UNITED STATES
SECURITIES AND EXCHANGE COMMISSION
Washington, D.C. 20549
FORM N-CSR
CERTIFIED SHAREHOLDER REPORT OF REGISTERED MANAGEMENT INVESTMENT COMPANIES
| Investment Company Act file number: | 811-22485 |
| Exact name of registrant as specified in charter: | abrdn Income Credit Strategies Fund |
| Address of principal executive offices: | 1900 Market Street, Suite 200 |
Philadelphia, PA 19103
| Name and address of agent for service: | Sharon Ferrari |
abrdn Inc.
1900 Market Street, Suite 200
Philadelphia, PA 19103
| Registrant’s telephone number, including area code: | 800-522-5465 |
| Date of fiscal year end: | October 31 |
| Date of reporting period: | April 30, 2023 |
Item 1 – Reports to Stockholders –
(a) A copy of the report transmitted to shareholders pursuant to Rule 30e-1 under the Investment Company Act of 1940 (the “1940 Act”) is filed herewith.


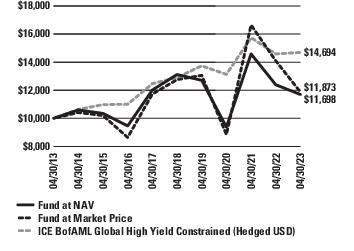
| NAV2,3 | 14.06% |
| Market Price2 | 15.02% |
| ICE BofAML Global High Yield Constrained (Hedged USD)4 | 7.41% |
| NAV | Closing Market Price | Premium(+)/ Discount(-) | |
| 4/30/2023 | $7.03 | $6.73 | -4.27% |
| 10/31/2022 | $6.72 | $6.37 | -5.21% |
| 1 | Past performance is no guarantee of future results. Investment returns and principal value will fluctuate and shares, when sold, may be worth more or less than original cost. Current performance may be lower or higher than the performance quoted. Net asset value return data includes investment management fees, custodial charges and administrative fees (such as Trustee and legal fees) and assumes the reinvestment of all distributions. |
| 2 | Assuming the reinvestment of dividends and distributions. |
| 3 | The Fund’s total return is based on the reported NAV for each financial reporting period end and may differ from what is reported on the Financial Highlights due to financial statement rounding or adjustments. |
| 4 | The ICE BofAMLGlobal High YieldConstrained (Hedged USD) Index tracks the performance of U.S. dollar-, Canadian dollar-, British pound- and euro-denominated below-investment-grade corporate debt publicly issued in the major domestic or eurobond markets. Indexes are unmanaged and have been provided for comparison purposes only. No fees or expenses are reflected. You cannot invest directly in an index. |
| abrdn Income Credit Strategies Fund | 1 |
| 2 | abrdn Income Credit Strategies Fund |
| • | Visit: https://www.abrdn.com/en-us/cefinvestorcenter |
| • | Email: Investor.Relations@abrdn.com; or |
| • | Call: 1-800-522-5465 (toll free in the U.S.). |
President
| abrdn Income Credit Strategies Fund | 3 |
| 6 Months | 1 Year | 3 Years | 5 Years | 10 Years | |
| Net Asset Value (NAV) | 14.06% | -5.61% | 7.64% | -2.27% | 1.58% |
| Market Price | 15.02% | -15.76% | 10.32% | -1.42% | 1.73% |
| ICE BofAML Global High Yield Constrained (Hedged USD) | 7.41% | 0.75% | 3.81% | 2.63% | 3.92% |
| 4 | abrdn Income Credit Strategies Fund |
| Date | AAA/Aaa % | A % | BB/Ba % | B % | CCC/CC/C % | NR % |
| April 30, 2023 | 0.0 | 1.1 | 17.4 | 52.9 | 23.4 | 5.2 |
| October 31, 2022 | 1.2 | 1.6 | 13.4 | 45.6 | 38.2 | 0.0 |
| April 30, 2022 | 0.0 | 0.0 | 8.0 | 50.0 | 36.0 | 6.0 |
| (1) | For financial reporting purposes, credit quality ratings shown above reflect the lowest rating assigned by either S&P, Moody’s or Fitch if ratings differ. These rating agencies are independent, nationally recognized statistical rating organizations and are widely used. Investment grade ratings are credit ratings of BBB/Baa or higher. Below investment grade ratings are credit ratings of BB/Ba or lower. Investments designated NR are not rated by these rating agencies. Unrated investments do not necessarily indicate low credit quality. Credit quality ratings are subject to change. The Adviser evaluates the credit quality of unrated investments based upon, but not limited to, credit ratings for similar investments. |
| Date | United States % | Europe % | United Kingdom % | Others % |
| April 30, 2023 | 40.7 | 36.0 | 12.3 | 11.0 |
| October 31, 2022 | 31.7 | 40.0 | 19.2 | 9.1 |
| April 30, 2022 | 33.0 | 28.0 | 18.0 | 21.0 |
| Date | 0 to 5 Years % | 5 to 10 Years % | 10 Years & Over % |
| April 30, 2023 | 22.0 | 74.7 | 3.3 |
| October 31, 2022 | 65.7 | 32.7 | 1.6 |
| April 30, 2022 | 70.0 | 27.0 | 3.0 |
| * | Modified duration is a measure of the sensitivity of the price of a bond to the fluctuations in interest rates. |
| abrdn Income Credit Strategies Fund | 5 |
| Shares or Principal Amount | Value | ||
| CORPORATE BONDS—122.8% | |||
| ARGENTINA—0.5% | |||
| Telecom Argentina SA, 8.00%, 07/18/2026(a)(b) | $ | 2,268,000 | $ 2,015,465 |
| AUSTRIA—0.8% | |||
| Benteler International AG, 10.50%, 05/15/2028(a) | 2,919,000 | 2,919,000 | |
| BERMUDA—0.2% | |||
| Highlands Holdings Bond Issuer Ltd. / Highlands Holdings Bond Co-Issuer, Inc. PIK, 7.63%, 10/15/2025(a)(b)(c) | 733,325 | 667,924 | |
| CANADA—3.2% | |||
| Bellatrix Exploration Ltd. | |||
| 8.50%, 09/11/2023(b)(d)(e) | 418,000 | – | |
| PIK, 12.50%, 12/15/2023(b)(d)(e) | 456,000 | – | |
| Bombardier, Inc. | |||
| 6.00%, 02/15/2028(a)(b) | 772,000 | 732,198 | |
| 7.50%, 02/01/2029(a)(b) | 485,000 | 477,005 | |
| Enerflex Ltd., 9.00%, 10/15/2027(a)(b) | 3,979,000 | 3,964,676 | |
| Husky III Holding Ltd., 13.00%, 02/15/2025(a)(b)(c) | 1,495,000 | 1,360,450 | |
| Jones Deslauriers Insurance Management, Inc., 10.50%, 12/15/2030(a)(b) | 2,850,000 | 2,892,750 | |
| Titan Acquisition Ltd. / Titan Co-Borrower LLC, 7.75%, 04/15/2026(a)(b) | 2,497,000 | 2,222,330 | |
| Total Canada | 11,649,409 | ||
| CHILE—0.3% | |||
| Sable International Finance Ltd., 5.75%, 09/07/2027(a)(b) | 200,000 | 188,500 | |
| VTR Comunicaciones SpA, 4.38%, 04/15/2029(a)(b) | 1,182,000 | 605,002 | |
| VTR Finance NV, 6.38%, 07/15/2028(a)(b) | 887,000 | 301,580 | |
| Total Chile | 1,095,082 | ||
| CHINA—0.1% | |||
| Kaisa Group Holdings Ltd., 9.38%, 06/30/2024(a)(f) | 3,609,000 | 346,390 | |
| CZECH REPUBLIC—0.9% | |||
| Allwyn Entertainment Financing UK PLC, 7.25%, 04/30/2030(a) | EUR | 2,853,000 | 3,172,267 |
| FRANCE—9.9% | |||
| Altice France SA | |||
| 8.13%, 02/01/2027(a)(b) | $ | 2,659,000 | 2,374,257 |
| 5.13%, 07/15/2029(a)(b) | 866,000 | 640,273 | |
| 5.50%, 10/15/2029(a)(b) | 469,000 | 351,084 | |
| Banijay Group SAS REGS, 6.50%, 03/01/2026(a) | EUR | 5,000,000 | 5,359,710 |
| CAB SELAS, 3.38%, 02/01/2028(a)(b) | 5,400,000 | 4,731,054 | |
| Chrome Holdco SASU, 5.00%, 05/31/2029(a) | 10,000,000 | 7,783,560 | |
| Electricite de France SA, (fixed rate to 01/22/2026, variable rate thereafter), 5.00%, 01/22/2026(a)(g) | 3,200,000 | 3,243,995 | |
| Iliad Holding SASU, 7.00%, 10/15/2028(a)(b) | $ | 1,568,000 | 1,483,588 |
| Loxam SAS, 5.75%, 07/15/2027(a) | EUR | 3,500,000 | 3,393,314 |
| Mobilux Finance SAS, 4.25%, 07/15/2028(a) | 3,000,000 | 2,743,732 | |
| Societe Generale SA, 9.38%, 11/22/2027(a)(b)(g) | $ | 4,420,000 | 4,196,348 |
| Total France | 36,300,915 | ||
| Shares or Principal Amount | Value | ||
| GEORGIA—0.1% | |||
| Bank of Georgia JSC, (fixed rate to 06/28/2024, variable rate thereafter), 11.13%, 06/28/2024(a)(g) | $ | 526,000 | $ 515,480 |
| GERMANY—6.3% | |||
| Cerdia Finanz GmbH, 10.50%, 02/15/2027(a)(b) | 1,155,000 | 1,097,250 | |
| Cheplapharm Arzneimittel GmbH | |||
| 4.38%, 01/15/2028(a)(b) | EUR | 2,771,000 | 2,785,855 |
| 5.50%, 01/15/2028(a)(b) | $ | 1,655,000 | 1,510,412 |
| 5.50%, 01/15/2028(a) | 529,000 | 483,223 | |
| CT Investment GmbH, 5.50%, 04/15/2026(a) | EUR | 3,645,000 | 3,543,212 |
| HT Troplast GmbH, 9.25%, 07/15/2025(a) | 3,865,000 | 4,194,963 | |
| IHO Verwaltungs GmbH | |||
| 3.88%, 05/15/2027(a)(c) | 1,700,000 | 1,641,471 | |
| PIK, 8.75%, 05/15/2028(a)(b) | 3,270,388 | 3,654,453 | |
| PrestigeBidCo GmbH, 3 mo. Euribor + 6.000%, 9.18%, 07/15/2027(a) | 2,176,000 | 2,379,752 | |
| Standard Profil Automotive GmbH, 6.25%, 04/30/2026(a) | 2,500,000 | 1,652,851 | |
| Total Germany | 22,943,442 | ||
| GIBRALTAR—1.2% | |||
| 888 Acquisitions Ltd., 7.56%, 07/15/2027(a) | 4,500,000 | 4,472,614 | |
| HONG KONG—0.1% | |||
| Seaspan Corp., 5.50%, 08/01/2029(a)(b) | $ | 315,000 | 252,000 |
| ISRAEL—1.7% | |||
| Teva Pharmaceutical Finance Netherlands II BV | |||
| 7.38%, 09/15/2029 | EUR | 5,000,000 | 5,564,906 |
| 7.88%, 09/15/2031 | 601,000 | 679,824 | |
| Total Israel | 6,244,730 | ||
| ITALY—1.9% | |||
| Gamma Bondco Sarl, 8.13%, 11/15/2026(a)(c) | 5,000,000 | 5,812,525 | |
| Lottomatica SpA, 6.25%, 07/15/2025(a) | 1,000,000 | 1,112,919 | |
| Total Italy | 6,925,444 | ||
| JAMAICA—0.4% | |||
| Digicel International Finance Ltd. / Digicel international Holdings Ltd. | |||
| 8.75%, 05/25/2024(a)(b) | $ | 1,482,000 | 1,337,505 |
| 8.00%, 12/31/2026(a)(b) | 120,811 | 25,974 | |
| Total Jamaica | 1,363,479 | ||
| LUXEMBOURG—13.7% | |||
| Albion Financing 2Sarl, 8.75%, 04/15/2027(a)(b) | 6,485,000 | 5,634,827 | |
| Altice Financing SA, 5.75%, 08/15/2029(a)(b) | 2,086,000 | 1,663,905 | |
| Altice Finco SA, 4.75%, 01/15/2028(a) | EUR | 5,000,000 | 3,923,868 |
| Altice France Holding SA | |||
| 10.50%, 05/15/2027(a)(b) | $ | 7,282,000 | 5,377,603 |
| 6.00%, 02/15/2028(a)(b) | 10,000,000 | 6,157,707 | |
| ARD Finance SA, 6.50%, 06/30/2027(a)(b)(c) | 610,732 | 500,505 | |
| Cidron Aida Finco Sarl | |||
| 5.00%, 04/01/2028(a) | EUR | 2,000,000 | 1,967,421 |
| 6.25%, 04/01/2028(a) | GBP | 2,993,000 | 3,232,706 |
| Cullinan Holdco Scsp, 4.63%, 10/15/2026(a) | EUR | 2,031,000 | 1,950,449 |
| Garfunkelux Holdco 3 SA, 7.75%, 11/01/2025(a) | GBP | 1,735,000 | 1,636,044 |
| Herens Midco Sarl, 5.25%, 05/15/2029(a) | EUR | 2,000,000 | 1,465,748 |
| 6 | abrdn Income Credit Strategies Fund |
| Shares or Principal Amount | Value | ||
| CORPORATE BONDS (continued) | |||
| LUXEMBOURG (continued) | |||
| HSE Finance Sarl, 5.63%, 10/15/2026(a) | EUR | 625,000 | $ 348,648 |
| LHMC Finco 2 Sarl PIK, 7.25%, 10/02/2025(a)(c) | 256,281 | 264,040 | |
| Monitchem HoldCo 3 SA, 8.75%, 05/01/2028(a) | 9,260,000 | 10,254,616 | |
| Summer BC Holdco A Sarl, 9.25%, 10/31/2027(a) | 6,397,474 | 5,678,641 | |
| Total Luxembourg | 50,056,728 | ||
| MAURITIUS—0.4% | |||
| Axian Telecom, 7.38%, 02/16/2027(a)(b) | $ | 1,447,000 | 1,311,127 |
| MEXICO—2.2% | |||
| Braskem Idesa SAPI, 6.99%, 02/20/2032(a)(b) | 1,079,000 | 772,025 | |
| Cemex SAB de CV, (fixed rate to 03/14/2028, variable rate thereafter), 9.13%, 03/14/2025(a)(g) | 4,448,000 | 4,416,869 | |
| Grupo Aeromexico SAB de CV, 8.50%, 03/17/2027(a)(b) | 1,600,000 | 1,431,486 | |
| Sixsigma Networks Mexico SA de CV, 7.50%, 05/02/2025(a)(b) | 1,500,000 | 1,273,887 | |
| Unifin Financiera SAB de CV | |||
| (fixed rate to 01/29/2025, variable rate thereafter), 8.88%, 01/29/2025(a)(d)(f)(g) | 2,000,000 | 18,440 | |
| 8.38%, 01/27/2028(a)(d)(f) | 3,000,000 | 75,000 | |
| Total Mexico | 7,987,707 | ||
| NETHERLANDS—6.3% | |||
| Nobel Bidco BV, 3.13%, 06/15/2028(a) | EUR | 3,300,000 | 2,679,234 |
| Stichting AK Rabobank Certificaten, 6.50%, 12/29/2049(a)(g) | 5,000,000 | 5,227,140 | |
| Summer BidCo BV | |||
| 9.00%, 11/15/2025(a)(c) | 3,056,762 | 2,817,539 | |
| 9.00%, 11/15/2025(a)(c) | 3,952,784 | 3,636,905 | |
| UPC Holding BV, 5.50%, 01/15/2028(a)(b) | $ | 3,000,000 | 2,685,000 |
| Ziggo Bond Co. BV, 3.38%, 02/28/2030(a)(b) | EUR | 7,000,000 | 5,871,752 |
| Total Netherlands | 22,917,570 | ||
| NIGERIA—0.7% | |||
| IHS Netherlands Holdco BV, 8.00%, 09/18/2027(a)(b) | $ | 2,860,000 | 2,513,082 |
| PORTUGAL—0.9% | |||
| Novo Banco SA, (fixed rate to 07/06/2023, variable rate thereafter), 8.50%, 07/06/2028(a) | EUR | 3,000,000 | 3,236,315 |
| REPUBLIC OF IRELAND—1.8% | |||
| AerCap Holdings NV, 5.88%, 10/10/2079(b) | $ | 2,239,000 | 2,076,777 |
| Cimpress PLC, 7.00%, 06/15/2026(b) | 5,565,000 | 4,659,129 | |
| Total Republic of Ireland | 6,735,906 | ||
| SPAIN—1.9% | |||
| Cirsa Finance International Sarl | |||
| 6.25%, 12/20/2023(a) | EUR | 1,496,227 | 1,642,511 |
| 10.38%, 11/30/2027(a) | 1,590,000 | 1,865,658 | |
| Telefonica Europe BV, 2.38%, 02/12/2029(a)(g) | 4,100,000 | 3,529,525 | |
| Total Spain | 7,037,694 | ||
| Shares or Principal Amount | Value | ||
| SWEDEN—1.8% | |||
| DDM Debt AB, 9.00%, 04/19/2026(a) | EUR | 5,400,000 | $ 3,867,671 |
| Intrum AB, 3.50%, 07/15/2026(a) | 3,200,000 | 2,895,618 | |
| Total Sweden | 6,763,289 | ||
| TURKEY—0.3% | |||
| Yapi ve Kredi Bankasi AS, (fixed rate to 01/22/2026, variable rate thereafter), 7.88%, 01/22/2031(a)(b) | $ | 983,000 | 924,020 |
| UNITED ARAB EMIRATES—0.0% | |||
| Emirates Reit Sukuk II Ltd., 9.50%, 12/12/2024(a) | 162,000 | 149,445 | |
| UNITED KINGDOM—14.8% | |||
| Barclays PLC, 6.13%, 12/15/2025(b)(g) | 1,240,000 | 1,065,036 | |
| BCP V Modular Services Finance PLC, 6.75%, 11/30/2029(a) | EUR | 2,700,000 | 2,311,796 |
| Bellis Acquisition Co. PLC, 4.50%, 02/16/2026(a) | GBP | 2,800,000 | 2,951,478 |
| Bellis Finco PLC, 4.00%, 02/16/2027(a) | 3,000,000 | 2,558,982 | |
| Connect Finco Sarl / Connect US Finco LLC, 6.75%, 10/01/2026(a)(b) | $ | 2,645,000 | 2,520,825 |
| eG Global Finance PLC, 6.25%, 10/30/2025(a) | EUR | 2,000,000 | 2,071,573 |
| EnQuest PLC | |||
| 7.00%, 10/15/2023(a) | GBP | 4,339,725 | 5,353,053 |
| 11.63%, 11/01/2027(a)(b) | $ | 1,950,000 | 1,838,474 |
| Galaxy Finco Ltd., 9.25%, 07/31/2027(a) | GBP | 6,300,000 | 6,943,671 |
| Intu Properties PLC, 11.00%, 12/04/2024(d)(e) | 3,795,706 | 4,521,725 | |
| Ithaca Energy North Sea PLC, 9.00%, 07/15/2026(a)(b) | $ | 2,636,000 | 2,537,493 |
| Jaguar Land Rover Automotive PLC | |||
| 4.50%, 01/15/2026(a) | EUR | 1,000,000 | 1,038,259 |
| 4.50%, 10/01/2027(a)(b) | $ | 1,700,000 | 1,423,531 |
| Jerrold Finco PLC, 4.88%, 01/15/2026(a) | GBP | 2,900,000 | 3,190,790 |
| Punch Finance PLC, 6.13%, 06/30/2026(a) | 2,740,000 | 2,952,798 | |
| Sherwood Financing PLC, 6.00%, 11/15/2026(a) | 5,000,000 | 5,169,982 | |
| TalkTalk Telecom Group Ltd., 3.88%, 02/20/2025(a) | 766,000 | 736,362 | |
| Virgin Media Vendor Financing Notes III DAC, 4.88%, 07/15/2028(a) | 5,000,000 | 5,149,132 | |
| Total United Kingdom | 54,334,960 | ||
| UNITED STATES—49.2% | |||
| Adams Homes, Inc., 7.50%, 02/15/2025(a)(b) | $ | 2,023,000 | 1,907,492 |
| Adtalem Global Education, Inc., 5.50%, 03/01/2028(a)(b) | 1,570,000 | 1,491,500 | |
| Advantage Sales & Marketing, Inc., 6.50%, 11/15/2028(a)(b) | 2,185,000 | 1,700,061 | |
| Affinity Interactive, 6.88%, 12/15/2027(a)(b) | 4,486,000 | 4,035,102 | |
| Air Lease Corp. Series B, 4.65%, 06/15/2026(b)(g) | 810,000 | 665,171 | |
| American Airlines, Inc. / AAdvantage Loyalty IP Ltd., 5.75%, 04/20/2029(a) | 1,053,791 | 1,001,402 | |
| Ardagh Metal Packaging Finance USA LLC / Ardagh Metal Packaging Finance PLC, 3.00%, 09/01/2029(a) | EUR | 5,000,000 | 4,035,710 |
| Ardagh Packaging Finance PLC / Ardagh Holdings USA, Inc., 4.75%, 07/15/2027(a) | GBP | 955,000 | 954,008 |
| abrdn Income Credit Strategies Fund | 7 |
| Shares or Principal Amount | Value | ||
| CORPORATE BONDS (continued) | |||
| UNITED STATES (continued) | |||
| Ascent Resources Utica Holdings LLC / ARU Finance Corp. | |||
| 7.00%, 11/01/2026(a)(b) | $ | 711,000 | $ 688,014 |
| 5.88%, 06/30/2029(a)(b) | 1,821,000 | 1,635,507 | |
| ASP Unifrax Holdings, Inc., 7.50%, 09/30/2029(a)(b) | 2,162,000 | 1,544,970 | |
| AthenaHealth Group, Inc., 6.50%, 02/15/2030(a)(b) | 735,000 | 603,684 | |
| Banff Merger Sub, Inc. | |||
| 8.38%, 09/01/2026(a)(b) | EUR | 133,000 | 140,304 |
| 8.38%, 09/01/2026(a) | 2,400,000 | 2,531,797 | |
| Caesars Entertainment, Inc., 8.13%, 07/01/2027(a)(b) | $ | 1,045,000 | 1,066,163 |
| Callon Petroleum Co. | |||
| 8.00%, 08/01/2028(a)(b) | 1,785,000 | 1,761,122 | |
| 7.50%, 06/15/2030(a)(b) | 1,045,000 | 992,558 | |
| Calpine Corp. | |||
| 5.13%, 03/15/2028(a)(b) | 2,000,000 | 1,847,418 | |
| 4.63%, 02/01/2029(a)(b) | 1,205,000 | 1,047,370 | |
| 5.00%, 02/01/2031(a)(b) | 135,000 | 113,734 | |
| Carnival Corp. | |||
| 10.13%, 02/01/2026(a)(b) | EUR | 236,000 | 271,036 |
| 7.63%, 03/01/2026(a)(b) | $ | 3,514,000 | 3,213,150 |
| 5.75%, 03/01/2027(a)(b) | 1,750,000 | 1,440,249 | |
| 6.00%, 05/01/2029(a)(b) | 445,000 | 349,280 | |
| CCO Holdings LLC / CCO Holdings Capital Corp. | |||
| 6.38%, 09/01/2029(a)(b) | 2,535,000 | 2,409,161 | |
| 4.50%, 08/15/2030(a)(b) | 1,081,000 | 907,715 | |
| 4.75%, 02/01/2032(a)(b) | 1,195,000 | 988,840 | |
| Chart Industries, Inc., 9.50%, 01/01/2031(a)(b) | 3,839,000 | 4,064,541 | |
| CHS/Community Health Systems, Inc. | |||
| 5.25%, 05/15/2030(a)(b) | 580,000 | 483,409 | |
| 4.75%, 02/15/2031(a)(b) | 480,000 | 387,234 | |
| Clydesdale Acquisition Holdings, Inc. | |||
| 6.63%, 04/15/2029(a)(b) | 275,000 | 269,912 | |
| 8.75%, 04/15/2030(a)(b) | 905,000 | 832,884 | |
| CMG Media Corp., 8.88%, 12/15/2027(a)(b) | 2,640,000 | 2,046,792 | |
| CNX Midstream Partners LP, 4.75%, 04/15/2030(a)(b) | 845,000 | 707,465 | |
| Consensus Cloud Solutions, Inc. | |||
| 6.00%, 10/15/2026(a)(b) | 1,574,000 | 1,447,222 | |
| 6.50%, 10/15/2028(a)(b) | 3,473,000 | 3,038,875 | |
| Consolidated Communications, Inc. | |||
| 5.00%, 10/01/2028(a)(b) | 417,000 | 305,744 | |
| 6.50%, 10/01/2028(a)(b) | 2,244,000 | 1,750,320 | |
| Cornerstone Building Brands, Inc., 6.13%, 01/15/2029(a)(b) | 5,592,000 | 4,207,980 | |
| Crestwood Midstream Partners LP / Crestwood Midstream Finance Corp. | |||
| 6.00%, 02/01/2029(a)(b) | 319,000 | 300,658 | |
| 7.38%, 02/01/2031(a)(b) | 1,295,000 | 1,295,000 | |
| Shares or Principal Amount | Value | ||
| CSC Holdings LLC | |||
| 7.50%, 04/01/2028(a)(b) | $ | 4,000,000 | $ 2,499,142 |
| 11.25%, 05/15/2028(a)(b) | 1,050,000 | 1,046,430 | |
| 5.75%, 01/15/2030(a)(b) | 4,480,000 | 2,286,341 | |
| 4.50%, 11/15/2031(a)(b) | 619,000 | 433,643 | |
| 5.00%, 11/15/2031(a)(b) | 862,000 | 413,725 | |
| Cumulus Media New Holdings, Inc., 6.75%, 07/01/2026(a)(b) | 1,500,000 | 1,098,750 | |
| Directv Financing LLC / Directv Financing Co-Obligor, Inc., 5.88%, 08/15/2027(a)(b) | 2,445,000 | 2,145,658 | |
| DISH DBS Corp., 5.75%, 12/01/2028(a)(b) | 1,670,000 | 1,187,215 | |
| Encore Capital Group, Inc., 5.38%, 02/15/2026(a) | GBP | 1,500,000 | 1,676,631 |
| EQM Midstream Partners LP, 4.75%, 01/15/2031(a)(b) | $ | 3,038,000 | 2,489,857 |
| Ford Motor Co., 4.75%, 01/15/2043 | 990,000 | 743,786 | |
| Ford Motor Credit Co. LLC, 4.54%, 03/06/2025 | GBP | 2,700,000 | 3,244,229 |
| Frontier Communications Holdings LLC | |||
| 5.88%, 10/15/2027(a)(b) | $ | 2,671,000 | 2,458,614 |
| 5.00%, 05/01/2028(a)(b) | 280,000 | 245,871 | |
| 6.75%, 05/01/2029(a)(b) | 830,000 | 668,019 | |
| 5.88%, 11/01/2029(b) | 895,605 | 681,196 | |
| 6.00%, 01/15/2030(a)(b) | 1,346,000 | 1,029,572 | |
| 8.75%, 05/15/2030(a)(b) | 1,701,000 | 1,682,461 | |
| 8.63%, 03/15/2031(a)(b) | 944,000 | 919,820 | |
| Genesis Energy LP / Genesis Energy Finance Corp. | |||
| 8.00%, 01/15/2027(b) | 1,912,000 | 1,908,021 | |
| 7.75%, 02/01/2028(b) | 1,210,000 | 1,190,922 | |
| Goodyear Europe BV | |||
| 2.75%, 08/15/2028(a) | EUR | 2,000,000 | 1,833,673 |
| 2.75%, 08/15/2028(a)(b) | 1,019,000 | 934,256 | |
| Goodyear Tire & Rubber Co. (The), 5.25%, 07/15/2031(b) | $ | 1,735,000 | 1,496,437 |
| Gray Escrow II, Inc., 5.38%, 11/15/2031(a)(b) | 341,000 | 218,588 | |
| Gray Television, Inc., 4.75%, 10/15/2030(a)(b) | 1,915,000 | 1,237,061 | |
| Hilcorp Energy I LP / Hilcorp Finance Co. | |||
| 6.00%, 04/15/2030(a)(b) | 1,910,000 | 1,780,086 | |
| 6.00%, 02/01/2031(a)(b) | 275,000 | 253,446 | |
| 6.25%, 04/15/2032(a)(b) | 1,011,000 | 945,163 | |
| HUB International Ltd., 5.63%, 12/01/2029(a)(b) | 2,420,000 | 2,153,800 | |
| ITT Holdings LLC, 6.50%, 08/01/2029(a)(b) | 4,895,000 | 4,064,172 | |
| Level 3 Financing, Inc., 10.50%, 05/15/2030(a)(b) | 1,852,000 | 1,772,926 | |
| MajorDrive Holdings IV LLC, 6.38%, 06/01/2029(a)(b) | 5,314,000 | 4,198,060 | |
| Mauser Packaging Solutions Holding Co. | |||
| 7.88%, 08/15/2026(a)(b) | 1,965,000 | 1,993,149 | |
| 9.25%, 04/15/2027(a)(b) | 725,000 | 688,024 | |
| McAfee Corp., 7.38%, 02/15/2030(a)(b) | 2,715,000 | 2,253,720 | |
| Midcap Financial Issuer Trust, 6.50%, 05/01/2028(a)(b) | 1,139,000 | 1,028,913 | |
| Moss Creek Resources Holdings, Inc. | |||
| 7.50%, 01/15/2026(a)(b) | 3,827,000 | 3,577,454 | |
| 10.50%, 05/15/2027(a)(b) | 548,000 | 528,999 | |
| NCL Corp. Ltd. | |||
| 5.88%, 03/15/2026(a)(b) | 721,000 | 621,046 | |
| 7.75%, 02/15/2029(a)(b) | 4,212,000 | 3,566,471 | |
| 8 | abrdn Income Credit Strategies Fund |
| Shares or Principal Amount | Value | ||
| CORPORATE BONDS (continued) | |||
| UNITED STATES (continued) | |||
| NCL Finance Ltd., 6.13%, 03/15/2028(a)(b) | $ | 1,803,000 | $ 1,455,922 |
| Neptune Bidco US, Inc., 9.29%, 04/15/2029(a)(b) | 2,884,000 | 2,714,565 | |
| NESCO Holdings II, Inc., 5.50%, 04/15/2029(a)(b) | 1,675,000 | 1,513,455 | |
| New Cotai LLC, 5.00%, 02/02/2027(d)(e) | 1,101,868 | 3,125,118 | |
| Nexstar Media, Inc., 4.75%, 11/01/2028(a)(b) | 1,650,000 | 1,450,196 | |
| Noble Finance II LLC, 8.00%, 04/15/2030(a) | 1,879,000 | 1,924,134 | |
| Northwest Fiber LLC / Northwest Fiber Finance Sub, Inc., 4.75%, 04/30/2027(a)(b) | 1,481,000 | 1,284,768 | |
| NuStar Logistics LP, 6.38%, 10/01/2030(b) | 1,530,000 | 1,473,405 | |
| Organon & Co. / Organon Foreign Debt Co-Issuer BV, 5.13%, 04/30/2031(a)(b) | 2,445,000 | 2,178,601 | |
| Par Pharmaceutical, Inc., 7.50%, 04/01/2027(a)(b) | 1,188,000 | 841,763 | |
| PetSmart, Inc. / PetSmart Finance Corp., 7.75%, 02/15/2029(a)(b) | 2,300,000 | 2,268,100 | |
| Royal Caribbean Cruises Ltd. | |||
| 5.50%, 08/31/2026(a)(b) | 180,000 | 165,009 | |
| 5.50%, 04/01/2028(a)(b) | 5,148,000 | 4,539,484 | |
| Sabre GLBL, Inc., 11.25%, 12/15/2027(a)(b) | 599,000 | 526,371 | |
| Sanchez Energy Corp., 7.25%, 07/15/2023(d) | 257,000 | 1,285 | |
| Scientific Games Holdings LP / Scientific Games US FinCo, Inc., 6.63%, 03/01/2030(a)(b) | 1,645,000 | 1,459,493 | |
| Sirius XM Radio, Inc., 4.13%, 07/01/2030(a)(b) | 3,325,000 | 2,666,975 | |
| Spirit Airlines, Inc., 1.00%, 05/15/2026 | 426,000 | 345,486 | |
| Stagwell Global LLC, 5.63%, 08/15/2029(a)(b) | 1,472,000 | 1,279,757 | |
| Staples, Inc. | |||
| 7.50%, 04/15/2026(a)(b) | 1,930,000 | 1,627,640 | |
| 10.75%, 04/15/2027(a)(b) | 5,097,000 | 3,450,345 | |
| Talen Energy Supply LLC, 8.63%, 06/01/2030(a) | 1,220,000 | 1,220,000 | |
| Trident TPI Holdings, Inc., 12.75%, 12/31/2028(a) | 89,000 | 91,140 | |
| Uniti Group LP / Uniti Group Finance Inc / CSL Capital LLC, 10.50%, 02/15/2028(a)(b) | 1,357,000 | 1,298,509 | |
| USA Compression Partners LP / USA Compression Finance Corp. | |||
| 6.88%, 04/01/2026(b) | 1,015,000 | 1,004,037 | |
| 6.88%, 09/01/2027(b) | 1,895,000 | 1,844,195 | |
| Viking Cruises Ltd., 5.88%, 09/15/2027(a)(b) | 2,870,000 | 2,462,259 | |
| Vistra Corp. | |||
| 8.00%, 10/15/2026(a)(b)(g) | 1,340,000 | 1,262,950 | |
| 7.00%, 12/15/2026(a)(b)(g) | 2,465,000 | 2,210,682 | |
| Vital Energy, Inc., 10.13%, 01/15/2028(b) | 1,161,000 | 1,167,177 | |
| Weatherford International Ltd., 8.63%, 04/30/2030(a)(b) | 5,737,000 | 5,843,825 | |
| Total United States | 180,372,547 | ||
| ZAMBIA—1.2% | |||
| First Quantum Minerals Ltd., 6.88%, 10/15/2027(a)(b) | 4,690,000 | 4,553,284 | |
| Total Corporate Bonds | 449,777,315 | ||
| Shares or Principal Amount | Value | ||
| COMMON STOCKS—1.8% | |||
| AUSTRALIA—0.0% | |||
| BIS Industries Ltd.(d)(e)(h) | 804,308 | $ – | |
| HONG KONG—0.5% | |||
| Studio City International Holdings Ltd.(d)(h) | 98,050 | 727,531 | |
| Studio City International Holdings Ltd.(d)(h) | 183,525 | 1,361,755 | |
| Total Hong Kong | 2,089,286 | ||
| UNITED STATES—1.3% | |||
| California Resources Corp. | 9,723 | 393,782 | |
| Cumulus Media, Inc., Class A(d)(h) | 5 | 18 | |
| Foresight Energy LLC(d)(e)(h) | 74,057 | 1,337,478 | |
| Kca Kelly Topco(d)(e) | 11,090 | 670,945 | |
| Larchmont Intermediate Holdco LLC(d)(e) | 1,661 | 19,328 | |
| New Cotai LLC(d)(e)(h) | 971,487 | 1,097,780 | |
| True Religion Common(d)(e)(h) | 61 | 1,139,751 | |
| Westmoreland Coal Co.(d)(e)(h) | 13,063 | 5,879 | |
| Total United States | 4,664,961 | ||
| Total Common Stocks | 6,754,247 | ||
| EXCHANGE-TRADED FUNDS—1.5% | |||
| iShares iBoxx High Yield Corporate Bond ETF | 73,000 | 5,501,280 | |
| Total Exchange-Traded Funds | 5,501,280 | ||
| BANK LOANS—1.1% | |||
| UNITED KINGDOM—0.7% | |||
| Impala Bidco 0 Ltd. GBP Term Loan, 8.93%, 06/08/2028(i) | GBP | 1,000,000 | 1,202,292 |
| Constellation Automotive Ltd. GBP 2nd Lien Term Loan B, 11.43%, 07/27/2029(d)(i) | 2,000,000 | 1,335,297 | |
| Total United Kingdom | 2,537,589 | ||
| UNITED STATES—0.4% | |||
| MLN US Holdco LLC | |||
| 11.78%, 11/01/2027(d)(i) | $ | 1,898,241 | 1,044,032 |
| 2022 Third Out Term Loan14.33%, 10/18/2027(i) | 952,345 | 457,126 | |
| Total United States | 1,501,158 | ||
| Total Bank Loans | 4,038,747 | ||
| MUNICIPAL BONDS—0.3% | |||
| PUERTO RICO—0.3% | |||
| GDB Debt Recovery Authority Bonds7.50%, 08/20/2040 | 1,528,363 | 1,268,541 | |
| Total Municipal Bonds | 1,268,541 | ||
| PREFERRED STOCKS—0.1% | |||
| UNITED STATES—0.1% | |||
| True Religion Preferred(d)(e)(h) | 64 | 318,675 | |
| Total Preferred Stocks | 318,675 | ||
| WARRANTS—0.1% | |||
| UNITED STATES—0.1% | |||
| California Resources Corp.(h) | 25,503 | 242,789 | |
| Total Warrants | 242,789 | ||
| abrdn Income Credit Strategies Fund | 9 |
| Shares or Principal Amount | Value | ||
| SHORT-TERM INVESTMENT—8.5% | |||
| State Street Institutional U.S. Government Money Market Fund, Premier Class, 4.76%(j) | 31,111,709 | $ 31,111,709 | |
| Total Short-Term Investment | 31,111,709 | ||
| Total Investments (Cost $556,987,732)(k)—136.2% | 499,013,303 | ||
| Liabilities in Excess of Other Assets—(36.2%) | (132,688,813) | ||
| Net Assets—100.0% | $366,324,490 | ||
| (a) | Denotes a security issued under Regulation S or Rule 144A. |
| (b) | The maturity date presented for these instruments represents the next call/put date. |
| (c) | Payment-in-kind security for which part of the income earned may be paid as additional principal. |
| (d) | Illiquid security. |
| (e) | Level 3 security. See Note 2(a) of the accompanying Notes to Financial Statements. |
| (f) | Security is in default. |
| (g) | Perpetual bond. This is a bond that has no maturity date, is redeemable and pays a steady stream of interest indefinitely. The maturity date presented for these instruments represents the next call/put date. |
| (h) | Non-income producing security. |
| (i) | Variable or Floating Rate security. Rate disclosed is as of April 30, 2023. |
| (j) | Registered investment company advised by State Street Global Advisors. The rate shown is the 7 day yield as of April 30, 2023. |
| (k) | See accompanying Notes to Financial Statements for tax unrealized appreciation/(depreciation) of securities. |
| ETF | Exchange-Traded Fund |
| EUR | Euro Currency |
| GBP | British Pound Sterling |
| HKD | Hong Kong Dollar |
| PIK | Payment-In-Kind |
| PLC | Public Limited Company |
| USD | U.S. Dollar |
| At April 30, 2023, the Fund held the following forward foreign currency contracts: |
| Purchase Contracts Settlement Date | Counterparty | Currency Purchased | Amount Purchased | Currency Sold | Amount Sold | Fair Value | Unrealized Appreciation/ (Depreciation) | |
| British Pound/United States Dollar | ||||||||
| 05/19/2023 | Citibank N.A. | GBP | 864,852 | USD | 1,082,610 | $ 1,087,299 | $4,689 | |
| Euro/United States Dollar | ||||||||
| 05/19/2023 | UBS AG | EUR | 650,000 | USD | 714,929 | 716,911 | 1,982 | |
| Hong Kong Dollar/United States Dollar | ||||||||
| 05/19/2023 | Goldman Sachs & Co. | HKD | 943,384 | USD | 120,357 | 120,266 | (91) | |
| 05/19/2023 | HSBC Bank PLC | HKD | 678,195 | USD | 86,514 | 86,458 | (56) | |
| 05/19/2023 | UBS AG | HKD | 466,597 | USD | 59,532 | 59,482 | (50) | |
| $2,070,416 | $6,474 | |||||||
| Sale Contracts Settlement Date | Counterparty | Currency Purchased | Amount Purchased | Currency Sold | Amount Sold | Fair Value | Unrealized Appreciation/ (Depreciation) | |
| United States Dollar/British Pound | ||||||||
| 05/19/2023 | Morgan Stanley & Co. | USD | 48,576,174 | GBP | 38,891,863 | $ 48,895,185 | $ (319,011) | |
| 05/19/2023 | UBS AG | USD | 4,729,468 | GBP | 3,791,886 | 4,767,191 | (37,723) | |
| United States Dollar/Euro | ||||||||
| 05/19/2023 | Morgan Stanley & Co. | USD | 2,322,807 | EUR | 2,099,630 | 2,315,767 | 7,040 | |
| 05/19/2023 | Royal Bank of Canada | USD | 10,649,395 | EUR | 9,629,137 | 10,620,364 | 29,031 | |
| 05/19/2023 | Royal Bank of Canada | USD | 132,282,462 | EUR | 120,952,973 | 133,403,932 | (1,121,470) | |
| 05/19/2023 | UBS AG | USD | 7,877,887 | EUR | 7,173,511 | 7,911,956 | (34,069) | |
| United States Dollar/Hong Kong Dollar | ||||||||
| 05/19/2023 | HSBC Bank PLC | USD | 163,634 | HKD | 1,282,490 | 163,495 | 139 | |
| 05/19/2023 | Morgan Stanley & Co. | USD | 16,142 | HKD | 126,427 | 16,117 | 25 | |
| 05/19/2023 | Royal Bank of Canada | USD | 33,160 | HKD | 260,123 | 33,161 | (1) | |
| 05/19/2023 | UBS AG | USD | 782,940 | HKD | 6,132,040 | 781,730 | 1,210 | |
| $208,908,898 | $(1,474,829) | |||||||
| Unrealized appreciation on forward foreign currency exchange contracts | $ 44,116 | |||||||
| Unrealized depreciation on forward foreign currency exchange contracts | $ (1,512,471) | |||||||
| 10 | abrdn Income Credit Strategies Fund |
| Assets | |
| Investments, at value (cost $525,876,023) | $ 467,901,594 |
| Short-term investments, at value (cost $31,111,709) | 31,111,709 |
| Foreign currency, at value (cost $12,137,587) | 12,133,979 |
| Cash | 8,426 |
| Receivable for investments sold | 8,201,165 |
| Interest and dividends receivable | 9,499,567 |
| Unrealized appreciation on forward foreign currency exchange contracts | 44,116 |
| Prepaid expenses in connection with at-the-market offering (Note 5) | 41,791 |
| Prepaid expenses in connection with the shelf registration (Note 5) | 59,956 |
| Prepaid expenses in connection with bank loan (Note 8) | 2,825 |
| Prepaid expenses | 13,970 |
| Total assets | 529,019,098 |
| Liabilities | |
| Revolving credit facility payable (Note 8) | 105,000,000 |
| Payable for investments purchased | 15,368,691 |
| Unrealized depreciation on forward foreign currency exchange contracts | 1,512,471 |
| Investment advisory fees payable (Note 3) | 489,620 |
| Dividend payable on preferred shares | 169,169 |
| Administration fees payable (Note 3) | 53,027 |
| Investor relations fees payable (Note 3) | 30,655 |
| Other accrued expenses | 70,975 |
| Total liabilities | 122,694,608 |
| Cumulative Preferred Shares, $0.001 par value | |
| Series A Mandatory Redeemable Preferred Shares (5.25%, $25.00 liquidation value per share, 1,600,000 shares outstanding) (Note 7) | 40,000,000 |
| Net Assets Applicable to Common Shareholders | $366,324,490 |
| Composition of Net Assets Attributable to Common Shareholders | |
| Common stock (par value $0.001 per share) (Note 5) | $ 52,076 |
| Paid-in capital in excess of par | 558,799,783 |
| Distributable accumulated loss | (192,527,369) |
| Net Assets | $366,324,490 |
| Net asset value per share based on 52,075,560 common shares issued and outstanding | $ 7.03 |
| abrdn Income Credit Strategies Fund | 11 |
| Net Investment Income | |
| Investment Income: | |
| Dividends and other income (net of foreign withholding taxes of $27,029) | $ 57,467 |
| Interest income | 17,875,562 |
| Total investment income | 17,933,029 |
| Expenses: | |
| Investment advisory fee (Note 3) | 2,213,919 |
| Administration fee (Note 3) | 221,392 |
| Trustees' fees and expenses | 151,778 |
| Independent auditors’ fees and expenses | 45,301 |
| Reports to shareholders and proxy solicitation | 44,904 |
| Investor relations fees and expenses (Note 3) | 44,471 |
| Legal fees and expenses | 30,917 |
| Custodian’s fees and expenses | 19,847 |
| Transfer agent’s fees and expenses | 15,423 |
| Miscellaneous | 143,912 |
| Total operating expenses, excluding interest expense | 2,931,864 |
| Interest expense and commitment fee on credit facility (Note 8) | 2,602,580 |
| Total operating expenses before reimbursed/waived expenses | 5,534,444 |
| Investment advisor waiver | (277,096) |
| Net expenses | 5,257,348 |
| Net Investment Income/(Loss) | 12,675,681 |
| Net Realized/Unrealized Gain/(Loss) from Investments and Foreign Currency Related Transactions: | |
| Net realized gain/(loss) from: | |
| Investment transactions | (41,528,203) |
| Forward foreign currency exchange contracts | (15,111,109) |
| Foreign currency transactions | 251,426 |
| (56,387,886) | |
| Net change in unrealized appreciation/(depreciation) on: | |
| Investments | 68,532,492 |
| Forward foreign currency exchange contracts | (357,455) |
| Foreign currency translation | 216,068 |
| 68,391,105 | |
| Net realized and unrealized gain from investments, forward foreign currency exchange contracts and foreign currencies | 12,003,219 |
| Change in Net Assets Resulting from Operations | $24,678,900 |
| Total distributions to preferred shareholders | (1,044,166) |
| Net Increase in Net Assets Attributable to Common Shareholders Resulting from Operations | $23,634,734 |
| 12 | abrdn Income Credit Strategies Fund |
| For the Six-Month Period Ended April 30, 2023 (unaudited) | For the Year Ended October 31, 2022 | |
| Increase/(Decrease) in Net Assets: | ||
| Operations: | ||
| Net investment income | $ 12,675,681 | $ 20,875,496 |
| Net realized gain/(loss) from investments, forward foreign currency exchange contracts and foreign currency transactions | (56,387,886) | 3,902,028 |
| Net change in unrealized appreciation/(depreciation) on investments, forward foreign currency exchange contracts and foreign currency translation | 68,391,105 | (84,502,480) |
| Net increase/(decrease) in net assets applicable to common shareholders resulting from operations | 24,678,900 | (59,724,956) |
| Distributions to Preferred Shareholders from: | ||
| Distributable earnings | (1,044,166) | (2,070,833) |
| Net decrease in net assets from distributions to preferred shareholders | (1,044,166) | (2,070,833) |
| Net decrease in net assets attributable to common shareholders resulting from operations | 23,634,734 | (61,795,789) |
| Distributions to Common Shareholders from: | ||
| Distributable earnings | (20,388,000) | (28,744,450) |
| Net decrease in net assets applicable to common shareholders from distributions | (20,388,000) | (28,744,450) |
| Proceeds from at-the-market offering resulting in the issuance of 483,411 and 1,523,512 shares of common stock, respectively (Note 12) | 3,949,054 | 13,839,680 |
| Proceeds from shares issued from the reorganization resulting in the addition of 26,763,172 and 0 shares of common stock, respectively (Note 12) | 192,397,770 | – |
| Expenses in connection with the at-the-market stock offering (Note 5) | (2,871) | (6,284) |
| Expenses in connection with the shelf offering (Note 5) | – | (5,301) |
| Reinvestment of dividends resulting in the issuance of 11,595 and 32,025 shares of common stock, respectively | 83,517 | 285,045 |
| Change in net assets from capital transactions | 196,427,470 | 14,113,140 |
| Change in net assets applicable to common shareholders | 199,674,204 | (76,427,099) |
| Net Assets: | ||
| Beginning of period | 166,650,286 | 243,077,385 |
| End of period | $366,324,490 | $166,650,286 |
| abrdn Income Credit Strategies Fund | 13 |
| Cash flows from operating activities: | |
| Net increase/(decrease) in net assets resulting from operations | $ 24,678,900 |
| Adjustments to reconcile net increase in net assets resulting from operations to net cash provided by operating activities: | |
| Investments purchased | (402,235,947) |
| Investments sold and principal repayments | 208,570,589 |
| Increase in short-term investments, excluding foreign government | (17,895,415) |
| Net amortization/accretion of premium (discount) | (3,976,156) |
| Increase in interest and dividends receivable | (3,029,287) |
| Net change unrealized depreciation on forward foreign currency exchange contracts | 357,455 |
| Increase in prepaid expenses | (5,892) |
| Increase in accrued investment management fees payable | 181,159 |
| Decrease in other accrued expenses | (138,265) |
| Net change in unrealized appreciation of investments | (68,532,492) |
| Net change in unrealized appreciation on foreign currency translations | (216,068) |
| Net realized loss on investments transactions | 41,528,203 |
| Net increase from Reorganization | 39,706,519 |
| Total Cash flows from operating activities | (181,006,697) |
| Cash flows from financing activities: | |
| Borrowings on line of credit | $ 87,000,000 |
| Repayment of revolving credit facility | (70,000,000) |
| Distributions paid to shareholders | (21,432,166) |
| Proceeds from shares issued from Reorganization | 192,397,770 |
| Proceeds from at-the-market stock offering | 3,949,054 |
| Proceeds from reinvestment of dividends | 83,517 |
| Expenses in connection with the at-the-market and shelf offering | (2,871) |
| Net cash used in financing activities | 191,995,304 |
| Effect of exchange rate on cash | (6,622) |
| Net change in cash | 10,981,985 |
| Unrestricted and restricted cash and foreign currency, beginning of year | 1,160,420 |
| Unrestricted and restricted cash and foreign currency, end of year | $ 12,142,405 |
| Supplemental disclosure of cash flow information: | |
| Cash paid for interest and fees on borrowing | 2,602,580 |
| 14 | abrdn Income Credit Strategies Fund |
| For the Six-Months Ended April 30, | For the Fiscal Years Ended October 31, | |||||
| 2023 (unaudited) | 2022 | 2021 | 2020 | 2019 | 2018 | |
| PER SHARE OPERATING PERFORMANCE(a): | ||||||
| Net asset value per common share, beginning of period | $6.72 | $10.45 | $10.15 | $12.46 | $14.08 | $15.25 |
| Net investment income | 0.39 | 0.87 | 0.98 | 0.87 | 1.05 | 1.55 |
| Net realized and unrealized gains/(losses) on investments, forward foreign currency exchange contracts and foreign currency transactions | 0.54 | (3.35) | 1.11 | (1.07) | (1.23) | (1.28) |
| Total from investment operations applicable to common shareholders | 0.93 | (2.48) | 2.09 | (0.20) | (0.18) | 0.27 |
| Distributions to preferred shareholders from: | ||||||
| Net investment income | (0.04) | (0.09) | (0.05) | – | – | – |
| Net increase/(decrease) in net assets attributable to common shareholders resulting from operations | 0.89 | (2.57) | 2.04 | – | – | – |
| Distributions to common shareholders from: | ||||||
| Net investment income | (0.60) | (1.20) | (1.13) | (0.77) | (1.41) | (1.44) |
| Return of capital | – | – | (0.07) | (0.63) | (0.03) | – |
| Total distributions | (0.60) | (1.20) | (1.20) | (1.40) | (1.44) | (1.44) |
| Capital Share Transactions: | ||||||
| Offering costs for preferred shares charged to paid-in-capital | – | – | (0.11) | – | – | – |
| Impact of shelf offering | 0.02 | 0.04 | – | – | – | – |
| Dilutive effect of rights offer (Note 5) | – | – | (0.43) | (0.71) | – | – |
| Total capital share transactions | 0.02 | 0.04 | (0.54) | – | – | – |
| Net asset value per common share, end of period | $7.03 | $6.72 | $10.45 | $10.15 | $12.46 | $14.08 |
| Market price, end of period | $6.73 | $6.37 | $11.30 | $9.18 | $11.33 | $13.09 |
| Total Investment Return Based on(b): | ||||||
| Market price | 15.02% | (34.92%) | 37.13% | (6.16%) | (2.48%) | (0.75%) |
| Net asset value | 13.89%(c) | (25.76%)(c) | 14.69% | (5.65%) | (0.29%) | 2.34% |
| Ratio to Average Net Assets Applicable to Common Shareholders/Supplementary Data: | ||||||
| Net assets including liquidation value of preferred shares, end of year(000 omitted) | $406,324 | $206,650 | $283,077 | $– | $– | $– |
| Net assets applicable to common shareholders, end of period (000 omitted) | $366,324 | $166,650 | $243,077 | $176,871 | $162,939 | $184,028 |
| Average net assets applicable to common shareholders (000 omitted) | $230,257 | $206,720 | $218,990 | $181,152 | $167,302 | $195,965 |
| Net operating expenses, net of fee waivers/recoupments | 4.60%(d) | 3.70% | 2.86% | 3.06% | 3.89% | 3.49% |
| Net operating expenses, excluding fee waivers/recoupments | 4.85%(d) | 3.95% | 3.01% | 3.24% | 4.05% | 3.55% See Notes to Financial Statements. |
| abrdn Income Credit Strategies Fund | 15 |
| For the Six-Months Ended April 30, | For the Fiscal Years Ended October 31, | |||||
| 2023 (unaudited) | 2022 | 2021 | 2020 | 2019 | 2018 | |
| Net operating expenses, net of fee waivers/recoupment, excluding interest expense, commitment fee and loan servicing fees | 2.33%(d) | 2.48% | 2.24% | 2.15% | 2.27% | 2.24% |
| Net Investment income | 11.10%(d) | 10.10% | 8.75% | 8.26% | 8.19% | 10.34% |
| Portfolio turnover | 37%(e) | 66% | 63% | 97% | 93% | 103% |
| Senior securities (loan facility) outstanding (000 omitted) | $105,000 | $88,000 | $118,000 | $81,200 | $72,000 | $83,000 |
| Asset coverage ratio on senior securities period end(f) | 487% | 335% | 340% | 318% | 326% | 322% |
| Asset coverage per $1000 on senior securities period end | $4,870 | $3,348 | $3,399 | $3,178 | $3,263 | $3,217 |
| Asset coverage ratio on total leverage at period end(g) | 353% | 230% | 254% | 318% | 326% | 322% |
| Asset coverage per $1,000 on total leverage at period end | $3,526 | $2,302 | $2,538 | $3,178 | $3,263 | $3,217 |
| (a) | Based on average shares outstanding. |
| (b) | Total investment return based on market value is calculated assuming that shares of the Fund’s common stock were purchased at the closing market price as of the beginning of the period, dividends, capital gains and other distributions were reinvested as provided for in the Fund’s dividend reinvestment plan and then sold at the closing market price per share on the last day of the period. The computation does not reflect any sales commission investors may incur in purchasing or selling shares of the Fund. The total investment return based on the net asset value is similarly computed except that the Fund’s net asset value is substituted for the closing market value. |
| (c) | The total return shown above includes the impact of financial statement rounding of the NAV per share and/or financial statement adjustments. |
| (d) | Annualized. |
| (e) | Not annualized. |
| (f) | Asset coverage ratio is calculated by dividing net assets plus the amount of any borrowings, including Series A Perpetual Preferred Shares, for investment purposes by the amount of any senior securities, which includes the revolving credit facility. |
| (g) | Asset coverage ratio is calculated by dividing net assets plus the amount of any borrowings for investment purposes by the amount of any borrowings. |
| 16 | abrdn Income Credit Strategies Fund |
April 30, 2023
| Acquired Fund | ACP NAV per Share ($) 3/10/2023 | Conversion Ratio | Shares Issued |
| Delaware Ivy High Income Opportunities Fund ("IVH") | 7.1889 | 1.615135 | 26,763,172 |
| abrdn Income Credit Strategies Fund | 17 |
April 30, 2023
| 18 | abrdn Income Credit Strategies Fund |
April 30, 2023
| Security Type | Standard Inputs |
| Debt and other fixed-income securities | Reported trade data, broker-dealer price quotations, benchmark yields, issuer spreads on comparable securities, credit quality, yield, and maturity. |
| Forward foreign currency contracts | Forward exchange rate quotations. |
| Investments, at Value | Level 1 – Quoted Prices | Level 2 – Other Significant Observable Inputs | Level 3 – Significant Unobservable Inputs | Total |
| Assets | ||||
| Investments in Securities | ||||
| Bank Loans | $ – | $ 4,038,747 | $ – | $ 4,038,747 |
| Common Stocks | 2,483,086 | – | 4,271,161 | 6,754,247 |
| Corporate Bonds | – | 442,130,472 | 7,646,843 | 449,777,315 |
| Exchange-Traded Funds | 5,501,280 | – | – | 5,501,280 |
| Municipal Bonds | – | 1,268,541 | – | 1,268,541 |
| Preferred Stocks | – | – | 318,675 | 318,675 |
| Warrants | 242,789 | – | – | 242,789 |
| Short-Term Investment | 31,111,709 | – | – | 31,111,709 |
| Total Investments | $39,338,864 | $447,437,760 | $12,236,679 | $499,013,303 |
| Other Financial Instruments | ||||
| Foreign Currency Exchange Contracts | $ – | $ 44,116 | $ – | $ 44,116 |
| Total Assets | $39,338,864 | $447,481,876 | $12,236,679 | $499,057,419 |
| Liabilities | ||||
| Other Financial Instruments | ||||
| Foreign Currency Exchange Contracts | $ – | $ (1,512,471) | $ – | $ (1,512,471) |
| Total Liabilities | $ – | $ (1,512,471) | $ – | $ (1,512,471) |
| abrdn Income Credit Strategies Fund | 19 |
April 30, 2023
| Rollforward of Level 3 Fair Value Measurement For the Six Months Ended April 30, 2023 | ||||||||||
| Investments in Securities | Balance as of October 31, 2022 | Accrued Discounts (Premiums) | Realized Gain (Loss) | Change in Unrealized Appreciation (Depreciation) | Net Purchases | Net Sales | Net Transfers in to Level 3 | Net Transfers out of Level 3 | Balance as of April 30, 2023 | Change in Unrealized Appreciation (Depreciation) from Investments Held at April 30, 2023 |
| Corporate Bonds | ||||||||||
| Canada | $- | $- | $- | $- | $- | $- | $- | $- | $- | $- |
| United Kingdom | 3,926,678 | 13,474 | - | 304,067 | 277,506 | - | - | - | 4,521,725 | 304,067 |
| United States* | - | 1,313 | - | (34,628) | 3,158,433 | - | - | - | 3,125,118 | (34,628) |
| Common Stocks | ||||||||||
| Australia* | - | - | - | - | - | - | - | - | - | - |
| United States* | - | - | - | (16,099) | 4,287,260 | - | - | - | 4,271,161 | (16,099) |
| Preferred Stocks | ||||||||||
| United States* | - | - | - | - | 318,675 | - | - | - | 318,675 | - |
| Total | $3,926,678 | $14,787 | $- | $253,340 | $8,041,874 | $- | $- | $- | $12,236,679 | $253,340 |
| * | Securities purchased as part of the Reorganization. |
| Description | Fair Value at 04/30/23 | Valuation Technique (s) | Unobservable Inputs | Input Value |
| Common Stocks | $1,337,478 | Market Approach | Discount for lack of marketability | 30% |
| Common Stocks | $670,945 | Market Approach | Broker Quote | n/a |
| Common Stocks | $19,328 | Market Approach | Financial Statements | n/a |
| Common Stocks | $1,097,780 | Market Approach | Financial Statements | n/a |
| Common Stocks | $1,139,751 | Market Approach | EBITA/Revenue multiple | 2.82x/.45x |
| Common Stocks | $5,879 | Market Approach | Broker Quote | n/a |
| Common Stocks | $0 | Market Approach | EBITA multiple | 5.67x |
| Corporate Bonds | $4,521,725 | Income Method | Credit Spread | 21.48% |
| Corporate Bonds | $3,125,118 | Market Approach | Financial Statements | n/a |
| Preferred Stocks | $318,675 | Market Approach | EBITA/Revenue multiple | 2.82x/.45x |
| 20 | abrdn Income Credit Strategies Fund |
April 30, 2023
| abrdn Income Credit Strategies Fund | 21 |
April 30, 2023
| Risk Exposure Category | |||||||
| Interest Rate Contracts | Foreign Currency Contracts | Credit Contracts | Equity Contracts | Commodity Contracts | Other | Total | |
| Assets: | |||||||
| Unrealized appreciation on: | |||||||
| Forward Foreign Currency Exchange Contracts | $– | $ 44,116 | $– | $– | $– | $– | $ 44,116 |
| Total | $– | $ 44,116 | $– | $– | $– | $– | $ 44,116 |
| Liabilities: | |||||||
| Unrealized depreciation on: | |||||||
| Forward Foreign Currency Exchange Contracts | $– | $ 1,512,471 | $– | $– | $– | $– | $ 1,512,471 |
| Total | $– | $1,512,471 | $– | $– | $– | $– | $1,512,471 |
| Gross Amounts Not Offset in the Statement of Assets and Liabilities | Gross Amounts Not Offset in the Statement of Assets and Liabilities | |||||||
| Gross Amounts of Assets Presented in Statement of Assets and Liabilities | Financial Instruments | Collateral Received | Net Amount | Gross Amounts of Liabilities Presented in Statement of Assets and Liabilities | Financial Instruments | Collateral Pledged | Net Amount | |
| Description | Assets | Liabilities | ||||||
| Foreign Currency Exchange Contracts | ||||||||
| Citibank N.A. | $4,689 | $– | $– | $4,689 | $– | $– | $– | $– |
| Goldman Sachs & Co. | – | – | – | – | 91 | – | – | 91 |
| HSBC Bank PLC | 139 | (56) | – | 83 | 56 | (56) | – | – |
| Morgan Stanley & Co. | 7,065 | (7,065) | – | – | 319,011 | (7,065) | – | 311,946 |
| Royal Bank of Canada | 29,031 | (29,031) | – | – | 1,121,471 | (29,031) | – | 1,092,440 |
| UBS AG | 3,192 | (3,192) | – | – | 71,842 | (3,192) | – | 68,650 |
| 22 | abrdn Income Credit Strategies Fund |
April 30, 2023
| Risk Exposure Category | ||||||
| Interest Rate Contracts | Foreign Currency Contracts | Credit Contracts | Equity Contracts | Commodity Contracts | Total | |
| Realized Gain (Loss) on Derivatives Recognized as a Result of Operations: | ||||||
| Net realized gain (loss) on: | ||||||
| Forward Currency Contracts | $– | $ (15,111,109) | $– | $– | $– | $ (15,111,109) |
| Total | $– | $(15,111,109) | $– | $– | $– | $(15,111,109) |
| Net Change in Unrealized Appreciation (Depreciation) on Derivatives Recognized as a Result of Operations: | ||||||
| Net change in unrealized appreciation (depreciation) of: | ||||||
| Forward Currency Contracts | $– | $ (357,455) | $– | $– | $– | $ (357,455) |
| Total | $– | $ (357,455) | $– | $– | $– | $ (357,455) |
| Derivative | Average Notional Value |
| Foreign Currency Contracts Purchased | $ 7,121,721 |
| Foreign Currency Contracts Sold | $173,694,024 |
| abrdn Income Credit Strategies Fund | 23 |
April 30, 2023
| 24 | abrdn Income Credit Strategies Fund |
April 30, 2023
| Amount Fiscal Year 2020 (Expires 10/31/23) | $ 335,688 | |
| Amount Fiscal Year 2021 (Expires 10/31/24) | $ 332,380 | |
| Amount Fiscal Year 2022 (Expires 10/31/25) | $ 519,698 | |
| Amount Fiscal Year 2023 (Expires 10/31/26) | $ 277,096 | |
| Total* | $1,464,862 |
| * | Amounts reported are due to expire throughout the respective 3-year expiration period presented above. |
| abrdn Income Credit Strategies Fund | 25 |
April 30, 2023
| 26 | abrdn Income Credit Strategies Fund |
April 30, 2023
| abrdn Income Credit Strategies Fund | 27 |
April 30, 2023
| 28 | abrdn Income Credit Strategies Fund |
April 30, 2023
| abrdn Income Credit Strategies Fund | 29 |
April 30, 2023
| Tax Cost of Securities | Unrealized Appreciation | Unrealized Depreciation | Net Unrealized Appreciation/ (Depreciation) |
| $557,780,569 | $11,146,769 | $(69,914,035) | $(58,767,266) |
| Net investment income | $17,646,601 |
| Net realized and unrealized gain from investments | 14,795,602 |
| Net increase in net assets from operations | 32,442,203 |
| Shares Outstanding | Net Assets | Net Asset Value Per Share | Net Unrealized Appreciation (Depreciation) | Accumulated Net Realized Gain/(Loss) | |
| Before Reorganization | |||||
| Delaware Ivy High Income Opportunities Fund | 16,570,235 | $ 192,397,770 | $11.61 | $ (39,706,519) | $ (83,124,103) |
| abrdn Income Credit Strategies Fund | 25,312,394 | 181,969,426 | 7.19 | (40,108,769) | (90,577,032) |
| Total | $374,367,196 | $(79,815,288) | $(173,701,135) |
| Shares Outstanding | Net Assets | Net Asset Value Per Share | Net Unrealized Appreciation (Depreciation) | Accumulated Net Realized Gain/(Loss) | |
| After Reorganization | |||||
| abrdn Income Credit Strategies Fund | 52,075,566 | $374,367,196 | $7.19 | $(79,815,288) | $(173,701,135) |
| 30 | abrdn Income Credit Strategies Fund |
April 30, 2023
| abrdn Income Credit Strategies Fund | 31 |
| 32 | abrdn Income Credit Strategies Fund |
| abrdn Income Credit Strategies Fund | 33 |
Stephen Bird
Nancy Yao Maasbach
John Sievwright
Randolph Takian
10 Queen's Terrace
Aberdeen, AB10 1XL
Scotland, United Kingdom
1900 Market Street, Suite 200
Philadelphia, PA19103
1900 Market Street, Suite 200
Philadelphia, PA 19103
One Congress Street, Suite 1
Boston, MA 02114-2016
P.O. Box 43006
Providence, RI 02940-3078
1601 Market Street
Philadelphia, PA 19103
1900 K Street N.W.
Washington D.C. 20006
1900 Market Street, Suite 200
Philadelphia, PA 19103
1-800-522-5465
Investor.Relations@abrdn.com

(b) Not applicable.
Item 2 – Code of Ethics.
This item is inapplicable to semi-annual report on Form N-CSR.
Item 3 – Audit Committee Financial Expert.
This item is inapplicable to semi-annual report on Form N-CSR.
Item 4 – Principal Accountant Fees and Services.
This item is inapplicable to semi-annual report on Form N-CSR.
Item 5 – Audit Committee of Listed Registrants.
This item is inapplicable to semi-annual report on Form N-CSR.
Item 6 – Investments.
(a) Schedule of Investments in securities of unaffiliated issuers as of close of the reporting period is included as part of the Report to Shareholders filed under Item 1 of this Form N-CSR.
(b) Not applicable.
Item 7 – Disclosure of Proxy Voting Policies and Procedures for Closed-End Management Investment Companies.
This item is inapplicable to semi-annual report on Form N-CSR.
Item 8 - Portfolio Managers of Closed-End Management Investment Companies.
(a) Not applicable to semi-annual report on Form N-CSR.
(b) There has been no change, as of the date of this filing, in any of the portfolio managers identified in response to paragraph (a)(1) of this Item in the registrant’s most recently filed annual report on Form N-CSR.
Item 9 – Purchases of Equity Securities by Closed-End Management Investment Company and Affiliated Purchasers.
No such purchases were made by or on behalf of the Registrant during the period covered by the report.
Item 10 – Submission of Matters to a Vote of Security Holders.
During the period ended April 30, 2023, there were no material changes to the procedures by which shareholders may recommend nominees to the Registrant’s Board of Trustees.
Item 11 – Controls and Procedures.
| (a) | The Registrant’s principal executive and principal financial officers, or persons performing similar functions, have concluded that the Registrant’s disclosure controls and procedures (as defined in Rule 30a-3(c) under the Investment Company Act of 1940 (the “Act”) (17 CFR 270.30a-3(c)) are effective, as of a date within 90 days of the filing date of the report that includes the disclosure required by this paragraph, based on the evaluation of these controls and procedures required by Rule 30a-3(b) under the Act (17 CFR 270.30a3(b)) and Rule 13a-15(b) or 15d-15(b) under the Securities Exchange Act of 1934, as amended (17 CFR 240.13a-15(b) or 240.15d15(b)). |
| (b) | There were no changes in the Registrant’s internal control over financial reporting (as defined in Rule 30a-3(d) under the Act (17 CFR 270.30a-3(d)) that occurred during the Registrant’s second fiscal quarter covered by this report that has materially affected, or is reasonably likely to materially affect, the Registrant’s internal control over financial reporting. |
Item 12 - Disclosure of Securities Lending Activities for Closed-End Management Investment Companies
Not applicable
Item 13 – Exhibits.
| (a)(1) | Not applicable. |
| (a)(2) | The certifications of the registrant as required by Rule 30a-2(a) under the Act are exhibits to this Form N-CSR. |
| (a)(3) | Any written solicitation to purchase securities under Rule 23c-1 under the 1940 Act (17 CFR 270.23c-1) sent or given during the period covered by the report by or on behalf of the registrant to 10 or more persons. Not applicable. |
| (a)(4) | Change in Registrant’s independent public accountant. Not applicable. |
| (b) | The certifications of the registrant as required by Rule 30a-2(b) under the Act are exhibits to this Form N-CSR. |
SIGNATURES
Pursuant to the requirements of the Securities Exchange Act of 1934 and the Investment Company Act of 1940, the Registrant has duly caused this report to be signed on its behalf by the undersigned, thereunto duly authorized.
abrdn Income Credit Strategies Fund
| By: | /s/ Christian Pittard | |
| Christian Pittard, | ||
| Principal Executive Officer of abrdn Income Credit Strategies Fund |
| Date: | July 10, 2023 |
Pursuant to the requirements of the Securities Exchange Act of 1934 and the Investment Company Act of 1940, this report has been signed below by the following persons on behalf of the Registrant and in the capacities and on the dates indicated.
| By: | /s/ Christian Pittard | |
| Christian Pittard, | ||
| Principal Executive Officer of abrdn Income Credit Strategies Fund |
| Date: | July 10, 2023 |
| By: | /s/ Sharon Ferrari | |
| Sharon Ferrari, | ||
| Principal Financial Officer of abrdn Income Credit Strategies Fund |
| Date: | July 10, 2023 |