 1 SWISHER HYGIENE Third Quarter 2011 Conference Call November 14, 2011 Exhibit 99.2 |
 Safe Harbor Statement Our discussion today may include forward-looking statements which are based on the expectations, estimates and projections of management as of today. The forward looking statements in our discussion are subject to various assumptions, risks, uncertainties and other factors that are difficult to predict and which could cause actual results to differ materially from those expressed or implied in the forward looking statements. These statements are not guarantees of future performance, and therefore, undue reliance should not be placed upon them. We refer all of you to our recent filings with the SEC for a more detailed discussion of the risks that could impact the future operating results and financial condition of Swisher Hygiene Inc. We disclaim any intentions or obligations to update or revise any forward looking statements, except to the extent required by applicable law. Also our discussion today will include references to certain non-GAAP measures. A reconciliation of these measures to the most comparable GAAP measure can be found on our website at swisherhygiene.com under the investor relations section. Non-GAAP Disclosures In addition to net income determined in accordance with GAAP, we use certain non-GAAP measures, such as “Adjusted EBITDA”, in assessing our operating performance. We believe the non-GAAP measure serves as an appropriate measure to be used in evaluating the performance of our business. We define Adjusted EBITDA as net loss excluding the impact of income taxes, depreciation and amortization expense, interest expense and income, foreign currency gain, net gain/loss on debt related fair value measurements, stock based compensation, and third party costs directly related to merger and acquisitions. We present Adjusted EBITDA because we consider it an important supplemental measure of our operating performance and believe it is frequently used by securities analysts, investors and other interested parties in the evaluation of our results. Management uses this non-GAAP financial measure frequently in our decision-making because it provides supplemental information that facilitates internal comparisons to the historical operating performance of prior periods and gives a better indication of our core operating performance. We include this non-GAAP financial measure in our earnings announcement and guidance in order to provide transparency to our investors and enable investors to better compare our operating performance with the operating performance of our competitors. Adjusted EBITDA should not be considered in isolation from, and is not intended to represent an alternative measure of, operating results or of cash flows from operating activities, as determined in accordance with GAAP. Additionally, our definition of Adjusted EBITDA may not be comparable to similarly titled measures reported by other companies. 2 Important Disclosures |
 Consolidated Highlights 3 Goals Results 1. Achieve significant revenue growth Revenue of $67.2 million; up 318% from the prior year 2. Sustainable double-digit organic growth Organic growth of 28.6% 3. Complete quality acquisitions Current revenue run rate exceeds $320 million 4. Efficiently and effectively integrate acquisitions Acquired 22 businesses generating $64 million in revenue 5. Aggressively pursue cost efficiencies Expanded our manufacturing capacity 6. Reduce our reliance on third party manufacturing Strengthened/increase our ability to process linens and dust control 7. Generate steady margin improvement Achieved Adjusted EBITDA of $5.3 million as compared to a loss of $1.1 million in the same period last year. |
 Profit Drivers • Strong operating performance • Strength of our capital structure and liquidity • Continued aggressive acquisition strategy • Strategically driven business development • Focused integration efforts 4 |
 Performance Versus Plan • Triple-digit revenue growth and double-digit organic revenue growth • Cross-selling initiatives are gaining traction • Continued successful integration of acquired businesses 5 |
 Consolidated Highlights 6 34% improvement in Q3 2011 Adjusted EBITDA compared to Q2 2011 Performance driven by: Performance impacted by: 1. Growth in new and existing accounts Overall revenue mix shift to lower margin chemical products 2. Performance of our acquisitions Addition of non-service product offering 3. Cost saving from regional consolidation Delayed chemical product cost improvement initiatives as a result of the Daley acquisition Excluding the effect of the mix shift and the introduction of non-service products and redirection of purchases to Daley, Adjusted EBITDA margin would have been 10% versus the reported 7.8% |
 Field Reorganization 7 Benefits • Leverage the skills and deep experience of our regional leadership; • Provide more efficient distribution of products for each region, lowering product costs and enhancing customer service; • Consolidate routes and operations, simplify operating processes and eliminate redundant costs, and; • Focus our selling effort toward adding new customers and cross-selling additional products and services into existing customers Impact • $5.0 million of annual labor savings; $0.5 million realized in the third quarter • Reductions in route costs and G&A expense as a percentage of revenue • Full effect of the reductions on route expense, SG&A and adjusted EBITDA margin in Q4 2011 |
 Financial Liquidity • $84 million of cash on hand with approximately $200 million in liquidity • Finalized $62.5 million of previously announced credit facilities to be used for capital expenditures • Current capital structure is 15% debt and 85% equity • Weighted borrowing average interest rate currently 1.7% • This, combined with our operating cash flow, leaves us essentially unencumbered to continue our rapid growth and acquisition strategy • Ongoing focus on working capital management 8 |
 Acquisition Strategy • Acquisition Recap Franchises Independent Businesses Q3 2011 2 20 Year-to-date 2011 9 45 Since September 2011 - 6 • Daley is a cornerstone in our manufacturing strategy, providing the capacity to produce as much as 80% of our chemical product requirements • Our pipeline of potential targeted acquisitions exceeds $750 million in annualized revenue • Our acquisition focus has shifted toward linen and dust control businesses 9 |
 Business Development • Completed strategic acquisition of Daley International - Provides greater control over our supply chain - Reduces exposure to the unforeseen limitations of our current partners - Provides an ability to enhance margins - Enables better control of our raw material and logistics costs - Secures the capacity needed to support future growth - Eliminates potential customer conflicts with third-party manufacturers - Gives access to new vertical opportunities including manufacturing, food processing, industrial and jan-san distribution - Enhances product line with floor care, processing and specialty products • Addressing demand for a linen and dust control offering • Continued development of hand-held device technology 10 |
 Consolidated Highlights 11 Accomplishments • Annualized run rate revenue in excess of $320 million, up 433% • Acquired and integrated 69 businesses with $255 million of annualized revenue for a combined purchase price of $288 million • Believe we are the second largest institutional chemical service provider in North America • Developed into recognized participant in the linen and dust control market • Generated double-digit organic growth of 14.6% in the first quarter, 22.4% in the second quarter and 28.6% in the third quarter • Raised $195 million in total equity • Closed on $162.5 million of credit facilities |
 Consolidated Highlights 12 Accomplishments • Joined the Russell 3000 index • Expanded our employee base from 600 to more than 2,100 • Maintained a robust capital structure - Cash on hand of $84 million - Working capital increased by $62 million - Debt-to-equity ratio of 15% - $200 million of capital currently available for acquisitions and the continued growth of our business • Became a chemical manufacturer with seven plants • Entered partnerships with 5 of America’s 20 largest foodservice distributors |
 Financial Results • Revenue $67.2 million - Up 318% from prior year - Up 280% from Q4 2010 - Organic growth of 28.6% • Cost of sales $25.8 million - Up 323% from prior year - Excluding acquisitions, Cost of Sales is up 16.4% • Route expenses $14.6 million - Up 316% from the prior year - Excluding acquisitions, Route expense is up 12.9% 13 |
 Financial Results • SG&A expense $22.6 million - Up 201% from prior year - Excluding acquisitions, SG&A is up 37.7% • Adjusted EBITDA $5.3 million - Compares favorably to $(1.1) million in Q3 2010 • Net loss $3.8 million - $(0.02)/ share versus $(0.07)/share in Q3 2011 14 |
 Our Goals • Full year 2011 revenue outlook in excess of $220 million, up 250% from 2010 - Organic growth 20-30% - Gross margin 60-63% - Route margin 40-43% - Adjusted EBITDA margin 10-18% 15 |
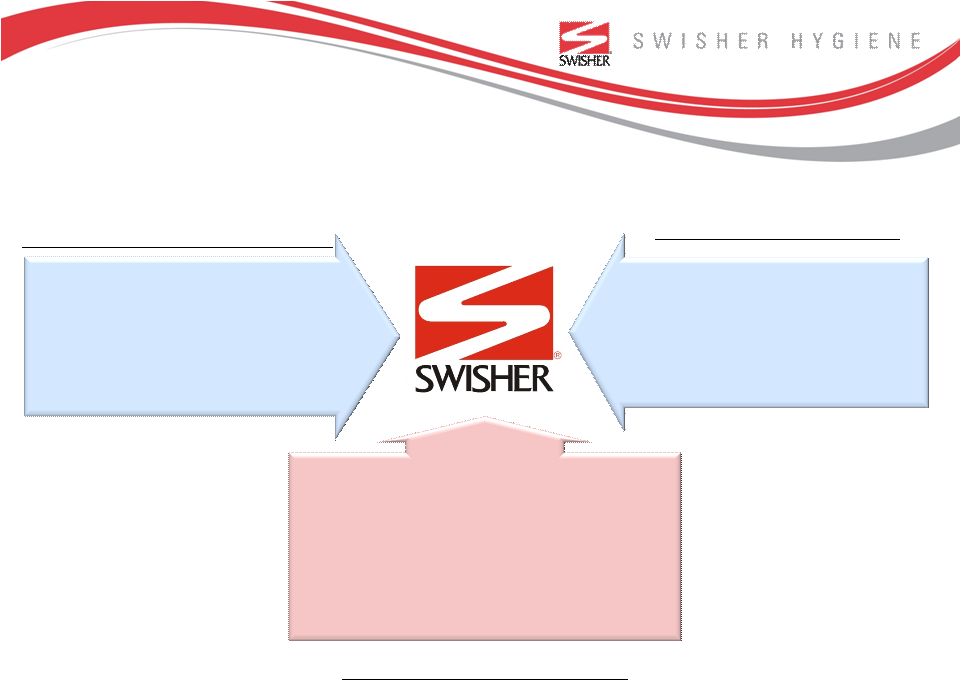 Restroom Services Hygiene Expertise Soap and Paper Products National Infrastructure Transforming Industry Thinking Facility Service Companies Back-of-House Services Chemical Expertise Distributor Partnerships Legacy Swisher Business 16 Chemical Companies Front-of-House Services Rental Products Route Model |