Results of operations for the year ended December 31, 2010 compared to the year ended December 31, 2009
The following tables present our consolidated results of operations for the year ended December 31, 2010 as compared to the year ended December 31, 2009, broken down among our four banking subsidiaries and adjusted to reflect intercompany eliminations and our contribution as the holding company.
| | | For the year ended December 31, 2010 | |
| | | | | | | | | | | | | | | Grupo Aval and eliminations | | | | |
| | | (in Ps billions) | |
Total interest income | | | 3,345.6 | | | | 1,403.9 | | | | 1,276.2 | | | | 683.1 | | | | (166.2 | ) | | | 6,542.6 | |
Total interest expense | | | (902.1 | ) | | | (457.2 | ) | | | (325.3 | ) | | | (142.8 | ) | | | (86.4 | ) | | | (1,913.8 | ) |
Net interest income | | | 2,443.5 | | | | 946.7 | | | | 950.9 | | | | 540.3 | | | | (252.6 | ) | | | 4,628.8 | |
| Total provisions (reversals), net | | | (610.6 | ) | | | (192.3 | ) | | | (101.6 | ) | | | (122.4 | ) | | | (0.0 | ) | | | (1,026.9 | ) |
| Total fees and other services income, net | | | 1,155.1 | | | | 186.6 | | | | 136.1 | | | | 140.5 | | | | (0.6 | ) | | | 1,617.7 | |
| Total other operating income | | | 582.4 | | | | 316.7 | | | | 42.0 | | | | 9.7 | | | | (165.3 | ) | | | 785.5 | |
Total operating income | | | 3,570.3 | | | | 1,257.6 | | | | 1,027.5 | | | | 568.1 | | | | (418.5 | ) | | | 6,005.1 | |
Total operating expenses | | | (1,757.9 | ) | | | (764.4 | ) | | | (558.3 | ) | | | (389.8 | ) | | | (49.5 | ) | | | (3,520.0 | ) |
Net operating income | | | 1,812.4 | | | | 493.2 | | | | 469.2 | | | | 178.4 | | | | (468.0 | ) | | | 2,485.1 | |
| Total non-operating income (expense), net | | | 96.0 | | | | 21.4 | | | | 53.0 | | | | 16.2 | | | | (9.6 | ) | | | 176.9 | |
| Income before income tax expense and non-controlling interest | | | 1,908.3 | | | | 514.6 | | | | 522.2 | | | | 194.5 | | | | (477.6 | ) | | | 2,662.1 | |
Income tax expense | | | (510.0 | ) | | | (126.2 | ) | | | (156.8 | ) | | | (49.9 | ) | | | 11.8 | | | | (831.0 | ) |
| Income before non-controlling interest | | | 1,398.3 | | | | 388.4 | | | | 365.4 | | | | 144.7 | | | | (465.8 | ) | | | 1,831.1 | |
Non-controlling interest | | | (483.4 | ) | | | (2.0 | ) | | | (3.8 | ) | | | (0.4 | ) | | | (384.7 | ) | | | (874.2 | ) |
| Net income attributable to shareholders | | | 914.9 | | | | 386.4 | | | | 361.6 | | | | 144.3 | | | | (850.4 | ) | | | 956.9 | |
| | | For the year ended December 31, 2009 | |
| | | | | | | | | | | | | | | Grupo Aval and eliminations | | | | |
| | | (in Ps billions) | |
Total interest income | | | 3,614.1 | | | | 1,821.7 | | | | 1,453.1 | | | | 789.1 | | | | 2.1 | | | | 7,680.0 | |
Total interest expense | | | (1,297.1 | ) | | | (732.0 | ) | | | (514.2 | ) | | | (217.0 | ) | | | (93.7 | ) | | | (2,854.0 | ) |
Net interest income | | | 2,317.0 | | | | 1,089.7 | | | | 938.8 | | | | 572.1 | | | | (91.6 | ) | | | 4,826.0 | |
| Total provisions (reversals), net | | | (347.8 | ) | | | (257.3 | ) | | | (94.5 | ) | | | (188.0 | ) | | | (0.0 | ) | | | (887.6 | ) |
| Total fees and other services income, net | | | 1,075.6 | | | | 216.6 | | | | 143.2 | | | | 143.3 | | | | 4.7 | | | | 1,583.5 | |
| Total other operating income | | | 492.1 | | | | 282.0 | | | | 29.4 | | | | 4.3 | | | | (123.6 | ) | | | 684.1 | |
Total operating income | | | 3,536.9 | | | | 1,331.0 | | | | 1,017.0 | | | | 531.6 | | | | (210.5 | ) | | | 6,205.9 | |
Total operating expenses | | | (1,585.3 | ) | | | (764.7 | ) | | | (536.5 | ) | | | (377.8 | ) | | | (28.1 | ) | | | (3,292.4 | ) |
Net operating income | | | 1,951.6 | | | | 566.2 | | | | 480.4 | | | | 153.9 | | | | (238.6 | ) | | | 2,913.5 | |
| Total non-operating income (expense), net | | | 78.0 | | | | 12.8 | | | | (42.3 | ) | | | 12.6 | | | | 6.6 | | | | 67.7 | |
| Income before tax expense and non-controlling interest | | | 2,029.6 | | | | 579.0 | | | | 438.1 | | | | 166.5 | | | | (232.0 | ) | | | 2,981.2 | |
Income tax expense | | | (522.7 | ) | | | (152.0 | ) | | | (132.5 | ) | | | (55.4 | ) | | | (1.7 | ) | | | (864.3 | ) |
| Income before non-controlling interest | | | 1,506.9 | | | | 427.0 | | | | 305.6 | | | | 111.1 | | | | (233.7 | ) | | | 2,116.9 | |
Non-controlling interest | | | (551.1 | ) | | | (44.9 | ) | | | (2.1 | ) | | | (0.4 | ) | | | (453.1 | ) | | | (1,051.5 | ) |
| Net income attributable to shareholders | | | 955.8 | | | | 382.1 | | | | 303.6 | | | | 110.7 | | | | (686.8 | ) | | | 1,065.4 | |
| | | | |
| | | | |
| | | | | | | |
| | | | |
Total interest income | | | (1,137.4 | ) | | | (14.8 | ) |
Total interest expense | | | (940.2 | ) | | | (32.9 | ) |
Net interest income | | | (197.2 | ) | | | (4.1 | ) |
Total provisions (reversals), net | | | 139.3 | | | | 15.7 | |
Total fees and other services income, net | | | 34.2 | | | | 2.2 | |
Total other operating income | | | 101.5 | | | | 14.8 | |
Total operating income | | | (200.8 | ) | | | (3.2 | ) |
Total operating expenses | | | 227.6 | | | | 6.9 | |
Net operating income | | | (428.4 | ) | | | (14.7 | ) |
Total non-operating income (expense), net | | | 109.3 | | | | 161.5 | |
| Income before income tax expense and non-controlling interest | | | (319.1 | ) | | | (10.7 | ) |
Income tax expense | | | (33.3 | ) | | | (3.9 | ) |
Income before non-controlling interest | | | (285.8 | ) | | | (13.5 | ) |
Non-controlling interest | | | (177.3 | ) | | | (16.9 | ) |
Net income attributable to shareholders | | | (108.5 | ) | | | (10.2 | ) |
Grupo Aval
Overview
Our net income attributable to our shareholders in 2010 decreased by 10.2%, or Ps 108.5 billion, to Ps 956.9 billion. The primary driver of this decrease in net income was the decline in total interest income, due to the overall declining interest rate environment in Colombia, which was only partially offset by a decrease in total interest expense. Despite the improvement in credit quality, our total provisions increased as a result of the Ps 298.0 billion increase in net provisions for foreclosed assets and other assets, which was principally due to provisions established by Corficolombiana associated with the realization of income from several of its equity security investments. The slight 6.9% increase in operating expense, due principally to higher administrative and other expenses and salaries and employee benefits, was consistent with the organic growth of the business and reflects BAC Credomatic’s December 2010 expenses. As a result of these factors, our efficiency ratio (which we calculate as total operating expenses minus depreciation and amortization, divided by total operating income plus net provisions) deteriorated from 42.9% in 2009 to 46.6% in 2010.
The following discussion describes the principal drivers of our consolidated results of operations for 2010 and 2009. Further detail is provided in the discussions of the results of operations of each of our banking subsidiaries, Porvenir and Corficolombiana.
Net interest income
| | | | | | | |
| | | | | | | | | | # | | | | |
| | | (in Ps billions) | | | | |
| Interest income: | | | | | | | | | | | | | |
Interest on loans | | | 4,627.3 | | | | 5,418.5 | | | | (791.2 | ) | | | (14.6 | ) |
Interest on investment securities | | | 1,452.7 | | | | 1,676.9 | | | | (224.3 | ) | | | (13.4 | ) |
Interbank and overnight funds | | | 99.0 | | | | 148.9 | | | | (49.9 | ) | | | (33.5 | ) |
Financial leases | | | 363.6 | | | | 435.7 | | | | (72.1 | ) | | | (16.5 | ) |
Total interest income | | | 6,542.6 | | | | 7,680.0 | | | | (1,137.4 | ) | | | (14.8 | ) |
| Interest expense: | | | | | | | | | | | | | | | | |
Checking accounts | | | (29.5 | ) | | | (53.2 | ) | | | (23.7 | ) | | | (44.5 | ) |
Time deposits | | | (679.1 | ) | | | (1,219.0 | ) | | | (539.9 | ) | | | (44.3 | ) |
Savings deposits | | | (640.8 | ) | | | (925.3 | ) | | | (284.5 | ) | | | (30.7 | ) |
Total interest expense on deposits | | | (1,349.4 | ) | | | (2,197.5 | ) | | | (848.1 | ) | | | (38.6 | ) |
Borrowings from banks and others | | | (177.0 | ) | | | (291.5 | ) | | | (114.5 | ) | | | (39.3 | ) |
| Interbank and overnight funds (expenses) | | | (109.3 | ) | | | (111.7 | ) | | | (2.4 | ) | | | (2.1 | ) |
Long-term debt (bonds) | | | (278.1 | ) | | | (253.4 | ) | | | 24.7 | | | | 9.8 | |
Total interest expense | | | (1,913.8 | ) | | | (2,854.0 | ) | | | (940.2 | ) | | | (32.9 | ) |
Net interest income | | | 4,628.8 | | | | 4,826.0 | | | | (197.2 | ) | | | (4.1 | ) |
Our net interest income decreased by 4.1% to Ps 4,628.8 billion in 2010, primarily due to a Ps 863.3 billion decrease in interest income on loans and financial leases and a Ps 224.3 billion decline in interest income on investment securities, partially offset by a Ps 940.2 billion decrease in total interest expense.
Average interest-earning assets grew slightly faster than average interest-bearing liabilities, which resulted in the ratio of average interest-earning assets to average interest-bearing liabilities increasing from 1.16 in 2009 to 1.18 in 2010. The increase in this ratio reflects the 16.7% growth of our average interest-earning assets from Ps 54,841.2 billion in 2009 to Ps 63,978.9 billion in 2010. However, the spread between the yield earned on our interest-earning assets and the interest rate paid on our interest-bearing liabilities decreased by 126 basis points, from 8.0% in 2009 to 6.7% in 2010, which was primarily a result of the decrease in yield from our loans and financial leases. The spread between the yield earned on loans and financial leases and the cost of interest-bearing liabilities decreased by 102 basis points from 8.8% in 2009 to 7.8% in 2010, because our loans and financial leases, especially our commercial loans, repriced faster than our liabilities in a declining interest rate environment. The deterioration of the spread between interest-earning assets and interest-bearing liabilities also resulted from a decrease in the yield of our investment securities portfolio, due primarily to the fact that while 2010 presented a favorable environment for fixed income securities, 2009 was even more favorable and the same results were not repeated. The decrease in income from the compression of the spread between the yield earned on our interest-earning assets and the interest rate paid on our interest-bearing liabilities was only partially offset by the increase in income resulting from the slight growth in the ratio of average interest-earning assets to average interest-bearing liabilities, and as a result, our net interest income decreased in 2010. Ultimately, our net interest margin declined from 8.8% in 2009 to 7.2% in 2010.
The primary driver of the decrease in net interest income was a Ps 863.3 billion, or 14.7%, decrease in interest income from loans and financial leases, primarily due to a decline in average yield, partly offset by an increase in average balances. Average yields for loans and financial leases decreased from 14.9% in 2009 to 11.3% in 2010. This reduction in yield was consistent with the 265 basis point decline in the average DTF rate (from a weekly average of 6.33% for 2009 to a weekly average of 3.68% for 2010, representing a 41.9% decrease). The DTF rate is the 90-day time deposit benchmark interest rate in Colombia and the rate most commonly used by banks to index the majority of their domestic interest-earning assets (excluding investment securities) and their deposits. However, our subsidiary banks’ results in 2010 indicate that the decrease in yield from loans and financial leases was not uniform across all loan types, with the percentage decrease in the yield from commercial loans being considerably higher than that for consumer loans. While commercial loans and interest-bearing liabilities are predominantly indexed to the DTF, consumer loans are usually indexed to industry averages and are set at rates close to the Tasa Usura (the legal limit for all loans other than microcredit loans). For 2010, the average Tasa Usura was approximately 22.7%,
compared to an average Tasa Usura of approximately 28.8% for 2009, which represented a 21.0% decrease in the average Tasa Usura for 2010 as compared to 2009. This decrease was less than the decrease in commercial loan yield, which much more closely resembled the 41.9% decrease in the average weekly DTF rate. This rate dynamic is typically observed, as movements in the Tasa Usura tend to exhibit a lag and the rate is initially less sensitive to increases / decreases in general interest rates. The decline of the average interest rate on loans and financial leases generated a Ps 1,341.3 billion decrease in interest income on a period-over-period basis. This decrease was partially offset by the 11.7% growth of the average balance of our loan and financial lease portfolio to Ps 43,977.1 billion, primarily due to the growth of commercial loans, and was responsible for producing a Ps 477.9 billion increase in interest income. See “Item 4. Information on the Company—B. Business overview—Selected statistical data.”
A Ps 224.3 billion decrease in interest income from investment securities also contributed to the decline in net interest income. Under Colombian Banking GAAP, interest income from investment securities includes accrued interest on debt instruments, valuation adjustments and gains (losses) realized on debt and equity securities that are accounted for as “available for sale,” gains (losses) on repurchase transactions (i.e., repos), gains (losses) realized on the sale of debt securities, and mark-to-market gains (losses) on the trading securities portfolio.
Our fixed income portfolio, which yielded Ps 946.0 billion of income in 2010, accounted for 65.1% of our earnings on investment securities for the year. These fixed income earnings were 17.5%, or Ps 200.3 billion, less than the fixed income earnings generated in 2009, reflecting the fact that in 2009 interest rates declined significantly and at a steady pace, while in 2010 interest rates were more volatile and ultimately declined less. However, it is important to note that fixed income earnings in 2010 were nonetheless 23.6% higher than in 2008, illustrating that 2010 presented a favorable environment for fixed income securities, but that 2009 was even better. During 2009, the interest rate on the Colombian Treasury Bond due in 2020, a benchmark for tracking the movement of fixed income rates, decreased by 216 basis points and closed December 31, 2009 at 8.47%. On the other hand, in 2010, the same benchmark index decreased by 85 basis points to 7.70%. Moreover, in January and February of 2010, this benchmark rate increased 61 basis points — at one point reaching 9.16%. This increase in rates proved particularly deleterious for Banco de Occidente, as 53.8% of its fixed income security investments were classified as “for trading” (compared to 29.8%, 12.4%, and 32.1% for Banco de Bogotá, Banco Popular and Banco AV Villas, respectively) at December 31, 2009 and thus the corresponding mark-to-market losses flowed to its income statement and reduced its income from investment securities. Following this increase in rates, a significant portion of each bank’s fixed income investments was reclassified as available for sale, as evidenced by the fact that at December 31, 2010 the percent of fixed income securities classified as “for trading” at each bank was 16.2%, 32.8%, 12.7%, and 42.0% for Banco de Bogotá, Banco de Occidente, Banco Popular and Banco AV Villas, respectively. While this risk management action sought to provide greater insulation for the banks in case of a further increase in rates, it also resulted in less income being generated for the remainder of 2010 when rates once again began to decline.
The income yielded by our equity securities portfolio in 2010 also decreased, but only by 4.6% to Ps 506.3 billion. This represented 34.9% of our income from investment securities in 2010. Income from the equity securities portfolio was almost entirely driven by Banco de Bogotá and, more specifically, Corficolombiana. As further explained in the Corficolombiana 2010-2009 discussion, this decrease primarily reflected the fact that the income realized by Corficolombiana related to the appreciation of its investments was lower in 2010 as compared to 2009.
The decrease in total interest expense partially offset the decrease in total interest income, reflecting a 250 basis point decrease in the average interest rate paid on interest-bearing liabilities from 6.0% in 2009 to 3.5% in 2010. The reduction in funding costs was consistent with the aforementioned decrease in the average DTF rate. The decrease in interest expense was primarily due to the 298 basis point decline in the average interest rate paid on time deposits, from 7.2% in 2009 to 4.3% in 2010, and the 189 basis point decline in average interest rate on savings deposits, from 4.6% in 2009 to 2.7% in 2010. The decline in interest rates paid on interest-bearing liabilities resulted in a Ps 1,147.4 billion decrease in interest expense.
The decline in funding costs was partially offset by the 14.4% increase in the average balance of interest-bearing liabilities to Ps 54,015.2 billion. This growth was primarily a result of the 17.1% increase in the average balance of savings deposits to Ps 23,362.1 billion, the 63.5% increase in the average balance of long-term debt to Ps 4,358.2 billion, and the 64.9% increase in the average balance of interbank and overnight funds to Ps 3,920.4 billion.
Only time deposits saw their average balance decrease, by 5.2% to Ps 15,970.4. The increase in the average balances of savings deposits, long-term debt, and interbank and overnight funds, as well as the decrease in the average balance of time deposits, was primarily the result of our banks searching for cheaper sources of funding in 2010. The overall increase in the average balance of interest-bearing liabilities was responsible for generating a Ps 207.1 billion increase in interest expense in 2010.
Provisions
Our total net provisions increased by 15.7% to Ps 1,026.9 billion in 2010. This increase was mainly attributable to the Ps 298.0 billion increase in net provisions for foreclosed assets and other assets to Ps 315.6 billion. The primary reason for this increase was a cautionary Ps 245.1 billion market risk provision established by Corficolombiana in December, after discussion with the Superintendency of Finance, in order to cover risks associated with potential future fluctuations of the share prices of its equity investments. Additionally, Corficolombiana established a Ps 69.8 billion net provision for foreclosed assets and other assets, with the permission of the Superintendency of Finance, related to the realization of income stemming from its investment in Sociedad de Inversiones en Energía S.A. (SIE) (further explained in the Corficolombiana 2010-2009 discussion).
Despite the increase in net provisions, our net provisions for loan and financial lease losses, accrued interest and other receivables decreased by 13.9% to Ps 820.3 billion. The main component of this line item, net provisions for loans and financial leases, decreased by 6.9% to Ps 764.5 billion (including BAC Credomatic financial data, which added Ps 0.7 billion in net provisions for loan and financial lease losses). The largest decrease in net provisions for loan and financial lease losses was recorded by Banco AV Villas, where provisions declined by Ps 58.7 billion or 28.8%. By contrast, Banco Popular’s net provisions for loan and financial lease losses increased by Ps 34.3 billion to Ps 128.6 billion due primarily to the deterioration of the credit quality of certain loans throughout the fourth quarter that were ultimately charged-off (further explained in the Banco Popular 2010-2009 discussion).
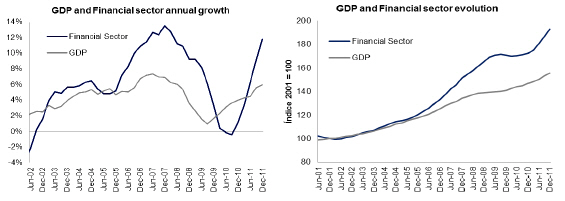
The decrease in provisions for loan and financial lease losses reflected the improvement in the quality of our loan and financial lease portfolio, which was consistent with the recovery of the Colombian economy. According to DANE, in 2010 Colombia’s real GDP grew 4.3%, as compared to 1.5% in 2009.
Past due loans and financial leases rose by 3.9% to Ps 1,569.7 billion at December 31, 2010; however, this increase was due to the BAC Credomatic acquisition, as our Colombian operations’ past due loans and financial leases decreased by 16.9% to Ps 1,255.8 billion at December 31, 2010. Our delinquency ratio (calculated as the ratio of loans and financial leases at least 31 days past due to total gross loans and financial leases) decreased from 3.6% at December 31, 2009 to 2.7% at December 31, 2010. Our delinquency ratio for our Colombian operations at December 31, 2010 was 2.6%. The decrease in past due loans and financial leases in our Colombian operations, by volume, was concentrated primarily in commercial loans past due, which decreased by 19.5% to Ps 538.7 billion (with its delinquency ratio declining from 2.6% to 1.7%) and consumer loans past due, which decreased by 10.8% to Ps 502.9 billion (with its delinquency ratio declining from 4.9% to 3.9%). Financial leases past due also decreased significantly, declining by 25.2% to Ps 117.8 billion (with its delinquency ratio declining from 4.9% to 3.3%). Incorporating the impact of BAC, our delinquency ratios for commercial, consumer, and financial leases at December 31, 2010 were 1.8%, 4.0%, and 3.2%, respectively.
At the subsidiary level, Banco Popular had the lowest delinquency ratio (2.5% at December 31, 2010, as compared to 3.7% at December 31, 2009), while Banco AV Villas continued to have the highest delinquency ratio (4.5% at December 31, 2010, as compared to 5.5% at December 31, 2009). The delinquency ratio at Banco AV Villas reflects its exposure to mortgage and traditional consumer loans, which generally have higher delinquency ratios. At December 31, 2010, 13.2% of Banco AV Villas’ total gross loans were mortgage loans (compared to 0.2%, 0.1%, and 1.2% at Banco de Bogotá excluding the effect of the BAC Credomatic acquisition, Banco de Occidente, and Banco Popular, respectively, at December 31, 2010), while 44.2% of its total gross loans were consumer loans (compared to 16.9% and 19.3% at Banco de Bogotá excluding the effect of the impact of BAC and Banco de Occidente acquisition, respectively. Banco de Bogotá with BAC holds 9.4% of its total gross loans as mortgage loans and 23.0% of its total gross loans as consumer loans. Although Banco Popular has a higher proportion of consumer loans, 99.7% of these loans are payroll loans (compared to an equivalent figure of approximately 40.0% for Banco AV Villas), which are of a much higher credit quality than traditional consumer loans.
Provisions for loans and financial lease losses decreased slightly less than past due loans and financial leases primarily as a result of an increase in charge-offs, for which we record provisions of 100% before they are charged-off. For further information, see “Item 4. Information on the Company—B. Business overview—Selected statistical data—Movements in allowances for credit losses—Charge-offs.” In 2010, charge-offs increased by 21.4% to Ps 677.6 billion (including BAC Credomatic’s impact, which contributed Ps 17.5 billion in charge-offs). As a result of the increase in charge-offs, which was due to the write-off of several loans by our subsidiary banks’ primarily related to the fact that with the recovery of the economy it became clear certain loans were going to be unrecoverable (for further detail refer to our subsidiary banks’ 2010 – 2009 discussions), our charge-off to average loan ratio increased by 14 basis points to 1.50%. In our Colombian operations, our charge-offs increased by 18.2%, while our charge-off to average loan ratio increased by 13 basis points to 1.49%.
The higher level of our net provisions for loan and financial lease losses relative to our charge-offs resulted in the 16.1% growth of our allowance for loan and financial lease losses to Ps 2,183.9 billion at December 31, 2010. For our Colombian operations, our allowance increased by 5.1% to Ps 1,977.6 billion. The growth of our allowance for loan and financial lease losses, combined with the slight increase in our past due loans due to the BAC Credomatic acquisition, resulted in an increase in our coverage ratio (defined as our allowance for loan and financial lease losses to loans at least 31 days past due) from 124.5% at December 31, 2009 to 139.1% at December 31, 2010. The coverage ratio for our Colombian operations was 157.5% at December 31, 2010. The lower coverage ratio incorporating the impact of BAC is due to the fact that proportionately BAC contributed more in past due loans than in allowance, which was expected considering 30.3% of BAC’s gross loan portfolio was concentrated in mortgage loans (which require less allowance than other types of loans).
Net provisions for accrued interest and other receivables decreased by 57.6% to Ps 55.9 billion in 2010, which was primarily a result of the improvement in the Colombian economy described above and a change in provisioning requirements mandated by the Superintendency of Finance in 2009. Prior to June 30, 2009, when any of our institutions suspended the accrual of interest on interest-earning assets, the interest accrued up to that time was provisioned for based on the ratio calculated by the commercial and consumer reference models. See “Item 11. Quantitative and Qualitative Disclosures About Risk——Risk management—Credit risk.” Effective as of July 1, 2009, the Superintendency of Finance required that financial institutions provision 100% of such accrued interest, which resulted in considerably higher provisioning for these accounts in the remainder of 2009. Following the initial increase in provisions to 100% of accrued interest and other receivables in 2009, our institutions were required to increase or decrease provisions based on marginal changes, and thus, the provision expense in 2010 decreased as compared to the provision expense for in 2009.
The recovery of charged-off assets increased by Ps 25.7 billion to Ps 109.0 billion, primarily as a result of higher charge-offs and a more effective recovery effort.
Total fees and other services income
| | | | | | | |
| | | | | | | | | | # | | | | |
| | | (in Ps billions) | | | | |
| Fees and other services income: | | | | | | | | | | | | | |
| Commissions from banking services | | | 916.0 | | | | 866.0 | | | | 50.0 | | | | 5.8 | |
Branch network services | | | 22.2 | | | | 19.5 | | | | 2.6 | | | | 13.5 | |
Credit card merchant fees | | | 165.6 | | | | 97.8 | | | | 67.8 | | | | 69.4 | |
Checking fees | | | 69.5 | | | | 70.7 | | | | (1.1 | ) | | | (1.6 | ) |
Warehouse services | | | 147.5 | | | | 149.7 | | | | (2.2 | ) | | | (1.5 | ) |
Fiduciary activities | | | 146.9 | | | | 137.6 | | | | 9.2 | | | | 6.7 | |
Pension plan administration | | | 409.9 | | | | 400.2 | | | | 9.7 | | | | 2.4 | |
Other | | | 103.3 | | | | 119.8 | | | | (16.5 | ) | | | (13.8 | ) |
| Total fees and other services income | | | 1,980.9 | | | | 1,861.3 | | | | 119.6 | | | | 6.4 | |
Fees and other services expenses | | | (363.1 | ) | | | (277.8 | ) | | | 85.3 | | | | 30.7 | |
| Total fees and other services income, net | | | 1,617.7 | | | | 1,583.5 | | | | 34.2 | | | | 2.2 | |
Total fees and other services income, net increased by 2.2% to Ps 1,617.7 billion in 2010. Gross total fees and other services income increased by Ps 119.6 billion to Ps 1,980.9 billion, while fees and other services expenses increased by Ps 85.3 billion to Ps 363.1 billion. As explained in more detail in the Banco de Occidente 2010-2009 discussion below, one of the main reasons for the increase in both credit card merchant fees and fee expenses was due to a reclassification of certain accounts stemming from the fact that Banco de Occidente previously recorded credit card merchant fees net of expenses. A second reclassification, which is further explained in the Banco AV Villas 2010-2009 discussion, is an important reason for the increase in commissions from banking services and the decrease in “Other.”
These reclassifications aside, the acquisition of BAC Credomatic, and the 30 days of its income consolidated in our 2010 results, explains a number of these increases. BAC Credomatic is particularly strong in the generation of fee income, contributing: approximately Ps 37.9 billion in commissions from banking services, Ps 18.6 billion in credit card merchant fees, and Ps 5.7 billion in “Other” fees, while adding approximately Ps 7.2 billion in fee expense.
Furthermore, fiduciary activity fees increased by 6.7% to Ps 146.9 billion, principally due to higher returns generated by Banco de Bogotá and Banco de Occidente’s fiduciary subsidiaries, while pension plan administration fees increased by 2.4% to Ps 409.9 billion due to higher fees contributed by Porvenir.
Other operating income
| | | | | | | |
| | | | | | | | | | # | | | | |
| | | (in Ps billions) | | | | |
Foreign exchange gains (losses), net | | | 49.5 | | | | (141.5 | ) | | | 191.0 | | | | 135.0 | |
Gains on derivative operations, net | | | 92.9 | | | | 287.5 | | | | (194.6 | ) | | | (67.7 | ) |
| Gains on sales of investments in equity securities, net | | | 87.5 | | | | 4.0 | | | | 83.4 | | | | 2066.9 | |
| Income from non-financial sector, net (1) | | | 294.8 | | | | 231.2 | | | | 63.6 | | | | 27.5 | |
Dividend income | | | 43.5 | | | | 68.9 | | | | (25.4 | ) | | | (36.9 | ) |
Other | | | 217.4 | | | | 233.9 | | | | (16.5 | ) | | | (7.1 | ) |
Total other operating income | | | 785.5 | | | | 684.1 | | | | 101.5 | | | | 14.8 | |
| (1) | Income from non-financial sector reflects Corficolombiana’s (Banco de Bogotá’s subsidiary) operating results in its consolidated investments in companies not related to the financial sector such as Epiandes, Hoteles Estelar and Organización Pajonales, among others. This result is net of the following operating and administrative expenses for 2010 and 2009: Ps 644.3 billion and Ps 549.2 billion, respectively. For a description of these investments, see “Item 4. Information on the Company—Business overview—Corficolombiana—Equity investment portfolio.” |
Total other operating income increased by 14.8% to Ps 785.5 billion in 2010, primarily due to a Ps 83.4 billion increase in net gains on sales of investments in equity securities. This was principally due to Corficolombiana’s sale of a portion of its stake in Banco de Occidente in October and December 2010 and its entire position in Colombina S.A. (further explained in the Corficolombiana 2010-2009 discussion). The second major driver in the increase in other operating income was 27.5% increase in net income from the non-financial sector to Ps 294.8 billion, which was due almost entirely to greater income generated by Corficolombiana’s investments in the non-financial sector (further explained in the Corficolombiana 2010-2009 discussion).
Partially offsetting these increases in income was a 36.9% decrease in dividend income to Ps 43.5 billion, principally reflecting an accounting convention regarding how dividend income for certain of Corficolombiana’s unconsolidated investments is recorded (see Corficolombiana 2010 – 2009 discussion for further information). The 7.1% decrease in “Other” income to Ps 217.4 billion is primarily attributable to the decrease in income generated by a few of Fidubogotá’s, Banco de Bogotá’s fiduciary subsidiary, jointly-managed fiduciary contracts (further
explained in the Banco de Bogotá 2010-2009 discussion). Finally, the Ps 194.6 billion decrease in net gains on derivative operations was almost entirely offset by the Ps 191.0 billion increase in related net foreign exchange gains. In the ordinary course of business, we enter into forward contracts and other derivative transactions in foreign currency through our treasury department almost entirely for hedging purposes and on behalf of clients.
Operating expenses
| | | | | | | |
| | | | | | | | | | # | | | | |
| | | (in Ps billions) | | | | |
Salaries and employee benefits | | | (1,262.4 | ) | | | (1,183.9 | ) | | | 78.5 | | | | 6.6 | |
Bonus plan payments | | | (45.1 | ) | | | (42.5 | ) | | | 2.6 | | | | 6.2 | |
Termination payments | | | (11.6 | ) | | | (7.2 | ) | | | 4.4 | | | | 61.5 | |
Administrative and other expenses | | | (1,817.1 | ) | | | (1,675.3 | ) | | | 141.8 | | | | 8.5 | |
Deposit security, net | | | (133.1 | ) | | | (126.8 | ) | | | 6.3 | | | | 5.0 | |
Charitable and other donation expenses | | | (7.2 | ) | | | (8.1 | ) | | | (0.9 | ) | | | (11.1 | ) |
Depreciation | | | (214.8 | ) | | | (205.2 | ) | | | 9.6 | | | | 4.7 | |
Goodwill amortization | | | (28.6 | ) | | | (43.5 | ) | | | (14.9 | ) | | | (34.2 | ) |
Total operating expenses | | | (3,520.0 | ) | | | (3,292.4 | ) | | | 227.6 | | | | 6.9 | |
Total operating expenses increased by 6.9% to Ps 3,520.0 billion in 2010. This increase was primarily due to an 8.5% rise in administrative and other expenses to Ps 1,817.1 billion and a 6.6% increase in salaries and employee benefits to Ps 1,262.4 billion, which were in line with the organic growth of the business and reflect the addition of BAC Credomatic’s December expenses. Salaries customarily are increased on a yearly basis using the previous year’s Consumer Price Index, or “CPI,” which was 2.0% in 2009, as a benchmark. Total headcount increased from 36,976 at December 31, 2009 to 53,485 at December 31, 2010, which includes the addition of 15,775 employees from BAC Credomatic. Our headcount in our Colombian operations increased 2.0% to 37,710. at December 31, 2010.
Because our total operating expenses before depreciation and amortization grew at 7.6%, while our operating income before provisions decreased by 0.9%, our efficiency ratio slightly deteriorated in 2010 as compared to 2009, rising from 42.9% in 2009 to 46.6% in 2010. Despite this increase, our efficiency ratio remains one of the best in the financial industry in Colombia.
Non-operating income (expense)
Total net non-operating income (expense) for 2010 was Ps 176.9 billion, which represents a Ps 109.3 billion increase from total net non-operating income of Ps 67.7 billion in 2009. Total non-operating income decreased marginally, by 0.8% to Ps 364.6 billion, while total non-operating expense decreased by 37.4% to Ps 187.6 billion between 2009 and 2010. The decrease in total non-operating expense is primarily explained by a decline in this line item for Banco de Bogotá and Banco Popular (further explained in the Banco de Bogotá and Banco Popular 2010-2009 discussions). The rise in non-operating income was primarily due to an increase at Banco Popular, due to the reversal of a portion of their provisions for employee pension plans and the recovery of charged-off loans from the Fondo Nacional de Garantías (further explained in the Banco Popular 2010-2009 discussion).
Income tax expense
Income before income tax expense and non-controlling interest decreased 10.7% from Ps 2,981.2 billion in 2009 to Ps 2,662.1 billion in 2010. Despite a slight increase in our effective tax rate, from 29.0% in 2009 to 31.2% in 2010, our income tax expense decreased by 3.9% to Ps 831.0 billion in 2010, reflecting the lower income before tax expense and non-controlling interest in 2010.
Non-controlling interest
Our non-controlling interest decreased by 16.9% to Ps 874.2 billion in 2010. This decrease was primarily due to the performance of Corficolombiana, of which our banking subsidiaries own 56.4% (funds managed by Porvenir own an additional 3.3% of Corficolombiana, which are not consolidated into Porvenir or us). In 2009, Corficolombiana represented a greater percentage of our consolidated net income before non-controlling interest as compared to our consolidated net income before non-controlling interest in 2010.
Segment results of operations for the year ended December 31, 2011 compared to the year ended December 31, 2010
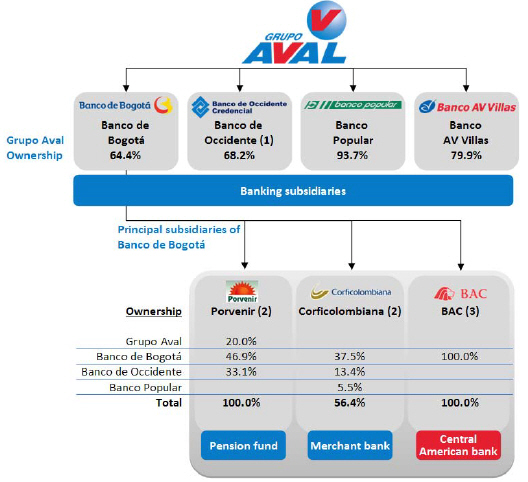
Banco de Bogotá
Overview
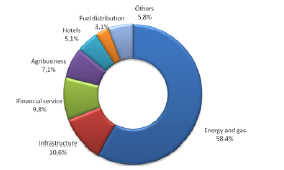
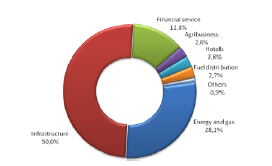
Banco de Bogotá’s net income attributable to its shareholders in the year ended December 31, 2011 increased by 25.2%, or Ps 230.8 billion, to Ps 1,145.7 billion. Banco de Bogota’s operations excluding LB Panama contributed Ps 814.7 billion and LB Panama’s operation contributed Ps 331.0 billion.
Net income from Banco de Bogotá’s operations excluding LB Panama decreased by 5.5%, or Ps 47.2 billion, in the year ended December 31, 2011. The primary reasons for this decrease were a decrease in income from investment securities, an increase in interest expense and an increase in operating expenses only partially offset by higher income from loans and financial leases, lower net provisions (indicating a recovery) and higher net fee income.
The following discussion describes the principal drivers of Banco de Bogotá’s consolidated results of operations for the years ended December 31, 2011 and 2010. Further detail is provided in the discussion of the results of operations of LB Panama, Porvenir and Corficolombiana.
Banco de Bogotá’s results of operations in 2011 include 12 months of BAC Credomatic operations whereas the 2010 results include only one month of BAC Credomatic operations. In order to provide a meaningful comparison, we present in the following tables information that shows “Banco de Bogota’s consolidated”, “Banco de Bogotá consolidated excluding LB Panama” and “ LB Panama’s” results. “Banco de Bogotá consolidated excluding LB Panama” is the result of subtracting “LB Panama” results from “Banco de Bogotá consolidated” results.
| | | Banco de Bogotá consolidated | |
| | | | | | | |
| | | | | | | | | | # | | | | |
| | | (in Ps billions) | | | | |
Total interest income | | | 4,395.9 | | | | 3,345.6 | | | | 1,050.3 | | | | 31.4 | |
Total interest expense | | | (1,459.2 | ) | | | (902.1 | ) | | | 557.1 | | | | 61.8 | |
Net interest income | | | 2,936.7 | | | | 2,443.5 | | | | 493.2 | | | | 20.2 | |
Total provisions (reversals), net | | | (139.0 | ) | | | (610.6 | ) | | | (471.6 | ) | | | (77.2 | ) |
Total fees and other services income, net | | | 1,756.8 | | | | 1,155.1 | | | | 601.7 | | | | 52.1 | |
Total other operating income | | | 758.1 | | | | 582.4 | | | | 175.8 | | | | 30.2 | |
Total operating income | | | 5,312.6 | | | | 3,570.3 | | | | 1,742.3 | | | | 48.8 | |
Total operating expenses | | | (2,968.0 | ) | | | (1,757.9 | ) | | | 1,210.0 | | | | 68.8 | |
Net operating income | | | 2,344.6 | | | | 1,812.4 | | | | 532.2 | | | | 29.4 | |
Total non-operating income (expense), net | | | 68.5 | | | | 96.0 | | | | (27.5 | ) | | | (28.6 | ) |
| Income before income tax expense and non-controlling interest | | | 2,413.1 | | | | 1,908.3 | | | | 504.8 | | | | 26.5 | |
Income tax expense | | | (737.2 | ) | | | (510.0 | ) | | | 227.2 | | | | 44.5 | |
Income before non-controlling interest | | | 1,675.9 | | | | 1,398.3 | | | | 277.6 | | | | 19.8 | |
Non-controlling interest | | | (530.2 | ) | | | (483.4 | ) | | | 46.8 | | | | 9.7 | |
Net income attributable to shareholders | | | 1,145.7 | | | | 914.9 | | | | 230.8 | | | | 25.2 | |
| | | Banco de Bogotá excl. LB Panama | | | | |
| | | | | | | | | | | | | |
| | | | | | | | | | # | | | | | | | 2011 | | | | 2010 | | | | # | |
| | | (in Ps billions) | | | | | | (in Ps billions) | |
Total interest income | | | 2,981.0 | | | | 3,226.6 | | | | (245.7 | ) | | | (7.6 | ) | | | 1,415.0 | | | | 119.0 | | | | 1,296.0 | |
Total interest expense | | | (1,124.1 | ) | | | (873.2 | ) | | | 250.9 | | | | 28.7 | | | | (335.1 | ) | | | (29.0 | ) | | | 306.2 | |
Net interest income | | | 1,856.9 | | | | 2,353.5 | | | | (496.6 | ) | | | (21.1 | ) | | | 1,079.8 | | | | 90.0 | | | | 989.8 | |
| Total provisions (reversals), net | | | 26.0 | | | | (608.3 | ) | | | (634.3 | ) | | | (104.3 | ) | | | (165.0 | ) | | | (2.3 | ) | | | 162.7 | |
| Total fees and other services income, net | | | 1,157.4 | | | | 1,100.0 | | | | 57.4 | | | | 5.2 | | | | 599.3 | | | | 55.1 | | | | 544.3 | |
| Total other operating income | | | 661.7 | | | | 565.1 | | | | 96.6 | | | | 17.1 | | | | 96.5 | | | | 17.3 | | | | 79.2 | |
Total operating income | | | 3,701.9 | | | | 3,410.2 | | | | 291.8 | | | | 8.6 | | | | 1,610.6 | | | | 160.1 | | | | 1,450.5 | |
Total operating expenses | | | (1,833.4 | ) | | | (1,643.9 | ) | | | 189.5 | | | | 11.5 | | | | (1,134.5 | ) | | | (114.0 | ) | | | 1,020.5 | |
Net operating income | | | 1,868.5 | | | | 1,766.3 | | | | 102.2 | | | | 5.8 | | | | 476.1 | | | | 46.1 | | | | 430.0 | |
| Total non-operating income (expense), net | | | 65.6 | | | | 67.7 | | | | (2.1 | ) | | | (3.0 | ) | | | 2.9 | | | | 28.3 | | | | (25.4 | ) |
| Income before income tax expense and non-controlling interest | | | 1,934.1 | | | | 1,833.9 | | | | 100.2 | | | | 5.5 | | | | 479.0 | | | | 74.4 | | | | 404.6 | |
Income tax expense | | | (589.3 | ) | | | (488.6 | ) | | | 100.7 | | | | 20.6 | | | | (147.9 | ) | | | (21.4 | ) | | | 126.5 | |
| Income before non-controlling interest | | | 1,344.8 | | | | 1,345.4 | | | | (0.5 | ) | | | (0.0 | ) | | | 331.1 | | | | 53.0 | | | | 278.1 | |
Non-controlling interest | | | (530.1 | ) | | | (483.4 | ) | | | 46.7 | | | | 9.7 | | | | (0.1 | ) | | | (0.0 | ) | | | 0.1 | |
| Net income attributable to shareholders | | | 814.7 | | | | 862.0 | | | | (47.2 | ) | | | (5.5 | ) | | | 331.0 | | | | 53.0 | | | | 278.0 | |
| (1) | LB Panama’s financial information is prepared in accordance with Colombian Banking GAAP and primarily reflects BAC Credomatic’s consolidated results, which are consolidated in LB Panama’s results from December 1, 2010. At December 31, 2011, LB Panama had Ps 2,017.3 billion of goodwill associated with the BAC Credomatic acquisition and Ps 524.5 billion of indebtedness that it incurred to finance, in part, the BAC Credomatic acquisition. Goodwill amortization and interest expense associated with the BAC Credomatic acquisition for the year ended December 31, 2011 were Ps 49.1 billion and Ps 19.4 billion, respectively. |
Net interest income
| | | | | | | |
| | | | | | | | | | # | | | | |
| | | (in Ps billions) | | | | |
| Interest income: | | | | | | | | | | | | | |
Interest on loans | | | 3,618.6 | | | | 2,040.9 | | | | 1,577.6 | | | | 77.3 | |
Interest on investment securities | | | 552.2 | | | | 1,156.7 | | | | (604.5 | ) | | | (52.3 | ) |
Interbank and overnight funds | | | 98.2 | | | | 67.8 | | | | 30.3 | | | | 44.7 | |
Financial leases | | | 127.0 | | | | 80.1 | | | | 46.9 | | | | 58.6 | |
Total interest income | | | 4,395.9 | | | | 3,345.6 | | | | 1,050.3 | | | | 31.4 | |
| Interest expense: | | | | | | | | | | | | | | | | |
Checking accounts | | | (66.0 | ) | | | (22.4 | ) | | | 43.6 | | | | 194.3 | |
Time deposits | | | (571.7 | ) | | | (374.0 | ) | | | 197.8 | | | | 52.9 | |
Savings deposits | | | (421.7 | ) | | | (290.4 | ) | | | 131.3 | | | | 45.2 | |
Total interest expense from deposits | | | (1,059.4 | ) | | | (686.8 | ) | | | 372.7 | | | | 54.3 | |
Borrowing from banks and others | | | (204.0 | ) | | | (62.2 | ) | | | 141.9 | | | | 228.1 | |
Interbank and overnight funds (expenses) | | | (111.1 | ) | | | (86.6 | ) | | | 24.5 | | | | 28.3 | |
Long-term debt (bonds) | | | (84.6 | ) | | | (66.6 | ) | | | 18.1 | | | | 27.1 | |
Total interest expense | | | (1,459.2 | ) | | | (902.1 | ) | | | 557.1 | | | | 61.8 | |
Net interest income | | | 2,936.7 | | | | 2,443.5 | | | | 493.2 | | | | 20.2 | |
| | | Banco de Bogotá excl. LB Panama | | | | |
| | | | | | | | | | | | | |
| | | | | | | | | | # | | | | | | | 2011 | | | | 2010 | | | | # | |
| | | (in Ps billions) | | | | | | (in Ps billions) | |
| Interest income: | | | | | | | | | | | | | | | | | | | | | | | | | |
Interest on loans | | | 2,299.5 | | | | 1,929.5 | | | | 370.0 | | | | 19.2 | | | | 1,319.0 | | | | 111.4 | | | | 1,207.6 | |
| Interest on investment securities | | | 499.4 | | | | 1,152.6 | | | | (653.3 | ) | | | (56.7 | ) | | | 52.8 | | | | 4.1 | | | | 48.7 | |
| Interbank and overnight funds | | | 75.2 | | | | 65.9 | | | | 9.3 | | | | 14.0 | | | | 23.0 | | | | 1.9 | | | | 21.1 | |
Financial leases | | | 106.9 | | | | 78.5 | | | | 28.4 | | | | 36.1 | | | | 20.1 | | | | 1.6 | | | | 18.6 | |
Total interest income | | | 2,981.0 | | | | 3,226.6 | | | | (245.7 | ) | | | (7.6 | ) | | | 1,415.0 | | | | 119.0 | | | | 1,296.0 | |
| Interest expense: | | | | | | | | | | | | | | | | | | | | | | | | | | | | |
Checking accounts | | | (36.4 | ) | | | (22.4 | ) | | | 14.0 | | | | 62.4 | | | | (29.6 | ) | | | — | | | | 29.6 | |
Time deposits | | | (406.8 | ) | | | (358.9 | ) | | | 48.0 | | | | 13.4 | | | | (164.9 | ) | | | (15.1 | ) | | | 149.8 | |
Savings deposits | | | (390.2 | ) | | | (285.2 | ) | | | 105.0 | | | | 36.8 | | | | (31.5 | ) | | | (5.2 | ) | | | 26.3 | |
| Total interest expense from deposits | | | (833.5 | ) | | | (666.5 | ) | | | 167.0 | | | | 25.1 | | | | (226.0 | ) | | | (20.3 | ) | | | 205.7 | |
| Borrowing from banks and others | | | (120.7 | ) | | | (55.7 | ) | | | 65.0 | | | | 116.7 | | | | (83.4 | ) | | | (6.5 | ) | | | 76.9 | |
| Interbank and overnight funds (expenses) | | | (104.1 | ) | | | (86.2 | ) | | | 17.9 | | | | 20.8 | | | | (7.0 | ) | | | (0.4 | ) | | | 6.6 | |
Long-term debt (bonds) | | | (65.9 | ) | | | (64.8 | ) | | | 1.1 | | | | 1.7 | | | | (18.7 | ) | | | (1.8 | ) | | | 17.0 | |
Total interest expense | | | (1,124.1 | ) | | | (873.2 | ) | | | 250.9 | | | | 28.7 | | | | (335.1 | ) | | | (29.0 | ) | | | 306.2 | |
Net interest income | | | 1,856.9 | | | | 2,353.5 | | | | (496.6 | ) | | | (21.1 | ) | | | 1,079.8 | | | | 90.0 | | | | 989.8 | |
| (1) | LB Panama’s financial information is prepared in accordance with Colombian Banking GAAP and primarily reflects BAC Credomatic’s consolidated results, which are consolidated in LB Panama’s results from December 1, 2010. At December 31, 2011, LB Panama had Ps 2,017.3 billion of goodwill associated with the BAC Credomatic acquisition and Ps 524.5 billion of indebtedness that it incurred to finance, in part, the BAC Credomatic acquisition. Goodwill amortization and interest expense associated with the BAC Credomatic acquisition for the year ended December 31, 2011 were Ps 49.1 billion and Ps 19.4 billion, respectively. |
Banco de Bogotá’s net interest income increased by 20.2% from Ps 2,443.5 billion in the year ended December 31, 2010 to Ps 2,936.7 billion in the year ended December 31, 2011. Banco de Bogotá’s operations excluding LB Panama contributed Ps 1,856.9 billion (a decrease of 21.1% or Ps 496.6 billion from Ps 2,353.5 billion for the year ended December 31, 2010) and LB Panama contributed Ps 1,079.8 billion. The decrease in Banco de Bogotá’s operations excluding LB Panama was driven by a 7.6%, or Ps 245.7 billion, decrease in total interest income to Ps 2,981.0 billion for the year ended December 31, 2011 and a 28.7%, or Ps 250.9 billion, increase in total interest expense to Ps 1,124.1 billion for the year ended December 31, 2011.
Total interest income increased by 31.4%, from Ps 3,345.6 billion in the year ended December 31, 2010 to Ps 4,395.9 billion in the year ended December 31, 2011, primarily due to an increase in interest income from loans and financial leases, which rose by Ps 1,624.6 billion to Ps 3,745.6 billion in the year ended December 31, 2011. Of the total interest income from loans and financial leases for the year ended December 31, 2011, Ps 2,406.4 billion were contributed by Banco de Bogotá’s operations excluding LB Panama (an increase of 19.8% or Ps 398.4 billion from Ps 2,008.0 billion for the year ended December 31, 2010) and Ps 1,339.2 billion were contributed by LB Panama’s operations.
The increase generated in Banco de Bogotá’s operations excluding LB Panama primarily reflected a 23.7%, or Ps 4,883.6 billion growth of the combined average of the loans and financial leases portfolios from Ps 20,638.2 billion in 2010 to Ps 25,521.9 billion in 2011, which increased interest income by Ps 440.8 billion. Partly offsetting this increase was a decrease in the annualized yield on loans and financial leases of Banco de Bogotá’s operations excluding LB Panama from 9.7% in the year ended December 31, 2010 to 9.4% in the same period in 2011, which decreased interest income from loans and financial leases by Ps 42.4 billion. The decrease in the yield on loans and financial leases in Banco de Bogotá’s operations excluding LB Panama primarily reflects a declining interest
rate environment in the second half of 2010 and early 2011 together with the strong growth of our loan portfolio during 2011. The average interest yield on loans and financial leases for Banco de Bogotá excluding LB Panama was 10.0% during the last quarter of 2011. The reasons for the decrease in the average yield on loans and financial leases are further discussed under “—Results of operations for the year ended December 31, 2011 compared to the year ended December 31, 2010—Grupo Aval Net interest income.”
During 2011, the average portfolio loans and financial leases for LB Panama was Ps 9,961.3 billion and the annualized yield on its loans and financial leases was 13.4%.
Partially offsetting the increase in interest income from loans and from financial leases was a 52.3% decrease in income from investment securities, from Ps 1,156.7 billion to Ps 552.2 billion for the years ended December 31, 2010 and 2011 respectively. Under Colombian Banking GAAP, interest income from investment securities includes accrued interest on debt instruments, valuation adjustments and gains (losses) realized on debt and equity securities that are accounted for as “available for sale,” gains (losses) on repurchase transactions (i.e., repos), gains (losses) realized on the sale of debt securities, and mark-to-market gains (losses) on the trading securities portfolio.
Of the Ps 552.2 billion of interest income from investment securities, Banco de Bogotá’s operations excluding LB Panama contributed Ps 499.4 billion (a decrease of 56.7% or Ps 653.3 billion from Ps 1,152.6 billion for the year ended December 31, 2010) while LB Panama contributed Ps 52.8 billion.
Interest income from equity investments from Banco de Bogotá’s operations excluding LB Panama decreased by Ps 662.9 billion, or 97.5%, to Ps 17.0 billion mainly as a result of Corficolombiana having realized mark-to-market gains on its investments in Sociedad de Inversiones en Energía S.A. or “SIE,” Banco de Occidente, Empresa de Energía de Bogotá or “EEB” and Promigas during 2010 and realizing mark-to-market losses for those investments during 2011(further explained in “—Segment results of operations for the year ended December 31, 2011 compared to the year ended December 31, 2010—Banco de Bogotá subsidiary analysis—Corficolombiana—Net interest income”). Interest income derived from the fixed income portfolio of Banco de Bogotá’s operations excluding LB Panama increased by 2.0% or Ps 9.6 billion driven by an increase in the average fixed income investment portfolio.
Total interest expense in Banco de Bogotá increased by Ps 557.1 billion or 61.8% from Ps 902.1 billion in the same period in 2010 to Ps 1,459.2 billion in the year ended December 31, 2011 out of which Ps 1,124.1 billion was incurred by Banco de Bogotá’s operations excluding LB Panama (an increase of Ps 250.9 billion or 28.7% from Ps 873.2 billion in the year ended December 31, 2010) and Ps 335.1 billion was incurred by LB Panama.
Total interest expense in Banco de Bogotá’s operations excluding LB Panama increased due to the combined effect of a 20.3%, or Ps 5,450.3 billion, increase in the average balance of interest-bearing liabilities increasing to Ps 32,334.6 billion at December 31, 2011, and an increase in the average cost of funding from 3.2% in the year ended December 31, 2010 to 3.5% in the year ended December 31, 2011. The main reason for the increase in the average cost of funding in Banco de Bogotá’s operations excluding LB Panama was increase of the average DTF as discussed under “—Results of operations for the year ended December 31, 2011 compared to the year ended December 31, 2010—Grupo Aval.”
During 2011, the average balance of interest-bearing liabilities for LB Panama was Ps 13,286.5 billion and the annualized cost of funds was 2.5%.
Banco de Bogotá’s net interest margin (calculated as net interest income divided by total average interest-earning assets) decreased from 7.4% in the year ended December 31, 2010 to 6.0% in the same period in 2011. The net interest margin of Banco de Bogotá’s operations excluding LB Panama decreased from 7.3% to 5.0%, mainly driven by a decrease in the annualized yield of its investment portfolio from 11.7% in 2010 to 4.8% in 2011 due to Corficolombiana’s equity investments results, as discussed above and further explained under “—Segment results of operations for the year ended December 31, 2011 compared to the year ended December 31, 2010—Banco de Bogotá subsidiary analysis—Corficolombiana.” LB Panama’s net interest margin was 8.8% for the year ended December 31, 2011.
Provisions
Total net provisions decreased by 77.2% to Ps 139.0 billion in the year ended December 31, 2011, driven primarily by a Ps 613.4 billion decrease in net provisions for foreclosed assets and other assets. This decrease was driven by a Ps 306.9 billion decrease in provision expense and a Ps 306.5 billion increase in recovery of provisions in the year ended December 31, 2011. These changes are associated with Corficolombiana’s gross provision made during 2010 for covering risk associated with potential future fluctuations on the share price of its equity investment and the gross provision made during 2010 on its investment in SIE, both provisions were reversed during 2011 (further explained in “—Segment results of operations for the year ended December 31, 2011 compared to the year ended December 31, 2010—Banco de Bogotá subsidiary analysis—Corficolombiana—Provisions”).
Partially offsetting the decrease in total net provisions for foreclosed assets and other assets was the increase in net provisions for loan and financial lease losses which increased by Ps 147.8 billion from Ps 286.6 billion for the year ended December 31, 2010 to Ps 434.4 billion for the year ended December 31, 2011.
Out of the Ps 434.4 billion of net provisions for loans and financial leases for the year ended December 31, 2011, Ps 273.0 billion were generated by Banco de Bogotá’s operations excluding LB Panama (a decrease of 4.5% or Ps 12.9 billion from Ps 285.9 billion for the year ended December 31, 2010) and Ps 161.4 billion was generated by LB Panama’s operations.
Banco de Bogotá’s past due loans at December 31, 2011 decreased by 5.6% to Ps 780.4 billion and its delinquency ratio improved by 60 basis points from 2.5% at December 31, 2010 to 1.9% at December 31, 2011. Banco de Bogota’s delinquency ratio excluding LB Panama was 1.6% at December 31, 2011, and LB Panama’s was 2.8% at December 31, 2011. LB Panama’s higher delinquency ratio is due to a greater concentration of consumer loans in BAC Credomatic’s business (including credit cards) than in Banco de Bogota’s operations excluding LB Panama.
Banco de Bogotá’s charge-offs increased by Ps 131.9 billion from Ps 245.7 billion in December 31, 2010 to Ps 377.5 billion in December 31, 2011. Out of the Ps 377.5 billion of charge-offs for the year ended December 31, 2011, Ps 212.5 billion were generated by Banco de Bogotá’s operations excluding LB Panama (a decrease of 6.9% or Ps 15.7 billion from Ps 228.2 for the year ended December 31, 2010) and Ps 165.1 billion was generated by LB Panama’s operations.
Banco de Bogotá’s charge-offs to average loan ratio decreased from 1.1% in December 31, 2010 to 1.0% in December 31, 2011. Banco de Bogotá’s operations excluding LB Panama charge-offs to average loan ratio decreased from 1.1% in December 31, 2010 to 0.8% in December 31, 2011.
Banco de Bogotá’s allowance for loans and financial leases increased by Ps 68.6 billion to Ps 1,099.4 billion at December 31, 2011 increasing Banco de Bogotá’s coverage ratio from 124.6% at December 31, 2010 to 140.9% at December 31, 2011.
In its Banco de Bogotá’s operations excluding LB Panama, Banco de Bogotá’s net provisions for loan and financial lease losses were greater than its charge-offs, which resulted in a 7.5% increase in its allowance for loan financial lease losses to Ps 885.9 billion at December 31, 2011. This growth combined with the decrease in past due loans resulted in an increase in its coverage ratio from 160.7% at December 31, 2010 to 197.5% at December 31, 2011.
LB Panama’s coverage ratio for the year ended December 31, 2011 was 64.3% compared to 65.7.% for the year ended December 31, 2010.
Banco de Bogotá’s net provisions for accrued interest and other receivables increased by Ps 16.6 billion, or 50.3%, to Ps 49.5 billion, Ps 10.4 billion of this increase was driven by Banco de Bogotá’s operations excluding LB Panama and Ps 6.2 billion was driven by LB Panama’s operations. The recovery of charged-off assets increased by Ps 22.6 billion, or 76.3%, to Ps 52.2 billion primarily as a result of a more successful recovery effort by Banco de Bogotá.
Total fees and other services income
| | | | | | | |
| | | | | | | | | | # | | | | |
| | | (in Ps billions) | | | | |
| Fees and other services income: | | | | | | | | | | | | | |
Commissions from banking services | | | 943.1 | | | | 557.9 | | | | 385.2 | | | | 69.0 | |
Branch network services | | | 35.0 | | | | 22.2 | | | | 12.8 | | | | 57.9 | |
Credit card merchant fees | | | 228.6 | | | | 70.3 | | | | 158.4 | | | | 225.4 | |
Checking fees | | | 42.4 | | | | 42.0 | | | | 0.5 | | | | 1.1 | |
Warehouse services | | | 114.7 | | | | 92.2 | | | | 22.5 | | | | 24.4 | |
Fiduciary activities | | | 99.7 | | | | 98.3 | | | | 1.3 | | | | 1.4 | |
Pension plan administration | | | 457.1 | | | | 408.3 | | | | 48.8 | | | | 11.9 | |
Other | | | 90.1 | | | | 37.1 | | | | 52.9 | | | | 142.5 | |
Total fees and other services income | | | 2,010.6 | | | | 1,328.2 | | | | 682.4 | | | | 51.4 | |
Fees and other services expenses | | | (253.8 | ) | | | (173.2 | ) | | | 80.7 | | | | 46.6 | |
Total fees and other services income, net | | | 1,756.8 | | | | 1,155.1 | | | | 601.7 | | | | 52.1 | |
| | | Banco de Bogotá’s operations excluding LB Panama | | | | |
| | | | | | | | | | | | | |
| | | | | | | | | | # | | | | | | | 2011 | | | | 2010 | | | | # | |
| | | (in Ps billions) | | | | | | (in Ps billions) | |
| Fees and other services income: | | | | | | | | | | | | | | | | | | | | | | | | | |
| Commissions from banking services | | | 526.8 | | | | 519.9 | | | | 6.9 | | | | 1.3 | | | | 416.2 | | | | 37.9 | | | | 378.3 | |
Branch network services | | | 35.0 | | | | 22.2 | | | | 12.8 | | | | 57.9 | | | | – | | | | – | | | | – | |
Credit card merchant fees | | | 55.2 | | | | 51.6 | | | | 3.6 | | | | 7.0 | | | | 173.4 | | | | 18.6 | | | | 154.8 | |
Checking fees | | | 42.4 | | | | 42.0 | | | | 0.5 | | | | 1.1 | | | | – | | | | – | | | | – | |
Warehouse services | | | 114.7 | | | | 92.2 | | | | 22.5 | | | | 24.4 | | | | – | | | | – | | | | – | |
Fiduciary activities | | | 99.7 | | | | 98.3 | | | | 1.3 | | | | 1.4 | | | | – | | | | – | | | | – | |
| Pension plan administration | | | 447.3 | | | | 408.3 | | | | 39.0 | | | | 9.6 | | | | 9.8 | | | | – | | | | 9.8 | |
Other | | | 35.1 | | | | 31.4 | | | | 3.7 | | | | 11.7 | | | | 55.0 | | | | 5.7 | | | | 49.3 | |
| Total fees and other services income | | | 1,356.2 | | | | 1,265.9 | | | | 90.3 | | | | 7.1 | | | | 654.4 | | | | 62.3 | | | | 592.1 | |
| Fees and other services expenses | | | (198.8 | ) | | | (166.0 | ) | | | 32.9 | | | | 19.8 | | | | (55.0 | ) | | | (7.2 | ) | | | 47.8 | |
| Total fees and other services income, net | | | 1,157.4 | | | | 1,100.0 | | | | 57.4 | | | | 5.2 | | | | 599.3 | | | | 55.1 | | | | 544.3 | |
| (1) | LB Panama’s financial information is prepared in accordance with Colombian Banking GAAP and primarily reflects BAC Credomatic’s consolidated results, which are consolidated in LB Panama’s results from December 1, 2010. At December 31, 2011, LB Panama had Ps 2,017.3 billion of goodwill associated with the BAC Credomatic acquisition and Ps 524.5 billion of indebtedness that it incurred to finance, in part, the BAC Credomatic acquisition. Goodwill amortization and interest expense associated with the BAC Credomatic acquisition for the year ended December 31, 2011 were Ps 49.1 billion and Ps 19.4 billion, respectively. |
Total net fees and other services income increased by 52.1% to Ps 1,756.8 billion in the year ended December 31, 2011, primarily as a result of higher commissions from banking services and increased credit card merchant fees
For the year ended December 31, 2011, Banco de Bogotá’s operations excluding LB Panama contributed Ps 1,157.4 billion in total fees and other income, net which includes Ps 526.8 billion in commissions from banking services and Ps 55.2 billion in credit card merchant fees. LB Panama, in turn, contributed Ps 599.3 billion in total fees and other income, net which includes Ps 416.2 billion in commissions from banking services and Ps 173.4 billion in credit card merchant fees.
The 11.9% (9.6% in Banco de Bogota’s operations excluding LB Panama) increase in pension plan administration fees is mainly as a result of higher fee income produced by Porvenir consisting of commissions earned on the administration of mandatory pension funds, severance funds, voluntary pension funds and third-party liability pension funds, further explained in “—Segment results of operations for the year ended December 31, 2011 compared to the year ended December 31, 2010—Banco de Bogotá subsidiary analysis—Porvenir—Net income.”
The Ps 52.9 billion, or 142.5%, increase to Ps 90.1 billion in “Other” fees is primarily attributable to a Ps 49.3 billion increase in income generated by LB Panama, which includes insurance sales commissions, investment fund administration fees, travel agency fees and others.
Warehouse services fees increased by Ps 22.5 billion, or 24.4%, to Ps 114.7 billion due to fees contributed by Almaviva, Banco de Bogota’s warehouse subsidiary. This rise in the income of warehouse services resulted from greater imports / exports from existing clients and the addition of new clients.
Other operating income
| | | | | | | |
| | | | | | | | | | # | | | | |
| | | (in Ps billions) | | | | |
Foreign exchange gains (losses), net | | | 186.9 | | | | 32.6 | | | | 154.3 | | | | 473.8 | |
Gains (losses) on derivative operations, net | | | (22.8 | ) | | | 63.6 | | | | (86.4 | ) | | | (135.9 | ) |
| Gains on sales of investments in equity securities, net | | | 41.8 | | | | 112.1 | | | | (70.3 | ) | | | (62.7 | ) |
Income from non-financial sector, net (2) | | | 431.8 | | | | 289.8 | | | | 142.0 | | | | 49.0 | |
Dividend income | | | 78.7 | | | | 44.1 | | | | 34.6 | | | | 78.4 | |
Other | | | 41.8 | | | | 40.3 | | | | 1.5 | | | | 3.8 | |
Other operating income | | | 758.1 | | | | 582.4 | | | | 175.8 | | | | 30.2 | |
| | | Banco de Bogotá’s operations excluding LB Panama | | | | |
| | | | | | | | | | | | | |
| | | | | | | | | | # | | | | | | | 2011 | | | | 2010 | | | | # | |
| | | (in Ps billions) | | | | | | (in Ps billions) | |
| Foreign exchange gains (losses), net | | | 86.0 | | | | 17.3 | | | | 68.8 | | | | 398.4 | | | | 100.9 | | | | 15.3 | | | | 85.5 | |
| Gains (losses) on derivative operations, net | | | (18.3 | ) | | | 61.5 | | | | (79.8 | ) | | | (129.7 | ) | | | (4.6 | ) | | | 2.0 | | | | (6.6 | ) |
| Gains on sales of investments in equity securities, net | | | 41.8 | | | | 112.1 | | | | (70.3 | ) | | | (62.7 | ) | | | – | | | | (0.0 | ) | | | 0.0 | |
| Income from non-financial sector, net | | | 431.8 | | | | 289.8 | | | | 142.0 | | | | 49.0 | | | | – | | | | – | | | | – | |
Dividend income | | | 78.7 | | | | 44.1 | | | | 34.6 | | | | 78.4 | | | | – | | | | – | | | | – | |
| Other | | | 41.6 | | | | 40.3 | | | | 1.3 | | | | 3.3 | | | | 0.2 | | | | 0.0 | | | | 0.2 | |
Other operating income | | | 661.7 | | | | 565.1 | | | | 96.6 | | | | 17.1 | | | | 96.5 | | | | 17.3 | | | | 79.2 | |
| (1) | LB Panama’s financial information is prepared in accordance with Colombian Banking GAAP and primarily reflects BAC Credomatic’s consolidated results, which are consolidated in LB Panama’s results from December 1, 2010. At December 31, 2011, LB Panama had Ps 2,017.3 billion of goodwill associated with the BAC Credomatic acquisition and Ps 524.5 billion of indebtedness that it incurred to finance, in part, the BAC Credomatic acquisition. Goodwill amortization and interest expense associated with the BAC Credomatic acquisition for the year ended December 31, 2011 were Ps 49.1 billion and Ps 19.4 billion, respectively. |
| (2) | Income from non-financial sector reflects the operating results of Corficolombiana in its consolidated investments in companies not related to the financial sector such as Epiandes, Hoteles Estelar and Organización Pajonales, among others. This result is net of the following operating and administrative expenses in the year ended December 31, 2011 and 2010: Ps 852.7 billion and Ps 644.3 billion, respectively. For a description of these investments, see “Item 4. Information on the Company—Business overview—Corficolombiana—Equity investment portfolio.” |
Total other operating income, net increased by 30.2% to Ps 758.1 billion in the year ended December 31, 2011 due primarily to a Ps 142.0 billion increase in income from the non-financial sector, which reflected the net income growth of non-financial companies consolidated by Corficolombiana further explained in the Corficolombiana 2011-2010 discussion.
Also contributing to the increase in other operating income was a Ps 67.9 billion increase in net foreign exchange and derivative operations. Foreign exchange gains (losses) and gains on derivative operations, which are related as Banco de Bogotá employs derivative operations to hedge foreign exchange risk, netted a gain of Ps 164.0 billion for the year ended December 31, 2011 as compared to Ps 96.1 billion for the year ended December 31, 2010. Net foreign exchange and derivative operations for Banco de Bogotá’s operations excluding LB Panama decreased by Ps 11.0 billion from Ps 78.8 billion for the year ended December 31, 2010 to Ps 67.8 billion for the year ended December 31, 2011. During 2011, LB Panama’s operations netted a gain of Ps 96.3 billion.
The increase in dividend income of Ps 34.6 billion was mainly attributable to dividend income from Promigas, a non-consolidated company of Corficolombiana which in 2010 was classified as “trading” and thus its dividend income was registered as interest income from investment securities (further explained in “—Segment results of operations for the year ended December 31, 2011 compared to the year ended December 31, 2010—Banco de Bogotá subsidiary analysis—Corficolombiana”).
Partially offsetting the increase in other operating income was a Ps 70.3 billion decrease in gains on sales of equity securities, resulting from Corficolombiana’s gains from the sale of part of its stake in Banco de Occidente and Proenergía in 2010 (further explained in “—Segment results of operations for the year ended December 31, 2011 compared to the year ended December 31, 2010—Banco de Bogotá subsidiary analysis—Corficolombiana—Other operating income”).
Operating expenses
| | | | | | | |
| | | | | | | | | | # | | | | |
| | | (in Ps billions) | | | | |
Salaries and employee benefits | | | (1,068.0 | ) | | | (612.3 | ) | | | 455.7 | | | | 74.4 | |
Bonus plan payments | | | (73.2 | ) | | | (19.6 | ) | | | 53.7 | | | | 274.0 | |
Termination payments | | | (19.5 | ) | | | (5.8 | ) | | | 13.7 | | | | 235.7 | |
Administrative and other expenses | | | (1,518.6 | ) | | | (968.3 | ) | | | 550.3 | | | | 56.8 | |
Deposit security, net | | | (85.0 | ) | | | (68.3 | ) | | | 16.7 | | | | 24.4 | |
Charitable and other donation expenses | | | (12.6 | ) | | | (4.0 | ) | | | 8.6 | | | | 217.0 | |
Depreciation | | | (116.0 | ) | | | (57.9 | ) | | | 58.1 | | | | 100.4 | |
Goodwill amortization | | | (75.2 | ) | | | (21.8 | ) | | | 53.3 | | | | 244.3 | |
Total operating expenses | | | (2,968.0 | ) | | | (1,757.9 | ) | | | 1,210.0 | | | | 68.8 | |
| | | Banco de Bogotá’s operations excluding LB Panama | | | | |
| | | | | | | | | | | | | |
| | | | | | | | | | # | | | | | | | 2011 | | | | 2010 | | | | # | |
| | | (in Ps billions) | | | | | | (in Ps billions) | |
| Salaries and employee benefits | | | (617.0 | ) | | | (576.6 | ) | | | 40.4 | | | | 7.0 | | | | (451.0 | ) | | | (35.7 | ) | | | 415.3 | |
Bonus plan payments | | | (19.3 | ) | | | (16.7 | ) | | | 2.6 | | | | 15.5 | | | | (53.9 | ) | | | (2.9 | ) | | | 51.1 | |
Termination payments | | | (2.2 | ) | | | (1.9 | ) | | | 0.3 | | | | 16.6 | | | | (17.3 | ) | | | (3.9 | ) | | | 13.4 | |
| Administrative and other expenses | | | (1,027.8 | ) | | | (905.0 | ) | | | 122.9 | | | | 13.6 | | | | (490.7 | ) | | | (63.3 | ) | | | 427.4 | |
Deposit security, net | | | (76.4 | ) | | | (67.5 | ) | | | 8.8 | | | | 13.1 | | | | (8.6 | ) | | | (0.7 | ) | | | 7.8 | |
| Charitable and other donation expenses | | | (10.9 | ) | | | (3.7 | ) | | | 7.1 | | | | 191.2 | | | | (1.7 | ) | | | (0.2 | ) | | | 1.5 | |
Depreciation | | | (59.1 | ) | | | (53.4 | ) | | | 5.6 | | | | 10.5 | | | | (56.9 | ) | | | (4.4 | ) | | | 52.5 | |
Goodwill amortization | | | (20.8 | ) | | | (19.0 | ) | | | 1.8 | | | | 9.5 | | | | (54.4 | ) | | | (2.8 | ) | | | 51.5 | |
Total operating expenses | | | (1,833.4 | ) | | | (1,643.9 | ) | | | 189.5 | | | | 11.5 | | | | (1,134.5 | ) | | | (114.0 | ) | | | 1,020.5 | |
| (1) | LB Panama’s financial information is prepared in accordance with Colombian Banking GAAP and primarily reflects BAC Credomatic’s consolidated results, which are consolidated in LB Panama’s results from December 1, 2010. At December 31, 2011, LB Panama had Ps 2,017.3 billion of goodwill associated with the BAC Credomatic acquisition and Ps 524.5 billion of indebtedness that it incurred to finance, in part, the BAC Credomatic acquisition. Goodwill amortization and interest expense associated with the BAC Credomatic acquisition for the year ended December 31, 2011 were Ps 49.1 billion and Ps 19.4 billion, respectively. |
Total operating expenses increased by 68.8% to Ps 2,968.0 billion in the year ended December 31, 2011 out of which Ps 1,833.4 billion were incurred by Banco de Bogotá’s operations excluding LB Panama and Ps 1,134.5 billion were incurred by LB Panama.
The increase in total operating expenses primarily reflected a 74.4% or Ps 455.7 billion and a 56.8% or Ps 550.3 billion increase in salaries and employee benefits, and administrative and other expenses, respectively. Salaries and employee benefits from Banco de Bogotá’s operations excluding LB Panama increased by 7.0% or Ps 40.4 billion to Ps 617.0 billion in the year ended December 31, 2011 due to an increase in personnel, while administrative and other expenses grew by 13.6% or Ps 122.9 billion to Ps 1,027.8 billion in the year ended December 31, 2011 due primarily to additional costs associated with growth of Banco de Bogotá’s loan portfolio and the increase in the Equity Tax (further explained in “Results of operations for the year ended December 31, 2011 compared to year ended December 31, 2010 – Grupo Aval – Net interest income”). LB Panama’s salaries and employee benefits and administrative and other expenses totaled Ps 451.0 billion and Ps 490.7 billion, respectively, for the year ended December 31, 2011.
Banco de Bogotá’s efficiency ratio deteriorated from 40.1% at December 31, 2010 to 50.9% at December 31, 2011. Banco de Bogotá’s efficiency ratio for its Banco de Bogotá’s operations excluding LB Panama deteriorated from 39.1% to 47.7% during these same periods and LB Panama’s efficiency ratio at December 31, 2011 was 57.6% associated with the contraction in net interest margin explained in the net interest subsection. Depreciation and goodwill amortization increased by Ps 111.4 billion from Ps 79.7 billion in the year ended December 31, 2010 to Ps 191.1 billion in the year ended December 31, 2011, primarily due to LB Panama’s acquisition which impacts LB Panama’s results. The ratio of operating expenses before depreciation and amortization as a percentage of average earning assets excluding LB Panama improved from 4.9% in 2010 to 4.7% in 2011.
Non-operating income (expense)
Total non-operating income (expense) decreased by Ps 27.5 from Ps 96.0 billion to Ps 68.5 billion in the year ended December 31, 2011 due to a decrease in reversals associated with LB Panama (further explained in “—Segment results of operations for the year ended December 31, 2011 compared to the year ended December 31, 2010—Banco de Bogotá subsidiary analysis—LB Panama”).
Income tax expense
Income before income tax expense and non-controlling interest increased 26.5% from Ps 1,908.3 billion for the year ended December 31, 2010 to Ps 2,413.1 billion for the year ended December 31, 2011. Income tax expense, in turn, increased by 44.5% to Ps 737.2 billion for the year ended December 31, 2011. Accordingly, Banco de Bogotá’s effective tax rate increased from 26.7% for the year ended December 31, 2010 to 30.5% for the year ended December 31, 2011, due to an increase in non-tax deductible expenses in Banco de Bogotá’s operations excluding LB Panama, such as the increase in the Equity Tax (further explained in the “Results of operations for the year ended December 31, 2011 compared to the year ended December 31, 2010 – Grupo Aval”), and a higher effective tax rate of 30.9% in LB Panama’s operations.
Non-controlling interest
Banco de Bogotá’s non-controlling interest increased by Ps 46.8 billion, or 9.7%, in the year ended December 31, 2011. The increase in non-controlling interest was primarily a result of Corficolombiana achieving better results in the year ended December 31, 2011 as compared to the same period in 2010 (Ps 608.1 billion as compared to Ps 564.8 billion, respectively) as further described in “—Segment results of operations for the year ended December 31, 2011 compared to the year ended December 31, 2010—Banco de Bogotá subsidiary analysis—Corficolombiana.”
Banco de Bogotá subsidiary analysis
Banco de Bogotá’s results of operations are significantly affected by the results of operations of its subsidiaries, LB Panama, Corficolombiana and Porvenir. In order to fully disclose the effect of these subsidiaries on Banco de Bogotá, the following is an analysis of the results of operations of each of LB Panama, Corficolombiana and Porvenir in the year ended December 31, 2011 compared to the year ended December 31, 2010.
Corficolombiana
Net income
| | | | | | | |
| | | | | | | | | | # | | | | |
| | | (in Ps billions) | | | | |
Total interest income | | | 270.2 | | | | 858.3 | | | | (588.1 | ) | | | (68.5 | ) |
Total interest expense | | | (197.1 | ) | | | (161.8 | ) | | | 35.3 | | | | 21.8 | |
Net interest income | | | 73.1 | | | | 696.5 | | | | (623.3 | ) | | | (89.5 | ) |
Total provisions (reversals), net | | | 285.5 | | | | (321.6 | ) | | | (607.1 | ) | | | (188.8 | ) |
Total fees and other services income, net | | | 46.7 | | | | 43.6 | | | | 3.0 | | | | 7.0 | |
Total other operating income | | | 573.4 | | | | 435.2 | | | | 138.2 | | | | 31.8 | |
Total operating income | | | 978.7 | | | | 853.7 | | | | 125.0 | | | | 14.6 | |
Total operating expenses | | | (137.2 | ) | | | (118.8 | ) | | | 18.4 | | | | 15.5 | |
Net operating income | | | 841.5 | | | | 734.9 | | | | 106.6 | | | | 14.5 | |
Total non-operating income (expense), net | | | (6.3 | ) | | | (3.2 | ) | | | (3.2 | ) | | | (99.5 | ) |
| Income before income tax expense and non-controlling interest | | | 835.2 | | | | 731.8 | | | | 103.4 | | | | 14.1 | |
Income tax expense | | | (150.5 | ) | | | (104.2 | ) | | | 46.3 | | | | 44.4 | |
Income before non-controlling interest | | | 684.7 | | | | 627.6 | | | | 57.1 | | | | 9.1 | |
Non-controlling interest | | | (76.6 | ) | | | (62.8 | ) | | | 13.8 | | | | 22.0 | |
Net income attributable to shareholders | | | 608.1 | | | | 564.8 | | | | 43.3 | | | | 7.7 | |
Corficolombiana’s net income increased by 7.7% to Ps 608.1 billion in the year ended December 31, 2011 as compared to the year ended December 31, 2010. The most significant drivers of the increase in net income were the decrease of 89.5% or Ps 623.3 billion in net interest income, which was primarily due to a reduction in interest income from investment securities, was partially offset by a decrease of Ps 607.1 billion in total provisions (reversals), net (reflecting a recovery of Ps 285.5 billion in 2011) and an increase in total other operating income, which reflected an increase in dividend income and net income from the non-financial sector.
Net interest income
| | | | | | | |
| | | | | | | | | | # | | | | |
| | | (in Ps billions) | | | | |
| Interest income: | | | | | | | | | | | | | |
Interest on loans | | | 13.8 | | | | 10.6 | | | | 3.2 | | | | 30.0 | |
Interest on investment securities | | | 161.7 | | | | 753.9 | | | | (592.2 | ) | | | (78.5 | ) |
Interbank and overnight funds | | | 43.1 | | | | 43.0 | | | | 0.1 | | | | 0.3 | |
Financial leases | | | 51.6 | | | | 50.8 | | | | 0.8 | | | | 1.5 | |
Total interest income | | | 270.2 | | | | 858.3 | | | | (588.1 | ) | | | (68.5 | ) |
| Interest expense: | | | | | | | | | | | | | | | | |
Checking accounts | | | – | | | | – | | | | – | | | | – | |
Time deposits | | | (91.6 | ) | | | (74.7 | ) | | | 17.0 | | | | 22.7 | |
Savings deposits | | | (2.7 | ) | | | (5.5 | ) | | | (2.8 | ) | | | (51.4 | ) |
Total interest expense on deposits | | | (94.3 | ) | | | (80.1 | ) | | | 14.1 | | | | 17.7 | |
Borrowing from banks and others | | | (35.6 | ) | | | (9.5 | ) | | | 26.1 | | | | 274.7 | |
Interbank and overnight funds (expenses) | | | (60.6 | ) | | | (63.6 | ) | | | (3.0 | ) | | | (4.7 | ) |
Long-term debt (bonds) | | | (6.6 | ) | | | (8.6 | ) | | | (2.0 | ) | | | (23.1 | ) |
Total interest expense | | | (197.1 | ) | | | (161.8 | ) | | | 35.3 | | | | 21.8 | |
Net interest income | | | 73.1 | | | | 696.5 | | | | (623.3 | ) | | | (89.5 | ) |
Net interest income decreased by 89.5% to Ps 73.1 billion in the year ended December 31, 2011. Total interest income, which consists of income from loans, investment securities, interbank and overnight funds and financial leases, decreased by 68.5% to Ps 270.2 billion in 2011. This decline was almost entirely due to the Ps 592.2 billion decrease in income on investment securities from Ps 753.9 billion in the year ended December 31, 2010 to Ps 161.7 billion in the year ended December 31, 2011. The decrease in income from investment securities was due to a decline in income from the equity portfolio, partially offset by an increase in income from the fixed income portfolio.
Corficolombiana’s equity portfolio generated Ps 5.0 billion in income in the year ended December 31, 2011, which represented a 99.2% decrease from the Ps 616.3 billion yielded in the year ended December 31, 2010. The primary reason for the decrease was the fact that in the year ended December 31, 2010 Corficolombiana recorded a Ps 199.1 billion gain associated with its investment in Sociedad de Inversiones en Energía S.A., or “SIE,” the majority of which was related to the reclassification of SIE in February 2010 from “available for sale” to “trading” (as further explained in “—Segment results of operations for the year ended December 31, 2010 compared to the year ended December 31, 2009—Banco de Bogotá—Banco de Bogotá subsidiary analysis—Corficolombiana—Net interest income”), while in the year ended December 31, 2011 Corficolombiana recorded a Ps 34.7 billion mark-to-market loss from this investment. This investment was sold in October 2011.
Corficolombiana recorded a Ps 44.3 billion mark-to-market loss on its investment in Banco de Occidente in the year ended December 31, 2011 as compared to a Ps 186.0 billion mark-to-market gain for the year ended December 31, 2010. In November 2010, the Colombian Stock Exchange reclassified Banco de Occidente’s stock from “low” to “medium” liquidity (bursatilidad) and Colombian regulations require the owner of an investment that has had its liquidity classification increase to “medium” by the Colombian Stock Exchange to reclassify its investment as trading and realize the unrealized gains (losses) associated with this investment as gains (losses) on the income statement. At December 31, 2011, Corficolombiana continued to have Banco de Occidente classified as “trading.”
Corficolombiana did not record any income from investment securities related to its investment in Empresa de Energía de Bogotá S.A. E.S.P., or “EEB,” in the year ended December 31, 2011 as it was classified as “available for sale” since late December 2010. By contrast, in the year ended December 31, 2010 it recorded Ps 209.0 billion in mark-to-market gain from this investment as it was classified as “trading” (further explained in “—Segment results of operations for the year ended December 31, 2010 compared to the year ended December 31, 2009—Banco de Bogotá—Banco de Bogotá subsidiary analysis—Corficolombiana—Net interest income”).
Additionally, in the year ended December 31, 2011 Corficolombiana recorded a Ps 122.1 billion loss from its investment in Promigas, while in the year ended December 31, 2010 Promigas generated a Ps 14.4 billion gain. In February 2011, the Colombian Stock Exchange reclassified Promigas’ stock from “medium” to “low” liquidity (bursatilidad) and Colombian regulations require the owner of an investment that has had its liquidity classification decreased to “low” by the Colombian Stock Exchange to realize the unrealized gains (losses) associated with that investment as gains (losses) on the income statement, regardless of its balance sheet classification. As a result, despite the fact that Promigas had been classified as “available for sale” since December 2010 (and remains classified as “available for sale”), Corficolombiana was required to realize its Ps 122.1 billion unrealized loss associated with this investment.
Partially offsetting these declines in interest income from investment securities was the recording of Ps 136.7 billion in income stemming from Corficolombiana’s private investment fund, which is independently directed by Corredores Asociados. This private investment fund was created in 2011.
Corficolombiana also recorded Ps 67.2 billion in income from investment securities related to mark-to-market gains on its investment in Proenergia, which Corficolombiana classified as “trading” in January 2011. The investment has experienced changes in liquidity (bursatilidad) since then and at December 31, 2011 it was classified as “available for sale.” Proenergia was not listed on the Colombian Stock Exchange until November 2010 and as a result it did not generate any mark-to-market gains / losses in the year ended December 31, 2010.
Corficolombiana’s fixed income portfolio generated Ps 156.7 billion of income in the year ended December 31, 2011, which was Ps 19.2 billion higher than the Ps 137.6 billion generated in the year ended December 31, 2010. This was primarily due to an increase in the average yield earned on its fixed income portfolio in the year ended December 31, 2011.
Interest expense increased by 21.8% to Ps 197.1 billion in the year ended December 31, 2011 as compared to the year ended December 31, 2010, primarily due to a Ps 26.1 billion increase in expenses from borrowings from banks and others to Ps 35.6 billion.
Provisions
Corficolombiana’s net provisions decreased by Ps 607.1 billion to Ps (285.5) billion (indicating a recovery of Ps 285.5 billion) in the year ended December 31, 2011 as compared to the year ended December 31, 2010. This decrease was attributable in part to the reversal of the cautionary Ps 245 billion market risk provision established by Corficolombiana in December 2010 (see “—Segment results of operations for the year ended December 31, 2010 compared to the year ended December 31, 2009—Banco de Bogotá—Banco de Bogotá subsidiary analysis—Corficolombiana—Net interest income”).
In addition, provisions were higher than usual in the year ended December 31, 2010 due to a Ps 69.7 billion gross provision established by Corficolombiana related to the realization of income stemming from its investment in SIE (see “—Segment results of operations for the year ended December 31, 2010 compared to the year ended December 31, 2009—Banco de Bogotá—Banco de Bogotá subsidiary analysis—Corficolombiana—Net interest income”). During the year ended December 31, 2011, all of this provision was reversed due to the sale of this investment in October 2011.
Total fees and other services income
| | | | | | | |
| | | | | | | | | | # | | | | |
| | | (in Ps billions) | | | | |
| Fees and other services income: | | | | | | | | | | | | | |
Commissions from banking services | | | 2.5 | | | | 4.4 | | | | (1.9 | ) | | | (43.2 | ) |
| Fiduciary activities | | | 32.6 | | | | 33.8 | | | | (1.2 | ) | | | (3.5 | ) |
| Other | | | 18.8 | | | | 12.4 | | | | 6.3 | | | | 51.1 | |
| Total fees and other services income | | | 53.8 | | | | 50.6 | | | | 3.2 | | | | 6.4 | |
| Fees and other services expenses | | | (7.1 | ) | | | (6.9 | ) | | | 0.2 | | | | 3.0 | |
| Total fees and other services income, net | | | 46.7 | | | | 43.6 | | | | 3.0 | | | | 7.0 | |
Net fee and other services income increased by Ps 3.0 billion to Ps 46.7 billion in the year ended December 31, 2011. This increase was primarily due to a Ps 6.3 billion increase in the “Other” fee line-item, which principally reflected an increase in investment banking advisory fees in the year ended December 31, 2011 as compared to the year ended December 31, 2010.
Other operating income
| | | | | | | |
| | | | | | | | | | # | | | | |
| | | (in Ps billions) | | | | |
Foreign exchange gains (losses), net | | | 4.8 | | | | (37.8 | ) | | | 42.6 | | | | 112.7 | |
Gains on derivative operations, net | | | 22.9 | | | | 29.6 | | | | (6.7 | ) | | | (22.7 | ) |
| Gains on sales of investments in equity securities, net | | | 41.2 | | | | 109.6 | | | | (68.4 | ) | | | (62.4 | ) |
Income from non-financial sector, net | | | 422.7 | | | | 289.8 | | | | 132.9 | | | | 45.9 | |
Dividend income | | | 76.2 | | | | 38.5 | | | | 37.6 | | | | 97.7 | |
Other | | | 5.6 | | | | 5.4 | | | | 0.1 | | | | 2.7 | |
Total other operating income | | | 573.4 | | | | 435.2 | | | | 138.2 | | | | 31.8 | |
Total other operating income increased by 31.8% to Ps 573.4 billion in the year ended December 31, 2011. This increase was driven by an increase of Ps 132.9 billion in net income from non-financial sector, Ps 37.6 billion in dividend income and Ps 35.9 billion in net foreign exchange and derivative operations. Partially offsetting this increase was a Ps 68.4 billion decrease in gains on sales of investments in equity securities.
Net income from the non-financial sector increased by 45.9% to Ps 422.7 billion in the year ended December 31, 2011, primarily as a result of a rise in the operational income of Epiandes, Episol, Pisa, Unipalma and Hoteles Estelar (some of Corficolombiana’s consolidated non-financial-sector investments).
The Ps 37.6 billion increase in dividend income to Ps 76.2 billion reflects Promigas’ investment accounting reclassification in 2010. In the year ended December 31, 2010, Promigas’ dividends were not recorded under the dividend income line-item because at the time this investment was classified as “trading,” and as a result of Colombian accounting regulations, its dividends were recorded under the line-item “interest from investment securities.” In the year ended December 31, 2011, Promigas’ contributed Ps 36.0 billion in dividends that were recorded under the “dividend income” line-item, since Promigas’ is, now classified as “available for sale.”
Net foreign exchange losses in 2010 decreased by Ps 42.6 billion resulting in a Ps 4.8 billion gain in 2011 due to the lower appreciation of the Colombian Peso in the year ended December 31, 2011 as compared to the year ended December 31, 2010. This gain was partially offset by lesser gain on net gains on derivative operations, which declined by Ps 6.7 billion to Ps 22.9 billion, as a result of the above-mentioned lower appreciation of the Colombian peso and lesser profits generated by local currency fixed income derivative positions.
The Ps 68.4 billion decrease in gains on sales of investments in equity securities was mainly driven by the Ps 62.8 billion and the Ps 19.0 billion gains on the sale of part of Corficolombiana’s investment in Banco de Occidente and in Proenergía, respectively, in the year ended December 31, 2010. These decreases were partially offset by the Ps 17.1 billion gain on the sale of Corficolombiana’s investment in SIE in the year ended December 31, 2011.
Operating expenses
| | | | | | | |
| | | | | | | | | | # | | | | |
| | | (in Ps billions) | | | | |
Salaries and employee benefits | | | (49.7 | ) | | | (45.2 | ) | | | 4.6 | | | | 10.1 | |
Bonus plan payments | | | (3.7 | ) | | | (4.7 | ) | | | (0.9 | ) | | | (20.1 | ) |
Termination payments | | | (1.0 | ) | | | (0.4 | ) | | | 0.7 | | | | 186.2 | |
Administrative and other expenses | | | (71.9 | ) | | | (58.1 | ) | | | 13.8 | | | | 23.9 | |
Deposit security, net | | | (5.8 | ) | | | (5.5 | ) | | | 0.3 | | | | 5.5 | |
Charitable and other donation expenses | | | (0.8 | ) | | | (1.9 | ) | | | (1.1 | ) | | | (56.8 | ) |
Depreciation | | | (3.7 | ) | | | (3.2 | ) | | | 0.6 | | | | 17.5 | |
Goodwill amortization | | | (0.5 | ) | | | – | | | | 0.5 | | | | – | |
Total operating expenses | | | (137.2 | ) | | | (118.8 | ) | | | 18.4 | | | | 15.5 | |
Corficolombiana’s total operating expenses increased by 15.5% to Ps 137.2 billion in the year ended December 31, 2011 as compared to the year ended December 31, 2010. This increase was almost entirely due to a Ps 13.8 billion increase in administrative and other expenses, almost entirely attributable to the additional Equity Tax imposed on Colombian institutions in 2011, as explained in further detail in Grupo Aval’s discussion of results of the year ended December 31, 2011. Total operating expenses before depreciation and goodwill amortization grew more rapidly than total operating income before provisions, worsening Corficolombiana’s efficiency ratio by increasing from 9.8% in the year ended December 31, 2010 to 19.2% in the year ended December 31, 2011.
Non-operating income (expense)
Total non-operating income (expense) decreased by Ps 3.2 billion to Ps (6.3) billion (reflecting a net non-operating expense of Ps 6.3 billion) in the year ended December 31, 2011, mainly due to a decrease in non-operating income from Ps 54.2 billion in 2010 to Ps 53.2 billion in 2011 and an increase in non-operating expenses from Ps 57.4 billion in 2010 to Ps 59.6 billion in 2011.
Income tax expense
Income tax expense increased by Ps 46.3 billion to Ps 150.5 billion for the year ended December 31, 2011. This increase was primarily due to higher income before income tax expense and non-controlling interest. Corficolombiana’s effective tax rate, calculated before non-controlling interest, increased from 14.2% for the year ended December 31, 2010 to 18.0% for the year ended December 31, 2011, primarily due to an increase in non-tax deductible expenses such as the Equity Tax (further explained in the “Results of operations for the year ended December 31, 2011 compared to the year ended December 31, 2010 – Grupo Aval”).
Porvenir
Porvenir generates income primarily from fees on its customers’ pension contributions, which consist predominantly of monthly mandatory contributions. It also generates net interest income, composed almost entirely of investment income from the appreciation of Porvenir’s proprietary trading portfolio, which can be divided into two components: (1) income from its stabilization reserve, which is the legally required proprietary stake (1% of assets under management) in its funds that are subject to a minimum return guarantee; and (2) direct investment portfolio income, which includes income from fixed income securities and money market instruments. As a result, Porvenir’s revenue is mainly affected by the number of contributors, the salaries of contributors, any changes in applicable fee rates and the rate of return of its assets under management.
Net income
| | | | | | | |
| | | | | | | | | | # | | | | |
| | | (in Ps billions) | | | | |
Total interest income | | | 17.7 | | | | 58.7 | | | | (40.9 | ) | | | (69.8 | ) |
Total interest expense | | | (2.9 | ) | | | (0.2 | ) | | | 2.7 | | | | 1,234.0 | |
Net interest income | | | 14.8 | | | | 58.5 | | | | (43.6 | ) | | | (74.6 | ) |
Total provisions (reversals), net | | | (1.0 | ) | | | (0.0 | ) | | | 1.0 | | | | – | |
Total fees and other services income, net | | | 406.3 | | | | 373.6 | | | | 32.6 | | | | 8.7 | |
Total other operating income | | | 13.3 | | | | 2.7 | | | | 10.6 | | | | 385.9 | |
Total operating income | | | 433.3 | | | | 434.8 | | | | (1.4 | ) | | | (0.3 | ) |
Total operating expenses | | | (202.3 | ) | | | (197.5 | ) | | | 4.7 | | | | 2.4 | |
Net operating income | | | 231.1 | | | | 237.3 | | | | (6.2 | ) | | | (2.6 | ) |
Total non-operating income (expense), net | | | 12.2 | | | | 1.3 | | | | 10.8 | | | | 811.5 | |
| Income before income tax expense and non-controlling interest | | | 243.2 | | | | 238.6 | | | | 4.6 | | | | 1.9 | |
Income tax expense | | | (88.5 | ) | | | (82.1 | ) | | | 6.4 | | | | 7.8 | |
Non-controlling interest | | | (0.2 | ) | | | (0.1 | ) | | | 0.1 | | | | 40.9 | |
Net income | | | 154.5 | | | | 156.4 | | | | (1.8 | ) | | | (1.2 | ) |
Porvenir’s net income decreased by 1.2% to Ps 154.5 billion in the year ended December 31, 2011 as compared to the year ended December 31, 2010. This fall was primarily driven by a decrease in net interest income and an increase in total operating expenses, offset, in most part, by an increase in net fee income, other operating income and non-operating income.
Total fees and other services income
Total net fees and other services income consist primarily of commissions earned on the administration of mandatory pension funds, severance funds, voluntary pension funds and third-party liability pension funds. Porvenir’s total net fees and other services income increased by 8.7% to Ps 406.3 billion in the year ended December 31, 2011, driven primarily by the increase in the revenues received from the administration of mandatory pension funds, which rose by Ps 38.8 billion, from Ps 266.4 billion in the year ended December 31, 2010 to Ps 305.2 billion in the year ended December 31, 2011, due to a 7.9% increase in the average number of contributors and a 3.8% increase in the average wage earned per contributor to Ps 1.2 million.
Also contributing to the increase in fee income was a Ps 5.1 billion increase in fees from severance fund management, which rose from Ps 55.7 billion in the year ended December 31, 2010 to Ps 60.8 billion in the year ended December 31, 2011. This increase was mainly due to the migration of assets from the short-term portfolio to the long-term portfolio and the rise in the assets under management in the severance fund, which increased by 0.3% in the same period of time.
Additionally, an increase in revenue associated with the management of voluntary pension funds, which rose by Ps 1.5 billion, from Ps 44.5 billion in the year ended December 31, 2010 to Ps 46.0 billion in the year ended December 31, 2011, also contributed to the increase in fee revenue.
Third-party liability pension funds decreased by Ps 0.5 billion from Ps 22.0 billion in the year ended December 31, 2010 to Ps 21.5 billion in the year ended December 31, 2011. This fall was due to a decrease in the commissions earned from the third-party liability pension funds that depend on the rate of return of the portfolios as prevailing local and global market conditions during 2011 were not particularly favorable.
Other fees associated with pension fund administration, such as non-contributor affiliate fees and transfer fees, decreased by Ps 5.8 billion from Ps 19.7 billion for the year ended December 31, 2010 to Ps 13.8 billion for the year ended December 31, 2011. Non-contributor affiliate fees are charged on income from the managed funds. Because returns on funds were lower in 2011 than in 2010 the fees charged were lower in 2011 than in 2010.
Commissions from banking services, consisting primarily of fees charged to customers for the processing of information and the early withdrawal of pensions, decreased by Ps 6.3 billion to Ps 7.6 billion in the year ended December 31, 2011. This decrease was mainly due to a Ps 8.5 billion reclassification of income from Gestión y Contacto S.A., which was included as commissions from banking services in 2010 and is classified as “other operating income” in 2011.
Fees and other service expenses increased marginally from Ps 50.1 billion for the year ended December 31, 2010 to Ps 50.5 billion for the year ended December 31, 2011.
Net interest income
Net interest income decreased by Ps 43.6 billion to Ps 14.8 billion in the year ended December 31, 2011. This decrease was primarily due to the decline in the rate of return of Porvenir’s mandatory investment in its stability reserve as prevailing market conditions during 2011 were not particularly favorable, in the local and global equity markets. In the local market, income from fixed income investments decreased due to the increase in the average Colombian Central Bank intervention and income from equity portfolios decreased due to the 17.6% decrease in the Colombian stock exchange index, or “IGBC,” during 2011. Porvenir’s rate of return on its investment portfolio decreased from 11.5% in the year ended December 31, 2010 to 2.2% in the year ended December 31, 2011. This effect was partially offset by an increase in the average volume of the investment portfolio, which grew by 30.4% from Ps 507.1 billion at December 31, 2010 to Ps 661.2 billion at December 31, 2011.
Operating expenses
| | | | | | | |
| | | | | | | | | | # | | | | |
| | | (in Ps billions) | | | | |
Salaries and employee benefits | | | (79.8 | ) | | | (77.5 | ) | | | 2.3 | | | | 3.0 | |
Bonus plan payments | | | (1.4 | ) | | | (3.7 | ) | | | (2.3 | ) | | | (62.8 | ) |
Termination payments | | | (0.1 | ) | | | (0.5 | ) | | | (0.4 | ) | | | (85.6 | ) |
Administrative and other expenses | | | (112.5 | ) | | | (110.8 | ) | | | 1.7 | | | | 1.5 | |
| Deposit security, net | | | – | | | | – | | | | – | | | | – | |
Charitable and other donation expenses | | | (2.2 | ) | | | (0.1 | ) | | | 2.0 | | | | 1,412.8 | |
Depreciation | | | (6.4 | ) | | | (5.0 | ) | | | 1.4 | | | | 28.6 | |
Goodwill amortization | | | – | | | | – | | | | – | | | | – | |
Total operating expenses | | | (202.3 | ) | | | (197.5 | ) | | | 4.7 | | | | 2.4 | |
Porvenir’s total operating expenses in the year ended December 31, 2011 increased by 2.4% to Ps 202.3 billion due primarily to the 3.0% growth of salaries and employee benefits to Ps 79.8 billion, which was consistent with the organic growth of the business. Also contributing to this increase in operating expenses was a Ps 2.0 billion increase in charitable and other donation expenses, which rose from Ps 0.1 billion in the year ended December 31, 2010 to Ps 2.2 billion in the year ended December 31, 2011 due to increased charitable donations related to the Colombian floods in 2011. Porvenir’s efficiency ratio in the year ended December 31, 2011 worsened in comparison to the same period in 2010, increasing from 44.3% to 45.1%.
Other operating income
Total other operating income in the year ended December 31, 2011 increased by Ps 10.6 billion from Ps 2.7 billion in the year ended December 31, 2010 to Ps 13.3 billion. This increase was mainly due to a Ps 8.5 billion reclassification of income from Gestión y Contacto S.A., which was included as commissions from banking services in 2010 and is classified as “other operating income” in 2011.
Non-operating income (expense, net)
Total non-operating income (expense), net includes provisions, gains on sale of property, administrative authority fines, and labor demand penalties. Total non-operating income (expense), net in the year ended December 31, 2011 increased by Ps 10.8 billion from Ps 1.3 billion in the year ended December 31, 2010 to Ps 12.2 billion. This increase was due to reversals of provisions.
Income tax expense
Income tax expense increased by 6.4% to Ps 88.5 billion for the year ended December 31, 2011. This increase was primarily due to higher income before income tax expense and non-controlling interest. Porvenir’s effective tax rate, calculated before non-controlling interest, increased from 34.3% for the year ended December 31, 2010 to 36.4% for the year ended December 31, 2011, primarily due to an increase in non-tax deductible expenses such as the Equity Tax (further explained in the “Results of operations for the year ended December 31, 2011 compared to the year ended December 31, 2010 – Grupo Aval”).
LB Panama
The following information is presented to illustrate the impact that LB Panama had on Banco de Bogotá’s consolidated results for the years ended December 31, 2011 and December 31, 2010. The results of operations in 2011 of LB Panama include twelve months of results of BAC Credomatic as compared to one month of BAC Credomatic’s operations in 2010. At December 31, 2011, LB Panama had U.S.$903 million of goodwill associated with the BAC Credomatic acquisition and U.S.$270 million of indebtedness that it incurred to finance, in part, the BAC Credomatic acquisition.
| | | | | | | |
| | | | | | | | | | # | |
| | | (in Ps billions) | |
Total interest income | | | 1,415.0 | | | | 119.0 | | | | 1,296.0 | |
Total interest expense | | | (335.1 | ) | | | (29.0 | ) | | | 306.2 | |
Net interest income | | | 1,079.8 | | | | 90.0 | | | | 989.8 | |
Total provisions (reversals), net | | | (165.0 | ) | | | (2.3 | ) | | | 162.7 | |
Total fees and other services income, net | | | 599.3 | | | | 55.1 | | | | 544.3 | |
Total other operating income | | | 96.5 | | | | 17.3 | | | | 79.2 | |
Total operating income | | | 1,610.6 | | | | 160.1 | | | | 1,450.5 | |
Total operating expenses | | | (1,134.5 | ) | | | (114.0 | ) | | | 1,020.5 | |
Net operating income | | | 476.1 | | | | 46.1 | | | | 430.0 | |
Total non-operating income (expense), net | | | 2.9 | | | | 28.3 | | | | (25.4 | ) |
Income before income tax expense and non-controlling interest | | | 479.0 | | | | 74.4 | | | | 404.6 | |
Income tax expense | | | (147.9 | ) | | | (21.4 | ) | | | 126.5 | |
Income before non-controlling interest | | | 331.1 | | | | 53.0 | | | | 278.1 | |
Non-controlling interest | | | (0.1 | ) | | | (0.0 | ) | | | 0.1 | |
Net income attributable to shareholders | | | 331.0 | | | | 53.0 | | | | 278.0 | |
| (1) | LB Panama’s financial information is prepared in accordance with Colombian Banking GAAP and primarily reflects BAC Credomatic’s consolidated results, which are consolidated in LB Panama’s results from December 1, 2010. At December 31, 2011, LB Panama had Ps 2,017.3 billion of goodwill associated with the BAC Credomatic acquisition and Ps 524.5 billion of indebtedness that it incurred to finance, in part, the BAC Credomatic acquisition. Goodwill amortization and interest expense associated with the BAC Credomatic acquisition for the year ended December 31, 2011 were Ps 49.1 billion and Ps 19.4 billion, respectively. |
LB Panama’s net income attributable to its shareholders in the year ended December 31, 2011 increased by Ps 278.0 billion, to Ps 331.0 billion mainly due to an increase of Ps 989.8 billion in net interest income and an increase of Ps 544.3 billion in total fees and income from services, net partially offset by an increase in total net provisions of Ps 162.7 billion, an increase in total operating expenses of Ps 1,020.5 billion and an increase of income tax expense of Ps 126.5 billion.
Net interest income
| | | | |
| | | | | | | |
| | | | | | | | | | # | |
| | | (in Ps billions) | |
| Interest income: | | | | | | | | | | |
Interest on loans | | | 1,319.0 | | | | 111.4 | | | | 1,207.6 | |
Interest on investment securities | | | 52.8 | | | | 4.1 | | | | 48.7 | |
Interbank and overnight funds | | | 23.0 | | | | 1.9 | | | | 21.1 | |
Financial leases | | | 20.1 | | | | 1.6 | | | | 18.6 | |
| Total interest income | | | 1,415.0 | | | | 119.0 | | | | 1,296.0 | |
| Interest expense: | | | | | | | | | | | | |
Checking accounts | | | (29.6 | ) | | | - | | | | 29.6 | |
Time deposits | | | (164.9 | ) | | | (15.1 | ) | | | 149.8 | |
Savings deposits | | | (31.5 | ) | | | (5.2 | ) | | | 26.3 | |
Total interest expense from deposits | | | (226.0 | ) | | | (20.3 | ) | | | 205.7 | |
Borrowing from banks and others | | | (83.4 | ) | | | (6.5 | ) | | | 76.9 | |
Interbank and overnight funds (expenses) | | | (7.0 | ) | | | (0.4 | ) | | | 6.6 | |
Long-term debt (bonds) | | | (18.7 | ) | | | (1.8 | ) | | | 17.0 | |
| Total interest expense | | | (335.1 | ) | | | (29.0 | ) | | | 306.2 | |
| Net interest income | | | 1,079.8 | | | | 90.0 | | | | 989.8 | |
| (1) | LB Panama’s financial information is prepared in accordance with Colombian Banking GAAP and primarily reflects BAC Credomatic’s consolidated results, which are consolidated in LB Panama’s results from December 1, 2010. At December 31, 2011, LB Panama had Ps 2,017.3 billion of goodwill associated with the BAC Credomatic acquisition and Ps 524.5 billion of indebtedness that it incurred to finance, in part, the BAC Credomatic acquisition. Goodwill amortization and interest expense associated with the BAC Credomatic acquisition for the year ended December 31, 2011 were Ps 49.1 billion and Ps 19.4 billion, respectively. |
LB Panama’s net interest income increased by Ps 989.8 billion from Ps 90.0 billion in the year ended December 31, 2010 to Ps 1,079.8 billion in the year ended December 31, 2011.
Total interest income increased by Ps 1,296.0 billion, from Ps 119.0 billion in the year ended December 31, 2010 to Ps 1,415.0 billion in the year ended December 31, 2011, primarily due to an increase in interest income from loans and financial leases, which rose by Ps 1,226.2 billion to Ps 1,339.2 billion in the year ended December 31, 2011. During 2011, the average balance of loans and financial leases for LB Panama was Ps 9,961.3 billion and the annualized yield on its loans and financial leases was 13.4%.
Interest on investment securities and income from interbank and overnight funds increased by Ps 48.7 billion and Ps 21.1 billion, respectively, during 2011. The average balance of investment securities during 2011 was Ps 1,333.4 billion and the average yield on investments was 4.0%.
Partially offsetting the increase in interest income from loans and financial leases, investment securities and overnight funds was a Ps 306.2 billion increase in total interest expense from Ps 29.0 billion in 2010 to Ps 335.1 billion in 2011. The average balance of interest-bearing liabilities was Ps 13,286.5 billion and the annualized rate paid on interest-bearing liabilities was 2.5%.
LB Panama’s net interest margin (calculated as net interest income divided by total average interest-earning assets) was 8.8% in the year ended December 31, 2011. The spread between the yield earned on its loans and financial leases and the cost of its interest-bearing liabilities was 10.9% in the year ended December 31, 2011.
Provisions
Total net provision increased by Ps 162.7 billion to Ps 165.0 billion for the year ended December 31, 2011. Net Provisions for loans and financial leases contributed Ps 161.4 billion of this total. LB Panama’s past due loans improved from 3.1% of total loans in 2010 to 2.8% of total loans in 2011. LB Panama’s charge offs were Ps 165.1 billion in 2011, equivalent to 1.6% of average outstanding loans. LB Panama’s coverage ratio for the year ended December 31, 2011 was 64.3% compared to 65.7% for the year ended December 31, 2010.
Total fees and other services income
| | | | |
| | | | | | | |
| | | | | | | | | | # | |
| | | (in Ps billions) | |
| Fees and other services income: | | | | | | | | | | |
| Commissions from banking services | | | 416.2 | | | | 37.9 | | | | 378.3 | |
| Branch network services | | | – | | | | – | | | | – | |
| Credit card merchant fees | | | 173.4 | | | | 18.6 | | | | 154.8 | |
| Checking fees | | | – | | | | – | | | | – | |
| Warehouse services | | | – | | | | – | | | | – | |
| Fiduciary activities | | | – | | | | – | | | | – | |
| Pension plan administration | | | 9.8 | | | | – | | | | 9.8 | |
| Other | | | 55.0 | | | | 5.7 | | | | 49.3 | |
Total fees and other services income | | | 654.4 | | | | 62.3 | | | | 592.1 | |
Fees and other services expenses | | | (55.0 | ) | | | (7.2 | ) | | | 47.8 | |
Total fees and other services income, net | | | 599.3 | | | | 55.1 | | | | 544.3 | |
| (1) | LB Panama’s financial information is prepared in accordance with Colombian Banking GAAP and primarily reflects BAC Credomatic’s consolidated results, which are consolidated in LB Panama’s results from December 1, 2010. At December 31, 2011, LB Panama had Ps 2,017.3 billion of goodwill associated with the BAC Credomatic acquisition and Ps 524.5 billion of indebtedness that it incurred to finance, in part, the BAC Credomatic acquisition. Goodwill amortization and interest expense associated with the BAC Credomatic acquisition for the year ended December 31, 2011 were Ps 49.1 billion and Ps 19.4 billion, respectively. |
Total net fees and other services income increased by Ps 544.3 billion to Ps 599.3 billion in the year ended December 31, 2011, primarily as a result of higher commissions from banking services and increased credit card merchant fees.
Other operating income
| | | | |
| | | | | | | |
| | | | | | | | | | # | |
| | | (in Ps billions) | |
Foreign exchange gains (losses), net | | | 100.9 | | | | 15.3 | | | | 85.5 | |
Gains (losses) on derivative operations, net | | | (4.6 | ) | | | 2.0 | | | | (6.6 | ) |
| Gains on sales of investments in equity securities, net | | | – | | | | (0.0 | ) | | | 0.0 | |
Income from non-financial sector, net | | | – | | | | – | | | | – | |
Dividend income | | | – | | | | – | | | | – | |
Other | | | 0.2 | | | | 0.0 | | | | 0.2 | |
Other operating income | | | 96.5 | | | | 17.3 | | | | 79.2 | |
| (1) | LB Panama’s financial information is prepared in accordance with Colombian Banking GAAP and primarily reflects BAC Credomatic’s consolidated results, which are consolidated in LB Panama’s results from December 1, 2010. At December 31, 2011, LB Panama had Ps 2,017.3 billion of goodwill associated with the BAC Credomatic acquisition and Ps 524.5 billion of indebtedness that it incurred to finance, in part, the BAC Credomatic acquisition. Goodwill amortization and interest expense associated with the BAC Credomatic acquisition for the year ended December 31, 2011 were Ps 49.1 billion and Ps 19.4 billion, respectively. |
Total other operating income, net increased by Ps 79.2 billion to Ps 96.5 billion in the year ended December 31, 2011 due primarily to a Ps 85.5 billion increase associated with foreign exchange gains (losses), net. In the ordinary course of business, LB Panama enters into forward contracts and other derivative transactions in foreign currency through its treasury department almost entirely for hedging purposes and on behalf of clients.
Operating expenses
| | | | |
| | | | | | | |
| | | | 201 | | | | 2010 | | | | # | |
| | | (in Ps billions) | |
Salaries and employee benefits | | | (451.0 | ) | | | (35.7 | ) | | | 415.3 | |
Bonus plan payments | | | (53.9 | ) | | | (2.9 | ) | | | 51.1 | |
Termination payments | | | (17.3 | ) | | | (3.9 | ) | | | 13.4 | |
Administrative and other expenses | | | (490.7 | ) | | | (63.3 | ) | | | 427.4 | |
Deposit security, net | | | (8.6 | ) | | | (0.7 | ) | | | 7.8 | |
Charitable and other donation expenses | | | (1.7 | ) | | | (0.2 | ) | | | 1.5 | |
Depreciation | | | (56.9 | ) | | | (4.4 | ) | | | 52.5 | |
Goodwill amortization | | | (54.4 | ) | | | (2.8 | ) | | | 51.5 | |
Total operating expenses | | | (1,134.5 | ) | | | (114.0 | ) | | | 1,020.5 | |
| (1) | LB Panama’s financial information is prepared in accordance with Colombian Banking GAAP and primarily reflects BAC Credomatic’s consolidated results, which are consolidated in LB Panama’s results from December 1, 2010. At December 31, 2011, LB Panama had Ps 2,017.3 billion of goodwill associated with the BAC Credomatic acquisition and Ps 524.5 billion of indebtedness that it incurred to finance, in part, the BAC Credomatic acquisition. Goodwill amortization and interest expense associated with the BAC Credomatic acquisition for the year ended December 31, 2011 were Ps 49.1 billion and Ps 19.4 billion, respectively. |
Total operating expenses increased by Ps 1,020.5 billion to Ps 1,134.5 billion in the year ended December 31, 2011. The increase is mainly due to a Ps 427.4 billion increase to Ps 490.7 billion in administrative and other expenses and to a Ps 415.3 billion increase to Ps 451.0 billion in salaries and employee benefits. LB Panama’s number of employees decreased from 15,755 in 2010 to 15,498 in 2011. LB Panama’s efficiency ratio at December 31, 2011 was 57.6%, which improved from the 65.7% ratio at December 31, 2010, but still higher than Grupo Aval’s Colombian operations.
Non-operating income (expense)
Total non-operating income (expense) decreased by Ps 25.4 billion to Ps 2.9 billion for the year ended December 31, 2011 because at December 2010 LB Panama registered non-recurring income associated with a reversal of provisions for withholding taxes on dividends paid to BAC Credomatic by its subsidiaries.
Income tax expense
Income before income tax expense and non-controlling interest increased by Ps 126.5 billion to Ps 147.9 billion for the year ended December 31, 2011. LB Panama’s effective tax rate was 30.9% for the year ended December 31, 2011.
Non-controlling interest
LB Panama’s non-controlling interest is not material. It accounted for Ps 0.1 billion for the year ended December 31, 2011.
Banco de Occidente
Net income
| | | | | | | |
| | | | | | | | | | # | | | | |
| | | (in Ps billions) | | | | |
Total interest income | | | 1,592.7 | | | | 1,403.9 | | | | 188.8 | | | | 13.5 | |
Total interest expense | | | (525.5 | ) | | | (457.2 | ) | | | 68.2 | | | | 14.9 | |
Net interest income | | | 1,067.2 | | | | 946.7 | | | | 120.6 | | | | 12.7 | |
Total provisions (reversals), net | | | (176.6 | ) | | | (192.3 | ) | | | (15.7 | ) | | | (8.2 | ) |
Total fees and other services income, net | | | 198.5 | | | | 186.6 | | | | 11.9 | | | | 6.4 | |
Total other operating income | | | 314.3 | | | | 316.7 | | | | (2.3 | ) | | | (0.7 | ) |
Total operating income | | | 1,403.5 | | | | 1,257.6 | | | | 145.9 | | | | 11.6 | |
Total operating expenses | | | (846.3 | ) | | | (764.4 | ) | | | 81.8 | | | | 10.7 | |
Net operating income | | | 557.2 | | | | 493.2 | | | | 64.0 | | | | 13.0 | |
Total non-operating income (expense), net | | | 15.5 | | | | 21.4 | | | | (5.9 | ) | | | (27.6 | ) |
| Income before income tax expense and non-controlling interest | | | 572.7 | | | | 514.6 | | | | 58.1 | | | | 11.3 | |
Income tax expense | | | (139.0 | ) | | | (126.2 | ) | | | 12.8 | | | | 10.2 | |
Income before non-controlling interest | | | 433.7 | | | | 388.4 | | | | 45.3 | | | | 11.7 | |
Non-controlling interest | | | (1.6 | ) | | | (2.0 | ) | | | (0.4 | ) | | | (21.1 | ) |
Net income attributable to shareholders | | | 432.1 | | | | 386.4 | | | | 45.7 | | | | 11.8 | |
Banco de Occidente’s net income attributable to its shareholders increased by 11.8% to Ps 432.1 billion for the year ended December 31, 2011. The most important drivers of this increase were the growth in net interest income and a decrease in total net provisions, offset in part by an increase in total operating expense and an increase in income tax expense.
Net interest income
| | | | | | | |
| | | | | | | | | | # | | | | |
| | | (in Ps billions) | | | | |
| Interest income: | | | | | | | | | | | | | |
Interest on loans | | | 1,080.2 | | | | 945.3 | | | | 134.9 | | | | 14.3 | |
Interest on investment securities | | | 177.1 | | | | 193.9 | | | | (16.7 | ) | | | (8.6 | ) |
Interbank and overnight funds | | | 29.2 | | | | 8.4 | | | | 20.8 | | | | 247.1 | |
Financial leases | | | 306.1 | | | | 256.3 | | | | 49.8 | | | | 19.4 | |
Total interest income | | | 1,592.7 | | | | 1,403.9 | | | | 188.8 | | | | 13.5 | |
| Interest expense: | | | | | | | | | | | | | | | | |
Checking accounts | | | (7.3 | ) | | | (4.9 | ) | | | 2.4 | | | | 50.1 | |
Time deposits | | | (116.5 | ) | | | (137.6 | ) | | | (21.1 | ) | | | (15.3 | ) |
Savings deposits | | | (188.5 | ) | | | (141.6 | ) | | | 46.9 | | | | 33.2 | |
Total interest expense from deposits | | | (312.3 | ) | | | (284.1 | ) | | | 28.3 | | | | 9.9 | |
Borrowing from banks and others | | | (75.3 | ) | | | (76.8 | ) | | | (1.4 | ) | | | (1.9 | ) |
Interbank and overnight funds (expenses) | | | (14.6 | ) | | | (6.7 | ) | | | 7.9 | | | | 118.0 | |
Long-term debt (bonds) | | | (123.3 | ) | | | (89.7 | ) | | | 33.6 | | | | 37.4 | |
Total interest expense | | | (525.5 | ) | | | (457.2 | ) | | | 68.2 | | | | 14.9 | |
Net interest income | | | 1,067.2 | | | | 946.7 | | | | 120.6 | | | | 12.7 | |
Banco de Occidente’s net interest income increased by 12.7% from Ps 946.7 billion for the year ended December 31, 2010 to Ps 1,067.2 billion for the year ended December 31, 2011. This increase was primarily driven by a 15.4% increase in the interest earned on loans and financial leases to Ps 1,386.3 billion for the year ended December 31, 2011. A 17.8% growth of Banco de Occidente’s average loan and financial lease portfolio to Ps 12,674.7 billion on December 31, 2011 resulted in a Ps 196.1 billion increase in interest income from loans and financial leases over the same period. Partially offsetting this increase was the decrease in average yield on loans and financial leases from 11.2% for the year ended December 31, 2010 to 10.9% for the same period in 2011, which resulted in a Ps 11.3 billion decrease in interest income from loans and financial leases. The decrease in the yield for loans and financial leases reflects a declining rate environment in the second half of 2010 and early 2011 together with the strong growth of our loan portfolio during 2011. The average interest yield on loans and financial leases for Banco de Occidente was 10.9% during the last quarter of 2011 as previously discussed in “Results of operations for the year ended December 31, 2011 compared to the year ended December 31, 2010 – Grupo Aval – Net interest income.”
Also contributing to the increase in interest income was a Ps 20.8 billion increase in income from interbank and overnight funds to Ps 29.2 billion for the year ended December 31, 2011. This increase was mainly driven by the increase in the average yield from 2.1% in 2010 to 5.5% in 2011.
Interest income from investment securities decreased by 8.6% to Ps 177.1 billion for the year ended December 31, 2011. The fixed income portfolio generated Ps 177.1 billion, or 99.99%, of Banco de Occidente’s earnings on investment securities in December 31, 2011, which was 8.6% lower than the Ps 193.8 billion earned on fixed income investments in December 31, 2010 due to a decrease in the average balance. The equity portfolio generated the remaining Ps 0.01 billion, or 0.01%, of the interest income from investment securities, which was marginally down from the Ps 0.05 billion produced by the equity portfolio in December 31, 2010.
The 14.9% increase in total interest expense to Ps 525.5 billion for the year ended December 31, 2011 partially offset the increase in interest income. The increase in interest paid on interest-bearing liabilities was concentrated in savings deposits, for which interest expense increased by Ps 46.9 billion (Ps 25.0 billion due to an increase in rate paid and Ps 21.9 billion due to an increase in their average balance) and long-term debt, for which interest expense increased by Ps 33.6 billion (Ps 30.9 billion due to an increase in their average balance and Ps 2.6 billion due to a decrease in rate paid). These increases were partially offset by a Ps 21.1 billion decrease in interest expense for time deposits (Ps 16.3 billion due to a decrease in rate paid and Ps 4.9 billion due to a decrease in average balance). The increase in the average balance of time deposits was driven by the issuance of Ps 647.1 billion in bonds during 2011 to cover long-term operations on loans and financial leases.
The average rate paid on interest-bearing liabilities remained basically unchanged at 4.1% for the year ended December 31, 2011 as compared to the year ended December 31, 2010, and the average yield earned on interest-earning assets increased from 8.8% for the year ended December 31, 2010 to 9.0% for the year ended December 31, 2011.
For the reasons explained above, the spread between the yield earned on its loans and financial leases and the cost of its interest-bearing liabilities decreased by 21 basis points from 7.1% for the year ended December 31, 2010 to 6.9% for the year ended December 31, 2011 due to the fact that the yield on loans and financial leases decreased by 23 basis points while the cost of funds remained basically unchanged. Banco de Occidente’s net interest margin, however, remained unchanged at 6.0% at December 31, 2011 and December 31, 2010.
Provisions
Total net provisions decreased by 8.2%, or Ps 15.7 billion, to Ps 176.6 billion for the year ended December 31, 2011, mainly driven by an increase in recovery of charged-off assets, which increased by Ps 17.7 billion to Ps 57.0 billion for the year ended December 31, 2011 primarily as a result of the improving Colombian economy and a more effective recovery effort by Banco de Occidente.
Net provisions for loan and financial lease losses, the main component of total net provisions, increased by 0.5%, or Ps 1.0 billion, to Ps 205.2 billion for the year ended December 31, 2011. Despite an increase in past due loans, in line with general growth of the loan portfolio, Banco de Occidente’s delinquency ratio improved from 2.8% at December 31,
2010 to 2.5% at December 31, 2011. This improvement was primarily a result of a reduction in past due commercial loans, which decreased by 8.4% to Ps 122.3 billion (with a drop in their delinquency ratio from 1.9% to 1.4%) due to the improvement of the Colombian economy.
Charge-offs decreased by 26.3% to Ps 167.8 billion for the year ended December 31, 2011, reflecting the improvement in Banco de Occidente’s credit quality. Banco de Occidente’s charge-offs to average loans and financial leases ratio decreased from 2.1% at December 31, 2010 to 1.3% at December 31, 2011. Banco de Occidente’s coverage ratio decreased slightly from 163.3% for the year ended December 31, 2010 to 158.4% for the year ended December 31, 2011.
Net provisions for accrued interest and other receivables decreased by 3.5%, or Ps 0.9 billion, to Ps 25.1 billion due to the aforementioned improvement in the Colombian economy.
Net provisions for foreclosed assets and other assets increased by Ps 1.9 billion to Ps 3.3 billion for the year ended December 31, 2011. Gross provisions for foreclosed assets and other assets increased by Ps 4.5 billion to Ps 11.4 billion as operating leases increased, and reversals of provisions for foreclosed and other assets increased by Ps 2.6 billion to Ps 8.0 billion primarily as a result of the improving Colombian economy.
Total fees and other services income, net
| | | | | | | |
| | | | | | | | | | # | | | | |
| | | (in Ps billions) | | | | |
| Fees and other services income: | | | | | | | | | | | | | |
Commissions from banking services | | | 140.6 | | | | 124.5 | | | | 16.1 | | | | 12.9 | |
Branch network services | | | – | | | | – | | | | – | | | | – | |
Credit card merchant fees | | | 75.3 | | | | 81.5 | | | | (6.2 | ) | | | (7.6 | ) |
Checking fees | | | 23.7 | | | | 23.3 | | | | 0.5 | | | | 1.9 | |
Warehouse services | | | – | | | | – | | | | – | | | | – | |
Fiduciary activities | | | 38.5 | | | | 37.9 | | | | 0.6 | | | | 1.7 | |
Pension plan administration | | | – | | | | – | | | | – | | | | – | |
Other | | | 29.6 | | | | 27.0 | | | | 2.6 | | | | 9.6 | |
Total fees and other services income | | | 307.7 | | | | 294.1 | | | | 13.6 | | | | 4.6 | |
Fees and other services expenses | | | (109.2 | ) | | | (107.5 | ) | | | 1.7 | | | | 1.6 | |
Total fees and other services income, net | | | 198.5 | | | | 186.6 | | | | 11.9 | | | | 6.4 | |
Total net fees and other services income increased by 6.4% to Ps 198.5 billion for the year ended December 31, 2011. This increase was primarily due to a Ps 16.1 billion increase in commissions from banking services, due to fees received from processing social security payments and fees received from ACH (Automated Clearing House). The increase was partially offset by a Ps 6.2 billion decrease in credit card and merchant fees and a Ps 1.7 billion increase in fees and other services expense.
Other operating income
| | | | | | | |
| | | | | | | | | | # | | | | |
| | | (in Ps billions) | | | | |
Foreign exchange gains (losses), net | | | 18.6 | | | | 17.1 | | | | 1.6 | | | | (9.3 | ) |
Gains on derivative operations, net | | | 4.3 | | | | 27.6 | | | | (23.3 | ) | | | (84.6 | ) |
| Gains on sales of investments in equity securities, net | | | 3.7 | | | | - | | | | 3.7 | | | | - | |
Income from non-financial sector, net | | | 2.0 | | | | 1.6 | | | | 0.4 | | | | 28.1 | |
Dividend income | | | 126.7 | | | | 111.7 | | | | 15.0 | | | | 13.4 | |
Other | | | 159.1 | | | | 158.8 | | | | 0.3 | | | | 0.2 | |
Other operating income | | | 314.3 | | | | 316.7 | | | | (2.3 | ) | | | (0.7 | ) |
Total other operating income decreased by 0.7% to Ps 314.3 billion for the year ended December 31, 2011. This decrease was mainly driven by a Ps 21.7 billion decrease in net foreign exchange and derivative operations. Partially offsetting these decreases was a Ps 15.0 billion increase in dividend income and a Ps 3.7 billion increase in gains on sales of investments in equity securities.
The Ps 23.3 billion decrease on gains on derivative operations, net was due to a higher appreciation of the Peso than the amount predicted by Banco de Occidente.
Operating expenses
| | | | | | | |
| | | | | | | | | | # | | | | |
| | | (in Ps billions) | | | | |
Salaries and employee benefits | | | (298.1 | ) | | | (275.1 | ) | | | 23.1 | | | | 8.4 | |
Bonus plan payments | | | (24.6 | ) | | | (20.1 | ) | | | 4.5 | | | | 22.1 | |
Termination payments | | | (2.9 | ) | | | (3.7 | ) | | | (0.8 | ) | | | (22.5 | ) |
Administrative and other expenses | | | (363.6 | ) | | | (320.6 | ) | | | 43.0 | | | | 13.4 | |
Deposit security, net | | | (34.1 | ) | | | (23.6 | ) | | | 10.6 | | | | 44.9 | |
Charitable and other donation expenses | | | (3.7 | ) | | | (1.4 | ) | | | 2.3 | | | | 161.2 | |
Depreciation | | | (117.9 | ) | | | (118.6 | ) | | | (0.7 | ) | | | (0.6 | ) |
Goodwill amortization | | | (1.4 | ) | | | (1.3 | ) | | | 0.1 | | | | 6.6 | |
Total operating expenses | | | (846.3 | ) | | | (764.4 | ) | | | 81.8 | | | | 10.7 | |
Total operating expenses for the year ended December 31, 2011 increased by Ps 81.8 billion, or 10.7%, to Ps 846.3 billion primarily due to a Ps 43.0 billion increase in administrative and other expenses to Ps 363.6 billion for the year ended December 31, 2011. This was driven principally by an increase in the Equity Tax (further discussed in the “Results of operations for the year ended December 31, 2011 compared to the year ended December 31, 2010 – Grupo Aval”) and an increase in operating expenses related to the growth in the loan and financial lease portfolio.
Salaries and employee benefits increased by Ps 23.1 billion, or 8.4%, to Ps 298.1 billion. This increase was explained by an increase in the number of Banco de Occidente’s employees from 8,269 on December 31, 2010 to 9,002 on December 31, 2011. On a per capita basis, salary and employee benefits decreased by 0.4%.
Deposit security expense increased by Ps 10.6 billion. Prior to 2010, this insurance expense was charged quarterly in advance; however, since then it is charged quarterly in arrears. Because of this, the Ps 23.6 billion in December 31, 2010 reflects only the expense of the last three quarters of 2010 (the expense for the first quarter was recorded in December 2009), while the Ps 34.1 billion for the year ended December 31, 2011 reflects the expense for the year.
Banco de Occidente’s efficiency ratio deteriorated slightly from the year ended December 31, 2010 as compared to the year ended December 31, 2011, increasing from 44.5% to 46.0%. The ratio of operating expenses before depreciation and amortization as a percentage of average earning assets was 4.1% for both 2010 and 2011.
Non-operating income (expense)
Total non-operating income (expense), which represented 2.7% of income before income tax expense and non-controlling interest for the year ended December 31, 2011, includes gains (losses) from the sale of foreclosed assets, property, plant and equipment, and other assets and income. This line item decreased by Ps 5.9 billion to Ps 15.5 billion for the year ended December 31, 2011 mainly because during 2010, Banco de Occidente sold a warehouse that generated a non-recurring non-operating income of approximately Ps 5.0 billion.
Income tax expense
Income tax expense increased by Ps 12.8 to Ps 139.0 billion for the year ended December 31, 2011. This was primarily due to higher income before income tax expense and non-controlling interest. The effective tax rate decreased slightly from 24.5% in December 2010 to 24.3% in December 2011.
Non-controlling interest
Banco de Occidente’s non-controlling interest remained basically unchanged from the year ended December 31, 2010, decreasing by Ps 0.4 billion to 1.6 billion for the year ended December 31, 2011. Since the merger of Banco de Occidente and Leasing de Occidente, non-controlling interest is not a significant factor to Banco de Occidente’s net income, responsible for only 0.4% of net income before non-controlling interest for the year ended December 31, 2011.
Banco Popular
Net income
| | | | | | | |
| | | | | | | | | | # | | | | |
| | | (in Ps billions) | | | | |
Total interest income | | | 1,403.2 | | | | 1,276.2 | | | | 127.1 | | | | 10.0 | |
Total interest expense | | | (417.8 | ) | | | (325.3 | ) | | | 92.5 | | | | 28.4 | |
Net interest income | | | 985.4 | | | | 950.9 | | | | 34.5 | | | | 3.6 | |
Total provisions (reversals), net | | | (67.3 | ) | | | (101.6 | ) | | | (34.3 | ) | | | (33.8 | ) |
Total fees and other services income, net | | | 150.7 | | | | 136.1 | | | | 14.6 | | | | 10.7 | |
Total other operating income | | | 51.8 | | | | 42.0 | | | | 9.8 | | | | 23.3 | |
Total operating income | | | 1,120.7 | | | | 1,027.5 | | | | 93.2 | | | | 9.1 | |
Total operating expenses | | | (623.2 | ) | | | (558.3 | ) | | | 64.9 | | | | 11.6 | |
Net operating income | | | 497.5 | | | | 469.2 | | | | 28.3 | | | | 6.0 | |
Total non-operating income (expense), net | | | 57.2 | | | | 53.0 | | | | 4.2 | | | | 7.8 | |
| Income before income tax expense and non-controlling interest | | | 554.7 | | | | 522.2 | | | | 32.4 | | | | 6.2 | |
Income tax expense | | | (177.5 | ) | | | (156.8 | ) | | | 20.7 | | | | 13.2 | |
Income before non-controlling interest | | | 377.2 | | | | 365.4 | | | | 11.7 | | | | 3.2 | |
Non-controlling interest | | | (5.0 | ) | | | (3.8 | ) | | | 1.2 | | | | 31.0 | |
Net income attributable to shareholders | | | 372.2 | | | | 361.6 | | | | 10.6 | | | | 2.9 | |
Banco Popular’s net income attributable to its shareholders increased by 2.9% to Ps 372.2 billion for the year ended December 31, 2011. This increase was primarily due to an increase in net interest income, a decrease in total provisions (reversals), net and a rise in total fees and other services income, offset in part by an increase in total operating expenses and income tax expense.
Net interest income
| | | | | | | |
| | | | | | | | | | # | | | | |
| | | (in Ps billions) | | | | |
| Interest income: | | | | | | | | | | | | | |
Interest on loans | | | 1,215.4 | | | | 1,067.4 | | | | 148.0 | | | | 13.9 | |
Interest on investment securities | | | 141.6 | | | | 164.8 | | | | (23.1 | ) | | | (14.0 | ) |
Interbank and overnight funds | | | 16.2 | | | | 16.8 | | | | (0.5 | ) | | | (3.2 | ) |
Financial leases | | | 30.0 | | | | 27.3 | | | | 2.7 | | | | 9.9 | |
Total interest income | | | 1,403.2 | | | | 1,276.2 | | | | 127.1 | | | | 10.0 | |
| Interest expense: | | | | | | | | | | | | | | | | |
Checking accounts | | | (8.4 | ) | | | (1.9 | ) | | | 6.5 | | | | 341.4 | |
Time deposits | | | (89.7 | ) | | | (81.8 | ) | | | 7.9 | | | | 9.7 | |
Savings deposits | | | (205.2 | ) | | | (170.6 | ) | | | 34.6 | | | | 20.3 | |
Total interest expense on deposits | | | (303.3 | ) | | | (254.3 | ) | | | 49.0 | | | | 19.3 | |
Borrowing from banks and others | | | (15.3 | ) | | | (9.9 | ) | | | 5.4 | | | | 54.2 | |
Interbank and overnight funds (expenses) | | | (6.7 | ) | | | (2.5 | ) | | | 4.2 | | | | 166.9 | |
Long-term debt (bonds) | | | (92.4 | ) | | | (58.5 | ) | | | 34.0 | | | | 58.1 | |
Total interest expense | | | (417.8 | ) | | | (325.3 | ) | | | 92.5 | | | | 28.4 | |
Net interest income | | | 985.4 | | | | 950.9 | | | | 34.5 | | | | 3.6 | |
Banco Popular’s net interest income grew by 3.6% to Ps 985.4 billion for the year ended December 31, 2011 as compared to the year ended December 31, 2010. This increase was driven primarily by the 13.8% increase in interest income from loans and financial leases to Ps 1,245.4 billion for the year ended December 31, 2011. Banco Popular’s average loans and financial lease portfolio grew by 21.0% to Ps 9,193.1 billion, resulting in a Ps 211.7 billion increase in interest income from loans and financial leases. Partially offsetting this increase was the decrease in average yield from 14.4% for the year ended December 31, 2010 to 13.5% for the year ended December 31, 2011, which resulted in a Ps 61.0 billion decrease in interest income from loans and financial leases. The decrease in the yield for loans and financial leases reflects a declining rate environment in the second half of 2010 and early 2011 together with the strong growth of our loan portfolio during 2011. The average interest yield on loans and financial leases for Banco Popular was 13.4% during the last quarter of 2011 as explained in the Grupo Aval discussion.
A decrease in interest income from investment securities, which declined by 14.0% to Ps 141.6 billion for the year ended December 31, 2011, partially offset the increase in interest income from loans and financial leases. The fixed income portfolio generated Ps 138.5 billion of interest income from investment securities, accounting for 97.8% of Banco Popular’s earnings on investment securities for the year ended December 31, 2011. This was 15.6% lower than the Ps 164.0 billion of income generated by fixed income securities for the year ended December 31, 2010 driven by a decrease in the average annualized yield and a decrease in the average fixed income portfolio. Banco Popular’s equity portfolio generated the remaining Ps 3.2 billion (Ps 2.1 billion of which was due to the realization of gains from the sale of an investment in VISA), or 2.2%, of income from investment securities for the year ended December 31, 2011.
The average yield earned on interest-earning assets decreased from 12.0% for the year ended December 31, 2010 to 11.6% for the year ended December 31, 2011, driven by the decrease in the average yield on loans and financial leases and in the yield on investment securities.
The increase in interest income was also partially offset by a 28.4%, or Ps 92.5 billion, increase in total interest expense to Ps 417.8 billion for the year ended December 31, 2011. The increase in interest expense was concentrated in savings accounts, for which interest expense increased by Ps 34.6 billion (Ps 24.1 billion due to an increase in rate paid and a Ps 10.5 billion increase due to an increase in their average balance) and long-term debt, for which interest expense increased by Ps 34.0 billion (Ps 31.6 billion due to an increase in their average balance and a Ps 2.3 billion increase due to an increase in rate paid). The average rate paid on interest-bearing liabilities increased from 3.8% in 2010 to 4.2% in 2011, which was consistent with the increase in the average DTF explained in the Grupo Aval discussion.
For the reasons explained above, Banco Popular’s net interest margin decreased by 82 basis points from 9.0% for the year ended December 31, 2010, to 8.1% for the year ended December 31, 2011. Similarly, the spread between the yield earned on its loans and financial leases and the cost of its interest-bearing liabilities decreased by 133 basis points from 10.6% for the year ended December 31, 2010 to 9.3% for the year ended December 31, 2011.
Provisions
Total net provisions decreased by Ps 34.3 billion to Ps 67.3 billion for the year ended December 31, 2011, driven primarily by a 30.0%, or Ps 38.5 billion, decrease in net provisions for loans and financial leases to Ps 90.1 billion. Gross provisions for loan and financial lease losses decreased by 11.6% to Ps 289.4 billion, while the reversal of provisions increased by 0.2% to Ps 199.3 billion for the year ended December 31, 2011.
The decrease in provisions for loans and financial leases losses was consistent with the improvement of Banco Popular’s credit quality, which stemmed primarily from the recovery of the Colombian economy. Past due loans
decreased by 2.0% to Ps 211.2 billion for the year ended December 31, 2011 as compared to the year ended December 31, 2010, but the bank’s delinquency ratio improved from 2.5% at December 31, 2010 to 2.1% at December 31, 2011. This improvement was primarily a result of a reduction in commercial loans past due, which decreased by 36.9% to Ps 46.6 billion (with a drop in their delinquency ratio from 2.0% to 1.1%) because of the strength of the Colombian economy and the bank’s more effective collection efforts. Consumer loans and financial leases past due partially offset this improvement. Consumer loans and financial leases past due increased by Ps 23.7 billion to Ps 140.4 billion and their delinquency ratio increased from 2.5% to 2.6%. Nevertheless, Banco Popular’s consumer loan and financial lease delinquency ratio is still lower than that of our other banking subsidiaries and the industry average because the majority of its consumer loans are payroll loans.
The decrease in past due loans was accompanied by a reduction in charge-offs, which was also due to the recovery of the Colombian economy. Charge-offs decreased by 47.4% to Ps 51.9 billion for the year ended December 31, 2011 as compared to the year ended December 31, 2010. Consistent with the decrease in charge-offs, Banco Popular’s charge-offs to average loan ratio decreased from 1.3% at December 31, 2010 to 0.6% at December 31, 2011. Since Banco Popular’s net provisions for loans and financial leases were greater than its charge-offs for the year ended December 31, 2011, its allowance for loan and financial lease losses increased by 7.9% to Ps 389.3 billion at December 31, 2011. Banco Popular’s coverage ratio improved from 167.5% to 184.3%.
Net provisions for accrued interest and other receivables increased by Ps 1.7 billion to Ps (3.9) billion (indicating a recovery of Ps 3.9 billion) due to the aforementioned improvement in the Colombian economy.
Net provisions for foreclosed assets and other assets increased by Ps 4.3 billion to Ps (0.7) billion (indicating a net recovery of Ps 0.7 billion) at December 31, 2011. Gross provisions for foreclosed assets and other assets decreased by Ps 0.5 billion to Ps 3.5 billion, while reversals of provisions for foreclosed and other assets decreased by Ps 4.7 billion to Ps 4.3 billion for the year ended December 31, 2011. Finally, Banco Popular’s recovery of charged-off assets increased by Ps 1.8 billion to Ps 18.1 billion over the same periods.
Total fees and other services income, net
| | | | | | | |
| | | | | | | | | | # | | | | |
| | | (in Ps billions) | | | | |
| Fees and other services income: | | | | | | | | | | | | | |
| Commissions from banking services | | | 88.8 | | | | 86.9 | | | | 2.0 | | | | 2.3 | |
| Branch network services | | | – | | | | – | | | | – | | | | – | |
| Credit card merchant fees | | | 5.4 | | | | 5.1 | | | | 0.4 | | | | 7.0 | |
| Checking fees | | | 4.1 | | | | 4.3 | | | | (0.2 | ) | | | (5.7 | ) |
| Warehouse services | | | 61.1 | | | | 55.3 | | | | 5.8 | | | | 10.5 | |
| Fiduciary activities | | | 11.8 | | | | 10.7 | | | | 1.1 | | | | 10.4 | |
| Pension plan administration | | | 1.1 | | | | 1.6 | | | | (0.6 | ) | | | (35.9 | ) |
| Others | | | 10.7 | | | | 10.3 | | | | 0.4 | | | | 3.9 | |
| Total fees and other services income | | | 182.9 | | | | 174.1 | | | | 8.8 | | | | 5.1 | |
| Fees and other services expenses | | | (32.2 | ) | | | (38.0 | ) | | | (5.7 | ) | | | (15.1 | ) |
| Total fees and other services income, net | | | 150.7 | | | | 136.1 | | | | 14.6 | | | | 10.7 | |
Total net fees and other services income increased by 10.7% to Ps 150.7 billion for the year ended December 31, 2011. This increase was primarily due to a Ps 5.8 billion increase in warehouse services to Ps 61.1 billion, a Ps 2.0 billion increase in commissions from banking services to Ps 88.8 billion and a Ps 5.7 billion decrease in fees and other services expenses to Ps 32.2 billion.
Fees from warehouse services are contributed by Alpopular, Banco de Occidente’s warehouse subsidiary. The rise in the income from warehouse services resulted from greater imports/exports from existing clients and the addition of new clients.
The decrease in fees and other services expenses was mainly driven by a decrease in commissions and banking services expenses.
Other operating income
| | | | | | | |
| | | | | | | | | | # | | | | |
| | | (in Ps billions) | | | | |
Foreign exchange gains (losses), net | | | 0.3 | | | | (1.6 | ) | | | 1.9 | | | | 117.3 | |
Gains on derivative operations, net | | | 0.0 | | | | 0.0 | | | | 0.0 | | | | – | |
| Gains on sales of investments in equity securities, net | | | – | | | | (0.0 | ) | | | 0.0 | | | | – | |
| Income from non-financial sector, net | | | 7.9 | | | | 3.5 | | | | 4.4 | | | | 128.8 | |
Dividend income | | | 31.6 | | | | 28.1 | | | | 3.5 | | | | 12.6 | |
Other | | | 12.0 | | | | 12.1 | | | | (0.1 | ) | | | (0.5 | ) |
Total other operating income | | | 51.8 | | | | 42.0 | | | | 9.8 | | | | 23.3 | |
Total other operating income increased by 23.3% to Ps 51.8 billion for the year ended December 31, 2011. This increase was primarily a result of a Ps 4.4 billion increase in net income from the non-financial sector, which is income contributed by Inca Fruenhauf S.A., or “Inca,” (Inca is a manufacturer of vehicle-towing equipment of which Banco Popular owns approximately 44.6%) a Ps 3.5 billion increase in dividend income and a Ps 1.9 billion increase in foreign exchange gains.
Operating expenses
| | | | | | | |
| | | | | | | | | | # | | | | |
| | | (in Ps billions) | | | | |
Salaries and employee benefits | | | (244.9 | ) | | | (224.1 | ) | | | 20.8 | | | | 9.3 | |
Bonus plan payments | | | (4.8 | ) | | | (3.8 | ) | | | 0.9 | | | | 24.3 | |
Termination payments | | | (0.2 | ) | | | (0.1 | ) | | | 0.1 | | | | 65.1 | |
Administrative and other expenses | | | (321.5 | ) | | | (281.2 | ) | | | 40.2 | | | | 14.3 | |
Deposit security, net | | | (27.2 | ) | | | (26.7 | ) | | | 0.5 | | | | 1.7 | |
Charitable and other donation expenses | | | (1.6 | ) | | | (1.3 | ) | | | 0.3 | | | | 20.8 | |
Depreciation | | | (23.1 | ) | | | (20.9 | ) | | | 2.2 | | | | 10.4 | |
Goodwill amortization | | | – | | | | – | | | | – | | | | – | |
Total operating expenses | | | (623.2 | ) | | | (558.3 | ) | | | 64.9 | | | | 11.6 | |
Total operating expenses increased by 11.6% to Ps 623.2 billion for the year ended December 31, 2011, principally due to a 14.3% increase in administrative and other expenses. This increase was driven by a rise in the Equity Tax (further explained in “Results of operations for the year ended December 31, 2011 compared to the year ended December 31, 2010 – Grupo Aval”) and an increase in operating expenses related to the growth in the loan and financial lease portfolio. Salaries and employee benefits increased by 9.3% to Ps 244.9 billion, which was partially explained by the increase in headcount from 6,180 at December 31, 2010 to 6,414 at December 31, 2011. On a per capita basis, salaries and employee benefits increased by 5.3%. Banco Popular’s efficiency ratio worsened from 47.6% at December 31, 2010 to 50.5% at December 31, 2011, associated with the contraction in net interest margin explained in the net interest income subsection. The ratio of operating expenses before depreciation and amortization as a percentage of average earning assets improved from 5.1% in 2010 to 5.0% in 2011.
Non-operating income (expense)
Total net non-operating income (expense) increased by Ps 4.2 billion to Ps 57.2 billion for the year ended December 31, 2011, from a net non-operating income of Ps 53.0 billion for the year ended December 31, 2010, due to reversals of provisions.
Income tax expense
Income tax expense for Banco Popular increased by Ps 20.7 billion to Ps 177.5 billion for the year ended December 31, 2011. This increase was primarily due to higher income before income tax expense and non-controlling interest. Banco Popular’s effective tax rate, calculated before non-controlling interest, increased from 30.0% for the year ended December 31, 2010 to 32.0% for the year December 31, 2011, due to an increase in non-tax deductible expenses such as the Equity Tax (further explained in the “Results of operations for the year ended December 31, 2011 compared to the year ended December 31, 2010 – Grupo Aval”).
Non-controlling interest
Banco Popular’s non-controlling interest increased by Ps 1.2 billion to Ps 5.0 billion. Non-controlling interest is not a significant contributor to net income for Banco Popular, responsible for only 1.3% of net income before non-controlling interest for the year ended December 31, 2011.
Banco AV Villas
Net income
| | | | | | | |
| | | | | | | | | | # | | | | |
| | | (in Ps billions) | | | | |
Total interest income | | | 717.6 | | | | 683.1 | | | | 34.4 | | | | 5.0 | |
Total interest expense | | | (169.0 | ) | | | (142.8 | ) | | | 26.2 | | | | 18.3 | |
Net interest income | | | 548.6 | | | | 540.3 | | | | 8.3 | | | | 1.5 | |
Total provisions (reversals), net | | | (33.4 | ) | | | (122.4 | ) | | | (89.0 | ) | | | (72.7 | ) |
Total fees and other services income, net | | | 151.2 | | | | 140.5 | | | | 10.7 | | | | 7.6 | |
Total other operating income | | | 3.4 | | | | 9.7 | | | | (6.3 | ) | | | (65.2 | ) |
Total operating income | | | 669.7 | | | | 568.1 | | | | 101.6 | | | | 17.9 | |
Total operating expenses | | | (436.0 | ) | | | (389.8 | ) | | | 46.2 | | | | 11.8 | |
Net operating income | | | 233.8 | | | | 178.4 | | | | 55.4 | | | | 31.1 | |
Total non-operating income (expense), net | | | 7.1 | | | | 16.2 | | | | (9.1 | ) | | | (56.3 | ) |
| Income before income tax expense and non-controlling interest | | | 240.8 | | | | 194.5 | | | | 46.3 | | | | 23.8 | |
Income tax expense | | | (75.4 | ) | | | (49.9 | ) | | | 25.5 | | | | 51.2 | |
Income before non-controlling interest | | | 165.5 | | | | 144.7 | | | | 20.8 | | | | 14.4 | |
Non-controlling interest | | | (0.2 | ) | | | (0.4 | ) | | | (0.1 | ) | | | (39.1 | ) |
Net income attributable to shareholders | | | 165.2 | | | | 144.3 | | | | 20.9 | | | | 14.5 | |
Banco AV Villas’ net income attributable to its shareholders increased by 14.5% or Ps 20.9 billion to Ps 165.2 billion for the year ended December 31, 2011. The increase was primarily due to an increase in net interest income, in total fees and other service income, net and a decrease in net provisions, offset in part by an increase in total operating expense and an increase in income tax expense.
Net interest income
| | | | | | | |
| | | | | | | | | | # | | | | |
| | | (in Ps billions) | | | | |
| Interest income: | | | | | | | | | | | | | |
Interest on loans | | | 600.7 | | | | 573.7 | | | | 27.0 | | | | 4.7 | |
Interest on investment securities | | | 111.9 | | | | 103.5 | | | | 8.4 | | | | 8.1 | |
Interbank and overnight funds | | | 4.9 | | | | 6.0 | | | | (1.0 | ) | | | (17.2 | ) |
Financial leases | | | – | | | | – | | | | – | | | | – | |
Total interest income | | | 717.6 | | | | 683.1 | | | | 34.4 | | | | 5.0 | |
| Interest expense: | | | | | | | | | | | | | | | | |
Checking accounts | | | (0.7 | ) | | | (0.3 | ) | | | 0.4 | | | | 146.8 | |
Time deposits | | | (91.6 | ) | | | (85.7 | ) | | | 6.0 | | | | 7.0 | |
Savings deposits | | | (55.1 | ) | | | (38.3 | ) | | | 16.9 | | | | 44.0 | |
Total interest expense from deposits | | | (147.4 | ) | | | (124.2 | ) | | | 23.2 | | | | 18.7 | |
Borrowing from banks and others | | | (6.8 | ) | | | (5.1 | ) | | | 1.7 | | | | 34.1 | |
Interbank and overnight funds (expenses) | | | (14.8 | ) | | | (13.5 | ) | | | 1.2 | | | | 9.2 | |
Long-term debt (bonds) | | | – | | | | – | | | | – | | | | – | |
Total interest expense | | | (169.0 | ) | | | (142.8 | ) | | | 26.2 | | | | 18.3 | |
Net interest income | | | 548.6 | | | | 540.3 | | | | 8.3 | | | | 1.5 | |
Banco AV Villas’ net interest income increased by 1.5%, or Ps. 8.3 billion, from Ps 540.3 billion for the year ended December 31, 2010 to Ps 548.6 billion for the year ended December 31, 2011. This increase was primarily driven by a Ps 27.0 billion increase in the interest income from loans and a Ps 8.4 billion increase in interest income from investment securities, partially offset by an increase in interest expense of Ps 26.2 billion.
Interest earned on loans increased by 4.7%, or Ps. 27.0 billion, to Ps 600.7 billion for the year ended December 31, 2011. The increase in interest earned on loans was due to a 9.3%, or Ps 393.3 billion, growth on Banco AV Villas’ average loan portfolio to Ps 4,616.1 billion, which resulted in an increase of Ps 51.2 billion in interest income on loans. Partially off-setting the increase associated with a higher average loan portfolio was the decline in the average yield for loans from 13.6% for the year ended December 31, 2010 to 13.0% for the year ended December 31, 2011, which resulted in a Ps 24.1 billion decrease in interest income from loans. The decrease in the yield for loans reflects a declining rate environment in the second half of 2010 and early 2011, together with the strong growth of our loan portfolio during 2011. The average interest yield on loans and financial leases for Banco AV Villas was 13.2% during the last quarter of 2011 as previously discussed in “Results of operations for the year ended December 31, 2011 compared to the year ended December 31, 2010 – Grupo Aval – Net interest income.”
Interest income from investment securities increased by 8.1%, or Ps 8.4 billion, to Ps 111.9 billion for the year ended December 31, 2011. The fixed income portfolio generated Ps 111.8 billion, or 99.9%, of Banco AV Villas’ earnings on investment securities for the year ended December 31, 2011. The earnings from the fixed income portfolio for the year ended December 31, 2011 increased by 8.1%, or Ps 8.4 billion, primarily due to the increase in the average balance of the fixed income portfolio, partially offset by a decrease in the average yield driven by the increasing rate environment in Colombia. The equity portfolio generated the remaining Ps 0.1 billion, or 0.1%, of the interest income from investment securities.
The average yield earned on interest-earning assets decreased from 11.7% for the year ended December 31, 2010 to 11.2% for the year ended December 31, 2011, driven by the decrease in the average yield on loans and in the yield on investment securities.
Total interest expense increased by 18.3%, or Ps 26.2 billion, to Ps 169.0 billion for the year ended December 31, 2011. This increase was mainly driven by a Ps 16.9 billion increase in savings deposits and a Ps 6.0 billion increase in time deposits.
The increase in interest expense on savings deposits was driven by a 19.4%, or Ps. 471.5 billion, increase in the average balance of savings deposits to Ps 2,903.7 billion for the year ended December 31, 2011, which resulted in a Ps 9.0 billion increase in interest expense and an increase in the nominal interest rate paid from 1.6% for the year ended December 31, 2010 to 1.9% for the year ended December 31, 2011, and resulted in a Ps 7.9 billion increase in interest expense. The increase in the interest rate paid was consistent with the increase of the average DTF, explained in the Grupo Aval discussion.
The increase in interest expense on time deposits was driven by a 5.5%, or Ps 109.1 billion, increase in the average balance of time deposits to Ps 2,007.5 billion for the year ended December 31, 2011, which resulted in a Ps 4.8 billion increase in interest expense and a slight increase in the nominal interest rate paid from 4.35% for the year ended December 31, 2010 to 4.41% for the year ended December 31, 2011, and resulted in a Ps 1.1 billion
increase in interest expense. The increase in the interest rate paid was consistent with the increase of the average DTF explained in the Grupo Aval discussion.
For the reasons explained above, Banco AV Villas’ net interest margin decreased from 9.2% for the year ended December 31, 2010 to 8.5% for the year ended December 31, 2011. Similarly, the spread between the yield earned on its loans and financial leases and the cost of its interest-bearing liabilities decreased from 10.8% for the year ended December 31, 2010 to 10.0% for the year ended December 31, 2011.
Provisions
Total net provisions decreased by 72.7%, or Ps 89.0 billion, to Ps 33.4 billion for the year ended December 31, 2011. This decrease was primarily driven by a decrease in net provisions for loan and financial lease losses, the main component (by volume) of total net provisions, which decreased by 53.4%, or Ps 77.5 billion, to Ps 67.6 billion as a result of the improvement of Banco AV Villas’ credit quality. Banco AV Villas’ past due loans decreased by 7.8% to Ps 183.1 billion and its delinquency ratio improved from 4.5% at December 31, 2010 to 3.6% at December 31, 2011. This improvement was primarily a result of a reduction in past due commercial loans, which decreased by 24.9% to Ps 26.1 billion (with a drop in their delinquency ratio from 1.9% to 1.2%) and past due mortgage loans, which decreased by 10.9% to Ps 59.7 billion (with a drop in their delinquency ratio from 11.4% to 8.8%).
Charge-offs decreased by 24.8% to Ps 79.4 billion for the year ended December 31, 2011. Banco AV Villas’ charge-offs to average loans and financial leases ratio decreased from an annualized 2.4% for the year ended December 31, 2010 to 1.7% for the year ended December 31, 2011. Banco AV Villas’ net provisions for loan and financial lease losses decreased more than its charge-offs, which resulted in a 4.6% decrease in its allowance for loan and financial lease losses to Ps 243.7 billion at December 31, 2011. Even though there was a decrease in Banco AV Villas’ allowance, its coverage ratio increased from 128.7% at December 31, 2010 to 133.1% at December 31, 2011.
Net provisions for accrued interest and other receivables increased by Ps 4.4 billion to Ps 7.1 billion for the year ended December 31, 2011, due to a decrease of approximately Ps 3.0 billion in recoveries of Colombian Treasury Bonds.
Net provisions for foreclosed assets and other assets increased by Ps 0.5 billion to Ps (1.0) billion (indicating a recovery of Ps 1.0 billion) for the year ended December 31, 2011. Gross provisions for foreclosed assets and other assets increased by Ps 0.4 billion to Ps 2.8 billion, and reversals of provisions for foreclosed and other assets decreased by Ps 0.1 billion to Ps 3.8 billion.
The recovery of charged-off assets increased by Ps 16.5 billion to Ps 40.2 billion, primarily as a result of the improving Colombian economy and a more effective recovery effort by Banco AV Villas.
Total fees and other services income, net
| | | | | | | |
| | | | | | | | | | # | | | | |
| | | (in Ps billions) | | | | |
| Fees and other services income: | | | | | | | | | | | | | |
Commissions from banking services | | | 143.8 | | | | 146.8 | | | | (3.0 | ) | | | (2.0 | ) |
Branch network services | | | – | | | | – | | | | – | | | | – | |
Credit card merchant fees | | | 11.1 | | | | 8.8 | | | | 2.3 | | | | 26.1 | |
Checking fees | | | 4.2 | | | | – | | | | 4.2 | | | | – | |
Warehouse services | | | – | | | | – | | | | – | | | | – | |
Fiduciary activities | | | – | | | | – | | | | – | | | | – | |
Pension plan administration | | | – | | | | – | | | | – | | | | – | |
Other | | | 39.7 | | | | 28.9 | | | | 10.8 | | | | 37.3 | |
Total fees and other services income | | | 198.7 | | | | 184.5 | | | | 14.2 | | | | 7.7 | |
Fees and other services expenses | | | (47.5 | ) | | | (43.9 | ) | | | 3.6 | | | | 8.1 | |
Total fees and other services income, net | | | 151.2 | | | | 140.5 | | | | 10.7 | | | | 7.6 | |
Total net fees and other services income increased by 7.6%, or Ps 10.7 billion, to Ps 151.2 billion for the year ended December 31, 2011. This was primarily due to a Ps 10.8 billion increase in “Other,” including fees received from social security payments and a Ps 4.2 billion increase in checking fees. This was partially offset by a Ps 3.6 billion increase in fees and other services expenses and a Ps 3.0 billion decrease in commissions from banking services.
Other operating income
| | | | | | | |
| | | | | | | | | | # | | | | |
| | | (in Ps billions) | | | | |
Foreign exchange gains (losses), net | | | 0.6 | | | | (0.7 | ) | | | 1.3 | | | | 181.1 | |
Gains on derivative operations, net | | | (0.3 | ) | | | 1.8 | | | | (2.0 | ) | | | (114.3 | ) |
| Gains on sales of investments in equity securities, net | | | – | | | | – | | | | – | | | | – | |
Income from non-financial sector, net | | | – | | | | – | | | | – | | | | – | |
Dividend income | | | 3.0 | | | | 2.5 | | | | 0.5 | | | | 20.7 | |
Other | | | 0.0 | | | | 6.2 | | | | (6.2 | ) | | | (99.7 | ) |
Other operating income | | | 3.4 | | | | 9.7 | | | | (6.3 | ) | | | (65.2 | ) |
Total other operating income decreased by 65.2% or Ps 6.3 billion to Ps 3.4 billion for the year ended December 31, 2011. This decrease was mainly driven by a non-recurring income registered in December 2010 associated with the sale of Ps 149.6 billion of the mortgage loan portfolio.
Operating expenses
| | | | | | | |
| | | | | | | | | | # | | | | |
| | | (in Ps billions) | | | | |
Salaries and employee benefits | | | (144.9 | ) | | | (136.4 | ) | | | 8.5 | | | | 6.2 | |
Bonus plan payments | | | (1.9 | ) | | | (1.6 | ) | | | 0.3 | | | | 19.1 | |
Termination payments | | | (1.4 | ) | | | (2.0 | ) | | | (0.6 | ) | | | (29.8 | ) |
Administrative and other expenses | | | (247.7 | ) | | | (217.6 | ) | | | 30.2 | | | | 13.9 | |
Deposit security, net | | | (16.5 | ) | | | (14.6 | ) | | | 2.0 | | | | 13.4 | |
Charitable and other donation expenses | | | (4.0 | ) | | | (0.5 | ) | | | 3.6 | | | | 759.5 | |
Depreciation | | | (19.6 | ) | | | (17.3 | ) | | | 2.3 | | | | 13.3 | |
Goodwill amortization | | | – | | | | – | | | | – | | | | – | |
Total operating expenses | | | (436.0 | ) | | | (389.8 | ) | | | 46.2 | | | | 11.8 | |
Total operating expenses for the year ended December 31, 2011 increased by 11.8%, or Ps 46.2 billion, to Ps 436.0 billion. Administrative and other expenses increased by Ps 30.2 billion to Ps 247.7 billion, principally driven by an increase in the Equity Tax (further explained in the “Results of operations for the year ended December 31, 2011 compared to the year ended December 31, 2010 – Grupo Aval”) and also related to the organic growth of the business and managing Banco AV Villas’ larger loan portfolio. Salaries and employee benefits increased by Ps 8.5 billion, or 6.2%, to Ps 144.9 billion, which was partially explained by the growth in the number of Banco AV Villas’ employees from 6,064 on December 31, 2010 to 6,160 on December 31, 2011. On a per capita basis, salary and employee benefits increased by 4.6%. Charitable and other donation expenses increased by Ps 3.6 billion, due to a Ps 4.0 billion donation made by Banco AV Villas for the flood victims in Colombia during the year ended December 31, 2011. Banco AV Villas’ efficiency ratio worsened at December 31, 2011 as compared to December 31, 2010, increasing from 53.9% to 59.2%, associated with the contraction in net interest margin explained in the net interest income subsection. The ratio of operating expenses before depreciation and amortization as a percentage of average earning assets was 6.4% in 2010 and 6.5% in 2011.
Non-operating income (expense)
Total non-operating income (expense) decreased by Ps 9.1 billion to Ps 7.1 billion for the year ended December 31, 2011. This decrease was driven by a Ps 9.7 billion decrease in non-operating income and a Ps 0.6 billion decrease in non-operating expenses due to lower recoveries from estimated liabilities, such as tax provisions and compensation provisions, in 2011 than in 2010.
Income tax expense
Income tax expense increased by Ps 25.5 billion to Ps 75.4 billion for the year ended December 31, 2011. This was primarily due to higher income before income tax expense and non-controlling interest. The effective tax rate increased from 25.6% for the year ended December 31, 2010 to 31.3% for the year ended December 31, 2011. This increase was driven by higher non-tax deductible expenses, such as the Equity Tax (recorded in administrative and other expenses), and lower non-taxable revenues in 2011 than in 2010.
Non-controlling interest
Banco AV Villas’ non-controlling interest, responsible for only 0.1% of its net income before non-controlling interest for the year ended December 31, 2011, decreased by Ps 0.1 billion from Ps 0.4 billion for the year ended December 31, 2010. Banco AV Villas’ non-controlling interest reflects other Grupo Aval banks’ ownership in A Toda Hora S.A. See “Item 4. Information on the Company—Business overview—Banco AV Villas.”
Segment results of operations for the year ended December 31, 2010 compared to the year ended December 31, 2009
Banco de Bogotá
Net income
| | | | | | | |
| | | | | | | | | | # | | | | |
| | | (in Ps billions) | | | | |
Total interest income | | | 3,345.6 | | | | 3,614.1 | | | | (268.5 | ) | | | (7.4 | ) |
Total interest expense | | | (902.1 | ) | | | (1,297.1 | ) | | | (395.0 | ) | | | (30.5 | ) |
Net interest income | | | 2,443.5 | | | | 2,317.0 | | | | 126.5 | | | | 5.5 | |
Total net provisions | | | (610.6 | ) | | | (347.8 | ) | | | 262.8 | | | | 75.6 | |
Total fees and other services income, net | | | 1,155.1 | | | | 1,075.6 | | | | 79.4 | | | | 7.4 | |
Total other operating income | | | 582.4 | | | | 492.1 | | | | 90.3 | | | | 18.4 | |
Total operating income | | | 3,570.3 | | | | 3,536.9 | | | | 33.4 | | | | 0.9 | |
Total operating expenses | | | (1,757.9 | ) | | | (1,585.3 | ) | | | 172.6 | | | | 10.9 | |
Net operating income | | | 1,812.4 | | | | 1,951.6 | | | | (139.2 | ) | | | (7.1 | ) |
Total non-operating income (expense), net | | | 96.0 | | | | 78.0 | | | | 17.9 | | | | 23.0 | |
| Income before income tax expense and non-controlling interest | | | 1,908.3 | | | | 2,029.6 | | | | (121.3 | ) | | | (6.0 | ) |
Income tax expense | | | (510.0 | ) | | | (522.7 | ) | | | (12.7 | ) | | | (2.4 | ) |
Income before non-controlling interest | | | 1,398.3 | | | | 1,506.9 | | | | (108.5 | ) | | | (7.2 | ) |
Non-controlling interest | | | (483.4 | ) | | | (551.1 | ) | | | (67.7 | ) | | | (12.3 | ) |
Net income attributable to shareholders | | | 914.9 | | | | 955.8 | | | | (40.9 | ) | | | (4.3 | ) |
Banco de Bogotá’s net income attributable to its shareholders decreased by 4.3% to Ps 914.9 billion in 2010. This decrease primarily reflected an increase in provisions established by Corficolombiana for its investment securities portfolio and an increase in operating expenses, partially offset by an increase in net interest income and total other operating income (primarily reflecting the sale of certain equity investments by Corficolombiana). As a result of these factors, Banco de Bogotá’s efficiency ratio deteriorated slightly from 39.0% in 2009 to 40.1% in 2010.
Net interest income
| | | | | | | |
| | | | | | | | | | # | | | | |
| | | (in Ps billions) | | | | |
| Interest income: | | | | | | | | | | | | | |
Interest on loans | | | 2,040.9 | | | | 2,439.3 | | | | (398.3 | ) | | | (16.3 | ) |
Interest on investment securities | | | 1,156.7 | | | | 1,002.9 | | | | 153.9 | | | | 15.3 | |
Interbank and overnight funds | | | 67.8 | | | | 69.0 | | | | (1.1 | ) | | | (1.7 | ) |
Financial leases | | | 80.1 | | | | 102.9 | | | | (22.8 | ) | | | (22.2 | ) |
Total interest income | | | 3,345.6 | | | | 3,614.1 | | | | (268.5 | ) | | | (7.4 | ) |
| Interest expense: | | | | | | | | | | | | | | | | |
Checking accounts | | | (22.4 | ) | | | (32.0 | ) | | | (9.5 | ) | | | (29.8 | ) |
Time deposit | | | (374.0 | ) | | | (644.7 | ) | | | (270.8 | ) | | | (42.0 | ) |
Savings deposits | | | (290.4 | ) | | | (393.7 | ) | | | (103.4 | ) | | | (26.2 | ) |
Total interest expense on deposits | | | (686.8 | ) | | | (1,070.4 | ) | | | (383.6 | ) | | | (35.8 | ) |
Borrowing from banks and others | | | (62.2 | ) | | | (94.8 | ) | | | (32.6 | ) | | | (34.4 | ) |
Interbank and overnight funds (expenses) | | | (86.6 | ) | | | (79.4 | ) | | | 7.1 | | | | 9.0 | |
Long-term debt (bonds) | | | (66.6 | ) | | | (52.4 | ) | | | 14.1 | | | | 27.0 | |
Total interest expense | | | (902.1 | ) | | | (1,297.1 | ) | | | (395.0 | ) | | | (30.5 | ) |
Net interest income | | | 2,443.5 | | | | 2,317.0 | | | | 126.5 | | | | 5.5 | |
Banco de Bogotá’s net interest income increased by 5.5% to Ps 2,443.5 billion in 2010. This was due to the fact that the bank was able to reduce its total interest expense by more than the decline in its total interest income. Total interest expense decreased by 30.5% to Ps 902.1 billion, which reflected decreased average cost of funding, primarily for time deposits, in a declining interest rate environment. The nominal interest rate paid on interest-bearing liabilities declined from an average of 5.7% in 2009 to 3.2% in 2010, which resulted in a Ps 530.2 billion decrease in interest expense. This decrease was partially offset by a 21.7% increase in the balance of average interest-bearing liabilities to Ps 27,939.0 billion (primarily reflecting increased savings deposits and interbank and overnight funds) in 2010, which was responsible for a Ps 135.3 billion increase in interest expense.
The decline in interest expense was partially offset by a 7.4% decrease in total interest income to Ps 3,345.6 billion. Total interest income fell mainly due to a decrease in interest income from loans and financial leases, which declined by 16.6% to Ps 2,121.0 billion. This primarily reflected a decrease in yield, especially from commercial loans (78.8% of Banco de Bogotá’s total gross loans and financial lease portfolio at December 31, 2010 from our Colombian operations), which as explained in the Grupo Aval 2010-2009 discussion, were particularly impacted by the declining interest rate environment. The decrease in the yield of loans and financial leases from 13.2% in 2009 to 9.9% in 2010 resulted in a Ps 601.8 billion decrease in interest income from loans and financial leases. Partly offsetting this decrease in interest income was the 11.5% growth of Banco de Bogotá’s average loan and financial lease portfolio, primarily in corporate and consumer loans, to Ps 21,407.8 billion. The growth in the balance of this portfolio resulted in an increase of Ps 180.6 billion in interest income.
Partially offsetting the decline in interest income from loans and financial leases was the increase in income from investment securities, which increased by 15.3% to Ps 1,156.7 billion in 2010. The equity portfolio generated Ps 679.8 billion in income in 2010, up 29.7% from the Ps 524.3 billion produced in 2009, mainly as a result of the fact that Corficolombiana realized greater income from the appreciation of its equity portfolio in 2010 than in 2009 (further explained in the Corficolombiana 2010-2009 discussion). The fixed income portfolio generated the remaining Ps 476.5 billion of interest income from investment securities, reflecting gains resulting from the declining interest rate environment as well as interest accrued on the portfolio. The income generated by the fixed income portfolio in 2010 was 0.4% lower than the fixed income earnings in 2009, which were Ps 478.6 billion. Despite the fact that the market environment for fixed income was more favorable in 2009, as can be seen by the performance of Grupo Aval’s other banking subsidiaries’ fixed income portfolios, Banco de Bogotá was able to generate very similar returns by increasing the volume of its fixed income investments; its balance of fixed income investments increased from Ps 7,123.3 billion at December 31, 2009 to 9,378.9 billion at December 31, 2010 (a portion of this increase was attributable to the BAC acquisition, which added Ps 1,360.9 billion in fixed income investments). Banco de Bogotá consolidated BAC Credomatic’s financials from December 1, 2010.
As a result of the aforementioned factors, Banco de Bogotá’s net interest margin decreased from 8.4% in 2009 to 7.4% in 2010. Similarly, the spread between the yield earned on its loans and financial leases and the cost of its interest-bearing liabilities decreased from 7.6% in 2009 to 6.7% in 2010.
Provisions
Despite the improvement of Banco de Bogotá’s credit quality, total net provisions increased by 75.6% to Ps 610.6 billion in 2010, driven primarily by the growth of net provisions for foreclosed assets and other assets, which increased by Ps 303.1 billion to Ps 320.7 billion. This increase was due to provisions established by Corficolombiana associated with the realization of income from several of its equity security investments (further explained in the Corficolombiana 2010-2009 discussion).
Unlike provisions for foreclosed assets and other assets, net provisions for loan and financial lease losses decreased slightly, declining by 1.6% to Ps 286.6 billion, which was consistent with the fact Banco de Bogotá’s credit quality improved. Despite the fact that Banco de Bogotá’s past due loans at December 31, 2010 exhibited a 43.2% growth to Ps 827.0 billion, this was entirely due to the BAC Credomatic acquisition. Removing BAC Credomatic’s impact, Banco de Bogotá’s past due loans at December 31, 2010 decreased by 11.2% to Ps 513.1 billion. Banco de Bogotá’s delinquency ratio decreased from 2.9% at December 31, 2009 to 2.5% at December 31, 2010, due to the BAC Credomatic acquisition and was 2.2% for the Colombian operations. The slightly higher
delinquency ratio with BAC is due primarily to BAC having a higher balance of past due credit card loans, which was expected as a result of BAC’s focus on the credit card business.
Charge-offs increased by 31.1% to Ps 245.7 billion in 2010, and Ps 17.5 billion (or 9.4%) of this growth was due to the acquisition of BAC. The remaining Ps 228.2 billion (or 21.7%) portion of the increase was primarily due to an increase in Banco de Bogotá’s Colombian loan portfolio (total gross loans grew by 18.7% from 2009 to 2010). As a result, despite the 31.1% increase in charge-offs, Banco de Bogotá’s charge-offs to average loan ratio increased only marginally, from 1.0% in 2009 to 1.1% in 2010.
Banco de Bogotá’s allowance for loan and financial lease losses increased by 34.7% to Ps 1,030.7 billion at December 31, 2010. This increase was primarily due to the acquisition of BAC which resulted in Banco de Bogotá’s past due loans growing at a faster pace and its coverage ratio decreasing from 132.5% at December 31, 2009 to 124.6% at December 31, 2010. The lower coverage ratio is due to the fact that BAC proportionally contributed more in past due loans than in allowance, which was expected considering 30.3% of BAC’s gross loan portfolio was concentrated in mortgage loans, which require lower allowances than other types of loans. In its Colombian operations, Banco de Bogotá’s net provisions for loan and financial lease losses were greater than its charge-offs, which resulted in a 7.7% increase in its allowance for loan financial lease losses attributable to its Colombian operations to Ps 824.4 billion at December 31, 2010. This growth combined with the decrease in past due loans in its Colombian operations, resulted in the increase of its coverage ratio of its Colombian operations from 132.5% at December 31, 2009 to 160.7% at December 31, 2010.
Also partially offsetting the increase in provisions for foreclosed assets and other assets was a decrease in net provisions for accrued interest and other receivables, which declined by 47.0% from Ps 62.2 billion to Ps 33.0 billion. This drop was a result of the aforementioned improvement in the Colombian economy.
The recovery of charged-off assets increased by Ps 6.4 billion to Ps 29.6 billion primarily as a result of a slightly more successful recovery effort by Banco de Bogotá.
Total fees and other services income
| | | | | | | |
| | | | | | | | | | # | | | | |
| | | (in Ps billions) | | | | |
| Fees and other services income: | | | | | | | | | | | | | |
Commissions from banking services | | | 557.9 | | | | 508.8 | | | | 49.1 | | | | 9.6 | |
Branch network services | | | 22.2 | | | | 19.5 | | | | 2.6 | | | | 13.5 | |
Credit card merchant fees | | | 70.3 | | | | 46.8 | | | | 23.5 | | | | 50.1 | |
Checking fees | | | 42.0 | | | | 43.3 | | | | (1.3 | ) | | | (3.0 | ) |
Warehouse services | | | 92.2 | | | | 91.8 | | | | 0.4 | | | | 0.5 | |
Fiduciary activities | | | 98.3 | | | | 93.0 | | | | 5.3 | | | | 5.7 | |
Pension plan administration | | | 408.3 | | | | 399.2 | | | | 9.1 | | | | 2.3 | |
Other | | | 37.1 | | | | 24.5 | | | | 12.6 | | | | 51.5 | |
Total fees and other services income | | | 1,328.2 | | | | 1,226.9 | | | | 101.4 | | | | 8.3 | |
Fees and other services expenses | | | (173.2 | ) | | | (151.2 | ) | | | 21.9 | | | | 14.5 | |
Total fees and other services income, net | | | 1,155.1 | | | | 1,075.6 | | | | 79.4 | | | | 7.4 | |
Total net fees and other services income increased by 7.4% to Ps 1,155.1 billion in 2010, primarily as a result of higher commissions from banking services and increased credit card merchant fees. As explained in the Grupo Aval 2010-2009 discussion, the acquisition of BAC Credomatic and the income it contributed in 2010 were a major factor in these increases. Specifically, BAC Credomatic contributed Ps 37.9 billion in commissions from banking services and Ps 18.6 billion in credit card merchant fees, while adding approximately Ps 7.2 billion in fee expenses. The additional increase in commissions from banking services was due to increased interest-bearing deposits and higher income generated by social security payments. The 2.3% increase in pension plan administration fees is a result of higher income produced by Porvenir, which is further explained in the Porvenir 2010-2009 discussion. The Ps 12.6 billion increase in “Other” fees is primarily attributable to a Ps 9.7 billion increase in income generated by Casa de
Bolsa, Banco de Bogotá’s brokerage subsidiary. This increase in income was primarily due to the fact that in October 2009 Valores Bogotá merged with Valores Occidente and the other brokerage subsidiaries of Grupo Aval to form Casa de Bolsa, an entity which is consolidated by Banco de Bogotá; thus, while 2009 only reflected three months of such combined company’s income, 2010 reflected a full year.
Other operating income
| | | | | | | |
| | | | | | | | | | # | | | | |
| | | (in Ps billions) | | | | |
Foreign exchange gains (losses), net | | | 32.6 | | | | (114.1 | ) | | | 146.7 | | | | 128.5 | |
Gains on derivative operations, net | | | 63.6 | | | | 228.3 | | | | (164.7 | ) | | | (72.2 | ) |
| Gains on sales of investments in equity securities, net | | | 112.1 | | | | 4.0 | | | | 108.1 | | | | 2677.7 | |
Income from non-financial sector, net (1) | | | 289.8 | | | | 231.2 | | | | 58.5 | | | | 25.3 | |
Dividend income | | | 44.1 | | | | 84.5 | | | | (40.3 | ) | | | (47.8 | ) |
Other | | | 40.3 | | | | 58.2 | | | | (17.9 | ) | | | (30.8 | ) |
Total other operating income | | | 582.4 | | | | 492.1 | | | | 90.3 | | | | 18.4 | |
| (1) | Income from non-financial sector reflects Corficolombiana’s (Banco de Bogotá’s subsidiary) operating results in its consolidated investments in companies not related to the financial sector such as Epiandes, Hoteles Estelar and Organización Pajonales, among others. This result is net of the following operating and administrative expenses for the year ended December 31, 2010 and 2009: Ps 644.3 billion and Ps 549.2 billion , respectively. For a description of these investments, see “Item 4. Information on the Company—B. Business overview—Corficolombiana—Equity investment portfolio.” |
Total other operating income, net increased by 18.4% to Ps 582.4 billion in 2010 due primarily to a Ps 108.1 billion increase in gains on sales of investments in equity securities, resulting primarily from Corficolombiana’s sale of its stake in Banco de Occidente and Colombina S.A. (further explained in Corficolombiana’s 2010-2009 discussion under the “Other operating income” section). The 25.3% increase in income from the non-financial sector to Ps 289.8 billion, which reflected the net income growth of non-financial companies consolidated by Corficolombiana (further explained in the Corficolombiana 2010-2009 discussion), also contributed to the increase in other operating income.
Partially offsetting the increase was a 47.8% decrease in dividend income to Ps 44.1 billion. This principally reflects an accounting convention regarding how dividend income for a few of Corficolombiana’s unconsolidated investments was recorded (see Corficolombiana 2010 – 2009 discussion for further information). The 30.8% decrease in “Other” other operating income to Ps 40.3 billion also contributed to the decline in other operating income. This stemmed primarily from a decrease in income from jointly managed fiduciary contracts belonging to Fidubogotá, Banco de Bogotá’s fiduciary subsidiary. In particular, the contract to manage FONPET (jointly managed with Porvenir), a third party liability fund, generated less income due to the fact that fees on the management of this fund depend upon the yield of the fund, which was lower in 2010 as compared to 2009 due to more challenging market conditions. Foreign exchange gains (losses) and gains on derivative operations, which are related, netted a decrease of Ps 18.0 billion. This was primarily due to the operations at the level of Corficolombiana (see Corficolombiana 2010 – 2009 discussion for further information).
Operating expenses
| | | | | | | |
| | | | | | | | | | # | | | | |
| | | (in Ps billions) | | | | |
Salaries and employee benefits | | | (612.3 | ) | | | (539.8 | ) | | | 72.5 | | | | 13.4 | |
Bonus plan payments | | | (19.6 | ) | | | (19.8 | ) | | | (0.3 | ) | | | (1.3 | ) |
Termination payments | | | (5.8 | ) | | | (2.8 | ) | | | 3.0 | | | | 107.6 | |
Administrative and other expenses | | | (968.3 | ) | | | (891.8 | ) | | | 76.5 | | | | 8.6 | |
Deposit security, net | | | (68.3 | ) | | | (59.1 | ) | | | 9.2 | | | | 15.5 | |
Charitable and other donation expenses | | | (4.0 | ) | | | (2.3 | ) | | | 1.6 | | | | 69.5 | |
Depreciation | | | (57.8 | ) | | | (51.9 | ) | | | 5.9 | | | | 11.4 | |
Goodwill amortization | | | (21.8 | ) | | | (17.8 | ) | | | 4.1 | | | | 22.9 | |
Total operating expenses | | | (1,757.9 | ) | | | (1,585.3 | ) | | | 172.6 | | | | 10.9 | |
Total operating expenses increased by 10.9% to Ps 1,757.9 billion in 2010. This increase primarily reflected a 13.4% rise in salaries and employee benefits to Ps 612.3 billion, which was in line with the organic growth of the business and also included BAC Credomatic’s personnel expenses in December 2010. Salaries and employee benefits from Banco de Bogotá’s Colombian operations increased by 6.8% to Ps 576.7 billion for 2010, while headcount grew by 1.7% from 16,811 at December 31, 2009 to 17,095 at December 31, 2010. As a result, on a per capita basis, salaries and employee benefits for Banco de Bogotá without BAC increased by 5.1%. BAC Credomatic’s headcount at December 31, 2010 was 15,775. The 8.6% increase in administrative and other expenses to Ps 968.3 billion was primarily due to the BAC Credomatic acquisition. As a result of both the slight increase in operating expenses and the decrease in operating income, Banco de Bogotá’s efficiency ratio deteriorated from 39.0% in 2009 to 40.1% in 2010.
Non-operating income (expense)
Total non-operating income (expense) increased by 23.0% to Ps 96.0 billion primarily due to Ps 21.4 billion in income from the sale of foreclosed assets. Of this income, Ps 17.6 billion was due to the sale of land in Guayuriba.
Income tax expense
Income tax expense was Ps 510.0 billion in 2010, which was 2.4% lower than in 2009. Banco de Bogotá’s effective tax rate increased slightly in 2010, rising to 26.7% from 25.8% in 2009. The effective tax rate increased primarily due to the fact that its non-taxable dividend income associated with Corficolombiana’s unconsolidated investments decreased by 47.8%, or Ps 40.3 billion, for the reasons further explained in the “Other operating income” section.
Non-controlling interest
Banco de Bogotá’s non-controlling interest decreased by Ps 67.7 billion, or 12.3%, in 2010. The decrease in non-controlling interest was primarily due to the fact that net income before non-controlling interest was lower, but it should be noted that non-controlling interest as a percent of net income before non-controlling interest also decreased, dropping from 36.6% to 34.6%. This was primarily a result of Corficolombiana contributing a greater percentage of net income before non-controlling interest in 2009 as compared to 2010 (Ps 668.4 billion as compared to Ps 564.8 billion, respectively).
Banco de Bogotá subsidiary analysis
As discussed above, Banco de Bogotá’s results of operations are significantly affected by the results of operations of its subsidiaries, Corficolombiana and Porvenir. In order to fully disclose the impact of these subsidiaries on Banco de Bogotá, set forth below is an analysis of the results of operations of each of Corficolombiana and Porvenir for 2010 as compared to 2009.
Corficolombiana
Net income
| | | | | | | |
| | | | | | | | | | # | | | | |
| | | (in Ps billions) | | | | |
Total interest income | | | 858.3 | | | | 716.5 | | | | 141.8 | | | | 19.8 | |
Total interest expense | | | (161.8 | ) | | | (181.1 | ) | | | (19.2 | ) | | | (10.6 | ) |
Net interest income | | | 696.5 | | | | 535.4 | | | | 161.0 | | | | 30.1 | |
Total provisions (reversals), net | | | (321.6 | ) | | | (7.7 | ) | | | 313.9 | | | | – | |
Total fees and other services income, net | | | 43.6 | | | | 40.1 | | | | 3.6 | | | | 8.9 | |
Total other operating income | | | 435.2 | | | | 356.2 | | | | 79.0 | | | | 22.2 | |
Total operating income | | | 853.7 | | | | 924.0 | | | | (70.3 | ) | | | (7.6 | ) |
Total operating expenses | | | (118.8 | ) | | | (118.4 | ) | | | 0.4 | | | | 0.3 | |
Net operating income | | | 734.9 | | | | 805.7 | | | | (70.7 | ) | | | (8.8 | ) |
Total non-operating income (expense), net | | | (3.2 | ) | | | 9.3 | | | | (12.5 | ) | | | (134.1 | ) |
| Income before income tax expense and non-controlling interest | | | 731.8 | | | | 815.0 | | | | (83.2 | ) | | | (10.2 | ) |
Income tax expense | | | (104.2 | ) | | | (97.0 | ) | | | 7.2 | | | | 7.4 | |
Income before non-controlling interest | | | 627.6 | | | | 718.0 | | | | (90.4 | ) | | | (12.6 | ) |
Non-controlling interest | | | (62.8 | ) | | | (49.6 | ) | | | 13.2 | | | | 26.7 | |
Net income attributable to shareholders | | | 564.8 | | | | 668.4 | | | | (103.6 | ) | | | (15.5 | ) |
Corficolombiana’s net income decreased by 15.5% to Ps 564.8 billion in 2010. The main reason for this decrease in net income was an increase in total net provisions, specifically in provisions for its unconsolidated equity security investments. Nevertheless, since Corficolombiana’s operating income before provisions increased, while its operating expenses remained essentially unchanged, its efficiency ratio improved from 12.4% in 2009 to 9.8% in 2010.
Net interest income
Corficolombiana’s net interest income increased by 30.1% to Ps 696.5 billion in 2010. Total interest income, which consists of income from loans, investment securities, interbank and overnight funds and financial leases, increased by 19.8% to Ps 858.3 billion in 2010. This increase was primarily due to the 21.9% rise in income from investment securities from Ps 618.3 billion in 2009 to Ps 753.9 billion in 2010. The increase in income from investment securities was due to a growth in income from the equity securities portfolio, which was partially offset by a marginal decrease in income from the fixed income portfolio in 2010.
Corficolombiana’s equity portfolio generated Ps 616.3 billion in income in 2010, which represented a 29.9% increase from the Ps 474.5 billion produced in 2009. This income was mainly comprised of the Ps 594.2 billion associated with the appreciation and reclassification of certain investments in Corficolombiana’s equity portfolio, in particular Empresa de Energía de Bogotá (EEB), Sociedad de Inversiones en Energía S.A. (SIE), and Banco de Occidente, which are publicly traded companies in Colombia.
Over the course of 2010, Corficolombiana’s investment in Empresa de Energía de Bogotá (EEB), which was classified as “trading” until late December 2010, generated Ps 209.0 billion of income. Prior to December 2010, if an equity security was classified by the Bolsa de Valores de Colombia (BVC; Colombian Stock Exchange) as either “medium” or “high” liquidity, the Superintendency of Finance required the owner of the security to classify the investment as “trading.” However, in late December 2010 the Superintendency of Finance issued a statement allowing corporaciones financieras (finance corporations), such as Corficolombiana, to reclassify certain “medium” or “high” liquidity equity securities to “available for sale” from “trading” if the Board of Directors of those institutions deemed those investments of a long-term, strategic nature. The Board of Directors deemed Corficolombiana’s investment in EEB as a long-term, strategic investment, and as a result in December 2010 it was
reclassified as “available for sale.” The impact of this reclassification going forward is that Corficolombiana will treat EEB as it does all of its “available for sale” investments.
In February 2010, Corficolombiana reclassified its investment in the shares of Sociedad de Inversiones en Energía S.A. (SIE) from “available for sale” to “trading” because the BVC reclassified SIE’s stock from “low” to “medium” liquidity. At that time, Colombian law established by the Superintendency of Finance mandated (in accordance with External Circular 100 of 1995, Chapter 1, numeral 4.2) that when the BVC increased the liquidity classification of a stock, if it was held as “available for sale,” the owner of the investment must reclassify the shares as “trading” and recognize the gains / losses associated with these shares that had previously been recorded as “unrealized net gains on investments” in order to reflect the appropriate value of the investment. In 2010, Corficolombiana realized Ps 196.5 billion in income from its investment in SIE (corresponding to the net unrealized gains at February 2010 plus the net mark-to-market gains generated post-February 2010). At December 31, 2010, this investment continued to be classified as “trading.”
Finally, in June 2010, due to the share-exchange merger between Banco de Occidente and Leasing de Occidente (of which Corficolombiana was the largest shareholder with a 45.2% stake), Corficolombiana was left with a 6.1% stake in Banco de Occidente classified as “available for sale”—the transaction is further explained in the Banco de Occidente 2010-2009 discussion. In October 2010, Corficolombiana sold 2.56 million shares of Banco de Occidente, or 1.71%, for a realized net gain of Ps 62.3 billion—this income was recorded under “Other operating income” under the line-item “Gains on sales of equity securities.” In November 2010, the BVC reclassified Banco de Occidente’s shares from “low” to “medium” liquidity, and as a result of this reclassification, Corficolombiana was required to realize the Ps 173.8 billion in income that was previously recorded as “unrealized net gains on investments” for its 4.42% stake in Banco de Occidente (its remaining share ownership in Banco de Occidente after the 1.71% sale in October 2010). The income generated by this reclassification, as well as the Ps 0.7 billion generated from mark-to-market gains following this reclassification, is ultimately eliminated from Grupo Aval’s consolidated statement of income because Grupo Aval consolidates Banco de Occidente in its financial statements, and thus, already reflects the value of its investment. In December 2010, Corficolombiana sold 0.60 million shares of Banco de Occidente, or 0.40%. In contrast with the sale in October, no gains were generated under “Other operating income” under the line-item “Gains on sales of equity securities” because its Banco de Occidente investment had been marked-to-market since the November 2010 reclassification to “trading.” At December 31, 2010, this investment continued to be classified as “trading.”
Corficolombiana’s fixed income portfolio generated Ps 137.56 billion of income in 2010 due primarily to gains arising from the declining interest rate environment. While this was a relatively high figure for Corficolombiana, it was 2.7% less than the Ps 141.3 billion generated in 2009, which as previously mentioned, reflected an even steeper decline in interest rates.
Corficolombiana’s interest expense decreased by 10.6% to Ps 161.8 billion in 2010, primarily due to a Ps 16.3 billion, or 17.9%, decrease in interest expense on time deposits to Ps 74.7 billion. Again, the reduction in interest expense was primarily a result of the previously discussed declining interest rate environment.
Provisions
Corficolombiana’s net provisions increased by Ps 313.9 billion to Ps 321.6 billion in 2010. This increase was mainly attributable to a Ps 245.1 billion cautionary market risk provision established by Corficolombiana in December, after discussion with the Superintendency of Finance, in order to cover risks associated with potential future fluctuations of the share prices of the equity securities portfolio.
Corficolombiana also recorded a Ps 69.8 billion net provision in 2010 under the provisions for foreclosed assets and other assets line-item, with the permission of the Superintendency of Finance, related to the previously mentioned realization of income stemming from its investment in SIE. Given that SIE recently began trading publicly on October 8, 2009, Corficolombiana established a provision in order to moderate the impact of potential future fluctuations in its price.
Total fees and other services income
| | | | | | | |
| | | | | | | | | | # | | | | |
| | | (in Ps billions) | | | | |
| Fees and other services income: | | | | | | | | | | | | | |
Commissions from banking services | | | 4.4 | | | | 3.6 | | | | 0.8 | | | | 22.5 | |
Fiduciary activities | | | 33.8 | | | | 34.3 | | | | (0.5 | ) | | | (1.6 | ) |
Other | | | 12.4 | | | | 10.8 | | | | 1.6 | | | | 14.7 | |
Total fees and other services income | | | 50.6 | | | | 48.7 | | | | 1.9 | | | | 3.8 | |
Fees and other services expenses | | | (6.9 | ) | | | (8.6 | ) | | | (1.7 | ) | | | (19.8 | ) |
Total fees and other services income, net | | | 43.6 | | | | 40.1 | | | | 3.6 | | | | 8.9 | |
Net fee and other services income increased by 8.9% to Ps 43.6 billion in 2010. While the fiduciary business produced marginally less income, this decrease was more than compensated by an increase in commissions from banking services and a decrease in fee expenses and other service expenses.
Other operating income
| | | | | | | |
| | | | | | | | | | # | | | | |
| | | (in Ps billions) | | | | |
Foreign exchange gains (losses), net | | | (37.8 | ) | | | (80.9 | ) | | | 43.1 | | | | 53.3 | |
Gains on derivative operations, net | | | 29.6 | | | | 116.3 | | | | (86.7 | ) | | | (74.5 | ) |
| Gains on sales of investments in equity securities, net | | | 109.6 | | | | 0.2 | | | | 109.4 | | | | – | |
Income from non-financial sector, net | | | 289.8 | | | | 231.2 | | | | 58.5 | | | | 25.3 | |
Dividend income | | | 38.5 | | | | 81.8 | | | | (43.3 | ) | | | (52.9 | ) |
Other | | | 5.4 | | | | 7.5 | | | | (2.1 | ) | | | (27.8 | ) |
Total other operating income | | | 435.2 | | | | 356.2 | | | | 79.0 | | | | 22.2 | |
Total other operating income increased by 22.2% to Ps 435.2 billion in 2010. This was primarily due to a Ps 109.4 billion increase in net gains on sales of investments in equity securities. Over the course of 2010, Corficolombiana sold three significant investments. The first was the sale of its 7.6% stake in Colombina S.A. Although the sale was formalized in December 2009, due to the form of payment, half of the income was recorded in 2010. This sale generated Ps 21.0 billion in income in that year. The second was the aforementioned sale of the portion of Corficolombiana’s stake in Banco de Occidente in October 2010, which generated Ps 62.3 billion in income. Finally, in December 2010 Corficolombiana sold 5.8 million shares of Proenergia S.A., which amounts to 4.4% of the company, for a gain of Ps 19.0 billion.
Also contributing to the increase in total other operating income was a 25.3% increase in net income from the non-financial sector to Ps 289.8 billion. This increased income resulted primarily from Epiandes and PISA, two of Corficolombiana’s consolidated investments.
Partially offsetting this increase was a 74.5% decline in gains on derivative operations to Ps 29.6 billion, which reflected the fact that Corficolombiana reduced the duration of its underlying assets (resulting in a small residual exposure in its derivative operations due to imperfect matching, as the rest were hedged) in order to reduce its risk exposure (and thus its potential returns) from the more volatile derivative markets in 2010. The greater appreciation of the Colombian peso in 2009 as compared to 2010, 8.9% against 6.4%, respectively, also decreased gains on derivative operations as Corficolombiana utilized its derivative positions to hedge its risk from its foreign exchange operations (in which it was net short of the Colombian Peso). The opposite results can be observed in the changes in Corficolombiana’s foreign exchange gains (losses) line item, which partially offset the decrease in income on derivative operations. Corficolombiana’s foreign exchange losses were reduced by Ps 43.1 billion to Ps (37.8) billion. In a year where the Colombian Peso appreciated less and Corficolombiana reduced its derivative and foreign exchange positions, both net foreign exchange losses and net derivative gains were diminished from previous years.
Also partially offsetting the increase in total other operating income was a 52.9% decrease in dividend income to Ps 38.5 billion in 2010. This decrease was driven principally by the accounting reclassification of some of Corficolombiana’s equity investments. In 2009, Promigas’ and Empresa de Energía de Bogotá’s (EEB) dividends were recorded under the dividend income line-item, but as a result of an accounting convention, when the shares of these companies were reclassified from “Available for sale” to “trading” (for Promigas and EEB reclassification explanations see Corficolombiana 2010-2009 and 2009-2008 discussions), their dividends began to be recorded under “Interest from investment securities” rather than under the dividend income line-item. Even though Promigas was once again classified as “available for sale” from June 2010 to November 2010, its dividends were not recorded under the dividend income line-item due to the fact that after its first reclassification to “Trading,” the investment was left without any unrealized gains on the balance sheet; Colombian banking regulations mandate that dividends from an “Available for sale” investment can only be registered on the income statement if the amount received is greater than the value recorded as unrealized gains. In instances such as this where that is not the case, the equity method mandates that dividends must be registered as a reduction in the value of the investment on the balance sheet. Promigas’ and EEB’s dividends in 2009 were Ps 29.5 and Ps 11.8 billion, respectively.
Operating expenses
| | | | | | | |
| | | | | | | | | | # | | | | |
| | | (in Ps billions) | | | | |
Salaries and employee benefits | | | (45.2 | ) | | | (43.1 | ) | | | 2.1 | | | | 4.8 | |
Bonus plan payments | | | (4.7 | ) | | | (8.3 | ) | | | (3.7 | ) | | | (44.2 | ) |
Termination payments | | | (0.4 | ) | | | (0.6 | ) | | | (0.3 | ) | | | (42.8 | ) |
Administrative and other expenses | | | (58.1 | ) | | | (58.2 | ) | | | (0.2 | ) | | | (0.3 | ) |
Deposit security, net | | | (5.5 | ) | | | (4.1 | ) | | | 1.4 | | | | 33.7 | |
Charitable and other donation expenses | | | (1.9 | ) | | | (1.1 | ) | | | 0.8 | | | | 79.8 | |
Depreciation | | | (3.2 | ) | | | (2.9 | ) | | | 0.2 | | | | 7.6 | |
Goodwill amortization | | | – | | | | – | | | | – | | | | – | |
Total operating expenses | | | (118.8 | ) | | | (118.4 | ) | | | 0.4 | | | | 0.3 | |
Corficolombiana’s total operating expenses remained essentially unchanged in 2010, increasing by 0.3% to Ps 118.8 billion. Since operating expenses remained basically unchanged in 2010, while operating income before provisions increased by 26.1% to Ps 1,175.3 billion, Corficolombiana’s efficiency ratio improved, decreasing from 12.4% in 2009 to 9.8% in 2010.
Non-operating income (expense)
Total non-operating income (expense) decreased by Ps 12.5 billion to Ps (3.2) billion (indicating a net non-operating expense) in 2010, mainly due to an increase in non-operating expenses from Ps 44.2 billion in 2009 to Ps 57.4 billion in 2010. The primary driver for this was a Ps 8.4 billion increase in the non-operating expenses of one of Corficolombiana’s consolidated investments (Estudios y Proyectos del Sol S.A., or Episol) in 2010. Although during this period Episol’s non-operating income also increased by a similar amount (Episol’s income and expenses are reported as non-operating because the company is still in a pre-operational stage), Corficolombiana’s non-operating income account did not reflect this increase primarily due to the fact that in 2009 Epiandes contributed Ps 11.0 billion in non-operating income that was not repeated in 2010.
Porvenir
Porvenir generates income primarily from fees on its customers’ pension contributions, which consist predominantly of monthly mandatory contributions. It also generates net interest income, composed almost entirely of investment income from the appreciation of Porvenir’s proprietary trading portfolio, which can be divided into two components: (1) income from its stabilization reserve, which is the legally required proprietary stake (1% of assets under management) in its funds that are subject to a minimum return guarantee and (2) direct investment portfolio income, which includes income from fixed income securities and money market instruments. As a result,
Porvenir’s revenue is mainly affected by the number of contributors, the salaries of contributors, any changes in applicable fee rates and the rate of return of its assets under management.
Net income
| | | | | | | |
| | | | | | | | | | # | | | | |
| | | (in Ps billions) | | | | |
Total interest income | | | 58.7 | | | | 65.3 | | | | (6.6 | ) | | | (10.1 | ) |
Total interest expense | | | (0.2 | ) | | | (0.3 | ) | | | (0.1 | ) | | | (35.6 | ) |
Net interest income | | | 58.5 | | | | 64.9 | | | | (6.5 | ) | | | (10.0 | ) |
Total provisions (reversals), net | | | (0.0 | ) | | | (2.5 | ) | | | (2.5 | ) | | | (99.0 | ) |
Total fees and other services income, net | | | 373.6 | | | | 366.8 | | | | 6.9 | | | | 1.9 | |
Total other operating income | | | 2.7 | | | | 4.7 | | | | (2.0 | ) | | | (41.7 | ) |
Total operating income | | | 434.8 | | | | 433.9 | | | | 0.9 | | | | 0.2 | |
Total operating expenses | | | (197.5 | ) | | | (182.7 | ) | | | 14.8 | | | | 8.1 | |
Net operating income | | | 237.3 | | | | 251.2 | | | | (13.9 | ) | | | (5.5 | ) |
Total non-operating income (expense), net | | | 1.3 | | | | 3.2 | | | | (1.9 | ) | | | (58.4 | ) |
| Income before income tax expense and non-controlling interest | | | 238.6 | | | | 254.4 | | | | (15.8 | ) | | | (6.2 | ) |
Income tax expense | | | (82.1 | ) | | | (88.3 | ) | | | (6.2 | ) | | | (7.0 | ) |
Income before non-controlling interest | | | 156.5 | | | | 166.0 | | | | (9.5 | ) | | | (5.7 | ) |
Non-controlling interest | | | (0.1 | ) | | | (0.0 | ) | | | 0.1 | | | | 157.5 | |
Net income | | | 156.4 | | | | 166.0 | | | | (9.6 | ) | | | (5.8 | ) |
Porvenir’s net income decreased by 5.8% to Ps 156.4 billion in 2010. This was primarily due to the decrease in net interest income and the increase in total operating expenses, which offset the increase in fees and other services income and the decrease in provisions. As a result, Porvenir’s efficiency ratio worsened over this period, increasing from 40.8% in 2009 to 44.3% in 2010.
Total fees and other services income
Total net fees and other services income consists primarily of commissions earned on the administration of mandatory pension funds, severance funds, voluntary pension funds and third-party liability pension funds. Porvenir’s total net fees and other services income increased slightly by 1.9% to Ps 373.6 billion in 2010, driven primarily by the increase in the revenues received from the administration of mandatory pension funds, which rose by Ps 28.4 billion, from Ps 237.9 billion in 2009 to Ps 266.4 billion in 2010, due to a 5.1% increase in the average number of contributors and a 4.9% increase in the average monthly wage per contributor to Ps 1.13 million.
Additionally, an increase in revenue associated with the management of voluntary pension funds, which rose by Ps 9.8 billion, from Ps 34.7 billion in 2009 to Ps 44.5 billion in 2010, also contributed to the increase in fee revenue.
These increases were partially offset by a Ps 12.0 billion decrease in income from third-party liability pension funds from Ps 34.0 billion in 2009 to Ps 22.0 billion in 2010. This was due to the fact that fees on the management of these funds are dependent upon the yield of the funds, which were lower in 2010 as compared to 2009 due to more challenging market conditions.
Further offsetting the increase in fee income was a Ps 16.1 billion decline in fees from severance fund management, which dropped from Ps 71.8 billion in 2009 to Ps 55.7 billion in 2010. The primary cause of this decrease was a new regulation issued by the Superintendency of Finance that required the creation of two distinct severance funds, a short-term one and a long-term one, as opposed to having just one severance fund, with the maximum permissible fee rate being reduced from 4.0% to 3.0% for the long-term severance fund and to 1.0% for the short term fund.
Commissions from banking services, consisting primarily of fees charged to customers for the processing of information and the early withdrawal of pensions, increased by Ps 5.5 billion to Ps 13.9 billion in 2010.
Fees and other service expenses rose slightly, from Ps 42.2 billion in 2009 to Ps 50.1 billion in 2010. This was a product of the organic growth of the business and its main product lines.
Net interest income
Net interest income decreased by Ps 6.5 billion to Ps 58.5 billion in 2010. This decrease was primarily due to the decline in the rate of return of Porvenir’s total investment portfolio. While prevailing market conditions in 2010 were favorable, market conditions in 2009 were even more favorable. As a result, Porvenir’s rate of return on its investment portfolio decreased from 17.0% in 2009 to 11.5% in 2010. This was partially offset by an increase in the average volume of the investment portfolio, which increased by 40.3%, from Ps 452.7 billion at December 31, 2009 to Ps 635.2 billion at December 31, 2010.
Operating expenses
| | | | | | | |
| | | | | | | | | | # | | | | |
| | | (in Ps billions) | | | | |
Salaries and employee benefits | | | (77.5 | ) | | | (69.4 | ) | | | 8.0 | | | | 11.6 | |
Bonus plan payments | | | (3.7 | ) | | | (5.3 | ) | | | (1.6 | ) | | | (30.2 | ) |
Termination payments | | | (0.5 | ) | | | (1.0 | ) | | | (0.5 | ) | | | (51.8 | ) |
Administrative and other expenses | | | (110.8 | ) | | | (101.9 | ) | | | 8.9 | | | | 8.7 | |
| Deposit security, net | | | – | | | | – | | | | – | | | | – | |
Charitable and other donation expenses | | | (0.1 | ) | | | (0.3 | ) | | | (0.2 | ) | | | – | |
Depreciation | | | (5.0 | ) | | | (4.8 | ) | | | 0.2 | | | | 3.4 | |
Goodwill amortization | | | – | | | | – | | | | – | | | | – | |
Total operating expenses | | | (197.5 | ) | | | (182.7 | ) | | | 14.8 | | | | 8.1 | |
Porvenir’s total operating expenses increased by 8.1% to Ps 197.5 billion in 2010, due primarily to the 8.7% growth of administrative and other expenses to Ps 110.8 billion and the 11.6% increase in salaries and employee benefits to Ps 77.5 billion, both consistent with the organic growth of the business. As previously mentioned, Porvenir’s 2010 efficiency ratio slightly worsened in comparison to its 2009 figure, increasing from 40.8% in 2009 to 44.3% in 2010.
Non-operating income (expense)
Total non-operating income (expense) decreased by Ps 1.9 billion in 2010. A higher reversal of provisions in 2009, which was not repeated in 2010, was the main driver of the decrease in non-operating income. Non-operating income composed 0.6% of total net income before income tax and non-controlling interest in 2010.
Banco de Occidente
Net income
| | | | | | | |
| | | | | | | | | | # | | | | |
| | | (in Ps billions) | | | | |
Total interest income | | | 1,403.9 | �� | | | 1,821.7 | | | | (417.8 | ) | | | (22.9 | ) |
Total interest expense | | | (457.2 | ) | | | (732.0 | ) | | | (274.7 | ) | | | (37.5 | ) |
Net interest income | | | 946.7 | | | | 1,089.7 | | | | (143.1 | ) | | | (13.1 | ) |
Total provisions (reversals), net | | | (192.3 | ) | | | (257.3 | ) | | | (65.0 | ) | | | (25.3 | ) |
Total fees and other services income, net | | | 186.6 | | | | 216.6 | | | | (30.0 | ) | | | (13.8 | ) |
Total other operating income | | | 316.7 | | | | 282.0 | | | | 34.7 | | | | 12.3 | |
Total operating income | | | 1,257.6 | | | | 1,331.0 | | | | (73.3 | ) | | | (5.5 | ) |
Total operating expenses | | | (764.4 | ) | | | (764.7 | ) | | | (0.3 | ) | | | 0.0 | |
Net operating income | | | 493.2 | | | | 566.2 | | | | (73.0 | ) | | | (12.9 | ) |
Total non-operating income (expense), net | | | 21.4 | | | | 12.8 | | | | 8.6 | | | | 67.3 | |
| Income before income tax expense and non-controlling interest | | | 514.6 | | | | 579.0 | | | | (64.4 | ) | | | (11.1 | ) |
Income tax expense | | | (126.2 | ) | | | (152.0 | ) | | | (25.8 | ) | | | (17.0 | ) |
Income before non-controlling interest | | | 388.4 | | | | 427.0 | | | | (38.6 | ) | | | (9.0 | ) |
Non-controlling interest | | | (2.0 | ) | | | (44.9 | ) | | | (42.9 | ) | | | (95.5 | ) |
Net income attributable to shareholders | | | 386.4 | | | | 382.1 | | | | 4.3 | | | | 1.1 | |
Banco de Occidente’s net income attributable to its shareholders increased by 1.1% to Ps 386.4 billion in 2010. The primary cause of this increase was the decrease in minority interest, by 95.5% to Ps 2.0 billion, due to the merger of Banco de Occidente and Leasing de Occidente, which occurred in the first half of 2010. The growth of total other operating income by 12.3% to Ps 316.7 billion (mainly as a result of a rise in dividend income from Corficolombiana, of which Banco de Occidente owns 13.4%) also contributed to the increase in net income. Banco de Occidente’s efficiency ratio worsened during this period, increasing from 39.8% in 2009 to 44.5% in 2010.
Net interest income
| | | | | | | |
| | | | | | | | | | # | | | | |
| | | (in Ps billions) | | | | |
| Interest income: | | | | | | | | | | | | | |
Interest on loans | | | 945.3 | | | | 1,223.8 | | | | (278.5 | ) | | | (22.8 | ) |
Interest on investment securities | | | 193.9 | | | | 263.2 | | | | (69.3 | ) | | | (26.3 | ) |
Interbank and overnight funds | | | 8.4 | | | | 32.1 | | | | (23.6 | ) | | | (73.7 | ) |
Financial leases | | | 256.3 | | | | 302.6 | | | | (46.4 | ) | | | (15.3 | ) |
Total interest income | | | 1,403.9 | | | | 1,821.7 | | | | (417.8 | ) | | | (22.9 | ) |
| Interest expense: | | | | | | | | | | | | | | | | |
Checking accounts | | | (4.9 | ) | | | (3.9 | ) | | | 1.0 | | | | 26.3 | |
Time deposits | | | (137.6 | ) | | | (263.5 | ) | | | (125.8 | ) | | | (47.8 | ) |
Savings deposits | | | (141.6 | ) | | | (215.3 | ) | | | (73.8 | ) | | | (34.3 | ) |
Total interest expense from deposits | | | (284.1 | ) | | | (482.7 | ) | | | (198.6 | ) | | | (41.1 | ) |
Borrowing from banks and others | | | (76.8 | ) | | | (116.7 | ) | | | (39.9 | ) | | | (34.2 | ) |
Interbank and overnight funds (expenses) | | | (6.7 | ) | | | (5.5 | ) | | | 1.2 | | | | 21.6 | |
Long-term debt (bonds) | | | (89.7 | ) | | | (127.1 | ) | | | (37.4 | ) | | | (29.4 | ) |
Total interest expense | | | (457.2 | ) | | | (732.0 | ) | | | (274.7 | ) | | | (37.5 | ) |
Net interest income | | | 946.7 | | | | 1,089.7 | | | | (143.1 | ) | | | (13.1 | ) |
Banco de Occidente’s net interest income decreased by 13.1% from Ps 1,089.7 billion in 2009 to Ps 946.7 billion in 2010. This decrease was primarily driven by a 21.3% decrease in the interest earned on loans and financial leases to Ps 1,201.6 billion in 2010. The decrease in average annualized yield for loans and financial leases from 15.0% in 2009 to 11.2% in 2010 reflected the fact that 59.1% of Banco de Occidente’s gross loan portfolio at December 31, 2010 was concentrated in commercial loans which, as mentioned in the 2010-2009 Grupo Aval discussion above, saw their yield particularly affected by the declining interest rate environment. The decrease in yield resulted in a Ps 394.0 billion decline in interest income from loans and financial leases. Partially offsetting this decrease in interest income was the 5.7% growth of Banco de Occidente’s average loan and financial lease portfolio, primarily in consumer loans and financial leases, to Ps 10,763.8 billion. The growth in the balance of this portfolio resulted in an increase of Ps 69.1 billion in interest income.
Interest income from investment securities decreased by 26.3% to Ps 193.9 billion. The fixed income portfolio generated Ps 193.8 billion, or 99.97%, of Banco de Occidente’s earnings on investment securities in 2010, reflecting gains resulting from the declining interest rate environment as well as interest accrued on the portfolio. Nevertheless, the earnings from fixed income investments for 2010 were 25.5% less than the Ps 260.0 billion earned on fixed income investments in 2009, primarily due to challenging months in January and February 2010 stemming from the volatility of fixed income interest rates in these first couple of months (explained in further depth in the Grupo Aval 2010-2009 discussion). The equity portfolio generated the remaining Ps 0.05 billion, or 0.03%, of the interest income from investment securities, which was down from the Ps 3.2 billion produced by the equity portfolio in 2009.
The decrease in interest income was partially offset by a 37.5% decline in total interest expense to Ps 457.2 billion in 2010. The decrease in interest paid on interest-bearing liabilities reflected a decreased average cost of funding, primarily in savings deposits and time deposits. The nominal interest rate paid on interest-bearing liabilities decreased from an average of 6.6% in 2009 to 4.1% in 2010, which resulted in a Ps 242.4 billion decrease in interest expense. The average balance of interest-bearing liabilities increased by 1.5% to Ps 11,174.8 billion from 2009 to 2010; however, Banco de Occidente changed its composition of interest-bearing liabilities throughout 2010: the average balance of savings deposits, which are relatively less expensive than time deposits, increased by 11.6% to Ps 4,860.9 billion, while the average balance of time deposits decreased by 16.3% to Ps 2,854.7 billion. As a result, the increase in volume of interest-bearing liabilities actually contributed to a Ps 32.3 billion decrease in interest expense.
Banco de Occidente’s net interest margin decreased to 6.0% in 2010, down from 7.7% in 2009. Similarly, the spread between the yield earned on its loans and financial leases and the cost of its interest-bearing liabilities decreased from 8.3% in 2009 to 7.1% in 2010. In addition to its high concentration in commercial loans, Banco de Occidente’s assets repriced faster than its liabilities due to the fact that a high proportion of its gross loans are due in one year or less (53.9% at December 31, 2010 compared to the Grupo Aval consolidated average of 45.9%, and 47.0% before including BAC Credomatic’s impact, each at December 31, 2010), which are particularly sensitive to repricing in an environment of declining interest rates.
Provisions
Total net provisions decreased by 25.3% to Ps 192.3 billion in 2010, driven by a decrease in provisions for loans and financial leases and a marginal increase in recoveries. Net provisions for loan and financial lease losses, the main component of total net provisions, decreased by 12.0% to Ps 204.2 billion as a result of the improvement of Banco de Occidente’s credit quality. Banco de Occidente’s past due loans decreased by 24.7% to Ps 328.7 billion and its delinquency ratio decreased from 4.0% at December 31, 2009 to 2.8% at December 31, 2010. This decrease was primarily a result of a reduction in past due commercial loans, which decreased by 34.9% to Ps 133.5 billion (with a drop in their delinquency ratio from 3.2% to 1.9%).
Charge-offs increased by 9.4% to Ps 227.6 billion in 2010 due almost entirely to an increase in write-offs in the fourth quarter of 2010 as compared to the fourth quarter of 2009 (Banco de Occidente had almost identical charge-off figures for the first nine months of 2010 as compared to the first nine months of 2009, Ps 147.2 and Ps 147.7, respectively). Charge-offs in the fourth quarter of 2010 were higher than usual primarily due to two events: (1) the write-off of a Ps 10.2 billion loan made to a construction company that declared bankruptcy in October 2010 and (2) a Ps 5.7 billion write-off in November 2010 for a loan issued to an agriculture company that experienced economic difficulties. Banco de Occidente’s charge-offs to average loans and financial leases ratio rose from 1.9% in 2009 to 2.1% in 2010. Due to the increase in charge-offs and a decrease in its net provisions, Banco de Occidente’s allowance for loan and financial lease losses decreased by 4.2% to Ps 536.8 billion at December 31, 2010. However, since the percentage decrease in past due loans was greater than the percentage decrease in allowance, Banco de Occidente’s coverage ratio improved from 128.4% to 163.3%.
Net provisions for accrued interest and other receivables decreased by 49.8% to Ps 26.0 billion due to the aforementioned improvement in the Colombian economy.
Net provisions for foreclosed assets and other assets decreased by Ps 1.2 billion, or 44.4%, to Ps 1.5 billion in 2010. Gross provisions for foreclosed assets and other assets decreased by Ps 1.5 billion to Ps 6.9 billion, and reversals of provisions for foreclosed and other assets decreased by Ps 0.3 billion to Ps 5.4 billion.
The recovery of charged-off assets increased by Ps 10.3 billion primarily as a result of the improving Colombian economy and a more effective recovery effort by Banco de Occidente.
Total fees and other services income
| | | | | | | |
| | | | | | | | | | # | | | | |
| | | (in Ps billions) | | | | |
| Fees and other services income: | | | | | | | | | | | | | |
Commissions from banking services | | | 124.5 | | | | 150.5 | | | | (26.0 | ) | | | (17.3 | ) |
Branch network services | | | – | | | | – | | | | – | | | | – | |
Credit card merchant fees | | | 81.5 | | | | 42.6 | | | | 38.8 | | | | 91.1 | |
Checking fees | | | 23.3 | | | | 22.7 | | | | 0.6 | | | | 2.6 | |
Warehouse services | | | – | | | | – | | | | – | | | | – | |
Fiduciary activities | | | 37.9 | | | | 33.8 | | | | 4.1 | | | | 12.1 | |
Pension plan administration | | | – | | | | – | | | | – | | | | – | |
Other | | | 27.0 | | | | 26.0 | | | | 1.1 | | | | 4.2 | |
Total fees and other services income | | | 294.1 | | | | 275.5 | | | | 18.6 | | | | 6.7 | |
Fees and other services expenses | | | (107.5 | ) | | | (59.0 | ) | | | 48.5 | | | | 82.3 | |
Total fees and other services income, net | | | 186.6 | | | | 216.6 | | | | (30.0 | ) | | | (13.8 | ) |
Total net fees and other services income decreased by 13.8% to Ps 186.6 billion in 2010. At the beginning of the year, the Superintendency of Finance required Banco de Occidente to change the way it classified certain income/expenses. Specifically, it ordered the bank to split its credit card merchant fees into gross revenue and expenses (it was previously recorded on a net basis). This almost entirely explains the Ps 38.8 billion increase in credit card merchant fees, as well as the Ps 48.5 billion increase in fees and other services expenses. The Ps 26.0 billion decrease in commissions from banking services is also explained by a reclassification that occurred in the first semester of 2010. Banco de Occidente moved Ps 34.9 billion of this income to “income from the non-financial sector, net” under “Other operating income,” as it was related to income generated by Ventas y Servicios S.A., a real-sector company consolidated by Banco de Occidente. The reported amount for the line item “income from the non-financial sector” in the 2010 period is much less than the Ps 34.9 billion other income reclassification because the reported amount is net of Ps 33.3 billion of expenses, which were reallocated from operating expenses (primarily administrative and other expenses and salaries and employee benefits).
Other operating income
| | | | | | | |
| | | | | | | | | | # | | | | |
| | | (in Ps billions) | | | | |
Foreign exchange gains (losses), net | | | 17.1 | | | | (7.1 | ) | | | 24.1 | | | | 341.0 | |
Gains on derivative operations, net | | | 27.6 | | | | 55.8 | | | | (28.3 | ) | | | (50.6 | ) |
| Gains on sales of investments in equity securities, net | | | 0.0 | | | | – | | | | 0.0 | | | | – | |
Income from non-financial sector, net (1) | | | 1.6 | | | | – | | | | 1.6 | | | | – | |
Dividend income | | | 111.7 | | | | 68.6 | | | | 43.1 | | | | 62.7 | |
Other | | | 158.8 | | | | 164.6 | | | | (5.8 | ) | | | (3.5 | ) |
Other operating income | | | 316.7 | | | | 282.0 | | | | 34.7 | | | | 12.3 | |
Total other operating income increased by 12.3% to Ps 316.7 billion in 2010. Banco de Occidente’s dividend income increased by 62.7% to Ps 111.7 billion, primarily as a result of higher dividends paid by Corficolombiana. Corficolombiana’s dividend income in 2010 was much higher due to the fact that its dividend payments are based on its previous year’s net income, and Corficolombiana’s net income in 2009 was particularly high (further explained in
the 2010-2009 Corficolombiana discussion). This increase was partially offset by a Ps 28.3 billion decrease in net gains on derivative operations to Ps 27.6 billion, though this was almost entirely compensated by a related Ps 24.1 billion increase in net foreign exchange gains. The Ps 1.6 billion net income from the non-financial sector is composed of income related to Ventas y Servicios S.A., a subsidiary of Banco de Occidente. Prior to 2010, when a change in accounting policies resulted in Ventas y Servicios’ net income being recorded under the line item “income from non-financial sector,” it was divided among various different line items on Banco de Occidente’s financial statements.
Operating expenses
| | | | | | | |
| | | | | | | | | | # | | | | |
| | | (in Ps billions) | | | | |
Salaries and employee benefits | | | (275.1 | ) | | | (274.5 | ) | | | 0.5 | | | | 0.2 | |
Bonus plan payments | | | (20.1 | ) | | | (18.9 | ) | | | 1.3 | | | | 6.6 | |
Termination payments | | | (3.7 | ) | | | (2.4 | ) | | | 1.3 | | | | 51.9 | |
Administrative and other expenses | | | (320.6 | ) | | | (303.7 | ) | | | 16.9 | | | | 5.6 | |
Deposit security, net | | | (23.6 | ) | | | (31.1 | ) | | | (7.5 | ) | | | (24.2 | ) |
Charitable and other donation expenses | | | (1.4 | ) | | | (1.2 | ) | | | 0.3 | | | | 21.6 | |
Depreciation | | | (118.6 | ) | | | (120.1 | ) | | | (1.5 | ) | | | (1.2 | ) |
Goodwill amortization | | | (1.3 | ) | | | (12.8 | ) | | | (11.5 | ) | | | (90.0 | ) |
Total operating expenses | | | (764.4 | ) | | | (764.7 | ) | | | (0.3 | ) | | | – | |
Total operating expenses for 2010 remained basically unchanged from 2009 at Ps 764.4 billion, however, there were a few changes in certain line-items. Goodwill amortization decreased due to the additional amortization of Ps 10.2 billion in the first semester of 2009 that was not repeated in 2010. There was also a Ps 7.5 billion decrease in net deposit security expenses. This decrease was partially offset by a 5.6% increase of administrative and other expenses to Ps 320.6 billion associated with the organic growth of the business. Salaries and employee benefits increased very slightly, by 0.2% to Ps 275.1 billion, which considering the increase in total employees from 7,827 at December 31, 2009 to 8,269 at December 31, 2010, represents a 5.2% per capita decrease. Despite the fact that total operating expenses remained steady, Banco de Occidente’s efficiency ratio slightly worsened in 2010, increasing from 39.8% to 44.5%, respectively. Nevertheless, it should be noted that Banco de Occidente is still among the most efficient of Grupo Aval’s banks, and the Colombian financial system as a whole, due to the bank’s efficient use of its office branch network and its ability to conduct business directly through its Treasury department.
Non-operating income (expense)
Total non-operating income (expense), which represented 4.2% of income before income tax expense and non-controlling interest in 2010, includes gains (losses) from the sale of foreclosed assets, property, plant and equipment, and other assets and income. This line item increased by Ps 8.6 billion to Ps 21.4 billion in 2010, primarily due to the sale of a warehouse in 2010 that generated approximately Ps 5.0 billion of non-operating income.
Income tax expense
Income tax expense decreased by 17.0% to Ps 126.2 billion in 2010. This was reflected in Banco de Occidente’s 24.5% effective tax rate for this period, which was 173 basis points below the 26.3% rate that prevailed in 2009. This decrease was primarily due to the fact that an important portion of the income generated by Banco de Occidente in 2010 stemmed from dividend income from its investment in Corficolombiana, which is non-taxable according to Colombian regulations. It is important to note that Banco de Occidente’s historic (and current) relatively low effective tax rate is a result not only of the significant non-taxable dividend income it receives from Corficolombiana and Porvenir, but also from deductions associated with Leasing de Occidente’s operations, mainly related to the fact that it holds productive assets (which it leases) that provide a tax deduction equivalent to 30% of their purchase price.
Non-controlling interest
Banco de Occidente’s non-controlling interest decreased by 95.5% to Ps 2.0 billion. This decrease was due to Banco de Occidente’s merger with Leasing de Occidente, an entity that Banco de Occidente previously consolidated on its financial statements, despite owning only 34.4%, due to a control agreement signed with Corficolombiana (which owned 45.2% of Leasing de Occidente). As per the merger agreement, Banco de Occidente issued shares in exchange for the outstanding shares of Leasing de Occidente, and as a result, its shares outstanding increased from 137.0 million to 149.8 million. Due to Corficolombiana’s sizable stake in Leasing de Occidente, following the transaction it owned 6.1% of Banco de Occidente’s shares outstanding, although it has since sold 2.11% of these shares at December 31, 2010 and as of May 15, 2011, held 3.9% (further explained in the 2010 – 2009 Corficolombiana discussion).
Banco Popular
Net income
| | | | | | | |
| | | | | | | | | | # | | | | |
| | | (in Ps billions) | | | | |
Total interest income | | | 1,276.2 | | | | 1,453.1 | | | | (176.9 | ) | | | (12.2 | ) |
Total interest expense | | | (325.3 | ) | | | (514.2 | ) | | | (189.0 | ) | | | (36.7 | ) |
Net interest income | | | 950.9 | | | | 938.8 | | | | 12.1 | | | | 1.3 | |
Total provisions (reversals), net | | | (101.6 | ) | | | (94.5 | ) | | | 7.1 | | | | 7.5 | |
Total fees and other services income, net | | | 136.1 | | | | 143.2 | | | | (7.1 | ) | | | (5.0 | ) |
Total other operating income | | | 42.0 | | | | 29.4 | | | | 12.7 | | | | 43.1 | |
Total operating income | | | 1,027.5 | | | | 1,017.0 | | | | 10.5 | | | | 1.0 | |
Total operating expenses | | | (558.3 | ) | | | (536.5 | ) | | | 21.8 | | | | 4.1 | |
Net operating income | | | 469.2 | | | | 480.4 | | | | (11.3 | ) | | | (2.3 | ) |
Total non-operating income (expense), net | | | 53.0 | | | | (42.3 | ) | | | 95.3 | | | | (225.3 | ) |
| Income before income tax expense and non-controlling interest | | | 522.2 | | | | 438.1 | | | | 84.1 | | | | 19.2 | |
Income tax expense | | | (156.8 | ) | | | (132.5 | ) | | | 24.3 | | | | 18.3 | |
Income before non-controlling interest | | | 365.4 | | | | 305.6 | | | | 59.8 | | | | 19.6 | |
Non-controlling interest | | | (3.8 | ) | | | (2.1 | ) | | | 1.8 | | | | 85.5 | |
Net income attributable to shareholders | | | 361.6 | | | | 303.6 | | | | 58.1 | | | | 19.1 | |
Banco Popular’s net income attributable to its shareholders increased by 19.1% to Ps 361.6 billion in 2010 mainly due to: (1) an increase in net interest income, which was a result of decreasing its total interest expense by more than the decrease in its total interest income, (2) a rise in total other operating income primarily due to an increase in dividend income, and (3) an increase in non-operating income, which was predominantly a result of the reversal of a portion of its provisions for employee pension plans and the recovery of guaranties for charged-off loans from the Fondo Nacional de Garantías (Colombian National Guaranty Fund). The slight decrease in net operating income, partially due to the 4.1% increase in its total operating expenses, contributed to a marginal worsening of its efficiency ratio from 46.7% in 2009 to 47.6% in 2010.
Net interest income
| | | | | | | |
| | | | | | | | | | # | | | | |
| | | (in Ps billions) | | | | |
| Interest income: | | | | | | | | | | | | | |
Interest on loans | | | 1,067.4 | | | | 1,144.8 | | | | (77.5 | ) | | | (6.8 | ) |
Interest on investment securities | | | 164.8 | | | | 236.9 | | | | (72.1 | ) | | | (30.4 | ) |
Interbank and overnight funds | | | 16.8 | | | | 41.2 | | | | (24.5 | ) | | | (59.3 | ) |
Financial leases | | | 27.3 | | | | 30.1 | | | | (2.9 | ) | | | (9.5 | ) |
Total interest income | | | 1,276.2 | | | | 1,453.1 | | | | (176.9 | ) | | | (12.2 | ) |
| Interest expense: | | | | | | | | | | | | | | | | |
Checking accounts | | | (1.9 | ) | | | (16.6 | ) | | | (14.7 | ) | | | (88.5 | ) |
Time deposits | | | (81.8 | ) | | | (182.6 | ) | | | (100.7 | ) | | | (55.2 | ) |
Savings deposits | | | (170.6 | ) | | | (262.6 | ) | | | (92.0 | ) | | | (35.0 | ) |
Total interest expense on deposits | | | (254.3 | ) | | | (461.8 | ) | | | (207.4 | ) | | | (44.9 | ) |
Borrowing from banks and others | | | (9.9 | ) | | | (18.5 | ) | | | (8.5 | ) | | | (46.3 | ) |
Interbank and overnight funds (expenses) | | | (2.5 | ) | | | (2.1 | ) | | | 0.5 | | | | 22.7 | |
Long-term debt (bonds) | | | (58.5 | ) | | | (31.9 | ) | | | 26.6 | | | | 83.2 | |
Total interest expense | | | (325.3 | ) | | | (514.2 | ) | | | (189.0 | ) | | | (36.7 | ) |
Net interest income | | | 950.9 | | | | 938.8 | | | | 12.1 | | | | 1.3 | |
Banco Popular’s net interest income grew by 1.3% to Ps 950.9 billion in 2010. This increase was driven primarily by the 36.7% decrease in interest expense to Ps 325.3 billion amidst the previously discussed declining interest rate environment. The decrease in interest expense was concentrated in time deposits, for which interest expense decreased by 100.7 billion (Ps 82.0 billion due to a decrease in rate paid and Ps 18.7 billion as a result of a decline in their average balance), and savings accounts, for which interest expense decreased by Ps 92.0 billion (Ps 109.5 billion due to a decrease in rate paid, partially offset by a Ps 17.5 billion increase associated with the growth of their average balance). The nominal interest rate paid on interest-bearing liabilities decreased from an average of 6.4% in 2009 to 3.8% in 2010, which excluding interbank and overnight funds, resulted in a Ps 224.0 billion decrease in interest expense. This decrease was partially offset by a 7.8% increase in the balance of average interest-bearing liabilities to Ps 8,600.4 billion (primarily reflecting increased savings deposits and long-term debt) in 2010, which was responsible for a Ps 34.6 billion increase in interest expense (excluding the impact of interbank and overnight funds).
A decline in Banco Popular’s interest income from loans and financial leases, which decreased by 6.8% to Ps 1,094.6 billion, partially offset the decrease in interest expense. This decrease in interest income was comparatively less pronounced than what was generally observed throughout the Colombian financial system due to the fact that a substantial portion of its loan portfolio is concentrated in consumer loans (53.1% of its total gross loan portfolio at December 31, 2010), which as mentioned in the Grupo Aval 2010-2009 discussion, were relatively less affected by the declining interest rate environment. Nevertheless, the decrease in average yield for loans and financial leases from 18.5% in 2009 to 14.4% in 2010 resulted in a Ps 260.7 billion decline in interest income from loans and financial leases. Partially offsetting the decrease in interest income from the decline in yield was the 19.6% growth of Banco Popular’s average loan and financial lease portfolio, primarily in consumer and commercial loans, to Ps 7,597.9 billion. The growth in the balance of this portfolio resulted in an increase of Ps 180.3 billion in interest income.
A decrease in interest income from investment securities, which declined by 30.4% to Ps 164.8 billion in 2010, also partially offset the decrease in interest expense. The fixed income portfolio generated Ps 164.0 billion of interest income from investment securities, accounting for 99.5% of Banco Popular’s earnings on investment securities in 2010. This was 30.2% lower than the Ps 234.9 billion of income generated by fixed income securities in 2009 for the reasons explained in the Grupo Aval 2010-2009 discussion. Banco Popular’s equity portfolio generated the remaining Ps 0.7 billion, or 0.5%, of income from investment securities in 2010. This was marginally lower than the Ps 2.0 billion yielded by its equity portfolio in 2009.
For the reasons explained above, Banco Popular’s net interest margin decreased from 10.4% in 2009 to 9.0% in 2010, while its spread between the yield earned on its loans and financial leases and the cost of its interest-bearing liabilities declined from 12.1% in 2009 to 10.6% in 2010.
Provisions
Total net provisions increased by 7.5% to Ps 101.6 billion in 2010, driven primarily by a 36.4% rise in net provisions for loans and financial leases to Ps 128.6 billion. The increase in provisions was primarily due to the deterioration of the credit quality of certain loans throughout the fourth quarter which were ultimately charged off, as illustrated by the Ps 68.1 billion increase in charge-offs to Ps 98.6 billion in 2010 (with Ps 54.5 billion coming in the fourth quarter), were ultimately charged-off. Consistent with the increase in charge-offs, Banco Popular’s charge-offs to average loan ratio increased from 0.5% in 2009 to 1.3% in 2010. Despite this increase, Banco Popular’s ratio of charge-offs to average loans was still relatively low, especially for a bank concentrated in consumer loans. Moreover, even with the increase in charge-offs, Banco Popular’s net provisions for loans and financial leases were still greater than its charge-offs, which resulted in a 6.4% increase in its allowance for loan and financial lease losses to Ps 360.8 billion at December 31, 2010.
As a result of the recovery of the Colombian economy and the charging-off of certain past due loans in 2010, Banco Popular’s past due loans decreased by 19.4% to Ps 215.4 billion at December 31, 2010, and its delinquency ratio decreased from 3.7% at December 31, 2009 to 2.5% at December 31, 2010. This decrease was primarily a result of a reduction in past due commercial loans, which decreased by 25.1% to Ps 73.8 billion (with a drop in their delinquency ratio from 3.7% to 2.0%), and past due consumer loans, which declined by 8.0% to Ps 116.7 billion (with a decrease in their delinquency ratio from 3.0% to 2.5%). The growth of Banco Popular’s allowance, combined with the decrease in its past due loans and financial leases, resulted in the increase of its coverage ratio from 127.0% at December 31, 2009 to 167.5% at December 31, 2010.
Net provisions for accrued interest and other receivables decreased by Ps 16.7 billion to Ps (5.7) billion (indicating a recovery of Ps 5.7 billion) due to the aforementioned improvement in the Colombian economy.
Net provisions for foreclosed assets and other assets decreased by Ps 2.7 billion to Ps (5.0) billion (indicating a net recovery of Ps 5.0 billion) in 2010. Gross provisions for foreclosed assets and other assets decreased by Ps 2.3 billion to Ps 4.0 billion, while reversals of provisions for foreclosed and other assets increased by Ps 0.4 billion to Ps 9.0 billion in 2010.
Banco Popular’s recovery of charged-off assets increased by Ps 7.8 billion to Ps 16.4 billion as a result of both a higher level of charge-offs and higher collections stemming from the overall improved economic environment.
Total fees and other services income
| | | | | | | |
| | | | | | | | | | # | | | | |
| | | (in Ps billions) | | | | |
| Fees and other services income: | | | | | | | | | | | | | |
Commissions from banking services | | | 86.9 | | | | 93.2 | | | | (6.3 | ) | | | (6.8 | ) |
Branch network services | | | – | | | | – | | | | – | | | | – | |
Credit card merchant fees | | | 5.1 | | | | 4.3 | | | | 0.8 | | | | 18.0 | |
Checking fees | | | 4.3 | | | | 4.7 | | | | (0.4 | ) | | | (8.8 | ) |
Warehouse services | | | 55.3 | | | | 57.9 | | | | (2.7 | ) | | | (4.6 | ) |
Fiduciary activities | | | 10.7 | | | | 10.9 | | | | (0.2 | ) | | | (2.0 | ) |
Pension plan administration | | | 1.6 | | | | 1.0 | | | | 0.6 | | | | 59.5 | |
Others | | | 10.3 | | | | 10.5 | | | | (0.2 | ) | | | (2.2 | ) |
Total fees and other services income | | | 174.1 | | | | 182.6 | | | | (8.5 | ) | | | (4.6 | ) |
Fees and other services expenses | | | (38.0 | ) | | | (39.3 | ) | | | (1.4 | ) | | | (3.5 | ) |
Total fees and other services income, net | | | 136.1 | | | | 143.2 | | | | (7.1 | ) | | | (5.0 | ) |
Total net fees and other services income decreased by 5.0% to Ps 136.1 billion in 2010. This decline was primarily due to a 6.8% drop in commissions from banking services to Ps 86.9 billion as a result of the decision not to renew a government contract, for which the Colombian government intended to establish new terms. This contract was assigned to Banco Agrario, the only state-owned bank in Colombia.
Other operating income
| | | | | | | |
| | | | | | | | | | # | | | | |
| | | (in Ps billions) | | | | |
Foreign exchange gains (losses), net | | | (1.6 | ) | | | (1.8 | ) | | | 0.2 | | | | 11.2 | |
Gains on derivative operations, net | | | 0.0 | | | | 0.1 | | | | (0.1 | ) | | | (96.9 | ) |
| Gains on sales of investments in equity securities, net | | | (0.0 | ) | | | – | | | | (0.0 | ) | | | – | |
| Income from non-financial sector, net | | | 3.5 | | | | – | | | | 3.5 | | | | – | |
Dividend income | | | 28.1 | | | | 14.8 | | | | 13.2 | | | | 89.1 | |
Other | | | 12.1 | | | | 16.3 | | | | (4.2 | ) | | | (25.6 | ) |
Total other operating income | | | 42.0 | | | | 29.4 | | | | 12.7 | | | | 43.1 | |
Total other operating income increased by 43.1% to Ps 42.0 billion in 2010. This increase was primarily a result of an increase in dividend income, in particular from Corficolombiana, of which Banco Popular owns approximately 5.5%. The reason for the increase in dividend income from Corficolombiana is included in the Banco de Occidente 2010-2009 discussion in the section on other operating income. The Ps 3.5 billion of net income from the non-financial sector is income contributed by Inca. Prior to 2010, when a change in accounting policies resulted in Inca’s net income being recorded under the line item “income from non-financial sector,” it was divided among various different line items of Banco Popular’s financial statements.
Operating expenses
| | | | | | | |
| | | | | | | | | | # | | | | |
| | | (in Ps billions) | | | | |
Salaries and employee benefits | | | (224.1 | ) | | | (222.3 | ) | | | 1.8 | | | | 0.8 | |
Bonus plan payments | | | (3.8 | ) | | | (2.8 | ) | | | 1.0 | | | | 34.6 | |
Termination payments | | | (0.1 | ) | | | (0.5 | ) | | | (0.4 | ) | | | (76.7 | ) |
Administrative and other expenses | | | (281.2 | ) | | | (264.8 | ) | | | 16.5 | | | | 6.2 | |
Deposit security, net | | | (26.7 | ) | | | (24.2 | ) | | | 2.5 | | | | 10.2 | |
Charitable and other donation expenses | | | (1.3 | ) | | | (4.4 | ) | | | (3.0 | ) | | | (69.4 | ) |
Depreciation | | | (20.9 | ) | | | (17.5 | ) | | | 3.5 | | | | 19.8 | |
Goodwill amortization | | | – | | | | – | | | | – | | | | – | |
Total operating expenses | | | (558.3 | ) | | | (536.5 | ) | | | 21.8 | | | | 4.1 | |
Total operating expenses increased by 4.1% to Ps 558.3 billion in 2010, principally due to a 6.2% increase in administrative and other expenses as a result of the growth in the loan and financial lease portfolio. Salaries and employee benefits remained basically unchanged at Ps 224.1 billion, which considering the increase in headcount from 5,875 at December 31, 2009 to 6,180 at December 31, 2010, represents a 4.2% decrease on a per capita basis. Since operating expenses before depreciation and the amortization of goodwill grew 3.5%, while total operating income before provisions only grew 1.6%, Banco Popular’s efficiency ratio deteriorated slightly from 46.7% in 2009 to 47.6% in 2010.
Non-operating income (expense)
Total net non-operating income (expense) increased by Ps 95.3 billion to a net non-operating income of Ps 53.0 billion in 2010 from a net non-operating expense of Ps 42.3 billion in 2009, driven primarily by: (1) an approximate Ps 34.4 billion reversal of provisions for employee pension plans, (2) a Ps 18.4 billion recovery of guaranties for charged off loans (primarily corresponding to small and medium-sized business) from the Colombian National Guaranty Fund, which guarantees loans to certain industries and businesses that the government has identified as important strategic investments for the country’s development, (3) the sale of several foreclosed assets that netted Ps 10.3 billion in income, and (4) the reduction of legal expenses for labor lawsuits by approximately Ps 20.0 billion in 2010 as compared to 2009.
Income tax expense
Income tax expense for Banco Popular increased by Ps 24.3 billion to Ps 156.8 billion in 2010. This increase was primarily due to higher income before income tax expense and non-controlling interest, as Banco Popular’s effective tax rate, calculated before removing non-controlling interest, remained essentially unchanged at 30.0% in 2010 (as compared to 30.2% in 2009).
Non-controlling interest
Banco Popular’s non-controlling interest increased by Ps 1.8 billion to Ps 3.8 billion. Non-controlling interest is not a significant contributor to net income for Banco Popular, responsible for only 1.0% of net income before non-controlling interest in 2010.
Banco AV Villas
Net income
| | | Year ended December 31, | | | Change, 2010 vs. 2009 | |
| | | 2010 | | | 2009 | | | | # | | | % | |
| | | (in Ps billions) | | | | |
Total interest income | | | 683.1 | | | | 789.1 | | | | (106.0 | ) | | | (13.4 | ) |
Total interest expense | | | (142.8 | ) | | | (217.0 | ) | | | (74.2 | ) | | | (34.2 | ) |
Net interest income | | | 540.3 | | | | 572.1 | | | | (31.7 | ) | | | (5.5 | ) |
Total provisions (reversals), net | | | (122.4 | ) | | | (188.0 | ) | | | (65.6 | ) | | | (34.9 | ) |
Total fees and other services income, net | | | 140.5 | | | | 143.3 | | | | (2.8 | ) | | | (2.0 | ) |
Total other operating income | | | 9.7 | | | | 4.3 | | | | 5.5 | | | | 128.2 | |
Total operating income | | | 568.1 | | | | 531.6 | | | | 36.5 | | | | 6.9 | |
Total operating expenses | | | (389.8 | ) | | | (377.8 | ) | | | 12.0 | | | | 3.2 | |
Net operating income | | | 178.4 | | | | 153.9 | | | | 24.5 | | | | 15.9 | |
Total non-operating income (expense), net | | | 16.2 | | | | 12.6 | | | | 3.6 | | | | 28.2 | |
| Income before income tax expense and non-controlling interest | | | 194.5 | | | | 166.5 | | | | 28.0 | | | | 16.8 | |
Income tax expense | | | (49.9 | ) | | | (55.4 | ) | | | (5.5 | ) | | | (10.0 | ) |
Income before non-controlling interest | | | 144.7 | | | | 111.1 | | | | 33.6 | | | | 30.2 | |
Non-controlling interest | | | (0.4 | ) | | | (0.4 | ) | | | (0.1 | ) | | | (13.5 | ) |
Net income attributable to shareholders | | | 144.3 | | | | 110.7 | | | | 33.6 | | | | 30.4 | |
Banco AV Villas’ net income attributable to its shareholders increased by 30.4% to Ps 144.3 billion in 2010. This increase was primarily due to a reduction in provision expenses (resulting from an improvement in asset quality), partially offset by an increase in operating expenses. During this period, Banco AV Villas’ efficiency ratio worsened slightly, increasing from 50.3% in 2009 to 53.9% in 2010.
Net interest income
| | | | | | | |
| | | | | | | | | | # | | | | |
| | | (in Ps billions) | | | | |
| Interest income: | | | | | | | | | | | | | |
Interest on loans | | | 573.7 | | | | 610.6 | | | | (36.9 | ) | | | (6.0 | ) |
Interest on investment securities | | | 103.5 | | | | 171.9 | | | | (68.5 | ) | | | (39.8 | ) |
Interbank and overnight funds | | | 6.0 | | | | 6.5 | | | | (0.6 | ) | | | (8.9 | ) |
Financial leases | | | – | | | | – | | | | – | | | | – | |
Total interest income | | | 683.1 | | | | 789.1 | | | | (106.0 | ) | | | (13.4 | ) |
| Interest expense: | | | | | | | | | | | | | | | | |
Checking accounts | | | (0.3 | ) | | | (0.8 | ) | | | (0.5 | ) | | | (64.5 | ) |
Time deposits | | | (85.7 | ) | | | (128.2 | ) | | | (42.6 | ) | | | (33.2 | ) |
Savings deposits | | | (38.3 | ) | | | (59.2 | ) | | | (21.0 | ) | | | (35.4 | ) |
Total interest expense on deposits | | | (124.2 | ) | | | (188.2 | ) | | | (64.0 | ) | | | (34.0 | ) |
Borrowing from banks and others | | | (5.1 | ) | | | (4.1 | ) | | | 0.9 | | | | 22.7 | |
Interbank and overnight funds (expenses) | | | (13.5 | ) | | | (24.7 | ) | | | (11.2 | ) | | | (45.2 | ) |
Long-term debt (bonds) | | | – | | | | – | | | | – | | | | – | |
Total interest expense | | | (142.8 | ) | | | (217.0 | ) | | | (74.2 | ) | | | (34.2 | ) |
Net interest income | | | 540.3 | | | | 572.1 | | | | (31.7 | ) | | | (5.5 | ) |
Banco AV Villas’ net interest income decreased by 5.5% to Ps 540.3 billion in 2010. This was primarily due to the 39.8% decrease in income from investment securities to Ps 103.5 billion. The fixed income portfolio generated Ps 103.4 billion, or 99.9%, of Banco AV Villas’ earnings on investment securities in 2010, reflecting gains resulting from the declining interest rate environment as well as interest accrued on the portfolio. Nevertheless, the earnings from fixed income investments in 2010 were 39.5% less than the Ps 170.8 billion earned on fixed income investments in 2009 for the reasons explained in the Grupo Aval 2010-2009 discussion. The equity portfolio generated the remaining Ps 0.1 billion, or 0.1%, of the interest income from investment securities, which was only slightly less than the Ps 1.1 billion in income yielded by the equity portfolio in 2009.
The decrease in interest earned on loans and financial leases by 6.0% to Ps 573.3 billion also contributed to the drop in net interest income in 2010. This was principally due to the decline in average yield for loans and financial leases from 16.6% in 2009 to 13.6% in 2010, which resulted in a Ps 112.4 billion decrease in interest income from loans and financial leases. Partially offsetting this decrease was the 15.1% growth of Banco AV Villas’ average loan and financial lease portfolio, primarily in consumer loans, to Ps 4,222.8 billion. The growth in the balance of this portfolio resulted in an increase of Ps 75.5 billion in interest income.
Total interest expense declined 34.2% to Ps 142.8 billion in 2010. The decrease in interest paid on interest-bearing liabilities reflected a decreased average cost of funding, primarily in time deposits. The nominal interest rate paid on interest-bearing liabilities decreased from an average of 4.9% in 2009 to 2.8% in 2010, which resulted in a Ps 94.7 billion decrease in interest expense. This decrease was partially offset by a 15.5% increase in the balance of average interest-bearing liabilities to Ps 5,102.6 billion in 2010 (primarily reflecting increased savings and time deposits), which was responsible for a Ps 20.5 billion increase in interest expense.
Banco AV Villas’ net interest margin decreased from 11.6% in 2009 to 9.2% in 2010; however, its spread between the yield earned on its loans and financial leases and the cost of its interest-bearing liabilities only decreased from 11.7% in 2009 to 10.8% in 2010, illustrating the primary cause of the decrease in interest income stemmed from investment securities.
Provisions
Total net provisions decreased by 34.9% to Ps 122.4 billion in 2010. This decrease was primarily driven by a decrease in net provisions for loan and financial lease losses, the main component (by volume) of total net provisions, which decreased by 28.8%, or Ps 58.7 billion, to Ps 145.1 billion as a result of the improvement of Banco AV Villas’ credit quality, which was in line with the overall recovery of the Colombian economy. Banco AV Villas’ past due loans decreased by 13.8% to Ps 198.5 billion and its delinquency ratio decreased from 5.5% at December 31, 2009 to 4.5% at December 31, 2010. This decrease was primarily a result of a reduction in past due mortgage loans, which decreased by 18.6% to Ps 67.1 billion (with a drop in their delinquency ratio from 12.1% to 11.4%), and past due commercial loans, which decreased by 36.4% to Ps 34.7 billion (with a drop in their delinquency ratio from 3.1% to 1.9%).
Charge-offs decreased by 20.1% to Ps 105.7 billion in 2010. Consistent with the decrease in charge-offs, Banco AV Villas’ charge-offs to average loan ratio declined from 3.4% in 2009 to 2.4% in 2010. The fact that Banco AV Villas’ net provisions for loan and financial lease losses were greater than its charge-offs resulted in a 18.2% increase in its allowance for loan and financial lease losses to Ps 255.5 billion at December 31, 2010. The growth of Banco AV Villas’ allowance, combined with the decrease in past due loans, resulted in the significant increase of its coverage ratio from 93.9% at December 31, 2009 to 128.7% at December 31, 2010.
Net provisions for accrued interest and other receivables decreased by 62.0% to Ps 2.6 billion as a result of the general improvement of the Colombian economy, as well as a payment received from the Colombian Government (which was fully provisioned) due to adjustments from the mortgage loan portfolio issued in 1999.
Net provisions for foreclosed assets and other assets decreased by Ps 1.3 billion to Ps (1.6) billion (meaning there was a net recovery of Ps 1.6 billion) in 2010. Gross provisions for foreclosed assets and other assets decreased by Ps 0.4 billion to Ps 2.3 billion, while reversals of provisions for foreclosed and other assets increased by Ps 0.9 billion to Ps 3.9 billion.
The recovery of charged-off assets increased by Ps 1.3 billion primarily as a result of a slightly more effective recovery effort by Banco AV Villas.
Total fees and other services income
| | | | | | | |
| | | | | | | | | | # | | | | |
| | | (in Ps billions) | | | | |
| Fees and other services income: | | | | | | | | | | | | | |
Commissions from banking services | | | 146.8 | | | | 116.0 | | | | 30.7 | | | | 26.5 | |
Branch network services | | | – | | | | – | | | | – | | | | – | |
Credit card merchant fees | | | 8.8 | | | | 4.0 | | | | 4.8 | | | | – | |
Checking fees | | | – | | | | – | | | | – | | | | – | |
Warehouse services | | | – | | | | – | | | | – | | | | – | |
Fiduciary activities | | | – | | | | – | | | | – | | | | – | |
Pension plan administration | | | – | | | | – | | | | – | | | | – | |
Other | | | 28.9 | | | | 58.8 | | | | (30.0 | ) | | | (50.9 | ) |
Total fees and other services income | | | 184.5 | | | | 178.9 | | | | 5.5 | | | | 3.1 | |
Fees and other services expenses | | | (43.9 | ) | | | (35.6 | ) | | | 8.3 | | | | 23.4 | |
Total fees and other services income, net | | | 140.5 | | | | 143.3 | | | | (2.8 | ) | | | (2.0 | ) |
Total fees and other services income decreased by 2.0% to Ps 140.5 billion in 2010. The Ps 30.7 billion increase in commissions from banking services and the Ps 30.0 billion decrease in “Other” is almost entirely explained by a reclassification of accounts, whereby an account related to commissions earned from ATM transfers was moved from the latter to the former. Also partially explaining the decrease in “Other,” was the reclassification of Ps 3.7 billion in income from “Other” to credit card merchant fees, which in turn also predominantly explains the increase in that line-item. The Ps 8.3 billion increase in fees and other service expenses to Ps 43.9 billion was due to a general increase in the volume of transactions and was in line with the organic growth of the business.
Other operating income
| | | | | | | |
| | | | | | | | | | # | | | | |
| | | (in Ps billions) | | | | |
Foreign exchange gains (losses), net | | | (0.7 | ) | | | (1.8 | ) | | | 1.0 | | | | 58.6 | |
Gains on derivative operations, net | | | 1.8 | | | | 3.4 | | | | (1.6 | ) | | | (47.8 | ) |
| Gains on sales of investments in equity securities, net | | | – | | | | – | | | | – | | | | – | |
Income from non-financial sector, net | | | – | | | | – | | | | – | | | | – | |
Dividend income | | | 2.5 | | | | 2.7 | | | | (0.2 | ) | | | (7.4 | ) |
Other | | | 6.2 | | | | – | | | | 6.2 | | | | – | |
Total other operating income | | | 9.7 | | | | 4.3 | | | | 5.5 | | | | 128.2 | |
Total other operating income increased by Ps 5.5 billion to Ps 9.7 billion in 2010. This was almost entirely due to income from the sale of a Ps 149.6 billion mortgage loan portfolio that netted Ps 6.2 billion in income. Total other operating income composed only 1.7% of total operating income for 2010.
Operating expenses
| | | | | | | |
| | | | | | | | | | # | | | | |
| | | (in Ps billions) | | | | |
Salaries and employee benefits | | | (136.4 | ) | | | (138.1 | ) | | | (1.7 | ) | | | (1.2 | ) |
Bonus plan payments | | | (1.6 | ) | | | (0.9 | ) | | | 0.6 | | | | 68.7 | |
Termination payments | | | (2.0 | ) | | | (1.5 | ) | | | 0.5 | | | | 33.9 | |
Administrative and other expenses | | | (217.6 | ) | | | (209.1 | ) | | | 8.4 | | | | 4.0 | |
Deposit security, net | | | (14.6 | ) | | | (12.4 | ) | | | 2.2 | | | | 17.8 | |
Charitable and other donation expenses | | | (0.5 | ) | | | (0.2 | ) | | | 0.3 | | | | – | |
Depreciation | | | (17.3 | ) | | | (15.6 | ) | | | 1.7 | | | | 10.9 | |
Goodwill amortization | | | – | | | | – | | | | – | | | | – | |
Total operating expenses | | | (389.8 | ) | | | (377.8 | ) | | | 12.0 | | | | 3.2 | |
Total operating expenses increased by 3.2% to Ps 389.8 billion in 2010, primarily due to a 4.0% increase in administrative and other expenses to Ps 217.6 billion related to the organic growth of the business and managing the Banco AV Villas’ larger loan portfolio. Salaries and employee benefits decreased slightly by 1.2% to Ps 136.4 billion, which was in line the 5.0% decrease in headcount from 6,381 at December 31, 2009 to 6,064 at December 31, 2010 (primarily in outsourced positions). On a per capita basis, this represented a 3.9% increase in salaries and employee benefits. The increase in operating expenses contributed to a marginal worsening of Banco AV Villas’ efficiency ratio, which increased from 50.3% in 2009 to 53.9% in 2010.
Non-operating income (expense)
Total non-operating income (expense) in 2010 was Ps 16.2 billion, a Ps 3.6 billion increase from the Ps 12.6 billion in 2009.
Income tax expense
The total income tax expense for Banco AV Villas in 2010 decreased by 10.0% to Ps 49.9 billion. This resulted because, despite the fact that the bank’s income before taxes and non-controlling interest was Ps 28.0 billion higher in 2010, its effective tax rate was 25.6% in 2010, 763 basis points lower than the prevailing 33.3% in 2009. The reason Banco AV Villas’ effective tax rate was lower in 2010 are as follows: (1) in 2010 the bank generated Ps 27.0 billion in non-taxable revenue while in 2009 that figure was only Ps 6.8 billion and (2) non-tax deductible expenses in 2010 were Ps 14.4 billion while in 2009 they were Ps 25.0 billion.
Non-controlling interest
Banco AV Villas’ non-controlling interest, responsible for only 0.3% of its net income before non-controlling interest in 2010, decreased by Ps 0.06 billion from Ps 0.43 billion in 2009. Banco AV Villas’ non-controlling interest reflects other Grupo Aval banks’ ownership in A Toda Hora S.A. See “Item 4. Information on the Company––B. Business overview—Banco Popular.”
U.S. GAAP reconciliation
We prepare our financial statements in accordance with Colombian Banking GAAP, which differs in significant respects from U.S. GAAP. Our net income attributable to Grupo Aval shareholders, in accordance with Colombian Banking GAAP, was Ps 1,291.2 billion and Ps 956.9 billion, for the year ended December 31, 2011 and 2010, respectively. Under U.S. GAAP, we would have reported a net income attributable to Grupo Aval shareholders of Ps 781.8 billion and Ps 965.3 billion, for the year ended December 31, 2011 and 2010, respectively.
The following items generated the most significant differences between Colombian Banking GAAP and U.S. GAAP in determining net income and shareholders’ equity:
| | · | Non-controlling Interest; |
| | · | Investments in Affiliated Companies; and |
For a discussion of the principal differences between Colombian Banking GAAP and U.S. GAAP as they relate to our financial statements and a reconciliation of net income in 2011 and 2010 and shareholders’ equity at December 31, 2011 and 2010, see note 30 to our audited consolidated financial statements.
Critical accounting policies under U.S. GAAP
Allowance for loan losses
Under U.S. GAAP, we consider loans to be impaired when it is probable that all amounts of principal and interest will not be collected according to the contractual terms of the loan agreement. Pursuant to ASC 310, the allowance for significant impaired loans is assessed based on the present value of estimated future cash flows discounted at the current effective loan rate or the fair value of the collateral in the case where the loan is considered collateral-dependent. An allowance for impaired loans is provided when discounted future cash flows or collateral fair value is lower than book value.
In addition, if necessary, a collective allowance for loan losses is established for individual loans, based on recent loss experience, credit scores, the risk characteristics of the various classifications of loans and other factors directly influencing the potential collectability and affecting the quality of the loan portfolio.
To calculate the allowance required for smaller-balance impaired loans, we perform an analysis of historical losses from our loan portfolios in order to estimate losses for U.S. GAAP purposes resulting from loan losses that had been incurred in such loan portfolios at the balance sheet date but which had not been individually identified. Loss estimates are analyzed by loan type and, thus, for homogeneous groups of clients. Such historical ratios are updated to incorporate the most recent data reflecting current economic conditions, industry performance trends, geographic or obligor concentrations within each portfolio segment, and any other pertinent information that may affect the estimation of the allowance for loan losses.
Many factors can affect our estimates of allowance for loan losses, including volatility of default probability, migrations and estimated loss severity.
A 10% decrease in the expected cash flows of significant impaired loans individually analyzed, could result in an additional impairment of approximately Ps 124.9 billion.
A 10% increase in the historical loss ratios for loans collectively analyzed could result in an additional impairment of approximately Ps 119.4 billion.
These sensitivity analyses do not represent management’s expectations of the deterioration in risk ratings or the increases in loss rates but are provided as hypothetical scenarios to assess the sensitivity of the allowance for loan and lease losses to changes in key inputs. We believe the risk ratings and loss severities currently in use are appropriate and that the probability of a downgrade of one level of the internal risk ratings for commercial loans and leases within a short period of time is remote.
The allowance for loan losses, which includes the allowance for loan and lease losses and the reserve for unfunded lending commitments, represents management’s estimate of probable losses inherent in Grupo Aval’s loan portfolio excluding those loans accounted for under the fair value option.
We consider accounting estimates related to loan provisions part of our critical accounting policies because the assumptions and estimates utilized to calculate future estimated losses require a high degree of judgment. It is possible that others, given the same information, may at any point in time reach different reasonable conclusions.
Contingencies
Under U.S. GAAP, ASC 450, “Accounting for Contingencies,” provides guidance for recording contingencies. Under ASC 450, there are three levels of assessment of contingent events: probable, reasonably possible and remote. The term “probable” in ASC 450 is defined as “the future event or events are likely to occur.” The term “reasonably possible” is defined as “the chance of the future event or events occurring is more than remote but less than likely.” In addition, the term “remote” is defined as “the chance of the future event or events occurring is slight.”
Under ASC 450, an estimated loss related to a contingent event is to be accrued by a charge to income if both of the following conditions are met:
| | · | information available prior to issuance of the financial statements indicates that it is probable that an asset had been impaired or a liability had been incurred at the date of the financial statements; and |
| | · | the amount of loss can be reasonably estimated. |
The amount recorded is an estimate of the amount of loss at the date of the financial statements. If the contingent event is evaluated to be reasonably possible, no provision for the contingent event may be made, but disclosure of the event is required.
We consider contingencies to be part of our critical accounting policies because of the high degree of judgment and assumptions involved in developing and applying valuation methodologies.
Fair value estimates
A portion of our assets is carried at fair value, including trading and available-for-sale securities, derivatives, asset-backed securities, loans, short-term borrowings and long-term debt to meet client needs and to manage liquidity needs and market risk. We determine the fair values of financial instruments based on the fair value hierarchy under applicable accounting guidance which requires an entity to maximize the use of observable inputs and minimize the use of unobservable inputs when measuring fair value. Applicable accounting guidance establishes three levels of inputs used to measure fair value.
ASC 820-10 defines fair value as the price that would be received to sell an asset or paid to transfer a liability in an orderly transaction between market participants at the measurement date. ASC 820-10, among other things, requires Grupo Aval to maximize the use of observable inputs and minimize the use of unobservable inputs when measuring fair value.
In addition, ASC 825-10 provides an option to elect fair value as an alternative measurement for selected financial assets, financial liabilities, unrecognized firm commitments and written loan commitments not previously recorded at fair value. Under ASC 825-10, fair value is used for both the initial and subsequent measurement of the designated assets, liabilities and commitments, with the changes on fair value recognized in net income. As a result of ASC 825-10 analysis, Grupo Aval has not elected to apply fair value accounting for any of its financial instruments not previously carried at fair value.
We consider fair value estimates to be part of our critical accounting policies because of the high degree of judgment and assumptions involved in developing and applying valuation methodologies.
Fair value hierarchy
ASC 820-10 establishes a three-level valuation hierarchy for disclosure of fair value measurements. The valuation hierarchy is based upon the transparency of inputs to the valuation of an asset or liability as of the measurement date. The three levels are defined as follows:
| | · | Level 1: inputs to the valuation methodology are quoted prices (unadjusted) for identical assets or liabilities in active markets. |
| | · | Level 2: inputs to the valuation methodology include quoted prices for similar assets and liabilities in active markets, and inputs that are observable for the asset or liability, either directly or indirectly, for substantially the full term of the asset or liability. |
Inputs include the following:
| | · | quoted prices for similar assets or liabilities in active markets; |
| | · | quoted prices for identical or similar assets or liabilities in non-active markets; |
| | · | pricing models whose inputs are observable for substantially the full term of the asset or liability; and |
| | · | pricing models whose inputs are derived principally from or corroborated by observable market data through correlation or other means. |
| | · | Level 3: inputs to the valuation methodology are unobservable and significant to the fair value measurement. |
A financial instrument’s categorization within the valuation hierarchy is based upon the lowest level of input that is significant to the fair value measurement.
Determination of fair value
Fair value is based upon quoted market prices, where available. If listed prices or quotes are not available, fair value is based upon internally developed models that use primarily market-based or independently sourced market parameters, including interest rate yield curves, option volatilities and currency rates. Valuation adjustments may be made to ensure that financial instruments are recorded at fair value. These adjustments include amounts to reflect counterparty credit quality, the Bank’s creditworthiness, liquidity and unobservable parameters that are applied consistently over time.
We consider that the accounting estimates related to the valuation of financial instruments, including derivatives, where quoted market prices are not available to be part of our critical accounting policies, as they are highly susceptible to change and require management to make assumptions about interest rates, volatility, exchange rates, the credit rating of the counterparty, valuation adjustments and specific features of the transactions.
We believe its valuation methods are appropriate and consistent with other market participants. The use of different methodologies, or assumptions, to determine the fair value of certain financial instruments could result in a different estimate of fair value at the reporting date.
Other-than-temporary impairment
Under U.S. GAAP, certain debt securities, including those securities issued or secured by the Colombian government, Colombian government entities or foreign governments, were classified as available-for-sale securities, and therefore, carried at fair value with changes in the fair value reflected in other comprehensive income for the years ended December 31, 2011 and 2010.
ASC 320 establishes a new method of recognizing and reporting other-than-temporary impairments of debt securities. Impairment is now considered to be other-than-temporary if an entity:
| | · | intends to sell the security; |
| | · | is more likely than not to be required to sell the security before recovering its cost; or |
| | · | does not expect to recover the security’s entire amortized cost basis (even if the entity does not intend to sell)—that is, a “credit loss.” |
This credit loss is based on the present value of cash flows expected to be collected from the debt security. If a credit loss exists but an entity does not intend to sell the impaired debt security and is more likely than not to not be required to sell before recovery, the impairment is other-than-temporary. It should, therefore, be separated into:
| | · | the estimated amount relating to the credit loss; and |
| | · | all other changes in fair value. |
Only the estimated credit loss amount is recognized in profit or loss; the remaining change in fair value is recognized in “Other comprehensive income.” This approach more closely aligns the impairment models for debt securities and loans by reflecting only credit losses as impairment in profit and loss.
The fair value of debt securities was determined on the balance sheet date, based primarily on the quoted market price, and in limited cases, bond valuation models are used. These models take into consideration certain assumptions in estimating future cash flows and a rate under which the cash flows are discounted.
At December 31, 2011 and 2010 the amortized cost exceeded the fair value of these securities. Nevertheless, we have determined, for U.S. GAAP purposes, that unrealized losses on these securities are temporary in nature based on our ability and intent to hold the investment for a period of time sufficient to allow for any anticipated recovery and the results of our review conducted to identify and evaluate investments that have indications of possible impairments.
Impairment of goodwill and intangibles recognized upon business combinations.
At least annually, we test goodwill and intangibles recognized upon business combinations for impairment. We use a two-step process: (1) we screen for potential impairment using an estimation of the fair value of the reporting unit; and (2) we measure the amount of impairment, if any. Management determines fair value either by reference to market value, if available, by a pricing model or with the assistance of a qualified evaluator. Any determination of fair value through a pricing model or by a qualified evaluator requires management to make assumptions and use estimates. In certain circumstances, the requirement to test goodwill for impairment annually can be satisfied without a remeasurement of the fair value of a reporting unit.
The estimated fair value of the reporting unit is highly sensitive to changes in these estimates and assumptions; therefore, in some instances, changes in these assumptions could impact whether the fair value of a reporting unit is greater than its carrying value. We perform sensitivity analyses around these assumptions in order to assess the reasonableness of the assumptions and the resulting estimated fair values. Ultimately, future potential changes in these assumptions may impact the estimated fair value of a reporting unit and cause the fair value of the reporting unit to be below its carrying value.
We consider the accounting practice of impairment testing to be part of our critical accounting policies because it involves a significant degree of estimates and assumptions that must be considered and due to the fact that valuation models are highly sensitive to changes in these assumptions and estimates.
Recognition and measurement of intangibles recognized upon business combinations
Under U.S. GAAP, we use the purchase method of accounting to account for acquired businesses. This requires us to record the assets acquired and liabilities assumed at their respective fair values at the date of acquisition. This process requires us to make certain estimates and assumptions, in particular concerning the fair values of the acquired intangible assets and property, plant and equipment, and the liabilities assumed at the date of the acquisition.
We also determine the useful lives of the acquired intangible assets, property, plant and equipment. Judgments as to purchase price allocation can materially impact our future results and so, for large acquisitions, we may obtain third-party valuations. We use different valuation methodologies for each intangible asset and base our valuation on information available at the acquisition date.
We consider these recognitions and measurements of intangibles to be part of our critical accounting policies because of the high level of estimation and assumptions that must be made.
Pension plans
Under U.S. GAAP, specifically ASC 715-30, pension plan actuarial valuation is determined annually based on the projected unit credit method and is based on actuarial, economic and demographic assumptions about future events.
We consider the accounting estimates related to our pension plans to be part of our critical accounting policies as the amounts contributed to the plans involve certain assumptions and determinations made by our actuaries relating to, among others, future macroeconomic and employee demographics factors, which will not necessarily coincide with the future outcome of such factors.
Deferred income tax assets and liabilities
Income taxes are accounted for under the asset and liability method. Deferred income tax assets and liabilities are recorded for the estimated future tax effects of temporary differences between the carrying amounts of assets and liabilities recorded for accounting and tax reporting purposes and for the future tax effects of net operating loss carryforwards. Deferred tax assets and liabilities are measured using enacted tax rates expected to apply to taxable income in the years in which those temporary differences are expected to be recovered or settled. The effect on deferred tax assets and liabilities of a change in tax rates is recognized in income in the period that includes the enactment date. We recognize a valuation allowance for a deferred tax asset if it is more likely than not that some portion or all of the deferred tax assets will not be realized. We achieve a tax benefit only if we have sufficient taxable income in future periods against which we can apply the above-mentioned carryforward.
Beginning with the adoption of FASB Interpretation No. 48, “Accounting for Uncertainty in Income Taxes (included in FASB ASC Subtopic 740 10 – Income Taxes – Overall”), at January 1, 2009, we recognize the effect of income tax positions only if those positions are more likely than not to be sustained. Recognized income tax positions are measured at the largest amount that is greater than 50% likely of being realized. Changes in recognition or measurement are reflected in the period in which the change in judgment occurs. Prior to the adoption of Interpretation 48, we recognized the effect of income tax positions only if such positions were likely to be sustained.
We review estimated future taxable income and reversals of existing temporary taxable differences in determining valuations allowances. When calculating deferred tax, we take into account our future estimates, financial statements, applicable tax legislation and interpretations of the Colombian tax authorities.
We consider the determination of deferred income tax assets and liabilities to be part of our critical accounting policies as it involves estimates of future taxable income, which can be affected, among others, by economic conditions and changes to tax regulations.
Recent U.S. GAAP pronouncements
In January 2010, the FASB issued Update No. 2010-02, “Accounting and Reporting for Decreases in Ownership of a Subsidiary—a Scope Clarification” (“2010-02”), an update of ASC 810 “Consolidation.” The objective of ASU 2010-02 is to address implementation issues related to changes in ownership provisions. This ASU clarifies that the scope of the decreases in ownership provisions within ASC Topic 810-10 and related guidance applies to decreases in ownership of a subsidiary or group of assets that is a business or nonprofit, a subsidiary that is transferred to an equity method investee or joint venture and an exchange of a group of assets that constitutes a business or nonprofit activity to a non-controlling interest including an equity method investee or a joint venture. The effect of the adoption of this standard did not have any material impact on Grupo Aval’s financial position, results of operations or operating cash flows.
On March 5, 2010, the FASB issued Accounting Standards Update 2010-11, “Scope Exception Related to Embedded Credit Derivatives,” to clarify and amend the accounting for credit derivatives embedded in beneficial interests in securitized financial assets. Currently, certain credit derivative features embedded in beneficial interests in securitized financial assets are not accounted for as derivatives. The new guidance eliminates the scope exception for embedded credit derivatives (except for those that are created solely by subordination) and provides new guidance on the evaluation to be performed. Bifurcation and separate recognition may be required for certain beneficial interests that are currently not accounted for at fair value through earnings. The new guidance became effective the first day of the first fiscal quarter beginning after June 15, 2010 (e.g., the first day of the third quarter of 2010 for calendar year-end companies), with early adoption permitted. At adoption, a company may make a one-time election to apply the fair value option on an instrument-by-instrument basis for any beneficial interest in securitized financial assets. As of December 31, 2011, Grupo Aval has not identified any embedded credit derivatives requiring disclosure.
ASU 2010-06, “Fair Value Measurements and Disclosures (Topic 820): Improving Disclosures about Fair Value Measurements” was issued in January 2010 to add additional disclosures about the different classes of assets and liabilities measured at fair value, the valuation techniques and inputs used, the activity in Level 3 fair value measurements and the transfers between Levels 1, 2 and 3. Those aspects of this disclosure standard required at December 31, 2011 did not have a material impact on the Company’s consolidated financial statements but affected disclosure presented elsewhere herein. The disclosure about purchases, sales, issuances and settlements in the rollforward of activity in level 3 fair value measurements was deferred until fiscal years beginning after December 15, 2010 and did not significantly affect the Company’s consolidated financial statements at December 31, 2011.
In July 2010, the FASB issued ASU No. 2010-20, “Receivables (Topic 310): Disclosures about the Credit Quality of Financing Receivables and the Allowance for Credit Losses.” ASU 2010-20 is intended to provide additional information to assist users of financial statement in assessing an entity’s credit risk exposures and evaluating the adequacy of its allowance for credit losses. The disclosures as of the end of a reporting period are effective for interim and annual reporting periods ending on or after December 15, 2010. The disclosures about activity that occurs during a reporting period are effective for interim and annual reporting periods beginning on or after December 15, 2010. The amendments in ASU 2010-20 encourage, but do not require, comparative disclosures for earlier reporting periods that ended before initial adoption. However, an entity should provide comparative disclosures for those reporting periods ending after initial adoption. The adoption of this guidance did not have a material impact on the Company’s financial statements.
In August 2010, the FASB issued ASU 2010-21, “Accounting for Technical Amendments to Various SEC Rules and Schedules.” This ASU amends Release No. 33-9026: Technical Amendments to Rules, Forms, Schedules, and Codification of Financial Reporting Policies and did not have a significant impact on the Company’s financial statements at December 31, 2011.
In August 2010, the FASB issued ASU 2010-22, “Technical Corrections to SEC Paragraphs – An announcement made by the staff of the U.S. Securities and Exchange Commission.” This ASU amends various SEC paragraphs based on external comments received and the issuance of SAB 112, which amends or rescinds portions of certain SAB topics and did not have a significant impact on the Company’s financial statements at December 31, 2011.
In December 2010, the FASB issued ASU 2010-28, “When to Perform Step 2 of the Intangibles-Goodwill and Others,” to provide guidance on when to perform Step 2 of the goodwill impairment test for reporting units with zero or negative carrying amounts. This amendment to ASC 350 is effective for annual reporting periods beginning after December 15, 2010 for public companies. Transition requirements specify that companies must perform the Step 2 test on adoption for reporting units with a zero or negative carrying amount for which qualitative factors exist that indicate it is more likely than not that a goodwill impairment exists. Any resulting impairment charge would be recorded through a cumulative-effect adjustment to beginning retained earnings. This amendment did not have a material impact on the Company at December 31, 2011.
In January 2011, the FASB issued ASU 2011-01, “Deferral of the Effective Date of Disclosures about Troubled Debt Restructurings in Update No. 2010-20.” This ASU temporarily delays the effective date of the disclosures about troubled debt restructurings in Update 2010-20 for public entities. The delay was intended to allow the FASB time to complete its deliberations on what constitutes a troubled debt restructuring, and was resolved with the issuance of ASU 2011-02.
In April 2011, the FASB issued ASU 2011-02, Receivables (Topic 310), “A Creditor’s Determination of Whether a Restructuring Is a Troubled Debt Restructuring.” The amendments in this update provide additional guidance and clarification to help creditors determine whether a creditor has granted a concession and whether a debtor is experiencing financial difficulties for purposes of determining whether a restructuring constitutes a troubled debt restructuring. The amendments in this update became effective for the first interim or annual reporting period beginning on or after June 15, 2011, and they should be applied retrospectively to the beginning annual period of adoption. As a result of these amendments, an entity may identify receivables that are newly considered impaired. For purposes of measuring impairment of those receivables, an entity should apply the amendments prospectively for the first interim or annual period beginning on or after June 15, 2011. The adoption of this guidance did not have a material impact on the Company’s financial statements.
ASU 2011-03 concerns the improvement of accounting-for-repurchase agreements (repos) and other agreements that both entitle and require a transferor to repurchase or redeem financial assets before their maturity by amending the criteria for determining effective control of collateral. The guidance is effective for fiscal quarters and years beginning on or after December 15, 2011. Grupo Aval does not expect any significant effect from the adoption of this new standard.
In May 2011, the FASB issued ASU 2011-04, “Amendments to Achieve Common Fair Value Measurement and Disclosure Requirements in U.S. GAAP and IFRS.” The amendments in this update result in common fair value measurement and disclosure requirements in U.S. GAAP and IFRS. Consequently, the amendments change the wording used to describe many of the requirements in U.S. GAAP for measuring fair value and for disclosing information about fair value measurements. The amendments in this update are to be applied prospectively. For public entities, the amendments are effective during interim and annual periods beginning after December 15, 2011. For nonpublic entities, the amendments are effective for annual periods beginning after December 15, 2011. Early application by public entities is not permitted. This ASU is not expected to have a significant impact on the Company’s financial statements.
In June 2011, the FASB issued ASU 2011-05, “Presentation of Comprehensive Income.” The amendments in this update improve the comparability, clarity, consistency and transparency of financial reporting and increase the prominence of items reported in other comprehensive income. To increase the prominence of items reported in other comprehensive income and to facilitate convergence of U.S. GAAP and IFRS, the option to present components of other comprehensive income as part of the statement of changes in stockholders’ equity was eliminated. The amendments require that all non-owner changes in stockholders’ equity be presented either in a single continuous statement of comprehensive income or in two separate but consecutive statements. In the two-statement approach, the first statement should present total net income and its components should be followed consecutively by a second statement that should present total other comprehensive income, the components of other comprehensive income and the total of comprehensive income. All entities that report items of comprehensive income, in any period presented, will be affected by the changes in this update. For public entities, the amendments are effective for fiscal years, and interim periods within those years, beginning after December 15, 2011. For nonpublic entities, the amendments are effective for fiscal years ending after December 15, 2012, and interim and annual periods thereafter. The amendments in this update should be applied retrospectively and early adoption is permitted. This ASU is not expected to have a significant impact on the Company’s financial statements.
In September 2011, the FASB issued ASU 2011-08, “Intangibles – Goodwill and Other Topics (Topic 350), Testing Goodwill for Impairment.” The objective of this update is to simplify how entities, both public and nonpublic, test goodwill for impairment. The amendments in the update permit an entity to first assess qualitative factors to determine whether it is more likely than not that the fair value of a reporting unit is less than its carrying amount as a basis for determining whether it is necessary to perform the two-step goodwill impairment test described in Topic 350. The more-likely-than-not threshold is defined as having a likelihood of more than 50 percent. Under the amendments in this update, an entity is not required to calculate the fair value of a reporting unit unless the entity determines that it is more likely than not that its fair value is less than its carrying amount. The amendments in this update apply to all entities, both public and nonpublic, that have goodwill reported in their financial statements. The amendments are effective for interim and annual goodwill impairment tests performed for fiscal years beginning after December 15, 2011. Early adoption is permitted, including for annual and interim goodwill impairment tests performed as of a date before September 15, 2011, if an entity’s financial statements for the most recent annual or interim period have not yet been issued or, for nonpublic entities, have not yet been made available for issuance. This ASU is not expected to have a significant impact on the Company’s financial statements.
In December 2011, FASB issued ASU 2011-12, “Deferral of the Effective Date for Amendments to the Presentation of Reclassifications of Items Out of Accumulated Other Comprehensive Income in Accounting Standards Update No. 2011-05” to effectively defer only those changes in update 2011-05 that relate to the presentation of reclassification adjustments out of accumulated other comprehensive income. The amendments will be temporary to allow the Board time to redeliberate the presentation requirements for reclassifications out of accumulated other comprehensive income for annual and interim financial statements for public, private and non-profit entities. All other requirements in update 2011-05 are not affected by this update, including the requirement to report comprehensive income either in a single continuous financial statement or in two separate but consecutive financial statements. Public entities should apply these requirements for fiscal years, and interim periods within those years, beginning after December 15, 2011.
The following table sets forth our internal and external sources of funding at December 31, 2011, 2010 and 2009.
| | | | |
| | | 2011 | | | 2010 | | | 2009 | |
| | | (in Ps billions) | |
| Liabilities and shareholders’ equity: | | | | | | | | | |
Deposits | | | 71,007.6 | | | | 63,669.3 | | | | 49,348.5 | |
Bankers’ acceptances outstanding | | | 123.3 | | | | 59.2 | | | | 41.6 | |
Interbank borrowings and overnight funds | | | 3,225.1 | | | | 2,477.4 | | | | 2,753.7 | |
Borrowings from banks and others | | | 11,437.8 | | | | 10,491.2 | | | | 3,854.9 | |
Accounts payable | | | 3,093.9 | | | | 2,243.5 | | | | 1,518.5 | |
Accrued interest payable | | | 313.0 | | | | 247.4 | | | | 269.1 | |
Other liabilities | | | 1,793.5 | | | | 1,542.0 | | | | 950.7 | |
Long-term debt (bonds) | | | 6,566.2 | | | | 5,952.4 | | | | 3,422.2 | |
Estimated liabilities | | | 855.3 | | | | 596.9 | | | | 711.6 | |
Non-controlling interest | | | 4,927.0 | | | | 4,475.5 | | | | 4,038.0 | |
Total liabilities | | | 103,342.7 | | | | 91,754.7 | | | | 66,908.8 | |
Total shareholders’ equity | | | 8,159.1 | | | | 4,554.6 | | | | 4,084.3 | |
Total liabilities and shareholders’ equity | | | 111,501.9 | | | | 96,309.3 | | | | 70,993.1 | |
In 2010, the Superintendency of Finance modified the classification criteria for derivatives. Derivatives were previously required to be shown net of liabilities, under assets in the Bankers’ acceptances, spot transactions and derivatives financial instruments line item. They are now shown gross, as assets and liabilities, and the liabilities are added in the Bankers’ acceptances and derivatives financial instruments line item. Pursuant to these rules and for the purposes of this section, derivatives (liabilities) are excluded from the Bankers’ acceptances outstanding line item and are included under “Other liabilities.”
Capitalization ratios
The following table presents consolidated capitalization ratios for our banking subsidiaries, Grupo Aval and our principal competitors at December 31, 2011.
| | | At December 31, 2011 | |
| | | Grupo Aval entities | | | | | | | | | | | | | |
| Colombian Banking GAAP | | Banco de Bogotá | | | Banco de Occidente | | | Banco Popular | | | Banco AV Villas | | | Aggregate (1) | | | Grupo Aval consolidated | | | Bancolombia | | | Davivienda | | | BBVA Colombia | |
| | | (in percentages) | |
Tangible equity ratio (2) | | | 10.0 | | | | 13.5 | | | | 13.6 | | | | 12.3 | | | | 11.4 | | | | 9.2 | | | | 9.9 | | | | 10.3 | | | | 8.3 | |
Tier 1 ratio (3) | | | 12.0 | | | | 8.7 | | | | 9.1 | | | | 12.5 | | | | 11.0 | | | | – | | | | 9.0 | | | | 11.4 | | | | 9.5 | |
Solvency ratio (4) | | | 13.3 | | | | 10.1 | | | | 11.7 | | | | 14.2 | | | | 12.6 | | | | – | | | | 12.5 | | | | 14.4 | | | | 12.3 | |
Source: Company calculations based on each entity’s respective financial statements for the period indicated.
| (1) | Reflects the summation of calculated amounts for each line item for each of our banking subsidiaries. |
| (2) | Tangible equity ratio is calculated as total shareholders’ equity plus minority interest minus goodwill, divided by total assets minus goodwill. See “Item 3. Key Information—A. Selected financial data—Non-GAAP measures reconciliation.” |
| (3) | Tier 1 ratio is calculated as primary capital divided by risk-weighted assets. |
| (4) | Solvency ratio is calculated as technical capital divided by risk-weighted assets. For a definition of technical capital, |
| | see “Item 4. Information on the Company—B. Business overview—Supervision and regulation—Capital adequacy requirements.” |
| | Tangible solvency ratio differs from solvency ratio. Tangible solvency ratio is calculated as technical capital minus goodwill, divided by risk-weighted assets minus goodwill. The tangible solvency ratios for the following entities at December 31, 2011 were: Banco de Bogotá 9.3%, Banco de Occidente 9.9%, Banco Popular 11.7%, Banco AV Villas 14.2%, Grupo Aval (aggregate) 10.0%, Bancolombia 11.7%, Davivienda 11.3% and BBVA Colombia 10.5%. |
Each of our banking subsidiaries is required by the Superintendency of Finance to maintain a solvency ratio of at least 9.0% of its total risk-weighted assets. As Grupo Aval is not regulated as a financial institution or bank holding company, it is not required to comply with capital adequacy regulations applicable to our banking subsidiaries. The following tables set forth reported and as-adjusted capital adequacy information for each of our banking subsidiaries at December 31, 2011 and 2010. The reported figures are calculated using the methodology prescribed by the Superintendency of Finance, which requires that we subtract investments in non-consolidated entities from our regulatory capital. The as-adjusted amounts have been adjusted not to subtract non-controlling interest in financial institutions, which are consolidated in other Grupo Aval subsidiaries at December 31, 2011 and 2010 (principally Banco de Bogotá’s non-controlling interest held through Corficolombiana in Banco de Occidente at December 31, 2010; Banco de Occidente’s investment in Corficolombiana and Porvenir, consolidated into Grupo Aval through Banco de Bogotá; and Banco Popular’s stake in Corficolombiana, consolidated into Grupo Aval through Banco de Bogotá). Management uses these as-adjusted amounts when reviewing the capitalization of our banking subsidiaries in part because we believe that the inclusion of such investments presents a more comprehensive picture of our capitalization.
The following tables present consolidated capitalization ratios for our banking subsidiaries at December 31, 2011 and 2010. For a reconciliation of these capitalization ratios to Colombian Banking GAAP, “Item 4. Information on the Company—B. Business overview—Industry—Supervision and regulation—Capital adequacy requirements.”
Banco de Bogotá (Consolidated) | | | | | | |
| | | | | | | | | | | | | |
| | | | | | | | | | | | | | | | | | | | | | | | | |
| | | (Ps billions, except percentages) | | | (Ps billions, except percentages) | |
Primary capital (Tier I) | | | 7,175 | | | | 12.0 | % | | | 7,401 | | | | 12.3 | % | | | 4,497.1 | | | | 8.9 | % | | | 4,769.4 | | | | 9.4 | % |
Secondary capital (Tier II) | | | 823 | | | | 1.4 | % | | | 826 | | | | 1.4 | % | | | 3,137.5 | | | | 6.2 | % | | | 3,140.6 | | | | 6.2 | % |
Primary and secondary capital (Tier I and II) | | | 7,998 | | | | 13.3 | % | | | 8,227 | | | | 13.7 | % | | | 7,634.5 | | | | 15.1 | % | | | 7,910.0 | | | | 15.5 | % |
| Risk-weighted assets including regulatory value at risk (1) | | | 59,961 | | | | – | | | | 60,189 | | | | – | | | | 50,663.7 | | | | – | | | | 50,937.1 | | | | – | |
Source: Company calculations based on each bank’s respective consolidated financial statements for the period indicated.
| (1) | Regulatory value at risk is calculated in accordance with the Superintendency of Finance guidelines, see “Item 4. Information on the Company—B. Business overview—Supervision and regulation—Capital adequacy requirements.” |
| (2) | Adjusted to reflect non-consolidated interests in Leasing de Occidente. In June 2010, Banco de Occidente and Leasing de Occidente merged. |
Banco de Occidente (Consolidated) | | | | | | |
| | | | | | | | | | | | | |
| | | | | | | | | | | | | | | | | | | | | | | | | |
| | | (Ps billions, except percentages) | | | (Ps billions, except percentages) | |
Primary capital (Tier I) | | | 1,568 | | | | 8.7 | % | | | 2,003 | | | | 10.9 | % | | | 1,196.0 | | | | 8.0 | % | | | 1,557.2 | | | | 10.2 | % |
Secondary capital (Tier II) | | | 239 | | | | 1.3 | % | | | 565 | | | | 3.1 | % | | | 302.0 | | | | 2.0 | % | | | 631.3 | | | | 4.1 | % |
Primary and secondary capital (Tier I and II) | | | 1,808 | | | | 10.1 | % | | | 2,567 | | | | 14.0 | % | | | 1,498.0 | | | | 10.0 | % | | | 2,188.6 | | | | 14.3 | % |
| Risk-weighted assets including regulatory value at risk (1) | | | 17,947 | | | | – | | | | 18,390 | | | | – | | | | 14,921.2 | | | | – | | | | 15,290.3 | | | | – | |
Source: Company calculations based on each bank’s respective consolidated financial statements for the period indicated.
| (1) | Regulatory value at risk is calculated in accordance with the Superintendency of Finance guidelines, see “Item 4. Information on the Company—B. Business overview—Supervision and regulation—Capital adequacy requirements.” |
| (2) | Adjusted to reflect non-consolidated interests in Porvenir and Corficolombiana. |
Banco Popular (Consolidated) | | | | | | |
| | | | | | | | | | | | | |
| | | | | | | | | | | | | | | | | | | | | | | | | |
| | | (Ps billions, except percentages) | | | (Ps billions, except percentages) | |
Primary capital (Tier I) | | | 1,095 | | | | 9.1 | % | | | 1,181 | | | | 9.7 | % | | | 921.4 | | | | 8.4 | % | | | 990.8 | | | | 9.0 | % |
Secondary capital (Tier II) | | | 311 | | | | 2.6 | % | | | 451 | | | | 3.7 | % | | | 380.1 | | | | 3.5 | % | | | 522.8 | | | | 4.7 | % |
Primary and secondary capital (Tier I and II) | | | 1,405 | | | | 11.7 | % | | | 1,632 | | | | 13.5 | % | | | 1,301.4 | | | | 11.8 | % | | | 1,513.6 | | | | 13.7 | % |
| Risk-weighted assets including regulatory value at risk (1) | | | 12,047 | | | | – | | | | 12,134 | | | | – | | | | 10,998.5 | | | | – | | | | 11,067.9 | | | | – | |
Source: Company calculations based on each bank’s respective consolidated financial statements for the period indicated.
| (1) | Regulatory value at risk is calculated in accordance with the Superintendency of Finance guidelines, see “Item 4. Information on the Company—B. Business overview—Supervision and regulation—Capital adequacy requirements.” |
| (2) | Adjusted to reflect non-consolidated interests in Corficolombiana. |
Banco AV Villas (Consolidated) | | | | | | |
| | | | | | | |
| | | | | | | | | | | | | |
Primary capital (Tier I) | | | 700 | | | | 12.5 | % | | | 598.8 | | | | 12.1 | % |
Secondary capital (Tier II) | | | 100 | | | | 1.8 | % | | | 100.6 | | | | 2.0 | % |
| Primary and secondary capital (Tier I and II) | | | 800 | | | | 14.2 | % | | | 699.4 | | | | 14.1 | % |
| Risk-weighted assets including regulatory value at risk (1) | | | 5,617 | | | | – | | | | 4,943.1 | | | | – | |
Source: Company calculations based on each bank’s respective consolidated financial statements for the period indicated.
| (1) | Regulatory value at risk is calculated in accordance with the Superintendency of Finance guidelines, see “Item 4. Information on the Company—B. Business overview—Supervision and regulation—Capital adequacy requirements.” |
Funding
Our banks fund most of their assets with local deposits, consistent with other Colombian banks. Other sources of funding include interbank borrowings and overnight funds, and borrowings from development banks and long-term bond issuances.
The following table summarizes the funding structure of our banks at the dates indicated.
| | | | |
| | | | | | | | | | |
| | | (in Ps billions) | |
| Deposits | | | 71,007.6 | | | | 63,669.3 | | | | 49,348.5 | |
| Borrowings from banks and others | | | 11,437.8 | | | | 10,491.2 | | | | 3,854.9 | |
| Bankers’ acceptance outstanding | | | 123.3 | | | | 59.2 | | | | 41.6 | |
| Interbank borrowings and overnight funds | | | 3,225.1 | | | | 2,477.4 | | | | 2,753.7 | |
| Long-term debt (bonds) | | | 6,566.2 | | | | 5,952.4 | | | | 3,422.2 | |
| Total funding | | | 92,360.0 | | | | 82,649.4 | | | | 59,420.9 | |
From year-end 2010 to year-end 2011, interbank borrowings and overnight funds increased as a percentage of total funding by 0.5 percentage points, while borrowings from banks and others and deposits decreased by 0.3 and 0.2 percentage points, respectively.
From year-end 2009 to year-end 2010, deposits decreased as a percentage of total funding by 6.0 percentage points, interbank borrowings and overnight funds decreased by 1.6 percentage points, borrowings from banks and others increased by 6.2 percentage points, and bonds increased by 1.4 percentage points.
In 2011 total funding increased by 11.7 percentage points from the same period in 2010, mainly as a result of an increase in deposits and in borrowings from banks and others. From year-end 2010 to year-end 2011 total deposits decreased as a percentage of total funding by 0.2 percentage points, from 77.0% to 76.9%, mainly due to an increase in interbank borrowings and overnight funds which increased from 3.0% of total funding in December 2010 to 3.5% in December 2011.
Our banks’ funding base also benefits from the highest available local credit ratings for each of our banking subsidiaries and each of Porvenir and Corficolombiana, as assigned by BRC Investor Services S.A. S.C.V., an affiliate of Moody’s Investors Services, Inc. Banco Popular and Banco AV Villas have also achieved the highest available local credit ratings as assigned by Value and Risk Rating S.A. S.C.V. In addition, Banco de Bogotá’s 5.00% Senior Notes due 2017 were rated Baa2 by Moody’s, BBB- by Fitch and BBB- by Standard and Poor’s at issuance, and Grupo Aval’s 5.25% Senior Notes due 2017 were rated Baa3 by Moody’s and BBB- by Fitch at issuance. Any adverse change in credit ratings may increase the cost of our funding. See “Item 3. Key Information—D. Risk factors—Risks relating to our businesses and industry—Risks relating to our banking business—Downgrades in our credit rating or in the credit ratings of our banking subsidiaries would increase the cost of, or impair access to, funding.”
We believe that our working capital is sufficient to meet the company’s present requirements and that the current level of funding of each of our banks is adequate to support its business.
The following table presents our consolidated funding from deposits at the dates indicated.
| | | | |
| | | | | | | | | | |
| | | (in Ps billions) | |
| Interest-bearing deposits: | | | | | | | | | |
| Checking accounts | | | 7,167.8 | | | | 6,191.1 | | | | 1,629.3 | |
| Time deposits | | | 22,630.5 | | | | 18,615.0 | | | | 16,144.2 | |
| Savings deposits | | | 27,912.0 | | | | 26,021.2 | | | | 21,313.7 | |
| Total | | | 57,710.2 | | | | 50,827.4 | | | | 39,087.2 | |
| Non-interest-bearing deposits: | | | | | | | | | | | | |
| Checking accounts | | | 12,250.0 | | | | 11,861.3 | | | | 9,511.2 | |
| Other deposits | | | 1,047.4 | | | | 980.6 | | | | 750.1 | |
| Total | | | 13,297.4 | | | | 12,841.9 | | | | 10,261.3 | |
| Total deposits | | | 71,007.6 | �� | | | 63,669.3 | | | | 49,348.5 | |
Checking accounts. Our consolidated balance of checking accounts was Ps 19,417.8 billion at December 31, 2011, Ps 18,052.4 billion at December 31, 2010 and Ps 11,140.5 billion at December 31, 2009, representing 21.0%, 21.8% and 18.7% of total funding, respectively. The decrease in total funding share of deposits was primarily due to a lower growth rate of checking accounts and an increase in total funding share of interbank borrowing and overnight funds.
Time deposits. Our consolidated balance of time deposits was Ps 22,630.5 billion at December 31, 2011, Ps 18,615.0 billion at December 31, 2010 and Ps 16,144.2 billion at December 31, 2009, representing 24.5%, 22.5% and 27.2% of total funding, respectively.
The following table presents time deposits held at December 31, 2011, by amount and maturity for deposits.
| | | | |
| | | | | | Foreign currency-denominated | | | | |
| | | (in Ps billions) | |
Up to 3 months | | | 3,607.4 | | | | 3,247.2 | | | | 6,854.5 | |
From 3 to 6 months | | | 1,878.0 | | | | 1,084.2 | | | | 2,962.2 | |
From 6 to 12 months | | | 4,114.2 | | | | 1,453.1 | | | | 5,567.3 | |
More than 12 months | | | 3,404.2 | | | | 610.2 | | | | 4,014.4 | |
Time deposits less than U.S.$100,000 (1) | | | 2,317.7 | | | | 914.4 | | | | 3,232.1 | |
Total | | | 15,321.5 | | | | 7,309.0 | | | | 22,630.5 | |
| (1) | Equivalent to Ps 194.3 million at the representative market rate at December 31, 2011. |
Savings deposits. Our consolidated balance of savings deposits was Ps 27,912.0 billion at December 31, 2011, Ps 26,021.2 billion at December 31, 2010 and Ps 21,313.7 billion at December 31, 2009, representing 30.2%, 31.5% and 35.9% of total funding, respectively.
Other deposits. Our consolidated balance of other deposits, which consist of deposits from correspondent banks, cashier checks and collection services, was Ps 1,047.4 billion at December 31, 2011, Ps 980.6 billion at December 31, 2010 and Ps 750.1 billion at December 31, 2009, representing 1.1%, 1.2% and 1.3%, respectively.
Interbank borrowings and overnight funds. Our consolidated balance of interbank borrowings and overnight funds was Ps 3,225.1 billion at December 31, 2011, Ps 2,477.4 billion at December 31, 2010 and Ps 2,753.7 billion at December 31, 2009, representing 3.5%, 3.0% and 4.6% of total funding, respectively.
The following table sets forth our short-term borrowings consisting of interbank borrowings for the periods indicated.
| | | | |
| | | | | | | | | | |
| | | | | | | | | | | | | | | | | | | |
| | | (in Ps billions, except percentages) | |
| Short-term borrowings | | | | | | | | | | | | | | | | | | |
| Interbank borrowings and overnight funds | | | | | | | | | | | | | | | | | | |
End of period | | | 3,225.1 | | | | – | | | | 2,477.4 | | | | – | | | | 2,753.7 | | | | – | |
Average during period | | | 4,279.6 | | | | 3.4 | % | | | 3,955.4 | | | | 2.5 | % | | | 2,377.7 | | | | 4.7 | % |
| Maximum amount of borrowing at any month-end | | | 5,977.3 | | | | – | | | | 6,884.8 | | | | – | | | | 3,619.1 | | | | – | |
Interest paid during the period | | | 146.9 | | | | – | | | | 99.0 | | | | – | | | | 111.7 | | | | – | |
As part of their interbank transactions, our banks maintain a portfolio of government securities and private sector liquid debt instruments used to obtain overnight funds from other financial institutions or investment funds by selling such securities and simultaneously agreeing to repurchase them. Due to the short-term nature of this source of funding, these transactions are volatile and are generally composed of Colombian government securities.
Borrowings from banks and others. Borrowings from banks are provided by correspondent banks and by governmental entities to promote lending to specific sectors of the Colombian economy. This funding, which mainly has fully matched maturities and interest rates with related loans, totaled 11,437.8 billion at December 31, 2011, Ps 10,491.2 billion at December 31, 2010 and Ps 3,854.9 billion at December 31, 2009, representing 12.4%, 12.7% and 6.5% of total funding, respectively.
Bankers’ acceptances outstanding. Our consolidated bankers’ acceptances outstanding balance was Ps 123.3 billion at December 31, 2011, Ps 59.2 billion at December 31, 2010 and Ps 41.6 billion at December 31, 2009, representing 0.1%, 0.1% and 0.1%, of total funding, respectively.
Bonds. We issue bonds in the Colombian markets. Our consolidated balance of bonds outstanding was Ps 6,566.2 billion at December 31, 2011, Ps 5,952.4 billion at December 31, 2010 and Ps 3,422.2 billion at December 31, 2009, representing 7.1%, 7.2% and 5.8% of total funding, respectively. On December 19, 2011 Banco de Bogotá issued U.S.$600 million (Ps 1,165.6 billion) of its 5.00% Senior Notes due 2017 in the international markets.
The following bond issuances were placed in the Colombian market in 2011:
| | | | | | | | |
| (in Ps billions, unless otherwise indicated) |
| Banco de Bogotá S.A. | | 2011 | | 1,165.6 | | January 2017 | | 5.00% |
Banco de Occidente S.A. | | 2011 | | 400.0 | | March 2014 to March 2016 | | IPC + 2.49% to IPC + 3.05% to 6.65% to 7.25% |
Banco de Occidente S.A. | | 2011 | | 247.1 | | September 2014 to September 2021 | | IPC + 4.0% to IBR + 1.80% |
| Banco Popular S.A. | | 2011 | | 400.0 | | February 2013 to August 2015 | | IPC + 7.0% |
| Banco de América Central | | 2011 | | 30.9 | | January 2012 to December 2016 | | 4.00% to 4.25% |
BAC Credomatic Guatemala | | 2011 | | 164.8 | | January 2012 to December 2012 | | 4.65% to 8.69% |
On February 1, 2012, Grupo Aval completed the Grupo Aval Debt Offering, consisting of U.S.$600 million of 5.25% Senior Notes due 2017.
Banco de Bogotá
For the year ended December 31, 2011, the proportion of total deposits in Banco de Bogotá’s total funding increased 2.3% due to a significant decrease in long-term debt. The decrease in long-term debt was due to the conversion of the Ps 2,285 billion of convertible bonds issued on November 19, 2010 offset by the issuance on December 19, 2011 of U.S.$600 million (Ps 1,165.6 billion) of 5.00% Senior Notes due 2017.
The following table presents the composition of Banco de Bogotá’s funding at the dates indicated.
| | | | |
| | | | | | | | | | |
| | | (in Ps billions) | | | % | | | (in Ps billions) | | | % | | | (in Ps billions) | | | % | |
Checking accounts | | | 12,510.6 | | | | 22.4 | | | | 11,004.6 | | | | 21.8 | | | | 5,167.1 | | | | 17.8 | |
Time deposits | | | 15,450.3 | | | | 27.7 | | | | 12,774.7 | | | | 25.4 | | | | 9,137.5 | | | | 31.4 | |
Savings deposits | | | 14,805.4 | | | | 26.5 | | | | 13,653.7 | | | | 27.1 | | | | 9,729.5 | | | | 33.4 | |
Other deposits | | | 600.2 | | | | 1.1 | | | | 559.3 | | | | 1.1 | | | | 347.9 | | | | 1.2 | |
Total deposits | | | 43,366.5 | | | | 77.7 | | | | 37,992.3 | | | | 75.4 | | | | 24,382.0 | | | | 83.8 | |
| | | | | | | | | | | | | | | | | | | | | | | | | |
Interbank and overnight funds | | | 2,507.2 | | | | 4.5 | | | | 1,789.1 | | | | 3.6 | | | | 2,224.0 | | | | 7.6 | |
Borrowings from banks and other | | | 7,680.8 | | | | 13.8 | | | | 7,094.2 | | | | 14.1 | | | | 1,850.0 | | | | 6.4 | |
Bankers’ acceptance outstanding | | | 85.3 | | | | 0.2 | | | | 39.2 | | | | 0.1 | | | | 28.3 | | | | 0.1 | |
| Long-term debt (includes convertible bonds) | | | 2,174.8 | | | | 3.9 | | | | 3,460.7 | | | | 6.9 | | | | 616.5 | | | | 2.1 | |
Total other funding | | | 12,448.0 | | | | 22.3 | | | | 12,383.2 | | | | 24.6 | | | | 4,718.9 | | | | 16.2 | |
Total funding | | | 55,814.5 | | | | 100.0 | | | | 50,375.6 | | | | 100.0 | | | | 29,100.9 | | | | 100.0 | |
Banco de Occidente
Checking accounts, which have historically constituted an important proportion of funding for Banco de Occidente, decreased by 7.6% for the year ended December 31, 2011, from 34.4% at December 31, 2010. This decrease was due to a 3.4% increase in interbank and overnight funds a 2.6% increase in savings deposits and a 1.7% increase in long-term debt.
For the year ended December 31, 2011, the proportion of total deposits in Banco de Occidente’s total funding decreased by 4.6% to 76.1%. For the year ended December 31, 2010, the proportion of total deposits in Banco de Occidente’s total funding increased 0.2% primarily due to a decrease in borrowings from banks and others.
The following table presents the composition of Banco de Occidente’s funding at the dates indicated.
| | | | |
| | | | | | | | | | |
| | | (in Ps billions) | | | % | | | (in Ps billions) | | | % | | | (in Ps billions) | | | % | |
Checking accounts | | | 4,897.7 | | | | 26.8 | | | | 5,301.5 | | | | 34.4 | | | | 4,426.1 | | | | 29.0 | |
Time deposits | | | 3,002.7 | | | | 16.4 | | | | 2,463.7 | | | | 16.0 | | | | 3,219.2 | | | | 21.1 | |
Savings deposits | | | 5,729.0 | | | | 31.3 | | | | 4,436.1 | | | | 28.8 | | | | 4,434.0 | | | | 29.0 | |
Other deposits | | | 291.1 | | | | 1.6 | | | | 240.2 | | | | 1.6 | | | | 228.9 | | | | 1.5 | |
Total deposits | | | 13,920.5 | | | | 76.1 | | | | 12,441.4 | | | | 80.7 | | | | 12,308.2 | | | | 80.5 | |
| | | | | | | | | | | | | | | | | | | | | | | | | |
Interbank and overnight funds | | | 628.6 | | | | 3.4 | | | | 12.8 | | | | 0.1 | | | | 31.2 | | | | 0.2 | |
Borrowings from banks and other | | | 1,701.8 | | | | 9.3 | | | | 1,522.6 | | | | 9.9 | | | | 1,578.9 | | | | 10.3 | |
Bankers’ acceptance outstanding | | | 36.3 | | | | 0.2 | | | | 18.5 | | | | 0.1 | | | | 12.6 | | | | 0.1 | |
Long-term debt (bonds) | | | 1,995.6 | | | | 10.9 | | | | 1,421.1 | | | | 9.2 | | | | 1,355.7 | | | | 8.9 | |
Total other funding | | | 4,362.3 | | | | 23.9 | | | | 2,975.0 | | | | 19.3 | | | | 2,978.4 | | | | 19.5 | |
Total funding | | | 18,282.7 | | | | 100.0 | | | | 15,416.4 | | | | 100.0 | | | | 15,286.6 | | | | 100.0 | |
Banco Popular
In, 2011, Banco Popular decreased its proportion of deposits to total funding by 0.7%. This decrease was primarily due to a decrease in savings deposits by 3.5%. This was partially offset by a 2.5% increase in time deposits.
The following table presents the composition of Banco Popular’s funding at the dates indicated.
| | | | |
| | | | | | | | | | |
| | | (in Ps billions) | | | % | | | (in Ps billions) | | | % | | | (in Ps billions) | | | % | |
Checking accounts | | | 1,493.3 | | | | 13.3 | | | | 1,270.6 | | | | 12.6 | | | | 1,170.9 | | | | 13.1 | |
Time deposits | | | 1,916.5 | | | | 17.0 | | | | 1,460.1 | | | | 14.5 | | | | 2,030.4 | | | | 22.7 | |
Savings deposits | | | 5,751.2 | | | | 51.1 | | | | 5,497.9 | | | | 54.6 | | | | 5,050.9 | | | | 56.5 | |
Other deposits | | | 94.3 | | | | 0.8 | | | | 119.6 | | | | 1.2 | | | | 129.4 | | | | 1.4 | |
Total deposits | | | 9,255.3 | | | | 82.3 | | | | 8,348.1 | | | | 83.0 | | | | 8,381.6 | | | | 93.8 | |
| | | | | | | | | | | | | | | | | | | | | | | | | |
Interbank and overnight funds | | | – | | | | 0.0 | | | | 2.9 | | | | – | | | | – | | | | – | |
Borrowings from banks and other | | | 539.2 | | | | 4.8 | | | | 309.5 | | | | 3.1 | | | | 252.7 | | | | 2.8 | |
Bankers’ acceptance outstanding | | | 1.5 | | | | 0.0 | | | | 1.4 | | | | – | | | | 0.7 | | | | – | |
Long-term debt (bonds) | | | 1,451.5 | | | | 12.9 | | | | 1,400.0 | | | | 13.9 | | | | 300.0 | | | | 3.4 | |
Total other funding | | | 1,992.1 | | | | 17.7 | | | | 1,713.8 | | | | 17.0 | | | | 553.4 | | | | 6.2 | |
Total funding | | | 11,247.4 | | | | 100.0 | | | | 10,061.9 | | | | 100.0 | | | | 8,934.9 | | | | 100.0 | |
Banco AV Villas
Historically, Banco AV Villas has had a small proportion of checking accounts to total funding, as it only began providing checking services when it was converted into a commercial bank in 2002.
In 2011, the proportion of savings deposits and time deposits to total funding increased by 7.2 and 3.0 percentage points, respectively, as compared to December 31, 2010. However, the proportion of checking accounts, which historically has had a small proportion of total funding, decreased by 0.4 of a percentage point. During the year ended December 31, 2011, the proportion of total deposits in Banco AV Villas’ total funding increased 9.7% due to a decrease in interbank and overnight funds.
The following table presents the composition of Banco AV Villas’ funding at the dates indicated.
| | | | |
| | | | | | | | | | |
| | | | |
| | | (in Ps billions) | | | % | | | (in Ps billions) | | | % | | | (in Ps billions) | | | % | |
Checking accounts | | | 535.2 | | | | 8.4 | | | | 513.3 | | | | 8.7 | | | | 388.3 | | | | 7.7 | |
Time deposits | | | 2,279.5 | | | | 35.6 | | | | 1,921.8 | | | | 32.7 | | | | 1,758.0 | | | | 34.7 | |
Savings deposits | | | 3,286.0 | | | | 51.3 | | | | 2,598.5 | | | | 44.2 | | | | 2,275.7 | | | | 44.9 | |
Other deposits | | | 61.8 | | | | 1.0 | | | | 61.6 | | | | 1.0 | | | | 50.3 | | | | 1.0 | |
Total deposits | | | 6,162.5 | | | | 96.3 | | | | 5,095.1 | | | | 86.6 | | | | 4,472.3 | | | | 88.3 | |
| | | | | | | | | | | | | | | | | | | | | | | | | |
Interbank and overnight funds | | | 108.5 | | | | 1.7 | | | | 675.3 | | | | 11.5 | | | | 498.4 | | | | 9.8 | |
Borrowings from banks and other | | | 128.9 | | | | 2.0 | | | | 113.6 | | | | 1.9 | | | | 96.1 | | | | 1.9 | |
Bankers’ acceptance outstanding | | | 0.2 | | | | – | | | | – | | | | – | | | | – | | | | – | |
Total other funding | | | 237.5 | | | | 3.7 | | | | 788.9 | | | | 13.4 | | | | 594.5 | | | | 11.7 | |
Total funding | | | 6,400.0 | | | | 100.0 | | | | 5,884.1 | | | | 100.0 | | | | 5,066.8 | | | | 100.0 | |
Capital expenditures
Grupo Aval incurred Ps 225.5 billion of capital expenditures in property, plant and equipment in 2011, an increase from Ps 259.5 billion in 2010 and from Ps 234.2 billion in 2009.
Other than our technology program, we do not have any significant policies or projects relating to research and development, and we own no patents or licenses. See “Item 4. Information on the Company—B. Business overview—Other corporate information—Technology.”
For a discussion of Trend information, see “—A. Operating results—Principal factors affecting our financial condition and results of operations.”
In the ordinary course of business, our banks have entered into various types of off-balance sheet arrangements, including lines and letters of credit and financial guarantees. Our banks utilize these instruments to meet their customers’ financing needs. The contractual amount of these instruments represents the maximum possible credit risk should the counterparty draw down the entire commitment or our bank fulfill its entire obligation under the guarantees, and the counterparty subsequently fails to perform according to the terms of the contract. Our banks may hold cash or other liquid collateral to support these commitments, and our banks generally have legal recourse to recover amounts paid but not recovered from customers under these instruments. Most of these commitments and guarantees expire undrawn. As a result, the total contractual amount of these instruments does not represent our future credit exposure or funding requirements. In addition, some of these commitments, primarily those related to consumer financing, are cancelable by our banks upon notice.
The following table presents the maximum potential amount of future payments under these instruments at the dates presented for Grupo Aval on a consolidated basis.
| | | | |
| | | (in Ps billions) | |
| | | | | | | | | |
Unused credit card limits | | | 9,538.8 | | | | 8,859.9 | | | | 3,269.2 | |
Civil demands against our banks | | | 646.4 | | | | 559.6 | | | | 346.4 | |
Issued and confirmed letters of credit | | | 638.1 | | | | 513.6 | | | | 233.0 | |
Unused lines of credit | | | 2,807.0 | | | | 2,734.3 | | | | 1,627.5 | |
Bank guarantees | | | 1,906.6 | | | | 1,718.1 | | | | 1,202.0 | |
Approved credits not disbursed | | | 2,013.5 | | | | 1,573.6 | | | | 1,421.9 | |
Other | | | 2,190.5 | | | | 742.0 | | | | 904.4 | |
Total | | | 19,740.9 | | | | 16,701.1 | | | | 9,004.4 | |
The following table presents our contractual obligations at December 31, 2011.
| | | | |
| | | Payments due by period | |
| | | | | | | | | | | | | | | |
| | | (in Ps billions) | |
| Liabilities: | | | | | | | | | | | | | | | |
Long-term debt obligations (1) | | | 6,566.2 | | | | 809.6 | | | | 2,423.7 | | | | 1,154.7 | | | | 2,178.2 | |
Time deposits | | | 22,630.5 | | | | 16,755.0 | | | | 4,744.3 | | | | 516.8 | | | | 614.4 | |
| Long-term borrowings from banks and others | | | 11,437.8 | | | | 3,740.4 | | | | 3,983.8 | | | | 1,565.7 | | | | 2,147.9 | |
Repurchase agreements | | | 3,019.8 | | | | 3,019.8 | | | | – | | | | – | | | | – | |
Employee benefit plans | | | 299.0 | | | | 30.8 | | | | 63.7 | | | | 68.0 | | | | 136.5 | |
Total | | | 43,953.3 | | | | 24,355.7 | | | | 11,215.5 | | | | 3,305.1 | | | | 5,076.9 | |
(1) See note 20 to our audited consolidated financial statements at December 31, 2011.
Board of directors
The board of directors of Grupo Aval is composed of seven principal members and seven alternate members, each of whom serves a one-year term and may be reelected indefinitely. The term for the current directors expires on March 31, 2013. It is our practice that the President of each of our banking subsidiaries is appointed as a member of our board of directors.
The current members of the board of directors were appointed at a shareholders’ meeting held on December 7, 2010 and have been re-elected at subsequent shareholders’ meetings. The following table presents the names of the current principal and alternate members of the board of directors.
| | |
Luis Carlos Sarmiento Angulo | | José Hernán Rincón Gómez |
Alejandro Figueroa Jaramillo | | Juan María Robledo Uribe |
Efraín Otero Álvarez | | Juan Camilo Ángel Mejía |
Mauricio Cárdenas Müller | | Gabriel Mesa Zuleta |
Guillermo Fernández de Soto Valderrama (1) | | Álvaro Velásquez Cock |
Antonio José Urdinola Uribe (1) (2) (3) | | Enrique Mariño Esguerra (3) |
Esther América Paz Montoya (1) (2) (3) | | Germán Villamil Pardo (3) |
| (1) | Member of the Audit committee. |
| (2) | Independent director under SEC Audit Committee rules. |
| (3) | Independent director under Colombian requirements. |
Luis Fernando Pabón Pabón is the secretary of our board.
Biographical information of the principal members of our board of directors and the secretary of our board is set forth below.
Luis Carlos Sarmiento Angulo, age 79, has served as the Chairman of the board of directors of Grupo Aval since 1999. Mr. Sarmiento Angulo is the founder and controlling shareholder of Grupo Aval and, since 1985, has served as a member of the board of directors of Organización Luis Carlos Sarmiento Angulo Ltda., an affiliate of our controlling shareholder. Since 2010 he has served as principal member of the Board of Directors of Casa
Editorial El Tiempo and of CEET TV. He also serves as Chairman of the board of directors of four not-for-profit entities: Asociación Nacional de Instituciones Financieras – ANIF, Fundación para el Futuro de Colombia – Colfuturo; Fundación Grupo Aval and Fundación Luis Carlos Sarmiento Angulo, through which he is sponsoring, among other initiatives, Grameen Aval Colombia, a microfinance not-for-profit organization established in association with Grameen Trust of Bangladesh. He holds a degree in Civil Engineering from Universidad Nacional de Colombia. He is the father of the President of Grupo Aval, Mr. Luis Carlos Sarmiento Gutiérrez. Mr. Sarmiento Angulo’s business address is Carrera 13 No. 26A–47, Bogotá D.C., Colombia.
Alejandro Figueroa Jaramillo, age 70, has served as a principal member on the board of directors of Grupo Aval since 1999. Mr. Figueroa Jaramillo has been the President of Banco de Bogotá since 1988. He has been employed with Banco de Bogotá since 1978, where he also served as Executive Vice President and Vice President of Finance. He is the Chairman of the board of directors of Porvenir and has been a board member of Porvenir since 1991. He has also been a member of the board of directors of Corficolombiana since 1998 and of Fundación Grupo Aval since 2011. He previously served as Vice-Minister of Economic Development of Colombia and President of Almaviva S.A., Banco de Bogotá’s bonded warehouse. He holds a degree in Civil Engineering from Facultad de Minas de la Universidad Nacional in Antioquia and a Master of Science degree in Economics from Harvard University. Mr. Figueroa Jaramillo’s business address is Calle 35 No. 7–47, Bogotá, D.C., Colombia.
Efraín Otero Álvarez, age 63, has served as a principal member on the board of directors of Grupo Aval since 1999. Mr. Otero Álvarez has been the President of Banco de Occidente since 1995. He has been employed with Banco de Occidente since 1973, where he also served as Vice President of Finance and Executive Vice President. He has also served as a member of the boards of directors of Porvenir since 1995, of Corficolombiana since 1998, of Banco de Occidente – Panama since 2006 and of Fundación Grupo Aval since 2011. He previously worked as an economist at Corporación Autónoma del Valle del Cauca. He holds a degree in Economics and a Master’s degree in Industrial Engineering, both from the Universidad del Valle. Mr. Otero Álvarez’s business address is Carrera 4 No. 7–61, Cali, Colombia.
Mauricio Cárdenas Müller, age 42, has served as a principal member on the board of directors of Grupo Aval since 2010, and previously as an alternate member thereof since 2002. Mr. Cárdenas Müller has acted as chief advisor to the President of Organización Luis Carlos Sarmiento Angulo Ltda. and as advisor to the Chairman and the President of Grupo Aval since 2004. He served as a member of the board of directors of Seguros Alfa S.A. and of Seguros de Vida Alfa S.A. from 2002 until 2011, and he serves as a member of the board of directors of Fundación para el Futuro de Colombia – Colfuturo since 2007, of Porvenir since 2008, of Empresa de Energía de Bogotá ESP since 2010 and of Casa Editorial El Tiempo and CEET TV since 2011. He holds a degree in Electrical Engineering from Universidad Javeriana and a Master’s degree in Business Administration from Escuela de Dirección y Negocios de la Universidad de la Sabana – INALDE. Mr. Cárdenas Müller’s business address is Carrera 13 No. 26A–47, Bogotá D.C., Colombia.
Guillermo Fernández de Soto Valderrama, age 58, has served as a principal member on the board of directors of Grupo Aval since 2008. Mr. Fernández de Soto Valderrama has acted as Executive Secretary of Grupo de Río, President of the Chamber of Commerce of Bogotá, Chancellor of Colombia, Secretary General of the Andean Community of Nations and Ambassador of Colombia to The Netherlands. He has also served as a member of the board of directors of the Corficolombiana since 2008 and of Porvenir since 2010. He holds degrees in Law and Economics from Universidad Javeriana. Mr. Fernández de Soto Valderrama’s business address is Calle 86 No. 10-88 Oficina 202, Bogotá D.C., Colombia.
Antonio José Urdinola Uribe, age 72, has served as a principal member on the board of directors of Grupo Aval since 2006. Mr. Urdinola Uribe is a private advisor. He has acted as Minister of Finance of Colombia, President of Empresa Colombiana de Petróleos – Ecopetrol, President of Instituto Colombiano de Comercio Exterior – Incomex and advisor to the World Bank, the United Nations, Corporación Andina de Fomento and the Government of Colombia. He has also been a member of the boards of directors of, among other entities, Valorem S.A. since 2005 and Empresa de Energía de Bogotá ESP since 2008. Mr. Urdinola Uribe holds a degree in Economics from the Universidad de los Andes and a diploma in Political Science from the London School of Economics. Mr. Urdinola Uribe’s business address is Carrera 13 No. 26A–47, Bogotá D.C., Colombia.
Esther América Paz Montoya, age 57, has served as a principal member on the board of directors of Grupo Aval since 2010, and previously as an alternate member thereof since 2005. Ms. Paz Montoya is a former President of Banco AV Villas, where she also served as Vice President of Finance and Vice President of Operations, and a former President of Ahorramás Corporación de Ahorro y Vivienda. She holds a degree in Business Administration from the Universidad del Valle. Ms. Paz Montoya’s business address is Carrera 13 No. 26A–47, Bogotá D.C., Colombia.
Biographical information of the alternate members of our board of directors is set forth below.
José Hernán Rincón Gómez, age 83, has served as an alternate member of the board of directors of Grupo Aval since 2010 and previously as a principal member thereof since 2005. Mr. Rincón Gómez has been the President of Banco Popular since 1991. He has also served as a member of the board of directors of Corficolombiana since 1998 and of Fundación Grupo Aval since 2011. He is the former President of, among other entities, Banco Comercial Antioqueño (the predecessor to Banco Santander Colombia), Avianca (airline company) and Banco del Estado. He holds a degree in Economics from the Universidad de Antioquia and is qualified as a public accountant. Mr. Rincón Gómez’s business address is Calle 17 No. 7–43, Bogotá D.C., Colombia.
Juan María Robledo Uribe, age 67, has served as an alternate member on the board of directors of Grupo Aval since 2000. Mr. Robledo Uribe has acted as Executive Vice President of Banco de Bogotá from 1990 to 1992, from 1993 to 2001 and since 2003. He has been employed with Banco de Bogotá for over 40 years, where he has also served as Vice President of Banking Services and Vice President of Commercial Banking. He has been a member of the board of directors of Corficolombiana from 1993 to 2001 and since 2006, of Fidubogotá since 2007, of Porvenir since 1991 and of Fundación Grupo Aval since 2011. He holds a degree in Economics from the Universidad del Rosario. He is also the former President of Banco del Comercio (which merged into Banco de Bogotá in 1992) and of Corficolombiana from 2003 until 2005. Mr. Robledo Uribe’s business address is Calle 35 No. 7–47, Bogotá D.C., Colombia.
Juan Camilo Ángel Mejía, age 46, has served as an alternate member on the board of directors of Grupo Aval since 2008. Mr. Ángel Mejía has been the President of Banco AV Villas since 2007, and previously acted as its Vice President of Credit and Portfolio, Vice President of Asset Regularization and Vice President of Real Estate. Previously he was an advisor in the Offerings Department of Banco Central Hipotecario and Project Manager in the Capital Markets division of Corfinsura. He has also been a member of the board of directors of Asociación Bancaria de Colombia since 2007, of Titularizadora Colombiana S.A. since 2008 and of Fundación Grupo Aval since 2011. He holds a degree in Civil Engineering from the Universidad de Medellín. Mr. Ángel Mejía’s business address is Carrera 13 No. 26A–47, Bogotá D.C., Colombia.
Gabriel Mesa Zuleta, age 45, has served as an alternate member on the board of directors of Grupo Aval since 2004. Mr. Mesa Zuleta has been the President of Sadinsa S.A. since 2003 and a member of the board of directors of Banco Popular since 2004, of Seguros Alfa S.A. since 2004 and of Seguros de Vida Alfa S.A. since 2004. He previously acted as Director of the Administrative Department of the President of the Republic of Colombia and as President of Empresa de Telecomunicaciones de Colombia–Telecom. He holds a law degree from the Universidad del Rosario. Mr. Mesa Zuleta’s business address is Carrera 13 No. 26–45, Bogotá D.C., Colombia.
Álvaro Velásquez Cock, age 72, has served as an alternate member on the board of directors of Grupo Aval since 2008. Mr. Velásquez Cock has served as advisor to Grupo Ethuss since 1994. He has acted as Dean of the Faculty of Economics of the Universidad de Antioquia, Chief of the Departamento Nacional de Estadística–DANE, President of Pedro Gómez & Cía. S.A. and as a member of the Advisory Committee of the Superintendency of Finance. He has been a member of the board of directors of Banco de Bogotá since 2001, of Banco de Bogotá – Panama since 1984, of Corficolombiana since 1992 and of Unipalma since 1996. He holds a degree in Economics from the Universidad de Antioquia. Mr. Velásquez Cock’s business address is Calle 69 No. 9–58, Bogotá D.C., Colombia.
Enrique Mariño Esguerra, age 86, has served as an alternate member on the board of directors of Grupo Aval since 2006. Mr. Mariño Esguerra is a manager and partner of Ingeniería CEISA. He is a former member of the board of directors of Corporación de Ahorro y Vivienda AV Villas (the predecessor to Banco AV Villas), Cemento Samper S.A., Seguros Alfa S.A. and Seguros de Vida Alfa S.A. He holds a degree in Civil Engineering from the Universidad Nacional. Mr. Mariño Esguerra’s business address is Avenida Carrera 19 No. 135–30, Bogotá D.C., Colombia.
Germán Villamil Pardo, age 52, has served as an alternate member on the board of directors of Grupo Aval since 2010 and previously as a principal member thereof since 2006. Mr. Villamil Pardo is a partner of Gómez Pinzón Zuleta Abogados S.A. He previously held several positions in the Ministry of Finance of Colombia as well as in Banco de la República. He holds a law degree with a specialty in tax from the Universidad de los Andes. Mr. Villamil Pardo’s business address is Calle 67 No. 7–35 Oficina 1204, Bogotá D.C., Colombia.
Luis Fernando Pabón Pabón, age 53, has served as Secretary of the Board of Grupo Aval since 2000. Mr. Pabón Pabón formerly served as Legal Vice President of Banco de Colombia and as Legal Counsel to the President of Banco de Bogotá. He has been a member of the board of directors of Banco AV Villas S.A. since 1998, of Porvenir since 2003, of Almaviva S.A. since 2007, of Organización Luis Carlos Sarmiento Angulo Ltda. since 2006 and of Casa Editorial El Tiempo and CEET TV since 2011. He also serves as legal counsel to Organización Luis Carlos Sarmiento Angulo Ltda. Mr. Pabón Pabón holds a law degree from Universidad Javeriana and a specialization in financial law from the Universidad de los Andes. Mr. Pabón Pabón’s business address is Carrera 13 No. 26A–47, Bogotá D.C., Colombia.
Executive officers
The executive officers of Grupo Aval are responsible for the day-to-day management of our company. The executive officers serve until removed. Although the Presidents of Corficolombiana, Porvenir and BAC Credomatic are not represented in the board of directors or the management of Grupo Aval, they are key individuals in our group’s merchant banking, pension management and Central American businesses.
The following table lists the names and positions of our executive officers and the presidents of our banking subsidiaries, Porvenir and Corficolombiana. Certain of our executive officers are also members of the boards of directors of our subsidiaries.
| | |
Grupo Aval | | |
Luis Carlos Sarmiento Gutiérrez | | President |
Diego Fernando Solano Saravia | | Chief Financial Officer |
Diego Rodríguez Piedrahita | | Chief Risk Management Officer |
Julio Leonzo Álvarez Álvarez | | Chief Technology Officer |
Javier Díaz Fajardo | | Vice President of Investor Relations |
Edgar Enrique Lasso Fonseca | | Vice President of Corporate Planning |
María Edith González Flórez | | Vice President of Accounting |
Rafael Eduardo Neira Torres | | Vice President of Internal Control |
María José Arango Caicedo | | Vice President of Corporate Services |
| | | |
| Banco de Bogotá | | |
Alejandro Figueroa Jaramillo | | President |
| | | |
| Banco de Occidente | | |
Efraín Otero Álvarez | | President |
| | | |
| Banco Popular | | |
José Hernán Rincón Gómez | | President |
| | | |
| Banco AV Villas | | |
Juan Camilo Ángel Mejía | | President |
| | | |
Corficolombiana José Elías Melo Acosta | | President |
| | |
| | | |
Porvenir Miguel Largacha Martínez | | President |
| | | |
BAC Credomatic Ernesto Castegnaro | | President |
Biographical information of our executive officers and key employees who are not directors is set forth below.
Luis Carlos Sarmiento Gutiérrez, age 50, has acted as President of Grupo Aval since 2000. Mr. Sarmiento Gutiérrez acted as President of Cocelco S.A. from 1997 until 2000. Previously he served as Executive Vice President at First Bank of the Americas in New York and as an analyst and financial manager at Procter & Gamble’s corporate headquarters. He has been the Chairman of the board of directors of Banco de Bogotá since 2004 of Corficolombiana since 2006 and is a member of the Board of Directors of Empresa de Energía de Bogotá ESP since 2010. He holds a Bachelor of Science degree, magna cum laude, in civil engineering from the University of Miami and a Master’s degree in Business Administration with a concentration in Finance from the Johnson Graduate School of Management at Cornell University. Mr. Sarmiento Gutiérrez is the son of the Chairman of the board of directors of Grupo Aval, Mr. Sarmiento Angulo. Mr. Sarmiento Gutiérrez’s business address is Carrera 13 No. 26A–47, Bogotá D.C., Colombia.
Diego Fernando Solano Saravia, age 46, has acted as Chief Financial Officer, and formerly as Vice President of Corporate Planning, of Grupo Aval since 2006. Mr. Solano Saravia has been a member of the boards of directors of Porvenir and Gas Natural S.A. since 2009. He previously served as associate principal at McKinsey & Co. and Corporate Vice President at Banco Santander Colombia. He holds a degree in Systems Engineering from the Universidad de los Andes and a Master’s degree in Business Administration from the Wharton School at the University of Pennsylvania. His business address is Carrera 13 No. 26A–47, Bogotá D.C., Colombia.
Diego Rodríguez Piedrahita, age 53, has acted as Chief Risk Management Officer of Grupo Aval since 1999. Mr. Rodríguez Piedrahita previously worked at Bank of America and ING. He has been the Chairman of the board of directors of Banco AV Villas since 2004 and a board member thereof since 2000. He has also been a member of the board of directors of Fidubogotá since 2000 and of Organización Luis Carlos Sarmiento Angulo Ltda. since 2006. He holds a Bachelor’s degree in Business Management and a Master in Business Administration from George Washington University. Mr. Rodríguez Piedrahita’s business address is Carrera 13 No. 26A–47, Bogotá D.C., Colombia.
Julio Leonzo Álvarez Álvarez, age 65, has acted as Chief Technology Officer, and formerly as Vice President of Corporate Systems, of Grupo Aval since 1998. Mr. Álvarez Álvarez has acted as President of Avianca (airline company), Cervecería Unión S.A. (beverage company) and Pedro Gómez & Cía (construction company). He has been a member of the board of directors of A Toda Hora S.A. – ATH since 2005, of Porvenir since 2001 and of Banco Popular since 1996. He holds a degree in civil engineering from the Universidad Nacional de Colombia with studies in the Higher Management Program, INALDE – Universidad de la Sabana, Postgraduate Program in Financial Management – Universidad de Medellín, and Postgraduate Program in Statistics Applied to Engineering – Universidad Nacional de Colombia. Mr. Álvarez Álvarez’s business address is Carrera 13 No. 26A–47, Bogotá, D.C., Colombia.
Javier Díaz Fajardo, age 41, has acted as Vice President of Investor Relations of Grupo Aval since 2010. Mr. Díaz Fajardo acted as Managing Director of Andes Capital LLC from 2007 until 2009. Previously he served as Chief Counsel of the Multilateral Investment Fund, a trust administered by the Inter-American Development Bank, and as associate at the law firms of Cárdenas & Cárdenas in Bogotá, Colombia and Cleary, Gottlieb, Steen & Hamilton in New York, New York. He holds a law degree from Universidad de los Andes and a Master’s in International Business from The Fletcher School at Tufts University. Mr. Díaz Fajardo’s business address is Carrera 13 No. 26A–47, Bogotá D.C., Colombia.
Edgar Enrique Lasso Fonseca, age 55, has acted as Vice President of Corporate Planning of Grupo Aval since 2008. Mr. Lasso Fonseca held several positions at the Superintendency of Finance, including Delegate for Financial Intermediaries from 1995 until 2007. He previously worked as corporate analyst at Banco de Bogotá. He holds a degree in Economics from Universidad Externado de Colombia and in Banking Management from the Universidad de los Andes. Mr. Lasso Fonseca’s business address is Carrera 13 No. 26A–47, Bogotá D.C., Colombia.
María Edith González Flórez, age 53, has acted as Vice President of Accounting, and formerly as Financial and Administrative Manager, of Grupo Aval since 2004. Ms. González Flórez previously worked as Financial Manager at Cocelco S.A. and Movistar. She holds a degree in Public Accounting from the Universidad de Santiago de Cali and a Finance specialty from Universidad ICESI. She has been a member of the board of directors of Casa de Bolsa S.A. since 2010. Ms. González Flórez’s business address is Carrera 13 No. 26A–47, Bogotá D.C., Colombia.
Rafael Eduardo Neira Torres, age 56, has acted as Comptroller of Grupo Aval since 2009. Mr. Neira Torres acted as Deputy Financial Superintendent, and formerly as Adjunct Financial Superintendent, at the Superintendency of Finance from 2006 to 2008. He previously worked as Operations Vice President at Banco Davivienda. He holds a degree in Accounting from the Universidad Jorge Tadeo Lozano and in Banking Management from the Universidad de los Andes. Mr. Neira Torres’ business address is Carrera 13 No. 26A–47, Bogotá D.C., Colombia.
María José Arango Caicedo, age 46, has acted as Vice President of Corporate Services of Grupo Aval since 2000. She previously worked as Commercial Manager of Cocelco S.A., as Electronic Banking Manager at Banco de Occidente and as Project Manager in Fanalca. She has been a member of the board of directors of Corporación Publicitaria de Colombia S.A. since 2002. She holds a degree in Systems Engineering from Universidad ICESI and a Master’s degree in Business Administration from the Universidad del Valle. Her business address is Carrera 13 No. 26A–47, Bogotá D.C., Colombia.
José Elías Melo Acosta, age 52, has served as President of Corficolombiana since 2008. Mr. Melo Acosta previously served as President of Megabanco from 1999 to 2006, of Banco del Estado in 1999 and of Confederación de Cooperativas de Colombia from 1994 to 1998. He has also served in several positions within the Colombian government including as Minister of Employment and Social Security, Superintendent of Finance, Vice Minister of Finance and Public Credit and Secretary of the Monetary Board of the Banco de la República. He is a member of the board of directors of Fundación Grupo Aval since 2011. He holds a law degree with specialty in socioeconomic sciences from Universidad Javeriana. His business address is Carrera 13 No. 26–45, Bogotá D.C., Colombia.
Miguel Largacha Martínez, age 48, has served as President of Porvenir since 2008. Mr. Largacha Martínez previously served as President of BBVA Horizonte Pensiones y Cesantías, and held other positions within BBVA Colombia S.A., including Executive Vice President and Legal Vice President of Banco Ganadero (the predecessor to BBVA Colombia S.A.) and has been a member of the board of directors of Fundación Grupo Aval since 2011. He holds a law degree from Universidad Javeriana and has further completed postgraduate studies in Financial Legislation and Executive Management at the Universidad de los Andes. His business address is Carrera 13 No. 27–75, Bogotá D.C., Colombia.
Ernesto Castegnaro, age 61, has served as President of BAC Credomatic since 1983. Mr. Castegnaro joined BAC Credomatic in 1976 and has over 30 years of experience managing credit card operations and over 25 years managing banking operations. He is also a director on the MasterCard Latin America Board of Directors. Mr. Castegnaro holds an MBA in Banking and Finance from INCAE and a Civil Engineering degree from the University of Costa Rica. His business address is Centro Corporativo Plaza Roble, Edificio Terrazas B, Escazú, San José, Costa Rica.
Our common shareholders must approve the compensation of our board of directors at the first semi-annual shareholders’ meeting of every calendar year.
Each member of our board of directors, including alternates, receives a fee based on attendance at each board of directors’ session. Members of our audit committee also receive an additional fee for attending audit committee meetings. For 2012, the board of directors’ session fee is Ps 1,575,000 and the audit committee session fee is Ps 1,575,000. For 2011, the board of directors’ session fee was Ps 1,500,000 and the audit committee session fee was Ps 1,500,000.
We are not required under Colombian law to publish information regarding the compensation of our individual executive officers, and we do not make this information public. Our shareholders, however, can request this information before our semi-annual general shareholders’ meetings. The aggregate amount of compensation, inclusive of bonuses, that we and our subsidiaries paid to directors, alternate directors and executive officers was Ps 36.6 billion (U.S.$18.8 million) in 2011. We pay bonuses to our executive officers which vary according to each officer’s performance and the achievement of certain predefined goals, and, therefore, the amounts paid may vary for each officer.
We do not have, and have not had in the past, any share option plans.
Audit committee
Our audit committee currently consists of three members, appointed by the board of directors: Antonio José Urdinola Uribe, Guillermo Fernandez de Soto and Esther América Paz Montoya, all of whom are independent within the meaning of SEC corporate governance rules of independence for purposes of the audit committee. Mr. Urdinola Uribe is the chair of our audit committee. Pursuant to Colombian law, the audit committee must meet at least quarterly.
Our audit committee advises the board of directors generally on internal control matters, and it specifically undertakes to:
| | · | review financial statements prior to their submission to the board of directors and to the general shareholders’ meeting; |
| | · | supervise the internal auditor to verify if its actions address the internal control needs of the company and to identify limitations with respect to its duties; |
| | · | review all internal control reports of the company and supervise compliance with such reports by the company’s management; |
| | · | issue its opinion on the independence of the external auditor, based on standards set forth by Colombian and U.S. regulations; |
| | · | monitor the company’s levels of risk exposure at least every six months and propose mitigation measures as needed; |
| | · | propose to the board of directors control systems to prevent, detect and adequately respond to the risk of fraud and improper conduct by company employees; |
| | · | provide assistance to our board of directors in fulfilling its responsibilities with respect to our compliance with legal and regulatory requirements; |
| | · | make recommendations to the general shareholders meeting concerning the engagement of the independent accounting firm; and |
| | · | issue reports to the board of directors on matters deemed relevant. |
Pursuant to regulations of the Superintendency of Finance, the audit committee has a charter approved by the board of directors, which sets forth the main aspects related to the operation of such committee, including, among others, its composition and duties.
At December 31, 2011, on a consolidated basis, we employed approximately 54,463 individuals, with 43,817 employees, 5,176 personnel provided by staffing service companies and 5,470 outside contractors.
The following table presents the approximate breakdown of the employees, personnel provided by staffing service companies and outside contractors of our banking subsidiaries, Porvenir, Corficolombiana and Grupo Aval (unconsolidated), at December 31, 2011.
| | | | | | | | | | | | | | | | | | | | | | | | Grupo Aval (unconsolidated) | | | | |
Employees | | | 9,227 | | | | 8,351 | | | | 3,879 | | | | 4,497 | | | | 1,943 | | | | 671 | | | | 15,133 | | | | 116 | | | | 43,817 | |
| Personnel provided by staffing service companies | | | 2,688 | | | | 103 | | | | 1,463 | | | | 416 | | | | 45 | | | | 93 | | | | 365 | | | | 3 | | | | 5,176 | |
Outside contractors | | | 2,360 | | | | 548 | | | | 1,072 | | | | 1,247 | | | | 131 | | | | 107 | | | | — | | | | 5 | | | | 5,470 | |
Total | | | 14,275 | | | | 9,002 | | | | 6,414 | | | | 6,160 | | | | 2,119 | | | | 871 | | | | 15,498 | | | | 124 | | | | 54,463 | |
| (1) | Excludes employees of Porvenir, Corficolombiana, BAC and their subsidiaries. |
| (2) | 49.3% (3,757) of Banco de Bogotá’s direct employees (7,628) are represented by unions and 58.38% (4,453) of such employees are covered by collective bargaining agreements that expire in August 2012. |
| (3) | 50.6% (3,454) of Banco de Occidente’s direct employees (6,828) are represented by unions and are covered by collective bargaining agreements that expire in December 2014. |
| (4) | 29.0% (934) of Banco Popular’s direct employees (3,218) are represented by unions and 97.9% (3,151) of such employees are covered by collective bargaining agreements that expire in December 2014. |
| (5) | Less than 0.1% (2) of Banco AV Villas’ direct employees (3,954) are represented by unions. |
Mr. Sarmiento Angulo beneficially owns 94.1% of our outstanding common shares and 62.6% of our preferred shares as determined under SEC rules at April 25, 2012. See “Item 7. Major Shareholders and Related Party Transactions—A. Major shareholders.” The following table provides the names of our other directors and key executive officers who owned shares of Grupo Aval at April 25, 2012.
| | | | | Percentage of outstanding common shares | | | | | | Percentage of outstanding preferred shares | |
| Alejandro Figueroa Jaramillo | | | 557,695 | | | | * | | | | 1,538,460 | | | | * | |
| José Hernán Rincón Gómez | | | 300,000 | | | | * | | | | 230,769 | | | | * | |
| Juan María Robledo Uribe | | | 284,917 | | | | * | | | | 384,769 | | | | * | |
| Esther América Paz Montoya | | | 251,718 | | | | * | | | | 423,076 | | | | * | |
| Efraín Otero Álvarez | | | 102,729 | | | | * | | | | 300,000 | | | | * | |
| Gabriel Mesa Zuleta | | | 80,645 | | | | * | | | | 30,769 | | | | * | |
| Luis Fernando Pabón Pabón | | | 78,237 | | | | * | | | | 115,384 | | | | * | |
| Enrique Mariño Esguerra | | | 49,687 | | | | * | | | | 38,461 | | | | * | |
| Diego Fernando Solano Saravia | | | 49,586 | | | | * | | | | 152,078 | | | | * | |
| Julio Leonzo Álvarez Álvarez | | | 41,952 | | | | * | | | | –– | | | | * | |
| Mauricio Cárdenas Müller | | | 40,616 | | | | * | | | | 76,923 | | | | * | |
| Germán Villamil Pardo | | | 33,058 | | | | * | | | | –– | | | | * | |
| María José Arango Caicedo | | | 21,908 | | | | * | | | | 9,230 | | | | * | |
| Diego Rodríguez Piedrahita | | | 16,528 | | | | * | | | | 49,847 | | | | * | |
| Álvaro Velásquez Cock | | | 8,264 | | | | * | | | | 11,538 | | | | * | |
| Juan Camilo Ángel Mejía | | | 7,319 | | | | * | | | | 22,666 | | | | * | |
| Miguel Largacha Martínez | | | — | | | | * | | | | 172,680 | | | | * | |
| José Elías Melo Acosta | | | — | | | | * | | | | 16,733 | | | | * | |
| | | | | Percentage of outstanding common shares | | | | | | Percentage of outstanding preferred shares | |
| Javier Díaz Fajardo | | | — | | | | * | | | | 5,769 | | | | * | |
Guillermo Fernández de Soto Valderrama | | | — | | | | * | | | | — | | | | * | |
Antonio José Urdinola Uribe | | | — | | | | * | | | | — | | | | * | |
Luis Carlos Sarmiento Gutiérrez | | | — | | | | * | | | | — | | | | * | |
Edgar Enrique Lasso Fonseca | | | — | | | | * | | | | — | | | | * | |
María Edith González Flórez | | | — | | | | * | | | | — | | | | * | |
Rafael Eduardo Neira Torres | | | — | | | | * | | | | — | | | | * | |
Ernesto Castegnaro | | | — | | | | * | | | | — | | | | * | |
* less than 0.1%.
Mr. Luis Carlos Sarmiento Angulo controls Grupo Aval and was the beneficial owner of 85.9% of our issued and outstanding share capital at April 25, 2012. He retained 94.1% of our voting power by virtue of his beneficial ownership of 94.1% of our outstanding common shares, and beneficially owned 62.6% of our outstanding preferred shares, as determined under SEC rules, at April 25, 2012. Beneficial ownership is defined in Form 20-F and generally includes voting or investment power over securities. Percentage of beneficial ownership is based on 18,551,766,453 of our aggregate equity securities outstanding comprising of 13,719,081,181 common shares outstanding and 4,832,685,272 preferred shares outstanding at April 25, 2012.
On June 23, 2011, we closed the First Banco Popular Share Ownership Transaction and issued 2,073,115,004 preferred shares to the shareholders of Rendifin S.A. in exchange for 43.47% of the share capital of Banco Popular, raising Mr. Sarmiento Angulo’s beneficial ownership stake in our preferred shares to 56.9% and his beneficial ownership in Grupo Aval to 85.1%. On September 20, 2011, we closed the Second Banco Popular Share Ownership Transaction, in which Mr. Sarmiento Angulo beneficially acquired 934,669,126 preferred shares, raising his total ownership of outstanding preferred shares to approximately 63.8%, and approximately 85.9% of our total share capital. See “—B. Related party transactions—Other transactions with Mr. Sarmiento Angulo and his affiliates—Banco Popular share ownership reorganization.”
The principal shareholder, as a common shareholder, does not have any different or special voting rights in comparison to any other common shareholder.
The following table sets forth information, as of December 31, 2011, regarding the beneficial ownership of our equity securities by:
| | · | each person that is a beneficial owner of more than 5% of our outstanding equity securities; |
| | · | all directors and executive officers as a group; and |
| | | | |
| Principal beneficial owners | | | | | Percentage of outstanding common shares | | | | | | Percentage of outstanding preferred shares | |
Luis Carlos Sarmiento Angulo | | | 12,905,118,094 | | | | 93.5 | % | | | 3,024,544,900 | | | | 63.7 | % |
Other directors and officers as a group | | | 1,924,859 | | | | * | | | | 3,579,152 | | | | * | |
Other shareholders | | | 899,648,287 | | | | 6.5 | % | | | 1,716,951,161 | | | | 36.2 | % |
Total | | | 13,806,691,240 | | | | 100.0 | % | | | 4,745,075,213 | | | | 100.0 | % |
To our knowledge, based on the registers maintained by Deceval, a Colombian registrar of companies, and our records, at March 30, 2012, there were 643 non-Colombian holders of our common shares, of which we believe there were at least 20 U.S. holders of our common shares and preferred shares as of March 30, 2012 who held in the aggregate less than 0.1% of our total shares outstanding.
We currently engage in, and expect from time to time in the future to engage in, financial and commercial transactions with “related parties” (within the meaning of the SEC rules). Unless otherwise indicated below, such transactions are conducted on an arm’s-length basis in the ordinary course of business, on terms that would apply to transactions with third parties.
Loans or deposits involving related parties
The following chart presents outstanding amounts of related party transactions involving loans or deposits between Grupo Aval and its consolidated subsidiaries, on one hand, and each of the following individuals and entities.
| | | Transactions between Grupo Aval and its subsidiaries, and | |
| | | Grupo Aval’s directors and key management and their affiliates (1) | | | Close family members of Mr. Sarmiento Angulo and their affiliates | | | Mr. Sarmiento Gutiérrez and his affiliates | | | Mr. Sarmiento Angulo and his affiliates | |
| | | (in Ps billions) | |
| | | | |
Outstanding loans (2) | | | 11.3 | | | | 42.2 | | | | 0.03 | | | | 1,067 | |
Deposits (3) | | | 10.2 | | | | 9.3 | | | | 0.2 | | | | 3,548 | |
| | | | | | | | | | | | | | | | | |
| | | | |
Outstanding loans (2) | | | 7.0 | | | | 22.5 | | | | 0.1 | | | | 1,094 | |
Deposits (3) | | | 8.8 | | | | 6.1 | | | | 0.6 | | | | 3,327 | |
| (1) | Excludes Mr. Sarmiento Angulo and Mr. Sarmiento Gutiérrez and their affiliates. Key management includes executive officers of Grupo Aval as well as each of the presidents of our banks, Porvenir and Corficolombiana. |
| (2) | Includes loans approved but not yet disbursed. All outstanding loans are made in the ordinary course of business, and on terms and conditions not materially different from those available to the general public, including interest and collateral. See below “—Loans granted to related parties by our banking subsidiaries.” |
| (3) | All deposits, including time deposits and investment portfolios, of all related parties held with us are made in the ordinary course of business, held at market rates and on terms and conditions not materially different from those available to the general public. |
For information on related party transactions in accordance with Colombian disclosure rules, see note 27 to our audited consolidated financial statements. Required Colombian disclosures as to related party transactions differ from those required by the SEC. For the purposes of note 27 to our audited consolidated financial statements, “related parties” includes the principal shareholders of Grupo Aval, members of the board of directors, individuals who are legal representatives of Grupo Aval and companies in which Grupo Aval, its principal shareholders or board members have a direct equity interest of at least 10.0%. For the purposes of this section, and as required by SEC rules, “related parties” includes enterprises that control, or are under common control with Grupo Aval, associates, individuals owning directly or indirectly an interest in the voting power that gives them significant influence over Grupo Aval, close family members, key management personnel (including directors and senior management) and any enterprises in which a substantial interest in the voting power is owned, directly or indirectly, by any of the persons listed above. We determine beneficial ownership under SEC rules. See “—A. Major shareholders.”
Certain members of our board of directors and key management own shares of Grupo Aval which, other than in the case of Mr. Sarmiento Angulo, were acquired in the open market and represent less than 0.1% of our total outstanding shares. On May 12, 2011, Grupo Aval concluded the Preferred Shares Local Offering in which it sold 1,600 million preferred shares, raising an aggregate amount of Ps 2.1 trillion (U.S.$1.1 billion at the representative market rate on such date), before deducting brokerage commissions and discounts, and transaction expenses. In connection with our Preferred Shares Local Offering, certain members of our board of directors and key management acquired preferred shares under the same conditions granted to the general public. See “Item 6. Directors, Senior Management and Employees—E. Share ownership.” We do not, and have not, offered or granted any share options to any of our directors or employees.
Loans granted to Grupo Aval and its subsidiaries by shareholders of Grupo Aval and their affiliates
Certain shareholders of Grupo Aval and their affiliates have granted loans to Grupo Aval and its subsidiaries on an arm’s-length basis. All loans are unsecured and have a five-year term, with a two-year grace period. The following are the outstanding loans granted to Grupo Aval by shareholders of Grupo Aval and their respective affiliates at April 25, 2012:
| | · | loans granted by Bienes y Comercio S.A., a company beneficially owned by Mr. Sarmiento Angulo, to Grupo Aval between February 2010 and February 2012, with a total outstanding amount of Ps 166.7 billion (U.S.$85.8 million) at April 25, 2012 at an interest rate of DTF + 3.0% per annum; and |
| | · | loans granted by Adminegocios & Cía. S.C.A., an entity beneficially owned by Mr. Sarmiento Angulo, to Grupo Aval on February 2012, with a total outstanding amount of Ps 8.3 billion (U.S.$4.3 million) at April 25, 2012, at an interest rate of DTF + 3.0% per annum. |
The following loans were granted between October 1, 2010 and December 31, 2010 by companies beneficially owned by Mr. Sarmiento Angulo to Grupo Aval in part to fund the acquisition of 13,726,421 mandatorily convertible bonds issued by Banco de Bogotá (convertible into 29,205,152 shares of Banco de Bogotá). The proceeds of the convertible bond issuance were used to finance the BAC Credomatic acquisition. See “Business—BAC Credomatic.” All loans were granted on an arm’s-length basis, are unsecured and have a five-year term, with a two-year grace period, as follows:
| | · | loans granted by Rendifin S.A. to Grupo Aval with a total outstanding amount of Ps 789.7 billion (U.S.$406.5 million) at an interest rate of DTF + 3.0% per annum; and |
| | · | loans granted by Bienes y Comercio S.A. with a total outstanding amount of Ps 189.0 billion (U.S.$97.3 million) at an interest rate of DTF + 3.0% per annum. |
The total amount of loans outstanding from companies beneficially owned by Mr. Sarmiento Angulo at April 25, 2012 is Ps 1,153.8 billion (U.S.$593.9 million).
Loans granted to related parties by our banking subsidiaries
Key management of Grupo Aval and our banks, and their respective affiliates, who meet our credit eligibility requirements may subscribe to loans in the ordinary course of business, on market terms and conditions available to the general public.
All outstanding loans with our related parties are made in the ordinary course of business and on terms and conditions, including interest rates and collateral, not materially different from those available to the general public and did not involve more than the normal risk of collectability or present other unfavorable features.
In connection with our Preferred Shares Local Offering, certain members of our board of directors and key management were granted loans by our banking subsidiaries for the purpose of acquiring Grupo Aval preferred shares. These loans were granted at market rates and on terms and conditions not materially different from those available to other purchasers of Grupo Aval shares.
Other transactions with Mr. Sarmiento Angulo and his affiliates
Beneficial ownership in our banking subsidiaries
In addition to his beneficial ownership in Grupo Aval, Mr. Sarmiento Angulo beneficially owns at the date of this annual report, 9.6% of Banco de Bogotá, 13.3% of Banco de Occidente, 15.4% of Banco AV Villas and 0.7% of Banco Popular.
Except as stated above, Mr. Sarmiento Angulo does not have any other beneficial ownership in our banking subsidiaries. For information on the dividend history of our banking subsidiaries, see “Item 10. Additional Information—F. Dividends and paying agents—Dividend history of our banking subsidiaries.”
Banco Popular share ownership reorganization
Immediately prior to the completion of the First Banco Popular Share Ownership Transaction on June 23, 2011, Grupo Aval directly owned 2,368,686,432 shares (or 30.66%) of the share capital of Banco Popular, while Rendifin S.A., Popular Securities S.A. and Inversiones Escorial S.A. (companies beneficially owned by Mr. Sarmiento Angulo) owned 4,872,610,306 (or 63.07%) of the share capital of Banco Popular.
On January 31, 2011, Grupo Aval entered into the First Banco Popular Share Ownership Reorganization Transaction through an agreement with Rendifin S.A. to acquire through escisión 43.47% of Banco Popular’s outstanding shares held by Rendifin S.A. in exchange for 2,073,115,004 of our preferred shares at a ratio of 1.62 Banco Popular share per Grupo Aval preferred share. We completed this transaction on June 23, 2011 and increased our direct ownership in Banco Popular to 74.17% and issued 2,073,115,004 preferred shares to the shareholders of Rendifin S.A.
On April 29, 2011, we entered into the Second Banco Popular Share Ownership Reorganization Transaction through a second agreement with Popular Securities S.A. and Inversiones Escorial S.A. to acquire an additional 19.60% of Banco Popular in exchange for 934,669,126 preferred shares at the same ratio of 1.62 Banco Popular share per Grupo Aval preferred share, which increased our ownership interest in Banco Popular to 93.73%. The Second Banco Popular Share Ownership Reorganization Transaction closed on September 20, 2011.
The independent investment bank Rothschild de Mexico S.A. de C.V. issued a fairness opinion on January 6, 2011, stating that the exchange ratio of 1.62 Banco Popular shares to one Grupo Aval preferred share was reasonable to Grupo Aval shareholders.
Grupo Aval had previously controlled Banco Popular through a shareholders’ agreement with Rendifin S.A. Pursuant to this agreement, Rendifin had granted Grupo Aval irrevocable power to represent Rendifin’s shares in Banco Popular. The agreement provided that all economic rights to the Banco Popular shares would continue to be vested in Rendifin. The agreement terminated on June 23, 2011 because Grupo Aval came to own more than 50% of the issued and outstanding shares of Banco Popular. Prior to termination, Grupo Aval received, as compensation for its services, a monthly fee in the amount of Ps 116,072,351, which was linked to the CPI.
Insurance services
Seguros de Vida Alfa S.A., or “Vida Alfa,” a life insurance affiliate of Mr. Sarmiento Angulo, provides insurance required by law, as well as annuities, relating to the mandatory pension funds managed by Porvenir. The insurance provider is selected by Porvenir through a competitive bidding process once every four years. Premiums under this insurance policy are deducted by Porvenir from the individual customers’ account and transferred to Vida Alfa on behalf of the individual customer.
The table below presents the insurance premiums paid for the periods indicated.
| | | |
| | | (in Ps billions) | |
For the three-month period ended March 31, 2012 | | | 72.8 | |
| | | | | |
| For the year ended December 31: | | | | |
2011 | | | 285.7 | |
2010 | | | 252.7 | |
Vida Alfa also provides:
| | · | life insurance, as sole provider and as co-insurer with non-affiliated insurers (pursuant to a competitive bidding process), for individual borrowers of our banking subsidiaries to cover the risk of non-payment upon death. Premiums are paid by the borrowers; and |
| | · | workers compensation for all employees of Grupo Aval and its subsidiaries. |
Seguros Alfa S.A., or “Alfa,” a property and casualty insurance affiliate of Mr. Sarmiento Angulo, provides fire and earthquake insurance for mortgage loans granted by certain of our banks. In addition, Alfa provides surety bonds and property insurance for our subsidiaries. Our banking subsidiaries also provide insurance products affiliated with Vida Alfa and Alfa through their bancassurance lines. These transactions are conducted on an arm’s-length basis in the ordinary course of business. Alfa has in the past, but not currently, provided bankers’ blanket bond coverage to our subsidiaries, reinsured under prevailing market conditions, and surety bonds for Corficolombiana’s toll-road concessions. The amounts relating to those transactions are immaterial.
Put/call agreement between Grupo Aval and Adminegocios & Cia. S.C.A., an entity controlled by Mr. Sarmiento Angulo and a direct shareholder of Grupo Aval
On November 24, 2010, Grupo Aval and Adminegocios & Cia. S.C.A., an entity controlled by Mr. Sarmiento Angulo, our controlling shareholder, entered into an agreement whereby Grupo Aval assigned to Adminegocios & Cia. S.C.A. its right to acquire up to 2,605,000 mandatorily convertible bonds issued by Banco de Bogotá (convertible into 5,542,553 shares of Banco de Bogotá). Under the put/call agreement, we have an option to purchase from Adminegocios & Cia. S.C.A., and they have the right to sell, 2,605,000 convertible bonds (or the underlying shares, if converted). In either case, the purchase price we will have to pay Adminegocios & Cia. S.C.A. is the subscription price paid by Adminegocios & Cia. S.C.A. at the time of acquiring the mandatorily convertible bonds issued by Banco de Bogotá plus a premium of 6.5% per annum up to the date of acquisition. The options expire two years from December 2, 2010, the date of first subscription of the mandatorily convertible bonds. With the 2,605,000 convertible bonds assigned by us, Adminegocios & Cia. S.C.A. acquired a total of 4,249,965 convertible bonds from Banco de Bogotá. The mandatorily convertible bonds were acquired by Adminegocios & Cia. S.C.A. in order to finance the BAC Credomatic acquisition. We expect to exercise our option before it expires.
On March 1, 2011, Adminegocios & Cia. S.C.A. converted all of its 4,249,965 mandatorily convertible bonds holding into 9,042,478 common shares of Banco de Bogotá.
We expect to acquire (on the same pricing terms as the put/call agreement and simultaneously with the exercise of our option under such agreement) 3,499,925 shares of Banco de Bogotá from Adminegocios & Cia. S.C.A., in addition to the 5,542,553 shares of Banco de Bogotá subject to the option in the put/call agreement.
Other
The following companies are beneficially owned by Mr. Sarmiento Angulo and may continue to provide services to us and our subsidiaries for amounts that are immaterial: Construcciones Planificadas S.A. (office renovations), Vigía S.A. (security services) and Corporación Publicitaria de Colombia S.A. (advertising).
Not applicable.
Financial statements
See “Item 18. Financial Statements,” which contains our financial statements prepared in accordance with Colombian Banking GAAP.
Legal proceedings
We, our banking subsidiaries, Porvenir and Corficolombiana are party to lawsuits and administrative proceedings incidental to the normal course of our business.
We record contingency provisions when the risk of loss is probable, in which case, we would consider settling. In cases where we litigate a claim, we record a provision for our estimate of the probable loss based on historical data for similar claims. Due to the provisions we have established and the legal opinions we have received, we do not believe that any liabilities related to such lawsuits or proceedings will have a material adverse effect on our financial conditions or results of operations. At December 31, 2011, we, our banking subsidiaries, Corficolombiana and Porvenir have recorded provisions for a total amount of approximately Ps 39.8 billion.
Constitutional actions
We, our banking subsidiaries, Porvenir and Corficolombiana are also party to collective or class actions (“acciones populares” or “acciones de grupo,” respectively). Collective actions are court actions where an individual seeks to protect collective rights and prevent contingent damages, obtain injunctions and damages caused by an infringement of collective rights of which the following are the most significant.
All pension and severance fund administrators in Colombia, including Porvenir, are subject to at least two class actions in which certain individuals are alleging that the pension and severance funds administrators have caused damages to their customers by (1) paying returns earned by the severance and pension funds below the minimum profitability certified by the Superintendency of Finance, and (2) making payments to its customers—under the scheduled retirement system—below the established standards. Additionally, Porvenir and four of the largest pension and severance funds are subject to a constitutional action relating to charging commissions above the legally established limits for contributions to mandatory pension funds. These constitutional actions are seeking the payment of the alleged damages caused to fund managers’ customers. No provisions have been established in connection with these three constitutional actions because the amount is unquantifiable, and we consider the probability of loss to be remote.
Banco de Bogotá, Banco de Occidente, Banco Popular and Corficolombiana are subject to two relevant constitutional actions, as follows:
| | · | A constitutional action filed by certain individuals on behalf of the taxpayers of Cali, claiming that Banco de Bogotá S.A., among other financial institutions, abused its dominant position as creditors of the municipality of Cali in connection with credit facilities granted to such institutions, and therefore, are seeking the reimbursement of interest paid by the municipality in excess of the amounts due at September 30, 2009. We believe that the probability of loss in connection with this constitutional action is low (eventual) and, as such, have not recorded any provisions in connection with this constitutional action. |
| | · | A constitutional action filed by certain individuals on behalf of Department of Valle (Departamento del Valle) against several financial institutions, including Banco de Bogotá S.A., claims that the Department has paid interest in a manner prohibited by law, in connection with a credit facility granted to the Province. In addition, the plaintiffs are claiming that the defendants did not pay the alleged real value of the shares of Sociedad Portuaria de Buenaventura and Empresa de Energía del Pacífico, on a sale transaction of said shares. We consider the probability of loss in connection with this constitutional action to be low (eventual) and, therefore, have not recorded any provision. |
Banco AV Villas is subject to constitutional actions brought against several companies in the financial sector in Colombia in connection with the recalculation of mortgage interests that allegedly damaged several mortgage lenders. Banco AV Villas has a comparatively small mortgage portfolio, and we believe that the probability of loss in connection with these constitutional actions is remote.
Other litigation
The Superintendency of Industry and Commerce is currently conducting an investigation into certain Colombian banks, including Banco de Bogotá, Banco de Occidente, Banco Popular and Banco AV Villas, for alleged price fixing of bank interchange fees charged by issuer banks to acquiring banks during the period from May 2007 to October 2008. See “Item 3. Key Information—D. Risk Factors—Risks relating to our businesses and industry—Risks relating to our banking business—We may face legal and other challenges to maximizing revenue from credit card fees and other fees from customers.”
In addition to the matters described above, we, our banking subsidiaries, Porvenir, Corficolombiana and BAC are from time to time subject to claims and parties to legal proceedings incidental to the normal course of our business, including in connection with our lending activities, employees, taxation matters and other general commercial matters. Due to the inherent difficulty of predicting the outcome of legal disputes, we cannot predict the eventual outcome of these pending matters, what the timing of the ultimate resolution of these matters will be or what the eventual loss, fines or penalties related to each pending matter may be. We believe that we have recorded adequate provisions for the anticipated costs in connection with these claims and legal proceedings and believe that liabilities related to such claims and proceedings should not, in the aggregate, have a material adverse effect on our business, financial conditions, or results of operations. However, in light of the uncertainties involved in such claims and proceedings, the ultimate resolution of these matters may exceed the provisions that we have currently recorded. As a result, the outcome of a particular matter could be material to our operating results for a particular period.
A discussion of the significant changes in our business can be found under “Item 4. Information on the Company—A. History and development of the company.”
Not applicable.
Not applicable.
Market price and volume information
Our preferred shares have been listed since February 1, 2011 on the Colombian Stock Exchange, which is relatively small and illiquid compared to securities exchanges in major financial centers. In addition, a small number of issuers represent a disproportionately large percentage of market capitalization and trading volume on the Colombian Stock Exchange. A liquid trading market for the preferred shares might not develop on the Colombian Stock Exchange which could impair the ability of a holder of preferred shares to dispose of such shares on the Colombian Stock Exchange in the amount and at the price and time desired by such holder, and could increase the volatility of the market price of our preferred shares.
Trading history of our preferred shares
Our preferred shares have been listed since February 1, 2011 on the Colombian Stock Exchange under the symbol “PFAVAL” and we first issued preferred shares on May 12, 2011 at the conclusion of the Preferred Shares Local Offering. Due to this recent issuance, historical trading data and prices are limited. The following table
presents the high and low closing sales prices for the periods indicated, and average daily trading volume for our preferred shares on the Colombian Stock Exchange.
| | | | |
| | | | | | | | | Average daily trading volume | |
| | | (Ps per share) | | | (in shares) | |
| Year | | | | | | | | | |
2011 (beginning May 12) | | | 1,320 | | | | 1,120 | | | | 3,363,366 | |
| Quarter | | | | | | | | | | | | |
Second Quarter 2011 (beginning May 12) | | | 1,315 | | | | 1,250 | | | | 4,392,269 | |
Third Quarter 2011 | | | 1,320 | | | | 1,120 | | | | 2,151,997 | |
Fourth Quarter 2011 | | | 1,300 | | | | 1,130 | | | | 3,916,467 | |
First Quarter 2012 | | | 1,325 | | | | 1,160 | | | | 3,914,596 | |
Second quarter 2012 (through April 25, 2012) | | | 1,300 | | | | 1,250 | | | | 2,084,400 | |
| Month | | | | | | | | | | | | |
October 2011 | | | 1,250 | | | | 1,210 | | | | 1,744,628 | |
November 2011 | | | 1,300 | | | | 1,130 | | | | 7,825,521 | |
December 2011 | | | 1,280 | | | | 1,200 | | | | 2,179,253 | |
January 2012 | | | 1,270 | | | | 1,160 | | | | 1,378,219 | |
February 2012 | | | 1,260 | | | | 1,210 | | | | 3,298,650 | |
March 2012 | | | 1,325 | | | | 1,235 | | | | 6,946,139 | |
April 2012 (through April 25, 2012) | | | 1,300 | | | | 1,250 | | | | 2,084,400 | |
Source: Colombian Stock Exchange.
On April 25, 2012, the last reported closing sale price on the Colombian Stock Exchange was Ps 1,250 per preferred share.
Trading history of our common shares.
The principal trading market for our common shares is the Colombian Stock Exchange. Shares of our common shares began trading on the Colombian Stock Exchange in 1999 and are listed under the symbol “GRUPOAVAL.” The following table presents the high and low closing sales prices and average daily trading volume for shares of our common shares on the Colombian Stock Exchange for the periods indicated. Due to a relatively low public float (6.0% of our total share capital), our common shares have historically traded at prices that we believe should not be a meaningful factor in determining the price for our preferred shares.
| | | | |
| | | | | | | | | Average daily trading volume | |
| | | (Ps per share) | | | (in shares) | |
| Year | | | | | | | | | |
2006 | | | 802 | | | | 449 | | | | 1,673,566 | |
2007 | | | 697 | | | | 570 | | | | 1,638,804 | |
2008 | | | 645 | | | | 388 | | | | 1,378,067 | |
2009 | | | 785 | | | | 450 | | | | 1,781,899 | |
2010 | | | 1,770 | | | | 745 | | | | 2,069,109 | |
2011 | | | 1,715 | | | | 1,125 | | | | 1,492,887 | |
| Quarter | | | | | | | | | | | | |
First quarter 2010 | | | 913 | | | | 745 | | | | 1,984,411 | |
Second quarter 2010 | | | 957 | | | | 875 | | | | 1,505,195 | |
Third quarter 2010 | | | 1,335 | | | | 918 | | | | 1,941,629 | |
Fourth quarter 2010 | | | 1,770 | | | | 1,315 | | | | 2,840,134 | |
First quarter 2011 | | | 1,715 | | | | 1,345 | | | | 1,669,916 | |
Second quarter 2011 | | | 1,370 | | | | 1,255 | | | | 1,805,270 | |
Third quarter 2011 | | | 1,315 | | | | 1,125 | | | | 1,119,850 | |
Fourth quarter 2011 | | | 1,270 | | | | 1,135 | | | | 1,384,055 | |
First quarter 2012 | | | 1,330 | | | | 1,160 | | | | 597,033 | |
Second quarter 2012 (through April 25, 2012) | | | 1,275 | | | | 1,240 | | | | 614,623 | |
| Month | | | | | | | | | | | | |
October 2011 | | | 1,245 | | | | 1,210 | | | | 1,114,841 | |
November 2011 | | | 1,260 | | | | 1,135 | | | | 1,427,098 | |
December 2011 | | | 1,270 | | | | 1,190 | | | | 1,610,227 | |
January 2012 | | | 1,220 | | | | 1,160 | | | | 333,211 | |
February 2012 | | | 1,260 | | | | 1,205 | | | | 646,597 | |
March 2012 | | | 1,330 | | | | 1,230 | | | | 798,729 | |
April 2012 (through April 25, 2012) | | | 1,275 | | | | 1,240 | | | | 614,623 | |
Source: Colombian Stock Exchange.
On April 25, 2012, the last reported closing sale price on the Colombian Stock Exchange was Ps 1,240 per common share.
Trading history of common shares of our subsidiaries
The common shares of five of our subsidiaries are listed on the Colombian Stock Exchange, as follows:
| | · | Banco de Bogotá, under the symbol “BOGOTA”; |
| | · | Banco de Occidente, under the symbol “OCCIDENTE”; |
| | · | Banco Popular, under the symbol “POPULAR”; |
| | · | Banco AV Villas, under the symbol “VILLAS”; and |
| | · | Corficolombiana, under the symbol “CORFICOLCF.” |
The following tables set forth the high and low closing sales prices, and average daily trading volume for the common shares of Banco de Bogotá, Banco de Occidente, Banco Popular, Banco AV Villas and Corficolombiana on the Colombian Stock Exchange for the periods indicated. Due to a relatively low public float (approximately 12.7% of the total share capital of Banco de Bogotá, approximately 4.7% of the total share capital of Banco Popular, approximately 9.1% of the total share capital of Banco de Occidente and approximately 4.9% of the total share capital of Banco AV Villas), the shares of these banking subsidiaries have historically traded at low volumes and traded at prices that we believe should not be a meaningful factor in determining the price for our preferred shares. Very few of the shares of Banco Popular not owned or controlled by us or our controlling shareholder are held by the public; rather, they are held by Colombian governmental institutions. Approximately 28.5% of the total shares of Corficolombiana is held by the public.
Banco de Bogotá
| | | | |
| | | | | | | | | Average daily trading volume | |
| | | (Ps per share) | | | (in shares) | |
| Year | | | | | | | | | |
2009 | | | 34,580 | | | | 22,100 | | | | 14,003 | |
2010 | | | 59,000 | | | | 33,100 | | | | 22,523 | |
2011 | | | 56,000 | | | | 47,300 | | | | 15,547 | |
| Quarter | | | | | | | | | | | | |
First quarter 2011 | | | 56,000 | | | | 52,520 | | | | 21,981 | |
Second quarter 2011 | | | 54,600 | | | | 51,900 | | | | 14,337 | |
Third quarter 2011 | | | 53,300 | | | | 48,020 | | | | 14,999 | |
Fourth quarter 2011 | | | 50,000 | | | | 47,300 | | | | 10,703 | |
First quarter 2012 | | | 52,060 | | | | 48,000 | | | | 18,688 | |
Second quarter 2012 (through April 25, 2012) | | | 51,000 | | | | 50,160 | | | | 11,588 | |
Source: Colombian Stock Exchange.
On April 25, 2012, the last reported closing sale price on the Colombian Stock Exchange was Ps 50,200 per common share.
Banco de Occidente
| | | | |
| | | | | | | | | Average daily trading volume | |
| | | (Ps per share) | | | (in shares) | |
| Year | | | | | | | | | |
2009 | | | 28,500 | | | | 15,660 | | | | 966 | |
2010 | | | 38,900 | | | | 27,780 | | | | 18,251 | |
2011 | | | 38,800 | | | | 28,940 | | | | 6,650 | |
| Quarter | | | | | | | | | | | | |
First quarter 2011 | | | 38,800 | | | | 34,000 | | | | 13,752 | |
Second quarter 2011 | | | 34,980 | | | | 33,000 | | | | 9,186 | |
Third quarter 2011 | | | 33,500 | | | | 30,000 | | | | 1,456 | |
Fourth quarter 2011 | | | 30,000 | | | | 28,940 | | | | 2,185 | |
First quarter 2012 | | | 30,500 | | | | 28,400 | | | | 2,940 | |
Second quarter 2012 (through April 25, 2012) | | | 31,000 | | | | 30,000 | | | | 1,929 | |
Source: Colombian Stock Exchange.
On April 25, 2012, the last reported closing sale price on the Colombian Stock Exchange was Ps 30,500 per common share.
Banco Popular
| | | | |
| | | | | | | | | Average daily trading volume | |
| | | (Ps per share) | | | (in shares) | |
| Year | | | | | | | | | |
2009 | | | 300 | | | | 260 | | | | 4,574 | |
2010 | | | 560 | | | | 300 | | | | 80,055 | |
2011 | | | 770 | | | | 499 | | | | 31,010 | |
| Quarter | | | | | | | | | | | | |
First quarter 2011 | | | 770 | | | | 560 | | | | 83,231 | |
Second quarter 2011 | | | 650 | | | | 600 | | | | 4,705 | |
Third quarter 2011 | | | 620 | | | | 620 | | | | 708 | |
Fourth quarter 2011 | | | 620 | | | | 499 | | | | 35,609 | |
First quarter 2012 | | | 520 | | | | 520 | | | | 291,076 | |
Second quarter 2012 (through April 25, 2012) | | | – | | | | – | | | | – | |
Source: Colombian Stock Exchange.
The last reported closing sale price on the Colombian Stock Exchange, which was on March 30, 2012, was Ps 520 per common share.
Banco AV Villas
| | | | |
| | | | | | | | | Average daily trading volume | |
| | | (Ps per share) | | | (in shares) | |
| Year | | | | | | | | | |
2009 | | | 5,280 | | | | 2,950 | | | | 1,198 | |
2010 | | | 8,200 | | | | 3,205 | | | | 3,751 | |
2011 | | | 8,200 | | | | 6,500 | | | | 894 | |
| Quarter | | | | | | | | | | | | |
First quarter 2011 | | | 8,200 | | | | 7,310 | | | | 537 | |
Second quarter 2011 | | | 8,000 | | | | 7,000 | | | | 733 | |
Third quarter 2011 | | | 7,000 | | | | 6,500 | | | | 2,090 | |
Fourth quarter 2011 | | | 7,800 | | | | 6,800 | | | | 172 | |
First quarter 2012 | | | 7,990 | | | | 5,210 | | | | 861 | |
Second quarter 2012 (through April 25, 2012) | | | 7,990 | | | | 7,990 | | | | 122 | |
.
Source: Colombian Stock Exchange.
On April 25, 2012, the last reported closing sale price on the Colombian Stock Exchange was Ps 7,990 per common share.
Corficolombiana
| | | | |
| | | | | | | | | Average daily trading volume | |
| | | (Ps per share) | | | (in shares) | |
| Year | | | | | | | | | |
2009 | | | 23,500 | | | | 13,040 | | | | 57,735 | |
2010 | | | 36,460 | | | | 22,540 | | | | 117,254 | |
2011 | | | 35,600 | | | | 31,600 | | | | 79,754 | |
| Quarter | | | | | | | | | | | | |
First quarter 2011 | | | 35,500 | | | | 33,400 | | | | 126,062 | |
Second quarter 2011 | | | 34,600 | | | | 33,120 | | | | 41,157 | |
Third quarter 2011 | | | 35,600 | | | | 31,600 | | | | 90,261 | |
Fourth quarter 2011 | | | 35,180 | | | | 33,100 | | | | 60,109 | |
First quarter 2012 | | | 34,880 | | | | 33,600 | | | | 67,773 | |
Second quarter 2012 (through April 25, 2012) | | | 33,840 | | | | 33,000 | | | | 40,365 | |
Source: Colombian Stock Exchange.
On April 25, 2012, the last reported closing sale price on the Colombian Stock Exchange was Ps 33,300 per common share.
Trading on the Colombian Stock Exchange
The Colombian Stock Exchange is the sole market for the common and preferred shares of Grupo Aval and the common shares of our banking subsidiaries and Corficolombiana. There are no official market makers or independent specialists on the Colombian Stock Exchange to assure market liquidity and, therefore, orders to buy or sell in excess of corresponding orders to sell or buy will not be executed. The aggregate equity market capitalization of the 83 companies listed on the Colombian Stock Exchange at April 25, 2012 was Ps 463.0 trillion (U.S.$261.9 billion). See “Item 4. Information on the Company—B. Business overview—Industry—Colombia—Recent developments in the Colombian stock market.”
Regulation of Colombian securities markets
Colombian securities markets are subject to the supervision and regulation of the Superintendency of Finance, which was created in 2005 following the merger of the Superintendency of Banking and the Superintendency of Securities. The Superintendency of Finance is an independent regulatory entity ascribed to the Ministry of Finance and Public Finance. The Superintendency of Finance has the authority to inspect, supervise and control the financial, insurance and securities exchange sectors and any other activities related to the investment or management of public savings. Accordingly, we are subject to the supervision and control of the Superintendency of Finance as an issuer of securities, and our subsidiaries are subject to its supervision and regulation as financial institutions and issuers of securities. See “Item 4. Information on the Company—B. Business overview—Industry—Supervision and regulation—Colombian banking regulators—Ministry of Finance and Public Credit” and “—Superintendency of Finance.”
Investment in our preferred shares by non-residents of Colombia
The International Investment Statute of Colombia as provided by Decree 2080 of 2000, as amended, regulates the manner in which foreign investors may participate in the Colombian securities markets and undertake other types of investment, prescribes registration with the Colombian Central Bank of certain foreign exchange transactions and specifies procedures under which certain types of foreign investments are to be authorized and administered.
A preferred shareholder may under certain circumstances be required to comply directly with certain registration and other requirements under the foreign investment regulations. Under these regulations, the failure of a non-resident investor to report or register foreign exchange transactions relating to investments in Colombia with the Colombian Central Bank on a timely basis may prevent the investor from obtaining remittance rights, including for the payment of dividends, and constitute an exchange control violation and/or result in a fine.
Under Colombian law, foreign investors receive the same treatment as Colombian citizens with respect to the ownership and voting of our preferred securities. See “Item 3. Key Information—D. Risk factors—Risks relating to our preferred shares.”
Not applicable.
Not applicable.
Not applicable.
Not applicable.
The following is a summary of certain significant provisions of our by-laws, Colombian corporate law, the rules and regulations of the Superintendency of Finance and the Listing Rules of the Colombian Stock Exchange that pertain to our capital, management, periodical and occasional disclosures, as well as other corporate issues applicable to us. The description below includes the material provisions of our by-laws and Colombian corporate law. In Colombia, by-laws are the principal governing document of a corporation.
Our by-laws provide for an authorized share capital of 120,000,000,000 shares of par value of Ps 1.00 each, which may be either of two classes: common shares or shares with a preferred dividend, liquidation preference and no voting. At April 25, 2012, we had 13,719,081,181 common shares outstanding, and 4,832,685,272 preferred shares outstanding.
Our by-laws also provide for the conversion of common shares into preferred shares. A shareholders’ meeting must define, in each case, the procedure to be followed for such conversion and must determine, among other matters, the maximum number or percentage of shares that may be converted. The shareholders’ meeting may also authorize the Board of Directors or the President of our Company to approve the agreements, forms and other documents to be executed in order to give effect to a conversion.
Our shareholders’ meeting held on December 7, 2010, determined that outstanding common shares may be converted into preferred shares on a 1-to-1 basis. Conversion of common shares into preferred shares may only be made once a month, provided that, as required by Colombian law and in accordance with our by-laws, our preferred shares shall not exceed 50% of our subscribed capital.
Voting rights
Common shares
The holders of common shares are entitled to vote on the basis of one vote per share on any matter subject to approval at a general shareholders’ meeting. These general meetings may be ordinary meetings or extraordinary meetings. Ordinary general shareholders’ meetings occur twice a year, no later than the last business day of March and September, for the following purposes:
| | · | to consider the approval of our report for the preceding semester ending on June 30 or December 31, as applicable, including the financial statements for the above-mentioned term; |
| | · | to review the report prepared by the external auditor for the preceding semester ending on June 30 or December 31; |
| | · | to elect directors and the external auditor (on an annual basis); |
| | · | to determine the compensation of the members of the board of directors and the external auditor (on an annual basis); and |
| | · | to determine the dividend policy and the allocation of profits, if any, of the preceding semester ending on June 30 or December 31, respectively, as well as any retained earnings from previous semesters. |
Pursuant to Law 964 of 2005, at least 25% of the members of our board of directors must be independent within the meaning of Colombian rules. A person who is an “independent director” is understood to mean a director who is not:
| | · | an employee or director of the issuer or any of its parent or subsidiary companies, including any person acting in such capacity during the year immediately preceding that in which they were appointed to the board, except in the case of an independent member of the board of directors being re-elected; |
| | · | a shareholder, who either directly or by virtue of an agreement directs, guides or controls the majority of the entity’s voting rights or who determines the majority composition of the administrative, directing or controlling bodies of this same entity; |
| | · | a partner or employee of any association or firm that provides advisory or consultancy services to the issuer or to companies belonging to the same economic group to which such issuer belongs, in the event that income obtained from such services represent for said association or firm at least twenty percent (20.0%) of its total operating income; |
| | · | an employee or director of a foundation, association, partnership or corporation that receives significant donations from the issuer. The term “significant donations” is quantified as twenty percent (20.0%) or more of the total amount of donations received by the respective institution; |
| | · | an administrator of any entity on whose board of directors a legal representative of the issuer participates; or |
| | · | a board member who receives from the issuer any kind of remuneration other than fees as a member of the board of directors, member of the audit committee or any other committee established by the board of directors. |
Pursuant to Decree 3923 of 2006, the election of independent directors must be in a ballot separate from the ballot to elect the rest of the directors, unless the reaching of the minimum number of independent directors required by law or by the by-laws is assured, or when there is only one list that includes the minimum number of independent directors required by law or by the by-laws.
Both elections are made under a proportional representation voting system named electoral quotient—“cociente electoral” (except for the elections unanimously approved by the general shareholders’ meeting). Under that system:
| | · | each holder of common shares is entitled at the first annual general shareholders’ meeting to nominate candidates for the election of directors; |
| | · | each nomination of one or more directors by a shareholder constitutes a list for the purposes of the election; |
| | · | each list of nominees must contain a hierarchy as to the order of preference for nominees in that list to be elected; |
| | · | once all lists have been nominated, holders of common shares may cast one vote for each common share held in favor of a particular list of nominees. Votes may not be cast for particular nominees in a list; they may be cast only for the entire list; |
| | · | the total number of votes cast in the election is divided by the number of directors to be elected. The resulting quotient is the quota of votes necessary to elect particular directors. For each time that the number of votes cast for a list of nominees is divisible by the quota of votes, one nominee from that list is elected, in the order of the hierarchy of that list; and |
| | · | when no list has enough remaining votes to satisfy the quota of votes necessary to elect a director, any remaining board seat or seats are filled by electing the highest remaining nominee from the list with the highest number of remaining votes cast until all available seats have been filled. |
Extraordinary general shareholders’ meetings may take place when duly called for a specified purpose or purposes, or, without prior notice, when holders representing all outstanding shares entitled to vote on the issues presented are present at the meeting. Extraordinary meetings of shareholders may be called by our board of directors, by our president or by our external auditor, directly or by request of a plural number of shareholders representing no less than 25.0% of the company’s capital. In addition, meetings may be called by the Superintendency of Finance, directly or by request of shareholders holding at least 15.0% of the shares outstanding. Notice of extraordinary meetings should be given at least five days in advance.
Quorum for both ordinary and extraordinary general shareholders’ meetings to be convened at first call requires the presence of two or more shareholders representing at least 50.0% plus one of the outstanding shares entitled to vote at the relevant meeting. If no quorum is present for a general shareholders’ meeting, a subsequent meeting may
be called within 10 to 30 business days at which the presence of two or more shareholders entitled to vote at the relevant meeting constitutes quorum, regardless of the number of shares represented.
Notice of ordinary general meetings must be published in one newspaper of wide circulation, at least 15 business days prior to the proposed date of a general shareholders’ meeting. Notice of extraordinary general meetings, listing the matters to be addressed at such meetings, must be published in one newspaper of wide circulation, at least five calendar days prior to the proposed date of an extraordinary general shareholders’ meeting.
Except where Colombian law requires a supermajority, decisions made at a shareholders’ meeting must be approved by a majority of the shares present. Pursuant to Colombian law and/or our by-laws, special-majorities are required in the following cases:
| | · | the vote of at least 70.0% of the shares present and entitled to vote at a shareholders’ meeting is required to approve the issuance of common shares not subject to preemptive rights; |
| | · | the Company must distribute (1) at least 50.0% of the semester’s net profits according to Article 155 of the Colombian Code of Commerce, or (2) at least 70.0% of the semester’s net profits if the total amount segregated in the legal, statutory and other reserves exceeds the Company’s outstanding capital, according to Article 454 of the Colombian Code of Commerce; however, the vote of at least 78.0% of the shares represented and entitled to vote may approve the distribution of a lower percentage of dividends; |
| | · | The vote of at least 80.0% of the shares present and entitled to vote is required to approve the payment of dividends in shares; however, according to Law 222 of 1995, if a “situation of control” exists, whereby the decision-making power is subject to the will of a person or group of persons, a company may only pay dividends by issuing shares, to the shareholders that so accept; |
| | · | unanimity is required to replace a vacancy on the board of directors without applying the electoral quotient system described above; and |
| | · | the vote of 70.0% of the issued and outstanding common shares and 70.0% of the outstanding and issued preferred shares is required to approve any amendment that may impair the rights of the preferred shares. |
The adoption by a shareholders’ meeting of certain corporate actions such as mergers, escisiones, and share conversions are also subject to authorization by the Superintendency of Finance.
Preferred shares
The holders of preferred shares are not entitled to receive notice of, attend to or vote at any general shareholders’ meeting of holders of common shares, except as described below.
The holders of preferred shares will be entitled to vote on the basis of one vote per share at any shareholders’ meeting, whenever a shareholder vote is required on the following matters:
| | · | in the event that amendments to our by-laws may impair the conditions or rights assigned to such preferred shares and when the conversion of such shares into common shares is to be approved. In both such cases, the vote of 70.0% of the outstanding and issued preferred shares is required; and |
| | · | if at the end of any six-month period, our profits are not sufficient to pay the minimum dividend on the preferred shares and the Superintendency of Finance, by its own decision or upon request of holders of at least 10.0% of preferred shares, determines that benefits were concealed or shareholders were misled with regard to benefits thereby decreasing the profits to be distributed, the Superintendency of Finance may resolve that holders of preferred shares should participate with speaking and voting rights at the general shareholders’ meeting, in the terms established by law. |
We must issue a notice of any meeting at which holders of preferred shares are entitled to vote, which notice must be published in a newspaper of wide circulation. Depending on the matters to be subjects of the shareholders
meeting, notice to preferred shareholders must be delivered at least 15 business days or 5 calendar days before the meeting. Each notice must contain the following:
| | · | the date of the meeting; |
| | · | a description of any resolution to be proposed for adoption at the meeting on which the holders of preferred shares are entitled to vote; and |
| | · | instructions for the delivery of proxies. |
Redemption
All shareholders (whether holders of common or preferred shares) have, at their option, a redemption right in the following cases:
| | · | If, as a result of a merger, transformation or escisión of the Company, (a) the stockholders must assume a higher level of liability (i.e., by transforming a corporation into a partnership), or (b) the economic rights of the shareholders are impaired. In these events, the shareholders that were not present at the meeting in which the decision was taken or voted against it, may exercise the redemption right. |
| | · | Pursuant to Colombian Law (Article 12 of Law 222 of 1995), the economic rights of shareholders are deemed to be impaired if: |
| | · | their ownership percentage is reduced as a consequence of the merger, transformation or escisión of the Company; |
| | · | the equity value or the par value of the shares is reduced (in the latter case, only to the extent that the reduction of the par value implies a decrease in the Company’s stock capital); and |
| | · | the negotiability of the shares is restricted or diminished. |
| | · | If the Company decides to withdraw the listing of its shares from a stock exchange or its registration before the National Registry of Shares and Issuers (Registro Nacional de Valores y Emisores). |
The exercise of this right is regulated by Articles 15 and 16 of Law 222 of 1995. According to Article 15, within five days following notice of the exercise of this right by a shareholder, the Company must offer to the other shareholders the shares owned by the exercising shareholder. Within the following 15 days, the other shareholders may acquire the shares on a pro rata basis. If all or a part of the shares are not acquired by the other shareholders, then the Company must reacquire them to the extent there are profits or reserves built up by the Company for those purposes. If neither the shareholders nor the Company acquires all of the shares owned by the exercising shareholder, then pursuant to Article 16 of Law 222 of 1995, such exercising shareholder is entitled to the reimbursement of the capital contributions made to the Company.
In both cases, the redemption price of the shares will be established by the agreement of seller and buyer. In the absence of such agreement, the redemption price will be determined by an expert appraiser. Notwithstanding the above, the by-laws may establish other methods for determining the redemption price to be paid in the foregoing circumstances. Our current by-laws do not contemplate such other methods.
Dividends
Common shares
Following the approval of the financial statements at a general shareholders’ meeting, shareholders may determine the allocation of distributable profits, if any, of the preceding semester by a resolution approved by the majority of the holders of common shares present at the ordinary general shareholders’ meeting, pursuant to the recommendation of the board of directors and management.
Under the Colombian Code of Commerce, a company must, after payment of income taxes and appropriation of legal reserves, and after off-setting losses from prior terms, distribute at least 50.0% of net profits to all shareholders, payable in cash, or as determined by the shareholders, within a period of one year following the date on which the shareholders determine the dividends. If the total amount segregated in the legal, statutory and occasional reserves of a company exceeds its outstanding capital, this percentage is increased to 70.0%. The minimum common shares dividend requirement of 50.0% or 70.0%, as the case may be, may be waived by a favorable vote of the holders of 78.0% of a company’s common shares present at the meeting, in which case the shareholders may distribute any percentage of the net profits.
Under Colombian law and our by-laws, net profits obtained in each semester are to be allocated as follows:
| | · | first, an amount equivalent to 10.0% of net profits is segregated to build a legal reserve, until that reserve is equal to at least 50.0% of our paid-in capital; |
| | · | second, payment of the minimum dividend on the preferred shares; and |
| | · | third, allocation of the balance of the net profits is determined by the holders of a majority of the common shares entitled to vote on the recommendation of the board of directors and the president and may, subject to further reserves required by the by-laws, be distributed as dividends. |
Under Colombian law, the dividends payable to the holders of common shares, for each common share, cannot exceed the dividends payable to holders of the preferred shares, for each preferred share. All common shares that are fully paid-in and outstanding at the time a dividend or other distribution is declared are entitled to share equally in that dividend or other distribution. Common shares that are only partially paid-in participate in a dividend or distribution in the same proportion as the shares have been paid in at the time of the dividend or distribution.
The general shareholders’ meeting may allocate a portion of the profits to, among others, welfare, education or civic services.
Preferred shares
Holders of preferred shares are entitled to receive a minimum dividend after deducting losses affecting the capital, and deducting any amounts set aside for legal reserve, but before creating or accruing for any other reserve and before any declared dividends are paid to holders of common shares. Dividends to holders of common shares must be approved by the shareholders. If no dividends are declared, no holder of Grupo Aval’s preferred or common shares will be entitled to payment. The minimum dividend will be equal to Ps 1.00 in each calendar semester, so long as this value is higher than the dividend paid to the holders of common shares. If the minimum preferred dividend is not equal or higher than the per share dividend on the common shares, the minimum dividend will be equal to the dividend paid to the holders of common shares, if any.
Payment of the preferred dividend shall be made at the time and in the manner established in the general shareholders’ meeting and with the priority indicated by Colombian law.
Grupo Aval is under a “situation of control” (whereby the decision-making power is subject to the will of a person or group of persons). As a result, the Company may only pay stock dividends to the shareholders that so accept it. Those shareholders that do not accept to receive a stock dividend, are entitled to receive their dividend in cash.
For additional information regarding dividends, see “Item 10. Additional Information—F. Dividends and paying agents—Dividend policy.”
General aspects involving dividends
The dividend periods may be different from the periods covered by the general balance sheet. In the general shareholders’ meeting, shareholders will determine such dividend periods, the effective date, and the method and the place for payment of dividends.
Dividends declared on the common shares and the preferred shares will be payable to the record holders of those shares, as they are recorded on our share registry, on the appropriate dates as determined in the general shareholders’ meeting. However, in accordance with Decree 4766 of December 14, 2011, issued by the Ministry of Finance and Public Credit:
| | · | companies whose shares are registered with the National Registry of Shares and Issuers must establish a period of at least three trading days between the date that they receive approval to distribute profits from the General Shareholders Assembly and the date of payment; and |
| | · | the ex-dividend period (fecha ex-dividendo) is the period during which it is understood that a purchase of shares does not include the right to receive dividends. The ex-dividend date shall be set forth by stock exchanges, and it cannot be less than two trading days. According to Colombian Stock Exchange regulations, a transaction is “ex-dividend” if it takes place between the first day of dividend payment and the four trading days preceding that date. |
Liquidation rights
We will be dissolved if certain events take place, including the following:
| | · | our term of existence, as stated in our by-laws, set at May 25, 2044, expires without being extended by the shareholders prior to its expiration date; |
| | · | losses cause the decrease of our shareholders’ equity below 50% of the amount of outstanding share capital, unless one or more of the corrective measures described in the Colombian Code of Commerce are adopted by the shareholders within six-months; |
| | · | by decision at the general shareholders’ meeting; and |
| | · | in certain other events expressly provided by law and in the by-laws. |
Upon dissolution, a liquidator must be appointed by a general meeting of the shareholders to wind up the affairs of our company.
Upon liquidation, and out of the surplus assets available for distribution to shareholders, holders of fully paid preferred shares are entitled to a preference in the reimbursement of their contribution (“aporte” as provided by article 63 of Law 222 of 1995) to Grupo Aval. This reimbursement, if any, is payable in pesos before any distribution or payment may be made to holders of common shares. If, upon any liquidation, assets that are available for distribution among the holders of preferred shares are insufficient to pay in full their respective liquidation preferences, such assets will be distributed among those holders pro rata.
Subject to the preferential liquidation rights of holders of preferred shares, and provided there are still sufficient assets remaining, all fully paid common shares will be entitled to participate in any distribution upon liquidation. Partially paid common shares must participate in a distribution upon liquidation in the same proportion that those shares have been paid at the time of the distribution.
To the extent there are surplus assets available for distribution after full payment to the holders of preferred and common shares of their contribution to Grupo Aval, the surplus assets will be distributed among all holders of shares of share capital (common or preferred), pro rata, in accordance with their respective holdings of shares.
Preemptive rights and other anti-dilution provisions
Pursuant to the Colombian Code of Commerce, we are allowed to have an outstanding amount of share capital that is less than the authorized share capital set out in our by-laws. Under our by-laws, the holders of common shares determine the amount of authorized share capital, and our board of directors has the power to (1) order the issuance and regulate the terms of subscription of common shares up to the total amount of authorized share capital, and (2) regulate the issuance of preferred shares, when expressly delegated at the general shareholders’ meeting. The
issuance of preferred shares must be approved by the general shareholders’ meeting, which shall determine the nature and extent of any rights, according to our by-laws and Colombian law.
At the time of incorporation of a Colombian company, its outstanding share capital must represent at least 50% of the authorized capital. Any increases in the authorized share capital or decreases in the outstanding share capital must be approved by the majority of shareholders required to approve a general amendment to the by-laws.
Colombian law requires that, whenever we issue new common shares, we must offer to the holders of common shares the right to subscribe a number of common shares sufficient to maintain their existing ownership percentage of the aggregate share capital. These rights are preemptive rights. On the other hand, holders of preferred shares are entitled to preemptive rights only on the specific situations that the shareholders’ meeting so decides. See “Item 3. Key Information—D. Risk factors—Risks relating to our preferred shares.”
Common shareholders at a general shareholders’ meeting may waive preemptive rights with respect to a particular capital increase by the favorable vote of at least 70.0% of the shares represented at the meeting. Preemptive rights must be exercised within the period stated in the share placement terms of the increase, which cannot be less than 15 business days following the publication of the notice of the public offer of that capital increase. From the date of the notice of the share placement terms, preemptive rights may be transferred separately from the corresponding shares.
The Superintendency of Finance will authorize a decrease in the outstanding share capital approved by the holders of common shares only if:
| | · | we have no outstanding liabilities; |
| | · | our creditors consent in writing; or |
| | · | the outstanding share capital remaining after the reduction represents at least twice the amount of our liabilities. |
Restrictions on purchases and sales of share capital by related parties
Pursuant to the Colombian Code of Commerce, the members of our board of directors and certain of our principal executive officers may not, directly or indirectly, buy or sell shares of our share capital while they hold their positions, unless they obtain the prior approval of the board of directors passed with the vote of two-thirds of its members (excluding, in the case of transactions by a director, such director’s vote). Furthermore, pursuant to Article 262 of the Colombian Code of Commerce, Grupo Aval’s subsidiaries are prohibited from owning (directly or indirectly) shares of Grupo Aval.
In addition, as our shares are publicly traded on the Colombian Stock Exchange, the transfer of the shares is subject to the tender offer rules.
Pursuant to Article 23 of Law 222 of 1995, the members of our board of directors and our legal representatives generally must perform their duties according to the principles of good faith, due diligence and loyalty. In particular, the directors and legal representatives must refrain from entering into any transaction (including any sale and purchase of shares) which may imply competition with the Company or a conflict of interests, unless they obtain the prior approval of the General Shareholders Meeting, which, in any case, shall only be granted if the respective transaction does not harm the Company’s interests.
Transfer and registration of shares
Grupo Aval’s common and preferred shares are listed on the Colombian Stock Exchange. According to Colombian regulations, shares listed on a stock exchange must be sold and transferred only through such exchange, unless such shares were issued outside Colombia and are transferred outside Colombia, or unless the share purchase transaction amounts to a value that is lower than the regulatory threshold of 66,000 UVRs, as required by Article 6.15.1.1.2 of Decree 2555 of 2010. In addition, the following transactions are not required to be effected through the relevant stock exchange:
| | · | transfers between shareholders with the same beneficial owner; |
| | · | transfers of shares owned by financial institutions that are being liquidated under the control and supervision of the Superintendency of Finance; |
| | · | transfers by the State; and |
| | · | any other transactions as may be authorized by the Superintendency of Finance. |
Under Colombian law, shares may be traded either in physical form or electronic form. Transfers of shares are subject to a registry system which differs depending on whether the shares are evidenced in electronic form or physical form. Transfers of shares evidenced by electronic certificates must first be registered with a securities central depositary through a stockbroker. The main purpose of the securities central depositary is to receive, safekeep and manage securities certificates issued by corporations in order to keep a record of the transactions undertaken over such securities, including transfers, pledges and withdrawals. Accordingly, they are not allowed to hold, invest or otherwise use the securities held under their custody.
Transfer of shares evidenced by electronic or physical certificates, as the case may be, must be registered on the company’s share ledger. Only those holders registered on the share ledger are recognized as shareholders. Registration requires endorsement of the certificates or a written instruction from the holder. In the case of electronic certificates, the securities central depositary notifies us regarding the transfer of shares after registering it in its system.
All of our shares are currently deposited with the securities central depositary (Deceval).
On July 15, 2010, we entered into a stock purchase agreement with GE Consumer Finance Central Holdings Corp. and General Electric Capital Corporation (collectively, “GE Capital”), to acquire all of the outstanding shares of BAC Credomatic GECF Inc., a company incorporated under the laws of the British Virgin Islands, for U.S.$1.92 billion, subject to certain adjustments. BAC Credomatic is a Central American banking group. We completed the acquisition on December 9, 2010. See “Item 4. Information on the Company—B. Business overview—BAC Credomatic.” As part of the financing of this acquisition, our indirect subsidiary LB Panama entered into two U.S.$135 million (Ps 243.0 billion), totaling U.S.$270 million (Ps 486.0 billion), five-year term loans, respectively, with Bancolombia S.A. and Bancolombia Miami Agency at 180-day LIBOR plus 3.125% on November 26, 2010.
On November 24, 2010 Grupo Aval and Adminegocios & Cia. S.C.A., an entity controlled by Mr. Sarmiento Angulo, our controlling shareholder, entered into an agreement whereby Grupo Aval assigned to Adminegocios & Cia. S.C.A. its right to acquire up to 2,605,000 mandatorily convertible bonds issued by Banco de Bogotá (convertible into 5,542,553 shares of Banco de Bogotá shares). Under the put/call agreement, we have an option to purchase from Adminegocios & Cia. S.C.A., and they have the right to sell, 2,605,000 convertible bonds (or the underlying shares, if converted). In either case, the purchase price we will have to pay Adminegocios & Cia. S.C.A. is the subscription price paid by Adminegocios & Cia. S.C.A. at the time of acquiring the mandatorily convertible bonds issued by Banco de Bogotá, plus a premium of 6.5% per annum up to the date of acquisition. The options expire two years from December 2, 2010, the date of first subscription of the mandatorily convertible bonds. The mandatorily convertible bonds were acquired by Adminegocios & Cia. S.C.A. in order to finance the BAC Credomatic acquisition.
On January 31, 2011 we entered into an escisión agreement with Rendifin S.A. to acquire 43.47% of Banco Popular’s outstanding shares held by Rendifin S.A. in exchange for 2,073,115,004 of our preferred shares. See “Item 7. Major Shareholders and Related Party Transactions—B. Related party transactions—Other transactions with Mr. Sarmiento Angulo and his affiliates—Banco Popular share ownership reorganization.”
On April 29, 2011, we entered into a second escisión agreement with Popular Securities S.A. and Inversiones Escorial S.A. to acquire an additional 19.57% of Banco Popular in exchange for 934,669,126 preferred shares. See
“Item 7. Major Shareholders and Related Party Transactions—B. Related party transactions—Other transactions with Mr. Sarmiento Angulo and his affiliates—Banco Popular share ownership reorganization.”
On February 1, 2012, we entered into an indenture in connection with the Grupo Aval Debt Offering and issued U.S.$600 million of 5.25% Senior Notes due 2017. The indenture was among us, as guarantor, Grupo Aval Limited, as Issuer, Deutsche Bank Trust Company Americas, as Trustee, Registrar, Paying Agent and Transfer Agent and Deutsche Bank Luxembourg S.A., as Luxembourg Paying Agent and Transfer Agent.
Restrictions on foreign investment in Colombia
Colombia’s foreign investment statute regulates the manner in which non-residents are permitted to invest in Colombia and participate in the Colombian securities market. Among other requirements, Colombian law requires foreign investors to register certain foreign exchange transactions with the Colombian Central Bank and obtain authorization for certain types of investments. Certain foreign exchange transactions, including those between residents and non-residents, must be made through authorized foreign exchange market participants.
Non-residents are permitted to hold portfolio investments in Colombia, through either a registered stock brokerage firm, a trust company or an investment firm. Investors would only be allowed to transfer dividends abroad after the foreign investment registration procedure with the Colombian Central Bank has been completed. The failure of a non-resident investor to report or register foreign exchange transactions with the Colombian Central Bank relating to investments in Colombia on a timely basis may prevent the investor from remitting dividends, or an investigation that may result in a fine, may be commenced.
The following summary contains a description of certain Colombian and U.S. federal income tax consequences of the acquisition, ownership and disposition of preferred shares. The summary is based upon the tax laws of Colombia and regulations thereunder and on the tax laws of the United States and regulations thereunder as of the date hereof, which are subject to change.
Colombian tax considerations
For purposes of Colombian taxation, residence consists of the continuous presence in the country for more than six-months either within a fiscal year or consecutive fiscal years, or the presence, whether or not continuous, in the country for more than six months within a fiscal year. Colombians who maintain their immediate family or their principal place of business in Colombia are considered residents for tax purposes, even if they are not present in the country during the fiscal year. For purposes of Colombian taxation, a legal entity is a resident of Colombia if it is organized under the laws of Colombia.
Pursuant to the Colombian Fiscal Statute, resident individuals and Colombian entities are subject to Colombian taxes on income earned in Colombia and worldwide, while non-resident individuals and foreign entities are only taxed on their Colombian-source income.
Taxation of dividends
In Colombia, dividends received by foreign companies or other foreign entities, non-resident individuals and successors of non-residents are not subject to income taxes, insofar as the profits from which they are paid have been taxed at the corporate level (Articles 48, 49 and 245 of the Fiscal Statute). However, if those profits were not taxed at the corporate level, the amount paid as a dividend will be subject to a withholding tax at a rate of 33% (or whatever is the income tax rate at the moment of the accrual or payment of dividends), according to Article 245 of the Fiscal Statute.
Foreign companies, foreign investment funds, and individuals that are not Colombian residents are not required by law to file an income tax return in Colombia either when the dividends received by them have been subject to withholding taxes or when dividends are paid out of profits subject to income tax at the corporate level.
Taxation of sales of shares
Pursuant to Article 36-1 of the Fiscal Statute, gains derived by a non-resident of Colombia from the sale of stock are not subject to income, withholding, remittance or other taxes in Colombia when the stock is listed in the Colombian Stock Exchange and the transaction does not involve the sale of 10% or more of the company’s outstanding stock by the same beneficial owner in the same taxable year.
The sale of stock by foreign institutional capital investment funds is not subject to income tax at the fund level nor at the unitholder level pursuant to Article 18-1 of the Fiscal Statute.
Other Colombian taxes
At the date of this annual report, there is no income tax treaty and no inheritance or gift tax treaty in effect between Colombia and the United States. There are no Colombian stamp, issue, registration, transfer or similar taxes or duties payable by holders of preferred shares.
According to Law 1430 of 2010, enacted on December 29, 2010, gains derived from the sale of derivatives that are considered securities under Colombian law are not subject to income, withholding, remittance or other taxes in Colombia when the underlying asset consists exclusively of shares that are listed on the Colombian Stock Exchange.
United States federal income taxation considerations for U.S. holders
In general
The following is a description of the material U.S. federal income tax consequences to the U.S. Holders described below of owning and disposing of our preferred shares, but it does not purport to be a comprehensive description of all tax considerations that may be relevant to a particular person’s decision to acquire the shares. This discussion applies only to a U.S. Holder that holds our preferred shares as capital assets for tax purposes. In addition, it does not describe all of the tax consequences that may be relevant in light of the U.S. Holder’s particular circumstances, including alternative minimum tax consequences and tax consequences applicable to U.S. Holders subject to special rules, such as:
| | · | certain financial institutions; |
| | · | dealers in securities or currencies or traders in securities who use a mark-to-market method of tax accounting; |
| | · | persons holding preferred shares as part of a hedging transaction, straddle, wash sale, conversion transaction or integrated transaction or persons entering into a constructive sale with respect to the preferred shares; |
| | · | persons whose functional currency for U.S. federal income tax purposes is not the U.S. dollar; |
| | · | entities classified as partnerships for U.S. federal income tax purposes; |
| | · | tax-exempt entities, including “individual retirement accounts” or “Roth IRAs”; |
| | · | persons that own or are deemed to own ten percent or more of our voting stock; and |
| | · | persons holding our preferred shares in connection with a trade or business conducted outside of the United States. |
If an entity that is classified as a partnership for U.S. federal income tax purposes holds our preferred shares, the U.S. federal income tax treatment of a partner will generally depend on the status of the partner and the activities of the partnership. Partnerships holding our preferred shares and partners in such partnerships should consult their tax advisers as to the particular U.S. federal income tax consequences of holding and disposing of the preferred shares.
This discussion is based on the Internal Revenue Code of 1986, as amended, or the Code, administrative pronouncements, judicial decisions, and final, temporary and proposed Treasury regulations, all as of the date hereof, any of which is subject to change, possibly with retroactive effect.
A “U.S. Holder” is a beneficial owner of our preferred shares who is:
| | · | a citizen or individual resident of the United States; |
| | · | a corporation, or other entity taxable as a corporation, created or organized in or under the laws of the United States, any state therein or the District of Columbia; or |
| | · | an estate or trust the income of which is subject to U.S. federal income taxation regardless of its source. |
U.S. Holders should consult their tax advisers concerning the U.S. federal, state, local and foreign tax consequences of owning and disposing of our preferred shares in their particular circumstances.
Taxation of dividends
The preferred shares constitute equity of our company for U.S. federal income tax purposes. Therefore, subject to the passive foreign investment company, or PFIC, rules described below, distributions paid on our preferred shares will be treated as dividends to the extent paid out of our current or accumulated earnings and profits (as determined under U.S. federal income tax principles). Because we do not maintain calculations of our earnings and profits under U.S. federal income tax principles, it is expected that distributions generally will be reported to U.S. Holders as dividends. Subject to applicable limitations, dividends paid by qualified foreign corporations to certain non-corporate U.S. Holders in taxable years beginning before January 1, 2013 are subject to U.S. federal income tax at lower rates than other types of ordinary income if certain conditions are met. However, because our preferred shares are not tradable on an established securities market in the United States and there is no income tax treaty between Colombia and the United States, we do not expect to be a qualified foreign corporation for this purpose. Accordingly, dividends paid on our preferred shares will be taxed at ordinary income rates.
The amount of a dividend will include any amounts withheld by our company in respect of Colombian taxes. The amount of the dividend will generally be treated as foreign-source dividend income to U.S. Holders and will not be eligible for the dividends-received deduction generally available to U.S. corporations under the Code. Dividends will be included in a U.S. Holder’s income on the date actually or constructively received by the U.S. Holder. The amount of any dividend income paid in pesos will be the U.S. dollar amount calculated by reference to the exchange rate in effect on the applicable date of receipt, regardless of whether the payment is in fact converted into U.S. dollars. If the dividend is converted into U.S. dollars on the applicable date of receipt, a U.S. Holder should not be required to recognize foreign currency gain or loss in respect of the dividend income. A U.S. Holder may have foreign currency gain or loss if the dividend is converted into U.S. dollars after the date of receipt.
Subject to applicable limitations (including a minimum holding period requirement), some of which vary depending upon the U.S. Holder’s circumstances, Colombian income taxes withheld from dividends on preferred shares will be creditable against the U.S. Holder’s U.S. federal income tax liability. In lieu of claiming a foreign tax credit, U.S. Holders may, at their election, deduct foreign taxes, including the Colombian tax, in computing their taxable income, subject to generally applicable limitations under U.S. law. An election to deduct foreign taxes instead of claiming foreign tax credits applies to all taxes paid or accrued in the taxable year to foreign countries and possessions of the United States. The rules governing foreign tax credits are complex, and U.S. Holders should consult their tax advisers regarding the creditability of foreign taxes in their particular circumstances.
Sale or other taxable disposition of preferred shares
Subject to the PFIC rules described below, for U.S. federal income tax purposes, gain or loss realized on the sale or other taxable disposition of our preferred shares will be capital gain or loss, and will be long-term capital gain or loss if the U.S. Holder held the preferred shares for more than one year. The amount of the gain or loss will equal the difference between the U.S. Holder’s tax basis in the preferred shares disposed of and the amount realized on the disposition, in each case as determined in U.S. dollars. This gain or loss will generally be U.S.-source gain or loss for foreign tax credit purposes.
Passive foreign investment company rules
Based on proposed Treasury regulations, which are proposed to be effective for taxable years beginning after December 31, 1994, and on management estimates, we believe we were not a PFIC for U.S. federal income tax purposes for the 2011 taxable year. However, because the proposed Treasury regulations may not be finalized in their current form, because the application of the proposed regulations is not entirely clear and because the composition of our income and assets will vary over time, there can be no assurance that we were not or will not be a PFIC for any taxable year. The determination of whether we are a PFIC, however, is made annually and is based upon the composition of our income and assets (including, among others, entities in which we hold at least a 25% interest), and the nature of our activities. In general, we will be a PFIC for any taxable year in which at least 75% of our gross income is passive income, or at least 50% of the value (determined on a quarterly basis) of our assets is attributable to assets that produce or are held for the production of passive income.
If we are a PFIC for any taxable year during which a U.S. Holder held our preferred shares, any gain recognized by a U.S. Holder on a sale or other taxable disposition of preferred shares would be allocated ratably over the U.S. Holder’s holding period for the preferred shares. The amounts allocated to the taxable year of the sale or other disposition and to any year before we became a PFIC would be taxed as ordinary income. The amount allocated to all other taxable years would be subject to tax at the highest rate in effect for individuals or corporations, as appropriate, for that taxable year, and an interest charge would be imposed on the amount allocated to those taxable years. Further, any distribution in respect of preferred shares in excess of 125% of the average of the annual distributions on preferred shares received by the U.S. Holder during the preceding three years or the U.S. Holder’s holding period, whichever is shorter, would be subject to taxation as described immediately above with respect to gains. Certain elections may be available that would result in alternative treatments (such as mark-to-market treatment) of the preferred shares. U.S. Holders should consult their tax advisers to determine whether any of these elections would be available and, if so, what the consequences of the alternative treatments would be in their particular circumstances.
If we were a PFIC for any taxable year during which a U.S. Holder held the preferred shares, such U.S. Holder may be required to file a report containing such information as the U.S. Treasury may require.
Information reporting and backup withholding
Payments of dividends and sales proceeds that are made within the United States or through certain U.S.-related financial intermediaries generally are subject to information reporting, and may be subject to backup withholding, unless (1) the U.S. Holder is an exempt recipient or (2) in the case of backup withholding, the U.S. Holder provides a correct taxpayer identification number and certifies that it is not subject to backup withholding. The amount of any backup withholding from a payment to a U.S. Holder will be allowed as a credit against the holder’s U.S. federal income tax liability and may entitle it to a refund, provided that the required information is timely furnished to the Internal Revenue Service.
Certain U.S. Holders who are individuals may be required to report information relating to their ownership of an interest in certain foreign financial assets, including stock of a non-U.S. person, subject to certain exceptions (including an exception for stock held in custodial accounts maintained by a U.S. financial institution). Certain U.S. Holders who are entities may be subject to similar rules in the future. U.S. Holders should consult their tax advisers regarding their reporting obligations with respect to the preferred shares.
Dividend policy
The amount of dividends, if any, that we pay will be dependent, in large part, on the amount of dividends received from our subsidiaries. From 2007 to 2011, the amount of dividends that we have paid increased at a compound annual growth rate of 20.8%. Dividends are declared semi-annually in March and September of each year, and we do not declare dividends quarterly. Our subsidiaries declared Ps 711.4 billion in 2011 and Ps 533.5 billion in 2010 of dividends payable to us, and we declared an aggregate of Ps 790.3 billion in 2011 and 527.1 billion in 2010 of dividends to our shareholders.
The following table presents the net profits of, and dividends declared by, each of our banks and Porvenir, and the amount of dividends received by us from each of them during the periods indicated.
| | | For the year ended December 31, | |
| | | | | | | | | | | | | | | | | | | | | | | | | | | | | | | | | | | | | |
| | | | | | | | | | | | | | | | | | | |
| | | (in Ps billions, except percentages) | |
| Direct ownership interest held by Grupo Aval | | | 64.4 | % | | | 65.3 | % | | | 68.2 | % | | | 68.0 | % | | | 93.7 | % | | | 30.7 | % | | | 79.9 | % | | | 79.9 | % | | | 20.0 | % | | | 20.0 | % | | | – | | | | – | |
| Unconsolidated net profits | | | 1,100 | | | | 782 | | | | 441 | | | | 389 | | | | 367 | | | | 352 | | | | 165 | | | | 144 | | | | 153 | | | | 155 | | | | 2,227 | | | | 1,822 | |
| Dividends declared | | | 495 | | | | 420 | | | | 205 | | | | 185 | | | | 177 | | | | 169 | | | | 71 | | | | 64 | | | | 152 | | | | 155 | | | | 1,099 | | | | 993 | |
| Dividends contributed to Grupo Aval | | | 319 | | | | 275 | | | | 140 | | | | 126 | | | | 166 | | | | 52 | | | | 57 | | | | 51 | | | | 30 | | | | 31 | | | | 711 | | | | 534 | |
| Dividends declared by Grupo Aval | | | | | | | | | | | | | | | | | | | | | | | | | | | | | | | | | | | | | | | | | | | 790 | | | | 527 | |
The allocation of our distributable profits, if any, is determined by our common shareholders following approval of our semiannual financial statements. Our general shareholders’ meetings generally occur in March and September, three months after the close of the semiannual period. As such, dividends declared in one year may relate to the results of the previous year.
In the past we have paid dividends on a monthly basis. We have not, however, adopted a specific dividend policy with respect to future dividends. The amount of any distributions will depend on many factors, such as the results of operations and financial condition of our company and our subsidiaries, their cash requirements, their prospects and other factors deemed relevant by our board of directors and shareholders.
Our company pays dividends based on the results shown in our semi-annual unconsolidated audited financial statements prepared under Colombian GAAP for companies other than financial institutions. See “Presentation of Financial and Other Information—Financial statements.”
The principal differences between Colombian Banking GAAP and Colombian GAAP for companies other than financial institutions are the following:
| | · | Valuation of Investments in securities: Under Colombian GAAP, all investments in debt securities are accounted for at book value, as opposed to Colombian Banking GAAP, according to which, depending on how the securities are classified, investments may be accounted for at market value. Therefore, in our financial statements prepared under Colombian GAAP, investments in debt securities that at the bank’s level had been accounted for at market value, are re-expressed at book value. |
| | · | Deferred assets: Under Colombian GAAP deferred assets are amortized in full on a yearly basis. Under Colombian Banking GAAP deferred assets can be amortized in periods longer than one year. Therefore, in our financial statements prepared under Colombian GAAP, the bank’s deferred assets are fully amortized each year. |
In addition there are other differences related to the general provision for loans and inflation adjustments that do not have a material effect on our financial statements.
Net income as reported in our consolidated Colombian GAAP financial statements differed from net income as reported in our consolidated Colombian Banking GAAP financial statements by Ps 5.0 billion (0.4%) and Ps 114.8 billion (13.6%) for the years ended December 31, 2011 and 2010, respectively.
We expect that differences between Colombian GAAP and Colombian Banking GAAP will continue to occur in future periods.
The amount of dividends expected from our subsidiaries will also depend on the future share ownership in our subsidiaries.
Dividend history of Grupo Aval
The following table presents the annual cash dividends paid by Grupo Aval on each share during the periods indicated.
Dividends declared with respect to net income: | | | | | | |
| | | (Ps) | | | (U.S.$) | |
| Year ended: | | | | | | |
2006 | | | 22.80 | | | | 0.010 | |
2007 | | | 26.58 | | | | 0.013 | |
2008 | | | 30.00 | | | | 0.013 | |
2009 | | | 33.24 | | | | 0.016 | |
2010 | | | 37.80 | | | | 0.020 | |
2011 | | | 42.60 | | | | 0.022 | |
Dividend history of our banking subsidiaries
The following tables set forth the annual cash dividends paid by each of our banks on each share during the periods indicated.
Banco de Bogotá
Dividends declared with respect to net income: | | | | | | |
| | | (Ps) | | | (U.S.$) | |
| Year ended: | | | | | | |
2006 | | | 1,284.00 | | | | 0.574 | |
2007 | | | 1,392.00 | | | | 0.691 | |
2008 | | | 1,500.00 | | | | 0.669 | |
2009 | | | 1,566.00 | | | | 0.766 | |
2010 | | | 1,608.00 | | | | 0.840 | |
2011 | | | 1,728.00 | | | | 0.889 | |
Banco de Occidente
Dividends declared with respect to net income: | | | | | | |
| | | (Ps) | | | (U.S.$) | |
| Year ended: | | | | | | |
2006 | | | 990.00 | | | | 0.442 | |
2007 | | | 1,107.00 | | | | 0.549 | |
2008 | | | 1,134.00 | | | | 0.505 | |
2009 | | | 1,158.00 | | | | 0.566 | |
2010 | | | 1,233.00 | | | | 0.644 | |
2011 | | | 1,314.00 | | | | 0.676 | |
Banco Popular
Dividends declared with respect to net income: | | | | | | |
| | | (Ps) | | | (U.S.$) | |
| Year ended: | | | | | | |
2006 | | | 14.64 | | | | 0.007 | |
2007 | | | 15.09 | | | | 0.007 | |
2008 | | | 11.52 | | | | 0.005 | |
2009 | | | 16.98 | | | | 0.008 | |
2010 | | | 21.84 | | | | 0.011 | |
2011 | | | 22.92 | | | | 0.012 | |
Banco AV Villas
Dividends declared with respect to net income: | | | | | | |
| | | (Ps) | | | (U.S.$) | |
| Year ended: | | | | | | |
2006 | | | 32.25 | | | | 0.014 | |
2007 | | | 308.06 | | | | 0.153 | |
2008 | | | 233.08 | | | | 0.104 | |
2009 | | | 249.06 | | | | 0.122 | |
2010 | | | 285.81 | | | | 0.149 | |
2011 | | | 315.00 | | | | 0.162 | |
Dividend history of Porvenir and Corficolombiana
The following tables presents the annual cash dividends paid by Porvenir and Corficolombiana during the periods indicated.
Porvenir
Dividends declared with respect to net income: | | | | | | |
| | | (Ps) | | | (U.S.$) | |
| Year ended: | | | | | | |
2006 | | | 948.00 | | | | 0.423 | |
2007 | | | 744.00 | | | | 0.369 | |
2008 | | | 771.00 | | | | 0.344 | |
2009 | | | 1,301.98 | | | | 0.637 | |
2010 | | | 918.00 | | | 0.480 | |
2011 | | | 972.00 | | | | 0.500 | |
Corficolombiana
Dividends declared with respect to net income: | | | | | | |
| | | (Ps) | | | (U.S.$) | |
| Year ended: | | | | | | |
2006 | | | 1,153.62 | | | | 0.515 | |
2007 | | | 1,103.40 | | | | 0.548 | |
2008 | | | 1,038.00 | | | | 0.463 | |
2009 | | | 1,332.00 | | | | 0.652 | |
2010 | | | 882.00 | | | | 0.461 | |
2011 | | | 1,464.00 | | | | 0.754 | |
Dividend history of BAC Credomatic
As of December 31, 2011, BAC Credomatic had declared U.S.$189.6 of cash dividends per share.
General aspects involving dividends
The dividend periods may be different from the periods covered by the general balance sheet. At the general shareholders’ meeting, shareholders will determine such dividend periods, the effective date, the system and the place for payment of dividends.
Dividends declared on the shares of common and preferred shares will be payable to the record holders of those shares, as they are recorded on our stock registry, on the appropriate record dates as determined at the general shareholders’ meeting. However, pursuant to External Circular 13 of 1998 issued by the former Superintendency of Securities (currently, the Superintendency of Finance), if a shareholder sells shares during the ten business days immediately preceding the payment date, dividends corresponding to those shares will be paid by us to the seller.
The vote of at least 80.0% of the shares present and entitled to vote is required to approve the payment of dividends in shares; however, according to Law 222 of 1995, if a “situation of control” exists, whereby the decision-making power is subject to the will of another person or group of persons, a company may only pay dividends by issuing shares, to the shareholders that so accept.
Not applicable.
We are subject to the information requirements of the Exchange Act, except that as a foreign issuer, we will not be subject to the proxy rules or the short-swing profit disclosure rules of the Exchange Act. In accordance with these statutory requirements, we will file or furnish reports and other information with the SEC. You may inspect and copy reports and other information filed with the SEC at the Public Reference Room at 100 F Street NE, Washington, D.C. 20549. Information on the operation of the Public Reference Room may be obtained by calling the SEC at 1-800-SEC-0330. In addition, the SEC maintains an internet website that contains reports and other information about issuers, like us, that file electronically with the SEC. The address of that website is www.sec.gov.
Not applicable.
Risk management
The guiding principles of risk management at Grupo Aval and our banks have been the following:
| | · | collective decision making for commercial lending at the board level of each of our banks; |
| | · | extensive and in-depth market knowledge, the result of our market leadership and our experienced, stable and seasoned senior management; |
| | · | clear top-down directives with respect to: |
| | · | compliance with know-your-customer policies; and |
| | · | commercial loan credit structures based on the clear identification of sources of repayment and on the cash-flow generating capacity of the borrower; |
| | · | use of common credit analysis tools and loan pricing tools across all our banks; |
| | · | diversification of the commercial loan portfolio with respect to industries and economic groups; |
| | · | specialization in consumer product niches; |
| | · | extensive use of continuously updated rating and scoring models to ensure the growth of high-credit quality consumer lending; |
| | · | use of our extensive market presence in the identification and implementation of best practices for operational risk management; and |
| | · | conservative policies in terms of: |
| | · | the trading portfolio composition, with a bias towards instruments with lower volatility; |
| | · | proprietary trading; and |
| | · | the variable remuneration of trading personnel. |
Unless otherwise indicated, risk management figures for Banco de Bogotá consolidate financial data of BAC Credomatic. BAC Credomatic has in place its own risk management controls for credit risk, market risk and operational risk.
With respect to credit risk, BAC has a centralized structure with a Regional Risk Director reporting to the CEO of BAC, who chairs the Regional Credit Committee and is responsible for setting out credit policies and procedures applicable at the local (individual country) level and defining growth strategies in accordance with country risk. While local credit-risk managers report to the country head, compliance with the credit policies is reported directly to the Regional Risk Director.
With respect to market risk, there are Regional Investment Policies and Regional Asset and Liability Management Policies which set out the guidelines for establishing country risk and issuer limits as well as limits on foreign currency positions and general guidelines for the administration of liquidity, interest rate and exchange-rate risks. The establishment and administration of the regional policies is the responsibility of the Regional Asset and Liability Committee, which is comprised of BAC Credomatic board members.
Daily compliance to these policies in all countries is carried out with the investment portfolio control management module, which documents the entire investment process. The monitoring of exposures is the responsibility of the Regional Financial Director through the local assets and liabilities committees.
Operating Risk Management at BAC Credomatic is carried out using the conceptual methodology of Basel II guidelines and the elements of COSO integral risk management. A centralized operating risk management unit ensures that there are in place policies to ensure a standardized treatment of operating risks including methodologies for the timely recognition of the principal exposures, the ownership of operational risks by functional units, accountability throughout the organization and effective procedures to collect information on operational losses. The centralized operating risk committee is also responsible for putting in place an effective business continuity plan.
Credit risk
The credit-risk management process at all our banks takes into consideration the requirements of the Superintendency of Finance, the guidelines of Grupo Aval credit-risk management and the composition of each of the banks’ loan portfolio, which, in turn, is the result of the execution of each bank’s strategy.
Commercial lending
58.0% of our total loan portfolio is composed of commercial loans to corporate and small- and medium-sized enterprises. However, the level of commercial loans varies in each of our banks. At December 31, 2011, the proportion of commercial loans was 63.5%, 58.6%, 43.2% and 41.9% at Banco de Bogotá, Banco de Occidente, Banco Popular and Banco AV Villas, respectively.
The credit approval process for commercial loans at each of our banks follows the policies and lending authorities established by each bank. The highest lending authority at all banks, other than the board of directors, is the national credit committee (Comité Nacional de Crédito at Banco de Bogotá, Banco Popular and Banco AV Villas or Comité de Crédito Dirección General at Banco de Occidente), which has lending limits that range between Ps 2.0 billion (approximately U.S.$1.1 million) at Banco AV Villas and Ps 4.0 billion (approximately U.S.$2.2 million) at Banco de Bogotá and Banco de Occidente.
Following the approval of a transaction by the credit committee of any of our banks, information regarding the loan is sent to the Grupo Aval risk management committee if the loan would result in aggregate exposure to the borrower in excess of Ps 5.0 billion. For commercial loans, the credit approval process includes the presentation to the Grupo Aval risk management committee of all potential credit exposures per client that, across all of our banks, represent an exposure in excess of Ps 20.0 billion (approximately U.S.$10 million). This committee, which is composed of the vice presidents of credit of each of our banks and the risk management staff of Grupo Aval, meets on a weekly basis to discuss general developments in the industry and economy, risks and opportunities, and the structure of credit transactions, as well as to consult on and evaluate potential business opportunities. The committee consolidates requests for loans across all banks and evaluates our total exposure to potential borrowers. In each case, the committee evaluates the relevant bank’s application of its credit analysis policy and it may make recommendations with respect to the structure of the loan (such as guarantees, interest rates, commissions and covenants). The risk management committee will then submit the transaction to the Grupo Aval advisory board.
The Grupo Aval advisory board, which is composed of the presidents of our banks and the vice presidents of Grupo Aval, meets on a bimonthly basis to discuss the adoption of policies for risk management and how to accommodate clients with large credit needs, as well as to advise the banks with respect to defaults or other credit risk issues. The advisory board also evaluates transactions submitted to it by the Grupo Aval risk management committee for compliance with applicable policies and makes recommendations to the banks with respect to such loans. The boards of the banks make the ultimate decisions with respect to such loans.
In order to facilitate the analysis of commercial loans which meet the threshold and are thus reviewed by Grupo Aval, we have developed certain tools, including a standardized “proyecto de crédito,” a stand-alone document containing all of the information considered necessary for us to make a credit decision. We have also developed financial projection models and pricing models that assist us in analyzing potential loans and comparing the estimated return on a loan with that of a comparable risk-free instrument.
We seek to achieve a profitable, high-quality commercial loan portfolio and an efficient procedure for analyzing potential loans across our banks. To that end, we have established policies and procedures for the analysis and approval of potential commercial credit transactions that seek to focus lending on the following principles:
| | · | borrowers whose shareholders and management are, in our opinion, of the highest integrity (taking into account not only an analysis of the borrower’s credit profile but also their reputation in the business community and other factors); |
| | · | borrowers which participate in key industries; |
| | · | borrowers which are leaders or major players in the industries in which they participate; |
| | · | transaction structures, including covenants and guarantees, which provide adequate protection; and |
| | · | pricing which compensates adequately for capital invested and the market and credit risks incurred. |
In addition, we make loans to public sector entities. For purposes of evaluating the extension of credit to public sector entities, our banks follow three criteria: (1) the loan must be used to finance an investment that has been approved by local authorities; (2) a source of repayment must be clearly identified, such as tax revenues; and (3) the source of repayment so identified must be pledged to secure the loan.
Consumer lending
Consumer lending represented 28.2% of the total loan portfolio at December 31, 2011; however, the participation and specialization by product varies in each of our banks. At December 31, 2011, Banco Popular consumer lending represented 53.1% of the total loan portfolio and was concentrated on payroll deduction loans (libranzas), a product in which it is the leader in Colombia. At Banco AV Villas and Banco de Bogotá, consumer lending represented 44.2% and 23.2% of their total loan portfolio, respectively. At Banco de Occidente, 19.1% of the total loan portfolio consisted of consumer loans, with motor vehicle financing representing 7.2% of the total loan portfolio.
The credit approval process for consumer loans at each of our banks follows the policies and lending authorities established by each bank. The highest lending authority at all banks, other than the board of directors, is the national credit committee (Comité Nacional de Crédito at Banco de Bogotá, Banco Popular and Banco AV Villas or Comité de Crédito Dirección General at Banco de Occidente), which have lending limits that range between Ps 2.0 billion (approximately U.S.$1.1 million) at Banco AV Villas, and Ps 4.0 billion (approximately U.S.$2.2 million) at Banco de Bogotá and Banco de Occidente.
For consumer banking, each bank has developed a business model designed to take into consideration the product offering. Banco Popular, for which payroll deduction loans represent 51.7%, has developed a business model which concentrates its analysis on the credit and operational risks of the payee (the employer) supported with statistical origination and behavior models. Banco AV Villas is the bank with the most diversified consumer loan portfolio. After being exclusively a mortgage lending institution until 2000, it has developed different niches in consumer lending. The fast growth of consumer lending with above average credit quality has been the result of the development of in-house statistical origination and behavior models and the development of a multiple view vintage analysis tool, which has allowed the sale of consumer loan products to the lower income population, which is a more profitable customer segment in which relatively few banks compete. Banco de Bogotá has successfully integrated Megabanco’s operations into its full-service consumer loan portfolio of credit cards, personal loans, automobile loans and overdrafts. Banco de Occidente has become a leader in motor vehicle financing by maintaining an independent motor vehicle financing unit which has developed its own statistical models and its own origination and collection strategies.
Mortgage lending
Mortgage lending represented 6.0% of the total loan portfolio at December 31, 2011, with Banco AV Villas being the only one of our banks with a significant participation. At Banco AV Villas mortgage lending represents 13.5% of its loan portfolio, a percentage that has decreased consistently since 2005 when it was 44.5%. Although the year-end balance of mortgage loans at Banco AV Villas has decreased consistently over the last five years, there have been new disbursals for approximately Ps 920.6 billion during this same period. In order to ensure an adequate mortgage loan portfolio quality, Banco AV Villas has developed statistical models for the origination and follow-up on new mortgage loans, which has resulted in a very low past due to total loan ratios for recently originated loans.
Financial leases
Financial leases represented 7.4% of the total loan portfolio at December 31, 2011 and corresponded to the financial leasing transactions processed through Banco de Bogotá’s, Banco de Occidente’s and Banco Popular’s respective leasing divisions and Leasing Corficolombiana, a subsidiary of Corficolombiana which consolidates with Banco de Bogotá. All leasing subsidiaries have independent credit approval processes and their own credit policies, which in turn are closely supervised by their parent companies.
Microcredit lending
Microcredit loans represented 0.4% of the total loan portfolio at December 31, 2011.
Credit classification and provisioning
Our banks continually engage in the determination of risk factors associated with their credit-related assets, through their duration, including restructurings. For such purposes, they have designed and adopted the SARC in accordance with Superintendency of Finance guidelines. The SARC has integrated credit policies and procedures for the administration of credit risks, models of reference for the determination and calculation of anticipated losses, provisions for coverage of credit risks and internal control procedures.
Our banks are required to classify the loan portfolio in accordance with the rules of the Superintendency of Finance, which established the following loan classification categories: “AA,” “A,” “BB,” “B,” “CC” and “Default,” depending on the strength of the credit and, after the loan is disbursed, its past due status.
Each bank reviews outstanding loan portfolio components under the above-mentioned criteria and classifies individual loans under the risk-rating categories below on the basis of minimum objective criteria, such as balance sheet strength, profitability and cash generation capacity. The classification of new commercial loans is made on the basis of these objective criteria. The criteria are also evaluated on an ongoing basis, together with loan performance, in reviewing the classification of existing commercial loans.
| | | | Commercial loan portfolio | | |
“AA” | | New loans with risk rating at approval of “AA” | | Outstanding loans and financial leases with past due payments not exceeding 29 days (i.e., between 0 and 29 days past due). The debtor’s financial statements or its projected cash flows, as well as all other credit information available to the financial subsidiaries, reflect excellent paying capacity. | | Loans whose risk rating is “AA” according to the methodology of the Consumer Reference Model, or “MRCO,” as established by the Superintendency of Finance |
| | | | | | | |
“A” | | New loans with risk rating at approval of “A” | | Outstanding loans and financial leases with delayed payments in excess of 30 days but not exceeding 59 days (i.e., between 30 and 59 days past due). The debtor’s financial statements or its projected cash flows, as well as all other credit information available to the financial subsidiaries, reflect appropriate paying capacity. | | Loans whose risk rating is “A” according to the methodology of the MRCO as established by the Superintendency of Finance |
| | | | Commercial loan portfolio | | |
“BB” | | New loans with risk rating at approval of “BB” | | Outstanding loans and financial leases past due more than 60 days but less than 90 days (i.e., between 60 and 89 days past due). Loans in this category are acceptably serviced and collateralized, but there are weaknesses which may potentially affect, on a transitory or permanent basis, the debtor’s ability to pay or its projected cash flows, to the extent that, if not timely corrected, would affect the normal collection of credit or contracts. | | Loans whose risk rating is “BB” according to the methodology of the MRCO as established by the Superintendency of Finance |
| | | | | | | |
“B” | | New loans with risk rating at approval of “B” | | Outstanding loans and financial leases past due over 90 days but less than 120 days (i.e., between 90 and 119 days past due). The debtor shows insufficient paying capacity of its obligations. | | Loans whose risk rating is “B” according to the methodology of the MRCO as established by the Superintendency of Finance |
| | | | | | | |
“CC” | | New loans with risk rating at approval of “CC” | | Outstanding loans and financial leases past due more than 120 days but less than 150 days (i.e., between 120 and 149 days past due). Loans in this category represent grave insufficiencies in the debtors’ paying capacity or in the project’s cash flow, which may compromise the normal collection of the obligations. | | Loans whose risk rating is “CC” according to the methodology of the MRCO as established by the Superintendency of Finance |
| | | | | | | |
“Default” | | — | | Outstanding loans and financial leases past due for 150 days or more. This category is deemed uncollectible. These loans are considered in default. | | Consumer loan portfolio past due over 90 days |
For new consumer loans, the banks use their internal statistical origination models to develop an initial classification category (“AA,” “A,” “BB,” “B” and “CC”). Once the loan is disbursed, the banks use formulas provided by the Superintendency of Finance, which incorporate payment performance of the borrower to calculate a score which in turn is used to determine the loan classification.
For financial leases the risk categories are established in the same manner as commercial or consumer loans.
For financial statement reporting purposes, the Superintendency requires that loans and leases be given a risk category on the scale of “A,” “B,” “C,” “D” and “E.” As a result, the risk classifications are aligned to the risk categories as follows.
| |
| |
“A | “AA” | “AA” |
| “A” – between 0 and 30 days past due |
“B” | “A” | “A” – more than 30 days past due |
| “BB” | “BB” |
“C” | “B” | “B” |
| “CC” | “CC” |
“D” | “Default” | “Default” – all other past due loans not classified in “E” |
“E” | “Default” | “Default” – past due loans with a Loss given default (LGD) of 100% (1) |
| (1) | LGD is defined as a percentage to reflect the credit loss incurred if an obligor defaults. LGD for debtors depends on the type of collateral and would suffer a gradual increase in the percentage of loss according to the amount of days elapsing after being classified in each category. For this purpose, 100% of the collateral value is considered to cover the principal amount. |
For our mortgage and microcredit loan portfolios the risk categories in effect at December 31, 2011, based on past due status, are as follows.
| | | | |
| “A” Normal Risk | | In compliance or up to date and up to 30 days past due | | In compliance or up to 60 days past due |
| “B” Acceptable Risk | | Past due between 31 and 60 days | | Past due between 61 and 150 days |
| “C” Appreciable Risk | | Past due between 61 and 90 days | | Past due between 151 and 360 days |
| “D” Significant Risk | | Past due between 91 and 120 days | | Past due between 361 and 540 days |
| “E” Uncollectable | | Past due over 120 days | | Past due over 540 days |
Loan loss provisions
Our banks follow the norms of the Superintendency of Finance for the establishment of loan loss provisions. There are separate rules for commercial loans and leases, consumer loans and mortgage loans.
For commercial loans and financial leases, the process is as follows:
| | · | determination of the loan classification (“AA,” “A,” “BB,” “B,” “CC” or “Default”) based on the repayment capacity and payment record, among other considerations, of the borrower; |
| | · | determination of the probability of default from tables provided by the Superintendency of Finance which take into account the loan classification (“AA” through “Default”) and the size of the borrower in terms of assets (large, medium or small business); |
| | · | determining the loss given default based on the type of credit support (guarantees) and the past due status of the loan, using guides (tables) provided by the Superintendency of Finance; and |
| | · | based on the expected loss given default and the exposure at default, the amount of the loan provision for the individual loan is determined and booked. |
For consumer loans, the process is as follows:
| | · | determination of the loan classification (“AA,” “A,” “BB,” “B,” “CC” or “Default”) based on the score generated by the bank’s internal statistical origination model (for new loans) or on a score determined by a formula provided by the Superintendency of Finance, which incorporates the payment performance of the borrower; |
| | · | determining the probability of default from tables provided by the Superintendency of Finance which take into account the loan classification (“AA” through “Default”); |
| | · | determining the loss given default based on the type of credit support and past due status using tables provided by the Superintendency of Finance; and |
| | · | based on the expected loss given default and the exposure at default, the amount of the loan provision for the individual loan is determined and booked. |
For microcredit and mortgage loans, the provision as a percentage of the principal is determined in accordance with the following table.
| | | | | | | | |
| | | Provision as % of principal | | | Provision as % of principal covered by guarantee | | | Provision as % of principal not covered by guarantee | |
| | “A” | | | | 0.0 | | | | 1.0 | | | | 1.0 | |
| | “B” | | | | 1.0 | | | | 3.2 | | | | 100.0 | |
| | “C” | | | | 20.0 | | | | 10.0 | | | | 100.0 | |
| | “D” | | | | 50.0 | | | | 20.0 | | | | 100.0 | |
| | “E” | | | | 100.0 | | | | 30.0 | | | | 100.0 | |
Liquidity risk
As a holding company, Grupo Aval’s liquidity requirements are limited to dividends, debt-service payments and operational expenses. Our liquidity is derived entirely from dividends from subsidiaries, which management believes is sufficient for these purposes. Grupo Aval is not required to maintain minimum liquidity positions. Subject to the capital requirements of each of our banks, there are no limitations on our banks’ ability to pay dividends to Grupo Aval.
Banks controlled by Grupo Aval are required to, and do, maintain adequate liquidity positions based on the Superintendency of Finance’s liquidity parameters, as follows:
| | · | Until 2009, banks were required to determine liquidity gap, which is the difference between the expected cash flow disbursements from assets and the expected cash flow disbursements from liabilities, classified by time bracket, including in the calculation of both on- and off-balance sheet assets and liabilities as well as contingent assets and liabilities. Cumulative liquidity gap is defined as the sum of liquidity gap for the current and previous periods. |
| | · | Banks were generally required to have a positive three-month cumulative liquidity gap and, if this measure was negative, its absolute value was accounted for as “Liquidity Value at Risk.” No bank was allowed to have two consecutive evaluations of Liquidity Value at Risk which exceeded its “Net liquid assets” defined as net interbank loans, tradable debt securities that mature in more than three months, and available cash. |
| | · | In 2009, a short-term liquidity index (Indicador de Riesgo de Liquidez), or “IRL,” that measures 7-, 15- and 30-day liquidity was established. This index is defined as the difference between adjusted liquid assets and net liquidity requirements. Liquid assets include total debt securities adjusted by market liquidity and exchange rate, excluding investments classified as “held to maturity” different from mandatory investments, and available cash. Net liquidity requirements are the difference between expected contractual asset and liability cash flows. Cash flows from past due loans are not included in this calculation. |
Our banks have adequate liquidity, as shown in the following table. The three-month cumulative liquidity gap values for our banks for year-end 2011, 2010 and 2009 are those reported to the Superintendency of Finance and reflect unconsolidated figures for each of our banks.
| | | | |
Three-month cumulative liquidity position | | | | | | | | | |
| | | (in Ps billions) | |
| Banco de Bogotá | | | | | | | | | |
Total assets and contingencies | | | 11,941 | | | | 7,685 | | | | 8,733 | |
Total liabilities, equity and contingencies | | | 9,960 | | | | 8,094 | | | | 7,215 | |
Liquidity gap | | | 1,981 | | | | (409 | ) | | | 1,518 | |
Net liquid assets (NLA) | | | 1,662 | | | | 2,059 | | | | 2,017 | |
Liquidity gap plus NLA | | | 3,643 | | | | 1,650 | | | | 3,535 | |
| Banco de Occidente | | | | | | | | | | | | |
Total assets and contingencies | | | 5,692 | | | | 4,183 | | | | 3,998 | |
Total liabilities, equity and contingencies | | | 3,917 | | | | 2,874 | | | | 2,309 | |
Liquidity gap | | | 1,775 | | | | 1,309 | | | | 1,689 | |
Net liquid assets (NLA) | | | 1,430 | | | | 1,849 | | | | 2,139 | |
Liquidity gap plus NLA | | | 3,205 | | | | 3,157 | | | | 3,828 | |
| Banco Popular | | | | | | | | | | | | |
Total assets and contingencies | | | 2,361 | | | | 2,602 | | | | 1,841 | |
Total liabilities, equity and contingencies | | | 855 | | | | 1,429 | | | | 1,416 | |
Liquidity gap | | | 1,506 | | | | 1,173 | | | | 425 | |
Net liquid assets (NLA) | | | 1,163 | | | | 945 | | | | 1,141 | |
Liquidity gap plus NLA | | | 2,669 | | | | 2,118 | | | | 1,566 | |
| Banco AV Villas | | | | | | | | | | | | |
Total assets and contingencies | | | 1,354 | | | | 1,511 | | | | 1,146 | |
Total liabilities, equity and contingencies | | | 1,561 | | | | 2,025 | | | | 1,592 | |
Liquidity gap | | | (207 | ) | | | (514 | ) | | | (446 | ) |
Net liquid assets (NLA) | | | 809 | | | | 1,074 | | | | 681 | |
Liquidity gap plus NLA | | | 602 | | | | 560 | | | | 234 | |
The following table shows the short-term liquidity index at December 31, 2011 and 2010 (the year in which this index was introduced) for each of our banks.
| | | | | | | | | | | | | |
| | | | |
| | | | | | | | | | | | | | | | | | | | | | | | | |
| | | (in Ps billions) | |
IRL – 7 days | | | 6,345 | | | | 4,587 | | | | 2,709 | | | | 2,255 | | | | 2,740 | | | | 1,795 | | | | 2,026 | | | | 1,045 | |
IRL – 15 days | | | 6,013 | | | | 4,015 | | | | 2,363 | | | | 1,999 | | | | 2,407 | | | | 1,479 | | | | 1,759 | | | | 943 | |
IRL – 30 days | | | 5,395 | | | | 2,846 | | | | 1,677 | | | | 1,403 | | | | 1,781 | | | | 880 | | | | 1,639 | | | | 392 | |
Operational risk management
The policies with respect to operational risk at Grupo Aval and our banks are directed at complying with the norms established by the Superintendency of Finance (which, in turn, follow the Basel II Accord of 2004), and the U.S. Sarbanes-Oxley Act of 2002. These norms require that Colombian banks establish a system for the administration of operational risks, or “SARO,” which includes the identification, measurement, control and monitoring functions as well as a business continuity plan.
In order to comply with these norms, each of our banks established within its organizational structure an operational risk unit independent of the operational and control areas of each bank. The responsibilities of these units are the establishment and definition of policies and methodologies and the procedures for communicating within each organization all information related to operational risk. In addition to the staff of each operational risk unit, the banks have established the role of operational risk advisors, which are employees in key areas who, in addition to their functional responsibilities, are required to report events or situations which may result in operational losses. Additionally, each bank has an operational risk management committee composed of selected
members of the board of directors, the internal auditor, external auditor and selected vice presidents, which meets on a quarterly basis to review operational risks policies and follow up on the execution of action plans.
At Grupo Aval, an operational risk management committee, composed of the heads of the operational risk units of each bank and staff of Grupo Aval risk management, was established. The principal activities of this committee, which meets on a semi-monthly basis, are as follows:
| | · | advisory in the engagement of external consultants for the identification of gaps with international standards and the development of work plans to close the gaps; |
| | · | coordinated analysis of norms and the impact in each of Grupo Aval’s banks; |
| | · | identification and application of best practices; |
| | · | identification and implementation of operational risk management tools; |
| | · | unification of criteria in the search of business continuity tools; |
| | · | economies of scale in the engagement of consultants and the acquisition of tools; and |
| | · | coordination in the preparation of requests for proposals and the evaluation of proposals. |
We implement, from time to time, best practices that result from meetings of the Grupo Aval operational risk management committee.
Market risk management
Grupo Aval does not manage market risk at a consolidated level. Rather each bank monitors its market risk. Grupo Aval on an unconsolidated basis does not have material market risk; however, our banking subsidiaries have substantial market risk, primarily as a result of our banks’ lending, trading and investments businesses. The primary market risks to which we are exposed are interest rate risk, foreign exchange rate risk, variations in stock price risk and investment fund risk.
We are exposed to interest rate risk whenever there is a mismatch between interest-rate-sensitive assets and liabilities, subject to any hedging we have engaged in using interest rate swaps or other off-balance sheet derivative instruments. Interest rate risk arises in connection with both trading and non-trading activities.
We are exposed to foreign exchange rate risk as a result of mismatches between assets and liabilities, and off-balance sheet items denominated in different currencies. We are exposed to variations in stock price risk in connection with investments in equity securities, including our merchant banking investments. We are exposed to fund risk primarily from investments in mutual funds.
We and our banks’ respective boards of directors, through their risk management committees, are responsible for establishing policies, procedures and limits with respect to market risk. These committees also monitor overall performance in light of the risks assumed. These policies and procedures describe the control framework used by us and each of our banks to identify, measure and manage market risk exposures inherent in our and their activities. The main purpose of these policies and procedures is to set limits on risk. All risk managers within Grupo Aval must ensure that each business activity is performed in accordance with the policies established by the relevant bank and also Grupo Aval. These policies and procedures are followed in market risk decision-making in all business units and activities. All of our banks comply with the requirements of SARM (Sistema de Administración de Riesgos de Mercado) of the Superintendency of Finance.
Each bank is responsible for setting market risk limits and monitoring market risk.
Risk management personnel at Grupo Aval and each of our banks are responsible for the following:
| | · | identification, measurement and management of the market risk exposures inherent in their businesses; |
| | · | analyzing exposures under stress scenarios; |
| | · | confirming compliance with applicable risk management policies, reporting violations of such policies, and proposing new policies; |
| | · | designing of methodologies for valuing securities and financial instruments; and |
| | · | reporting daily to senior management as to the levels of market risk associated with trading instruments. |
Tools for measuring and managing market risk
Our banks hold trading and non-trading instruments. Trading instruments are recorded in our banks’ “treasury books” and non-trading instruments are recorded in their “banking books.”
Trading instruments
Trading instruments include our proprietary positions in financial instruments held for sale and/or acquired to take advantage of current and/or expected differences between purchase and sale prices. The tables in this section include certain investments recorded under Colombian Banking GAAP in “Held to maturity” and recorded under U.S. GAAP in “Trading” and “Available for sale.” As a result of trading fixed income and floating rate securities, equity securities, investment funds and foreign exchange, we and our banks are exposed to interest rate, variations in stock prices, investment fund and foreign exchange rate risks, as well as volatility risk when derivatives are used. Our banks trade foreign exchange, fixed income instruments, floating rate securities and basic derivative instruments (forwards, options, cross currency swaps and interest rate swaps).
Our banks use VaR to measure their exposure to market risk in trading instruments. VaR is an estimate of the expected maximum loss in market value of a given portfolio over a time horizon at a specific confidence interval, subject to certain assumptions and limitations discussed below.
VaR models have inherent limitations, including the fact that they rely on historical data, which may not be indicative of future market conditions or trading patterns. As a result, VaR models could overestimate or underestimate the value at risk and should not be viewed as predictive of future results. Furthermore, our banks may incur losses materially in excess of the amounts indicated by the VaR models on a particular trading day or over a period of time. VaR does not calculate the greatest possible loss. In addition, VaR models are subject to the reasonable judgment of our bank’s risk management personnel.
Each bank’s board of directors, assets and liabilities committee, or “ALCO,” and risk management committee establishes the maximum VaR for each type of investment and for each type of risk using their own internal VaR models as well as the Superintendency of Finance methodology, or the regulatory VaR. Our banks use VaR estimates to alert senior management whenever the statistically estimated losses in the banks’ portfolios exceed pre-established levels. Limits on VaR are used to control exposure on a portfolio-by-portfolio basis.
In order to strictly control the trading portfolios, each entity has limits for every risk factor. To determine the limits, the impact of the variation (dollar value for 1 basis point or DV01) in each risk is taken into account. These risk limits are validated through stress testing based on historical extreme scenarios.
As described below, our banks measure interest rate risk, foreign exchange risk, variations in stock price risk and investment fund risk in accordance with VaR models. We use two types of approaches to measure VaR: (1) regulatory VaR methodology and (2) internal VaR models.
| | · | The regulatory VaR used in the calculation of the capital ratio (solvency ratio) follows the methodology established by the Superintendency of Finance. The Superintendency methodology is based on the Basel II model. The Superintendency of Finance has not made publicly available technical information on how it determines the volatilities used in this model, and only limited information is available. The volatilities used in the Superintendency of Finance’s model are of a magnitude similar to those observed in very high volatility or stress periods. These parameters are seldom changed by the Superintendency of Finance. See “—Regulatory VaR” below. |
| | · | In addition, our banks use internal models to manage market risk. Parameters are set to adapt to the evolution of volatility of the risk factors over time using statistical methods to estimate them. Our banks generally give recent data more weight in calculations to reflect actual market conditions. The corporate governance bodies of our banks set limits based on this VaR measure in order to control the market risks. Parametric VaR and historical simulation methodologies are also used. |
Regulatory VaR
The Regulatory VaR calculation is primarily used for the Superintendency of Finance’s solvency ratio calculations.
The Superintendency of Finance methodology is based on the Basel II model. This model applies only to the banks’ investment portfolio and excludes investments classified as “held to maturity” and any other non-trading positions included in the “Trading” and “Available for sale” portfolios. Total market risk is calculated on a daily basis by aggregating the VaR for each risk exposure category on a ten-day horizon using risk factors calculated in extreme market stress scenarios. VaR at month-end comprises part of the capital adequacy ratio calculation (as set forth in Decree 2555). The Superintendency of Finance’s rules require our banks to calculate VaR for the following risk factors: interest rate risk, foreign exchange rate risk, variations in stock price risk and fund risk; correlations between risk factors are not considered. The fluctuations in the portfolio’s VaR depend on sensitivity factors determined by the Superintendency of Finance, modified duration and changes in balances outstanding. The ten-day horizon is defined as the average time in which an entity could sell a trading position on the market.
The VaR calculation for each bank is the aggregate of the VaR of the bank and its subsidiaries. Trust companies (fiduciarias), our pension and severance fund manager, Porvenir, and our brokerage firm, Casa de Bolsa, are not included in this calculation as the risk of their proprietary portfolios is not material to Grupo Aval.
Interest Rate Risk
Our banks’ exposure to interest rate risk in their trading portfolios primarily arises from investments in securities (floating and fixed rate) and derivative instruments. In accordance with the Superintendency of Finance rules, our banks calculate interest rate risk for positions in pesos, foreign currency and UVRs separately. UVR is a Colombian inflation-adjusted monetary index calculated by the board of directors of the Colombian Central Bank and generally used for pricing home-mortgage loans. The interest rate risk model is designed to measure the risk of loss arising from changes in market interest rates. It includes the sum of the net short or long position in the whole trading book, a proportion of the matched positions in each time band (the “vertical disallowance”) and a proportion of the matched positions across different time bands (the “horizontal disallowance”). The interest rate sensitivity factors and vertical and horizontal disallowances are not updated frequently by the Superintendency of Finance because those are calculated based on extreme historical market situations; the most recent update was made in November 2010 and published in External Circular 42.
A significant portion of the market risk of our banks is interest rate risk VaR as quantified in the tables below. The interest rate risk of our banks is primarily generated by long positions held in Peso-denominated Colombian government debt. Our banks have a preference for these securities as the government debt market is the largest and most developed of the local financial markets. Additionally, government debt securities support the liquidity management of our banks as they are eligible for Colombian Central Bank overnight repo funding and are classified as high-quality liquid assets. Government debt securities also carry a zero weight for capital adequacy calculations making them attractive in terms of utilization of capital. These factors provide a strong incentive for our banks to invest in government debt securities and diversify less into other debt securities that do not possess these characteristics.
Foreign exchange rate risk
Our banks use a sensitivity factor to calculate the probability of losses as a result of fluctuations in currencies in which our banks hold positions. Regulatory VaR is computed daily by multiplying the net position by the maximum probable variation in the price of such positions on a ten-day horizon, determined by the Superintendency of Finance as shown in the following table.
U.S. dollar | 5.5% |
Euro | 6.0% |
Other currencies | 8.0% |
Our banks’ exposure to foreign exchange rate risk arises primarily from changes to the U.S. dollar/peso exchange rate. Our banks use an approximation to estimate the risk in exchange-rate-related option positions based on delta, gamma and vega sensitivities, which is included in foreign exchange risk.
The foreign exchange rate risk VaR calculation under the standard model of the Superintendency of Finance includes both the trading and non-trading book.
Equity price risk
In determining regulatory VaR variations in stock price risk, certain investments are excluded: (a) equity investments in financial institutions that are supervised by the Superintendency of Finance and (b) equity investments derived from corporate restructuring processes (under Law 550 of 1999) or received as in-kind payment for non-performing loans. In addition, as part of the solvency ratio calculation, equity investments in entities supervised by the Superintendency of Finance that do not consolidate are deducted from primary capital. Investments in entities that consolidate but are not supervised by Superintendency of Finance (non-financial investment) are included in VaR calculations.
Variations in stock price risk in Grupo Aval come primarily from Corficolombiana’s non-financial investment portfolio. This risk is factored into Banco de Bogotá variations in stock price risk VaR as it consolidates Corficolombiana and is excluded from Banco de Occidente’s and Banco Popular’s variations in stock price risk calculation.
The Superintendency of Finance’s methodology for determining VaR for variations in stock price risk outlined above results in the inclusion of Corficolombiana’s consolidated and non-consolidated equity investments in non-financial institutions.
In December 2010, the Superintendency of Finance issued a revised methodology that excludes from the VaR calculation investments that are available-for-sale equity securities that are acquired as strategic investments and intended to be held on a long-term horizon. Grupo Aval has historically considered in its internal models that Corficolombiana’s consolidated equity investments and our investments that are held on a long-term horizon should have more limited variations in stock price risk on us.
Variations in stock price risk VaR is computed daily by multiplying the net position by the maximum probable variation in the price of such positions on a ten-day horizon, determined by the Superintendency of Finance to be 14.7%. This coefficient is based on historic volatilities and is seldom adjusted.
Investment fund risk
Investment fund risk comes from temporary investment of cash in portfolios managed by trust companies.
Investment fund risk VaR is computed daily by multiplying the net position by the maximum probable variation in the price of such positions on a ten-day horizon, determined by the Superintendency of Finance to be 14.7%.
The following tables show the VaR calculation relating to each of the risk factors described above and based on the Superintendency of Finance Methodology for the years ended December 31, 2011 and December 31, 2010, for a ten-day horizon for each of our banks. The averages, minimums and maximums are determined based on end-of-the-month calculations.
Banco de Bogotá
| | | | | | | |
| | | | | | | |
| | | | | | | | | | | | | | | | |
| | | (in Ps millions) | |
Interest rate risk VaR | | | 441,638 | | | | 419,458 | | | | 451,582 | | | | 377,127 | | | | 457,187 | |
Foreign exchange rate risk VaR | | | 23,339 | | | | 23,138 | | | | 31,143 | | | | 19,381 | | | | 11,205 | |
Variations in stock price risk VaR | | | 15,911 | | | | 35,853 | | | | 47,569 | | | | 15,703 | | | | 32,011 | |
Fund risk VaR | | | 85,161 | | | | 74,723 | | | | 92,588 | | | | 2,115 | | | | 2,565 | |
Total market risk VaR | | | 566,049 | | | | 553,172 | | | | 613,519 | | | | 485,994 | | | | 502,968 | |
Banco de Occidente
| | | | | | | |
| | | | | | | |
| | | | | | | | | | | | | | | | |
| | | (in Ps millions) | |
Interest rate risk VaR | | | 63,893 | | | | 73,348 | | | | 81,902 | | | | 63,893 | | | | 76,537 | |
Foreign exchange rate risk VaR | | | 596 | | | | 604 | | | | 992 | | | | 86 | | | | 2,440 | |
Variations in stock price risk VaR | | | 12 | | | | 298 | | | | 773 | | | | 11 | | | | 776 | |
Fund risk VaR | | | – | | | | 4 | | | | 48 | | | | – | | | | – | |
Total market risk VaR | | | 64,502 | | | | 74,253 | | | | 83,012 | | | | 64,502 | | | | 79,753 | |
Banco Popular
| | | | | | | |
| | | | | | | |
| | | | | | | | | | | | | | | | |
| | | (in Ps millions) | |
Interest rate risk VaR | | | 99,298 | | | | 116,054 | | | | 132,938 | | | | 99,298 | | | | 137,945 | |
Foreign exchange rate risk VaR | | | 1,128 | | | | 1,403 | | | | 2,123 | | | | 910 | | | | 1,777 | |
Variations in stock price risk VaR | | | 12 | | | | 461 | | | | 1,391 | | | | 11 | | | | 1,345 | |
Fund risk VaR | | | 697 | | | | 756 | | | | 813 | | | | 690 | | | | 712 | |
Total market risk VaR | | | 101,134 | | | | 118,674 | | | | 136,814 | | | | 101,134 | | | | 141,780 | |
Banco AV Villas
| | | | | | | |
| | | | | | | |
| | | | | | | | | | | | | | | | |
| | | (in Ps millions) | |
Interest rate risk VaR | | | 54,775 | | | | 60,620 | | | | 71,449 | | | | 50,418 | | | | 50,294 | |
Foreign exchange rate risk VaR | | | 119 | | | | 126 | | | | 150 | | | | 116 | | | | 149 | |
Variations in stock price risk VaR | | | – | | | | – | | | | – | | | | – | | | | – | |
Fund risk VaR | | | 2 | | | | 2 | | | | 3 | | | | 2 | | | | 2 | |
Total market risk VaR | | | 54,896 | | | | 61,508 | | | | 71,569 | | | | 50,570 | | | | 50,446 | |
Banco Popular’s regulatory VaR is greater than Banco de Occidente’s despite having portfolios of similar values, which is explained by Banco Popular’s average duration being greater than four years while Banco de Occidente’s is less than two years.
Banco de Bogotá’s fund risk VaR increased to Ps 85.2 billion at December 31, 2011 from Ps 2.6 billion at December 31, 2010. This was due to the fact that Corficolombiana recorded in February 2011 an investment security in a private investment fund, which is directed by Corredores Asociados. At December 31, 2011, this exposure is Ps 561.3 billion.
Internal models for VaR calculation
In addition to Regulatory VaR, our banks use internal models to measure VaR in order to determine and control their main risks under normal operating conditions. In particular, all of our banks use internal models to oversee the interest rate risk of their investment portfolio. Banco de Bogotá, Banco de Occidente and Banco Popular use internal models to measure VaR of their full investment portfolio on a daily basis, while Banco AV Villas uses an internal model to measure VaR only for a government bond position.
We use methodologies such as Parametric VaR and historical simulation. The Parametric VaR, which is based on Riskmetrics Group, Inc.’s methodology, involves the identification of specific risks, such as interest and exchange rate risks that could affect the value of assets included in the trading book. The volatility of each factor, measured as a standard deviation, and the correlation with other factors are determined by using an exponentially weighted moving average, or “EWMA,” model. Once this is determined, the expected cash flow of each security included in the portfolio is determined. These cash flows are classified into categories for each risk identified and multiplied by the corresponding volatility to calculate the VaR per factor. The VaR for the various factors is then aggregated using a correlation matrix to identify the overall standard deviation of the bank’s treasury book. The VaR of the bank’s treasury book is determined based on the standard deviation subject to a confidence level of 99% and a one-day horizon.
The historical simulation calculates daily VaR based on the historical behavior of the one-day variations of prices in the market. This methodology does not assume any statistical distribution function for the earnings and loss of a portfolio. This simulation assumes that the market is stable during a period of time and infers the market’s future behavior based on historical data.
Back testing is required by the Superintendency of Finance to establish the validity of the internal models used for VaR calculations. The Superintendency of Finance requires two sets of tests: so called “dirty tests,” which compare the value at risk estimated for the day against the result effectively obtained (profit and loss) of the same day using the previous day’s portfolio; and “clean tests,” which compare the value at risk estimated for the day against an estimated result (profit and loss) based on the previous day’s portfolio. These tests are performed on a daily basis, although the requirement for the “clean” test is on a monthly basis. The methodology and results of these tests are available for review by the Superintendency of Finance.
The following table shows the interest rate VaR calculation based on internal models for 2011 and 2010 on a ten-day horizon (using an adjustment factor applied to VaR on a one day horizon). The values presented for Banco AV Villas were calculated on Banco de Bogotá’s model. Values for all other banks are based on their internal models. The averages, minimums and maximums are determined based on daily calculations except for BAC Credomatic, which are determined based on end-of-the-quarter calculations.
Interest rate risk VaR (per internal model)
| | | | | | | | | | | | | |
| | | (in Ps millions) | |
| 2011 | | | | | | | | | | | | |
As of December 31 | | | 94,009 | | | | 27,202 | | | | 13,637 | | | | 8,862 | |
Average | | | 128,656 | | | | 35,743 | | | | 20,819 | | | | – | |
Maximum | | | 215,633 | | | | 54,312 | | | | 35,643 | | | | – | |
Minimum | | | 79,093 | | | | 22,029 | | | | 12,631 | | | | – | |
| 2010 | | | | | | | | | | | | | | | | |
As of December 31 | | | 169,265 | | | | 45,667 | | | | 27,465 | | | | 11,984 | |
| (1) | Banco Popular’s internal VaR data reflects Banco Popular’s unconsolidated results. The regulatory VaR, however corresponds to consolidated figures. Banco Popular (unconsolidated) accounts for over 98% of the consolidated regulatory VaR at year-end 2011 and 2010. Banco Popular’s VaR results are lower than Banco de Occidente’s as a significant portion of Banco de Occidente’s portfolio is held in foreign currencies through its subsidiaries in Panama and the Bahamas, resulting in increased volatility. In comparison, an immaterial amount of Banco Popular’s portfolio is denominated in foreign currencies. |
Considerations on equity price risk regulatory VaR
As stated above, variations in equity price risk measured based on the regulatory VaR methodology include both equity investments held for trading and others held with a long-term horizon. In addition, it does not discriminate between listed and unlisted equity investments or between those which consolidate and those which do not. It focuses on investments in non-financial institutions. VaR calculated under this methodology is higher than VaR calculated with a methodology that focuses on equities held for trading.
Holding periods for many of Corficolombiana’s equity investments exceed ten years. Its largest investments have remained in the portfolio for several years and are intended to remain as permanent investments.
Equity price risk regulatory VaR decreased by Ps 16.1 billion to Ps 15.9 billion in December 31, 2011 from Ps 32.0 billion in December 31, 2010. The reason for this decrease has been the change in classification of investments such as Proenergía and SIE.
The following table breaks down our investments subject to regulatory VaR by time since initial investment at December 31, 2011 and 2010.
| | | | |
| | | | | | | |
| | | Investment subject to Regulatory VaR | | | | | | | | | Investment subject to Regulatory VaR | | | | | | | |
Less than 18 months | | | – | | | | – | | | | – | | | | – | | | | – | | | | – | |
18 - 36 months | | | – | | | | – | | | | – | | | | – | | | | – | | | | – | |
More than 36 months | | | 106,499 | | | | 15,655 | | | | 100.0 | % | | | 207,724 | | | | 30,535 | | | | 100.0 | % |
Total | | | 106,499 | | | | 15,655 | | | | 100.0 | % | | | 207,724 | | | | 30,535 | | | | 100.0 | % |
Non-trading instruments
Non-trading instruments consist primarily of loans and deposits. Our banks’ primary market risk exposure in their non-trading instruments is interest rate risk, which arises from the possibility of changes in market interest rates. Such changes in market interest rates affect our banks’ net interest income due to timing differences on the repricing of their assets and liabilities. Our banks are also affected by gaps in maturity dates and interest rates in the different asset and liability accounts. As part of their management of interest rate risk, our banks analyze the interest rate mismatches between their interest earning assets and their interest-bearing liabilities.
Superintendency of Finance rules require our banks to measure foreign exchange rate risk VaR not only for treasury book positions but also for all assets and liabilities denominated in foreign currencies. Our non-trading instruments are exposed to foreign exchange rate risk primarily from loans and deposits denominated in dollars. This foreign exchange rate risk is monitored under the VaR methodology described above.
Sensitivity of fair value is determined using either one of two methodologies: (1) determining the difference between the fair value and the net present value of the expected cash flows using a discount rate of 50 basis points and 100 basis points higher than that used for the original calculation; or (2) determining the sensitivity of the remaining cash flows (modified duration), multiplied by the fair value, multiplied by the increase in discount rate for each scenario (50 basis points and 100 basis points). Methodology 1 is in some cases more precise while methodology 2 is a good approximation for moderate variations in the discount rate.
Sensitivity of certain instruments is assumed to be zero because its fair value is equal to its book value as instruments with maturities of 90 days or less, or loans and borrowings from development banks.
Our sensitivity analysis methodology should be interpreted in light of the following limitations: (1) we have assumed a uniform interest rate change for assets and liabilities of varying maturities; and (2) we have assumed that the modified duration of variable rate assets and liabilities is the time remaining until the next interest reset date.
An increase in interest rates negatively affects the value of our banks’ assets and positively affects the value of our banks’ liabilities, as an increase in interest rates decreases the fair value of both assets and liabilities.
The following table presents our sensitivity analysis based on hypothetical changes of 50 and 100 basis point shifts in interest rates on the net present value of interest rate sensitive assets and liabilities for the periods indicated.
| | | | | | | |
Grupo Aval (aggregated) (1) | | | | | | | | | | | | | | | | | | |
| | | (in Ps millions) | |
| Assets | | | | | | | | | | | | | | | | | | |
Held-to-maturity securities | | | 2,965,733 | | | | (12,674 | ) | | | (25,298 | ) | | | 2,883,816 | | | | (18,488 | ) | | | (36,909 | ) |
Loans | | | 72,638,770 | | | | (567,306 | ) | | | (1,086,986 | ) | | | 58,617,120 | | | | (467,106 | ) | | | (942,599 | ) |
Short-term funds | | | 2,944,277 | | | | – | | | | – | | | | 2,351,050 | | | | – | | | | – | |
Customer’s acceptances | | | 116,625 | | | | – | | | | – | | | | 57,018 | | | | – | | | | – | |
| Total interest rate sensitive assets | | | 78,665,404 | | | | 579,980 | | | | 1,112,284 | | | | 63,909,177 | | | | (485,593 | ) | | | (979,508 | ) |
| Liabilities | | | | | | | | | | | | | | | | | | | | | | | | |
| Checking accounts, savings deposits and other | | | 50,055,718 | | | | – | | | | – | | | | 45,256,723 | | | | – | | | | – | |
Time deposits | | | 22,731,759 | | | | (67,833 | ) | | | (140,008 | ) | | | 18,667,732 | | | | (41,111 | ) | | | (81,966 | ) |
| Bank acceptances outstanding | | | 123,075 | | | | – | | | | – | | | | 59,812 | | | | – | | | | – | |
Short-term funds | | | 3,244,247 | | | | – | | | | – | | | | 2,481,088 | | | | – | | | | – | |
Borrowings from banks | | | 11,563,521 | | | | (53,775 | ) | | | (105,705 | ) | | | 10,490,661 | | | | (69,060 | ) | | | (135,765 | ) |
Long-term debt | | | 6,799,462 | | | | (70,279 | ) | | | (138,891 | ) | | | 8,096,192 | | | | (70,605 | ) | | | (139,557 | ) |
| Total interest rate sensitive liabilities | | | 94,517,782 | | | | (191,887 | ) | | | (384,605 | ) | | | 85,052,208 | | | | (180,776 | ) | | | (357,288 | ) |
Total net change | | | (15,852,377 | ) | | | (388,093 | ) | | | (727,679 | ) | | | (21,143,030 | ) | | | (304,817 | ) | | | (622,220 | ) |
| (1) | Grupo Aval aggregated reflects the sum of the fair values of each of our banking subsidiaries and of Grupo Aval. |
Not applicable.
Not applicable.
Not applicable.
Not applicable.
No matters to report.
No matters to report.
Not applicable.
As of December 31, 2011, under the supervision and with the participation of our management, including our President and Chief Financial Officer, we performed an evaluation of the effectiveness of the design and operation of our disclosure controls and procedures (as defined in Rule 13a-15(e) under the Exchange Act). There are inherent limitations to the effectiveness of any disclosure controls and procedures system, including the possibility of human error and circumventing or overriding them. Even if effective, disclosure controls and procedures can provide only reasonable assurance of achieving their control objectives.
Based on such evaluation, our President and Chief Financial Officer concluded that our disclosure controls and procedures are effective to provide reasonable assurance that the information we are required to disclose in the reports we file or submit under the Exchange Act is (1) recorded, processed, summarized and reported within the time periods specified in the SEC’s rules and forms and (2) accumulated and communicated to our management to allow timely decisions regarding required disclosures.
Our management is responsible for establishing and maintaining an adequate internal control over financial reporting as defined in Rule 13a-15(f) under the Exchange Act.
Our internal control over financial reporting is a process designed by, or under the supervision of, our principal executive and principal financial officers, management and other personnel, to provide reasonable assurance regarding the reliability of financial reporting and the preparation of our financial statements for external reporting purposes, in accordance with generally accepted accounting principles. These include those policies and procedures that:
| | · | pertain to the maintenance of records that, in reasonable detail, accurately and fairly reflect transactions and dispositions of our assets; |
| | · | provide reasonable assurance that transactions are recorded as necessary to permit preparation of financial statements, in accordance with generally accepted accounting principles, and that receipts and expenditures are being made only in accordance with authorization of our management and directors; and |
| | · | provide reasonable assurance regarding prevention or timely detection of unauthorized acquisition, use or disposition of our assets that could have a material effect on our financial statements. |
Because of its inherent limitations, internal control over financial reporting may not prevent or detect misstatements. Therefore, effective control over financial reporting cannot, and does not, provide absolute assurance of achieving our control objectives. Also, projections of, and any evaluation of effectiveness of the
internal controls in future periods are subject to the risk that controls may become inadequate because of changes in conditions, or that the degree of compliance with the policies or procedures may deteriorate.
We have adapted our internal control over financial reporting based on the guidelines set by the Internal Control – Integrated Framework of the Committee of Sponsoring Organizations of the Treadway Commission (“COSO”).
Under the supervision and with the participation of our management, including our President, our Chief Financial Officer, our Chief Risk Management Officer and our Vice-President of Internal Control, we conducted an evaluation of the effectiveness of our internal control over financial reporting as of December 31, 2011, based on the guidelines set forth by the COSO.
Based on this assessment, management believes that, as of December 31, 2011, its internal control over financial reporting was effective based on those criteria.
Not applicable.
There was no change in our internal control over financial reporting that occurred during the period covered by this annual report that has materially affected, or is reasonably likely to materially affect, our internal control over financial reporting.
Our audit committee currently consists of three members appointed by the board of directors: Antonio José Urdinola Uribe, Guillermo Fernandez de Soto and Esther América Paz Montoya. The board of directors has determined that Esther América Paz Montoya is an audit committee financial expert. While Grupo Aval is not a listed issuer, Esther América Paz Montoya and Antonio José Urdinola Uribe are independent audit committee members under the standards of the New York Stock Exchange, which applies the audit committee independence requirements of the Securities and Exchange Commission.
We have not adopted a written code of ethics because Colombian law does not require us to have a code of ethics.
Amounts paid to KPMG Ltda., for audit and other services were as follows:
| | | | | | | |
| | | (In Ps millions) | |
Audit fees | | | 53.5 | | | | 52.2 | |
Audit-related fees | | | 3,609.6 | | | | 4,684.3 | |
Tax fees | | | – | | | | – | |
Other fees paid | | | – | | | | – | |
The aggregate fees billed under the caption audit fees for professional services rendered to Grupo Aval for the audit of its financial statements and for services that are normally provided to Grupo Aval, in connection with statutory or regulatory filings or engagements totaled Ps 53.5 million and Ps 52.2 million for the years 2011 and 2010, respectively.
Additionally other audit-related fees totaled Ps 3,609.6 million and Ps 4,684.3 million for the years ended 2011 and 2010, respectively. Grupo Aval paid no tax fees or other fees for the years 2011 and 2009, respectively.
The services commissioned from our auditors meet the independence requirements stipulated by the Colombian Central Bank and by SEC rules and regulations, and they did not involve the performance of any work that is incompatible with the audit function.
If we are required to engage an auditing firm for audit and audit-related services, those services have to be pre-approved by the Audit Committee.
The Audit Committee is regularly informed of all fees paid to the auditing firms by us.
Not applicable.
Grupo Aval may repurchase its shares only with retained earnings. On the other hand, Colombian law prohibits the repurchase of shares of entities under the comprehensive supervision of, and subject to inspection and surveillance as financial institutions by, the Superintendency of Finance. As such, Banco de Bogotá, Banco de Occidente, Banco Popular, Banco AV Villas, and their respective financial subsidiaries, including Porvenir and Corficolombiana are not permitted to repurchase their shares or Grupo Aval’s shares.
The following table reflects purchases of our preferred stock by us or our affiliates in 2011.
| | Total Number of Shares Purchased | | | Average Price Paid per Share in Ps (1) | | | Total Number of Shares Purchased as Part of Publicly Announced Plans or Programs | | | Approximate Value in Ps billions of Shares that May Yet Be Purchased Under the Plans or Programs (1) | |
January 1 to January 31 | | | – | | | | – | | | | – | | | | – | |
February 1 to February 28 (2) | | | – | | | | – | | | | – | | | | – | |
March 1 to March 31 | | | – | | | | – | | | | – | | | | – | |
April 1 to April 30 | | | – | | | | – | | | | – | | | | – | |
May 1 to May 31 (3) (4) | | | 12,508,782 | | | | 1,292.5 | | | | 12,508,782 | | | | 13.8 | |
June 1 to June 30 (4) | | | 8,523,969 | | | | 1,282.6 | | | | 8,523,969 | | | | 2.8 | |
July 1 to July 31 | | | – | | | | – | | | | – | | | | 2.8 | |
August 1 to August 31 | | | – | | | | – | | | | – | | | | 2.8 | |
September 1 to September 30 | | | – | | | | – | | | | – | | | | 2.8 | |
October 1 to October 31 | | | – | | | | – | | | | – | | | | 2.8 | |
November 1 to November 30 | | | – | | | | – | | | | – | | | | 2.8 | |
December 1 to December 31 | | | – | | | | – | | | | – | | | | 2.8 | |
Total | | | 21,032,751 | | | | 1,287.5 | | | | 21,032,751 | | | | 2.8 | |
| (1) | Average price paid per share is the execution price, excluding brokerage fees and value added tax. Including brokerage fees and value added tax would decrease the approximate value of shares that may yet be purchased under the plans or programs. |
| (2) | Our preferred shares have been listed since February 1, 2011 on the Colombian Stock Exchange under the symbol “PFAVAL.” We first issued preferred shares on May 12, 2011 at the conclusion of the Preferred Shares Local Offering. See “Item 4. Information on the Company—A. History and development of the company—Preferred Shares Local Offering.” |
| (3) | On May 18, 2011, our board of directors authorized Mr. Luis Carlos Sarmiento Angulo, Chairman of the board of directors of Grupo Aval, to acquire, directly or indirectly, up to Ps 30 billion (U.S.$15.4 million) of our common or preferred shares. The authorization was given by a unanimous vote of the directors, with Mr. Sarmiento Angulo, Chairman of the board of directors of Grupo Aval, abstaining. |
| (4) | During May 2011, Mr. Sarmiento Angulo acquired 10,454,572 preferred shares at Ps 1,294.2 (average price paid per share) and 2,054,210 common shares at Ps 1,290.7 (average price paid per share). During June 2011, Mr. Sarmiento Angulo acquired 6,306,198 preferred shares at Ps 1,282.4 (average price paid per share) and 2,217,771 common shares at Ps 1,282.7 (average price paid per share). |
During 2011, all purchases and sales of equity securities were made in open-market transactions.
Not applicable.
Not applicable.
Not applicable.
We have responded to Item 18 in lieu of this item.
Financial Statements are filed as part of this annual report, see page F-1.
| 1.1 | English translation of By-laws of Grupo Aval (incorporated by reference from our Registration Statement on Form 20-F (File No. 000-54290) filed with the SEC on March 7, 2011). |
| 2.1 | Indenture among Grupo Aval Limited, as Issuer, Grupo Aval Acciones y Valores S.A., as Guarantor, Deutsche Bank Trust Company Americas, as Trustee, Registrar, Paying Agent and Transfer Agent and Deutsche Bank Luxembourg S.A., as Luxembourg Paying Agent and Transfer Agent, dated as of February 1, 2012. |
| 4.1 | Stock purchase agreement dated as of July 15, 2010 among GE Consumer Finance Central Holdings Corp., General Electric Capital Corporation and Grupo Aval Acciones y Valores S.A. (incorporated by reference from our Registration Statement on Form 20-F (File No. 000-54290) filed with the SEC on March 7, 2011). |
| 4.2 | Loan Agreement between Bancolombia S.A. and Leasing Bogota S.A. – Panama, dated as of November 26, 2010 (incorporated by reference from our Registration Statement on Form 20-F (File No. 000-54290) filed with the SEC on March 7, 2011). |
| 4.3 | Loan Agreement between Bancolombia S.A. and Leasing Bogota S.A. – Panama, dated as of November 26, 2010 (incorporated by reference from our Registration Statement on Form 20-F (File No. 000-54290) filed with the SEC on March 7, 2011). |
| 4.4 | Agreement between Grupo Aval Acciones y Valores S.A. and Adminegocios & Cia. S.C.A. regarding mandatorily convertible bonds issued by Banco de Bogota, dated as of November 24, 2010 (incorporated by reference from our Registration Statement on Form 20-F (File No. 000-54290) filed with the SEC on March 7, 2011). |
| 4.5 | Escision Agreement between Grupo Aval Acciones y Valores S.A. and Rendifin S.A., dated as of January 31, 2011 (incorporated by reference from our Registration Statement on Form 20-F (File No. 000-54290) filed with the SEC on March 7, 2011). |
| 4.6 | Escision Agreement between Grupo Aval Acciones y Valores S.A. and Inversiones Escorial S.A. and Popular Securities S.A. dated as of April 29, 2011. (incorporated by reference from our Annual Report on Form 20-F (File No. 000-54290) filed with the SEC on June 30, 2011). |
| 8.1 | List of subsidiaries. |
| 12.1 | Certification pursuant to section 302 of the Sarbanes-Oxley Act of 2002. |
| 12.2 | Certification pursuant to section 302 of the Sarbanes-Oxley Act of 2002. |
| 13.1 | Certification pursuant to 18 U.S.C. section 1350, as adopted pursuant to section 906 of the Sarbanes-Oxley Act of 2002. |
| 13.2 | Certification pursuant to 18 U.S.C. section 1350, as adopted pursuant to section 906 of the Sarbanes-Oxley Act of 2002. |
SIGNATURES
The registrant hereby certifies that it meets all of the requirements for filing on Form 20-F and that it has duly caused and authorized the undersigned to sign this annual report on its behalf.
Grupo Aval Acciones y Valores S.A. | |
| By: | /s/ Luis Carlos Sarmiento Gutiérrez | |
| | Name: | Luis Carlos Sarmiento Gutiérrez | |
| | Title: | President | |
Date: April 30, 2012