UNITED STATES
SECURITIES AND EXCHANGE COMMISSION
Washington, D.C. 20549
FORM 6-K
Report Of Foreign Private Issuer
Pursuant To Rule 13a-16 Or 15d-16 Of
The Securities Exchange Act Of 1934
For the month of May 2018
Commission File Number: 000-54290
Grupo Aval Acciones y Valores S.A.
(Exact name of registrant as specified in its charter)
Carrera 13 No. 26A - 47
Bogotá D.C., Colombia
(Address of principal executive office)
Indicate by check mark whether the registrant files or will file annual reports under cover of Form 20-F or Form 40-F:
| Form 20-F | X | Form 40-F |
Indicate by check mark if the registrant is submitting the Form 6-K in paper as permitted by Regulation S-T Rule 101(b)(1):
| Yes | No | X |
Indicate by check mark if the registrant is submitting the Form 6-K in paper as permitted by Regulation S-T Rule 101(b)(7):
| Yes | No | X |
GRUPO AVAL ACCIONES Y VALORES S.A.
TABLE OF CONTENTS
| ITEM | |
| 1. | Report of First Quarter 2018 Consolidated Results |
| 2. | First Quarter 2018 Consolidated Earnings Results Presentation |
Item 1

Grupo Aval Acciones y Valores S.A. (“Grupo Aval”) is an issuer of securities in Colombia and in the United States, registered with Colombia’s National Registry of Shares and Issuers (Registro Nacional de Valores y Emisores) and the United States Securities and Exchange Commission (“SEC”). As such, it is subject to the control of the Superintendency of Finance and compliance with applicable U.S. securities regulation as a “foreign private issuer” under Rule 405 of the U.S. Securities Act of 1933.
All of our banking subsidiaries (Banco de Bogotá, Banco de Occidente, Banco Popular and Banco AV Villas), Porvenir and Corficolombiana, are subject to inspection and surveillance as financial institutions by the Superintendency of Finance. Although we are not a financial institution, as a result of the enactment of Law 1870 of 2017, also known as Law of Financial Conglomerates, starting on 2018, Grupo Aval will be subject to the supervision and regulation of the Superintendency of Finance. Grupo Aval, as the holding company of its financial conglomerate will become responsible for the compliance with capital adequacy requirements, corporate governance standards, financial risk management and internal control framework and criteria for identifying, managing and revealing conflicts of interest, applicable to its financial conglomerate.
The unaudited consolidated financial information included in this document is presented in accordance with IFRS as currently issued by the IASB. Details of the calculations of non-GAAP measures such as ROAA and ROAE, among others, are explained when required in this report.
The results for 1Q2018 are not comparable to previous quarters due to the prospective adoption in Colombia of IFRS 9 and IFRS 15 starting in January 1, 2018.
This report may include forward-looking statements, which actual results may vary from those stated herein as a consequence of changes in general, economic and business conditions, changes in interest and currency rates and other risks factors as evidenced in our Form 20-F available at the SEC webpage. Recipients of this document are responsible for the assessment and use of the information provided herein. Grupo Aval will not have any obligation to update the information herein and shall not be responsible for any decision taken by investors in connection with this document. The content of this document and the unaudited figures included herein are not intended to provide full disclosure on Grupo Aval or its affiliates.
When applicable, in this document we refer to billions as thousands of millions.
| 1 |  |

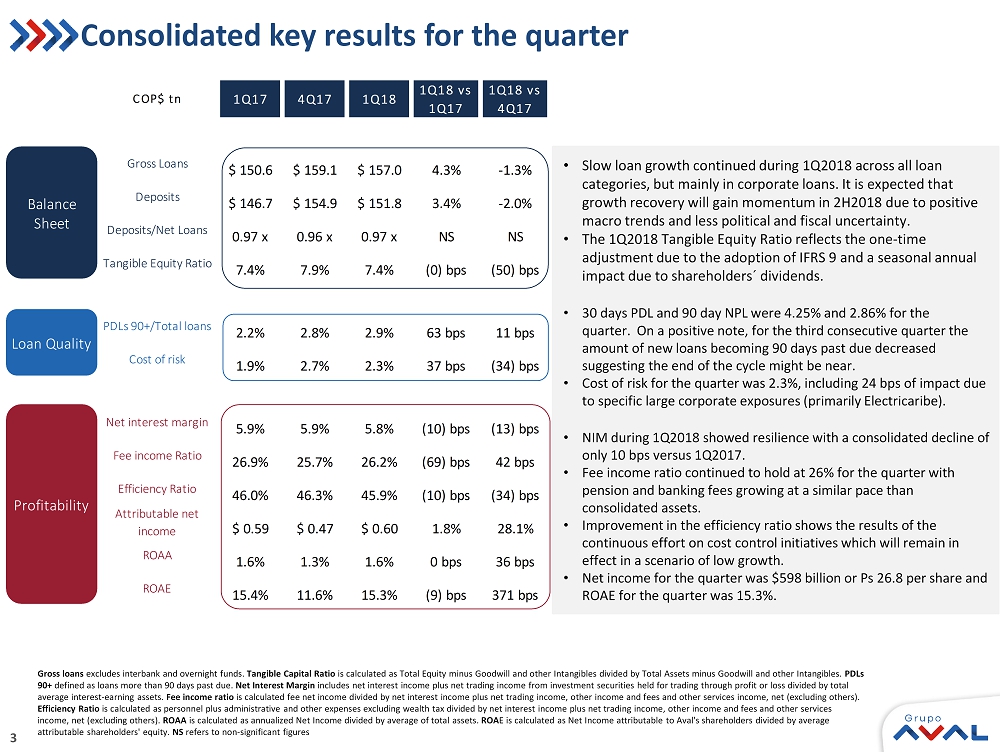
Bogotá, May 16th, 2018. GRUPO AVAL ACCIONES Y VALORES S.A. (“Grupo Aval”) reports a consolidated attributable net income result of Ps 597.7 billion (Ps 26.8 pesos per share) for 1Q18 versus a Ps 466.7 billion (Ps 20.9 pesos per share) figure reported for 4Q17. ROAE for the quarter was 15.3% and ROAA was 1.6%.
| • | Slow loan growth continued during 1Q2018 across all loan categories, but mainly in corporate loans. It is expected that growth recovery will gain momentum in 2H2018 due to positive macro trends and less political and fiscal uncertainty. |
| • | The 1Q2018 Tangible Equity Ratio reflects the one-time adjustment due to the adoption of IFRS 9 and a seasonal annual impact due to shareholders´ dividends. |
| • | 30 days PDL and 90 day NPL were 4.25% and 2.86% for the quarter. On a positive note, for the third consecutive quarter the amount of new loans becoming 90 days past due decreased suggesting the end of the cycle might be near. |
| • | Cost of risk for the quarter was 2.3%, including 24 bps of impact due to specific large corporate exposures (primarily Electricaribe). |
| • | NIM during 1Q2018 showed resilience with a consolidated decline of only 10 bps versus 4Q2017. |
| • | Fee income ratio continued to hold at 26% for the quarter with pension and banking fees growing at a similar pace than consolidated assets. |
| • | Improvement in the efficiency ratio shows the results of the continuous effort on cost control initiatives which will remain in effect in a scenario of low growth. |
| • | Net income for the quarter was $598 billion or Ps 26.8 per share and ROAE for the quarter was 15.3%. |
Gross loans excludes interbank and overnight funds. Tangible Capital Ratio is calculated as Total Equity minus Goodwill and other Intangibles divided by Total Assets minus Goodwill and other Intangibles. Net Interest Margin includes net interest income plus net trading income from investment securities held for trading through profit or loss divided by total average interest-earning assets. Fee income ratio is calculated fee net income divided by net interest income plus net trading income, other income and fees and other services income, net (excluding others). Efficiency Ratio is calculated as personnel plus administrative and other expenses excluding wealth tax divided by net interest income plus net trading income, other income and fees and other services income, net (excluding others). ROAA is calculated as annualized Net Income divided by average of total assets. ROAE is calculated as Net Income attributable to Aval's shareholders divided by average attributable shareholders' equity.
| 2 | |
| Grupo Aval Acciones y Valores S.A. | |||||||||
| Consolidated Financial Statements Under IFRS | |||||||||
| Information in Ps. Billions |
| Consolidated Statement of Financial Position | 1Q17 | 4Q17 | 1Q18 | D | |||||
| 1Q18 vs. 4Q17 | 1Q18 vs. 1Q17 | ||||||||
| Cash and cash equivalents | 24,542.3 | 22,336.8 | 21,687.7 | -2.9% | -11.6% | ||||
| Total financial assets held for trading through profit or losses | 5,063.0 | 5,128.1 | 5,768.9 | 12.5% | 13.9% | ||||
| Total available for sale financial assets | 18,063.6 | 18,614.2 | 19,527.5 | 4.9% | 8.1% | ||||
| Investments held to maturity | 2,636.8 | 2,899.0 | 2,827.9 | -2.5% | 7.2% | ||||
| Other financial assets at fair value through profit or loss | 2,117.7 | 2,282.6 | 2,333.2 | 2.2% | 10.2% | ||||
| Total loans and receivables, net | 151,304.0 | 160,754.3 | 156,099.6 | -2.9% | 3.2% | ||||
| Tangible assets | 6,430.9 | 6,654.0 | 6,449.4 | -3.1% | 0.3% | ||||
| Goodwill | 6,644.0 | 6,901.1 | 6,581.3 | -4.6% | -0.9% | ||||
| Concession arrangement rights | 2,816.2 | 3,114.2 | 3,221.3 | 3.4% | 14.4% | ||||
| Other assets | 7,493.9 | 7,854.3 | 7,782.4 | -0.9% | 3.8% | ||||
| Total assets | 227,112.6 | 236,538.5 | 232,279.0 | -1.8% | 2.3% | ||||
| Derivative instruments held for trading | 581.6 | 298.7 | 754.8 | 152.7% | 29.8% | ||||
| Deposits from clients at amortized cost | 146,736.3 | 154,885.2 | 151,771.6 | -2.0% | 3.4% | ||||
| Interbank borrowings and overnight funds | 7,984.8 | 4,970.4 | 6,971.1 | 40.3% | -12.7% | ||||
| Borrowings from banks and others | 18,368.5 | 18,205.3 | 16,279.8 | -10.6% | -11.4% | ||||
| Bonds | 16,275.4 | 19,102.2 | 18,546.8 | -2.9% | 14.0% | ||||
| Borrowings from development entities | 2,790.1 | 2,998.1 | 2,995.8 | -0.1% | 7.4% | ||||
| Other liabilities | 10,670.4 | 10,207.4 | 10,851.5 | 6.3% | 1.7% | ||||
| Total liabilities | 203,407.2 | 210,667.3 | 208,171.3 | -1.2% | 2.3% | ||||
| Equity attributable to owners of the parent company | 14,881.8 | 16,287.0 | 14,944.9 | -8.2% | 0.4% | ||||
| Non-controlling interests | 8,823.6 | 9,584.2 | 9,162.9 | -4.4% | 3.8% | ||||
| Total equity | 23,705.4 | 25,871.2 | 24,107.7 | -6.8% | 1.7% | ||||
| Total liabilities and equity | 227,112.6 | 236,538.5 | 232,279.0 | -1.8% | 2.3% | ||||
| Consolidated Statement of Income | 1Q17 | 4Q17 | 1Q18 | D | |||||
| Interest income | 4,728.9 | 4,622.8 | 4,589.2 | -0.7% | -3.0% | ||||
| Interest expense | 2,189.1 | 1,961.0 | 1,860.9 | -5.1% | -15.0% | ||||
| Net interest income | 2,539.8 | 2,661.8 | 2,728.3 | 2.5% | 7.4% | ||||
| Impairment loss on loans and accounts receivable | 791.3 | 1,125.9 | 984.3 | -12.6% | 24.4% | ||||
| Impairment loss on other financial assets | 0.0 | - | (50.6) | N.A | N.A | ||||
| Impairment loss on other assets | 6.5 | 156.0 | 5.9 | -96.2% | -8.8% | ||||
| Recovery of charged-off assets | (54.9) | (78.2) | (66.1) | -15.5% | 20.4% | ||||
| Impairment loss, net | 742.9 | 1,203.7 | 873.4 | -27.4% | 17.6% | ||||
| Net income from commissions and fees | 1,130.2 | 1,165.8 | 1,150.3 | -1.3% | 1.8% | ||||
| Net income from sales of goods and services to clients (non-financial sector) | 172.1 | 297.6 | 205.8 | -30.8% | 19.6% | ||||
| Net trading income | 32.2 | 178.8 | (90.3) | -150.5% | N.A | ||||
| Net income from financial instruments designated at fair value | 44.2 | 62.4 | 52.0 | -16.7% | 17.8% | ||||
| Total other income | 374.7 | 298.4 | 425.8 | 42.7% | 13.7% | ||||
| Total other expenses | 2,191.3 | 2,286.4 | 2,177.0 | -4.8% | -0.7% | ||||
| Income before income tax expense | 1,358.9 | 1,174.7 | 1,421.5 | 21.0% | 4.6% | ||||
| Income tax expense | 445.2 | 440.2 | 470.1 | 6.8% | 5.6% | ||||
| Income from continued operations | 913.7 | 734.6 | 951.3 | 29.5% | 4.1% | ||||
| Income from discontinued operations | - | - | - | N.A | N.A | ||||
| Net income before non-controlling interest | 913.7 | 734.6 | 951.3 | 29.5% | 4.1% | ||||
| Non-controlling interest | 326.7 | 267.9 | 353.6 | 32.0% | 8.2% | ||||
| Net income attributable to the owners of the parent company | 587.0 | 466.7 | 597.7 | 28.1% | 1.8% | ||||
| Key ratios | 1Q17 | 4Q17 | 1Q18 | YTD 2017 | YTD 2018 | ||||
| Net Interest Margin(1) | 5.8% | 5.8% | 5.9% | 5.8% | 5.9% | ||||
| Net Interest Margin (including net trading income)(1) | 5.9% | 5.9% | 5.8% | 5.9% | 5.8% | ||||
| Efficiency ratio(2) | 46.0% | 46.3% | 45.9% | 46.0% | 45.9% | ||||
| ROAA(3) | 1.6% | 1.3% | 1.6% | 1.6% | 1.6% | ||||
| ROAE(4) | 15.4% | 11.6% | 15.3% | 15.4% | 15.3% | ||||
| 30 days PDL / Total loans and leases (5) | 3.6% | 3.9% | 4.3% | 3.6% | 4.3% | ||||
| Provision expense / Average loans and leases (6) | 1.9% | 2.7% | 2.3% | 1.9% | 2.3% | ||||
| Allowance / 30 days PDL (5) | 0.81 | 0.91 | 1.04 | 0.81 | 1.04 | ||||
| Allowance / Total loans and leases | 2.9% | 3.5% | 4.4% | 2.9% | 4.4% | ||||
| Charge-offs / Average loans and leases (6) | 1.7% | 1.8% | 1.8% | 1.7% | 1.8% | ||||
| Total loans and leases, net / Total assets | 66.6% | 68.0% | 67.2% | 66.6% | 67.2% | ||||
| Deposits / Total loans and leases, net | 97.0% | 96.3% | 97.2% | 97.0% | 97.2% | ||||
| Equity / Assets | 10.4% | 10.9% | 10.4% | 10.4% | 10.4% | ||||
| Tangible equity ratio (7) | 7.4% | 7.9% | 7.4% | 7.4% | 7.4% | ||||
| Shares outstanding (EoP) | 22,281,017,159 | 22,281,017,159 | 22,281,017,159 | 22,281,017,159 | 22,281,017,159 | ||||
| Shares outstanding (Average) | 22,281,017,159 | 22,281,017,159 | 22,281,017,159 | 22,281,017,159 | 22,281,017,159 | ||||
| Common share price (EoP) | 1,165.0 | 1,300.0 | 1,160.0 | 1,165.0 | 1,160.0 | ||||
| Preferred share price (EoP) | 1,170.0 | 1,290.0 | 1,165.0 | 1,170.0 | 1,165.0 | ||||
| BV/ EoP shares in Ps. | 667.9 | 731.0 | 670.7 | 667.9 | 670.7 | ||||
| EPS | 26.3 | 20.9 | 26.8 | 26.3 | 26.8 | ||||
| P/E (8) | 11.1 | 15.4 | 10.9 | 11.1 | 10.9 | ||||
| P/BV (8) | 1.8 | 1.8 | 1.7 | 1.8 | 1.7 | ||||
(1) NIM is calculated as Net Interest Income divided by the average of Interest Earning Assets; (2) Efficiency Ratio is calculated as personnel plus administrative and other expenses divided by net interest income plus net trading income, other income and fees and other services income, net (excluding others); (3) ROAA is calculated as Income before Minority Interest divided by the average of total assets for each quarter; (4) ROAE is calculated as Net Income attributable to Grupo Aval?s shareholders divided by the average of shareholders´ attributable equity for each quarter; (5) Total loans excluding interbank and overnight funds and 30 days past due include interest accounts receivables; (6) Refers to average gross loans for the period; (7) Tangible Equity Ratio is calculated as Total Equity minus Intangibles (excluding those related to concessions) divided by Total Assets minus Intangibles (excluding those related to concessions); (8) Based on Preferred share prices.
| 3 | |
Statement of Financial Position Analysis
1. Assets
Total assets as of March 31st, 2018 totaled Ps 232,279.0 billion showing an increase of 2.3% versus March 31st, 2017, and decrease of 1.8% versus December 31st, 2017. Growth in assets was mainly driven by a 3.2% year over year growth in total loans and receivables, net to Ps 156,099.6 billion. When excluding FX movement in our Central American operation (“excluding FX”), asset growth would have been 3.3% versus March 31st, 2017 and 0.2% versus December 31st, 2017; for total loans and receivables, net growth would have been 4.3% versus March 31st, 2017 and -0.9% versus December 31st, 2017.
1.1 Loans and receivables
Total gross loans and receivables (excluding interbank and overnight funds) increased by 4.3% between March 31st, 2017 and March 31st, 2018 to Ps 157,037.7 billion (5.3% excluding FX) mainly driven by (i) a 8.3% increase in Mortgage and housing leases to Ps 15,824.7 billion (10.7% excluding FX), (ii) a 6.0% increase in Consumer loans and leases to Ps 49,675.0 billion (7.3% excluding FX), and (iii) a 2.7% increase in Commercial loans and leases to Ps 91,124.8 billion (3.4% excluding FX).
Interbank & overnight funds increased by 17.7% to Ps 6,000.5 billion (19.6% excluding FX) during the last twelve months.
Allowance for impairment of loans and receivables was Ps 6,938.6 billion as of March 31st, 2018 taking net loans and receivables to Ps 156,099.6 billion, 3.2% higher than in March 31st, 2017.
The increase in allowance for impairment of loans and receivables when compared to March 31st,2017 and December 31st, 2017 was mainly driven by the adoption of IFRS9 on January 1st, 2018.
| Total loans and receivables, net | 1Q17 | 4Q17 | 1Q18 | ∆ | |||||
| 1Q18 vs. 4Q17 | 1Q18 vs. 1Q17 | ||||||||
| Loans and receivables | |||||||||
| Commercial loans and leases | 88,730.3 | 92,149.8 | 91,124.8 | -1.1% | 2.7% | ||||
| Consumer loans and leases | 46,854.2 | 50,382.9 | 49,675.0 | -1.4% | 6.0% | ||||
| Mortgages and housing leases | 14,613.9 | 16,151.3 | 15,824.7 | -2.0% | 8.3% | ||||
| Microcredit loans and leases | 396.1 | 409.7 | 413.2 | 0.9% | 4.3% | ||||
| Loans and receivables | 150,594.5 | 159,093.7 | 157,037.7 | -1.3% | 4.3% | ||||
| Interbank & overnight funds | 5,099.3 | 7,279.0 | 6,000.5 | -17.6% | 17.7% | ||||
| Total loans and leases operations and receivables portfolio | 155,693.7 | 166,372.8 | 163,038.2 | -2.0% | 4.7% | ||||
| Allowance for impairment of loans and receivables | (4,389.7) | (5,618.5) | (6,938.6) | 23.5% | 58.1% | ||||
| Allowance for impairment of commercial loans | (2,072.7) | (2,928.5) | (3,401.7) | 16.2% | 64.1% | ||||
| Allowance for impairment of consumer loans | (2,119.7) | (2,461.9) | (3,228.1) | 31.1% | 52.3% | ||||
| Allowance for impairment of mortgages | (131.9) | (154.0) | (221.6) | 44.0% | 68.0% | ||||
| Allowance for impairment of microcredit loans | (65.4) | (74.2) | (87.2) | 17.6% | 33.5% | ||||
| Total loans and receivables, net | 151,304.0 | 160,754.3 | 156,099.6 | -2.9% | 3.2% | ||||
| 4 | |
The following table shows the gross loan composition per product of each of our loan categories.
| Gross loans | 1Q17 | 4Q17 | 1Q18 | ∆ | |||||
| 1Q18 vs. 4Q17 | 1Q18 vs. 1Q17 | ||||||||
| General purpose | 59,814.7 | 63,997.6 | 62,601.3 | -2.2% | 4.7% | ||||
| Working capital | 15,342.2 | 14,723.5 | 15,155.2 | 2.9% | -1.2% | ||||
| Financial leases | 9,918.5 | 9,892.4 | 9,677.3 | -2.2% | -2.4% | ||||
| Funded by development banks | 2,569.1 | 2,713.8 | 2,730.3 | 0.6% | 6.3% | ||||
| Overdrafts | 651.0 | 440.0 | 525.6 | 19.5% | -19.3% | ||||
| Credit cards | 434.8 | 382.6 | 435.2 | 13.7% | 0.1% | ||||
| Commercial loans and leases | 88,730.3 | 92,149.8 | 91,124.8 | -1.1% | 2.7% | ||||
| Personal loans | 28,700.9 | 30,709.4 | 30,849.1 | 0.5% | 7.5% | ||||
| Credit cards | 12,143.3 | 13,464.2 | 12,868.6 | -4.4% | 6.0% | ||||
| Automobile and vehicle | 5,702.0 | 5,896.6 | 5,651.0 | -4.2% | -0.9% | ||||
| Financial leases | 210.0 | 226.8 | 214.9 | -5.2% | 2.3% | ||||
| Overdrafts | 97.9 | 85.9 | 91.2 | 6.2% | -6.8% | ||||
| Other | 0.0 | 0.0 | 0.0 | -10.3% | -31.6% | ||||
| Consumer loans and leases | 46,854.2 | 50,382.9 | 49,675.0 | -1.4% | 6.0% | ||||
| Mortgages | 13,695.7 | 15,103.5 | 14,736.0 | -2.4% | 7.6% | ||||
| Housing leases | 918.2 | 1,047.8 | 1,088.6 | 3.9% | 18.6% | ||||
| Mortgages and housing leases | 14,613.9 | 16,151.3 | 15,824.7 | -2.0% | 8.3% | ||||
| Microcredit loans and leases | 396.1 | 409.7 | 413.2 | 0.9% | 4.3% | ||||
| Loans and receivables | 150,594.5 | 159,093.7 | 157,037.6 | -1.3% | 4.3% | ||||
| Interbank & overnight funds | 5,099.3 | 7,279.0 | 6,000.5 | -17.6% | 17.7% | ||||
| Total loans and leases operations and receivables portfolio | 155,693.7 | 166,372.8 | 163,038.1 | -2.0% | 4.7% | ||||
Over the last twelve months, personal loans and mortgages have driven our loan portfolio growth in accordance with our banks’ strategy.
In Colombia, loans and receivables increased by 4.5% during the last twelve months and 0.8% during the quarter. As for Central America, loans and receivables grew by 3.8% between March 31st, 2017 and March 31st, 2018 and decrease 6.4% in the last quarter; when excluding FX, growth would have been 7.7% and 0.4%, respectively.
Commercial loans grew by 2.7% between March 31st, 2017 and March 31st, 2018 and decrease 1.1% during the quarter. In Colombia, commercial loans grew by 2.0% between March 31st, 2017 and March 31st, 2018 and 0.3% in the quarter. As for Central America, commercial loans grew by 5.4% between March 31st, 2017 and March 31st, 2018 and decrease 6.4% in the quarter; when excluding FX, growth in Central America would have been 9.4% and 0.5%, respectively.
Consumer loans growth over the last year and quarter was mainly driven by personal loans and credit cards. In Colombia, personal loans grew by 9.3% during the last twelve months and 2.1% between December 31st, 2017 and March 31st, 2018, mainly in payroll lending. Growth of our Central American operations, excluding FX, was driven by credit cards, which grew 9.3% during the last twelve months and decreased 0.4% in the quarter, and personal loans, which grew 4.1% during last twelve months and 0.5% during the quarter.
| 5 | |
The following table shows the loans and receivables composition per entity. During the last twelve months, Banco Popular showed the highest growth rate within our banking operation in Colombia, driven by a strong performance in payroll loans which grew approximately 9.0% as compared to March 31st, 2017.
| Gross loans / Bank ($) | 1Q17 | 4Q17 | 1Q18 | D | |||||
| 1Q18 vs. 4Q17 | 1Q18 vs. 1Q17 | ||||||||
| Banco de Bogotá | 96,251.1 | 102,404.4 | 100,127.4 | -2.2% | 4.0% | ||||
| Domestic | 54,475.0 | 56,058.8 | 56,756.9 | 1.2% | 4.2% | ||||
| Central America | 41,776.1 | 46,345.5 | 43,370.5 | -6.4% | 3.8% | ||||
| Banco de Occidente | 27,159.4 | 27,132.0 | 26,809.4 | -1.2% | -1.3% | ||||
| Banco Popular | 16,441.3 | 17,690.2 | 18,319.2 | 3.6% | 11.4% | ||||
| Banco AV Villas | 9,238.4 | 10,131.9 | 10,166.5 | 0.3% | 10.0% | ||||
| Corficolombiana | 2,531.0 | 2,502.5 | 2,407.9 | -3.8% | -4.9% | ||||
| Eliminations | (1,026.7) | (767.3) | (792.8) | 3.3% | -22.8% | ||||
| Loans and receivables | 150,594.5 | 159,093.7 | 157,037.7 | -1.3% | 4.3% | ||||
| Interbank & overnight funds | 5,099.3 | 7,279.0 | 6,000.5 | -17.6% | 17.7% | ||||
| Total Grupo Aval | 155,693.7 | 166,372.8 | 163,038.2 | -2.0% | 4.7% | ||||
| Gross loans / Bank (%) | 1Q17 | 4Q17 | 1Q18 | |||
| Banco de Bogotá | 63.9% | 64.4% | 63.8% | |||
| Domestic | 36.2% | 35.2% | 36.1% | |||
| Central America | 27.7% | 29.1% | 27.6% | |||
| Banco de Occidente | 18.0% | 17.1% | 17.1% | |||
| Banco Popular | 10.9% | 11.1% | 11.7% | |||
| Banco AV Villas | 6.1% | 6.4% | 6.5% | |||
| Corficolombiana | 1.7% | 1.6% | 1.5% | |||
| Eliminations | -0.7% | -0.5% | -0.5% | |||
| Loans and receivables | 100% | 100% | 100% |
Of the total loans and receivables, 71.6% are domestic and 28.4% are foreign. In terms of gross loans (excluding interbank and overnight funds), 72.4% are domestic and 27.6% are foreign (reflecting the Central American operations). Total foreign gross loans grew 3.8% during the past 12 months and decreased 6.4% in the quarter. Excluding FX, yearly and quarterly growth for our Central American operations would have been 7.7% and 0.4%, respectively.
| Gross loans | 1Q17 | 4Q17 | 1Q18 | ∆ | |||||
| 1Q18 vs. 4Q17 | 1Q18 vs. 1Q17 | ||||||||
| Domestic | |||||||||
| Commercial loans and leases | 71,465.6 | 72,703.5 | 72,922.9 | 0.3% | 2.0% | ||||
| Consumer loans and leases | 31,067.2 | 32,911.6 | 33,375.5 | 1.4% | 7.4% | ||||
| Mortgages and housing leases | 5,889.6 | 6,723.4 | 6,955.5 | 3.5% | 18.1% | ||||
| Microcredit loans and leases | 396.1 | 409.7 | 413.2 | 0.9% | 4.3% | ||||
| Interbank & overnight funds | 2,900.4 | 4,739.9 | 3,062.8 | -35.4% | 5.6% | ||||
| Total domestic loans | 111,718.8 | 117,488.1 | 116,730.0 | -0.6% | 4.5% | ||||
| Foreign | |||||||||
| Commercial loans and leases | 17,264.7 | 19,446.3 | 18,201.9 | -6.4% | 5.4% | ||||
| Consumer loans and leases | 15,787.0 | 17,471.3 | 16,299.5 | -6.7% | 3.2% | ||||
| Mortgages and housing leases | 8,724.3 | 9,427.9 | 8,869.2 | -5.9% | 1.7% | ||||
| Microcredit loans and leases | - | - | - | - | - | ||||
| Interbank & overnight funds | 2,198.9 | 2,539.2 | 2,937.7 | 15.7% | 33.6% | ||||
| Total foreign loans | 43,974.9 | 48,884.7 | 46,308.2 | -5.3% | 5.3% | ||||
| Total loans and leases operations and receivables portfolio | 155,693.7 | 166,372.8 | 163,038.2 | -2.0% | 4.7% | ||||
| 6 | |
During last year the quality of our loan portfolio has evidenced a deterioration in line with a slower pace of the economy, a slight weakening in urban and national unemployment metrics and due to certain corporate exposures. Our 30 days PDL to total loans closed 1Q18 in 4.3%, compared to 3.9% in 4Q17 and 3.6% in 1Q17. The ratio of 90 days PDL to total loans was 2.9% for 1Q18, compared to 2.8% in 4Q17 and 2.2% in 1Q17. Finally, the ratio of CDE Loans to total loans was 6.6% in 1Q18, 6.1% in 4Q17 and 4.7% in 1Q17.
Commercial loans’ 30 days PDL ratio was 3.6% for 1Q18, 3.2% for 4Q17 and 2.9% for 1Q17; 90 days PDL ratio was 3.0%, 2.8% and 2.2%, respectively. Consumer loans’ 30 days PDL ratio was 5.4% for 1Q18, 5.1% for 4Q17 and 4.8% for 1Q17; 90 days PDL ratio was 2.8%, 2.8% and 2.3%, respectively. Mortgages’ 30 days PDL ratio was 4.1% for 1Q18, 3.8% for 4Q17 and 3.4% for 1Q17; 90 days PDL ratio was 2.1%, 2.1% and 1.7%, respectively.
| Total loans and leases operations and receivables portfolio | 1Q17 | 4Q17 | 1Q18 | ∆ | |||||
| 1Q18 vs. 4Q17 | 1Q18 vs. 1Q17 | ||||||||
| ''A'' normal risk | 138,124.7 | 145,155.6 | 141,800.8 | -2.3% | 2.7% | ||||
| ''B'' acceptable risk | 5,356.4 | 4,283.7 | 4,874.0 | 13.8% | -9.0% | ||||
| ''C'' appreciable risk | 3,745.5 | 4,695.5 | 5,130.0 | 9.3% | 37.0% | ||||
| ''D'' significant risk | 2,137.1 | 3,273.2 | 3,631.1 | 10.9% | 69.9% | ||||
| ''E'' unrecoverable | 1,230.8 | 1,685.8 | 1,601.7 | -5.0% | 30.1% | ||||
| Loans and receivables | 150,594.5 | 159,093.7 | 157,037.7 | -1.3% | 4.3% | ||||
| Interbank and overnight funds | 5,099.3 | 7,279.0 | 6,000.5 | -17.6% | 17.7% | ||||
| Total loans and leases operations and receivables portfolio | 155,693.7 | 166,372.8 | 163,038.2 | -2.0% | 4.7% | ||||
| CDE loans / Total loans (*) | 4.7% | 6.1% | 6.6% |
| Past due loans | 1Q17 | 4Q17 | 1Q18 | ∆ | |||||
| 1Q18 vs. 4Q17 | 1Q18 vs. 1Q17 | ||||||||
| Performing | 86,118.6 | 89,196.4 | 87,851.0 | -1.5% | 2.0% | ||||
| Between 31 and 90 days past due | 629.9 | 345.2 | 570.9 | 65.4% | -9.4% | ||||
| +90 days past due | 1,981.8 | 2,608.3 | 2,703.0 | 3.6% | 36.4% | ||||
| Commercial loans and leases | 88,730.3 | 92,149.8 | 91,124.8 | -1.1% | 2.7% | ||||
| Performing | 44,621.2 | 47,818.8 | 46,986.7 | -1.7% | 5.3% | ||||
| Between 31 and 90 days past due | 1,149.6 | 1,167.6 | 1,285.1 | 10.1% | 11.8% | ||||
| +90 days past due | 1,083.4 | 1,396.5 | 1,403.2 | 0.5% | 29.5% | ||||
| Consumer loans and leases | 46,854.2 | 50,382.9 | 49,675.0 | -1.4% | 6.0% | ||||
| Performing | 14,123.4 | 15,535.3 | 15,175.8 | -2.3% | 7.5% | ||||
| Between 31 and 90 days past due | 244.9 | 282.3 | 309.6 | 9.7% | 26.4% | ||||
| +90 days past due | 245.6 | 333.6 | 339.3 | 1.7% | 38.2% | ||||
| Mortgages and housing leases | 14,613.9 | 16,151.3 | 15,824.7 | -2.0% | 8.3% | ||||
| Performing | 338.8 | 347.9 | 349.4 | 0.4% | 3.1% | ||||
| Between 31 and 90 days past due | 17.6 | 18.2 | 18.2 | -0.1% | 3.7% | ||||
| +90 days past due | 39.7 | 43.6 | 45.5 | 4.5% | 14.7% | ||||
| Microcredit loans and leases | 396.1 | 409.7 | 413.2 | 0.9% | 4.3% | ||||
| Loans and receivables | 150,594.5 | 159,093.7 | 157,037.7 | -1.3% | 4.3% | ||||
| Interbank & overnight funds | 5,099.3 | 7,279.0 | 6,000.5 | -17.6% | 17.7% | ||||
| Allowance for impairment of commercial loans | 155,693.7 | 166,372.8 | 163,038.2 | -2.0% | 4.7% | ||||
| 30 Days PDL / Total loans (*) | 3.6% | 3.9% | 4.3% | |||
| 90 Days PDL / Total loans (*) | 2.2% | 2.8% | 2.9% |
(*) Total loans excluding interbank and overnight funds. 30 days past due and 90 days past due are calculated on a capital plus interest accounts receivable basis.
| 7 | |
Grupo Aval’s coverage over its 90 days PDL increased from 1.3x for 1Q17 and 4Q17 to 1.5x for 1Q18. Allowance to CDE Loans was 0.7x for 1Q18, 0.6x for 4Q17 and 1Q17, and allowance to 30 days PDL was 1.0x for 1Q18, 0.9x for 4Q17 and 0.8x for 1Q17. Impairment loss, net of recoveries of charged off assets to average total loans was 2.3% in 1Q18, 2.7% in 4Q17 and 1.9% in 1Q17. Charge-offs to average total loans was 1.8% in 1Q18 and 4Q17, and 1.7% in 1Q17.
| Total loans and leases operations and receivables portfolio | 1Q17 | 4Q17 | 1Q18 |
| Allowance for impairment / CDE loans | 0.6 | 0.6 | 0.7 | |||
| Allowance for impairment / 30 Days PDL | 0.8 | 0.9 | 1.0 | |||
| Allowance for impairment / 90 Days PDL | 1.3 | 1.3 | 1.5 | |||
| Allowance for impairment / Total loans (*) | 2.9% | 3.5% | 4.4% | |||
| Impairment loss / CDE loans | 0.4 | 0.5 | 0.4 | |||
| Impairment loss / 30 Days PDL | 0.6 | 0.7 | 0.6 | |||
| Impairment loss / 90 Days PDL | 0.9 | 1.0 | 0.9 | |||
| Impairment loss / Average total loans (*) | 2.1% | 2.9% | 2.5% | |||
| Impairment loss, net of recoveries of charged-off assets / Average total loans (*) | 1.9% | 2.7% | 2.3% | |||
| Charge-offs / Average total loans (*) | 1.7% | 1.8% | 1.8% |
(*) Total loans excluding interbank and overnight funds. 30 days past due and 90 days past due are calculated on a capital plus interest accounts receivable basis.
1.2 Financial assets held for investment
Total financial assets held for investment increased 9.2% to Ps 30,457.5 billion between March 31st, 2017 and March 31st, 2018, and by 5.3% versus December 31st, 2017. Ps 23,986.9 billion of our total gross portfolio is invested in debt securities, which increased by 6.1% between March 31st, 2017 and March 31st, 2018 and by 2.8% since December 31st, 2017. Ps 3,350.4 billion of our total gross investment securities is invested in equity securities, which increased by 31.6% between March 31st, 2017 and March 31st, 2018 and increased by 12.7% versus December 31st, 2017.
The average yield on our debt and equity investment securities (held for trading through profit or losses, available for sale, held to maturity and Interbank & Overnight funds) was 4.2% for 1Q18, 4.6% for 4Q17, compared to 5.5% in 1Q17.
| Financial assets held for investment | 1Q17 | 4Q17 | 1Q18 | ∆ | |||||
| 1Q18 vs. 4Q17 | 1Q18 vs. 1Q17 | ||||||||
| Debt securities | 2,651.1 | 2,650.5 | 2,574.3 | -2.9% | -2.9% | ||||
| Equity securities | 1,796.2 | 2,149.2 | 2,407.5 | 12.0% | 34.0% | ||||
| Derivative instruments | 615.7 | 328.4 | 787.1 | 139.7% | 27.8% | ||||
| Total financial assets held for trading through profit or losses | 5,063.0 | 5,128.1 | 5,768.9 | 12.5% | 13.9% | ||||
| Debt securities | 17,313.5 | 17,790.1 | 18,584.6 | 4.5% | 7.3% | ||||
| Equity securities | 750.2 | 824.0 | 942.9 | 14.4% | 25.7% | ||||
| Total available for sale financial assets | 18,063.6 | 18,614.2 | 19,527.5 | 4.9% | 8.1% | ||||
| Investments held to maturity | 2,636.8 | 2,899.0 | 2,827.9 | -2.5% | 7.2% | ||||
| Other financial assets at fair value through profit or loss | 2,117.7 | 2,282.6 | 2,334.6 | 2.3% | 10.2% | ||||
| Total financial assets held for investment | 27,881.2 | 28,923.9 | 30,457.5 | 5.3% | 9.2% | ||||
| 8 | |
1.3 Cash and Cash Equivalents
As of March 31st, 2018 cash and cash equivalents had a balance of Ps 21,687.7 billion showing decreases of 11.6% versus March 31st, 2017 and of 2.9% versus December 31st, 2017 (-10.5% and -0.1% excluding FX).
The ratio of cash and cash equivalents to deposits was 14.3% in March 31st, 2018, 14.4% in December 31st, 2017, and 14.9% in March 31st, 2017.
1.4 Goodwill and Other Intangibles
Goodwill and other intangibles as of December 31st, 2018 reached Ps 10,653.5 billion, increasing by 4.3% versus March 31st, 2017 and decreasing 1.9% versus December 31st, 2017.
Goodwill as of March 31st, 2018 was Ps 6,581.3 billion, decreasing by 0.9% versus March 31st, 2017 and decreasing 4.6% versus December 31th, 2017, explained by fluctuations in the exchange rate.
Other intangibles, which include “concession arrangement rights” and other intangibles, mainly reflect the value of road concessions recorded for the most part at Corficolombiana. Other intangibles as of March 31st, 2018 reached Ps 4,072.2 billion and grew by 14.0% versus March 31st, 2017 and 2.8% versus December 31st, 2017.
2. Liabilities
As of March 31st, 2018 funding represented 94.4% of total liabilities and other liabilities represented 5.6%.
2.1 Funding
Total Funding (Total Financial Liabilities at Amortized Cost) which includes (i) Deposits, (ii) Interbank borrowings and overnight funds, (iii) Borrowings from banks and others, (iv) Bonds, and (v) Borrowing from development entities had a balance of Ps 196.565.0 billion as of March 31st, 2018 showing an increase of 2.3% versus March 31st, 2017 and a decrease of 1.8% versus December 31st, 2017 (3.3% increase and 0.1% increase excluding FX). Total deposits represented 77.2% of total funding as of the end of 1Q18, 77.4% for 4Q17 and 76.4% for 1Q17.
Average cost of funds was 3.8% in 1Q18, 4.0% in 4Q17 and 4.6% in 1Q17. The decline in average cost of funds was a consequence of a declining interest rate scenario in Colombia.
| 9 | |
2.1.1 Deposits
| Deposits from clients at amortized cost | 1Q17 | 4Q17 | 1Q18 | ∆ | |||||
| 1Q18 vs. 4Q17 | 1Q18 vs. 1Q17 | ||||||||
| Checking accounts | 10,995.2 | 15,421.1 | 14,223.7 | -7.8% | 29.4% | ||||
| Other deposits | 579.0 | 472.8 | 530.5 | 12.2% | -8.4% | ||||
| Non-interest bearing | 11,574.3 | 15,893.9 | 14,754.2 | -7.2% | 27.5% | ||||
| Checking accounts | 22,567.6 | 20,596.5 | 20,283.6 | -1.5% | -10.1% | ||||
| Time deposits | 62,182.6 | 62,616.2 | 60,806.1 | -2.9% | -2.2% | ||||
| Savings deposits | 50,411.8 | 55,778.7 | 55,927.8 | 0.3% | 10.9% | ||||
| Interest bearing | 135,162.1 | 138,991.4 | 137,017.5 | -1.4% | 1.4% | ||||
| Deposits from clients at amortized cost | 146,736.3 | 154,885.2 | 151,771.6 | -2.0% | 3.4% | ||||
Of our total deposits as of March 31st, 2018 checking accounts represented 22.7%, time deposits 40.1%, savings accounts 36.8%, and other deposits 0.3%.
The following table shows the deposits composition by bank. During the last twelve months, Banco Popular showed the highest growth rate in deposits within our banking operation in Colombia.
| Deposits / Bank ($) | 1Q17 | 4Q17 | 1Q18 | ∆ | |||||
| 1Q18 vs. 4Q17 | 1Q18 vs. 1Q17 | ||||||||
| Banco de Bogotá | 95,809.9 | 100,947.2 | 97,258.2 | -3.7% | 1.5% | ||||
| Domestic | 55,965.4 | 56,548.8 | 54,586.4 | -3.5% | -2.5% | ||||
| Central America | 39,844.4 | 44,398.4 | 42,671.7 | -3.9% | 7.1% | ||||
| Banco de Occidente | 24,706.8 | 26,169.1 | 25,935.0 | -0.9% | 5.0% | ||||
| Banco Popular | 15,229.7 | 15,968.5 | 16,562.9 | 3.7% | 8.8% | ||||
| Banco AV Villas | 9,485.9 | 10,086.1 | 10,033.7 | -0.5% | 5.8% | ||||
| Corficolombiana | 3,971.8 | 4,095.7 | 4,295.6 | 4.9% | 8.2% | ||||
| Eliminations | (2,467.7) | (2,381.4) | (2,313.7) | -2.8% | -6.2% | ||||
| Total Grupo Aval | 146,736.3 | 154,885.2 | 151,771.6 | -2.0% | 3.4% | ||||
| Deposits / Bank (%) | 1Q17 | 4Q17 | 1Q18 | |||
| Banco de Bogotá | 65.3% | 65.2% | 64.1% | |||
| Domestic | 38.1% | 36.5% | 36.0% | |||
| Central America | 27.2% | 28.7% | 28.1% | |||
| Banco de Occidente | 16.8% | 16.9% | 17.1% | |||
| Banco Popular | 10.4% | 10.3% | 10.9% | |||
| Banco AV Villas | 6.5% | 6.5% | 6.6% | |||
| Corficolombiana | 2.7% | 2.6% | 2.8% | |||
| Eliminations | -1.7% | -1.5% | -1.5% | |||
| Total Grupo Aval | 100.0% | 100.0% | 100.0% |
| 10 | |
2.1.2 Borrowings from Banks and Other (includes borrowings from development entities)
As of March 31st, 2018 borrowings from banks and other totaled Ps 19,275.5 billion, showing decreases of 8.9% versus March 31st, 2017 and of 9.1% versus December 31st, 2017. Excluding FX, borrowings from banks and other decreased 7.3% versus March 31st, 2017 and 5.9% versus December 31st, 2017.
2.1.3 Bonds
Total bonds as of March 31st, 2018 totaled Ps 18,546.8 billion showing an increase of 14.0% versus March 31st, 2017 and an decrease of 2.9% versus December 31st, 2017. Excluding FX, bonds increased 14.3% versus March 31st, 2017 and decreased 2.5% versus December 31st, 2017.
3. Non-controlling Interest
Non-controlling Interest in Grupo Aval reflects: (i) the minority stakes that third party shareholders hold in each of its direct consolidated subsidiaries (Banco de Bogotá, Banco de Occidente, Banco Popular, Banco AV Villas and Corficolombiana), and (ii) the minority stakes that third party shareholders hold in the consolidated subsidiaries at the bank level (mainly Porvenir). As of March 31st, 2018 non-controlling interest was Ps 9,162.9 billion which increased by 3.8% versus March 31st, 2017 and decreased 4.4% versus December 31st, 2017. Total non-controlling interest remained stable during the last quarter representing 38.0% of total equity as March 31st, 2018. Total non-controlling interest derives from the sum of the combined minority interests of our banks and of Grupo Aval, applying eliminations associated with the consolidation process of Grupo Aval.
| Direct & indirect ownership of main subsidiaries | 1Q17 | 4Q17 | 1Q18 | ∆ | |||||
| 1Q18 vs. 4Q17 | 1Q18 vs. 1Q17 | ||||||||
| Banco de Bogotá | 68.7% | 68.7% | 68.7% | - | - | ||||
| Banco de Occidente | 72.3% | 72.3% | 72.3% | - | 0 | ||||
| Banco Popular | 93.7% | 93.7% | 93.7% | - | - | ||||
| Banco AV Villas | 79.9% | 79.9% | 79.9% | - | 0 | ||||
| BAC Credomatic(1) | 68.7% | 68.7% | 68.7% | - | - | ||||
| Porvenir(2) | 75.7% | 75.7% | 75.7% | - | - | ||||
| Corficolombiana(3) | 44.6% | 44.8% | 44.8% | - | 22 | ||||
(1) BAC Credomatic is fully owned by Banco de Bogotá; (2) Grupo Aval indirectly owns a 100% of Porvenir as follows: 20.0% in Grupo Aval, 46.9% in Banco de Bogotá and 33.1% in Banco de Occidente. Porvenir's results consolidate into Banco de Bogotá; (3) Grupo Aval increased its direct ownership in Corficolombiana mainly due to stock dividend distributions and/or acquisitions through open market transactions.
4. Attributable Shareholders’ Equity
Attributable shareholders’ equity as of March 31st, 2018 was Ps 14,944.9 billion, showing an increase of 0.4% versus March 31st, 2017 and a decrease of 8.2% versus December 31st, 2017.
| 11 | |
Income Statement Analysis
Our net income attributable to shareholders for 1Q18 of Ps 597.7 billion showed a 1.8% increase versus 1Q17 and a 28.1% increase versus 4Q17.
| Consolidated Statement of Income | 1Q17 | 4Q17 | 1Q18 | ∆ | |||||
| 1Q18 vs. 4Q17 | 1Q18 vs. 1Q17 | ||||||||
| Interest income | 4,728.9 | 4,622.8 | 4,589.2 | -0.7% | -3.0% | ||||
| Interest expense | 2,189.1 | 1,961.0 | 1,860.9 | -5.1% | -15.0% | ||||
| Net interest income | 2,539.8 | 2,661.8 | 2,728.3 | 2.5% | 7.4% | ||||
| Impairment loss on loans and accounts receivable | 791.3 | 1,125.9 | 984.3 | -12.6% | 24.4% | ||||
| Impairment loss on other financial assets | 0.0 | - | (50.6) | N.A | N.A | ||||
| Impairment loss on other assets | 6.5 | 156.0 | 5.9 | -96.2% | -8.8% | ||||
| Recovery of charged-off assets | (54.9) | (78.2) | (66.1) | -15.5% | 20.4% | ||||
| Impairment loss, net | 742.9 | 1,203.7 | 873.4 | -27.4% | 17.6% | ||||
| Net income from commissions and fees | 1,130.2 | 1,165.8 | 1,150.3 | -1.3% | 1.8% | ||||
| Net income from sales of goods and services to clients | 172.1 | 297.6 | 205.8 | -30.8% | 19.6% | ||||
| Net trading income | 32.2 | 178.8 | (90.3) | -150.5% | N.A | ||||
| Net income from financial instruments designated at fair value | 44.2 | 62.4 | 52.0 | -16.7% | 17.8% | ||||
| Total other income | 374.7 | 298.4 | 425.8 | 42.7% | 13.7% | ||||
| Total other expenses | 2,191.3 | 2,286.4 | 2,177.0 | -4.8% | -0.7% | ||||
| Income before income tax expense | 1,358.9 | 1,174.7 | 1,421.5 | 21.0% | 4.6% | ||||
| Income tax expense | 445.2 | 440.2 | 470.1 | 6.8% | 5.6% | ||||
| Income from continued operations | 913.7 | 734.6 | 951.3 | 29.5% | 4.1% | ||||
| Income from discontinued operations | - | - | - | N.A | N.A | ||||
| Net income before non-controlling interest | 913.7 | 734.6 | 951.3 | 29.5% | 4.1% | ||||
| Non-controlling interest | 326.7 | 267.9 | 353.6 | 32.0% | 8.2% | ||||
| Net income attributable to the owners of the parent company | 587.0 | 466.7 | 597.7 | 28.1% | 1.8% | ||||
1. Net Interest Income
| Net interest income | 1Q17 | 4Q17 | 1Q18 | ∆ | |||||
| 1Q18 vs. 4Q17 | 1Q18 vs. 1Q17 | ||||||||
| Interest income | |||||||||
| Commercial | 2,128.2 | 1,927.5 | 1,866.7 | -3.2% | -12.3% | ||||
| Interbank and overnight funds | 67.7 | 67.3 | 91.5 | 36.0% | 35.1% | ||||
| Consumer | 1,960.2 | 2,079.0 | 2,025.5 | -2.6% | 3.3% | ||||
| Mortgages and housing leases | 305.8 | 336.3 | 341.0 | 1.4% | 11.5% | ||||
| Microcredit | 29.1 | 29.4 | 29.6 | 0.5% | 1.6% | ||||
| Loan portfolio interest | 4,491.0 | 4,439.5 | 4,354.3 | -1.9% | -3.0% | ||||
| Interests on investments in debt securities | 238.0 | 183.3 | 234.9 | 28.2% | -1.3% | ||||
| Total interest income | 4,728.9 | 4,622.8 | 4,589.2 | -0.7% | -3.0% | ||||
| Interest expense | |||||||||
| Checking accounts | 86.8 | 72.8 | 80.6 | 10.8% | -7.1% | ||||
| Time deposits | 917.8 | 824.4 | 817.0 | -0.9% | -11.0% | ||||
| Savings deposits | 574.6 | 449.6 | 402.3 | -10.5% | -30.0% | ||||
| Total interest expenses on deposits | 1,579.2 | 1,346.8 | 1,299.9 | -3.5% | -17.7% | ||||
| Borrowings | 567.7 | 576.5 | 524.2 | -9.1% | -7.7% | ||||
| Interbank borrowings and overnight funds | 82.7 | 68.9 | 55.7 | -19.2% | -32.7% | ||||
| Borrowings from banks and others | 187.2 | 218.9 | 178.2 | -18.6% | -4.8% | ||||
| Bonds | 297.8 | 288.7 | 290.4 | 0.6% | -2.5% | ||||
| Borrowings from development entities | 42.2 | 37.7 | 36.8 | -2.4% | -12.9% | ||||
| Total interest expense | 2,189.1 | 1,961.0 | 1,860.9 | -5.1% | -15.0% | ||||
| Net interest income | 2,539.8 | 2,661.8 | 2,728.3 | 2.5% | 7.4% | ||||
| 12 | |
Our net interest income increased by 7.4% to Ps 2,728.3 billion for 1Q18 versus 1Q17 and increased by 2.5% versus 4Q17. The increase versus 1Q17 was derived from a 15.0% decrease in total interest expense and a 3.0% decrease in total interest income.
Our Net Interest Margin(1) was 5.8% for 1Q18, 5.9% for 4Q17 and 1Q17. Net Interest Margin on Loans was 6.9% for 1Q18, 7.0% for 4Q17 and 6.8% in 1Q17. On the other hand, our Net Investments Margin was 0.3% in 1Q18 versus 0.4% in 4Q17 and 0.6% in 1Q17.
In our Colombian operations, our Net Interest Margin was 5.6% for 1Q18, 4Q17, and 1Q17. Net Interest Margin on Loans was 6.8% for 1Q18, 6.7% for 4Q17, and 6.6% in 1Q17. On the other hand, our Net Investments Margin was 0.3% in 1Q18 versus 0.1% in 4Q17 and 0.1% in 1Q17.
In our Central American operations, our Net Interest Margin was 6.1% for 1Q18, 6.7% in 4Q17, and 6.6% in 1Q17. Net Interest Margin on Loans was 7.2% for 1Q18, 7.6% in 4Q17 and 7.4% in 1Q17. On the other hand, our Net Investments Margin was 0.0% in 1Q18 versus 1.2% in 4Q17 and 1.9% in 1Q17.
Our Net Interest Margin from our financial operation (excluding non-financial sector and holding company) was 5.9% in 1Q18, 6.1% in 4Q17 and 1Q17. Net Interest Margin on Loans from our financial operation (excluding non-financial sector and holding company) was 7.1% for 1Q18, 7.2% in 4Q17, and 7.1% in 1Q17.
2. Impairment loss on financial assets, net
Our impairment loss on financial assets, net increase by 17.6% to Ps 873.4 billion for 1Q18 versus 1Q17 and decreased by 27.4% versus 4Q17. The increase on impairment loss on loans and accounts receivable in 1Q18 versus 1Q17 was mainly driven by an increase on impairment losses on our commercial loan book. The decrease versus 4Q17 was mainly explained by lower provisions on Concesionaria Ruta del Sol (CRDS) and Electricaribe.
The decrease on impairment loss on other assets in 1Q18 is explained by the reversal of USD 17.3 million (Ps 49.4 billion) impairment, registered in 2Q16, due to the sale of our investments in OI and Telemar in 1Q18. This decrease was offset by a USD 17.7 million (Ps 50.5 billion) loss on sale on investments.
| Impairment loss, net | 1Q17 | 4Q17 | 1Q18 | ∆ | |||||
| 1Q18 vs. 4Q17 | 1Q18 vs. 1Q17 | ||||||||
| Impairment loss on loans and accounts receivable | 791.3 | 1,125.9 | 984.3 | -12.6% | 24.4% | ||||
| Recovery of charged-off assets | (54.9) | (78.2) | (66.1) | -15.5% | 20.4% | ||||
| Impairment loss on other financial assets | 0.0 | - | (50.6) | N.A | N.A | ||||
| Impairment loss on other assets | 6.5 | 156.0 | 5.9 | -96.2% | -8.8% | ||||
| Impairment loss, net | 742.9 | 1,203.7 | 873.4 | -27.4% | 17.6% | ||||
Our annualized gross cost of risk was 2.5% for 1Q18, 2.9% for 4Q17 and 2.1% for 1Q17. Net of recoveries of charged-off assets our ratio was 2.3% for 1Q18, 2.7% for 4Q17, and 1.9% for 1Q17.
(1)Grupo Aval’s NIM without income from investment securities held for trading through profit or loss was 5.9% for 1Q18, 5.8% for 4Q17 and 5.8% for 1Q17.
| 13 | |
3. Non-interest income
| Total non-interest income | 1Q17 | 4Q17 | 1Q18 | ∆ | |||||
| 1Q18 vs. 4Q17 | 1Q18 vs. 1Q17 | ||||||||
| Income from commissions and fees | |||||||||
| Banking fees (1) | 919.4 | 955.8 | 944.0 | -1.2% | 2.7% | ||||
| Trust and portfolio management activities | 76.8 | 83.9 | 76.9 | -8.4% | 0.2% | ||||
| Pension and severance fund management | 240.8 | 231.5 | 253.6 | 9.5% | 5.3% | ||||
| Bonded warehouse services | 44.3 | 41.3 | 37.3 | -9.6% | -15.6% | ||||
| Total income from commissions and fees | 1,281.2 | 1,312.5 | 1,311.8 | -0.1% | 2.4% | ||||
| Expenses for commissions and fees | 151.0 | 146.7 | 161.5 | 10.1% | 7.0% | ||||
| Net income from commissions and fees | 1,130.2 | 1,165.8 | 1,150.3 | -1.3% | 1.8% | ||||
| Income from sales of goods and services to clients | 1,359.4 | 1,529.8 | 1,433.2 | -6.3% | 5.4% | ||||
| Costs and expenses from sales of goods and services to clients | 1,187.3 | 1,232.2 | 1,227.4 | -0.4% | 3.4% | ||||
| Net income from sales of goods and services to clients (non-financial sector) | 172.1 | 297.6 | 205.8 | -30.8% | 19.6% | ||||
| Net trading income | 32.2 | 178.8 | (90.3) | -150.5% | N.A | ||||
| Net income from financial instruments designated at fair value | 44.2 | 62.4 | 52.0 | -16.7% | 17.8% | ||||
| Other income | |||||||||
| Foreign exchange gains (losses), net | 196.3 | 78.2 | 289.7 | N.A. | 47.6% | ||||
| Net gain on sale of investments | 3.8 | 23.4 | (43.6) | N.A | N.A | ||||
| Gain on the sale of non-current assets held for sale | 4.3 | 2.3 | 2.3 | -0.1% | -47.1% | ||||
| Income from non-consolidated investments(2) | 86.5 | 37.5 | 94.2 | 151.0% | 8.9% | ||||
| Net gains on asset valuations | (1.0) | 20.9 | 8.2 | -60.6% | N.A | ||||
| Other operating income | 84.8 | 136.1 | 75.0 | -44.9% | -11.6% | ||||
| Total other income | 374.7 | 298.4 | 425.8 | 42.7% | 13.7% | ||||
| Total non-interest income | 1,753.3 | 2,003.1 | 1,743.6 | -13.0% | -0.6% | ||||
(1)Includes commissions on banking services, office network services, credit and debit card fees, fees on drafts, checks and checkbooks and other fees
(2)Includes equity method and dividends
3.1 Net income from commissions and fees
Net Income from commissions and fees increased by 1.8% to Ps 1,150.3 billion for 1Q18 versus 1Q17 and decreased 1.3% in the quarter. Income from commissions and fees increased by 2.4% to Ps 1,311.8 billion in 1Q18 versus 1Q17 and decreased 0.1% in the quarter. Excluding FX, net income from commissions increased 2.7% and increased 0.7%, respectively. In Colombia, net income from commissions and fees decreased by 3.2% over the last year and increased 4.7% over the quarter. In Central America, net income from commissions and fees increased by 9.2% over the last year and decreased 8.3% over the quarter; excluding FX, net income increased by 11.6% and decreased 4.2% during the quarter.
3.2 Net income from sales of goods and services to clients (non-financial sector)
Income from non-financial sector, net increased by 19.6% to Ps 205.8 for 1Q18 versus 1Q17 and decreased 30.8% during the quarter.
| 14 | |
3.3 Net trading income
| Net trading income | 1Q17 | 4Q17 | 1Q18 | ∆ | |||||
| 1Q18 vs. 4Q17 | 1Q18 vs. 1Q17 | ||||||||
| Investments held for trading | 90.0 | 105.1 | 12.9 | -87.7% | -85.7% | ||||
| Trading derivatives | (114.8) | 6.9 | (152.1) | N.A | 32.5% | ||||
| Hedging activities | 57.0 | 66.8 | 48.8 | -26.8% | -14.3% | ||||
| Net trading income | 32.2 | 178.8 | (90.3) | -150.5% | N.A | ||||
3.4 Other income (expense)
Total other income (expense) for 1Q18 totaled Ps 425.8 billion increasing by 13.7% versus 1Q17 and increasing 42.7% versus 4Q17. The quarterly increase was mainly driven by higher income from foreign exchange gains, net.
4. Other expenses
Total other expenses for 1Q18 totaled Ps 2,177.0 billion decreasing by 0.7% versus 1Q17 and 4.8% versus 4Q17. Our efficiency ratio measured as operating expenses before depreciation and amortization (excluding wealth tax) to total income, was 45.9% in 1Q18, 46.3% in 4Q17 and 46.0% in 1Q17. The ratio of annualized operating expenses before depreciation and amortization (excluding wealth tax) as a percentage of average total assets was 3.4% in 1Q18, 3.6% in 4Q17 and 3.4% in 1Q17.
In Colombia, our efficiency ratio measured as operating expenses before depreciation and amortization (excluding wealth tax) to total income, was 42.9% in 1Q18 44.2% in 4Q17, and 42.7% in 1Q17. The ratio of annualized operating expenses before depreciation and amortization (excluding wealth tax) as a percentage of average total assets was 3.1% in 1Q18, 3.3% in 4Q17 and 3.1% in 1Q17.
In Central America, our efficiency ratio measured as operating expenses before depreciation and amortization to total income, was 52.5% in 1Q18, 50.5% in 4Q17 and 53.4% in 1Q17. The ratio of annualized operating expenses before depreciation and amortization as a percentage of average total assets was 4.3% in 1Q18, 4.4% in 4Q17 and 4.4% in 1Q17.
5. Non-controlling Interest
Non-controlling interest in Grupo Aval reflects: (i) the minority stakes that third party shareholders hold in each of its direct consolidated subsidiaries (Banco de Bogotá, Banco de Occidente, Banco Popular, Banco AV Villas and Corficolombiana), and (ii) the minority stakes that third party shareholders hold in the consolidated subsidiaries at the bank level (mainly Porvenir). For 1Q18, non-controlling interest in the income statement was Ps 353.6 billion, showing a 8.2% increase versus 1Q17 and 28.1% increase versus 4Q17. The ratio of non-controlling interest to income before non-controlling interest was 37.2% in 1Q18, 36.5% in 4Q17 and 35.8% in 1Q17.
| 15 | |
Information related to Grupo Aval’s consolidated financial statements by geography
| Grupo Aval Acciones y Valores S.A. - Colombian Operation | ||||||||||
| Financial Statements Under Full IFRS | ||||||||||
| Information in Ps. Billions | ||||||||||
| 1Q17 | 4Q17 | 1Q18 | ∆ | |||||||
| 1Q18 vs. 4Q17 | 1Q18 vs. 1Q17 | |||||||||
| Gross loans and receivables | 108,818.4 | 112,748.2 | 113,667.2 | 0.8% | 4.5% | |||||
| Total assets | 163,207.8 | 166,381.0 | 166,590.7 | 0.1% | 2.1% | |||||
| Deposits from clients at amortized cost | 106,891.9 | 110,486.8 | 109,099.9 | -1.3% | 2.1% | |||||
| Total liabilities | 149,774.3 | 151,862.0 | 152,897.5 | 0.7% | 2.1% | |||||
| Net income before non-controlling interest | 669.7 | 428.1 | 669.1 | 56.3% | -0.1% | |||||
| Net income attributable to the owners of the parent company | 419.3 | 256.1 | 403.7 | 57.7% | -3.7% | |||||
| YTD 2017 | YTD 2018 | ∆ | ||||||||
| 2018 vs. 2017 | ||||||||||
| Net income before non-controlling interest | 669.7 | 669.1 | -0.1% | |||||||
| A | Net income attributable to the owners of the parent company | 419.3 | 403.7 | -3.7% | ||||||
| Leasing Bogotá Panamá S.A.(1) | ||||||||||
| Financial Statements Under IFRS | ||||||||||
| Information in Ps. Billions | ||||||||||
| 1Q17 | 4Q17 | 1Q18 | ∆ | |||||||
| 1Q18 vs. 4Q17 | 1Q18 vs. 1Q17 | |||||||||
| Gross loans and receivables | 41,776.1 | 46,345.5 | 43,370.5 | -6.4% | 3.8% | |||||
| Total assets | 63,904.8 | 70,157.6 | 65,688.4 | -6.4% | 2.8% | |||||
| Deposits from clients at amortized cost | 39,844.4 | 44,398.4 | 42,671.7 | -3.9% | 7.1% | |||||
| Total liabilities | 53,632.9 | 58,805.3 | 55,273.8 | -6.0% | 3.1% | |||||
| Net income before non-controlling interest | 244.0 | 306.5 | 282.3 | -7.9% | 15.7% | |||||
| Net income attributable to the owners of the parent company | 167.7 | 210.6 | 194.0 | -7.9% | 15.7% | |||||
| YTD 2017 | YTD 2018 | ∆ | ||||||||
| 2018 vs. 2017 | ||||||||||
| Net income before non-controlling interest | 244.0 | 282.3 | 15.7% | |||||||
| B | Net income attributable to the owners of the parent company | 167.7 | 194.0 | 15.7% | ||||||
| A+B | Net income attributable to the owners of the parent company | 587.0 | 597.7 | 1.8% | ||||||
(1) Leasing Bogotá Panamá is the holding company that consolidates our Central American operations.
| 16 | |
Information related to Grupo Aval Acciones y Valores S.A. (Holding Company) and Grupo Aval Limited
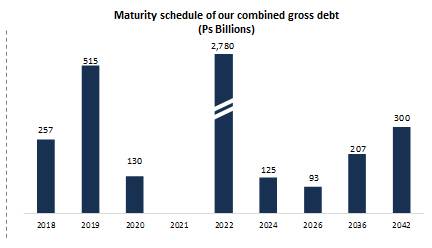
The holding company recorded a total gross indebtedness of Ps 1,651.9 billion (Ps 542.6 billion of bank debt and Ps 1,109.3 billion of bonds denominated in Colombian pesos) as of March 31st, 2018. It also guarantees irrevocably and unconditionally Grupo Aval Limited’s (144A / Reg S) 2022 (USD 1,000 million) bonds under its respective indentures. As of March 31st, 2018 the total amount outstanding (including interests payable) of such bonds was USD 1.0 billion, or Ps 2,781.9 billion when translated into pesos.
The debt at Grupo Aval Limited is serviced with interest income on loans to subsidiaries and cash & cash equivalents. Grupo Aval Limited has not required, to this date, cash from Grupo Aval Acciones y Valores S.A. to fulfill its obligations. The main sources of cash to pay the debt and debt service at Grupo Aval Acciones y Valores S.A. have been the dividend income from its subsidiaries and the returns on its cash & cash equivalents.
When combined, Grupo Aval Acciones y Valores S.A. and Grupo Aval Ltd. had Ps 1,711.6 billion of total liquid assets, a total gross indebtedness of Ps 4,417.1 billion and a net indebtedness (including callable senior loans to subsidiaries) of Ps 2,705.5 billion as of March 31st, 2018. In addition to liquid assets, Grupo Aval Ltd. has Ps 755.1 billion in other loans to subsidiaries.
| Total liquid assets as of March 31, 2018 | |
| Cash and cash equivalents | 534.3 |
| Fixed income investments | 114.6 |
| Callable Senior loans to subsidiaries | 1,062.7 |
| Total liquid assets | 1,71.6 |
 |
As of March 31st, 2018 our combined double leverage (calculated as investments in subsidiaries at book value, subordinated loans to subsidiaries and goodwill as a percentage of shareholders' equity) was 1.17x. Finally, we present an evolution of our key ratios on a combined basis:
| Debt service coverage and leverage ratios | 1Q17 | 4Q17 | 1Q18 | ∆ | |||||
| 1Q18 vs. 4Q17 | 1Q18 vs. 1Q17 | ||||||||
| Double leverage (1) | 1.17x | 1.16x | 1.17x | 0.01 | -0.01 | ||||
| Net debt / Core earnings (2)(3) | 3.4x | 2.7x | 2.6x | 0.0 | -0.7 | ||||
| Net debt / Cash dividends (2)(3) | 3.5x | 3.6x | 3.7x | 0.1 | 0.1 | ||||
| Core Earnings / Interest Expense (2) | 4.0x | 5.5x | 5.5x | 0.0 | 1.5 | ||||
(1) Double leverage is calculated as investments in subsidiaries at book value (excluding revaluations), subordinated loans to subsidiaries and goodwill as a percentage of shareholders' equity; (2) Core earnings are defined as annualized recurring cash flow from dividends, investments and net operating income; (3) Net debt is calculated as total gross debt minus cash and cash equivalents and fixed income investments
| 17 | |
ABOUT GRUPO AVAL
Grupo Aval is Colombia’s largest banking group, and through our BAC Credomatic operations it is also the largest and the most profitable banking group in Central America. Grupo Aval currently operates through four commercial banks in Colombia (Banco de Bogotá, Banco de Occidente, Banco Popular and Banco AV Villas). It manages pension and severance funds through the largest pension and severance fund manager in Colombia (Porvenir) and owns the largest merchant bank in Colombia (Corficolombiana), each of which Aval controls and consolidates into its results.
Investor Relations Contacts
Tatiana Uribe Benninghoff
Vice President of Financial Planning and Investor Relations
Tel: +571 241 9700 x3600
E-mail:turibe@grupoaval.com
Alejo Sánchez García
Financial Planning and Investor Relations Manager
Tel: +571 241 9700 x3600
E-mail:asanchez@grupoaval.com
| 18 | |
| Grupo Aval Acciones y Valores S.A. | |||||||||
| Consolidated Financial Statements Under IFRS | |||||||||
| Financial Statements Under IFRS | |||||||||
| Information in Ps. Billions | |||||||||
| Consolidated Statement of Financial Position | 1Q17 | 4Q17 | 1Q18 | ∆ | |||||
| 1Q18 vs. 4Q17 | 1Q18 vs. 1Q17 | ||||||||
| Cash and cash equivalents | 24,542.3 | 22,336.8 | 21,687.7 | -2.9% | -11.6% | ||||
| Financial assets held for investment | |||||||||
| Debt securities | 2,651.1 | 2,650.5 | 2,574.3 | -2.9% | -2.9% | ||||
| Equity securities | 1,796.2 | 2,149.2 | 2,407.5 | 12.0% | 34.0% | ||||
| Derivative instruments | 615.7 | 328.4 | 787.1 | 139.7% | 27.8% | ||||
| Total financial assets held for trading through profit or losses | 5,063.0 | 5,128.1 | 5,768.9 | 12.5% | 13.9% | ||||
| Debt securities | 17,313.5 | 17,790.1 | 18,584.6 | 4.5% | 7.3% | ||||
| Equity securities | 750.2 | 824.0 | 942.9 | 14.4% | 25.7% | ||||
| Total available for sale financial assets | 18,063.6 | 18,614.2 | 19,527.5 | 4.9% | 8.1% | ||||
| Investments held to maturity | 2,636.8 | 2,899.0 | 2,827.9 | -2.5% | 7.2% | ||||
| Other financial assets at fair value through profit or loss | 2,117.7 | 2,282.6 | 2,334.6 | 2.3% | 10.2% | ||||
| Total financial assets held for investment | 27,881.2 | 28,923.9 | 30,457.5 | 5.3% | 9.2% | ||||
| Loans and receivables | |||||||||
| Commercial loans and leases | 93,829.6 | 99,428.9 | 97,125.3 | -2.3% | 3.5% | ||||
| Commercial loans and leases | 88,730.3 | 92,149.8 | 91,124.8 | -1.1% | 2.7% | ||||
| Interbank & overnight funds | 5,099.3 | 7,279.0 | 6,000.5 | -17.6% | 17.7% | ||||
| Consumer loans and leases | 46,854.2 | 50,382.9 | 49,675.0 | -1.4% | 6.0% | ||||
| Mortgages and housing leases | 14,613.9 | 16,151.3 | 15,824.7 | -2.0% | 8.3% | ||||
| Microcredit loans and leases | 396.1 | 409.7 | 413.2 | 0.9% | 4.3% | ||||
| Total loans and leases operations and receivables portfolio | 155,693.7 | 166,372.8 | 163,038.2 | -2.0% | 4.7% | ||||
| Allowance for impairment of loans and receivables | (4,389.7) | (5,618.5) | (6,938.6) | 23.5% | 58.1% | ||||
| Total loans and receivables, net | 151,304.0 | 160,754.3 | 156,099.6 | -2.9% | 3.2% | ||||
| Other accounts receivable | 3,557.7 | 4,239.3 | 4,429.8 | 4.5% | 24.5% | ||||
| Hedging derivatives | 212.0 | 55.3 | 182.4 | N.A. | -14.0% | ||||
| Non-current assets held for sale | 240.9 | 101.4 | 89.5 | -11.7% | -62.9% | ||||
| Investments in associates and joint ventures | 1,134.5 | 1,043.0 | 942.4 | -9.6% | -16.9% | ||||
| Own-use property, plant and equipment, net | 5,738.0 | 5,800.0 | 5,576.4 | -3.9% | -2.8% | ||||
| Investment properties | 633.9 | 787.9 | 803.5 | 2.0% | 26.7% | ||||
| Biological assets | 59.0 | 66.1 | 69.5 | 5.1% | 17.9% | ||||
| Tangible assets | 6,430.9 | 6,654.0 | 6,449.4 | -3.1% | 0.3% | ||||
| Goodwill | 6,644.0 | 6,901.1 | 6,581.3 | -4.6% | -0.9% | ||||
| Concession arrangement rights | 2,816.2 | 3,114.2 | 3,221.3 | 3.4% | 14.4% | ||||
| Other intangible assets | 756.9 | 848.7 | 851.0 | 0.3% | 12.4% | ||||
| Intangible assets | 10,217.1 | 10,863.9 | 10,653.5 | -1.9% | 4.3% | ||||
| Current | 865.8 | 907.5 | 677.4 | -25.4% | -21.8% | ||||
| Deferred | 144.4 | 139.4 | 193.5 | 38.8% | 34.0% | ||||
| Income tax assets | 1,010.2 | 1,046.9 | 870.9 | -16.8% | -13.8% | ||||
| Other assets | 581.8 | 519.8 | 416.4 | -19.9% | -28.4% | ||||
| Total assets | 227,112.6 | 236,538.5 | 232,279.0 | -1.8% | 2.3% | ||||
| Derivative instruments held for trading | 581.6 | 298.7 | 754.8 | 152.7% | 29.8% | ||||
| Total financial liabilities held for trading | 581.6 | 298.7 | 754.8 | 152.7% | 29.8% | ||||
| Deposits from clients at amortized cost | 146,736.3 | 154,885.2 | 151,771.6 | -2.0% | 3.4% | ||||
| Checking accounts | 33,562.8 | 36,017.6 | 34,507.3 | -4.2% | 2.8% | ||||
| Time deposits | 62,182.6 | 62,616.2 | 60,806.1 | -2.9% | -2.2% | ||||
| Savings deposits | 50,411.8 | 55,778.7 | 55,927.8 | 0.3% | 10.9% | ||||
| Other deposits | 579.0 | 472.8 | 530.5 | 12.2% | -8.4% | ||||
| Financial obligations | 42,628.7 | 42,277.9 | 41,797.6 | -1.1% | -1.9% | ||||
| Interbank borrowings and overnight funds | 7,984.8 | 4,970.4 | 6,971.1 | 40.3% | -12.7% | ||||
| Borrowings from banks and others | 18,368.5 | 18,205.3 | 16,279.8 | -10.6% | -11.4% | ||||
| Bonds | 16,275.4 | 19,102.2 | 18,546.8 | -2.9% | 14.0% | ||||
| Borrowings from development entities | 2,790.1 | 2,998.1 | 2,995.8 | -0.1% | 7.4% | ||||
| Total financial liabilities at amortized cost | 192,155.2 | 200,161.3 | 196,565.0 | -1.8% | 2.3% | ||||
| Hedging derivatives | 37.6 | 13.5 | 33.8 | 151.3% | -9.9% | ||||
| Litigation | 157.8 | 165.4 | 163.8 | -0.9% | 3.8% | ||||
| Other provisions | 483.4 | 527.3 | 568.4 | 7.8% | 17.6% | ||||
| Provisions | 641.2 | 692.6 | 732.2 | 5.7% | 14.2% | ||||
| Current | 712.2 | 330.8 | 398.2 | 20.4% | -44.1% | ||||
| Deferred | 1,466.0 | 1,696.8 | 1,816.1 | 7.0% | 23.9% | ||||
| Income tax liabilities | 2,178.2 | 2,027.7 | 2,214.3 | 9.2% | 1.7% | ||||
| Employee benefits | 1,132.1 | 1,238.2 | 1,232.4 | -0.5% | 8.9% | ||||
| Other liabilities | 6,681.3 | 6,235.5 | 6,638.8 | 6.5% | -0.6% | ||||
| Total liabilities | 203,407.2 | 210,667.3 | 208,171.3 | -1.2% | 2.3% | ||||
| Equity attributable to owners of the parent company | 14,881.8 | 16,287.0 | 14,944.9 | -8.2% | 0.4% | ||||
| Non-controlling interests | 8,823.6 | 9,584.2 | 9,162.9 | -4.4% | 3.8% | ||||
| Total equity | 23,705.4 | 25,871.2 | 24,107.7 | -6.8% | 1.7% | ||||
| Total liabilities and equity | 227,112.6 | 236,538.5 | 232,279.0 | -1.8% | 2.3% | ||||
| 19 | |
| Grupo Aval Acciones y Valores S.A. |
| Consolidated Financial Statements Under IFRS |
| Financial Statements Under IFRS |
| Information in Ps. Billions |
| Consolidated Statement of Income | 1Q17 | 4Q17 | 1Q18 | ∆ | |||||
| 1Q18 vs. 4Q17 | 1Q18 vs. 1Q17 | ||||||||
| Interest income | |||||||||
| Loan portfolio interest | 4,491.0 | 4,439.5 | 4,354.3 | -1.9% | -3.0% | ||||
| Interests on investments in debt securities | 238.0 | 183.3 | 234.9 | 28.2% | -1.3% | ||||
| Total interest income | 4,728.9 | 4,622.8 | 4,589.2 | -0.7% | -3.0% | ||||
| Interest expense | |||||||||
| Checking accounts | 86.8 | 72.8 | 80.6 | 10.8% | -7.1% | ||||
| Time deposits | 917.8 | 824.4 | 817.0 | -0.9% | -11.0% | ||||
| Savings deposits | 574.6 | 449.6 | 402.3 | -10.5% | -30.0% | ||||
| Total interest expenses on deposits | 1,579.2 | 1,346.8 | 1,299.9 | -3.5% | -17.7% | ||||
| Borrowings | 567.7 | 576.5 | 524.2 | -9.1% | -7.7% | ||||
| Interbank borrowings and overnight funds | 82.7 | 68.9 | 55.7 | -19.2% | -32.7% | ||||
| Borrowings from banks and others | 187.2 | 218.9 | 178.2 | -18.6% | -4.8% | ||||
| Bonds | 297.8 | 288.7 | 290.4 | 0.6% | -2.5% | ||||
| Borrowings from development entities | 42.2 | 37.7 | 36.8 | -2.4% | -12.9% | ||||
| Total interest expense | 2,189.1 | 1,961.0 | 1,860.9 | -5.1% | -15.0% | ||||
| Net interest income | 2,539.8 | 2,661.8 | 2,728.3 | 2.5% | 7.4% | ||||
| Impairment loss | |||||||||
| Impairment loss on loans and accounts receivable | 791.3 | 1,125.9 | 984.3 | -12.6% | 24.4% | ||||
| Impairment loss on other financial assets | 0.0 | - | (50.6) | N.A | N.A | ||||
| Impairment loss on other assets | 6.5 | 156.0 | 5.9 | -96.2% | -8.8% | ||||
| Recovery of charged-off assets | (54.9) | (78.2) | (66.1) | -15.5% | 20.4% | ||||
| Impairment loss, net | 742.9 | 1,203.7 | 873.4 | -27.4% | 17.6% | ||||
| Net interest income, after impairment loss | 1,796.9 | 1,458.1 | 1,854.9 | 27.2% | 3.2% | ||||
| Income from commissions and fees | |||||||||
| Banking fees(1) | 919.4 | 955.8 | 944.0 | -1.2% | 2.7% | ||||
| Trust and portfolio management activities | 76.8 | 83.9 | 76.9 | -8.4% | 0.2% | ||||
| Pension and severance fund management | 240.8 | 231.5 | 253.6 | 9.5% | 5.3% | ||||
| Bonded warehouse services | 44.3 | 41.3 | 37.3 | -9.6% | -15.6% | ||||
| Total income from commissions and fees | 1,281.2 | �� 1,312.5 | 1,311.8 | -0.1% | 2.4% | ||||
| Expenses for commissions and fees | 151.0 | 146.7 | 161.5 | 10.1% | 7.0% | ||||
| Net income from commissions and fees | 1,130.2 | 1,165.8 | 1,150.3 | -1.3% | 1.8% | ||||
| Income from sales of goods and services to clients | 1,359.4 | 1,529.8 | 1,433.2 | -6.3% | 5.4% | ||||
| Costs and expenses from sales of goods and services to clients | 1,187.3 | 1,232.2 | 1,227.4 | -0.4% | 3.4% | ||||
| Net income from sales of goods and services to clients (non-financial sector) | 172.1 | 297.6 | 205.8 | ||||||
| Net trading income | 32.2 | 178.8 | (90.3) | -150.5% | N.A | ||||
| Net income from financial instruments designated at fair value | 44.2 | 62.4 | 52.0 | -16.7% | 17.8% | ||||
| Other income | |||||||||
| Foreign exchange gains (losses), net | 196.3 | 78.2 | 289.7 | N.A. | 47.6% | ||||
| Net gain on sale of investments | 3.8 | 23.4 | (43.6) | N.A | N.A | ||||
| Gain on the sale of non-current assets held for sale | 4.3 | 2.3 | 2.3 | -0.1% | -47.1% | ||||
| Income from non-consolidated investments(2) | 86.5 | 37.5 | 94.2 | 151.0% | 8.9% | ||||
| Net gains on asset valuations | (1.0) | 20.9 | 8.2 | -60.6% | N.A | ||||
| Other operating income | 84.8 | 136.1 | 75.0 | -44.9% | -11.6% | ||||
| Total other income | 374.7 | 298.4 | 425.8 | 42.7% | 13.7% | ||||
| Other expenses | |||||||||
| Loss on the sale of non-current assets held for sale | 4.1 | 1.4 | 0.2 | -84.7% | -94.6% | ||||
| Personnel expenses | 895.6 | 929.5 | 924.1 | -0.6% | 3.2% | ||||
| General and administrative expenses | 1,142.5 | 1,165.1 | 1,094.8 | -6.0% | -4.2% | ||||
| Depreciation and amortization | 127.9 | 135.7 | 131.7 | -2.9% | 2.9% | ||||
| Other operating expenses | 21.1 | 54.7 | 26.2 | -52.2% | 23.7% | ||||
| Total other expenses | 2,191.3 | 2,286.4 | 2,177.0 | -4.8% | -0.7% | ||||
| Income before income tax expense | 1,358.9 | 1,174.7 | 1,421.5 | 21.0% | 4.6% | ||||
| Income tax expense | 445.2 | 440.2 | 470.1 | 6.8% | 5.6% | ||||
| Income from continued operations | 913.7 | 734.6 | 951.3 | 29.5% | 4.1% | ||||
| Income from discontinued operations | - | - | - | - | - | ||||
| Net income before non-controlling interest | 913.7 | 734.6 | 951.3 | 29.5% | 4.1% | ||||
| Non-controlling interest | 326.7 | 267.9 | 353.6 | 32.0% | 8.2% | ||||
| Net income attributable to the owners of the parent company | 587.0 | 466.7 | 597.7 | 28.1% | 1.8% | ||||
(1)Includes commissions on banking services, office network services, credit and debit card fees, fees on drafts, checks and checkbooks and other fees
(2)Includes equity method and dividends
| 20 | |
Item 2

1 IFRS 1Q18 Consolidated Earnings Results
2 Disclaimer Grupo Aval Acciones y Valores S.A. (“ Grupo Aval”) is an issuer of securities in Colombia and in the United States, registered with Colombia’s National Registry of Share s and Issuers ( Registro Nacional de Valores y Emisores ) and the United States Securities and Exchange Commission (“SEC”). As such, it is subject to the control of the Superintendency of Finance and compliance with applicable U.S. securities regulation as a “foreign private issuer” under Rule 405 of the U.S. S ecurities Act of 1933. All of our banking subsidiaries (Banco de Bogotá, Banco de Occidente , Banco Popular and Banco AV Villas), Porvenir and Corficolombiana , are subject to inspection and surveillance as financial institutions by the Superintendency of Finance. Although we are not a financial institution, as a result of the enactment of Law 1870 of 2017, also known as Law of Financial Conglomerates, starting on 2018, Grupo Aval will be subject to the supervision and regulation of the Superintendency of Finance. Grupo Aval, as the holding company of its financial conglomerate will become responsible for the compliance with capital adequacy requiremen ts, corporate governance standards, financial risk management and internal control framework and criteria for identifying, managing and revealing conflicts of in ter est, applicable to its financial conglomerate . The unaudited consolidated financial information included in this document is presented in accordance with IFRS as currently iss ued by the IASB. Details of the calculations of non - GAAP measures such as ROAA and ROAE, among others, are explained when required in this report. The results for 1Q2018 are not comparable to previous quarters due to the prospective adoption in Colombia of IFRS 9 and IFRS 15 starting in January 1, 2018. This report may include forward - looking statements, which actual results may vary from those stated herein as a consequence of c hanges in general, economic and business conditions, changes in interest and currency rates and other risks factors as evidenced in our Form 20 - F available at t he SEC webpage. Recipients of this document are responsible for the assessment and use of the information provided herein. Grupo Aval will not have any obligation to update the information herein and shall not be responsible for any decision taken by investors in connection with this document. The content of this document a nd the unaudited figures included herein are not intended to provide full disclosure on Grupo Aval or its affiliates. When applicable, in this document we refer to billions as thousands of millions.
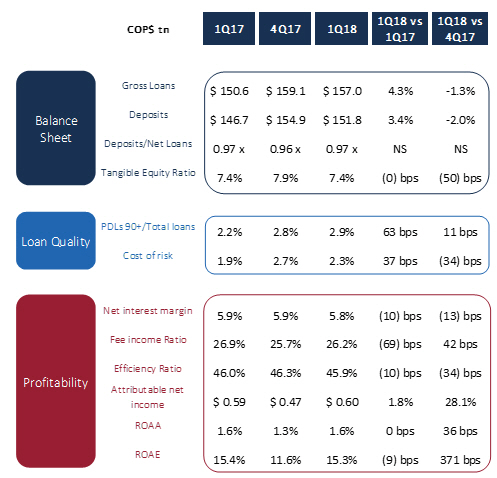
3 • Slow loan growth continued during 1Q2018 across all loan categories, but mainly in corporate loans. It is expected that growth recovery will gain momentum in 2H2018 due to positive macro trends and less political and fiscal uncertainty. • The 1Q2018 Tangible Equity Ratio reflects the one - time adjustment due to the adoption of IFRS 9 and a seasonal annual impact due to shareholders Dz dividends. • 30 days PDL and 90 day NPL were 4.25% and 2.86% for the quarter. On a positive note, for the third consecutive quarter the amount of new loans becoming 90 days past due decreased suggesting the end of the cycle might be near. • Cost of risk for the quarter was 2.3%, including 24 bps of impact due to specific large corporate exposures (primarily Electricaribe ). • NIM during 1Q2018 showed resilience with a consolidated decline of only 10 bps versus 1Q2017 . • Fee income ratio continued to hold at 26% for the quarter with pension and banking fees growing at a similar pace than consolidated assets. • Improvement in the efficiency ratio shows the results of the continuous effort on cost control initiatives which will remain in effect in a scenario of low growth. • Net income for the quarter was $598 billion or Ps 26.8 per share and ROAE for the quarter was 15.3%. Consolidated key results for the quarter Gross loans e xcludes interbank and overnight funds. Tangible Capital Ratio is calculated as Total Equity minus Goodwill and other Intangibles divided by Total Assets minus Goodwill and other Intangibles . PDLs 90+ defined as loans more than 90 days past due. Net Interest Margin includes net interest income plus net trading income from investment securities held for trading through profit or loss divided by tot al average interest - earning assets. Fee income ratio is calculated fee net income divided by net interest income plus net trading income, other income and fees and other services income, net (excluding others). Efficiency Ratio is calculated as personnel plus administrative and other expenses excluding wealth tax divided by net interest income plus ne t t rading income, other income and fees and other services income, net (excluding others). ROAA is calculated as annualized Net Income divided by average of total assets. ROA E is calculated as Net Income attributable to Aval's shareholders divided by average attributable shareholders' equity . NS refers to non - significant figures COP$ tn 1Q17 4Q17 1Q18 1Q18 vs 1Q17 1Q18 vs 4Q17 Gross Loans $ 150.6 $ 159.1 $ 157.0 4.3% -1.3% Deposits $ 146.7 $ 154.9 $ 151.8 3.4% -2.0% Deposits/Net Loans 0.97 x 0.96 x 0.97 x NS NS Tangible Equity Ratio 7.4% 7.9% 7.4% (0) bps (50) bps PDLs 90+/Total loans 2.2% 2.8% 2.9% 63 bps 11 bps Cost of risk 1.9% 2.7% 2.3% 37 bps (34) bps Net interest margin 5.9% 5.9% 5.8% (10) bps (13) bps Fee income Ratio 26.9% 25.7% 26.2% (69) bps 42 bps Efficiency Ratio 46.0% 46.3% 45.9% (10) bps (34) bps Attributable net income $ 0.59 $ 0.47 $ 0.60 1.8% 28.1% ROAA 1.6% 1.3% 1.6% 0 bps 36 bps ROAE 15.4% 11.6% 15.3% (9) bps 371 bps Balance Sheet Loan Quality Profitability

4 Key results per region for the quarter 72% of Assets 28% of Assets COP $ tn ( 1 ) Central America refers to Leasing Bogotá Panamá operation expressed in Colombian Pesos, at the exchange rate of each period . ( 2 ) Attributable net income for Grupo Aval of Ps 597 . 7 bn for 2018 corresponds to the Ps 403 . 7 bn of our Colombian operation plus Ps 282 . 2 bn of our Central American operation multiplied by 68 . 7 % , our stake in Banco de Bogotá . Gross loans e xcludes interbank and overnight funds . Tangible Capital Ratio is calculated as Total Equity minus Goodwill and other Intangibles divided by Total Assets minus Goodwill and other Intangibles . PDLs 90 + defined as loans more than 90 days past due . Net Interest Margin includes net interest income plus net trading income from investment securities held for trading through profit or loss divided by total average interest - earning assets . Fee income ratio is calculated fee net income divided by net interest income plus net trading income, other income and fees and other services income, net (excluding others) . Efficiency Ratio is calculated as personnel plus administrative and other expenses excluding wealth tax divided by net interest income plus net trading income, other income and fees and other services income, net (excluding others) . ROAA is calculated as annualized Net Income divided by average of total assets . ROA E is calculated as Net Income attributable to Aval's shareholders divided by average attributable shareholders' equity . NS refers to non - significant figures . Colombia Central America (1) (2) 1Q17 4Q17 1Q18 1Q18 vs 1Q17 1Q18 vs 4Q17 1Q17 4Q17 1Q18 1Q18 vs 1Q17 1Q18 vs 4Q17 Gross Loans $ 108.8 $ 112.7 $ 113.7 4.5% 0.8% $ 41.8 $ 46.3 $ 43.4 3.8% -6.4% Deposits $ 106.9 $ 110.5 $ 109.1 2.1% -1.3% $ 39.8 $ 44.4 $ 42.7 7.1% -3.9% Deposits/Net Loans 0.99 x 0.98 x 0.98 x NS NS 0.92 x 0.92 x 0.95 x 0.03 x 0.02 x Tangible Equity Ratio 6.7% 7.1% 6.6% (11) bps (52) bps 9.4% 10.0% 9.7% 24 bps (31) bps PDLs 90+/Total loans 2.7% 3.4% 3.5% 85 bps 13 bps 1.1% 1.2% 1.1% 5 bps (8) bps Cost of risk 2.0% 2.9% 2.5% 55 bps (40) bps 1.9% 2.0% 1.8% (7) bps (21) bps Net interest margin 5.6% 5.6% 5.6% 6 bps 5 bps 6.6% 6.7% 6.1% (52) bps (61) bps Fee income Ratio 23.3% 20.6% 21.6% (171) bps 104 bps 34.6% 36.2% 36.2% 151 bps (5) bps Efficiency Ratio 42.7% 44.2% 42.9% 24 bps (126) bps 53.4% 50.5% 52.5% (85) bps 206 bps Attributable net income $ 0.42 $ 0.26 $ 0.40 -3.7% 57.7% $ 0.24 $ 0.31 $ 0.28 15.7% -7.9% ROAA 1.7% 1.0% 1.6% (5) bps 57 bps 1.5% 1.8% 1.7% 15 bps (14) bps ROAE 20.6% 12.1% 19.8% (79) bps 772 bps 9.4% 11.0% 10.4% 95 bps (64) bps Balance Sheet Loan Quality Profitability
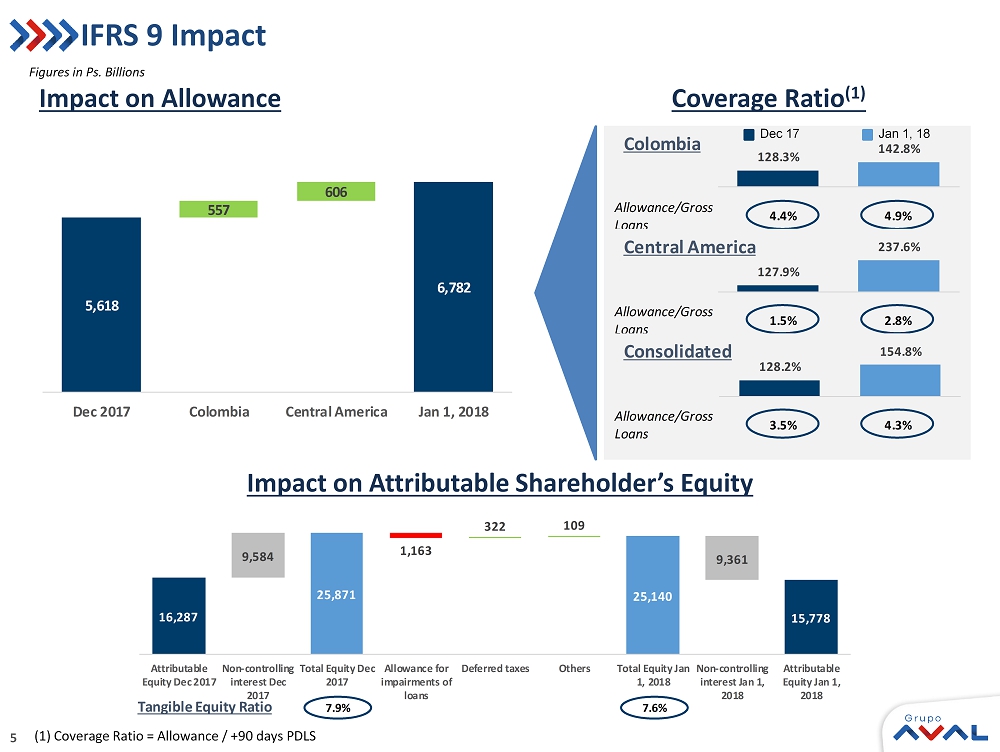
5 IFRS 9 Impact Figures in Ps. Billions Impact on Allowance 128.3% 142.8% Allowance/Gross Loans Colombia 4.4% 4.9% 127.9% 237.6% Allowance/Gross Loans Central America 1.5% 2.8% 128.2% 154.8% Allowance/Gross Loans Consolidated 3.5% 4.3% Coverage Ratio (1) Impact on Attributable Shareholder’s Equity 16,287 25,871 25,140 15,778 9,584 1,163 322 109 9,361 Attributable Equity Dec 2017 Non-controlling interest Dec 2017 Total Equity Dec 2017 Allowance for impairments of loans Deferred taxes Others Total Equity Jan 1, 2018 Non-controlling interest Jan 1, 2018 Attributable Equity Jan 1, 2018 Tangible Equity Ratio 7.6% 7.9% 5,618 6,782 557 606 Dec 2017 Colombia Central America Jan 1, 2018 Jan 1, 18 Dec 17 ( 1 ) Coverage Ratio = Allowance / + 90 days PDLS
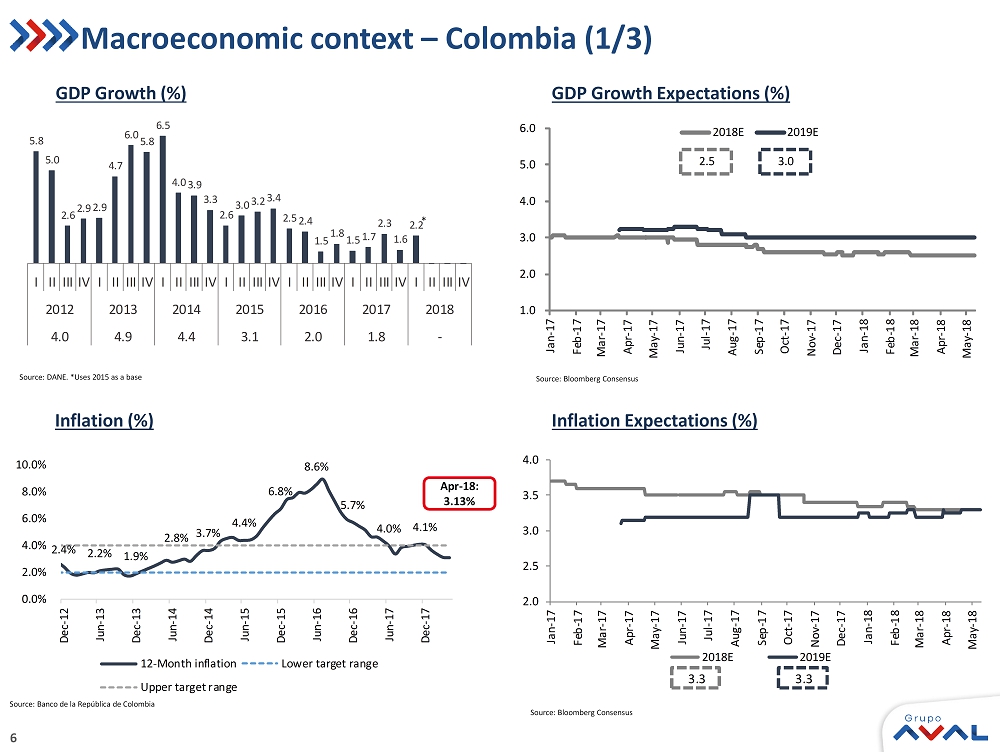
6 1.0 2.0 3.0 4.0 5.0 6.0 Jan-17 Feb-17 Mar-17 Apr-17 May-17 Jun-17 Jul-17 Aug-17 Sep-17 Oct-17 Nov-17 Dec-17 Jan-18 Feb-18 Mar-18 Apr-18 May-18 2018E 2019E 2.5 3.0 GDP Growth Expectations (%) Source: Bloomberg Consensus Inflation Expectations (%) Macroeconomic context – Colombia (1/3) Source: Bloomberg Consensus 2.0 2.5 3.0 3.5 4.0 Jan-17 Feb-17 Mar-17 Apr-17 May-17 Jun-17 Jul-17 Aug-17 Sep-17 Oct-17 Nov-17 Dec-17 Jan-18 Feb-18 Mar-18 Apr-18 May-18 2018E 2019E 3.3 3.3 Inflation (%) Source: Banco de la República de Colombia Apr - 18: 3.13% 2.4% 2.2% 1.9% 2.8% 3.7% 4.4% 6.8% 8.6% 5.7% 4.0% 4.1% 0.0% 2.0% 4.0% 6.0% 8.0% 10.0% Dec-12 Jun-13 Dec-13 Jun-14 Dec-14 Jun-15 Dec-15 Jun-16 Dec-16 Jun-17 Dec-17 12-Month inflation Lower target range Upper target range 5.8 5.0 2.6 2.9 2.9 4.7 6.0 5.8 6.5 4.0 3.9 3.3 2.6 3.0 3.2 3.4 2.5 2.4 1.5 1.8 1.5 1.7 2.3 1.6 2.2 I II III IV I II III IV I II III IV I II III IV I II III IV I II III IV I II III IV 2012 2013 2014 2015 2016 2017 2018 4.0 4.9 4.4 3.1 2.0 1.8 - GDP Growth (%) Source: DANE. *Uses 2015 as a base *

7 3.13% 4.25% 2.2% 0% 3% 5% 8% 10% 4Q12 2Q13 4Q13 2Q14 4Q14 2Q15 4Q15 2Q16 4Q16 2Q17 4Q17 may-18 Real GDP growth Inflation Colombian Central Bank's Interest rate 2% 4% 6% 8% Dec-12 Jun-13 Dec-13 Jun-14 Dec-14 Jun-15 Dec-15 Jun-16 Dec-16 Jun-17 Dec-17 Colombian Central Bank's Interest rate (EoP) DTF(1) IBR(2) 4.69% 4.25% 4.06% Central Bank’s Monetary Policy Source: Banco de la República de Colombia Source : Banrep . ( 1 ) End of period DTF rate ( 2 ) End of period 3 - month interbank (IBR) rate Source: Banco de la República de Colombia and DANE. Macroeconomic context – Colombia (2/3) 2014: 4.4% 2015: 3.1% 2016: 2.0% 2013: 4.9% 2012: 4.0% FY GDP May - 18 2017: 1.8% Unemployment (%) 10.4% 9.6% 9.1% 8.9% 9.2% 9.4% 9.4% 11.2% 10.6% 9.9% 9.8% 10.0% 10.6% 10.7% 2012 2013 2014 2015 2016 2017 Mar-18* Average national unemployment Average urban unemployment

8 (2.3) (2.2) (2.2) (1.9) (1.9) (1.8) (1.6) (1.3) (1.0) (1.0) (2.2) (2.4) (3.0) (4.0) (3.6) (3.1) (2.4) (2.2) (1.8) (1.5) (1.3) (1.2) (1.1) (1.1) (1.0) 2014 2015 2016 2017 2018 2019 2020 2021 2022 2023 2024 2025 2026 2027 Fiscal deficit as defined per fiscal rule Current and projected fiscal deficit (April 2018) Current and projected fiscal deficit (MFMP* 2017) Source: Bloomberg and DANE Source: Banrep . Colombian Peso vs WTI US$/barrel Macroeconomic context – Colombia ( 3 / 3 ) 1,700 2,200 2,700 3,200 3,700 20 40 60 80 100 120 Jan-16 Feb-16 Mar-16 Apr-16 May-16 Jun-16 Jul-16 Aug-16 Sep-16 Oct-16 Nov-16 Dec-16 Jan-17 Feb-17 Mar-17 Apr-17 May-17 Jun-17 Jul-17 Aug-17 Sep-17 Oct-17 Nov-17 Dec-17 Jan-18 Feb-18 Mar-18 Apr-18 May-18 WTI (US$ - Lhs) COP Exchange Rate Source: Ministry of Finance. (0.5%) (2.2%) (8.0%) (6.0%) (4.0%) (2.0%) 0.0% 2.0% 4.0% Dec-12 Mar-13 Jun-13 Sep-13 Dec-13 Mar-14 Jun-14 Sep-14 Dec-14 Mar-15 Jun-15 Sep-15 Dec-15 Mar-16 Jun-16 Sep-16 Dec-16 Mar-17 Jun-17 Sep-17 Dec-17 Trade balance Current Account Deficit Current Account (% GDP, quarterly) Current and Projected Fiscal Deficit - Fiscal Rule (% of GDP) 2014: 52.2% 2015: 39.6% 2016: 33.9% 2013: 54.4% 2012 : 51.4 % 2017: 34.5% Oil Exports/Total Exports Colombian Peso Exchange Rate 1Q17 4Q17 1Q18 1Q18 vs. 1Q17 1Q18 vs. 4Q17 End of Period 2,885.6 2,984.0 2,780.5 (3.6%) (6.8%) Quarter Average 2,924.3 2,985.9 2,860.3 (2.2%) (4.2%) FY16 FY17 (3.3%)(1.5%) (4.3%)(3.3%)

9 3.9% 5.6% 4.4% 3.8% 3.5% 3.8% 2.2% Central America* Panama Nicaragua Costa Rica Guatemala Honduras El Salvador Macroeconomic context – Central America Growth Outlook – Real GDP CAGR ’16 – ’19E Inflation per Country Central Banks ’ Interest Rates Source: Bloomberg CR : Costa Rica, ES: el Salvador, GU: Guatemala, HO: Honduras, NI: Nicaragua, PA: Panamá Source: IMF WEO Oct - 17; (*) Aggregate growth of all the Central American countries Source : SECMCA Source : SECMCA. CR : Costa Rica, ES: el Salvador, GU: Guatemala, HO: Honduras, NI: Nicaragua, PA: Panama (2.0%) (1.0%) 0.0% 1.0% 2.0% 3.0% 4.0% 5.0% 6.0% 7.0% Jan-16 Feb-16 Mar-16 Apr-16 May-16 Jun-16 Jul-16 Aug-16 Sep-16 Oct-16 Nov-16 Dec-16 Jan-17 Feb-17 Mar-17 Apr-17 May-17 Jun-17 Jul-17 Aug-17 Sep-17 Oct-17 Nov-17 Dec-17 Jan-18 Feb-18 Mar-18 CR ES GU HO NI PA Cenam 4.8% 4.4% 4.1% 0.6% 2.6% 0.9% 3.9% 0% 1% 2% 3% 4% 5% 6% 7% Jan-16 Feb-16 Mar-16 Apr-16 May-16 Jun-16 Jul-16 Aug-16 Sep-16 Oct-16 Nov-16 Dec-16 Jan-17 Feb-17 Mar-17 Apr-17 May-17 Jun-17 Jul-17 Aug-17 Sep-17 Oct-17 Nov-17 Dec-17 Jan-18 Feb-18 Mar-18 Apr-18 May-18 CR GU HO 5.50% 5.00% 2.75% 85.0 95.0 105.0 115.0 Jan-16 Feb-16 Mar-16 Apr-16 May-16 Jun-16 Jul-16 Aug-16 Sep-16 Oct-16 Nov-16 Dec-16 Jan-17 Feb-17 Mar-17 Apr-17 May-17 Jun-17 Jul-17 Aug-17 Sep-17 Oct-17 Nov-17 Dec-17 Jan-18 Feb-18 Mar-18 Apr-18 May-18 Colón-CR Quetzal-GU Lempira-HO Córdoba-NI TRM 88.7 105.9 112.4 97.2 105.5 Regional Exchange rates
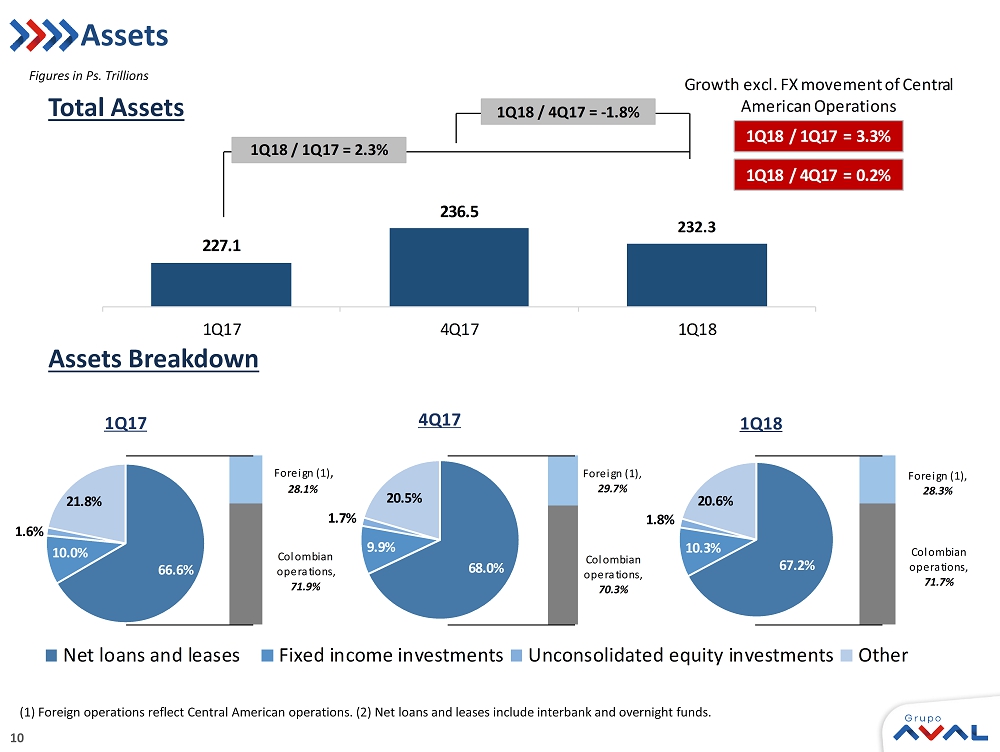
10 Assets Assets Breakdown Total Assets Figures in Ps. Trillions (1) Foreign operations reflect Central American operations. (2) Net loans and leases include interbank and overnight funds. 227.1 236.5 232.3 1Q17 4Q17 1Q18 1Q18 / 1Q17 = 2.3% 1Q18 / 4Q17 = - 1.8% 1Q18 / 1Q17 = 3.3% 1Q18 / 4Q17 = 0.2% Growth excl. FX movement of Central American Operations 66.6% 10.0% 1.6% Net loans and leases Fixed income investments Unconsolidated equity investments Other 66.6% 10.0% 1.6% 21.8% 1Q17 67.2% 10.3% 1.8% 20.6% 1Q18 Colombian operations , 71.9% Foreign (1) , 28.1% Colombian operations , 70.3% Foreign (1) , 29.7% Colombian operations , 71.7% Foreign (1) , 28.3% 68.0% 9.9% 1.7% 20.5% 4Q17
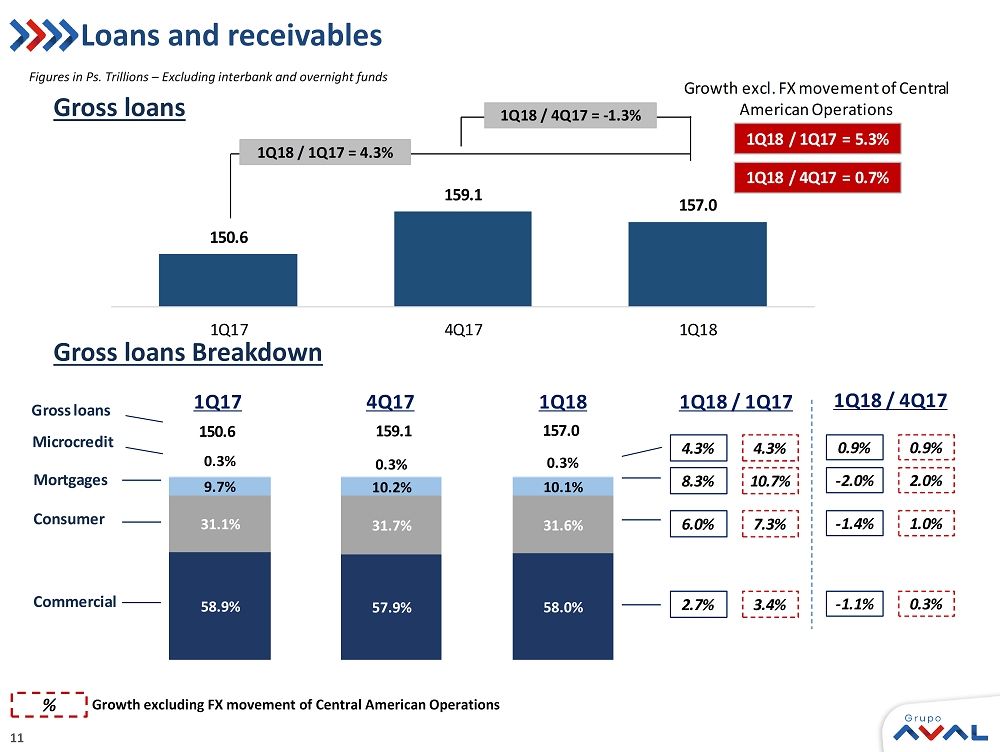
11 150.6 159.1 157.0 1Q17 4Q17 1Q18 1Q18 / 1Q17 = 4.3% 1Q18 / 4Q17 = - 1.3% 1Q18 / 1Q17 = 5.3% 1Q18 / 4Q17 = 0.7% Growth excl. FX movement of Central American Operations 58.9% 57.9% 58.0% 31.1% 31.7% 31.6% 9.7% 10.2% 10.1% 0.3% 0.3% 0.3% Commercial Consumer Mortgages Microcredit 2.7% 6.0% 8.3% 4.3% 3.4% 7.3% 10.7% 4.3% 1Q18 / 1Q17 1Q17 4Q17 1Q18 150.6 159.1 157.0 Gross loans 1Q18 / 4Q17 - 1.1% - 1.4% - 2.0% 0.9% 0.3% 1.0% 2.0% 0.9% Loans and receivables Gross loans Gross loans Breakdown Figures in Ps. Trillions – Excluding interbank and overnight funds % Growth excluding FX movement of Central American Operations
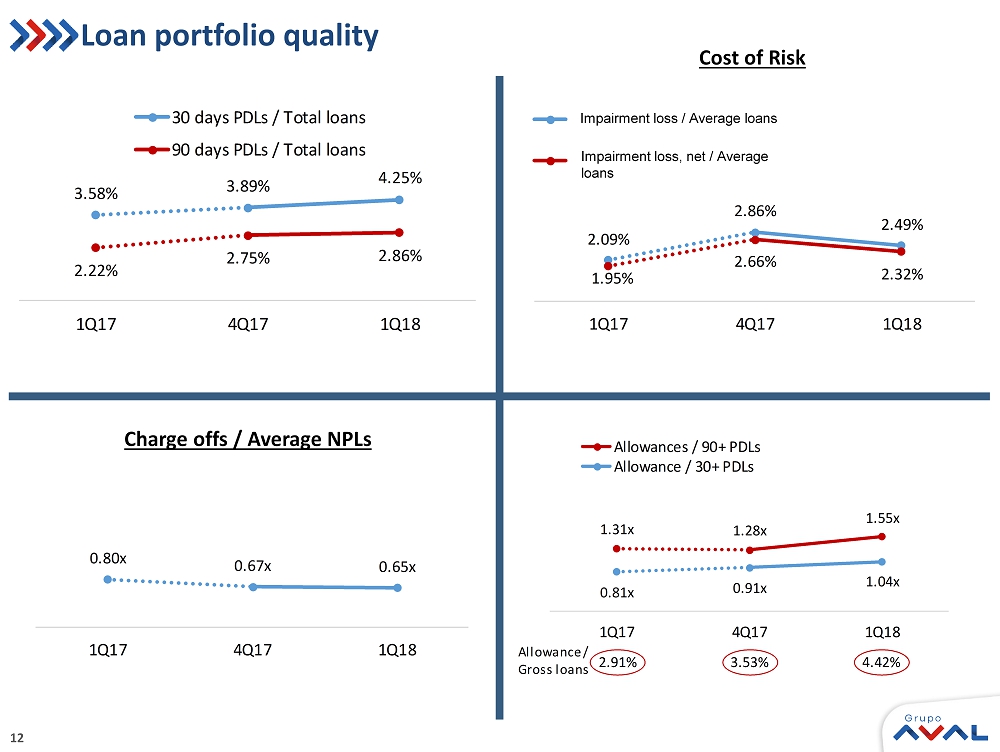
12 2.09% 2.86% 2.49% 1.95% 2.66% 2.32% 1Q17 4Q17 1Q18 Impairment loss / Average loans Impairment loss (net of recoveries of charged-off assets) / Average loans Loan portfolio quality Charge offs / Average NPLs Impairment loss / Average loans Impairment loss , net / Average loans Cost of Risk 3.58% 3.89% 4.25% 2.22% 2.75% 2.86% 1Q17 4Q17 1Q18 30 days PDLs / Total loans 90 days PDLs / Total loans 0.80x 0.67x 0.65x 1Q17 4Q17 1Q18 2.91% 1.31x 1.28x 1.55x 0.81x 0.91x 1.04x 1Q17 4Q17 1Q18 Allowances / 90+ PDLs Allowance / 30+ PDLs 3.53% 4.42% Allowance / Gross loans
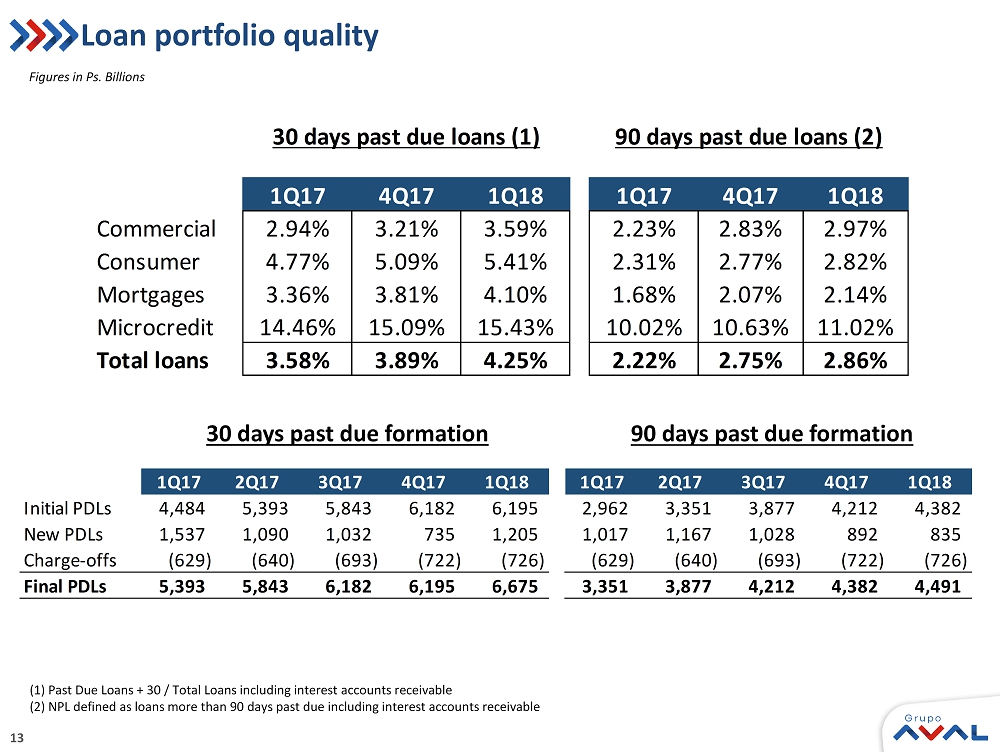
13 Loan portfolio quality 1Q17 4Q17 1Q18 1Q17 4Q17 1Q18 Commercial 2.94% 3.21% 3.59% 2.23% 2.83% 2.97% Consumer 4.77% 5.09% 5.41% 2.31% 2.77% 2.82% Mortgages 3.36% 3.81% 4.10% 1.68% 2.07% 2.14% Microcredit 14.46% 15.09% 15.43% 10.02% 10.63% 11.02% Total loans 3.58% 3.89% 4.25% 2.22% 2.75% 2.86% 30 days past due loans (1) 90 days past due loans (2) (1) Past Due Loans + 30 / Total Loans including interest accounts receivable (2) NPL defined as loans more than 90 days past due including interest accounts receivable Figures in Ps. Billions 30 days past due formation 1Q17 2Q17 3Q17 4Q17 1Q18 Initial PDLs 4,484 5,393 5,843 6,182 6,195 New PDLs 1,537 1,090 1,032 735 1,205 Charge-offs (629) (640) (693) (722) (726) Final PDLs 5,393 5,843 6,182 6,195 6,675 1Q17 2Q17 3Q17 4Q17 1Q18 2,962 3,351 3,877 4,212 4,382 1,017 1,167 1,028 892 835 (629) (640) (693) (722) (726) 3,351 3,877 4,212 4,382 4,491 9 0 days past due formation
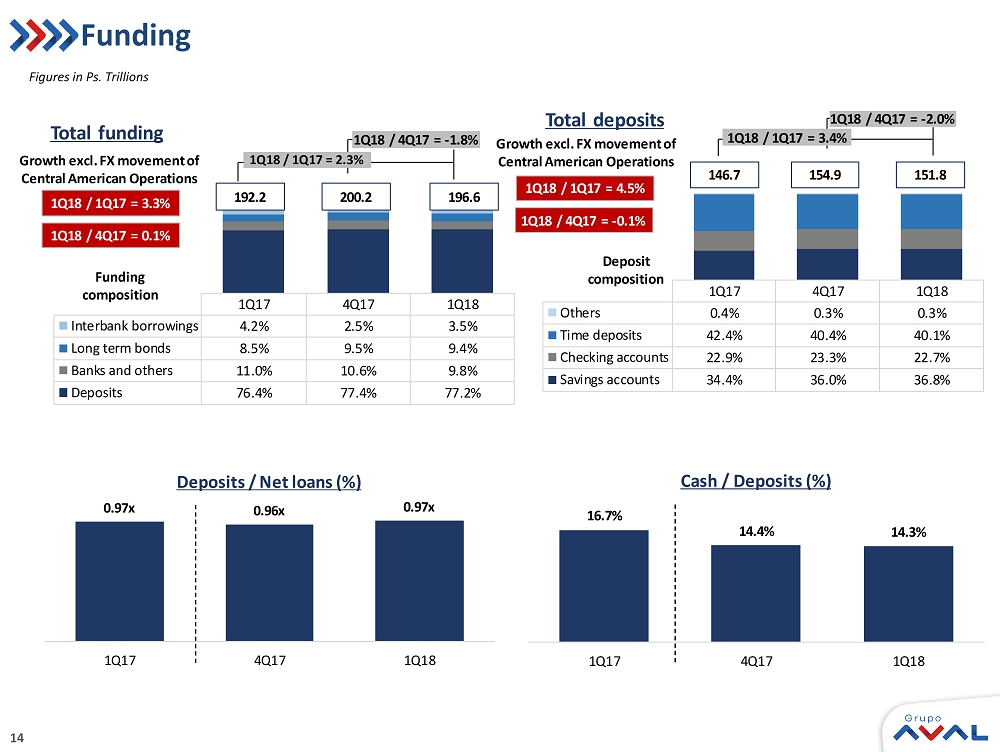
14 Funding Figures in Ps. Trillions 1Q17 4Q17 1Q18 Others 0.4% 0.3% 0.3% Time deposits 42.4% 40.4% 40.1% Checking accounts 22.9% 23.3% 22.7% Savings accounts 34.4% 36.0% 36.8% Total deposits 1Q18 / 1Q17 = 3.4% 1Q18 / 4Q17 = - 2.0% 146.7 154.9 151.8 Deposit composition 1Q18 / 1Q17 = 4.5% 1Q18 / 4Q17 = - 0.1% Growth excl. FX movement of Central American Operations 1Q17 4Q17 1Q18 Interbank borrowings 4.2% 2.5% 3.5% Long term bonds 8.5% 9.5% 9.4% Banks and others 11.0% 10.6% 9.8% Deposits 76.4% 77.4% 77.2% Total funding 192.2 200.2 196.6 Funding composition 1Q18 / 1Q17 = 2.3% 1Q18 / 4Q17 = - 1.8% 1Q18 / 1Q17 = 3.3% 1Q18 / 4Q17 = 0.1% Growth excl. FX movement of Central American Operations 0.97x 0.96x 0.97x 1Q17 4Q17 1Q18 Deposits / Net loans (%) 16.7% 14.4% 14.3% 1Q17 4Q17 1Q18 Cash / Deposits (%)

15 Capital Attributable Shareholders Equity Attributable Equity + Minority Interest Figures in Ps. Trillions Consolidated Capital Adequacy of our Banks (%) 1Q17 4Q17 1Q18 Minority interest 8.8 9.6 9.2 Attributable equity 14.9 16.3 14.9 1Q18 / 1Q17 = 1.7% 1Q18 / 4Q17 = - 6.8% 23.7 25.9 24.1 14.9 16.3 14.9 1Q17 4Q17 1Q18 Attributable shareholders equity 1Q18 / 4Q17 = - 8.2% 1Q18 / 1Q17 = 0.4% Total equity / Assets Tangible capital ratio (1) 10.4% 10.9% 10.4% 7.4% 7.9% 7.4% (1) Tangible Capital Ratio is calculated as Total Equity minus Goodwill and other Intangibles divided by Total Assets minus Goodwill and o the r Intangibles. 1Q174Q171Q18 1Q174Q171Q18 1Q174Q171Q18 1Q174Q171Q18 Primary capital (Tier 1) 9.2 8.8 9.0 10.6 10.5 10.5 9.5 8.9 8.5 11.3 10.9 11.0 Solvency Ratio 13.9 13.5 12.8 12.9 13.4 13.1 11.3 10.5 10.1 12.4 12.3 12.0

16 7.2% 7.2% 7.1% 7.1% 7.1% 7.0% 6.0% 6.5% 7.0% 7.5% 1Q17 4Q17 1Q18 Financial Sector Consolidated NIM – Net Interest Margin ( 1 / 2 ) Average Yield on Loans Average Cost of Funds Average Spread (Yield on Loans – Cost of Funds) 11.6% 11.0% 10.7% 11.7% 11.1% 10.8% 10.0% 11.0% 12.0% 1Q17 4Q17 1Q18 4.5% 3.9% 3.6% 6.8% 6.6% 6.1% 4.6% 4.0% 3.8% 1Q17 4Q17 1Q18
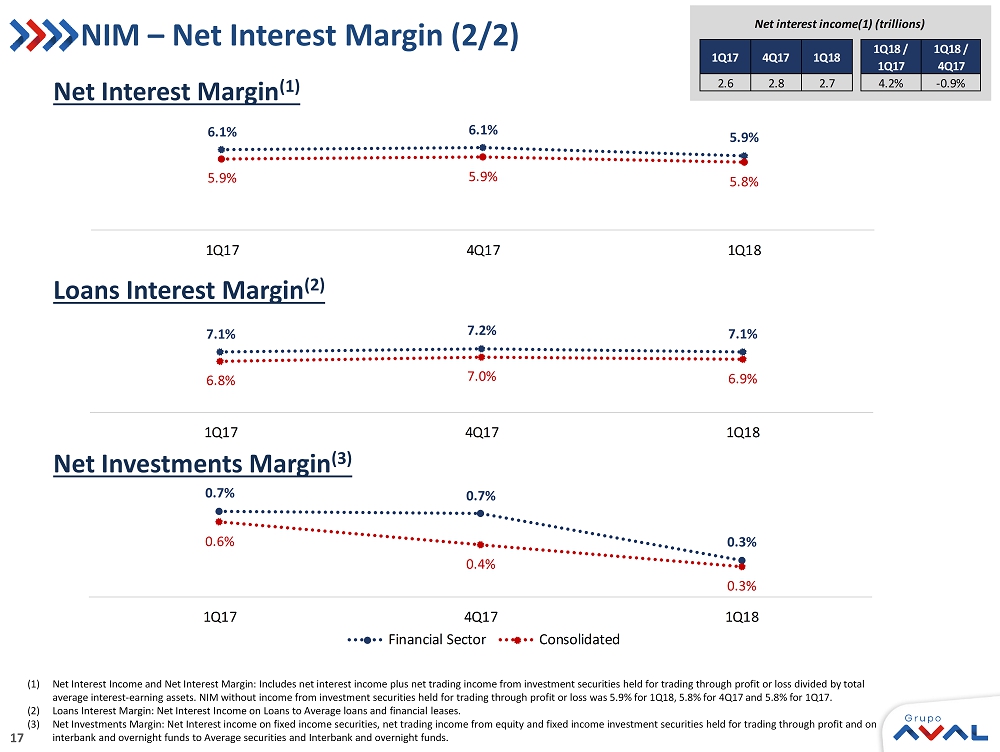
17 NIM – Net Interest Margin (2/2) Net Interest Margin (1) Loans Interest Margin (2) Net Investments Margin ( 3 ) 1Q17 4Q17 1Q18 1Q18 / 1Q17 1Q18 / 4Q17 2.6 2.8 2.7 4.2% -0.9% Net interest income(1) (trillions) (1) Net Interest Income and Net Interest Margin: Includes net interest income plus net trading income from investment securities held for trading through profit or loss divided by total average interest - earning assets. NIM without income from investment securities held for trading through profit or loss was 5.9% for 1Q18, 5.8% for 4Q17 and 5.8% for 1Q17. (2) Loans Interest Margin: Net Interest Income on Loans to Average loans and financial leases. (3) Net Investments Margin: Net Interest income on fixed income securities, net trading income from equity and fixed income investment securities held for trading through profit and on interbank and overnight funds to Average securities and Interbank and overnight funds. 7.1% 7.2% 7.1% 6.8% 7.0% 6.9% 1Q17 4Q17 1Q18 0.7% 0.7% 0.3% 0.6% 0.4% 0.3% 1Q17 4Q17 1Q18 Financial Sector Consolidated 6.1% 6.1% 5.9% 5.9% 5.9% 5.8% 1Q17 4Q17 1Q18
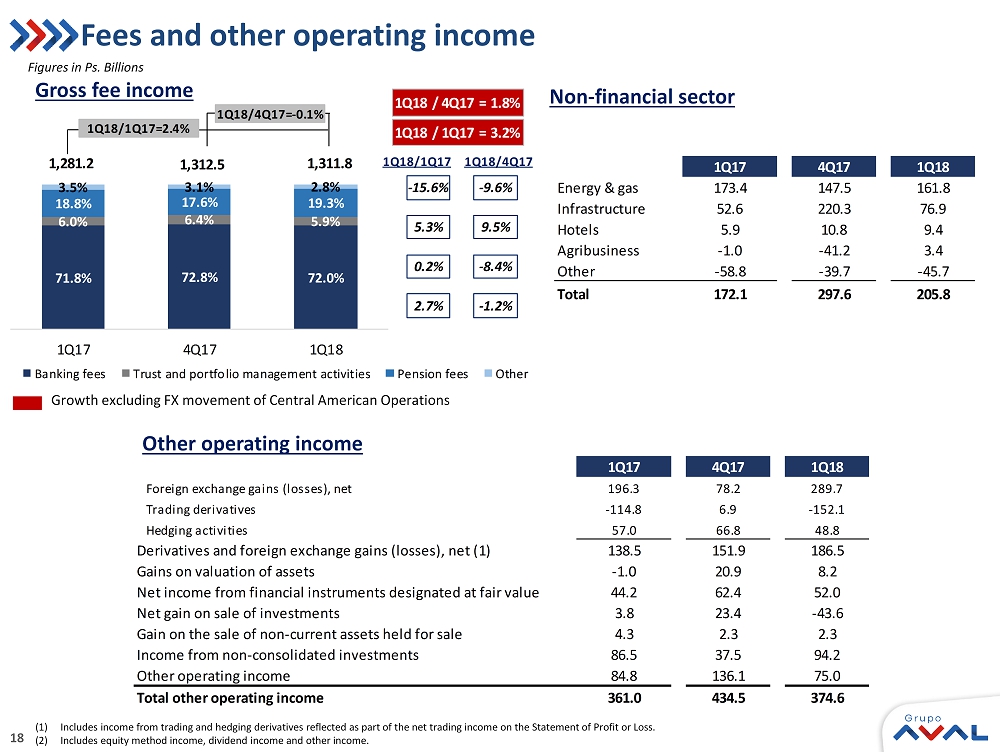
18 71.8% 72.8% 72.0% 6.0% 6.4% 5.9% 18.8% 17.6% 19.3% 3.5% 3.1% 2.8% 1Q17 4Q17 1Q18 Banking fees Trust and portfolio management activities Pension fees Other 1,281.2 1,312.5 1,311.8 1Q18/1Q17=2.4% 1Q18/4Q17= - 0.1% 2.7% 0.2% 5.3% - 15.6% 1Q18/4Q17 1Q18/1Q17 - 1.2% - 8.4% 9.5% - 9.6% 1Q18 / 1Q17 = 3.2% 1Q18 / 4Q17 = 1.8% Fees and other operating income Figures in Ps. Billions (1) Includes income from trading and hedging derivatives reflected as part of the net trading income on the Statement of Profit or Loss. (2) Includes equity method income, dividend income and other income . Gross fee income Other operating income Growth excluding FX movement of Central American Operations Non - financial sector 1Q17 4Q17 1Q18 Foreign exchange gains (losses), net 196.3 78.2 289.7 Trading derivatives -114.8 6.9 -152.1 Hedging activities 57.0 66.8 48.8 Derivatives and foreign exchange gains (losses), net (1) 138.5 151.9 186.5 Gains on valuation of assets -1.0 20.9 8.2 Net income from financial instruments designated at fair value 44.2 62.4 52.0 Net gain on sale of investments 3.8 23.4 -43.6 Gain on the sale of non-current assets held for sale 4.3 2.3 2.3 Income from non-consolidated investments 86.5 37.5 94.2 Other operating income 84.8 136.1 75.0 Total other operating income 361.0 434.5 374.6 1Q17 4Q17 1Q18 Energy & gas 173.4 147.5 161.8 Infrastructure 52.6 220.3 76.9 Hotels 5.9 10.8 9.4 Agribusiness -1.0 -41.2 3.4 Other -58.8 -39.7 -45.7 Total 172.1 297.6 205.8
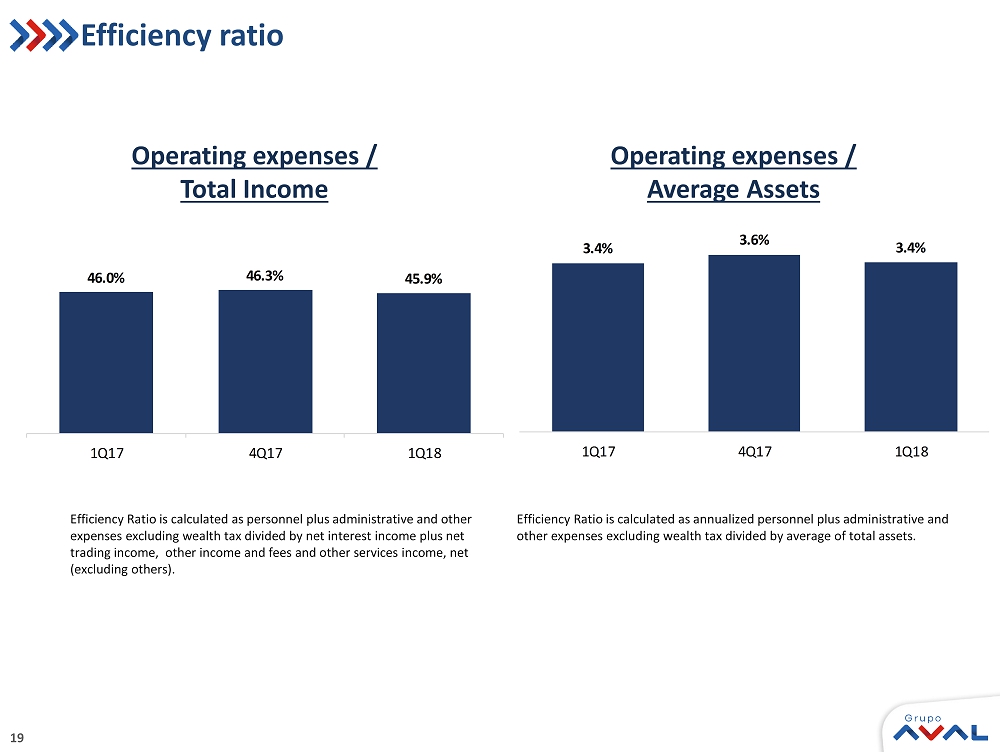
19 Efficiency ratio Efficiency Ratio is calculated as personnel plus administrative and other expenses excluding wealth tax divided by net interest income plus net trading income, other income and fees and other services income, net ( e xcluding others). Operating expenses / Total Income Operating expenses / Average Assets Efficiency Ratio is calculated as annualized personnel plus administrative and other expenses excluding wealth tax divided by average of total assets. 46.0% 46.3% 45.9% 1Q17 4Q17 1Q18 FY16 FY17 3.4% 3.6% 3.4% 1Q17 4Q17 1Q18 FY16 FY17
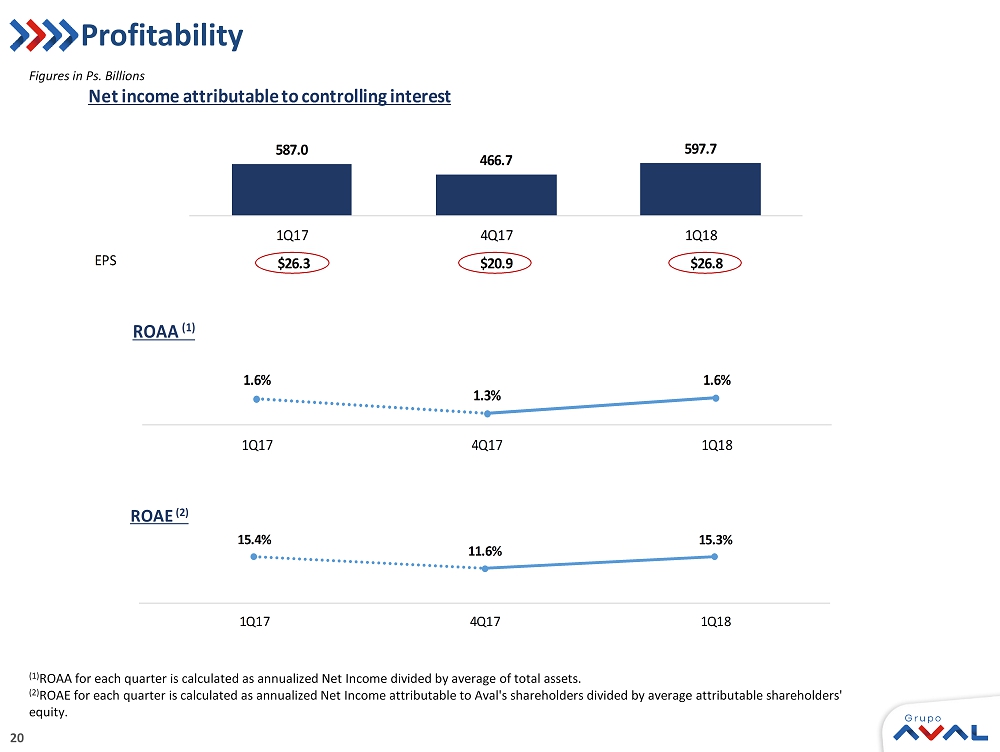
20 587.0 466.7 597.7 1Q17 4Q17 1Q18 Net income attributable to controlling interest $26.3 $20.9 $26.8 EPS $29.0 645.3 Profitability (1) ROAA for each quarter is calculated as annualized Net Income divided by average of total assets . (2) ROAE for each quarter is calculated as annualized Net Income attributable to Aval's shareholders divided by average attributable shareholders' equity. Figures in Ps. Billions 1.6% 1.3% 1.6% 1Q17 4Q17 1Q18 ROAA (1) 2.0% 15.4% 11.6% 15.3% 1Q17 4Q17 1Q18 ROAE (2) 11.6%
21
SIGNATURE
Pursuant to the requirements of the Securities Exchange Act of 1934, the registrant has duly caused this report to be signed on its behalf by the undersigned, thereunto duly authorized.
Date: May 18, 2018
| GRUPO AVAL ACCIONES Y VALORES S.A. | |||||
| By: | /s/ Jorge Adrián Rincón Plata | ||||
| Name: | Jorge Adrián Rincón Plata | ||||
| Title: | Chief Legal Counsel | ||||