UNITED STATES
SECURITIES AND EXCHANGE COMMISSION
Washington, D.C. 20549
FORM 6-K
Report Of Foreign Private Issuer
Pursuant To Rule 13a-16 Or 15d-16 Of
The Securities Exchange Act Of 1934
For the month of November 2018
Commission File Number: 000-54290
Grupo Aval Acciones y Valores S.A.
(Exact name of registrant as specified in its charter)
Carrera 13 No. 26A - 47
Bogotá D.C., Colombia
(Address of principal executive office)
Indicate by check mark whether the registrant files or will file annual reports under cover of Form 20-F or Form 40-F:
| Form 20-F | X | Form 40-F |
Indicate by check mark if the registrant is submitting the Form 6-K in paper as permitted by Regulation S-T Rule 101(b)(1):
| Yes | No | X |
Indicate by check mark if the registrant is submitting the Form 6-K in paper as permitted by Regulation S-T Rule 101(b)(7):
| Yes | No | X |
GRUPO AVAL ACCIONES Y VALORES S.A.
TABLE OF CONTENTS
| ITEM | |
| 1. | Report of Third Quarter 2018 Consolidated Results |
| 2. | First Quarter 2018 Consolidated Earnings Results Presentation |
Item 1

Report of 3Q2018 consolidated results
Information reported in Ps billions(1)and under IFRS
(1) We refer to billions as thousands of millions.


Grupo Aval Acciones y Valores S.A. (“Grupo Aval”) is an issuer of securities in Colombia and in the United States, registered with Colombia’s National Registry of Shares and Issuers (Registro Nacional de Valores y Emisores) and the United States Securities and Exchange Commission (“SEC”). As such, it is subject to the control of the Superintendency of Finance and compliance with applicable U.S. securities regulation as a “foreign private issuer” under Rule 405 of the U.S. Securities Act of 1933.
All of our banking subsidiaries (Banco de Bogotá, Banco de Occidente, Banco Popular and Banco AV Villas), Porvenir and Corficolombiana, are subject to inspection and surveillance as financial institutions by the Superintendency of Finance. Although we are not a financial institution, as a result of the enactment of Law 1870 of 2017, also known as Law of Financial Conglomerates, starting on February 6, 2019, Grupo Aval will be subject to the supervision and regulation of the Superintendency of Finance. Grupo Aval, as the holding company of its financial conglomerate will become responsible for the compliance with capital adequacy requirements, corporate governance standards, financial risk management and internal control framework and criteria for identifying, managing and revealing conflicts of interest, applicable to its financial conglomerate.
The unaudited consolidated financial information included in this document is presented in accordance with IFRS as currently issued by the IASB. Details of the calculations of non-GAAP measures such as ROAA and ROAE, among others, are explained when required in this report.
The results for 1Q2018, 2Q2018 and 3Q2018 are not comparable to previous quarters due to the prospective adoption in Colombia of IFRS 9 and IFRS 15 starting in January 1, 2018.
The previously reported figures for 2Q2018 had been adjusted to reflect the treatment of provision charges to stage 3 loans as described under IFRS 9 and detailed in KPMG’s practical guide to IFRS standards whose content we learnt post the 2Q2018 conference call and that clarifies the methodology that needs to be used to fully adopt this new standard.
This report may include forward-looking statements, which actual results may vary from those stated herein as a consequence of changes in general, economic and business conditions, changes in interest and currency rates and other risks factors as evidenced in our Form 20-F available at the SEC webpage. Recipients of this document are responsible for the assessment and use of the information provided herein. Grupo Aval will not have any obligation to update the information herein and shall not be responsible for any decision taken by investors in connection with this document. The content of this document and the unaudited figures included herein are not intended to provide full disclosure on Grupo Aval or its affiliates.
When applicable, in this document we refer to billions as thousands of millions.
| 1 |  |

Bogotá, November 15th, 2018. GRUPO AVAL ACCIONES Y VALORES S.A. (“Grupo Aval”) reports a consolidated attributable net income result of Ps 782.7 billion (Ps 35.1 pesos per share) for 3Q18 versus a Ps 681.5 billion (Ps 30.6 pesos per share) figure reported for 2Q18. ROAE for the quarter was 19.1% and ROAA was 2.4%.
Key results of the quarter:
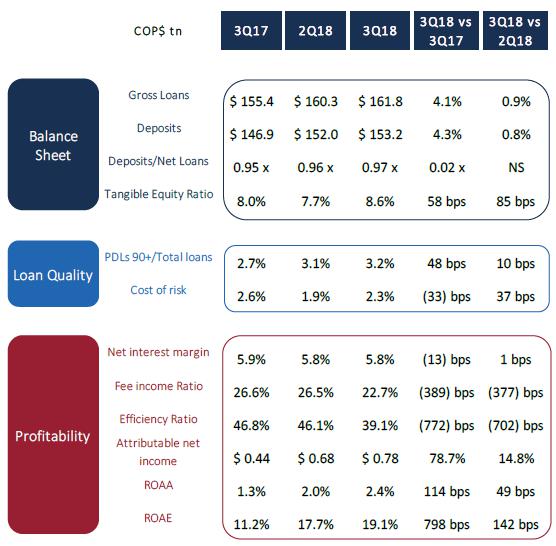
| • | Solid net income for the quarter of Ps 783 billion (35.1 pesos per share), bringing the accumulated net income for the year to Ps 2,062 billion. Net income for the quarter increased by 14.9% versus the previous quarter and 78.7% versus 3Q17. Accumulated net income increased by 37.9% versus income for the first nine months in 2017. |
| • | 3Q18 net income results were positively impacted by the full adoption of IFRS 15 with regard to concession project accounting; excluding retroactive income related to this adoption, net income for the quarter was Ps 658 billion. |
| • | 2.4% and 19.1% of ROAA and ROAE for the quarter or (1.9% and 16% in absence of the retroactive income). |
| • | Resilient NIM at 5.8% for the quarter, similar to this same ratio in the previous two quarters. |
| • | Improving PDL´s (18 bp) and NPL’s (11 bp) for the consumer portfolio during the quarter, an indication that the worst of the credit cycle, which impacted mostly these portfolios, is over. |
| • | Deterioration of the commercial portfolio’s PDL’s (27 bp) and NPL’s (23 bp) mostly driven by slow growth in Colombia and specific corporate clients in Central America. |
| • | Deterioration of Cost of Risk (37 bp) mainly as a consequence of a 72 bp increase in this ratio in Central America resulting from the political scenario in Nicaragua and the macroeconomic environment in Costa Rica when applied to the calculation of IFRS 9 impairment losses. |
| • | Strong efficiency ratio (39.1% on an operating expenses-to-total income and 3.5% on a cost-to-asset basis). Efficiency was driven by a decrease of 0.9% in total operating expenses. |
| • | Improvement of 85 bps in Tangible Equity Ratio to 8.6%. |
| 2 | |

Bogotá, November 15th, 2018. GRUPO AVAL ACCIONES Y VALORES S.A. (“Grupo Aval”) reports a consolidated attributable net income result of Ps 782.7 billion (Ps 35.1 pesos per share) for 3Q18 versus a Ps 681.5 billion (Ps 30.6 pesos per share) figure reported for 2Q18. ROAE for the quarter was 19.1% and ROAA was 2.4%.
Gross loansexcludes interbank and overnight funds.Tangible Capital Ratiois calculated as Total Equity minus Goodwill and other Intangibles divided by Total Assets minus Goodwill and other Intangibles.Net Interest Margin includes net interest income plus net trading income from investment securities held for trading through profit or loss divided by total average interest-earning assets.Fee income ratio is calculated fee net income divided by net interest income plus net trading income, other income and fees and other services income, net (excluding others).Efficiency Ratio is calculated as personnel plus administrative and other expenses excluding wealth tax divided by net interest income plus net trading income, other income and fees and other services income, net (excluding others).ROAA is calculated as annualized Net Income divided by average of total assets.ROAE is calculated as Net Income attributable to Aval's shareholders divided by average attributable shareholders' equity.
| 3 | |

Grupo Aval Acciones y Valores S.A.
Consolidated Financial Statements Under IFRS
Information in Ps. Billions
| Consolidated Statement of Financial Position | 3Q17 | 2Q18 | 3Q18 | D | |||||
| 3Q18 vs. 2Q18 | 3Q18 vs. 3Q17 | ||||||||
| Cash and cash equivalents | 21,821.4 | 21,175.2 | 24,396.8 | 15.2% | 11.8% | ||||
| Total financial assets held for trading through profit or losses | 4,786.1 | 5,013.4 | 5,391.2 | 7.5% | 12.6% | ||||
| Total available for sale financial assets | 17,682.0 | 20,086.6 | 21,083.2 | 5.0% | 19.2% | ||||
| Investments held to maturity | 2,663.1 | 2,961.1 | 2,999.4 | 1.3% | 12.6% | ||||
| Other financial assets at fair value through profit or loss | 2,220.7 | 2,409.6 | 2,459.7 | 2.1% | 10.8% | ||||
| Total loans and receivables, net | 155,019.9 | 158,305.7 | 158,265.1 | 0.0% | 2.1% | ||||
| Tangible assets | 6,579.4 | 6,461.4 | 6,465.3 | 0.1% | -1.7% | ||||
| Goodwill | 6,724.3 | 6,817.5 | 6,882.5 | 1.0% | 2.4% | ||||
| Concession arrangement rights | 2,952.3 | 3,493.3 | 4,981.0 | 42.6% | 68.7% | ||||
| Other assets | 7,613.9 | 7,823.6 | 8,562.8 | 9.4% | 12.5% | ||||
| Total assets | 228,063.1 | 234,547.4 | 241,487.0 | 3.0% | 5.9% | ||||
| Derivative instruments held for trading | 385.0 | 478.1 | 488.9 | 2.2% | 27.0% | ||||
| Deposits from clients at amortized cost | 146,886.5 | 151,958.1 | 153,188.5 | 0.8% | 4.3% | ||||
| Interbank borrowings and overnight funds | 7,895.6 | 7,154.7 | 8,669.9 | 21.2% | 9.8% | ||||
| Borrowings from banks and others | 16,698.1 | 16,836.5 | 17,094.3 | 1.5% | 2.4% | ||||
| Bonds | 18,493.4 | 19,347.3 | 19,128.2 | -1.1% | 3.4% | ||||
| Borrowings from development entities | 2,890.5 | 3,054.0 | 3,440.2 | 12.6% | 19.0% | ||||
| Other liabilities | 9,632.4 | 10,448.7 | 11,570.9 | 10.7% | 20.1% | ||||
| Total liabilities | 202,881.5 | 209,277.4 | 213,580.8 | 2.1% | 5.3% | ||||
| Equity attributable to owners of the parent company | 15,898.0 | 15,830.5 | 16,895.2 | 6.7% | 6.3% | ||||
| Non-controlling interests | 9,283.6 | 9,439.4 | 11,011.0 | 16.6% | 18.6% | ||||
| Total equity | 25,181.6 | 25,269.9 | 27,906.2 | 10.4% | 10.8% | ||||
| Total liabilities and equity | 228,063.1 | 234,547.4 | 241,487.0 | 3.0% | 5.9% | ||||
| Consolidated Statement of Income | 3Q17 | 2Q18 | 3Q18 | D | |||||
| Interest income | 4,661.6 | 4,541.4 | 4,599.3 | 1.3% | -1.3% | ||||
| Interest expense | 1,985.5 | 1,842.0 | 1,847.3 | 0.3% | -7.0% | ||||
| Net interest income | 2,676.1 | 2,699.4 | 2,752.0 | 1.9% | 2.8% | ||||
| Impairment loss on loans and accounts receivable | 1,091.4 | 856.9 | 1,013.9 | 18.3% | -7.1% | ||||
| Impairment loss on other financial assets | (0.0 | ) | (8.1 | ) | 3.9 | -148.3% | N.A | ||
| Impairment loss on other assets | 1.2 | 6.3 | 5.5 | -13.7% | N.A. | ||||
| Recovery of charged-off assets | (65.2 | ) | (88.9 | ) | (83.4 | ) | -6.2% | 27.8% | |
| Impairment loss, net | 1,027.4 | 766.3 | 939.9 | 22.7% | -8.5% | ||||
| Net income from commissions and fees | 1,148.8 | 1,199.0 | 1,193.8 | -0.4% | 3.9% | ||||
| Net income from sales of goods and services to clients (non-financial sector) | 159.3 | 259.0 | 972.3 | N.A. | N.A. | ||||
| Net trading income | 66.9 | 244.7 | 109.5 | -55.3% | 63.6% | ||||
| Net income from financial instruments designated at fair value | 45.3 | 75.0 | 50.2 | -33.1% | 10.7% | ||||
| Total other income | 317.5 | 134.5 | 297.6 | 121.2% | -6.3% | ||||
| Total other expenses | 2,170.5 | 2,251.4 | 2,231.4 | -0.9% | 2.8% | ||||
| Income before income tax expense | 1,216.1 | 1,594.0 | 2,204.0 | 38.3% | 81.2% | ||||
| Income tax expense | 470.8 | 454.7 | 750.8 | 65.1% | 59.5% | ||||
| Income from continued operations | 745.3 | 1,139.3 | 1,453.2 | 27.6% | 95.0% | ||||
| Income from discontinued operations | 0.0 | - | (0.0 | ) | N.A | N.A | |||
| Net income before non-controlling interest | 745.3 | 1,139.3 | 1,453.2 | 27.6% | 95.0% | ||||
| Non-controlling interest | 307.4 | 457.7 | 670.4 | 46.5% | 118.1% | ||||
| Net income attributable to the owners of the parent company | 437.9 | 681.5 | 782.7 | 14.8% | 78.7% | ||||
| Key ratios | 3Q17 | 2Q18 | 3Q18 | YTD 2017 | YTD 2018 | ||||
| Net Interest Margin(1) | 5.9% | 5.8% | 5.9% | 5.9% | 5.8% | ||||
| Net Interest Margin (including net trading income)(1) | 5.9% | 5.8% | 5.8% | 6.0% | 5.7% | ||||
| Efficiency ratio(2) | 46.8% | 46.1% | 39.1% | 46.6% | 43.7% | ||||
| ROAA(3) | 1.3% | 2.0% | 2.4% | 1.4% | 2.0% | ||||
| ROAE(4) | 11.2% | 17.7% | 19.1% | 12.9% | 17.2% | ||||
| 30 days PDL / Total loans and leases (5) | 4.0% | 4.4% | 4.5% | 4.0% | 4.5% | ||||
| Provision expense / Average loans and leases (6) | 2.6% | 1.9% | 2.3% | 2.4% | 2.1% | ||||
| Allowance / 30 days PDL (5) | 0.85 | 1.03 | 1.04 | 0.85 | 1.04 | ||||
| Allowance / Total loans and leases | 3.4% | 4.5% | 4.6% | 3.4% | 4.6% | ||||
| Charge-offs / Average loans and leases (6) | 1.8% | 1.9% | 1.9% | 1.7% | 1.9% | ||||
| Total loans and leases, net / Total assets | 68.0% | 67.5% | 65.5% | 68.0% | 65.5% | ||||
| Deposits / Total loans and leases, net | 94.8% | 96.0% | 96.8% | 94.8% | 96.8% | ||||
| Equity / Assets | 11.0% | 10.8% | 11.6% | 11.0% | 11.6% | ||||
| Tangible equity ratio (7) | 8.0% | 7.7% | 8.6% | 8.0% | 8.6% | ||||
| Shares outstanding (EoP) | 22,281,017,159 | 22,281,017,159 | 22,281,017,159 | 22,281,017,159 | 22,281,017,159 | ||||
| Shares outstanding (Average) | 22,281,017,159 | 22,281,017,159 | 22,281,017,159 | 22,281,017,159 | 22,281,017,159 | ||||
| Common share price (EoP) | 1,315.0 | 1,210.0 | 1,145.0 | 1,315.0 | 1,145.0 | ||||
| Preferred share price (EoP) | 1,330.0 | 1,230.0 | 1,165.0 | 1,330.0 | 1,165.0 | ||||
| BV/ EoP shares in Ps. | 713.5 | 710.5 | 758.3 | 713.5 | 758.3 | ||||
| EPS | 19.7 | 30.6 | 35.1 | 67.1 | 92.5 | ||||
| P/E (8) | 16.9 | 10.1 | 8.3 | 14.9 | 9.4 | ||||
| P/BV (8) | 1.9 | 1.7 | 1.5 | 1.9 | 1.5 | ||||
(1) NIM is calculated as Net Interest Income divided by the average of Interest Earning Assets; (2) Efficiency Ratio is calculated as personnel plus administrative and other expenses divided by net interest income plus net trading income, other income and fees and other services income, net (excluding others); (3) ROAA is calculated as Income before Minority Interest divided by the average of total assets for each quarter; (4) ROAE is calculated as Net Income attributable to Grupo Aval’s shareholders divided by the average of shareholders´ attributable equity for each quarter; (5) Total loans excluding interbank and overnight funds and 30 days past due include interest accounts receivables; (6) Refers to average gross loans for the period; (7) Tangible Equity Ratio is calculated as Total Equity minus Intangibles (excluding those related to concessions) divided by Total Assets minus Intangibles (excluding those related to concessions); (8) Based on Preferred share prices.
| 4 | |
Statement of Financial Position Analysis
1. Assets
Total assets as of September 30th, 2018 totaled Ps 241,487.0 billion showing an increase of 5.9% versus September 30th, 2017, and of 3.0% versus June 30th, 2018. Growth in assets was mainly driven by a 2.1% year over year growth in total loans and receivables, net to Ps 158,265.1 billion. When excluding FX movement in our Central American operation (“excluding FX”), asset growth would have been 5.5% versus September 30th, 2017 and 2.5% versus June 30th, 2018; for total loans and receivables, net growth would have been 1.7% versus September 30th, 2017 and -0.4% versus June 30th, 2018.
1.1 Loans and receivables
Total gross loans and receivables (excluding interbank and overnight funds) increased by 4.1% between September 30th, 2017 and September 30th, 2018 to Ps 161,816.7 billion (3.8% excluding FX) mainly driven by (i) a 11.8% increase in Mortgage and housing leases to Ps 17,244.0 billion (11.0% excluding FX), (ii) a 7.6% increase in Consumer loans and leases to Ps 52,504.9 billion (7.2% excluding FX), and (iii) a 0.9% increase in Commercial loans and leases to Ps 91,648.3 billion (0.7% excluding FX).
Interbank & overnight funds decreased by 18.5% to Ps 3,960.3 billion (-18.9% excluding FX) during the last twelve months.
Allowance for impairment of loans and receivables was Ps 7,511.9 billion as of September 30th, 2018 taking net loans and receivables to Ps 158,265.1 billion.
The increase in allowance for impairment of loans and receivables when compared to September 30th, 2017 was impacted by the adoption of IFRS9 on January 1st, 2018, which accounted for Ps 1,163.3 billion.
| Total loans and receivables, net | 3Q17 | 2Q18 | 3Q18 | D | |||||
| 3Q18 vs. 2Q18 | 3Q18 vs. 3Q17 | ||||||||
| Loans and receivables | |||||||||
| Commercial loans and leases | 90,797.1 | 91,769.8 | 91,648.3 | -0.1% | 0.9% | ||||
| Consumer loans and leases | 48,781.7 | 51,379.5 | 52,504.9 | 2.2% | 7.6% | ||||
| Mortgages and housing leases | 15,418.6 | 16,729.4 | 17,244.0 | 3.1% | 11.8% | ||||
| Microcredit loans and leases | 404.7 | 417.8 | 419.5 | 0.4% | 3.7% | ||||
| Loans and receivables | 155,402.1 | 160,296.5 | 161,816.7 | 0.9% | 4.1% | ||||
| Interbank & overnight funds | 4,861.7 | 5,189.8 | 3,960.3 | -23.7% | -18.5% | ||||
| Total loans and leases operations and receivables portfolio | 160,263.8 | 165,486.3 | 165,777.0 | 0.2% | 3.4% | ||||
| Allowance for impairment of loans and receivables | (5,243.9 | ) | (7,180.6 | ) | (7,511.9 | ) | 4.6% | 43.3% | |
| Allowance for impairment of commercial loans | (2,616.7 | ) | (3,552.9 | ) | (3,835.3 | ) | 7.9% | 46.6% | |
| Allowance for impairment of consumer loans | (2,410.6 | ) | (3,310.1 | ) | (3,345.8 | ) | 1.1% | 38.8% | |
| Allowance for impairment of mortgages | (143.8 | ) | (232.5 | ) | (248.8 | ) | 7.0% | 73.0% | |
| Allowance for impairment of microcredit loans | (72.8 | ) | (85.2 | ) | (82.1 | ) | -3.6% | 12.8% | |
| Total loans and receivables, net | 155,019.9 | 158,305.7 | 158,265.1 | 0.0% | 2.1% | ||||
| 5 | |

The following table shows the gross loan composition per product of each of our loan categories.
| Gross loans | 3Q17 | 2Q18 | 3Q18 | D | |||||
| 3Q18 vs. 2Q18 | 3Q18 vs. 3Q17 | ||||||||
| General purpose | 61,445.1 | 63,627.4 | 63,365.4 | -0.4% | 3.1% | ||||
| Working capital | 15,739.3 | 14,757.0 | 14,571.1 | -1.3% | -7.4% | ||||
| Financial leases | 9,865.3 | 9,755.4 | 9,785.6 | 0.3% | -0.8% | ||||
| Funded by development banks | 2,777.9 | 2,792.2 | 2,999.9 | 7.4% | 8.0% | ||||
| Overdrafts | 583.0 | 483.1 | 536.3 | 11.0% | -8.0% | ||||
| Credit cards | 386.6 | 354.7 | 390.0 | 10.0% | 0.9% | ||||
| Commercial loans and leases | 90,797.1 | 91,769.8 | 91,648.3 | -0.1% | 0.9% | ||||
| Personal loans | 29,923.6 | 31,848.9 | 32,584.5 | 2.3% | 8.9% | ||||
| Credit cards | 12,711.1 | 13,485.7 | 13,883.4 | 2.9% | 9.2% | ||||
| Automobile and vehicle | 5,822.1 | 5,727.6 | 5,703.7 | -0.4% | -2.0% | ||||
| Financial leases | 224.6 | 233.3 | 238.2 | 2.1% | 6.0% | ||||
| Overdrafts | 100.4 | 84.0 | 95.0 | 13.1% | -5.3% | ||||
| Other | 0.0 | 0.0 | 0.0 | -13.0% | -37.5% | ||||
| Consumer loans and leases | 48,781.7 | 51,379.5 | 52,504.9 | 2.2% | 7.6% | ||||
| Mortgages | 14,430.0 | 15,568.4 | 16,017.0 | 2.9% | 11.0% | ||||
| Housing leases | 988.5 | 1,161.0 | 1,227.0 | 5.7% | 24.1% | ||||
| Mortgages and housing leases | 15,418.6 | 16,729.4 | 17,244.0 | 3.1% | 11.8% | ||||
| Microcredit loans and leases | 404.7 | 417.8 | 419.5 | 0.4% | 3.7% | ||||
| Loans and receivables | 155,402.1 | 160,296.5 | 161,816.7 | 0.9% | 4.1% | ||||
| Interbank & overnight funds | 4,861.7 | 5,189.8 | 3,960.3 | -23.7% | -18.5% | ||||
| Total loans and leases operations and receivables portfolio | 160,263.8 | 165,486.3 | 165,777.0 | 0.2% | 3.4% | ||||
Over the last twelve months, personal loans and mortgages have driven our loan portfolio growth in accordance with our banks’ strategy. Our commercial loan book continued to show a sluggish growth as we have favored profitable growth.
In Colombia, loans and receivables increased by 3.1% during the last twelve months and 0.6% during the quarter. As for Central America, loans and receivables grew by 6.8% between September 30th, 2017 and September 30th, 2018 and increased 1.9% in the last quarter; when excluding FX, growth would have been 5.5% and 0.5%, respectively.
Commercial loans grew by 0.9% between September 30th, 2017 and September 30th, 2018 and decreased 0.1% during the quarter. In Colombia, commercial loans decreased by 0.8% between September 30th, 2017 and September 30th, 2018 and 0.7% in the quarter. As for Central America, commercial loans grew by 7.6% between September 30th, 2017 and September 30th, 2018 and 1.8% in the quarter; when excluding FX, growth in Central America would have been 6.3% and 0.4%, respectively.
Consumer loans growth over the last year and quarter was mainly driven by personal loans and credit cards. In Colombia, personal loans grew by 10.5% during the last twelve months and 2.8% between September 30th, 2018 and June 30th, 2018, mainly in payroll lending. Growth of our Central American operations, excluding FX, was driven by credit cards, which grew 8.9% during the last twelve months and 1.9% in the quarter, and personal loans, which grew 1.2% during last twelve months and decreased 1.0% during the quarter.
| 6 | |
The following table shows the loans and receivables composition per entity. During the last twelve months, Banco AV Villas showed the highest growth rate within our banking operation in Colombia, driven by a strong performance in payroll loans which grew approximately 39% as compared to September 30th, 2017.
| Gross loans / Bank ($) | 3Q17 | 2Q18 | 3Q18 | D | |||||
| 3Q18 vs. 2Q18 | 3Q18 vs. 3Q17 | ||||||||
| Banco de Bogotá | 99,329.3 | 102,535.9 | 103,561.6 | 1.0% | 4.3% | ||||
| Domestic | 55,135.7 | 56,214.0 | 56,363.0 | 0.3% | 2.2% | ||||
| Central America | 44,193.6 | 46,322.0 | 47,198.6 | 1.9% | 6.8% | ||||
| Banco de Occidente | 27,431.8 | 26,953.3 | 27,049.2 | 0.4% | -1.4% | ||||
| Banco Popular | 16,993.7 | 18,476.6 | 18,783.2 | 1.7% | 10.5% | ||||
| Banco AV Villas | 9,913.3 | 10,552.7 | 11,049.6 | 4.7% | 11.5% | ||||
| Corficolombiana | 2,505.1 | 2,426.4 | 2,391.4 | -1.4% | -4.5% | ||||
| Eliminations | (771.1 | ) | (648.5 | ) | (1,018.2 | ) | 57.0% | 32.1% | |
| Loans and receivables | 155,402.1 | 160,296.5 | 161,816.7 | 0.9% | 4.1% | ||||
| Interbank & overnight funds | 4,861.7 | 5,189.8 | 3,960.3 | -23.7% | -18.5% | ||||
| Total Grupo Aval | 160,263.8 | 165,486.3 | 165,777.0 | 0.2% | 3.4% | ||||
| Gross loans / Bank (%) | 3Q17 | 2Q18 | 3Q18 | ||||||
| Banco de Bogotá | 63.9% | 64.0% | 64.0% | ||||||
| Domestic | 35.5% | 35.1% | 34.8% | ||||||
| Central America | 28.4% | 28.9% | 29.2% | ||||||
| Banco de Occidente | 17.7% | 16.8% | 16.7% | ||||||
| Banco Popular | 10.9% | 11.5% | 11.6% | ||||||
| Banco AV Villas | 6.4% | 6.6% | 6.8% | ||||||
| Corficolombiana | 1.6% | 1.5% | 1.5% | ||||||
| Eliminations | -0.5% | -0.4% | -0.6% | ||||||
| Loans and receivables | 100% | 100% | 100% | ||||||
Of the total loans and receivables, 70.4% are domestic and 29.6% are foreign. In terms of gross loans (excluding interbank and overnight funds), 70.8% are domestic and 29.2% are foreign (reflecting the Central American operations). Total foreign gross loans grew 6.8% during the past twelve months and 1.9% in the quarter (excluding interbank and overnight funds). Excluding FX, yearly and quarterly growth (excluding interbank and overnight funds) for our Central American operations would have been 5.5% and 0.5%, respectively.
| Gross loans | 3Q17 | 2Q18 | 3Q18 | D | |||||
| 3Q18 vs. 2Q18 | 3Q18 vs. 3Q17 | ||||||||
| Domestic | |||||||||
| Commercial loans and leases | 72,242.2 | 72,169.3 | 71,690.5 | -0.7% | -0.8% | ||||
| Consumer loans and leases | 32,225.5 | 34,094.2 | 34,898.9 | 2.4% | 8.3% | ||||
| Mortgages and housing leases | 6,336.0 | 7,293.2 | 7,609.2 | 4.3% | 20.1% | ||||
| Microcredit loans and leases | 404.7 | 417.8 | 419.5 | 0.4% | 3.7% | ||||
| Interbank & overnight funds | 3,006.2 | 2,800.9 | 2,057.6 | -26.5% | -31.6% | ||||
| Total domestic loans | 114,214.6 | 116,775.5 | 116,675.8 | -0.1% | 2.2% | ||||
| Foreign | |||||||||
| Commercial loans and leases | 18,554.9 | 19,600.5 | 19,957.8 | 1.8% | 7.6% | ||||
| Consumer loans and leases | 16,556.2 | 17,285.3 | 17,606.0 | 1.9% | 6.3% | ||||
| Mortgages and housing leases | 9,082.5 | 9,436.2 | 9,634.8 | 2.1% | 6.1% | ||||
| Microcredit loans and leases | - | - | - | - | - | ||||
| Interbank & overnight funds | 1,855.6 | 2,388.9 | 1,902.7 | -20.4% | 2.5% | ||||
| Total foreign loans | 46,049.1 | 48,710.9 | 49,101.3 | 0.8% | 6.6% | ||||
| Total loans and leases operations and receivables portfolio | 160,263.8 | 165,486.3 | 165,777.0 | 0.2% | 3.4% | ||||
| 7 | |
The quality of our loan portfolio slightly deteriorated during the quarter mainly driven by a deterioration of the commercial portfolio’s PDL’s (27 bps) and NPL’s (23 bps) mostly driven by slow growth in Colombia and specific corporate clients in Central America. This was partially offset by improving PDL´s (18 bps) and NPL’s (11 bps) for the consumer portfolio during the quarter, an indication that the worst of the credit cycle, which impacted mostly these portfolios, is over.
Our 30 days PDL to total loans closed 3Q18 in 4.5%, compared to 4.4% in 2Q18 and 4.0% in 3Q17. The ratio of 90 days PDL to total loans was 3.2% for 3Q18, compared to 3.1% in 2Q18 and 2.7% in 3Q17. Finally, the ratio of CDE Loans to total loans was 7.1% in 3Q18, 6.9% in 2Q18 and 5.2% in 3Q17.
Commercial loans’ 30 days PDL ratio was 4.1% for 3Q18, 3.8% for 2Q18 and 3.4% for 3Q17; 90 days PDL ratio was 3.5%, 3.3% and 2.8%, respectively. Consumer loans’ 30 days PDL ratio was 5.2% for 3Q18, 5.3% for 2Q18 and 5.1% for 3Q17; 90 days PDL ratio was 2.9%, 3.0% and 2.7%, respectively. Mortgages’ 30 days PDL ratio was 4.1% for 3Q18, 4.0% for 2Q18 and 3.7% for 3Q17; 90 days PDL ratio was 2.2%, 2.2% and 2.0%, respectively.
| Total loans and leases operations and receivables portfolio | 3Q17 | 2Q18 | 3Q18 | D | |||||
| 3Q18 vs. 2Q18 | 3Q18 vs. 3Q17 | ||||||||
| ''A'' normal risk | 141,644.1 | 144,237.3 | 145,440.1 | 0.8% | 2.7% | ||||
| ''B'' acceptable risk | 5,630.5 | 5,058.0 | 4,892.4 | -3.3% | -13.1% | ||||
| ''C'' appreciable risk | 3,694.3 | 5,257.7 | 5,213.2 | -0.8% | 41.1% | ||||
| ''D'' significant risk | 2,972.8 | 4,050.8 | 4,177.6 | 3.1% | 40.5% | ||||
| ''E'' unrecoverable | 1,460.4 | 1,692.7 | 2,093.4 | 23.7% | 43.3% | ||||
| Loans and receivables | 155,402.1 | 160,296.5 | 161,816.7 | 0.9% | 4.1% | ||||
| Interbank and overnight funds | 4,861.7 | 5,189.8 | 3,960.3 | -23.7% | -18.5% | ||||
| Total loans and leases operations and receivables portfolio | 160,263.8 | 165,486.3 | 165,777.0 | 0.2% | 3.4% | ||||
| CDE loans / Total loans (*) | 5.2% | 6.9% | 7.1% | ||||||
| Past due loans | 3Q17 | 2Q18 | 3Q18 | D | |||||
| 3Q18 vs. 2Q18 | 3Q18 vs. 3Q17 | ||||||||
| Performing | 87,715.5 | 88,271.2 | 87,902.3 | -0.4% | 0.2% | ||||
| Between 31 and 90 days past due | 534.3 | 485.6 | 524.5 | 8.0% | -1.8% | ||||
| +90 days past due | 2,547.3 | 3,013.0 | 3,221.5 | 6.9% | 26.5% | ||||
| Commercial loans and leases | 90,797.1 | 91,769.8 | 91,648.3 | -0.1% | 0.9% | ||||
| Performing | 46,309.0 | 48,632.2 | 49,790.2 | 2.4% | 7.5% | ||||
| Between 31 and 90 days past due | 1,154.5 | 1,207.5 | 1,197.0 | -0.9% | 3.7% | ||||
| +90 days past due | 1,318.2 | 1,539.8 | 1,517.7 | -1.4% | 15.1% | ||||
| Consumer loans and leases | 48,781.7 | 51,379.5 | 52,504.9 | 2.2% | 7.6% | ||||
| Performing | 14,852.2 | 16,063.5 | 16,539.9 | 3.0% | 11.4% | ||||
| Between 31 and 90 days past due | 264.3 | 304.8 | 324.3 | 6.4% | 22.7% | ||||
| +90 days past due | 302.1 | 361.1 | 379.7 | 5.2% | 25.7% | ||||
| Mortgages and housing leases | 15,418.6 | 16,729.4 | 17,244.0 | 3.1% | 11.8% | ||||
| Performing | 343.2 | 354.9 | 355.4 | 0.1% | 3.5% | ||||
| Between 31 and 90 days past due | 17.2 | 16.8 | 16.7 | -0.7% | -3.1% | ||||
| +90 days past due | 44.3 | 46.1 | 47.5 | 2.9% | 7.3% | ||||
| Microcredit loans and leases | 404.7 | 417.8 | 419.5 | 0.4% | 3.7% | ||||
| Loans and receivables | 155,402.1 | 160,296.5 | 161,816.7 | 0.9% | 4.1% | ||||
| Interbank & overnight funds | 4,861.7 | 5,189.8 | 3,960.3 | -23.7% | -18.5% | ||||
| Allowance for impairment of commercial loans | 160,263.8 | 165,486.3 | 165,777.0 | 0.2% | 3.4% | ||||
| 30 Days PDL / Total loans (*) | 4.0% | 4.4% | 4.5% | ||||||
| 90 Days PDL / Total loans (*) | 2.7% | 3.1% | 3.2% |


(*) Total loans excluding interbank and overnight funds. 30 days past due and 90 days past due are calculated on a capital plus interest accounts receivable basis.
| 8 | |
Grupo Aval’s coverage over its 90 days PDL increased from 1.2x for 3Q17 to 1.5x for 3Q18. Allowance to CDE Loans was 0.7x for 3Q18 and 2Q18 and 0.6x for 3Q17, and allowance to 30 days PDL was 1.0x for 3Q18 and 2Q18 and 0.8x for 3Q17. Impairment loss, net of recoveries of charged off assets to average total loans was 2.3% in 3Q18, 1.9% in 2Q18 and 2.6% in 3Q17. Charge-offs to average total loans was 1.9% in 3Q18 and 2Q18 and 1.8% in 3Q17.
| Total loans and leases operations and receivables portfolio | 3Q17 | 2Q18 | 3Q18 | |||
| Allowance for impairment / CDE loans | 0.6 | 0.7 | 0.7 | |||
| Allowance for impairment / 30 Days PDL | 0.8 | 1.0 | 1.0 | |||
| Allowance for impairment / 90 Days PDL | 1.2 | 1.4 | 1.5 | |||
| Allowance for impairment / Total loans (*) | 3.4% | 4.5% | 4.6% | |||
| Impairment loss / CDE loans | 0.5 | 0.3 | 0.4 | |||
| Impairment loss / 30 Days PDL | 0.7 | 0.5 | 0.6 | |||
| Impairment loss / 90 Days PDL | 1.0 | 0.7 | 0.8 | |||
| Impairment loss / Average total loans (*) | 2.8% | 2.2% | 2.5% | |||
| Impairment loss, net of recoveries of charged-off assets / Average total loans (*) | 2.6% | 1.9% | 2.3% | |||
| Charge-offs / Average total loans (*) | 1.8% | 1.9% | 1.9% |
(*) Total loans excluding interbank and overnight funds. 30 days past due and 90 days past due are calculated on a capital plus interest accounts receivable basis.
1.2 Financial assets held for investment
Total financial assets held for investment increased 16.8% to Ps 31,933.5 billion between September 30th, 2017 and September 30th, 2018, and increased 4.8% versus June 30th, 2018. Ps 25,337.1 billion of our total gross portfolio is invested in debt securities, which increased by 15.2% between September 30th, 2017 and September 30th, 2018 and by 3.2% since June 30th, 2018. Ps 3,531.1 billion of our total gross investment securities is invested in equity securities, which increased by 27.7% between September 30th, 2017 and September 30th, 2018 and by 16.4% versus June 30th, 2018. The increase in equity securities was driven by the increase of Corficolombiana’s stake in Grupo de Energía de Bogotá.
The average yield on our debt and equity investment securities (held for trading through profit or losses, available for sale, held to maturity and Interbank & Overnight funds) was 4.7% for 3Q18, 4.8% for 2Q18 and 4.6% in 3Q17.
| Financial assets held for investment | 3Q17 | 2Q18 | 3Q18 | D | |||||
| 3Q18 vs. 2Q18 | 3Q18 vs. 3Q17 | ||||||||
| Debt securities | 2,456.1 | 2,421.5 | 2,467.3 | 1.9% | 0.5% | ||||
| Equity securities | 1,950.7 | 2,122.9 | 2,318.2 | 9.2% | 18.8% | ||||
| Derivative instruments | 379.3 | 469.0 | 605.6 | 29.1% | 59.7% | ||||
| Total financial assets held for trading through profit or losses | 4,786.1 | 5,013.4 | 5,391.2 | 7.5% | 12.6% | ||||
| Debt securities | 16,867.1 | 19,175.2 | 19,870.3 | 3.6% | 17.8% | ||||
| Equity securities | 814.9 | 911.4 | 1,212.9 | 33.1% | 48.8% | ||||
| Total available for sale financial assets | 17,682.0 | 20,086.6 | 21,083.2 | 5.0% | 19.2% | ||||
| Investments held to maturity | 2,663.1 | 2,961.1 | 2,999.4 | 1.3% | 12.6% | ||||
| Other financial assets at fair value through profit or loss | 2,220.7 | 2,409.7 | 2,459.8 | 2.1% | 10.8% | ||||
| Total financial assets held for investment | 27,352.0 | 30,470.7 | 31,933.5 | 4.8% | 16.8% | ||||
| 9 | |
1.3 Cash and Cash Equivalents
As of September 30th, 2018 cash and cash equivalents had a balance of Ps 24,396.8 billion showing increases of 11.8% versus September 30th, 2017 and of 15.2% versus June 30th, 2018 (11.3% and 14.5% excluding FX).
The ratio of cash and cash equivalents to deposits was 15.9% in September 30th, 2018, 13.9% in June 30th, 2018, and 14.9% in September 30th, 2017.
1.4 Goodwill and Other Intangibles
Goodwill and other intangibles as of September 30th, 2018 reached Ps 12,838.3 billion, increasing by 22.5% versus September 30th, 2017 and 14.4% versus June 30th, 2018.
Goodwill as of September 30th, 2018 was Ps 6,882.5 billion, increasing by 2.4% versus September 30th, 2017 and by 1.0% versus June 30th, 2018, explained by fluctuations in the exchange rate.
Other intangibles, which include “concession arrangement rights” and other intangibles, mainly reflect the value of road concessions recorded for the most part at Corficolombiana. Other intangibles as of September 30th, 2018 reached Ps 5,955.8 billion and grew by 58.6% versus September 30th, 2017 and 35.1% versus June 30th, 2018. This increase was mainly driven by the impact of the adoption of IFRS 15 in our Fourth Generation Concessions.
2. Liabilities
As of September 30th, 2018 funding represented 94.4% of total liabilities and other liabilities represented 5.6%.
2.1 Funding
Total Funding (Total Financial Liabilities at Amortized Cost) which includes (i) Deposits, (ii) Interbank borrowings and overnight funds, (iii) Borrowings from banks and others, (iv) Bonds, and (v) Borrowing from development entities had a balance of Ps 201,521.0 billion as of September 30th, 2018 showing an increase of 4.5% versus September 30th, 2017 and 1.6% versus June 30th, 2018 (4.1% and 1.2% increase excluding FX). Total deposits represented 76.0% of total funding as of the end of 3Q18, 76.6% for 2Q18 and 76.2% for 3Q17.
Average cost of funds was 3.7% in 3Q18 and 2Q18, and 4.1% in 3Q17. Our average cost of funds reflects stability in line with a now stable interest rate scenario.
| 10 | |
2.1.1 Deposits
| Deposits from clients at amortized cost | 3Q17 | 2Q18 | 3Q18 | D | |||||
| 3Q18 vs. 2Q18 | 3Q18 vs. 3Q17 | ||||||||
| Checking accounts | 13,355.3 | 14,353.1 | 13,729.4 | -4.3% | 2.8% | ||||
| Other deposits | 492.3 | 502.8 | 596.9 | 18.7% | 21.2% | ||||
| Non-interest bearing | 13,847.6 | 14,855.9 | 14,326.2 | -3.6% | 3.5% | ||||
| Checking accounts | 18,401.2 | 19,672.1 | 19,672.1 | 0.0% | 6.9% | ||||
| Time deposits | 62,866.8 | 63,831.1 | 66,265.0 | 3.8% | 5.4% | ||||
| Savings deposits | 51,770.9 | 53,599.1 | 52,925.2 | -1.3% | 2.2% | ||||
| Interest bearing | 133,038.9 | 137,102.2 | 138,862.3 | 1.3% | 4.4% | ||||
| Deposits from clients at amortized cost | 146,886.5 | 151,958.1 | 153,188.5 | 0.8% | 4.3% | ||||
Of our total deposits as of September 30th, 2018 checking accounts represented 21.8%, time deposits 43.3%, savings accounts 34.5%, and other deposits 0.4%.
The following table shows the deposits composition by bank. During the last twelve months, Banco Popular showed the highest growth rate in deposits within our banking operation in Colombia.
| Deposits / Bank ($) | 3Q17 | 2Q18 | 3Q18 | D | |||||
| 3Q18 vs. 2Q18 | 3Q18 vs. 3Q17 | ||||||||
| Banco de Bogotá | 94,919.6 | 97,736.2 | 98,944.1 | 1.2% | 4.2% | ||||
| Domestic | 53,520.9 | 52,901.9 | 53,724.9 | 1.6% | 0.4% | ||||
| Central America | 41,398.7 | 44,834.3 | 45,219.1 | 0.9% | 9.2% | ||||
| Banco de Occidente | 25,183.8 | 25,080.7 | 25,662.5 | 2.3% | 1.9% | ||||
| Banco Popular | 15,128.2 | 16,817.6 | 17,197.4 | 2.3% | 13.7% | ||||
| Banco AV Villas | 9,922.9 | 10,105.6 | 10,417.7 | 3.1% | 5.0% | ||||
| Corficolombiana | 4,148.0 | 3,975.0 | 3,727.3 | -6.2% | -10.1% | ||||
| Eliminations | (2,415.9 | ) | (1,757.0 | ) | (2,760.4 | ) | 57.1% | 14.3% | |
| Total Grupo Aval | 146,886.5 | 151,958.1 | 153,188.5 | 0.8% | 4.3% | ||||
| Deposits / Bank (%) | 3Q17 | 2Q18 | 3Q18 | ||||||
| Banco de Bogotá | 64.6% | 64.3% | 64.6% | ||||||
| Domestic | 36.4% | 34.8% | 35.1% | ||||||
| Central America | 28.2% | 29.5% | 29.5% | ||||||
| Banco de Occidente | 17.1% | 16.5% | 16.8% | ||||||
| Banco Popular | 10.3% | 11.1% | 11.2% | ||||||
| Banco AV Villas | 6.8% | 6.7% | 6.8% | ||||||
| Corficolombiana | 2.8% | 2.6% | 2.4% | ||||||
| Eliminations | -1.6% | -1.2% | -1.8% | ||||||
| Total Grupo Aval | 100.0% | 100.0% | 100.0% | ||||||
| 11 | |
2.1.2 Borrowings from Banks and Other (includes borrowings from development entities)
As of September 30th, 2018 borrowings from banks and other totaled Ps 20,534.5 billion, showing increases of 4.8% versus September 30th, 2017 and of 3.2% versus June 30th, 2018. Excluding FX, borrowings from banks and other increased 4.2% versus September 30th, 2017 and 2.6% versus June 30th, 2018.
2.1.3 Bonds
Total bonds as of September 30th, 2018 totaled Ps 19,128.2 billion showing an increase of 3.4% versus September 30th, 2017 and a decrease of 1.1% versus June 30th, 2018. Excluding FX, bonds increased 3.3% versus September 30th, 2017 and decreased 1.2% versus June 30th, 2018.
3. Non-controlling Interest
Non-controlling Interest in Grupo Aval reflects: (i) the minority stakes that third party shareholders hold in each of its direct consolidated subsidiaries (Banco de Bogotá, Banco de Occidente, Banco Popular, Banco AV Villas and Corficolombiana), and (ii) the minority stakes that third party shareholders hold in the consolidated subsidiaries at the bank level (mainly Porvenir). As of September 30th, 2018 non-controlling interest was Ps 11,011.0 billion which increased by 18.6% versus September 30th, 2017 and 16.6% versus June 30th, 2018 mainly driven by the resulting dilution from Corficolombiana’s capitalization process in August 2018. Total non-controlling interest represents 39.5% of total equity as of September 30th, 2018. Total non-controlling interest derives from the sum of the combined minority interests of our banks and of Grupo Aval, applying eliminations associated with the consolidation process of Grupo Aval.
| Direct & indirect ownership of main subsidiaries | 3Q17 | 2Q18 | 3Q18 | D | |||||
| 3Q18 vs. 2Q18 | 3Q18 vs. 3Q17 | ||||||||
| Banco de Bogotá | 68.7% | 68.7% | 68.7% | - | - | ||||
| Banco de Occidente | 72.3% | 72.3% | 72.3% | - | - | ||||
| Banco Popular | 93.7% | 93.7% | 93.7% | - | - | ||||
| Banco AV Villas | 79.9% | 79.9% | 79.9% | - | - | ||||
| BAC Credomatic(1) | 68.7% | 68.7% | 68.7% | - | - | ||||
| Porvenir(2) | 75.7% | 75.7% | 75.7% | - | - | ||||
| Corficolombiana(3) | 44.8% | 44.9% | 38.2% | (667) | (656) | ||||
(1) BAC Credomatic is fully owned by Banco de Bogotá; (2) Grupo Aval indirectly owns a 100% of Porvenir as follows: 20.0% in Grupo Aval, 46.9% in Banco de Bogotá and 33.1% in Banco de Occidente. Porvenir's results consolidate into Banco de Bogotá; (3) Grupo Aval increased its direct ownership in Corficolombiana mainly due to stock dividend distributions.
4. Attributable Shareholders’ Equity
Attributable shareholders’ equity as of September 30th, 2018 was Ps 16,895.2 billion, showing an increase of 6.3% versus September 30th, 2017 and 6.7% versus June 30th, 2018.
| 12 | |
Income Statement Analysis
Our net income attributable to shareholders for 3Q18 of Ps 782.7 billion showed a 78.7% increase versus 3Q17 and a 14.9% increase versus 2Q18.
| Consolidated Statement of Income | 3Q17 | 2Q18 | 3Q18 | D | |||||
| 3Q18 vs. 2Q18 | 3Q18 vs. 3Q17 | ||||||||
| Interest income | 4,661.6 | 4,541.4 | 4,599.3 | 1.3% | -1.3% | ||||
| Interest expense | 1,985.5 | 1,842.0 | 1,847.3 | 0.3% | -7.0% | ||||
| Net interest income | 2,676.1 | 2,699.4 | 2,752.0 | 1.9% | 2.8% | ||||
| Impairment loss on loans and accounts receivable | 1,091.4 | 856.9 | 1,013.9 | 18.3% | -7.1% | ||||
| Impairment loss on other financial assets | (0.0 | ) | (8.1 | ) | 3.9 | -148.3% | N.A | ||
| Impairment loss on other assets | 1.2 | 6.3 | 5.5 | -13.7% | N.A. | ||||
| Recovery of charged-off assets | (65.2 | ) | (88.9 | ) | (83.4 | ) | -6.2% | 27.8% | |
| Impairment loss, net | 1,027.4 | 766.3 | 939.9 | 22.7% | -8.5% | ||||
| Net income from commissions and fees | 1,148.8 | 1,199.0 | 1,193.8 | -0.4% | 3.9% | ||||
| Net income from sales of goods and services to clients (non-financial sector) | 159.3 | 259.0 | 972.3 | N.A. | N.A. | ||||
| Net trading income | 66.9 | 244.7 | 109.5 | -55.3% | 63.6% | ||||
| Net income from financial instruments designated at fair value | 45.3 | 75.0 | 50.2 | -33.1% | 10.7% | ||||
| Total other income | 317.5 | 134.5 | 297.6 | 121.2% | -6.3% | ||||
| Total other expenses | 2,170.5 | 2,251.4 | 2,231.4 | -0.9% | 2.8% | ||||
| Income before income tax expense | 1,216.1 | 1,594.0 | 2,204.0 | 38.3% | 81.2% | ||||
| Income tax expense | 470.8 | 454.7 | 750.8 | 65.1% | 59.5% | ||||
| Income from continued operations | 745.3 | 1,139.3 | 1,453.2 | 27.6% | 95.0% | ||||
| Income from discontinued operations | 0.0 | - | (0.0 | ) | N.A | N.A | |||
| Net income before non-controlling interest | 745.3 | 1,139.3 | 1,453.2 | 27.6% | 95.0% | ||||
| Non-controlling interest | 307.4 | 457.7 | 670.4 | 46.5% | 118.1% | ||||
| Net income attributable to the owners of the parent company | 437.9 | 681.5 | 782.7 | 14.8% | 78.7% | ||||
1. Net Interest Income
| Net interest income | 3Q17 | 2Q18 | 3Q18 | D | |||||
| 3Q18 vs. 2Q18 | 3Q18 vs. 3Q17 | ||||||||
| Interest income | |||||||||
| Commercial | 1,995.2 | 1,806.4 | 1,809.3 | 0.2% | -9.3% | ||||
| Interbank and overnight funds | 80.0 | 87.5 | 77.4 | -11.5% | -3.3% | ||||
| Consumer | 2,046.0 | 2,035.4 | 2,072.8 | 1.8% | 1.3% | ||||
| Mortgages and housing leases | 323.3 | 349.5 | 366.2 | 4.8% | 13.3% | ||||
| Microcredit | 25.8 | 28.8 | 26.4 | -8.2% | 2.4% | ||||
| Loan portfolio interest | 4,470.5 | 4,307.6 | 4,352.2 | 1.0% | -2.6% | ||||
| Interests on investments in debt securities | 191.2 | 233.7 | 247.1 | 5.7% | 29.3% | ||||
| Total interest income | 4,661.6 | 4,541.4 | 4,599.3 | 1.3% | -1.3% | ||||
| Interest expense | |||||||||
| Checking accounts | 72.0 | 91.6 | 81.2 | -11.4% | 12.8% | ||||
| Time deposits | 887.6 | 813.7 | 823.8 | 1.2% | -7.2% | ||||
| Savings deposits | 455.8 | 365.0 | 368.0 | 0.8% | -19.2% | ||||
| Total interest expenses on deposits | 1,415.4 | 1,270.3 | 1,273.1 | 0.2% | -10.1% | ||||
| Borrowings | 531.5 | 536.7 | 539.2 | 0.5% | 1.4% | ||||
| Interbank borrowings and overnight funds | 55.0 | 65.4 | 56.2 | -14.2% | 2.1% | ||||
| Borrowings from banks and others | 178.7 | 183.0 | 193.8 | 5.9% | 8.5% | ||||
| Bonds | 297.9 | 288.2 | 289.2 | 0.3% | -2.9% | ||||
| Borrowings from development entities | 38.6 | 35.0 | 35.1 | 0.2% | -9.1% | ||||
| Total interest expense | 1,985.5 | 1,842.0 | 1,847.3 | 0.3% | -7.0% | ||||
| Net interest income | 2,676.1 | 2,699.4 | 2,752.0 | 1.9% | 2.8% | ||||
| 13 | |
Our net interest income increased by 2.8% to Ps 2,752.0 billion for 3Q18 versus 3Q17 and 1.9% versus 2Q18. The increase versus 3Q17 was derived from a 7.0% decrease in total interest expense that was partially offset by a 1.3% decrease in total interest income.
Our Net Interest Margin(1) was 5.8% for 3Q18 and 2Q18, and 5.9% for 3Q17. Net Interest Margin on Loans was 6.8% for 3Q18 and 2Q18, and 7.0% in 3Q17. On the other hand, our Net Investments Margin was 0.8% in 3Q18 versus 0.9% in 2Q18 and 0.3% in 3Q17.
In our Colombian operations, our Net Interest Margin was 5.5% for 3Q18, 5.6% for 2Q18, and 5.7% for 3Q17. Net Interest Margin on Loans was 6.5% for 3Q18 and 2Q18, and 6.8% in 3Q17. On the other hand, our Net Investments Margin was 0.7% in 3Q18 versus 1.2% in 2Q18 and -0.3% in 3Q17.
In our Central American operations, our Net Interest Margin was 6.5% for 3Q18, 6.3% in 2Q18, and 6.6% in 3Q17. Net Interest Margin on Loans was 7.4% for 3Q18, 2Q18 and 3Q17. On the other hand, our Net Investments Margin was 1.1% in 3Q18 versus 0.0% in 2Q18 and 1.9% in 3Q17.
Our Net Interest Margin from our financial operation (excluding non-financial sector and holding company) was 6.0% in 3Q18 and 2Q18, and 6.1% in 3Q17. Net Interest Margin on Loans from our financial operation (excluding non-financial sector and holding company) was 7.0% for 3Q18 and 2Q18, and 7.2% in 3Q17.(2)
2. Impairment loss on financial assets, net(3)
Our impairment loss on financial assets, net decreased by 8.5% to Ps 939.9 billion for 3Q18 versus 3Q17 and increased 22.7% versus 2Q18.
| Impairment loss, net | 3Q17 | 2Q18 | 3Q18 | D | |||||
| 3Q18 vs. 2Q18 | 3Q18 vs. 3Q17 | ||||||||
| Impairment loss on loans and accounts receivable | 1,091.4 | 856.9 | 1,013.9 | 18.3% | -7.1% | ||||
| Recovery of charged-off assets | (65.2 | ) | (88.9 | ) | (83.4 | ) | -6.2% | 27.8% | |
| Impairment loss on other financial assets | (0.0 | ) | (8.1 | ) | 3.9 | -148.3% | N.A | ||
| Impairment loss on other assets | 1.2 | 6.3 | 5.5 | -13.7% | N.A. | ||||
| Impairment loss, net | 1,027.4 | 766.3 | 939.9 | 22.7% | -8.5% | ||||
Our annualized gross cost of risk was 2.5% for 3Q18, 2.2% for 2Q18 and 2.8% for 3Q17. Net of recoveries of charged-off assets our ratio was 2.3% for 3Q18, 1.9% for 2Q18, and 2.6% for 3Q17. The increase in our cost of risk in the quarter was mainly driven by our Central American operation.
| (1) | Grupo Aval’s NIM without income from investment securities held for trading through profit or loss was 5.9% for 3Q18, 5.8% for 2Q18 and 5.9% for 3Q17. |
| (2) | Grupo Aval’s NIM for the nine-month period ended September 30, 2018, includes a negative impact of Ps 250.0 billion of provisions for interest of loans in Stage 3. |
| (3) The impairment loss on financial assets, net excludes the aforementioned Ps 250.0 billion. |
| 14 | |
3. Non-interest income
| Total non-interest income | 3Q17 | 2Q18 | 3Q18 | D | |||||
| 3Q18 vs. 2Q18 | 3Q18 vs. 3Q17 | ||||||||
| Income from commissions and fees | |||||||||
| Banking fees | 968.3 | 994.3 | 975.8 | -1.9% | 0.8% | ||||
| Trust and portfolio management activities | 75.2 | 77.3 | 77.3 | -0.1% | 2.8% | ||||
| Pension and severance fund management | 227.0 | 235.2 | 244.1 | 3.8% | 7.6% | ||||
| Bonded warehouse services | 40.4 | 39.0 | 38.9 | -0.3% | -3.6% | ||||
| Total income from commissions and fees | 1,310.8 | 1,345.8 | 1,336.1 | -0.7% | 1.9% | ||||
| Expenses for commissions and fees | 162.1 | 146.9 | 142.3 | -3.1% | -12.2% | ||||
| Net income from commissions and fees | 1,148.8 | 1,199.0 | 1,193.8 | -0.4% | 3.9% | ||||
| Income from sales of goods and services to clients | 1,498.4 | 1,398.6 | 2,465.2 | 76.3% | 64.5% | ||||
| Costs and expenses from sales of goods and services to clients | 1,339.1 | 1,139.6 | 1,492.9 | 31.0% | 11.5% | ||||
| Net income from sales of goods and services to clients (non-financial sector) | 159.3 | 259.0 | 972.3 | N.A. | N.A. | ||||
| Net trading income | 66.9 | 244.7 | 109.5 | -55.3% | 63.6% | ||||
| Net income from financial instruments designated at fair value | 45.3 | 75.0 | 50.2 | -33.1% | 10.7% | ||||
| Other income | |||||||||
| Foreign exchange gains (losses), net | 151.6 | (24.4 | ) | 106.0 | N.A | -30.0% | |||
| Net gain on sale of investments | 13.6 | 23.7 | 5.9 | -74.9% | -56.5% | ||||
| Gain on the sale of non-current assets held for sale | 4.3 | 3.9 | 8.3 | 112.6% | 91.8% | ||||
| Income from non-consolidated investments | 47.8 | 50.5 | 58.9 | 16.7% | 23.2% | ||||
| Net gains on asset valuations | 6.3 | (0.4 | ) | 2.2 | N.A | -65.1% | |||
| Other operating income | 93.8 | 81.3 | 116.2 | 42.8% | 23.8% | ||||
| Total other income | 317.5 | 134.5 | 297.6 | 121.2% | -6.3% | ||||
| Total non-interest income | 1,737.8 | 1,912.2 | 2,623.3 | 37.2% | 51.0% | ||||
(1)Includes commissions on banking services, office network services, credit and debit card fees, fees on drafts, checks and checkbooks and other fees
(2)Includes equity method and dividends
3.1 Net income from commissions and fees
Net Income from commissions and fees increased by 3.9% to Ps 1,193.8 billion for 3Q18 versus 3Q17 and decreased 0.4% in the quarter. Income from commissions and fees increased by 1.9% to Ps 1,336.1 billion in 3Q18 versus 3Q17 and decreased 0.7% in the quarter. Excluding FX, net income from commissions increased 4.2% and decreased 2.2%, respectively. In Colombia, net income from commissions and fees increased by 3.6% over the last year and decreased 1.3% over the quarter. In Central America, net income from commissions and fees increased by 4.4% over the last year and 0.7% over the quarter; excluding FX, net income increased by 5.0% over the last year and decreased 3.4% during the quarter.
3.2 Net income from sales of goods and services to clients (non-financial sector)
Income from non-financial sector, net increased by 510.3% to Ps 972.3 billion for 3Q18 versus 3Q17 and 275.4% during the quarter. The yearly and quarterly increases mainly reflect the impact of the implementation of IFRS 15 in Corficolombiana’s Fourth Generation concessions. 3Q18 results for our non-financial sector includes a retroactive income of Ps 330,000 million (Ps 125,000 million at Grupo Aval’s attributable net income level).
Also contributing to the results of our non-financial sector was a better performance from our operations in energy and gas and hotels.
| 15 | |
3.3 Net trading income
| Net trading income | 3Q17 | 2Q18 | 3Q18 | D | |||||
| 3Q18 vs. 2Q18 | 3Q18 vs. 3Q17 | ||||||||
| Investments held for trading | 63.9 | 64.5 | 44.5 | -31.0% | -30.3% | ||||
| Trading derivatives | (41.6 | ) | 139.3 | 24.9 | -82.1% | -159.9% | |||
| Hedging activities | 44.6 | 40.8 | 40.0 | -2.0% | -10.2% | ||||
| Net trading income | 66.9 | 244.7 | 109.5 | -55.3% | 63.6% | ||||
Net trading income for Grupo Aval should be analyzed in conjunction with the foreign exchange gains (losses).
3.4 Other income
Total other income (expense) for 3Q18 totaled Ps 297.6 billion decreasing by 6.3% versus 3Q17 and increasing 121.2% versus 2Q18. The quarterly increase was mainly driven by higher income from foreign exchange gains, net.
4. Other expenses
Total other expenses for 3Q18 totaled Ps 2,231.4 billion increasing by 2.8% versus 3Q17 and decreasing 0.9% versus 2Q18. Our efficiency ratio measured as operating expenses before depreciation and amortization to total income, was 39.1% in 3Q18 (in absence of the Ps 330 billion of retroactive income this ratio would have been approximately 42%), 46.1% in 2Q18 and 46.8% in 3Q17. The ratio of annualized operating expenses before depreciation and amortization as a percentage of average total assets was 3.5% in 3Q18, 3.6% in 2Q18 and 3.5% in 3Q17.
In Colombia, our efficiency ratio measured as operating expenses before depreciation and amortization to total income, was 34.8% in 3Q18, 43.1% in 2Q18, and 44.1% in 3Q17. The ratio of annualized operating expenses before depreciation and amortization as a percentage of average total assets was 3.1% in 3Q18, 3.2% in 2Q18 and 3.2% in 3Q17.
In Central America, our efficiency ratio measured as operating expenses before depreciation and amortization to total income, was 49.3% in 3Q18, 52.6 % in 2Q18 and 52.5% in 3Q17. The ratio of annualized operating expenses before depreciation and amortization as a percentage of average total assets was 4.4% in 3Q18, 4.5% in 2Q18 and 4.4% in 3Q17.
5. Non-controlling Interest
Non-controlling interest in Grupo Aval reflects: (i) the minority stakes that third party shareholders hold in each of its direct consolidated subsidiaries (Banco de Bogotá, Banco de Occidente, Banco Popular, Banco AV Villas and Corficolombiana), and (ii) the minority stakes that third party shareholders hold in the consolidated subsidiaries at the bank level (mainly Porvenir). For 3Q18, non-controlling interest in the income statement was Ps 670.4 billion, showing a 118.1% increase versus 3Q17 and a 46.5% increase versus 2Q18. The ratio of non-controlling interest to income before non-controlling interest was 46.1% in 3Q18, 40.2% in 2Q18 and 41.2% in 3Q17.
The increase in non-controlling interest is mainly driven by (i) higher net income from Corficolombiana and (ii) by the dilution resulting from Corficolombiana’s capitalization process in August 2018.
| 16 | |
Information related to Grupo Aval’s consolidated financial statements by geography
Grupo Aval Acciones y Valores S.A. - Colombian Operation
Financial Statements Under Full IFRS
Information in Ps. Billions
| 3Q17 | 2Q18 | 3Q18 | D | |||||||
| 3Q18 vs. 2Q18 | 3Q18 vs. 3Q17 | |||||||||
| Gross loans and receivables | 111,208.5 | 113,974.5 | 114,618.1 | 0.6% | 3.1% | |||||
| Total assets | 162,360.6 | 165,647.8 | 171,956.3 | 3.8% | 5.9% | |||||
| Deposits from clients at amortized cost | 105,487.8 | 107,123.8 | 107,969.4 | 0.8% | 2.4% | |||||
| Total liabilities | 148,081.4 | 151,598.7 | 155,595.7 | 2.6% | 5.1% | |||||
| Net income before non-controlling interest | 477.1 | 855.9 | 1,163.2 | 35.9% | 143.8% | |||||
| Net income attributable to the owners of the parent company | 253.6 | 486.8 | 583.4 | 19.9% | 130.0% | |||||
| YTD 2017 | YTD 2018 | D | ||||||||
| 2018 vs. 2017 | ||||||||||
| Net income before non-controlling interest | 1,652.8 | 2,688.2 | 62.6% | |||||||
| A | Net income attributable to the owners of the parent company | 963.0 | 1,474.0 | 53.1% | ||||||
Leasing Bogotá Panamá S.A.(1)
Financial Statements Under IFRS
Information in Ps. Billions
| 3Q17 | 2Q18 | 3Q18 | D | |||||||
| 3Q18 vs. 2Q18 | 3Q18 vs. 3Q17 | |||||||||
| Gross loans and receivables | 44,193.6 | 46,322.0 | 47,198.6 | 1.9% | 6.8% | |||||
| Total assets | 65,702.5 | 68,899.6 | 69,530.7 | 0.9% | 5.8% | |||||
| Deposits from clients at amortized cost | 41,398.7 | 44,834.3 | 45,219.1 | 0.9% | 9.2% | |||||
| Total liabilities | 54,800.0 | 57,678.7 | 57,985.0 | 0.5% | 5.8% | |||||
| Net income before non-controlling interest | 268.2 | 283.3 | 289.9 | 2.3% | 8.1% | |||||
| Net income attributable to the owners of the parent company | 184.3 | 194.7 | 199.3 | 2.3% | 8.1% | |||||
| YTD 2017 | YTD 2018 | D | ||||||||
| 2018 vs. 2017 | ||||||||||
| Net income before non-controlling interest | 775.1 | 855.5 | 10.4% | |||||||
| B | Net income attributable to the owners of the parent company | 532.7 | 588.0 | 10.4% | ||||||
| A+B | Net income attributable to the owners of the parent company | 1,495.7 | 2,062.0 | 37.9% | ||||||
(1) Leasing Bogotá Panamá is the holding company that consolidates our Central American operations.
| 17 | |
Information related to Grupo Aval Acciones y Valores S.A. (Holding Company) and Grupo Aval Limited
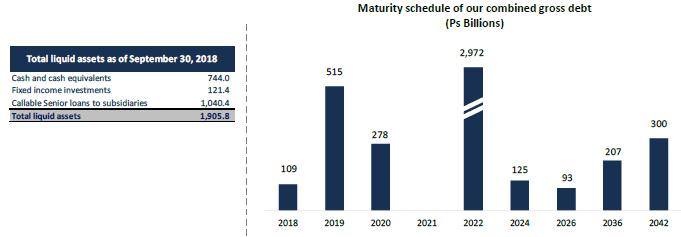
The holding company recorded a total gross indebtedness of Ps 1,652.4 billion (Ps 543.4 billion of bank debt and Ps 1,109.0 billion of bonds denominated in Colombian pesos) as of September 30th, 2018. It also guarantees irrevocably and unconditionally Grupo Aval Limited’s (144A / Reg S) 2022 (USD 1.0 billion) bonds under its respective indentures. As of September 30th, 2018 the total amount outstanding (including interests payable) of such bonds was USD 1.0 billion, or Ps 2,973.7 billion when translated into pesos.
The debt at Grupo Aval Limited is serviced with interest income on loans to subsidiaries and cash & cash equivalents. Grupo Aval Limited has not required, to this date, cash from Grupo Aval Acciones y Valores S.A. to fulfill its obligations. The main sources of cash to pay the debt and debt service at Grupo Aval Acciones y Valores S.A. have been the dividend income from its subsidiaries and the returns on its cash & cash equivalents.
When combined, Grupo Aval Acciones y Valores S.A. and Grupo Aval Ltd. had Ps 1,905.8 billion of total liquid assets, a total gross indebtedness of Ps 4,607.9 billion and a net indebtedness (including callable senior loans to subsidiaries) of Ps 2,702.1 billion as of September 30th, 2018. In addition to liquid assets, Grupo Aval Ltd. has Ps 722.1 billion in other loans to subsidiaries.
As of September 30th, 2018 our combined double leverage (calculated as investments in subsidiaries at book value, subordinated loans to subsidiaries and goodwill as a percentage of shareholders' equity) was 1.16x. Finally, we present an evolution of our key ratios on a combined basis:
| Debt service coverage and leverage ratios | 3Q17 | 2Q18 | 3Q18 | D | |||||
| 3Q18 vs. 2Q18 | 3Q18 vs. 3Q17 | ||||||||
| Double leverage (1) | 1.15x | 1.16x | 1.16x | -0.01 | -0.01 | ||||
| Net debt / Core earnings (2)(3) | 2.8x | 2.7x | 2.7x | -0.1 | 0.2 | ||||
| Net debt / Cash dividends (2)(3) | 3.5x | 3.2x | 3.6x | 0.0 | 0.2 | ||||
| Core Earnings / Interest Expense (2) | 3.6x | 4.8x | 5.0x | 0.0 | 0.0 | ||||
(1) Double leverage is calculated as investments in subsidiaries at book value (excluding revaluations), subordinated loans to subsidiaries and goodwill as a percentage of shareholders' equity; (2) Core earnings are defined as annualized recurring cash flow from dividends, investments and net operating income; (3) Net debt is calculated as total gross debt minus cash and cash equivalents and fixed income investments
| 18 | |
ABOUT GRUPO AVAL
Grupo Aval is Colombia’s largest banking group, and through our BAC Credomatic operations it is also the largest and the most profitable banking group in Central America. Grupo Aval currently operates through four commercial banks in Colombia (Banco de Bogotá, Banco de Occidente, Banco Popular and Banco AV Villas). It manages pension and severance funds through the largest pension and severance fund manager in Colombia (Porvenir) and owns the largest merchant bank in Colombia (Corficolombiana), each of which Aval controls and consolidates into its results.
Investor Relations Contacts
Tatiana Uribe Benninghoff
Vice President of Financial Planning and Investor Relations
Tel: +571 241 9700 x3600
E-mail:turibe@grupoaval.com
Alejo Sánchez García
Financial Planning and Investor Relations Manager
Tel: +571 241 9700 x3600
E-mail:asanchez@grupoaval.com
| 19 | |
Grupo Aval Acciones y Valores S.A.
Consolidated Financial Statements Under IFRS
Financial Statements Under IFRS
Information in Ps. Billions
| Consolidated Statement of Financial Position | 3Q17 | 2Q18 | 3Q18 | D | |||||
| 3Q18 vs. 2Q18 | 3Q18 vs. 3Q17 | ||||||||
| Cash and cash equivalents | 21,821.4 | 21,175.2 | 24,396.8 | 15.2% | 11.8% | ||||
| Financial assets held for investment | |||||||||
| Debt securities | 2,456.1 | 2,421.5 | 2,467.3 | 1.9% | 0.5% | ||||
| Equity securities | 1,950.7 | 2,122.9 | 2,318.2 | 9.2% | 18.8% | ||||
| Derivative instruments | 379.3 | 469.0 | 605.6 | 29.1% | 59.7% | ||||
| Total financial assets held for trading through profit or losses | 4,786.1 | 5,013.4 | 5,391.2 | 7.5% | 12.6% | ||||
| Debt securities | 16,867.1 | 19,175.2 | 19,870.3 | 3.6% | 17.8% | ||||
| Equity securities | 814.9 | 911.4 | 1,212.9 | 33.1% | 48.8% | ||||
| Total available for sale financial assets | 17,682.0 | 20,086.6 | 21,083.2 | 5.0% | 19.2% | ||||
| Investments held to maturity | 2,663.1 | 2,961.1 | 2,999.4 | 1.3% | 12.6% | ||||
| Other financial assets at fair value through profit or loss | 2,220.7 | 2,409.7 | 2,459.8 | 2.1% | 10.8% | ||||
| Total financial assets held for investment | 27,352.0 | 30,470.7 | 31,933.5 | 4.8% | 16.8% | ||||
| Loans and receivables | |||||||||
| Commercial loans and leases | 95,658.8 | 96,959.6 | 95,608.7 | -1.4% | -0.1% | ||||
| Commercial loans and leases | 90,797.1 | 91,769.8 | 91,648.3 | -0.1% | 0.9% | ||||
| Interbank & overnight funds | 4,861.7 | 5,189.8 | 3,960.3 | -23.7% | -18.5% | ||||
| Consumer loans and leases | 48,781.7 | 51,379.5 | 52,504.9 | 2.2% | 7.6% | ||||
| Mortgages and housing leases | 15,418.6 | 16,729.4 | 17,244.0 | 3.1% | 11.8% | ||||
| Microcredit loans and leases | 404.7 | 417.8 | 419.5 | 0.4% | 3.7% | ||||
| Total loans and leases operations and receivables portfolio | 160,263.8 | 165,486.3 | 165,777.0 | 0.2% | 3.4% | ||||
| Allowance for impairment of loans and receivables | (5,243.9 | ) | (7,180.6 | ) | (7,511.9 | ) | 4.6% | 43.3% | |
| Total loans and receivables, net | 155,019.9 | 158,305.7 | 158,265.1 | 0.0% | 2.1% | ||||
| Other accounts receivable | 3,781.0 | 4,290.8 | 5,184.9 | 20.8% | 37.1% | ||||
| Hedging derivatives | 112.9 | 85.6 | 85.6 | 0.0% | -24.2% | ||||
| Non-current assets held for sale | 166.9 | 104.8 | 102.3 | -2.5% | -38.7% | ||||
| Investments in associates and joint ventures | 1,154.6 | 986.0 | 1,048.5 | 6.3% | -9.2% | ||||
| Own-use property, plant and equipment, net | 5,749.3 | 5,573.2 | 5,573.0 | 0.0% | -3.1% | ||||
| Investment properties | 764.3 | 813.2 | 812.9 | 0.0% | 6.4% | ||||
| Biological assets | 65.8 | 75.1 | 79.3 | 5.6% | 20.6% | ||||
| Tangible assets | 6,579.4 | 6,461.4 | 6,465.3 | 0.1% | -1.7% | ||||
| Goodwill | 6,724.3 | 6,817.5 | 6,882.5 | 1.0% | 2.4% | ||||
| Concession arrangement rights | 2,952.3 | 3,493.3 | 4,981.0 | 42.6% | 68.7% | ||||
| Other intangible assets | 803.9 | 915.3 | 974.8 | 6.5% | 21.3% | ||||
| Intangible assets | 10,480.5 | 11,226.1 | 12,838.3 | 14.4% | 22.5% | ||||
| Current | 819.5 | 778.3 | 518.7 | -33.3% | -36.7% | ||||
| Deferred | 139.1 | 192.3 | 198.6 | 3.2% | 42.7% | ||||
| Income tax assets | 958.7 | 970.6 | 717.3 | -26.1% | -25.2% | ||||
| Other assets | 635.9 | 470.4 | 449.4 | -4.5% | -29.3% | ||||
| Total assets | 228,063.1 | 234,547.4 | 241,487.0 | 3.0% | 5.9% | ||||
| Derivative instruments held for trading | 385.0 | 478.1 | 488.9 | 2.2% | 27.0% | ||||
| Total financial liabilities held for trading | 385.0 | 478.1 | 488.9 | 2.2% | 27.0% | ||||
| Deposits from clients at amortized cost | 146,886.5 | 151,958.1 | 153,188.5 | 0.8% | 4.3% | ||||
| Checking accounts | 31,756.4 | 34,025.2 | 33,401.4 | -1.8% | 5.2% | ||||
| Time deposits | 62,866.8 | 63,831.1 | 66,265.0 | 3.8% | 5.4% | ||||
| Savings deposits | 51,770.9 | 53,599.1 | 52,925.2 | -1.3% | 2.2% | ||||
| Other deposits | 492.3 | 502.8 | 596.9 | 18.7% | 21.2% | ||||
| Financial obligations | 43,087.0 | 43,338.5 | 44,892.4 | 3.6% | 4.2% | ||||
| Interbank borrowings and overnight funds | 7,895.6 | 7,154.7 | 8,669.9 | 21.2% | 9.8% | ||||
| Borrowings from banks and others | 16,698.1 | 16,836.5 | 17,094.3 | 1.5% | 2.4% | ||||
| Bonds | 18,493.4 | 19,347.3 | 19,128.2 | -1.1% | 3.4% | ||||
| Borrowings from development entities | 2,890.5 | 3,054.0 | 3,440.2 | 12.6% | 19.0% | ||||
| Total financial liabilities at amortized cost | 192,864.0 | 198,350.6 | 201,521.0 | 1.6% | 4.5% | ||||
| Hedging derivatives | 12.1 | 46.5 | 63.6 | 36.8% | N.A. | ||||
| Litigation | 162.7 | 175.2 | 171.5 | -2.1% | 5.4% | ||||
| Other provisions | 511.1 | 569.1 | 582.6 | 2.4% | 14.0% | ||||
| Provisions | 673.8 | 744.3 | 754.1 | 1.3% | 11.9% | ||||
| Current | 300.8 | 257.7 | 311.8 | 21.0% | 3.6% | ||||
| Deferred | 1,608.0 | 1,731.4 | 2,245.1 | 29.7% | 39.6% | ||||
| Income tax liabilities | 1,908.8 | 1,989.1 | 2,556.8 | 28.5% | 33.9% | ||||
| Employee benefits | 1,231.6 | 1,178.7 | 1,326.0 | 12.5% | 7.7% | ||||
| Other liabilities | 5,806.1 | 6,490.1 | 6,870.2 | 5.9% | 18.3% | ||||
| Total liabilities | 202,881.5 | 209,277.4 | 213,580.8 | 2.1% | 5.3% | ||||
| Equity attributable to owners of the parent company | 15,898.0 | 15,830.5 | 16,895.2 | 6.7% | 6.3% | ||||
| Non-controlling interests | 9,283.6 | 9,439.4 | 11,011.0 | 16.6% | 18.6% | ||||
| Total equity | 25,181.6 | 25,269.9 | 27,906.2 | 10.4% | 10.8% | ||||
| Total liabilities and equity | 228,063.1 | 234,547.4 | 241,487.0 | 3.0% | 5.9% | ||||
| 20 | |
Grupo Aval Acciones y Valores S.A.
Consolidated Financial Statements Under Full IFRS
Financial Statements Under IFRS
Information in Ps. Billions
| Consolidated Statement of income | YTD 2017 | YTD 2018 | D | 3Q17 | 2Q18 | 3Q18 | D | ||||||||
| 2018 vs. 2017 | 3Q18 vs. 2Q18 | 3Q18 vs. 3Q17 | |||||||||||||
| Interest income | |||||||||||||||
| Loan portfolio interest | 13,460.4 | 12,949.3 | -3.8% | 4,470.5 | 4,307.6 | 4,352.2 | 1.0% | -2.6% | |||||||
| Interests on investments in debt securities | 658.6 | 715.7 | 8.7% | 191.2 | 233.7 | 247.1 | 5.7% | 29.3% | |||||||
| Total interest income | 14,119.1 | 13,665.0 | -3.2% | 4,661.6 | 4,541.4 | 4,599.3 | 1.3% | -1.3% | |||||||
| Interest expense | |||||||||||||||
| Checking accounts | 236.5 | 253.4 | 7.1% | 72.0 | 91.6 | 81.2 | -11.4% | 12.8% | |||||||
| Time deposits | 2,736.1 | 2,454.5 | -10.3% | 887.6 | 813.7 | 823.8 | 1.2% | -7.2% | |||||||
| Savings deposits | 1,529.3 | 1,135.3 | -25.8% | 455.8 | 365.0 | 368.0 | 0.8% | -19.2% | |||||||
| Total interest expenses on deposits | 4,502.0 | 3,843.3 | -14.6% | 1,415.4 | 1,270.3 | 1,273.1 | 0.2% | -10.1% | |||||||
| Borrowings | 1,643.1 | 1,600.0 | -2.6% | 531.5 | 536.7 | 539.2 | 0.5% | 1.4% | |||||||
| Interbank borrowings and overnight funds | 218.5 | 177.3 | -18.9% | 55.0 | 65.4 | 56.2 | -14.2% | 2.1% | |||||||
| Borrowings from banks and others | 551.1 | 555.0 | 0.7% | 178.7 | 183.0 | 193.8 | 5.9% | 8.5% | |||||||
| Bonds | 873.5 | 867.8 | -0.7% | 297.9 | 288.2 | 289.2 | 0.3% | -2.9% | |||||||
| Borrowings from development entities | 121.6 | 106.8 | -12.1% | 38.6 | 35.0 | 35.1 | 0.2% | -9.1% | |||||||
| Total interest expense | 6,266.7 | 5,550.2 | -11.4% | 1,985.5 | 1,842.0 | 1,847.3 | 0.3% | -7.0% | |||||||
| Net interest income | 7,852.4 | 8,114.8 | 3.3% | 2,676.1 | 2,699.4 | 2,752.0 | 1.9% | 2.8% | |||||||
| Impairment loss | |||||||||||||||
| Impairment loss on loans and accounts receivable | 2,993.4 | 2,790.2 | -6.8% | 1,091.4 | 856.9 | 1,013.9 | 18.3% | -7.1% | |||||||
| Recovery of charged-off assets | (186.3 | ) | (238.4 | ) | 27.9% | (65.2 | ) | (88.9 | ) | (83.4 | ) | -6.2% | 27.8% | ||
| Impairment loss on other financial assets | 0.1 | (54.8 | ) | N.A | (0.0 | ) | (8.1 | ) | 3.9 | -148.3% | N.A | ||||
| Impairment loss on other assets | 18.3 | 17.7 | -2.9% | 1.2 | 6.3 | 5.5 | -13.7% | N.A. | |||||||
| Impairment loss, net | 2,825.5 | 2,514.7 | -11.0% | 1,027.4 | 766.3 | 939.9 | 22.7% | -8.5% | |||||||
| Net interest income, after impairment loss | 5,026.9 | 5,600.1 | 11.4% | 1,648.8 | 1,933.2 | 1,812.1 | -6.3% | 9.9% | |||||||
| Income from commissions and fees | |||||||||||||||
| Banking fees(1) | 2,837.9 | 2,914.1 | 2.7% | 968.3 | 994.3 | 975.8 | -1.9% | 0.8% | |||||||
| Trust activities | 227.9 | 231.5 | 1.6% | 75.2 | 77.3 | 77.3 | -0.1% | 2.8% | |||||||
| Pension and severance fund management | 695.3 | 732.9 | 5.4% | 227.0 | 235.2 | 244.1 | 3.8% | 7.6% | |||||||
| Bonded warehouse services | 128.5 | 115.2 | -10.3% | 40.4 | 39.0 | 38.9 | -0.3% | -3.6% | |||||||
| Total income from commissions and fees | 3,889.6 | 3,993.7 | 2.7% | 1,310.8 | 1,345.8 | 1,336.1 | -0.7% | 1.9% | |||||||
| Expenses for commissions and fees | 476.4 | 450.7 | -5.4% | 162.1 | 146.9 | 142.3 | -3.1% | -12.2% | |||||||
| Net income from commissions and fees | 3,413.2 | 3,543.0 | 3.8% | 1,148.8 | 1,199.0 | 1,193.8 | -0.4% | 3.9% | |||||||
| Income from sales of goods and services to clients | 4,263.0 | 5,297.0 | 24.3% | 1,498.4 | 1,398.6 | 2,465.2 | 76.3% | 64.5% | |||||||
| Costs and expenses from sales of goods and services to clients | 3,803.7 | 3,859.8 | 1.5% | 1,339.1 | 1,139.6 | 1,492.9 | 31.0% | 11.5% | |||||||
| Net income from sales of goods and services to clients | 459.4 | 1,437.1 | N.A. | 159.3 | 259.0 | 972.3 | N.A. | N.A. | |||||||
| Net trading income | 382.5 | 263.8 | -31.0% | 66.9 | 244.7 | 109.5 | -55.3% | 63.6% | |||||||
| Net income from financial instruments designated at fair value | 147.5 | 177.2 | 20.2% | 45.3 | 75.0 | 50.2 | -33.1% | 10.7% | |||||||
| Other income (expense) | |||||||||||||||
| Foreign exchange gains (losses), net | 346.3 | 371.3 | 7.2% | 151.6 | (24.4 | ) | 106.0 | N.A | -30.0% | ||||||
| Net gain on sale of investments | 28.4 | (14.0 | ) | -149.2% | 13.6 | 23.7 | 5.9 | -74.9% | -56.5% | ||||||
| Gain on the sale of non-current assets held for sale | 11.3 | 14.5 | 28.1% | 4.3 | 3.9 | 8.3 | 112.6% | 91.8% | |||||||
| Income from non-consolidated investments(2) | 184.9 | 203.6 | 10.1% | 47.8 | 50.5 | 58.9 | 16.7% | 23.2% | |||||||
| Net gains on asset valuations | 18.1 | 10.0 | -44.5% | 6.3 | (0.4 | ) | 2.2 | N.A | -65.1% | ||||||
| Other operating income | 264.5 | 272.4 | 3.0% | 93.8 | 81.3 | 116.2 | 42.8% | 23.8% | |||||||
| Total other income (expense) | 853.4 | 857.9 | 0.5% | 317.5 | �� 134.5 | 297.6 | 121.2% | -6.3% | |||||||
| Other expenses | |||||||||||||||
| Loss on the sale of non-current assets held for sale | 5.5 | 2.8 | -49.6% | 0.1 | 1.8 | 0.8 | -57.1% | N.A. | |||||||
| Personnel expenses | 2,741.6 | 2,831.4 | 3.3% | 921.4 | 960.5 | 946.8 | -1.4% | 2.8% | |||||||
| General and administrative expenses | 3,342.9 | 3,333.9 | -0.3% | 1,101.5 | 1,129.3 | 1,109.8 | -1.7% | 0.8% | |||||||
| Depreciation and amortization | 385.8 | 398.1 | 3.2% | 130.4 | 128.6 | 137.8 | 7.1% | 5.7% | |||||||
| Other operating expenses | 66.7 | 93.6 | 40.4% | 17.1 | 31.2 | 36.2 | 16.2% | 112.2% | |||||||
| Total other expenses | 6,542.4 | 6,659.7 | 1.8% | 2,170.5 | 2,251.4 | 2,231.4 | -0.9% | 2.8% | |||||||
| Income before income tax expense | 3,740.5 | 5,219.4 | 39.5% | 1,216.1 | 1,594.0 | 2,204.0 | 38.3% | 81.2% | |||||||
| Income tax expense | 1,312.6 | 1,675.7 | 27.7% | 470.8 | 454.7 | 750.8 | 65.1% | 59.5% | |||||||
| Income from continued operations | 2,427.9 | 3,543.8 | 46.0% | 745.3 | 1,139.3 | 1,453.2 | 27.6% | 95.0% | |||||||
| Income from discontinued operations | - | (0.0 | ) | - | 0.0 | - | (0.0 | ) | - | - | |||||
| Net income before non-controlling interest | 2,427.9 | 3,543.8 | 46.0% | 745.3 | 1,139.3 | 1,453.2 | 27.6% | 95.0% | |||||||
| Non-controlling interest | 932.2 | 1,481.8 | 59.0% | 307.4 | 457.7 | 670.4 | 46.5% | 118.1% | |||||||
| Net income attributable to the owners of the parent company | 1,495.7 | 2,062.0 | 37.9% | 437.9 | 681.5 | 782.7 | 14.8% | 78.7% | |||||||
(1)Includes commissions on banking services, office network services, credit and debit card fees, fees on drafts, checks and checkbooks and other fees
(2)Includes equity method and dividends
| 21 | |
Item 2

1 IFRS 3Q18 Consolidated Earnings Results

2 Disclaimer Grupo Aval Acciones y Valores S . A . (“Grupo Aval”) is an issuer of securities in Colombia and in the United States, registered with Colombia’s National Registry of Shares and Issuers ( Registro Nacional de Valores y Emisores ) and the United States Securities and Exchange Commission (“SEC”) . As such, it is subject to the control of the Superintendency of Finance and compliance with applicable U . S . securities regulation as a “foreign private issuer” under Rule 405 of the U . S . Securities Act of 1933 . All of our banking subsidiaries (Banco de Bogotá, Banco de Occidente , Banco Popular and Banco AV Villas), Porvenir and Corficolombiana , are subject to inspection and surveillance as financial institutions by the Superintendency of Finance . Although we are not a financial institution, as a result of the enactment of Law 1870 of 2017 , also known as Law of Financial Conglomerates, starting on February 6 , 2019 , Grupo Aval will be subject to the supervision and regulation of the Superintendency of Finance . Grupo Aval, as the holding company of its financial conglomerate will become responsible for the compliance with capital adequacy requirements, corporate governance standards, financial risk management and internal control framework and criteria for identifying, managing and revealing conflicts of interest, applicable to its financial conglomerate . The unaudited consolidated financial information included in this document is presented in accordance with IFRS as currently issued by the IASB . Details of the calculations of non - GAAP measures such as ROAA and ROAE, among others, are explained when required in this report . The results for 1 Q 2018 , 2 Q 2018 and 3 Q 2018 are not comparable to previous quarters due to the prospective adoption in Colombia of IFRS 9 and IFRS 15 starting in January 1 , 2018 . The previously reported figures for 2 Q 2018 had been adjusted to reflect the treatment of provision charges to stage 3 loans as described under IFRS 9 and detailed in KPMG’s practical guide to IFRS standards whose content we learnt post the 2 Q 2018 conference call and that clarifies the methodology that needs to be used to fully adopt this new standard . This report may include forward - looking statements, which actual results may vary from those stated herein as a consequence of changes in general, economic and business conditions, changes in interest and currency rates and other risks factors as evidenced in our Form 20 - F available at the SEC webpage . Recipients of this document are responsible for the assessment and use of the information provided herein . Grupo Aval will not have any obligation to update the information herein and shall not be responsible for any decision taken by investors in connection with this document . The content of this document and the unaudited figures included herein are not intended to provide full disclosure on Grupo Aval or its affiliates . When applicable, in this document we refer to billions as thousands of millions .
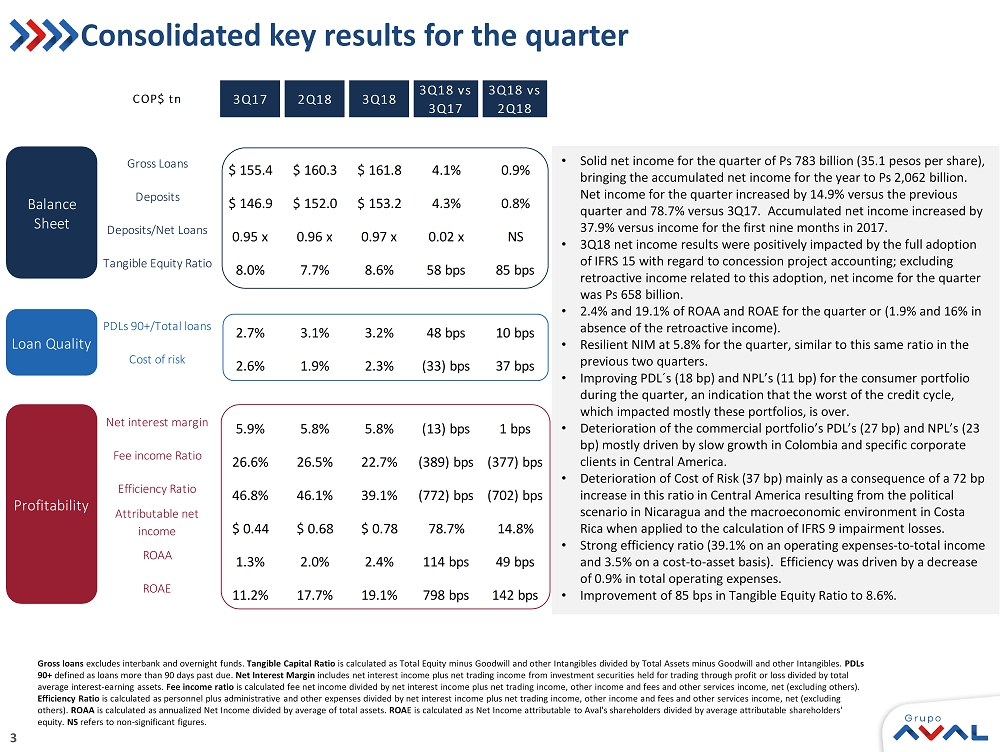
3 • Solid net income for the quarter of Ps 783 billion (35.1 pesos per share), bringing the accumulated net income for the year to Ps 2,062 billion. Net income for the quarter increased by 14.9% versus the previous quarter and 78.7% versus 3Q17. Accumulated net income increased by 37.9% versus income for the first nine months in 2017. • 3Q18 net income results were positively impacted by the full adoption of IFRS 15 with regard to concession project accounting; excluding retroactive income related to this adoption, net income for the quarter was Ps 658 billion. • 2.4% and 19.1% of ROAA and ROAE for the quarter or (1.9% and 16% in absence of the retroactive income). • Resilient NIM at 5.8% for the quarter, similar to this same ratio in the previous two quarters. • Improving PDL Dz s (18 bp ) and NPL’s (11 bp ) for the consumer portfolio during the quarter, an indication that the worst of the credit cycle, which impacted mostly these portfolios, is over. • Deterioration of the commercial portfolio’s PDL’s (27 bp ) and NPL’s (23 bp ) mostly driven by slow growth in Colombia and specific corporate clients in Central America. • Deterioration of Cost of Risk (37 bp ) mainly as a consequence of a 72 bp increase in this ratio in Central America resulting from the political scenario in Nicaragua and the macroeconomic environment in Costa Rica when applied to the calculation of IFRS 9 impairment losses. • Strong efficiency ratio (39.1% on an operating expenses - to - total income and 3.5% on a cost - to - asset basis). Efficiency was driven by a decrease of 0.9% in total operating expenses. • Improvement of 85 bps in Tangible Equity Ratio to 8.6%. Consolidated key results for the quarter Gross loans e xcludes interbank and overnight funds. Tangible Capital Ratio is calculated as Total Equity minus Goodwill and other Intangibles divided by Total Assets minus Goodwill and other Intangibl es. PDLs 90+ defined as loans more than 90 days past due. Net Interest Margin includes net interest income plus net trading income from investment securities held for trading through profit or loss divid ed by total average interest - earning assets. Fee income ratio is calculated fee net income divided by net interest income plus net trading income, other income and fees and other services in come, net (excluding others). Efficiency Ratio is calculated as personnel plus administrative and other expenses divided by net interest income plus net trading income, oth er income and fees and other services income, net (excluding others). ROAA is calculated as annualized Net Income divided by average of total assets. ROA E is calculated as Net Income attributable to Aval's shareholders divided by average attributable shareholders' equity. NS refers to non - significant figures. COP$ tn 3Q17 2Q18 3Q18 3Q18 vs 3Q17 3Q18 vs 2Q18 Gross Loans $ 155.4 $ 160.3 $ 161.8 4.1% 0.9% Deposits $ 146.9 $ 152.0 $ 153.2 4.3% 0.8% Deposits/Net Loans 0.95 x 0.96 x 0.97 x 0.02 x NS Tangible Equity Ratio 8.0% 7.7% 8.6% 58 bps 85 bps PDLs 90+/Total loans 2.7% 3.1% 3.2% 48 bps 10 bps Cost of risk 2.6% 1.9% 2.3% (33) bps 37 bps Net interest margin 5.9% 5.8% 5.8% (13) bps 1 bps Fee income Ratio 26.6% 26.5% 22.7% (389) bps (377) bps Efficiency Ratio 46.8% 46.1% 39.1% (772) bps (702) bps Attributable net income $ 0.44 $ 0.68 $ 0.78 78.7% 14.8% ROAA 1.3% 2.0% 2.4% 114 bps 49 bps ROAE 11.2% 17.7% 19.1% 798 bps 142 bps Balance Sheet Loan Quality Profitability

4 Key results per region for the quarter 71% of Assets 29% of Assets COP $ tn ( 1 ) Central America refers to Leasing Bogotá Panamá (LBP) operation expressed in Colombian Pesos, at the exchange rate of each period . ( 2 ) Attributable net income for Grupo Aval of Ps 782 . 7 bn for 3 Q 18 corresponds to the Ps 583 . 4 bn of our Colombian operation plus Ps 289 . 9 bn of our Central American operation multiplied by 68 . 7 % , our stake in Banco de Bogotá . Gross loans e xcludes interbank and overnight funds . Tangible Capital Ratio is calculated as Total Equity minus Goodwill and other Intangibles divided by Total Assets minus Goodwill and other Intangibles . PDLs 90 + defined as loans more than 90 days past due . Net Interest Margin includes net interest income plus net trading income from investment securities held for trading through profit or loss divided by total average interest - earning assets . Fee income ratio is calculated fee net income divided by net interest income plus net trading income, other income and fees and other services income, net (excluding others) . Efficiency Ratio is calculated as personnel plus administrative and other expenses excluding wealth tax divided by net interest income plus net trading income, other income and fees and other services income, net (excluding others) . ROAA is calculated as annualized Net Income divided by average of total assets . ROA E is calculated as Net Income attributable to Aval's shareholders divided by average attributable shareholders' equity . NS refers to non - significant figures . Equity for Central America is calculated as LBP multiplied by our 68 . 7 % stake in the company . Equity for Colombia is calculated as the difference between our consolidated attributable equity and the equity in Central America . Colombia Central America (1) (2) 3Q17 2Q18 3Q18 3Q18 vs 3Q17 3Q18 vs 2Q18 3Q17 2Q18 3Q18 3Q18 vs 3Q17 3Q18 vs 2Q18 Gross Loans $ 111.2 $ 114.0 $ 114.6 3.1% 0.6% $ 44.2 $ 46.3 $ 47.2 6.8% 1.9% Deposits $ 105.5 $ 107.1 $ 108.0 2.4% 0.8% $ 41.4 $ 44.8 $ 45.2 9.2% 0.9% Deposits/Net Loans 0.96 x 0.97 x 0.98 x NS NS 0.91 x 0.95 x 0.95 x 0.03 x NS Tangible Equity Ratio 7.2% 6.8% 7.9% 67 bps 108 bps 10.1% 10.1% 10.4% 33 bps 31 bps PDLs 90+/Total loans 3.3% 3.8% 3.9% 64 bps 11 bps 1.2% 1.3% 1.4% 14 bps 9 bps Cost of risk 2.8% 1.9% 2.1% (73) bps 23 bps 2.2% 2.1% 2.8% 67 bps 72 bps Net interest margin 5.7% 5.6% 5.5% (15) bps (9) bps 6.6% 6.3% 6.5% (8) bps 24 bps Fee income Ratio 22.5% 22.2% 18.3% (415) bps (394) bps 35.2% 35.5% 33.1% (203) bps (235) bps Efficiency Ratio 44.1% 43.1% 34.8% (929) bps (832) bps 52.5% 52.6% 49.3% (316) bps (322) bps Attributable net income $ 0.25 $ 0.49 $ 0.58 130.0% 19.9% $ 0.18 $ 0.19 $ 0.20 8.1% 2.3% ROAA 1.2% 2.1% 2.8% 158 bps 70 bps 1.6% 1.7% 1.7% 7 bps (1) bps ROAE 12.4% 24.5% 27.3% 1,490 bps 285 bps 9.8% 10.5% 10.2% 42 bps (29) bps Balance Sheet Loan Quality Profitability

5 1.0 2.0 3.0 4.0 5.0 6.0 Jan-17 Mar-17 May-17 Jul-17 Sep-17 Nov-17 Jan-18 Mar-18 May-18 Jul-18 Sep-18 Nov-18 2018E 2019E 2.7 3.3 GDP Growth Expectations (%) Source: Bloomberg Consensus Inflation Expectations (%) Macroeconomic context – Colombia (1/3) Source: Bloomberg Consensus 2.0 2.5 3.0 3.5 4.0 Jan-17 Mar-17 May-17 Jul-17 Sep-17 Nov-17 Jan-18 Mar-18 May-18 Jul-18 Sep-18 Nov-18 2018E 2019E 3.3 3.4 Inflation (%) Source: Banco de la República de Colombia Oct - 18: 3.33% 2.4% 2.2% 1.9% 2.8% 3.7% 4.4% 6.8% 8.6% 5.7% 4.0% 4.1% 3.2% 0.0% 2.0% 4.0% 6.0% 8.0% 10.0% Dec-12 Jun-13 Dec-13 Jun-14 Dec-14 Jun-15 Dec-15 Jun-16 Dec-16 Jun-17 Dec-17 Jun-18 12-Month inflation Lower target range Upper target range 6.2 4.5 2.6 2.4 2.7 4.3 5.3 5.9 5.7 4.1 4.8 4.3 2.7 2.8 3.3 3.1 3.4 2.2 0.8 1.4 1.4 2.2 1.8 1.6 2.6 2.5 I II III IV I II III IV I II III IV I II III IV I II III IV I II III IV I II III IV 2012 2013 2014 2015 2016 2017 2018 3.9 4.6 4.7 3.0 2.0 1.8 - GDP Growth (%) Source: DANE. Seasonally - adjusted , constant prices (2015) GDP.
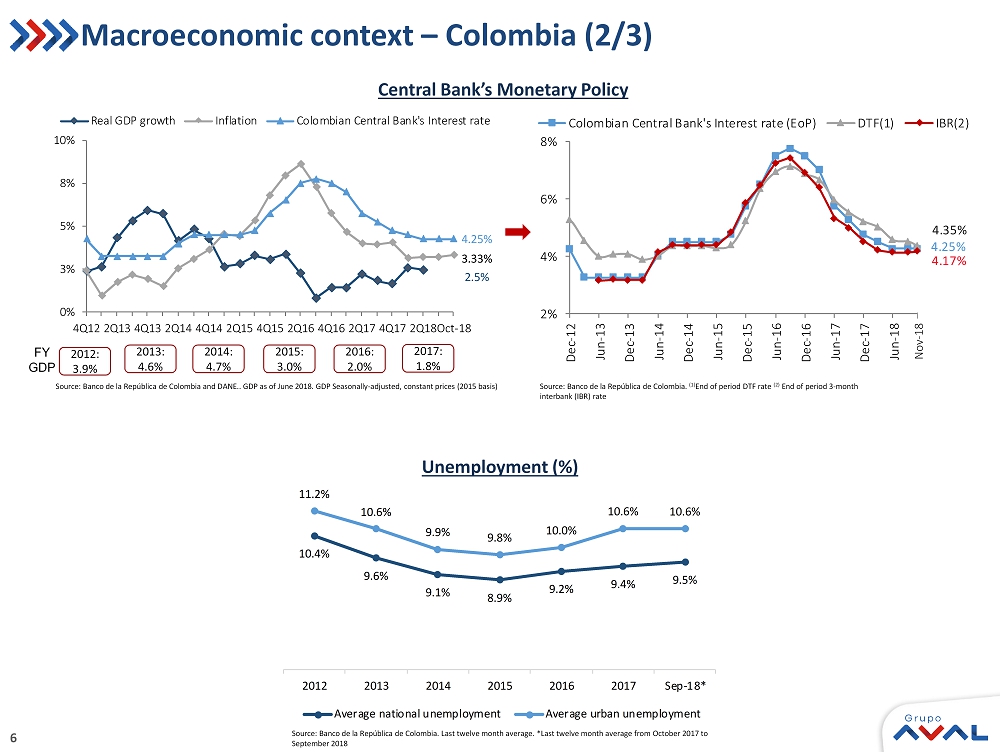
6 0% 3% 5% 8% 10% 4Q12 2Q13 4Q13 2Q14 4Q14 2Q15 4Q15 2Q16 4Q16 2Q17 4Q17 2Q18 Oct-18 Real GDP growth Inflation Colombian Central Bank's Interest rate 4.25% 3.33% 2.5% 2% 4% 6% 8% Dec-12 Jun-13 Dec-13 Jun-14 Dec-14 Jun-15 Dec-15 Jun-16 Dec-16 Jun-17 Dec-17 Jun-18 Colombian Central Bank's Interest rate (EoP) DTF(1) IBR(2) 4.35% 4.25% 4.17% Central Bank’s Monetary Policy Source: Banco de la República de Colombia. Last twelve month average. *Last twelve month average from October 2017 to September 2018 Source : Banco de la República de Colombia. (1) End of period DTF rate (2) End of period 3 - month interbank (IBR) rate Source: Banco de la República de Colombia and DANE.. GDP as of June 2018. GDP Seasonally - adjusted, constant prices (2015 basis) Macroeconomic context – Colombia (2/3) 2014: 4.7% 2015: 3.0% 2016: 2.0% 2013: 4.6% 2012: 3.9% FY GDP 2017: 1.8% Unemployment (%) 10.4% 9.6% 9.1% 8.9% 9.2% 9.4% 9.5% 11.2% 10.6% 9.9% 9.8% 10.0% 10.6% 10.6% 2012 2013 2014 2015 2016 2017 Sep-18* Average national unemployment Average urban unemployment Nov - 18

7 4Q14 1Q15 2Q15 3Q15 4Q15 1Q16 2Q16 3Q16 4Q16 1Q17 2Q17 3Q17 4Q17 1Q18 2Q18 3Q18 End of Period 2,392.5 2,598.4 2,598.7 3,086.8 3,149.5 3,000.6 2,919.0 2,880.1 3,000.7 2,885.6 3,050.4 2,936.7 2,984.0 2,780.5 2,930.8 2,972.2 Quarter Average 2,173.0 2,470.2 2,496.4 2,938.9 3,061.7 3,263.5 2,993.0 2,949.0 3,016.1 2,924.3 2,920.3 2,974.6 2,985.9 2,860.3 2,839.0 2,961.0 2,000 2,200 2,400 2,600 2,800 3,000 3,200 3,400 (2.4) (3.0) (4.0) (3.6) (3.1) (2.4) (2.2) (1.8) (1.5) (1.3) (1.2) (1.1) (1.1) (1.0) 2014 2015 2016 2017 2018 2019 2020 2021 2022 2023 2024 2025 2026 2027 Real fiscal deficit Projected fiscal deficit (April 2018) Source : Banco de la República de Colombia. Macroeconomic context – Colombia (3/3) Source: Ministry of Finance. Projections start in 2018. (1.4%) (3.8%) (8.0%) (6.0%) (4.0%) (2.0%) 0.0% 2.0% 4.0% Dec-14 Mar-15 Jun-15 Sep-15 Dec-15 Mar-16 Jun-16 Sep-16 Dec-16 Mar-17 Jun-17 Sep-17 Dec-17 Mar-18 Jun-18 Trade balance Current Account Deficit Current Account (% GDP, quarterly) Real and Projected Fiscal Deficit - Fiscal Rule (% of GDP) 2014: 52.2% 2015: 39.6% 2016: 33.9% 2017: 34.5% Oil Exports/Total Exports Colombian Peso Exchange Rate FY16 FY17 (3.3%)(1.5%) (4.3%)(3.3%) 3Q18 vs. 3Q17 3Q18 vs. 2Q18 1.2% 1.4% (0.5%) 4.3%

8 3.5% 5.8% - 0.9% 3.3% 3.3% 3.6% 2.4% Central America* Panama Nicaragua Costa Rica Guatemala Honduras El Salvador Macroeconomic context – Central America Growth Outlook – Real GDP CAGR ’17 – ’20E Inflation per Country Central Banks’ Interest Rates Source: Bloomberg CR : Costa Rica, ES: El Salvador, GU: Guatemala, HO: Honduras, NI: Nicaragua, PA: Panamá Source: IMF WEO Oct - 18; (*) Aggregate growth of all the Central American countries Source : SECMCA Source : SECMCA. CR : Costa Rica, ES: El Salvador, GU: Guatemala, HO: Honduras, NI: Nicaragua, PA: Panama . Inflation of Panamá and Cenam as of September 2018. (2.0%) (1.0%) 0.0% 1.0% 2.0% 3.0% 4.0% 5.0% 6.0% 7.0% Jan-16 Apr-16 Jul-16 Oct-16 Jan-17 Apr-17 Jul-17 Oct-17 Jan-18 Apr-18 Jul-18 Oct-18 CR ES GU HO NI PA Cenam 5.1% 4.7% 4.3% 3.6% 2.0% 1.5% 0.8% 0% 1% 2% 3% 4% 5% 6% 7% Jan-16 Apr-16 Jul-16 Oct-16 Jan-17 Apr-17 Jul-17 Oct-17 Jan-18 Apr-18 Jul-18 Oct-18 CR GU HO 5.50% 5.00% 2.75% 80.0 90.0 100.0 110.0 120.0 Jan-16 Mar-16 May-16 Jul-16 Sep-16 Nov-16 Jan-17 Mar-17 May-17 Jul-17 Sep-17 Nov-17 Jan-18 Mar-18 May-18 Jul-18 Sep-18 Nov-18 Colón-CR Quetzal-GU Lempira-HO Córdoba-NI TRM 100.2 108.2 115.7 101.0 115.6 Regional Exchange rates

9 68.0% 9.6% 1.7% Net loans and leases Fixed income investments Unconsolidated equity investments Other 68.0% 9.6% 1.7% 20.7% 3Q17 65.5% 10.5% 1.9% 22.1% 3Q18 Colombian operations , 71.2% Foreign (1) , 28.8% Colombian operations , 70.6% Foreign (1) , 29.4% Colombian operations , 71.2% Foreign (1) , 28.8% 67.5% 10.5% 1.7% 20.3% 2Q18 Assets Assets Breakdown Total Assets Figures in Ps. Trillions (1) Foreign operations reflect Central American operations. (2) Net loans and leases include interbank and overnight funds. 228.1 234.5 241.5 3Q17 2Q18 3Q18 3Q18 / 3Q17 = 5.9% 3Q18 / 2Q18 = 3.0% 3Q18 / 3Q17 = 5.5% 3Q18 / 2Q18 = 2.5% Growth excl. FX movement of Central American Operations (2)
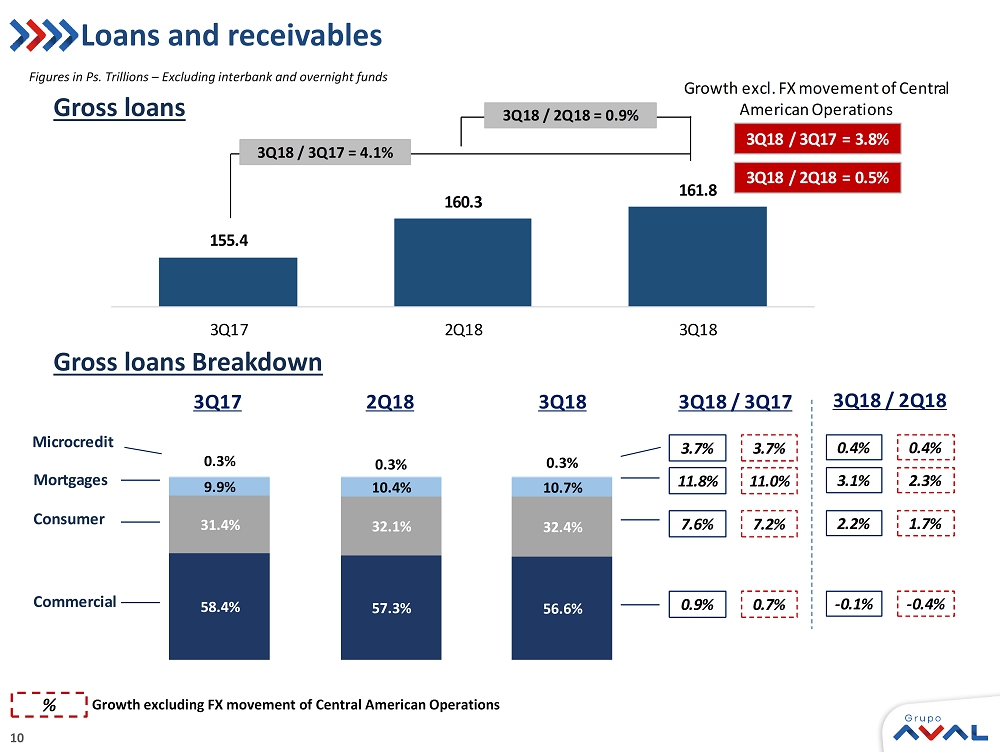
10 155.4 160.3 161.8 3Q17 2Q18 3Q18 3Q18 / 3Q17 = 4.1% 3Q18 / 2Q18 = 0.9% 3Q18 / 3Q17 = 3.8% 3Q18 / 2Q18 = 0.5% Growth excl. FX movement of Central American Operations 58.4% 57.3% 56.6% 31.4% 32.1% 32.4% 9.9% 10.4% 10.7% 0.3% 0.3% 0.3% Commercial Consumer Mortgages Microcredit 0.9% 7.6% 11.8% 3.7% 0.7% 7.2% 11.0% 3.7% 3Q18 / 3Q17 3Q17 2Q18 3Q18 3Q18 / 2Q18 - 0.1% 2.2% 3.1% 0.4% - 0.4% 1.7% 2.3% 0.4% Loans and receivables Gross loans Gross loans Breakdown Figures in Ps. Trillions – Excluding interbank and overnight funds % Growth excluding FX movement of Central American Operations

11 2.81% 2.16% 2.52% 2.64% 1.94% 2.31% 3Q17 2Q18 3Q18 Impairment loss / Average loans Impairment loss (net of recoveries of charged-off assets) / Average loans Loan portfolio quality Charge offs / Average NPLs Impairment loss / Average loans Impairment loss , net / Average loans Cost of Risk 3.98% 4.35% 4.47% 2.71% 3.09% 3.19% 3Q17 2Q18 3Q18 30 days PDLs / Total loans 90 days PDLs / Total loans 0.69x 0.65x 0.59x 3Q17 2Q18 3Q18 3.37% 1.25x 1.45x 1.45x 0.85x 1.03x 1.04x 3Q17 2Q18 3Q18 Allowances / 90+ PDLs Allowance / 30+ PDLs 4.48% 4.64% Allowance / Gross loans
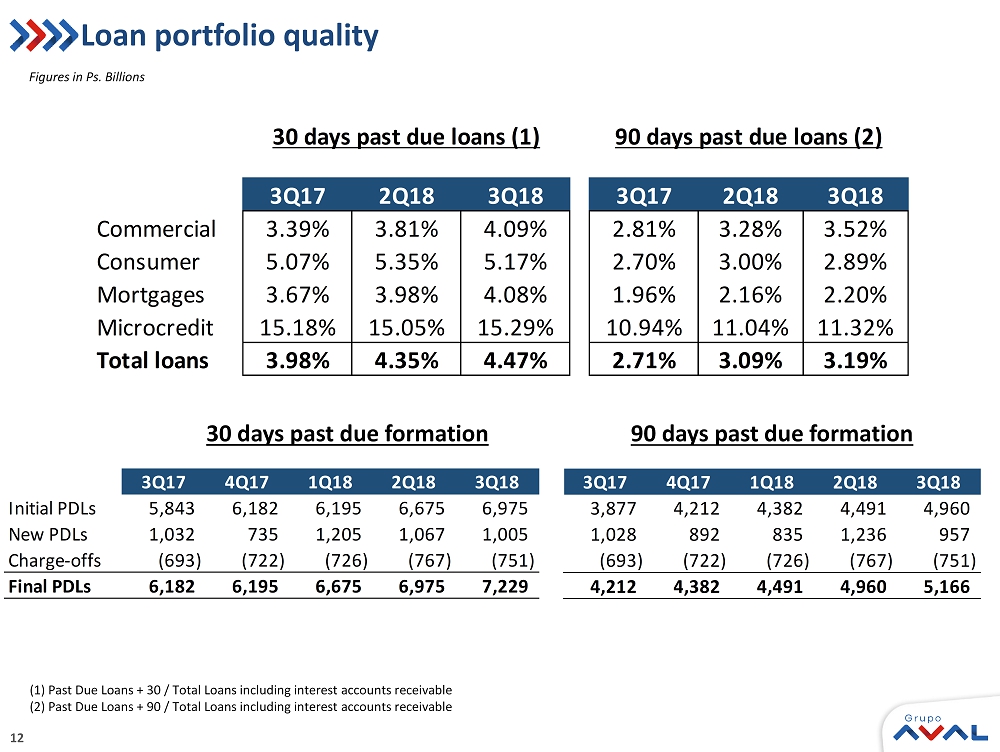
12 Loan portfolio quality 3Q17 2Q18 3Q18 3Q17 2Q18 3Q18 Commercial 3.39% 3.81% 4.09% 2.81% 3.28% 3.52% Consumer 5.07% 5.35% 5.17% 2.70% 3.00% 2.89% Mortgages 3.67% 3.98% 4.08% 1.96% 2.16% 2.20% Microcredit 15.18% 15.05% 15.29% 10.94% 11.04% 11.32% Total loans 3.98% 4.35% 4.47% 2.71% 3.09% 3.19% 30 days past due loans (1) 90 days past due loans (2) (1) Past Due Loans + 30 / Total Loans including interest accounts receivable (2) Past Due Loans + 90 / Total Loans including interest accounts receivable Figures in Ps. Billions 30 days past due formation 90 days past due formation 3Q17 4Q17 1Q18 2Q18 3Q18 Initial PDLs 5,843 6,182 6,195 6,675 6,975 New PDLs 1,032 735 1,205 1,067 1,005 Charge-offs (693) (722) (726) (767) (751) Final PDLs 6,182 6,195 6,675 6,975 7,229 3Q17 4Q17 1Q18 2Q18 3Q18 3,877 4,212 4,382 4,491 4,960 1,028 892 835 1,236 957 (693) (722) (726) (767) (751) 4,212 4,382 4,491 4,960 5,166
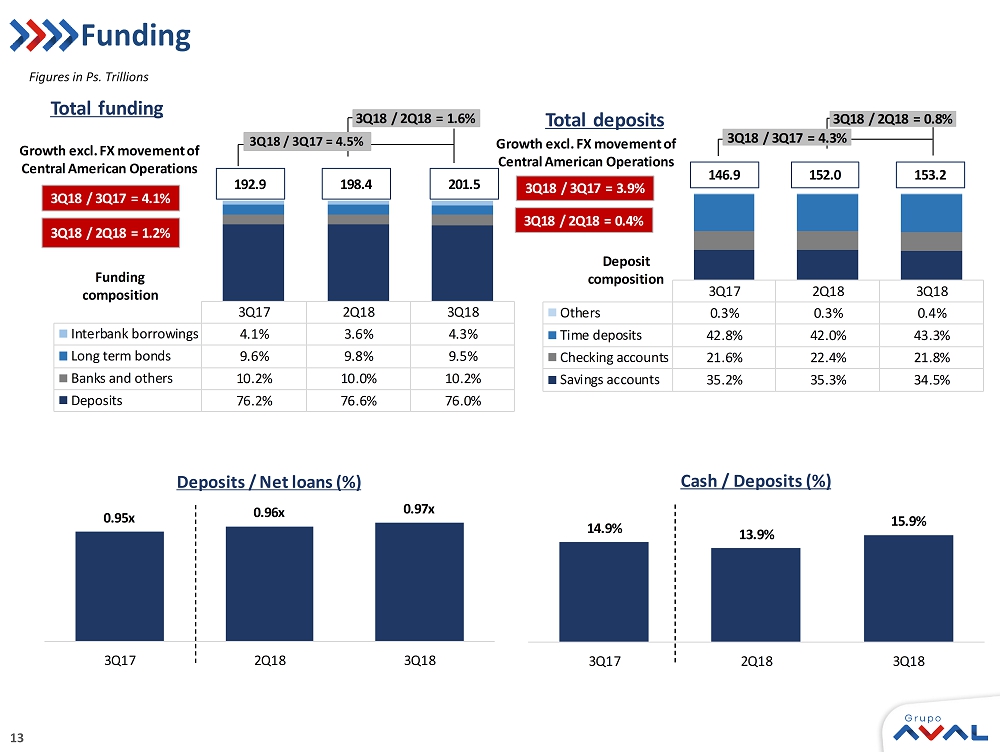
13 Funding Figures in Ps. Trillions 3Q17 2Q18 3Q18 Others 0.3% 0.3% 0.4% Time deposits 42.8% 42.0% 43.3% Checking accounts 21.6% 22.4% 21.8% Savings accounts 35.2% 35.3% 34.5% Total deposits 3Q18 / 3Q17 = 4.3% 3Q18 / 2Q18 = 0.8% 146.9 152.0 153.2 Deposit composition 3Q18 / 3Q17 = 3.9% 3Q18 / 2Q18 = 0.4% Growth excl. FX movement of Central American Operations 3Q17 2Q18 3Q18 Interbank borrowings 4.1% 3.6% 4.3% Long term bonds 9.6% 9.8% 9.5% Banks and others 10.2% 10.0% 10.2% Deposits 76.2% 76.6% 76.0% Total funding 192.9 198.4 201.5 Funding composition 3Q18 / 3Q17 = 4.5% 3Q18 / 2Q18 = 1.6% 3Q18 / 3Q17 = 4.1% 3Q18 / 2Q18 = 1.2% Growth excl. FX movement of Central American Operations 0.95x 0.96x 0.97x 3Q17 2Q18 3Q18 Deposits / Net loans (%) 14.9% 13.9% 15.9% 3Q17 2Q18 3Q18 Cash / Deposits (%)
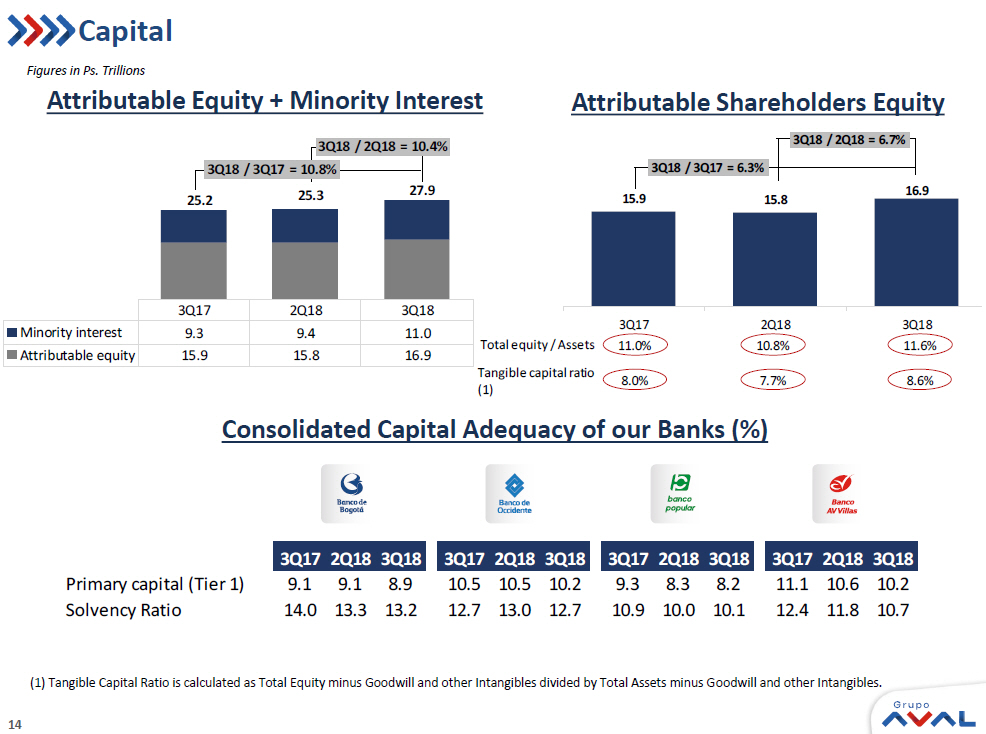
14 Capital Attributable Shareholders Equity Attributable Equity + Minority Interest Figures in Ps. Trillions Consolidated Capital Adequacy of our Banks (%) 3Q17 2Q18 3Q18 Minority interest 9.3 9.4 11.0 Attributable equity 15.9 15.8 16.9 3Q18 / 3Q17 = 10.8% 3Q18 / 2Q18 = 10.4% 25.2 25.3 27.9 15.9 15.8 16.9 3Q17 2Q18 3Q18 Attributable shareholders equity 3Q18 / 2Q18 = 6.7% 3Q18 / 3Q17 = 6.3% Total equity / Assets Tangible capital ratio (1) 11.0% 10.8% 11.6% 8.0% 7.7% 8.6% (1) Tangible Capital Ratio is calculated as Total Equity minus Goodwill and other Intangibles divided by Total Assets minus G ood will and other Intangibles. 3Q172Q183Q18 3Q172Q183Q18 3Q172Q183Q18 3Q172Q183Q18 Primary capital (Tier 1) 9.1 9.1 8.9 10.5 10.5 10.2 9.3 8.3 8.2 11.1 10.6 10.2 Solvency Ratio 14.0 13.3 13.2 12.7 13.0 12.7 10.9 10.0 10.1 12.4 11.8 10.7

15 7.2% 7.0% 7.0% 7.2% 6.9% 6.9% 12.1% 12.6% 12.8% 4.5% 5.0% 5.5% 6.0% 6.5% 7.0% 7.5% 8.0% 8.5% 9.0% 9.5% 10.0% 10.5% 11.0% 11.5% 12.0% 12.5% 13.0% 13.5% 3Q17 2Q18 3Q18 Financial Sector Consolidated Non-Financial Sector + HoldCo NIM – Net Interest Margin (1/2) Average Yield on Loans Average Cost of Funds Average Spread (Yield on Loans – Cost of Funds) 11.2% 10.5% 10.5% 18.4% 19.4% 18.7% 11.3% 10.6% 10.6% 0.0% 1.0% 2.0% 3.0% 4.0% 5.0% 6.0% 7.0% 8.0% 9.0% 10.0% 11.0% 12.0% 13.0% 14.0% 15.0% 16.0% 17.0% 18.0% 19.0% 20.0% 21.0% 3Q17 2Q18 3Q18 4.0% 3.6% 3.6% 6.3% 6.8% 5.9% 4.1% 3.7% 3.7% 3Q17 2Q18 3Q18
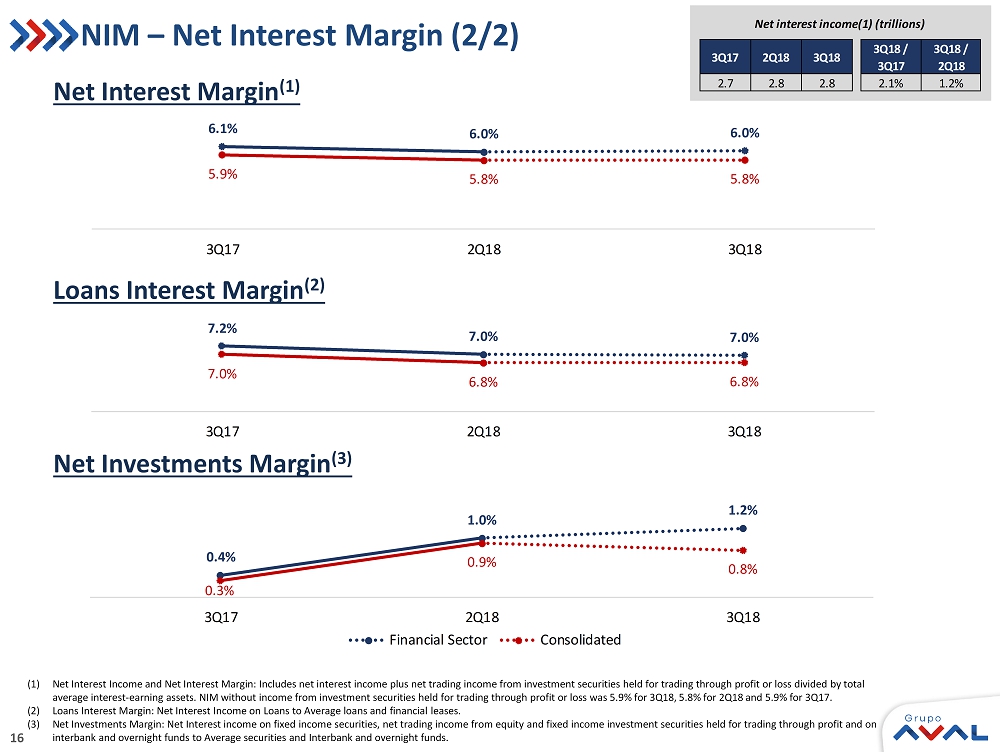
16 NIM – Net Interest Margin (2/2) Net Interest Margin (1) Loans Interest Margin (2) Net Investments Margin (3) 3Q17 2Q18 3Q18 3Q18 / 3Q17 3Q18 / 2Q18 2.7 2.8 2.8 2.1% 1.2% Net interest income(1) (trillions) (1) Net Interest Income and Net Interest Margin: Includes net interest income plus net trading income from investment securities hel d for trading through profit or loss divided by total average interest - earning assets. NIM without income from investment securities held for trading through profit or loss was 5.9% for 3Q18, 5.8% for 2Q18 and 5. 9% for 3Q17. (2) Loans Interest Margin: Net Interest Income on Loans to Average loans and financial leases. (3) Net Investments Margin: Net Interest income on fixed income securities, net trading income from equity and fixed income inves tme nt securities held for trading through profit and on interbank and overnight funds to Average securities and Interbank and overnight funds. 6.1% 6.0% 6.0% 5.9% 5.8% 5.8% 3Q17 2Q18 3Q18 7.2% 7.0% 7.0% 7.0% 6.8% 6.8% 3Q17 2Q18 3Q18 0.4% 1.0% 1.2% 0.3% 0.9% 0.8% 3Q17 2Q18 3Q18 Financial Sector Consolidated
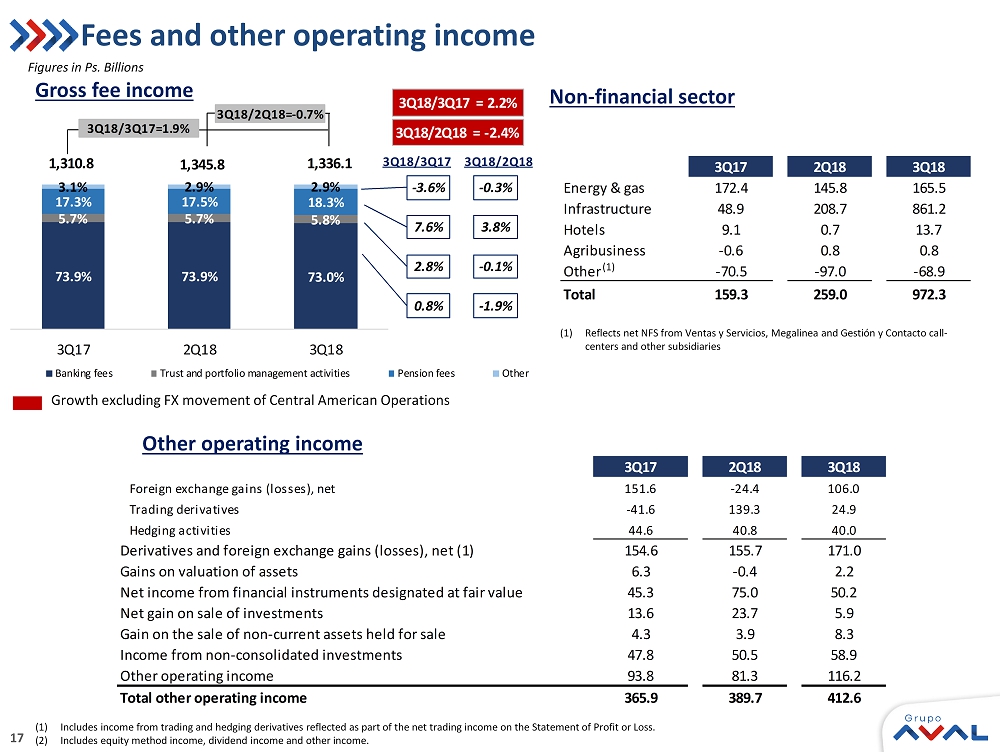
17 73.9% 73.9% 73.0% 5.7% 5.7% 5.8% 17.3% 17.5% 18.3% 3.1% 2.9% 2.9% 3Q17 2Q18 3Q18 Banking fees Trust and portfolio management activities Pension fees Other 1,310.8 1,345.8 1,336.1 3Q18/3Q17=1.9% 3Q18/2Q18= - 0.7% 0.8% 2.8% 7.6% - 3.6% 3Q18/2Q18 3Q18/3Q17 - 1.9% - 0.1% 3.8% - 0.3% 3Q18/2Q18 = - 2.4% 3Q18/3Q17 = 2.2% Fees and other operating income Figures in Ps. Billions (1) Includes income from trading and hedging derivatives reflected as part of the net trading income on the Statement of Profit or L oss. (2) Includes equity method income, dividend income and other income. Gross fee income Other operating income Growth excluding FX movement of Central American Operations Non - financial sector 3Q17 2Q18 3Q18 Foreign exchange gains (losses), net 151.6 -24.4 106.0 Trading derivatives -41.6 139.3 24.9 Hedging activities 44.6 40.8 40.0 Derivatives and foreign exchange gains (losses), net (1) 154.6 155.7 171.0 Gains on valuation of assets 6.3 -0.4 2.2 Net income from financial instruments designated at fair value 45.3 75.0 50.2 Net gain on sale of investments 13.6 23.7 5.9 Gain on the sale of non-current assets held for sale 4.3 3.9 8.3 Income from non-consolidated investments 47.8 50.5 58.9 Other operating income 93.8 81.3 116.2 Total other operating income 365.9 389.7 412.6 (1) Reflects net NFS from Ventas y Servicios , Megalinea and Gestión y Contacto call - centers and other subsidiaries (1) 3Q17 2Q18 3Q18 Energy & gas 172.4 145.8 165.5 Infrastructure 48.9 208.7 861.2 Hotels 9.1 0.7 13.7 Agribusiness -0.6 0.8 0.8 Other -70.5 -97.0 -68.9 Total 159.3 259.0 972.3
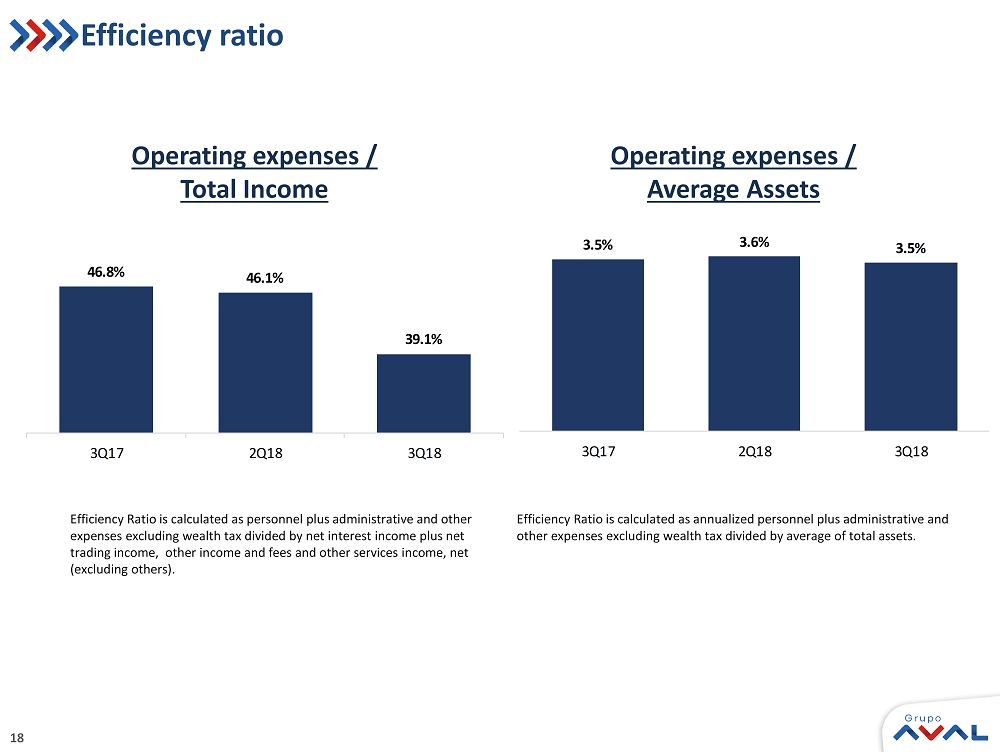
18 Efficiency ratio Efficiency Ratio is calculated as personnel plus administrative and other expenses excluding wealth tax divided by net interest income plus net trading income, other income and fees and other services income, net (excluding others). Operating expenses / Total Income Operating expenses / Average Assets Efficiency Ratio is calculated as annualized personnel plus administrative and other expenses excluding wealth tax divided by average of total assets. 46.8% 46.1% 39.1% 3Q17 2Q18 3Q18 FY16 FY17 3.5% 3.6% 3.5% 3Q17 2Q18 3Q18 FY16 FY17
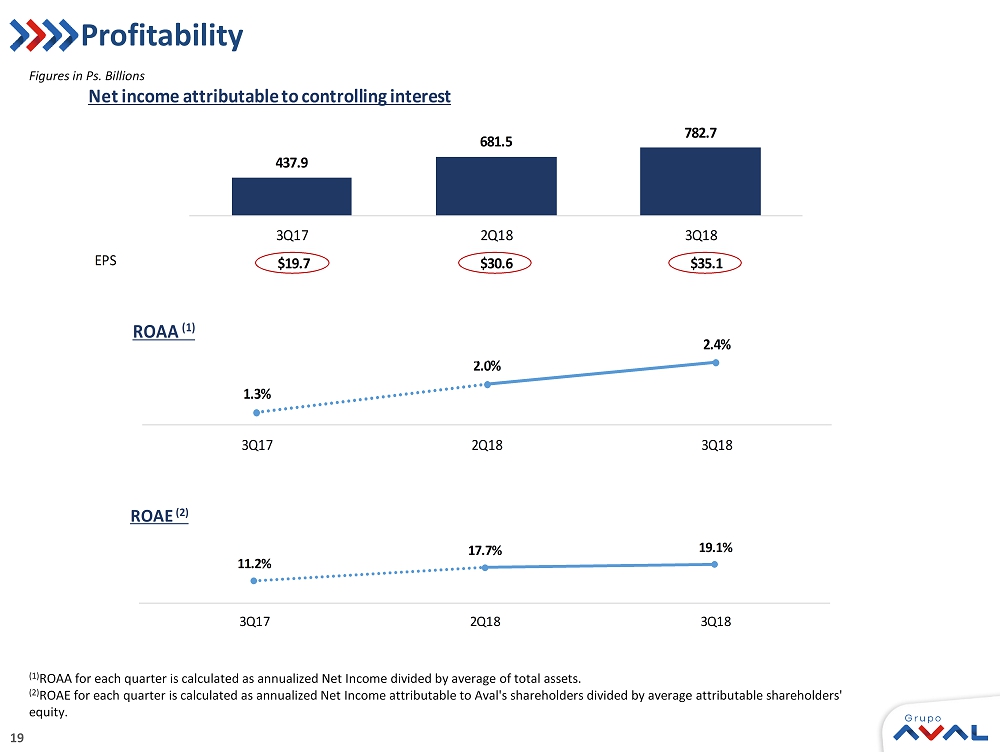
19 437.9 681.5 782.7 3Q17 2Q18 3Q18 Net income attributable to controlling interest $19.7 $30.6 $35.1 EPS $29.0 645.3 Profitability (1) ROAA for each quarter is calculated as annualized Net Income divided by average of total assets. (2) ROAE for each quarter is calculated as annualized Net Income attributable to Aval's shareholders divided by average attributa ble shareholders' equity. Figures in Ps. Billions 1.3% 2.0% 2.4% 3Q17 2Q18 3Q18 ROAA (1) 2.0% 11.2% 17.7% 19.1% 3Q17 2Q18 3Q18 ROAE (2) 17.7%

20 Appendix

21 • Reduction of corporate taxes from 37% to 30% 1 and elimination of Renta Presuntiva (a tax imposed on companies based on their shareholders’ equity in absence of taxable income) currently at 3.5% by 2021. • Deducibility of financial transaction taxes and Industry and Commerce taxes (@ 50% until 2022 and @100% post 2022). • One - time taxation of 5% of dividends and participations paid or credited to Colombia - based companies. 5% taxation of dividends received by individuals. • Taxation as income of management fees received by trust companies, stockbrokers and investment management companies. • Increase of the income tax rate for individuals up to 37% depending on the individual’s net income. • Creation of an equity tax for individuals with net assets of more than Ps 3,000 million (approx. USD 1 million) at a rate of between 0.5% and 1% depending on the individual’s net assets. • Creation of a voluntary “simplified tax regime” allowing for a unified payment of the income tax, the consumption tax, and the industry and commerce tax for individuals. • Expansion of good and services subject to VAT • Reduction in VAT rate from 19% to 18% in 2019 and 17% in 2020. • Compensation of 3 UVTs (currently US$33) per month to lower income households to offset the burden generated by the increase of items taxed with VAT. • Taxation of interest payment to jurisdictions different from Colombia up to 20%. • Taxation of credit and debit cards fees. • Taxation at the general tax rate in the sale of real estate. Objectives Financing Law - Ley de Financiamiento As presented to the Colombian Congress on October 30 th , 2018 x Finance the Government’s estimate of a Ps 14 billion gap in the 2019 Fiscal Budget x Change “structurally” the fiscal framework of Colombia x Boost GDP growth above 4% starting in 2020 1. Corporate taxes 2. VAT 4. Taxes to individuals 3. Other taxes Main aspects of the proposed reform 1 For Grupo Aval, a reduction of 100bps in the corporate tax rate accounts for an additional peso/share (based on FY 2017 numbe rs)

22 Update on Aval’s 4G infrastructure projects; Impact on Corficolombiana s results of full adoption of IFRS 15 • Update : As of September, 2018 Corficolombiana had started construction of two 4 G road concessions : Pacifico 1 and Chirajara - Fundadores . Completion of the construction phase of these two projects is estimated by the end of the year 2023 . It is expected that construction of a third 4 G project (Villavicencio – Yopal ) will commence during November 2018 and be completed by the year 2024 . The construction of a fourth project ( Mulalo – Loboguerrero ) should commence in the third quarter of 2019 and be completed by the year 2025 . Corficolombiana is the sole shareholder in two of these projects and a 90 % shareholder of the third . • IFRS 15 : With the introduction and full adoption of IFRS 15 1 , Corficolombiana has changed the way it accounts its concession projects in line with the risk associated with the two stages of a toll road : construction and operation . According to IFRS 15 , Corficolombiana has to differentiate the two phases of each Concession Project, because the services provided to the client (the Colombian Government) in each phase are different ; in line with this Corficolombiana has to reflect a differentiated return in each of the phases depending on the level of implied risk . As the risks involved during the construction phase of the toll - roads are, by far, larger, than the risk of the operating phase, the returns obtained during the construction years are expected to be much larger than the ones obtained during the operating years . IFRS 15 establishes the principles that an entity applies when reporting information about the nature, amount, timing and uncertainty of revenue and cash flows from a contract with a customer . Applying IFRS 15 , an entity recognizes revenue to depict the transfer of promised goods or services to the customer in an amount that reflects the consideration to which the entity expects to be entitled in exchange for those goods or services . To recognize revenue under IFRS 15 , an entity applies the following five steps : i ) identify the contract(s) with a customer, ii) identify the performance obligations in the contract . Performance obligations are promises in a contract to transfer to a customer goods or services that are distinct, iii) determine the transaction price . The transaction price is the amount of consideration to which an entity expects to be entitled in exchange for transferring promised goods or services to a customer . If the consideration promised in a contract includes a variable amount, an entity must estimate the amount of consideration to which it expects to be entitled in exchange for transferring the promised goods or services to a customer, iv) allocate the transaction price to each performance obligation on the basis of the relative stand - alone selling prices of each distinct good or service promised in the contract , and v) recognize revenue when a performance obligation is satisfied by transferring a promised good or service to a customer (which is when the customer obtains control of that good or service) . A performance obligation may be satisfied at a point in time (typically for promises to transfer goods to a customer) or over time (typically for promises to transfer services to a customer) . For a performance obligation satisfied over time, an entity would select an appropriate measure of progress to determine how much revenue should be recognized as the performance obligation is satisfied . Pre IFRS 15 accounting The construction and operating phases were analyzed as one and consequently income was accrued uniformly during the total duration of the contract without consideration of the different levels of risk assumed in each phase contracted (construction and operation) . IFRS 15 accounting The construction and operating phases are analyzed as two independent phases (because the services provided in each phase are different) and income depends on the level of risk assumed in each phase . 1 2 3 4 5 6 7 8 9 10 Expected Net Income of a Concession Project Pre IFRS 15 IFRS 15 Construction phase Operating phase Risk assumed

23
SIGNATURE
Pursuant to the requirements of the Securities Exchange Act of 1934, the registrant has duly caused this report to be signed on its behalf by the undersigned, thereunto duly authorized.
Date: November 16, 2018
| GRUPO AVAL ACCIONES Y VALORES S.A. | |||||
| By: | /s/ Jorge Adrián Rincón Plata | ||||
| Name: | Jorge Adrián Rincón Plata | ||||
| Title: | Chief Legal Counsel | ||||