UNITED STATES
SECURITIES AND EXCHANGE COMMISSION
Washington, D.C. 20549
FORM 6-K
Report Of Foreign Private Issuer
Pursuant To Rule 13a-16 Or 15d-16 Of
The Securities Exchange Act Of 1934
For the month of March 2019
Commission File Number: 000-54290
Grupo Aval Acciones y Valores S.A.
(Exact name of registrant as specified in its charter)
Carrera 13 No. 26A - 47
Bogotá D.C., Colombia
(Address of principal executive office)
Indicate by check mark whether the registrant files or will file annual reports under cover of Form 20-F or Form 40-F:
| Form 20-F | X | Form 40-F |
Indicate by check mark if the registrant is submitting the Form 6-K in paper as permitted by Regulation S-T Rule 101(b)(1):
| Yes | No | X |
Indicate by check mark if the registrant is submitting the Form 6-K in paper as permitted by Regulation S-T Rule 101(b)(7):
| Yes | No | X |
GRUPO AVAL ACCIONES Y VALORES S.A.
TABLE OF CONTENTS
| ITEM | |
| 1. | Report of Fourth Quarter and Full Year 2018 Consolidated Results |
| 2. | Fourth Quarter and Full Year 2018 Consolidated Earnings Results Presentation |
Item 1

Report of 4Q2018 and FY 2018
consolidated results
Information reported in Ps billions(1)and under IFRS
(1) We refer to billions as thousands of millions.


Grupo Aval Acciones y Valores S.A. (“Grupo Aval”) is an issuer of securities in Colombia and in the United States, registered with Colombia’s National Registry of Shares and Issuers (Registro Nacional de Valores y Emisores) and the United States Securities and Exchange Commission (“SEC”). As such, it is subject to compliance with securities regulation in Colombia and applicable U.S. securities regulation.
All of our banking subsidiaries (Banco de Bogotá, Banco de Occidente, Banco Popular and Banco AV Villas), Porvenir and Corficolombiana, are subject to inspection and supervision as financial institutions by the Superintendency of Finance. Grupo Aval is now also subject to the inspection and supervision of the Superintendency of Finance as a result of Law 1870 of 2017, also known as Law of Financial Conglomerates, which came in effect on February 6, 2019. Grupo Aval, as the holding company of its financial conglomerate is responsible for the compliance with capital adequacy requirements, corporate governance standards, risk management and internal control and criteria for identifying, managing and revealing conflicts of interest, applicable to its financial conglomerate.
The consolidated financial information included in this document is presented in accordance with IFRS as currently issued by the IASB. Details of the calculations of non-GAAP measures such as ROAA and ROAE, among others, are explained when required in this report. Full year and quarterly results for 2018 are not comparable to previous periods due to the prospective adoption in Colombia of IFRS 9 and IFRS 15 starting in January 1, 2018.
This report includes forward-looking statements. In some cases, you can identify these forward-looking statements by words such as “may,” “will,” “should,” “expects,” “plans,” “anticipates,” “believes,” “estimates,” “predicts,” “potential,” or “continue,” or the negative of these and other comparable words. Actual results and events may differ materially from those anticipated herein as a consequence of changes in general, economic and business conditions, changes in interest and currency rates and other risk described from time to time in our filings with the Registro Nacional de Valores y Emisores and the SEC. Recipients of this document are responsible for the assessment and use of the information provided herein. Matters described in this presentation and our knowledge of them may change extensively and materially over time but we expressly disclaim any obligation to review, update or correct the information provided in this report, including any forward looking statements, and do not intend to provide any update for such material developments prior to our next earnings report. The content of this document and the figures included herein are intended to provide a summary of the subjects discussed rather than a comprehensive description.
When applicable, in this document we refer to billions as thousands of millions.
| 1 |  |

Bogotá, March 14th, 2019. GRUPO AVAL ACCIONES Y VALORES S.A. (“Grupo Aval”) reports a consolidated attributable net income result of Ps 2,912.7 billion (Ps 130.7 pesos per share) for 2018 versus a Ps 1,962.4 billion (Ps 88.1 pesos per share) figure reported for 2017. ROAE for the year was 17.8% and ROAA was 2.2%.
Key results of the year and quarter:
| • | 2018 is historically the year of Aval’s best financial performance with total net income of Ps 2.91 trillion (Ps 131/share), an increase of 48.4% versus 2017. Non-recurrent net income amounted to Ps 16 billion or 0.7 pesos per share. |
| • | ROAE for the year was 17.8% for the year. Aval ended 2018 with an accounting tangible capital ratio of 8.4%. |
| • | Total gross loans grew by 6.4% in the year driven by 10.1% growth in the consumer portfolio and 15.1% growth in the mortgage portfolio. |
| • | Despite a 177 bps decline in the average Central Bank rate (2018 vs. 2017), our 2018 NIM on loans declined only 22 bps and finished strong at 6.71%. Total NIM (loans and investments) for the year was 5.67% versus 5.92% in 2017. |
| • | PDL´s and NPL´s showed improvement as of December 31, 2018 versus previous quarters. Our 30+ PDL was 4.25% and our 90+ NPL was 3.07%. Both figures include approximately 42 bps associated to Electricaribe, which is fully-provisioned as of yearend. |
| • | Cost of Risk, net of recoveries for the year was 2.4% versus 2.5% in 2017. Cost of risk during 4Q2018 was expectedly high associated to a non-recurrent marginal provision to bring the banks’ CRDS exposure coverage to the current 45%. Additional provisions to this credit exposure will depend on the final ruling of the Arbitration Tribunal (expected August 2019). |
| • | Total personnel and G&A expenses for the year grew at 4.1% which compares to assets growing close to 10%. This very satisfactory result is due to multiple digital and efficiency-improving strategies launched in all our banking subsidiaries during 2017 and 2018. |
| • | Very strong results from Corficolombiana’s non-financial subsidiaries, principally from Promigas, the gas transportation and distribution company and from the commencement of construction of three toll roads. Corficolombiana contributed with Ps 28 /share to Aval’s results during 2018 and is expected to continue to be a strong source of income in the next years. |
| • | A detail of Aval’s non-recurrent net income during 2018: |
| • | Banco de Bogotá and Banco Popular effected sales of non-productive assets, which contributed Ps 254 billion of attributable net income. |
| • | All the entities booked deferred tax recoveries as a result of the 2018 fiscal reform which positively impacted attributable net income in Ps 62 billion. |
| • | Banco de Occidenteand Banco Popular booked extraordinary compensation expenses totaling approximately Ps 30 billion at the attributable net income level. |
| • | Specific provision expenses were booked in relation to Electricaribe, CRDS and SITP of Ps 600 billion with a post-tax attributable net income impact of Ps 270 billion |
| • | Finally, strong funding and liquidity positions as deposits/net loans finished at 0.97x and cash/deposits finished at 17.3%. |
| 2 | |
Bogotá, March 14th, 2019. GRUPO AVAL ACCIONES Y VALORES S.A. (“Grupo Aval”) reports a consolidated attributable net income result of Ps 2,912.7 billion (Ps 130.7 pesos per share) for 2018 versus a Ps 1,962.4 billion (Ps 88.1 pesos per share) figure reported for 2017. ROAE for the year was 17.8% and ROAA was 2.2%.

Gross loans excludes interbank and overnight funds.Tangible Capital Ratio is calculated as Total Equity minus Goodwill and other Intangibles divided by Total Assets minus Goodwill and other Intangibles.Net Interest Margin includes net interest income plus net trading income from trading assets.Fee income ratio is calculated fee net income divided by net interest income plus net trading income, net income from sales of goods and services, other income and fees and other services income, net (excluding others).Efficiency Ratio is calculated as personnel plus administrative and other expenses excluding wealth tax divided by net interest income plus net trading income, net income from sales of goods and services, other income and fees and other services income, net (excluding others).ROAA is calculated as annualized Net Income divided by average of total assets.ROAEis calculated as Net Income attributable to Aval's shareholders divided by average attributable shareholders' equity.NSrefers to non-significant figures.
| 3 | |
| Grupo Aval Acciones y Valores S.A. | |||||||||
| Consolidated Financial Statements Under IFRS | |||||||||
| Information in Ps. Billions | |||||||||
| Consolidated Statement of Financial Position | 4Q17 | 3Q18 | 4Q18 |  | |||||
| 4Q18 vs. 3Q18 | 4Q18 vs. 4Q17 | ||||||||
| Cash and cash equivalents | 22,336.8 | 24,396.8 | 28,401.3 | 16.4% | 27.1% | ||||
| Trading assets | 5,128.1 | 5,391.2 | 7,204.3 | 33.6% | 40.5% | ||||
| Investment securities | 21,513.2 | 24,082.5 | 23,030.2 | -4.4% | 7.1% | ||||
| Hedging derivatives assest | 55.3 | 85.6 | 30.1 | -64.8% | -45.5% | ||||
| Total loans and receivables, net | 160,754.3 | 158,265.1 | 168,685.7 | 6.6% | 4.9% | ||||
| Tangible assets | 6,654.0 | 6,465.3 | 6,588.5 | 1.9% | -1.0% | ||||
| Goodwill | 6,901.1 | 6,882.5 | 7,318.6 | 6.3% | 6.1% | ||||
| Concession arrangement rights | 3,114.2 | 4,981.0 | 5,514.5 | 10.7% | 77.1% | ||||
| Other assets | 10,081.6 | 10,937.0 | 12,902.1 | 18.0% | 28.0% | ||||
| Total assets | 236,538.5 | 241,487.0 | 259,675.2 | 7.5% | 9.8% | ||||
| Trading liabilities | 298.7 | 488.9 | 811.3 | 65.9% | 171.6% | ||||
| Hedging derivatives liabilities | 13.5 | 63.6 | 195.5 | N.A. | N.A. | ||||
| Customer deposits | 154,885.2 | 153,188.5 | 164,359.5 | 7.3% | 6.1% | ||||
| Interbank borrowings and overnight funds | 4,970.4 | 8,669.9 | 6,814.1 | -21.4% | 37.1% | ||||
| Borrowings from banks and others | 18,205.3 | 17,094.3 | 20,610.8 | 20.6% | 13.2% | ||||
| Bonds issued | 19,102.2 | 19,128.2 | 20,140.3 | 5.3% | 5.4% | ||||
| Borrowings from development entities | 2,998.1 | 3,440.2 | 3,646.8 | 6.0% | 21.6% | ||||
| Other liabilities | 10,193.9 | 11,507.2 | 13,542.5 | 17.7% | 32.8% | ||||
| Total liabilities | 210,667.3 | 213,580.8 | 230,120.8 | 7.7% | 9.2% | ||||
| Controlling interest | 16,287.0 | 16,895.2 | 17,789.7 | 5.3% | 9.2% | ||||
| Non-controlling interests | 9,584.2 | 11,011.0 | 11,764.6 | 6.8% | 22.7% | ||||
| Total equity | 25,871.2 | 27,906.2 | 29,554.3 | 5.9% | 14.2% | ||||
| Total liabilities and equity | 236,538.5 | 241,487.0 | 259,675.2 | 7.5% | 9.8% | ||||
| Consolidated Statement of Income | 4Q17 | 3Q18 | 4Q18 | | |||||
| Interest income | 4,622.8 | 4,599.3 | 4,691.6 | 2.0% | 1.5% | ||||
| Interest expense | 1,961.0 | 1,847.3 | 1,934.7 | 4.7% | -1.3% | ||||
| Net interest income | 2,661.8 | 2,752.0 | 2,757.0 | 0.2% | 3.6% | ||||
| Loans and other accounts receivable | 1,125.9 | 1,013.9 | 1,359.7 | 34.1% | 20.8% | ||||
| Other financial assets | - | 3.9 | 22.3 | N.A. | N.A | ||||
| Recovery of charged-off financial assets | (78.2) | (83.4) | (81.7) | -2.0% | 4.4% | ||||
| Impairment loss on financial assets | 1,047.7 | 934.4 | 1,300.4 | 39.2% | 24.1% | ||||
| Net interest income, after impairment loss | 1,614.1 | 1,817.6 | 1,456.6 | -19.9% | -9.8% | ||||
| Net income from commissions and fees | 1,165.8 | 1,193.8 | 1,296.6 | 8.6% | 11.2% | ||||
| Net income from sales of goods and services | 297.6 | 972.3 | 1,206.8 | 24.1% | N.A. | ||||
| Net trading income | 178.8 | 109.5 | 318.9 | 191.3% | 78.3% | ||||
| Net income from other financial instruments designated at FVTPL(a) | 62.4 | 50.2 | 28.6 | -43.0% | -54.2% | ||||
| Total other income | 298.4 | 297.6 | 500.8 | 68.3% | 67.9% | ||||
| Total other expenses | 2,442.4 | 2,236.8 | 2,693.6 | 20.4% | 10.3% | ||||
| Net income before tax expense | 1,174.7 | 2,204.0 | 2,114.7 | -4.0% | 80.0% | ||||
| Income tax expense | 440.2 | 750.8 | 473.9 | -36.9% | 7.7% | ||||
| Net income for the period | 734.6 | 1,453.2 | 1,640.8 | 12.9% | 123.4% | ||||
| Non-controlling interest | 267.9 | 670.4 | 790.1 | 17.8% | 195.0% | ||||
| Net income attributable to the owners of the parent company | 466.7 | 782.7 | 850.7 | 8.7% | 82.3% | ||||
| Key ratios | 4Q17 | 3Q18 | 4Q18 | YTD 2017 | YTD 2018 | ||||
| Net Interest Margin(1) | 5.8% | 5.9% | 5.7% | 5.8% | 5.7% | ||||
| Net Interest Margin (including net trading income)(1) | 5.9% | 5.8% | 5.6% | 5.9% | 5.7% | ||||
| Efficiency ratio(2) | 46.3% | 39.1% | 41.8% | 46.5% | 43.1% | ||||
| ROAA(3) | 1.3% | 2.4% | 2.6% | 1.4% | 2.2% | ||||
| ROAE(4) | 11.6% | 19.1% | 19.6% | 12.5% | 17.8% | ||||
| 90 days PDL / Total loans and leases (5) | 2.8% | 3.2% | 3.1% | 2.8% | 3.1% | ||||
| Provision expense / Average loans and leases (6) | 2.7% | 2.3% | 3.1% | 2.5% | 2.4% | ||||
| Allowance / 90 days PDL (5) | 1.28 | 1.45 | 1.58 | 1.28 | 1.58 | ||||
| Allowance / Total loans and leases | 3.5% | 4.6% | 4.8% | 3.5% | 4.8% | ||||
| Charge-offs / Average loans and leases (6) | 1.8% | 1.9% | 2.2% | 1.7% | 1.9% | ||||
| Total loans and leases, net / Total assets | 68.0% | 65.5% | 65.0% | 68.0% | 65.0% | ||||
| Deposits / Total loans and leases, net | 96.3% | 96.8% | 97.4% | 96.3% | 97.4% | ||||
| Equity / Assets | 10.9% | 11.6% | 11.4% | 10.9% | 11.4% | ||||
| Tangible equity ratio (7) | 7.9% | 8.6% | 8.4% | 7.9% | 8.4% | ||||
| Shares outstanding (EoP) | 22,281,017,159 | 22,281,017,159 | 22,281,017,159 | 22,281,017,159 | 22,281,017,159 | ||||
| Shares outstanding (Average) | 22,281,017,159 | 22,281,017,159 | 22,281,017,159 | 22,281,017,159 | 22,281,017,159 | ||||
| Common share price (EoP) | 1,300.0 | 1,145.0 | 925.0 | 1,300.0 | 925.0 | ||||
| Preferred share price (EoP) | 1,290.0 | 1,165.0 | 999.0 | 1,290.0 | 999.0 | ||||
| BV/ EoP shares in Ps. | 731.0 | 758.3 | 798.4 | 731.0 | 798.4 | ||||
| EPS | 20.9 | 35.1 | 38.2 | 88.1 | 130.7 | ||||
| P/E (8) | 15.4 | 8.3 | 6.5 | 14.6 | 7.6 | ||||
| P/BV (8) | 1.8 | 1.5 | 1.3 | 1.8 | 1.3 | ||||
(1) NIM is calculated as Net Interest Income divided by the average of Interest Earning Assets; (2) Efficiency Ratio is calculated as personnel plus administrative and other expenses divided by net interest income plus net trading income, net income from sales of goods and services, other income and fees and other services income, net (excluding others); (3) ROAA is calculated as Income before Minority Interest divided by the average of total assets for each quarter; (4) ROAE is calculated as Net Income attributable to Grupo Aval’s shareholders divided by the average of shareholders´ attributable equity for each quarter; (5) Total loans excluding interbank and overnight funds and 90 days past due include interest accounts receivables; (6) Refers to average gross loans for the period; (7) Tangible Equity Ratio is calculated as Total Equity minus Intangibles (excluding those related to concessions) divided by Total Assets minus Intangibles (excluding those related to concessions); (8) Based on Preferred share prices. (9) FTVPL: Fair value through profit and loss
| 4 | |
Statement of Financial Position Analysis
1. Assets
Total assets as of December 31, 2018 totaled Ps 259,675.2 billion showing an increase of 9.8% versus December 31, 2017, and of 7.5% versus September 30, 2018. Growth in assets was mainly driven by a 4.9% year over year growth in total loans and receivables, net to Ps 168,685.7 billion. When excluding FX movement in our Central American operation (“excluding FX”), asset growth would have been 7.0% versus December 31, 2017 and 4.7% versus September 30, 2018; for total loans and receivables, net growth would have been 2.2% versus December 31, 2017 and 3.7% versus September 30, 2018.
1.1 Loans and receivables
Total gross loans and receivables (excluding interbank and overnight funds) increased by 6.4% between December 31, 2017 and December 31, 2018 to Ps 169,246.7 billion (3.7% excluding FX) mainly driven by (i) a 15.1% increase in Mortgage and housing leases to Ps 18,592.1 billion (9.4% excluding FX), (ii) a 10.1% increase in Consumer loans and leases to Ps 55,455.1 billion (6.8% excluding FX), and (iii) a 2.8% increase in Commercial loans and leases to Ps 94,773.8 billion (1.0% excluding FX).
Interbank & overnight funds increased by 4.9% to Ps 7,635.2 billion (1.7% excluding FX) during the last twelve months.
Allowance for impairment of loans and receivables was Ps 8,196.2 billion as of December 31, 2018 taking net loans and receivables to Ps 168,685.7 billion.
The increase in allowance for impairment of loans and receivables when compared to December 31, 2017 was impacted by the adoption of IFRS9 on January 1st, 2018, which accounted for Ps 1,163.0 billion.
| Total loans and receivables, net | 4Q17 | 3Q18 | 4Q18 | | |||||
| 4Q18 vs. 3Q18 | 4Q18 vs. 4Q17 | ||||||||
| Loans and receivables | |||||||||
| Commercial loans and leases | 92,149.8 | 91,648.3 | 94,773.8 | 3.4% | 2.8% | ||||
| Consumer loans and leases | 50,382.9 | 52,504.9 | 55,455.1 | 5.6% | 10.1% | ||||
| Mortgages and housing leases | 16,151.3 | 17,244.0 | 18,592.1 | 7.8% | 15.1% | ||||
| Microcredit loans and leases | 409.7 | 419.5 | 425.7 | 1.5% | 3.9% | ||||
| Loans and receivables | 159,093.7 | 161,816.7 | 169,246.7 | 4.6% | 6.4% | ||||
| Interbank & overnight funds | 7,279.0 | 3,960.3 | 7,635.2 | 92.8% | 4.9% | ||||
| Total loans and leases operations and receivables portfolio | 166,372.8 | 165,777.0 | 176,881.8 | 6.7% | 6.3% | ||||
| Allowance for impairment of loans and receivables | (5,618.5) | (7,511.9) | (8,196.2) | 9.1% | 45.9% | ||||
| Allowance for impairment of commercial loans | (2,928.5) | (3,835.3) | (4,357.9) | 13.6% | 48.8% | ||||
| Allowance for impairment of consumer loans | (2,461.9) | (3,345.8) | (3,448.9) | 3.1% | 40.1% | ||||
| Allowance for impairment of mortgages | (154.0) | (248.8) | (301.3) | 21.1% | 95.7% | ||||
| Allowance for impairment of microcredit loans | (74.2) | (82.1) | (88.2) | 7.4% | 18.9% | ||||
| Total loans and receivables, net | 160,754.3 | 158,265.1 | 168,685.7 | 6.6% | 4.9% | ||||
| 5 | |
The following table shows the gross loan composition per product of each of our loan categories.
| Gross loans | 4Q17 | 3Q18 | 4Q18 | | |||||
| 4Q18 vs. 3Q18 | 4Q18 vs. 4Q17 | ||||||||
| General purpose | 63,997.6 | 63,365.4 | 65,777.7 | 3.8% | 2.8% | ||||
| Working capital | 14,723.5 | 14,571.1 | 15,192.8 | 4.3% | 3.2% | ||||
| Financial leases | 9,892.4 | 9,785.6 | 9,859.0 | 0.7% | -0.3% | ||||
| Funded by development banks | 2,713.8 | 2,999.9 | 3,222.7 | 7.4% | 18.8% | ||||
| Overdrafts | 440.0 | 536.3 | 396.4 | -26.1% | -9.9% | ||||
| Credit cards | 382.6 | 390.0 | 325.1 | -16.6% | -15.0% | ||||
| Commercial loans and leases | 92,149.8 | 91,648.3 | 94,773.8 | 3.4% | 2.8% | ||||
| Personal loans | 30,709.4 | 32,584.5 | 33,937.4 | 4.2% | 10.5% | ||||
| Credit cards | 13,464.2 | 13,883.4 | 15,225.8 | 9.7% | 13.1% | ||||
| Automobile and vehicle | 5,896.6 | 5,703.7 | 5,951.8 | 4.3% | 0.9% | ||||
| Financial leases | 226.8 | 238.2 | 254.5 | 6.9% | 12.2% | ||||
| Overdrafts | 85.9 | 95.0 | 85.6 | -10.0% | -0.4% | ||||
| Other | 0.0 | 0.0 | 0.0 | -10.0% | -37.9% | ||||
| Consumer loans and leases | 50,382.9 | 52,504.9 | 55,455.1 | 5.6% | 10.1% | ||||
| Mortgages | 15,103.5 | 16,017.0 | 17,279.4 | 7.9% | 14.4% | ||||
| Housing leases | 1,047.8 | 1,227.0 | 1,312.7 | 7.0% | 25.3% | ||||
| Mortgages and housing leases | 16,151.3 | 17,244.0 | 18,592.1 | 7.8% | 15.1% | ||||
| Microcredit loans and leases | 409.7 | 419.5 | 425.7 | 1.5% | 3.9% | ||||
| Loans and receivables | 159,093.7 | 161,816.7 | 169,246.7 | 4.6% | 6.4% | ||||
| Interbank & overnight funds | 7,279.0 | 3,960.3 | 7,635.2 | 92.8% | 4.9% | ||||
| Total loans and leases operations and receivables portfolio | 166,372.8 | 165,777.0 | 176,881.8 | 6.7% | 6.3% | ||||
Over the last twelve months, personal loans, mortgages and credit cards have driven our loan portfolio growth in accordance with our banks’ strategy. During 2018, Grupo Aval engaged in a strategy of marginal but profitable growth in the Colombian commercial loan book combined with a focus on retail banking that lead to increases in market share in products such as payrolls, credit cards and mortgages.
In Colombia, loans and receivables increased by 3.3% during the last twelve months and 1.6% during the quarter. As for Central America, loans and receivables grew by 13.9% between December 31, 2017 and December 31, 2018 and increased 11.9% in the last quarter; when excluding FX, growth would have been 4.6% and 2.3%, respectively.
Commercial loans grew by 2.8% between December 31, 2017 and December 31, 2018 and 3.4% during the quarter. In Colombia, commercial loans decreased by 0.9% between December 31, 2017 and December 31, 2018 and increased 0.5% in the quarter. As for Central America, commercial loans grew by 16.7% between December 31, 2017 and December 31, 2018 and 13.7% in the quarter; when excluding FX, growth in Central America would have been 7.1% and 4.0%, respectively.
Consumer loans growth over the last year and quarter was mainly driven by personal loans and credit cards. In Colombia, personal loans grew by 11.2% during the last twelve months and 3.2% between December 31, 2018 and September 30, 2018, mainly in payroll lending. Growth of our Central American operations, excluding FX, was driven by credit cards, which grew 6.4% during the last twelve months and 3.9% in the quarter.
| 6 | |
The following table shows the loans and receivables composition per entity. During the last twelve months, Banco AV Villas showed the highest growth rate within our banking operation in Colombia, driven by a strong performance in payroll loans which grew approximately 31% (or 41.1% of its average balance of payroll lending) as compared to December 31, 2017.
| Gross loans / Bank ($) | 4Q17 | 3Q18 | 4Q18 | | |||||
| 4Q18 vs. 3Q18 | 4Q18 vs. 4Q17 | ||||||||
| Banco de Bogotá | 102,404.4 | 103,561.6 | 109,543.5 | 5.8% | 7.0% | ||||
| Domestic | 56,058.8 | 56,363.0 | 56,733.7 | 0.7% | 1.2% | ||||
| Central America | 46,345.5 | 47,198.6 | 52,809.8 | 11.9% | 13.9% | ||||
| Banco de Occidente | 27,132.0 | 27,049.2 | 27,964.3 | 3.4% | 3.1% | ||||
| Banco Popular | 17,690.2 | 18,783.2 | 19,040.1 | 1.4% | 7.6% | ||||
| Banco AV Villas | 10,131.9 | 11,049.6 | 11,516.9 | 4.2% | 13.7% | ||||
| Corficolombiana | 2,502.5 | 2,391.4 | 2,385.3 | -0.3% | -4.7% | ||||
| Eliminations | (767.3) | (1,018.2) | (1,203.5) | 18.2% | 56.8% | ||||
| Loans and receivables | 159,093.7 | 161,816.7 | 169,246.7 | 4.6% | 6.4% | ||||
| Interbank & overnight funds | 7,279.0 | 3,960.3 | 7,635.2 | 92.8% | 4.9% | ||||
| Total loans and receivables portfolio | 166,372.8 | 165,777.0 | 176,881.8 | 6.7% | 6.3% | ||||
| Gross loans / Bank (%) | 4Q17 | 3Q18 | 4Q18 | |||
| Banco de Bogotá | 64.4% | 64.0% | 64.7% | |||
| Domestic | 35.2% | 34.8% | 33.5% | |||
| Central America | 29.1% | 29.2% | 31.2% | |||
| Banco de Occidente | 17.1% | 16.7% | 16.5% | |||
| Banco Popular | 11.1% | 11.6% | 11.2% | |||
| Banco AV Villas | 6.4% | 6.8% | 6.8% | |||
| Corficolombiana | 1.6% | 1.5% | 1.4% | |||
| Eliminations | -0.5% | -0.6% | -0.7% | |||
| Loans and receivables | 100% | 100% | 100% |
In terms of gross loans (excluding interbank and overnight funds), 68.8% are domestic and 31.2% are foreign (reflecting the Central American operations).
| Gross loans | 4Q17 | 3Q18 | 4Q18 | | |||||
| 4Q18 vs. 3Q18 | 4Q18 vs. 4Q17 | ||||||||
| Domestic | |||||||||
| Commercial loans and leases | 72,703.5 | 71,690.5 | 72,084.2 | 0.5% | -0.9% | ||||
| Consumer loans and leases | 32,911.6 | 34,898.9 | 35,941.5 | 3.0% | 9.2% | ||||
| Mortgages and housing leases | 6,723.4 | 7,609.2 | 7,985.4 | 4.9% | 18.8% | ||||
| Microcredit loans and leases | 409.7 | 419.5 | 425.7 | 1.5% | 3.9% | ||||
| Interbank & overnight funds | 4,739.9 | 2,057.6 | 5,572.9 | 170.8% | 17.6% | ||||
| Total domestic loans | 117,488.1 | 116,675.8 | 122,009.7 | 4.6% | 3.8% | ||||
| Foreign | |||||||||
| Commercial loans and leases | 19,446.3 | 19,957.8 | 22,689.5 | 13.7% | 16.7% | ||||
| Consumer loans and leases | 17,471.3 | 17,606.0 | 19,513.5 | 10.8% | 11.7% | ||||
| Mortgages and housing leases | 9,427.9 | 9,634.8 | 10,606.8 | 10.1% | 12.5% | ||||
| Microcredit loans and leases | - | - | - | - | - | ||||
| Interbank & overnight funds | 2,539.2 | 1,902.7 | 2,062.3 | 8.4% | -18.8% | ||||
| Total foreign loans | 48,884.7 | 49,101.3 | 54,872.1 | 11.8% | 12.2% | ||||
| Total loans and leases operations and receivables portfolio | 166,372.8 | 165,777.0 | 176,881.8 | 6.7% | 6.3% | ||||
| 7 | |
The quality of our loan portfolio improved during the quarter mainly driven by an improvement of the commercial and consumer portfolio's PDL’s (21 bps and 34 bps, respectively) and NPL’s (10 bps 23 bps, respectively), mostly driven by a improving new PDL formation trend and a pick-up in growth dynamics.
Our 30 days PDL to total loans closed 4Q18 in 4.3%, compared to 4.5% in 3Q18 and 3.9% in 4Q17. The ratio of 90 days PDL to total loans was 3.1% for 4Q18, compared to 3.2% in 3Q18 and 2.8% in 4Q17. Finally, the ratio of CDE Loans to total loans was 7.1% in 4Q18 and 3Q18 and 6.0% in 4Q17.
Commercial loans’ 30 days PDL ratio was 3.9% for 4Q18, 4.1% for 3Q18 and 3.2% for 4Q17; 90 days PDL ratio was 3.4%, 3.5% and 2.8%, respectively. Consumer loans’ 30 days PDL ratio was 4.8% for 4Q18, 5.2% for 3Q18 and 5.1% for 4Q17; 90 days PDL ratio was 2.7%, 2.9% and 2.8%, respectively. Mortgages’ 30 days PDL ratio was 4.1% for 4Q18 and 3Q18, and 3.8% for 4Q17; 90 days PDL ratio was 2.2%, 2.2% and 2.1%, respectively.
| Total loans and leases operations and receivables portfolio | 4Q17 | 3Q18 | 4Q18 | | |||||
| 4Q18 vs. 3Q18 | 4Q18 vs. 4Q17 | ||||||||
| ''A'' normal risk | 145,234.6 | 145,440.1 | 152,227.9 | 4.7% | 4.8% | ||||
| ''B'' acceptable risk | 4,345.3 | 4,892.4 | 5,029.6 | 2.8% | 15.7% | ||||
| ''C'' appreciable risk | 4,633.9 | 5,213.2 | 5,528.6 | 6.0% | 19.3% | ||||
| ''D'' significant risk | 3,273.2 | 4,177.6 | 3,519.5 | -15.8% | 7.5% | ||||
| ''E'' unrecoverable | 1,606.7 | 2,093.4 | 2,941.1 | 40.5% | 83.0% | ||||
| Loans and receivables | 159,093.7 | 161,816.7 | 169,246.7 | 4.6% | 6.4% | ||||
| Interbank and overnight funds | 7,279.0 | 3,960.3 | 7,635.2 | 92.8% | 4.9% | ||||
| Total loans and leases operations and receivables portfolio | 166,372.8 | 165,777.0 | 176,881.8 | 6.7% | 6.3% | ||||
| CDE loans / Total loans (*) | 6.0% | 7.1% | 7.1% | ||||||
| Past due loans | 4Q17 | 3Q18 | 4Q18 | | |||||
| 4Q18 vs. 3Q18 | 4Q18 vs. 4Q17 | ||||||||
| Performing | 89,196.4 | 87,902.3 | 91,094.8 | 3.6% | 2.1% | ||||
| Between 31 and 90 days past due | 345.2 | 524.5 | 438.7 | -16.4% | 27.1% | ||||
| +90 days past due | 2,608.3 | 3,221.5 | 3,240.3 | 0.6% | 24.2% | ||||
| Commercial loans and leases | 92,149.8 | 91,648.3 | 94,773.8 | 3.4% | 2.8% | ||||
| Performing | 47,818.8 | 49,790.2 | 52,776.6 | 6.0% | 10.4% | ||||
| Between 31 and 90 days past due | 1,167.6 | 1,197.0 | 1,200.8 | 0.3% | 2.8% | ||||
| +90 days past due | 1,396.5 | 1,517.7 | 1,477.7 | -2.6% | 5.8% | ||||
| Consumer loans and leases | 50,382.9 | 52,504.9 | 55,455.1 | 5.6% | 10.1% | ||||
| Performing | 15,535.3 | 16,539.9 | 17,824.8 | 7.8% | 14.7% | ||||
| Between 31 and 90 days past due | 282.3 | 324.3 | 349.2 | 7.7% | 23.7% | ||||
| +90 days past due | 333.6 | 379.7 | 418.1 | 10.1% | 25.3% | ||||
| Mortgages and housing leases | 16,151.3 | 17,244.0 | 18,592.1 | 7.8% | 15.1% | ||||
| Performing | 347.9 | 355.4 | 355.4 | 0.0% | 2.1% | ||||
| Between 31 and 90 days past due | 18.2 | 16.7 | 18.0 | 7.9% | -1.5% | ||||
| +90 days past due | 43.6 | 47.5 | 52.4 | 10.3% | 20.2% | ||||
| Microcredit loans and leases | 409.7 | 419.5 | 425.7 | 1.5% | 3.9% | ||||
| Loans and receivables | 159,093.7 | 161,816.7 | 169,246.7 | 4.6% | 6.4% | ||||
| Interbank & overnight funds | 7,279.0 | 3,960.3 | 7,635.2 | 92.8% | 4.9% | ||||
| Allowance for impairment of commercial loans | 166,372.8 | 165,777.0 | 176,881.8 | 6.7% | 6.3% | ||||
| 30 Days PDL / Total loans (*) | 3.9% | 4.5% | 4.3% | |||
| 90 Days PDL / Total loans (*) | 2.8% | 3.2% | 3.1% |
(*) Total loans excluding interbank and overnight funds. 30 days past due and 90 days past due are calculated on a capital plus interest accounts receivable basis.
| 8 | |
Grupo Aval’s coverage over its 90 days PDL increased from 1.3x for 4Q17 to 1.6x for 4Q18. Allowance to CDE Loans was 0.7x for 4Q18 and 3Q18 and 0.6x for 4Q17, and allowance to 30 days PDL was 1.1x for 4Q18, 1.0x for 3Q18 and 0.9x for 4Q17. Impairment loss, net of recoveries of charged off assets to average total loans was 3.1% in 4Q18, 2.3% in 3Q18 and 2.7% in 4Q17. Charge-offs to average total loans was 2.2% in 4Q18, 1.9% in 3Q18 and 1.8% in 4Q17. Increases in coverage are partly due to the adoption of IFRS 9.
| Total loans and leases operations and receivables portfolio | 4Q17 | 3Q18 | 4Q18 |
| Allowance for impairment / CDE loans | 0.6 | 0.7 | 0.7 | |||
| Allowance for impairment / 30 Days PDL | 0.9 | 1.0 | 1.1 | |||
| Allowance for impairment / 90 Days PDL | 1.3 | 1.5 | 1.6 | |||
| Allowance for impairment / Total loans (*) | 3.5% | 4.6% | 4.8% |
| Impairment loss / CDE loans | 0.5 | 0.4 | 0.5 | |||
| Impairment loss / 30 Days PDL | 0.7 | 0.6 | 0.8 | |||
| Impairment loss / 90 Days PDL | 1.0 | 0.8 | 1.0 | |||
| Impairment loss / Average total loans (*) | 2.9% | 2.5% | 3.3% | |||
| Impairment loss, net of recoveries of charged-off assets / Average total loans (*) | 2.7% | 2.3% | 3.1% | |||
| Charge-offs / Average total loans (*) | 1.8% | 1.9% | 2.2% |
(*) Total loans excluding interbank and overnight funds. 30 days past due and 90 days past due are calculated on a capital plus interest accounts receivable basis.
1.2 Investments securities and trading assets
Total investment and trading assets increased 13.5% to Ps 30,234.5 billion between December 31, 2017 and December 31, 2018, and 2.6% versus September 30, 2018. Ps 25,702.6 billion of our total gross portfolio is invested in debt securities, which increased by 10.1% between December 31, 2017 and December 31, 2018 and by 1.4% since September 30, 2018. Ps 3,789.1 billion of our total gross investment securities is invested in equity securities, which increased by 27.4% between December 31, 2017 and December 31, 2018 and by 7.3% versus September 30, 2018. The increase in equity securities was driven by the increase of the stabilization reserve in Porvenir and the increase of Corficolombiana’s stake in Grupo de Energía de Bogotá.
| Investment and trading assets | 4Q17 | 3Q18 | 4Q18 | | |||||
| 4Q18 vs. 3Q18 | 4Q18 vs. 4Q17 | ||||||||
| Debt securities | 2,650.5 | 2,467.3 | 3,763.0 | 52.5% | 42.0% | ||||
| Equity securities | 2,149.2 | 2,318.2 | 2,672.6 | 15.3% | 24.4% | ||||
| Derivative assets | 328.4 | 605.6 | 768.7 | 26.9% | 134.1% | ||||
| Trading assets | 5,128.1 | 5,391.2 | 7,204.3 | 33.6% | 40.5% | ||||
| Investments in debt securities at FVTPL (non compliant with SPPI test) (*) | - | - | 31.3 | N.A | N.A | ||||
| Debt securities at FVOCI (**) | 17,790.1 | 19,870.3 | 18,935.8 | -4.7% | 6.4% | ||||
| Equity securities at FVOCI (**) | 824.0 | 1,212.9 | 1,116.5 | -7.9% | 35.5% | ||||
| Investments in securities at FVOCI | 18,614.2 | 21,083.2 | 20,052.2 | -4.9% | 7.7% | ||||
| Investments in debt securities at amortized cost | 2,899.0 | 2,999.4 | 2,972.6 | -0.9% | 2.5% | ||||
| Loss impairment | (0.0) | (0.1) | (25.9) | N.A. | N.A. | ||||
| Investment and trading assets | 26,641.3 | 29,473.7 | 30,234.5 | 2.6% | 13.5% | ||||
(*) After the adoption of IFRS 9, certain investment securities were designated as at fair value through profit and loss (FVTPL) because the contractual cash flows of these securities are not SPPI on the principal outstanding. The reclassified assets include certain asset-backed securities whose exposure to credit risk is higher than the exposure to credit risk of the underlying pool of financial assets. (**) FVOCI: Fair value through other comprehensive income.
| 9 | |
The average yield on our debt and equity investment securities (trading assets, investments in debt securities at fair value through profit or loss, investments in securities at fair value through other comprehensive income and investments in debt securities at amortized cost) was 4.4% for 4Q18, 4.7% for 3Q18 and 4.6% in 4Q17. Full year yields were 4.5% for 2018 and 5.1% for 2017.
1.3 Cash and Cash Equivalents
As of December 31, 2018 cash and cash equivalents had a balance of Ps 28,401.3 billion showing increases of 27.1% versus December 31, 2017 and of 16.4% versus September 30, 2018 (22.6% and 12.3% excluding FX).
The ratio of cash and cash equivalents to deposits was 17.3% in December 31, 2018, 15.9% in September 30, 2018, and 14.4% in December 31, 2017.
1.4 Goodwill and Other Intangibles
Goodwill and other intangibles as of December 31, 2018 reached Ps 13,867.0 billion, increasing by 27.6% versus December 31, 2017 and 8.0% versus September 30, 2018.
Goodwill as of December 31, 2018 was Ps 7,318.6 billion, increasing by 6.1% versus December 31, 2017 and by 6.3% versus September 30, 2018, explained by fluctuations in the exchange rate.
Other intangibles, which include “concession arrangement rights” and other intangibles, mainly reflect the value of road concessions recorded for the most part at Corficolombiana. Other intangibles as of December 31, 2018 reached Ps 6,548.4 billion and grew by 65.2% versus December 31, 2017 and 9.9% versus September 30, 2018. This increase was mainly driven by the beginning of the construction of two Forth Generation (4G) projects and the adoption of IFRS 15 in 2018. As of December 31, 2018 Corficolombiana was constructing three of the four 4G projects.
2. Liabilities
As of December 31, 2018 funding represented 93.7% of total liabilities and other liabilities represented 6.3%.
2.1 Funding
Total Funding (Total Financial Liabilities at Amortized Cost) which includes (i) Customer deposits, (ii) Interbank borrowings and overnight funds, (iii) Borrowings from banks and others, (iv) Bonds issued, and (v) Borrowing from development entities had a balance of Ps 215,571.4 billion as of December 31, 2018 showing an increase of 7.7% versus December 31, 2017 and 7.0% versus September 30, 2018 (5.0% and 4.3% increase excluding FX). Total customer deposits represented 76.2% of total funding as of the end of 4Q18, 76.0% for 3Q18 and 77.4% for 4Q17.
Average cost of funds was 3.7% in 4Q18 and 3Q18, and 4.0% in 4Q17. Our average cost of funds reflects stability in line with a now stable interest rate scenario. Full year cost of funds was 3.7% for 2018 and 4.2% for 2017.
| 10 | |
2.1.1 Customer deposits
| Customer deposits | 4Q17 | 3Q18 | 4Q18 | | |||||
| 4Q18 vs. 3Q18 | 4Q18 vs. 4Q17 | ||||||||
| Checking accounts | 15,421.1 | 13,668.0 | 17,325.2 | 26.8% | 12.3% | ||||
| Other deposits | 472.8 | 596.9 | 582.1 | -2.5% | 23.1% | ||||
| Non-interest bearing | 15,893.9 | 14,264.9 | 17,907.3 | 25.5% | 12.7% | ||||
| Checking accounts | 20,596.5 | 19,733.4 | 22,377.7 | 13.4% | 8.6% | ||||
| Time deposits | 62,616.2 | 66,265.0 | 66,853.0 | 0.9% | 6.8% | ||||
| Savings deposits | 55,778.7 | 52,925.2 | 57,221.4 | 8.1% | 2.6% | ||||
| Interest bearing | 138,991.4 | 138,923.7 | 146,452.1 | 5.4% | 5.4% | ||||
| Customer deposits | 154,885.2 | 153,188.5 | 164,359.5 | 7.3% | 6.1% | ||||
Of our total customer deposits as of December 31, 2018 checking accounts represented 24.2%, time deposits 40.7%, savings deposits 34.8%, and other deposits 0.4%.
The following table shows the customer deposits composition by bank. During the last twelve months, Banco AV Villas showed the highest growth rate in customer deposits within our banking operation in Colombia.
| Deposits / Bank ($) | 4Q17 | 3Q18 | 4Q18 | | |||||
| 4Q18 vs. 3Q18 | 4Q18 vs. 4Q17 | ||||||||
| Banco de Bogotá | 100,947.2 | 98,944.1 | 108,404.5 | 9.6% | 7.4% | ||||
| Domestic | 56,548.8 | 53,724.9 | 57,747.6 | 7.5% | 2.1% | ||||
| Central America | 44,398.4 | 45,219.1 | 50,656.9 | 12.0% | 14.1% | ||||
| Banco de Occidente | 26,169.1 | 25,662.5 | 25,592.2 | -0.3% | -2.2% | ||||
| Banco Popular | 15,968.5 | 17,197.4 | 17,571.4 | 2.2% | 10.0% | ||||
| Banco AV Villas | 10,086.1 | 10,417.7 | 11,425.4 | 9.7% | 13.3% | ||||
| Corficolombiana | 4,095.7 | 3,727.3 | 3,805.0 | 2.1% | -7.1% | ||||
| Eliminations | (2,381.4) | (2,760.4) | (2,439.1) | -11.6% | 2.4% | ||||
| Total Grupo Aval | 154,885.2 | 153,188.5 | 164,359.5 | 7.3% | 6.1% | ||||
| Deposits / Bank (%) | 4Q17 | 3Q18 | 4Q18 | ||||||
| Banco de Bogotá | 65.2% | 64.6% | 66.0% | ||||||
| Domestic | 36.5% | 35.1% | 35.1% | ||||||
| Central America | 28.7% | 29.5% | 30.8% | ||||||
| Banco de Occidente | 16.9% | 16.8% | 15.6% | ||||||
| Banco Popular | 10.3% | 11.2% | 10.7% | ||||||
| Banco AV Villas | 6.5% | 6.8% | 7.0% | ||||||
| Corficolombiana | 2.6% | 2.4% | 2.3% | ||||||
| Eliminations | -1.5% | -1.8% | -1.5% | ||||||
| Total Grupo Aval | 100.0% | 100.0% | 100.0% | ||||||
| 11 | |
2.1.2 Borrowings from Banks and Other (includes borrowings from development entities)
As of December 31, 2018 borrowings from banks and other totaled Ps 24,257.6 billion, showing increases of 14.4% versus December 31, 2017 and of 18.1% versus September 30, 2018. Excluding FX, borrowings from banks and other increased 9.6% versus December 31, 2017 and 13.4% versus September 30, 2018.
2.1.3 Bonds issued
Total bonds issued as of December 31, 2018 totaled Ps 20,140.3 billion showing an increase of 5.4% versus December 31, 2017 and 5.3% versus September 30, 2018. Excluding FX, bonds increased 4.9% versus both December 31, 2017 and September 30, 2018.
3. Non-controlling Interest
Non-controlling Interest in Grupo Aval reflects: (i) the minority stakes that third party shareholders hold in each of its direct consolidated subsidiaries (Banco de Bogotá, Banco de Occidente, Banco Popular, Banco AV Villas and Corficolombiana), and (ii) the minority stakes that third party shareholders hold in the consolidated subsidiaries at the bank level (mainly Porvenir). As of December 31, 2018 non-controlling interest was Ps 11,764.6 billion which increased by 22.7% versus December 31, 2017 and 6.8% versus September 30, 2018 mainly driven by the dilution seen in Corficolombiana’s stake. Total non-controlling interest represents 39.8% of total equity as of December 31, 2018. Total non-controlling interest derives from the sum of the combined minority interests of our banks and of Grupo Aval, applying eliminations associated with the consolidation process of Grupo Aval.
| Direct & indirect ownership of main subsidiaries | 4Q17 | 3Q18 | 4Q18 | | |||||
| 4Q18 vs. 3Q18 | 4Q18 vs. 4Q17 | ||||||||
| Banco de Bogotá | 68.7% | 68.7% | 68.7% | - | - | ||||
| Banco de Occidente | 72.3% | 72.3% | 72.3% | - | - | ||||
| Banco Popular | 93.7% | 93.7% | 93.7% | - | - | ||||
| Banco AV Villas | 79.9% | 79.9% | 79.9% | - | - | ||||
| BAC Credomatic(1) | 68.7% | 68.7% | 68.7% | - | - | ||||
| Porvenir(2) | 75.7% | 75.7% | 75.7% | - | (3) | ||||
| Corficolombiana(3) | 44.8% | 38.2% | 38.2% | 1 | (654) | ||||
(1) BAC Credomatic is fully owned by Banco de Bogotá; (2) Grupo Aval indirectly owns a 100% of Porvenir voting rights through: 20.0% in Grupo Aval, 46.9% in Banco de Bogotá and 33.1% in Banco de Occidente. Porvenir's results consolidate into Banco de Bogotá; (3) Grupo Aval decreased its ownership in Corficolombiana as it did not exercise its right to subscribe shares in the equity issuance done in 2018. Rights of subscription were transferred to all Grupo Aval shareholders.
4. Attributable Shareholders’ Equity
Attributable shareholders’ equity as of December 31, 2018 was Ps 17,789.7 billion, showing an increase of 9.2% versus December 31, 2017 and 5.3% versus September 30, 2018.
| 12 | |
Income Statement Analysis
Our net income attributable to the owners of the parent company for 4Q18 of Ps 850.7 billion showed a 82.3% increase versus 4Q17 and a 8.7% increase versus 3Q18.
| Consolidated Statement of Income | 4Q17 | 3Q18 | 4Q18 | | |||||
| 4Q18 vs. 3Q18 | 4Q18 vs. 4Q17 | ||||||||
| Interest income | 4,622.8 | 4,599.3 | 4,691.6 | 2.0% | 1.5% | ||||
| Interest expense | 1,961.0 | 1,847.3 | 1,934.7 | 4.7% | -1.3% | ||||
| Net interest income | 2,661.8 | 2,752.0 | 2,757.0 | 0.2% | 3.6% | ||||
| Loans and other accounts receivable | 1,125.9 | 1,013.9 | 1,359.7 | 34.1% | 20.8% | ||||
| Other financial assets | - | 3.9 | 22.3 | N.A. | N.A | ||||
| Recovery of charged-off financial assets | (78.2) | (83.4) | (81.7) | -2.0% | 4.4% | ||||
| Impairment loss on financial assets | 1,047.7 | 934.4 | 1,300.4 | 39.2% | 24.1% | ||||
| Net income from commissions and fees | 1,165.8 | 1,193.8 | 1,296.6 | 8.6% | 11.2% | ||||
| Net income from sales of goods and services | 297.6 | 972.3 | 1,206.8 | 24.1% | N.A. | ||||
| Net trading income | 178.8 | 109.5 | 318.9 | 191.3% | 78.3% | ||||
| Net income from other financial instruments designated at FVTPL (*) | 62.4 | 50.2 | 28.6 | -43.0% | -54.2% | ||||
| Total other income | 298.4 | 297.6 | 500.8 | 68.3% | 67.9% | ||||
| Total other expenses | 2,442.4 | 2,236.8 | 2,693.6 | 20.4% | 10.3% | ||||
| Net income before tax expense | 1,174.7 | 2,204.0 | 2,114.7 | -4.0% | 80.0% | ||||
| Income tax expense | 440.2 | 750.8 | 473.9 | -36.9% | 7.7% | ||||
| Net income for the period | 734.6 | 1,453.2 | 1,640.8 | 12.9% | 123.4% | ||||
| Non-controlling interest | 267.9 | 670.4 | 790.1 | 17.8% | 195.0% | ||||
| Net income attributable to the owners of the parent company | 466.7 | 782.7 | 850.7 | 8.7% | 82.3% | ||||
(*) FVTPL: Fair value through profit and loss.
1. Net Interest Income
| Net interest income | 4Q17 | 3Q18 | 4Q18 | | |||||
| 4Q18 vs. 3Q18 | 4Q18 vs. 4Q17 | ||||||||
| Interest income | |||||||||
| Commercial | 1,927.5 | 1,809.3 | 1,775.9 | -1.8% | -7.9% | ||||
| Interbank and overnight funds | 67.3 | 77.4 | 86.7 | 11.9% | 28.8% | ||||
| Consumer | 2,079.0 | 2,072.8 | 2,166.2 | 4.5% | 4.2% | ||||
| Mortgages and housing leases | 336.3 | 366.2 | 387.0 | 5.7% | 15.0% | ||||
| Microcredit | 29.4 | 26.4 | 25.6 | -3.4% | -13.1% | ||||
| Loan portfolio | 4,439.5 | 4,352.2 | 4,441.3 | 2.0% | 0.0% | ||||
| Interests on investments in debt securities | 183.3 | 247.1 | 250.3 | 1.3% | 36.6% | ||||
| Total interest income | 4,622.8 | 4,599.3 | 4,691.6 | 2.0% | 1.5% | ||||
| Interest expense | |||||||||
| Checking accounts | 72.8 | 81.2 | 96.7 | 19.1% | 32.9% | ||||
| Time deposits | 824.4 | 823.8 | 842.0 | 2.2% | 2.1% | ||||
| Savings deposits | 449.6 | 368.0 | 361.7 | -1.7% | -19.6% | ||||
| Total interest expenses on deposits | 1,346.8 | 1,273.1 | 1,300.4 | 2.1% | -3.4% | ||||
| Interbank borrowings and overnight funds | 68.9 | 56.2 | 88.8 | 58.1% | 28.9% | ||||
| Borrowings from banks and others | 218.9 | 193.8 | 214.2 | 10.6% | -2.1% | ||||
| Bonds issued | 288.7 | 289.2 | 294.9 | 2.0% | 2.2% | ||||
| Borrowings from development entities | 37.7 | 35.1 | 36.3 | 3.6% | -3.7% | ||||
| Total interest expenses on financial obligations | 614.2 | 574.2 | 634.2 | 10.5% | 3.3% | ||||
| Total interest expense | 1,961.0 | 1,847.3 | 1,934.7 | 4.7% | -1.3% | ||||
| Net interest income | 2,661.8 | 2,752.0 | 2,757.0 | 0.2% | 3.6% | ||||
| 13 | |
Our net interest income increased by 3.6% to Ps 2,757.0 billion for 4Q18 versus 4Q17 and 0.2% versus 3Q18. The increase versus 4Q17 was derived from a 1.5% increase in total interest income and a 1.3% decrease in total interest expense.
Our Net Interest Margin(1)(2) was 5.6% for 4Q18, 5.8% for 3Q18 and 5.9% for 4Q17. Net Interest Margin on Loans was 6.6% for 4Q18, 6.8% for 3Q18 and 7.0% in 4Q17. On the other hand, our Net Investments Margin was 0.5% in 4Q18 versus 0.8% in 3Q18 and 0.4% in 4Q17.
In our Colombian operations, our Net Interest Margin was 5.2% for 4Q18, 5.5% for 3Q18, and 5.6% for 4Q17. Net Interest Margin on Loans was 6.2% for 4Q18, 6.5% for 3Q18 and 6.7% in 4Q17. On the other hand, our Net Investments Margin was 0.4% in 4Q18 versus 0.7% in 3Q18 and 0.1% in 4Q17.
In our Central American operations, our Net Interest Margin was 6.7% for 4Q18, 6.5% in 3Q18, and 6.7% in 4Q17. Net Interest Margin on Loans was 7.6% for 4Q18, 7.4% for 2Q18 and 7.6% for 4Q17. On the other hand, our Net Investments Margin was 0.7% in 4Q18 versus 1.1% in 3Q18 and 1.2% in 4Q17.
Net Interest Margin was 5.7% for full year 2018 and 5.9% for full year 2017, respectively (1)(2). Net Interest Margin on Loans was 6.7% for full year 2018 and 6.9% for full year 2017. Net Investments Margin was 0.6% for full year 2018 and 0.7% for full year 2017.
2. Impairment loss on financial assets, net
Our impairment loss on financial assets, net increased by 24.1% to Ps 1,300.4 billion for 4Q18 versus 4Q17 and 39.2% versus 3Q18.
| Impairment loss on financial assets | 4Q17 | 3Q18 | 4Q18 | | |||||
| 4Q18 vs. 3Q18 | 4Q18 vs. 4Q17 | ||||||||
| Loans and other accounts receivable | 1,125.9 | 1,013.9 | 1,359.7 | 34.1% | 20.8% | ||||
| Other financial assets | - | 3.9 | 22.3 | N.A. | N.A | ||||
| Recovery of charged-off financial assets | (78.2) | (83.4) | (81.7) | -2.0% | 4.4% | ||||
| Impairment loss on financial assets | 1,047.7 | 934.4 | 1,300.4 | 39.2% | 24.1% | ||||
Our annualized gross cost of risk was 3.3% for 4Q18, 2.5% for 3Q18 and 2.9% for 4Q17. Net of recoveries of charged-off assets our ratio was 3.1% for 4Q18, 2.3% for 3Q18, and 2.7% for 4Q17. The last quarter had an expected 78 bps non-recurrent hike associated to marginal provisions done in our bank’s CRDS, Electricaribe and SITP exposures.
For the full year, gross cost of risk(2) was 2.6% for FY18 and 2.7% for FY17.Net of recoveries of charged-off assets, cost of risk for full year was 2.4% for FY18 and 2.5% for FY17. The specific corporate loans accounted for 37 and 34 bps of full year cost of risk, respectively.
| (1) | Grupo Aval’s NIM without income from trading securities and investment in debt securities designated at fair value through profit and loss (non compliant with SPPI test) was 5.7% for 4Q18, 5.9% for 3Q18 and 5.8% for 4Q17, while for full year 2017 was 5.8% and full year 2018 was 5.7%. |
| (2) | Grupo Aval’s NIM and cost of risk for the twelve-month period ended December 31, 2018, included the impact of Ps 382.0 billion of provisions of loans classified as Stage 3 accounted as a lower value of net interest income. The impairment loss on financial assets excludes the aforementioned Ps 382.0 billion. |
| 14 | |
3. Non-interest income
| Total non-interest income | 4Q17 | 3Q18 | 4Q18 | | |||||
| 4Q18 vs. 3Q18 | 4Q18 vs. 4Q17 | ||||||||
| Income from commissions and fees | |||||||||
| Banking fees(1) | 955.8 | 975.8 | 1,082.4 | 10.9% | 13.3% | ||||
| Trust activities | 83.9 | 77.3 | 81.4 | 5.4% | -3.0% | ||||
| Pension and severance fund management | 231.5 | 244.1 | 254.5 | 4.2% | 9.9% | ||||
| Bonded warehouse services | 41.3 | 38.9 | 41.4 | 6.4% | 0.3% | ||||
| Total income from commissions and fees | 1,312.5 | 1,336.1 | 1,459.7 | 9.3% | 11.2% | ||||
| Expenses from commissions and fees | 146.7 | 142.3 | 163.1 | 14.6% | 11.1% | ||||
| Net income from commissions and fees | 1,165.8 | 1,193.8 | 1,296.6 | 8.6% | 11.2% | ||||
| Income from sales of goods and services | 1,529.8 | 2,465.2 | 2,829.0 | 14.8% | 84.9% | ||||
| Costs and expenses from sales of goods and services | 1,232.2 | 1,492.9 | 1,622.3 | 8.7% | 31.7% | ||||
| Net income from sales of goods and services (non-financial sector) | 297.6 | 972.3 | 1,206.8 | 24.1% | N.A. | ||||
| Net trading income | 178.8 | 109.5 | 318.9 | 191.3% | 78.3% | ||||
| Net income from other financial instruments designated at FVTPL(2) | 62.4 | 50.2 | 28.6 | -43.0% | -54.2% | ||||
| Other income | |||||||||
| Foreign exchange gains (losses), net | 78.2 | 106.0 | (87.9) | -182.9% | N.A | ||||
| Net gain on sale of investments | 23.4 | 5.9 | 15.1 | 153.8% | -35.5% | ||||
| Gain on the sale of non-current assets held for sale | 2.3 | 8.3 | 5.6 | -32.5% | 146.2% | ||||
| Income from non-consolidated investments(3) | 37.5 | 58.9 | 65.6 | 11.3% | 74.8% | ||||
| Net gains on asset valuations | 20.9 | 2.2 | 27.3 | N.A. | 30.3% | ||||
| Other operating income | 136.1 | 116.2 | 475.1 | N.A. | N.A. | ||||
| Total other income | 298.4 | 297.6 | 500.8 | 68.3% | 67.9% | ||||
| Total non-interest income | 2,003.1 | 2,623.3 | 3,351.7 | 27.8% | 67.3% | ||||
(1) Includes commissions on banking services, office network services, credit and debit card fees, fees on drafts, checks and checkbooks and other fees
(2) FVTPL: Fair value through profit and loss
(3) Includes equity method and dividends
3.1 Net income from commissions and fees
Net Income from commissions and fees increased by 11.2% to Ps 1,296.6 billion for 4Q18 versus 4Q17 and 8.6% in the quarter. Income from commissions and fees increased by 11.2% to Ps 1,459.7 billion in 4Q18 versus 4Q17 and 9.3% in the quarter. Excluding FX, net income from commissions increased 8.2% and 5.4%, respectively. In Colombia, net income from commissions and fees increased by 12.2% over the last year and 3.3% over the quarter. In Central America, net income from commissions and fees increased by 10.1% over the last year and 15.6% over the quarter; excluding FX, net income increased by 3.9% over the last year and 8.0% during the quarter.
3.2 Net income from sales of goods and services
Net income from sales of goods and services (non-financial sector) increased by 305.4% to Ps 1,206.8 billion for 4Q18 versus 4Q17 and 24.1% during the quarter. The yearly increase mainly reflects the impact of the Corficolombiana’s 4G concessions as well as a better performance from our operations in hotels and solid results from our energy business.
The 24.1% increase during the quarter was mainly attributable to the beginning of the construction of Covioriente (one of our 4G concessions) in November 2018.
| 15 | |
3.3 Net trading income
| Net trading income | 4Q17 | 3Q18 | 4Q18 | | |||||
| 4Q18 vs. 3Q18 | 4Q18 vs. 4Q17 | ||||||||
| Trading investment income | 105.1 | 44.5 | 33.5 | -24.7% | -68.1% | ||||
| Net income (loss) on financial derivatives | 6.9 | 24.9 | 235.8 | N.A. | N.A. | ||||
| Other trading income on derivatives | 66.8 | 40.0 | 49.6 | 23.9% | -25.7% | ||||
| Net trading income | 178.8 | 109.5 | 318.9 | 191.3% | 78.3% | ||||
Net trading income for Grupo Aval should be analyzed in conjunction with the foreign exchange gains (losses).
3.4 Other income
Total other income for 4Q18 totaled Ps 500.8 billion increasing by 67.9% versus 4Q17 and 68.3% versus 3Q18. The yearly and quarterly increases were mainly driven by income from a PP&E structure optimizations in Banco de Bogotá and Banco Popular.
4. Other expenses
Total other expenses for 4Q18 totaled Ps 2,693.6 billion increasing by 10.3% versus 4Q17 and 20.4% versus 3Q18. Our efficiency ratio measured as operating expenses before depreciation and amortization to total income, was 41.8% in 4Q18, 39.1% in 3Q18, 46.3% in 4Q17. The ratio of annualized operating expenses before depreciation and amortization as a percentage of average total assets was 3.8% in 4Q18, 3.5% in 3Q18 and 3.6% in 4Q17.
In Colombia, our efficiency ratio measured as operating expenses before depreciation and amortization to total income, was 38.0% in 4Q18, 34.8% in 3Q18, and 44.2% in 4Q17. The ratio of annualized operating expenses before depreciation and amortization as a percentage of average total assets was 3.3% in 4Q18, 3.1% in 3Q18 and 3.3% in 4Q17.
In Central America, our efficiency ratio measured as operating expenses before depreciation and amortization to total income, was 50.0% in 4Q18, 49.3% in 3Q18 and 50.5% in 4Q17. The ratio of annualized operating expenses before depreciation and amortization as a percentage of average total assets was 4.8% in 4Q18, 4.4% in 3Q18 and 4.4% in 4Q17.
For full year, our efficiency ratio measured as operating expenses to total income was 43.1% for FY18 and 46.5% FY17. The ratio of operating expenses as a percentage of average total assets was 3.5% for FY18 and FY17.
| 16 | |
5. Non-controlling Interest
Non-controlling interest in Grupo Aval reflects: (i) the minority stakes that third party shareholders hold in each of its direct consolidated subsidiaries (Banco de Bogotá, Banco de Occidente, Banco Popular, Banco AV Villas and Corficolombiana), and (ii) the minority stakes that third party shareholders hold in the consolidated subsidiaries at the bank level (mainly Porvenir). For 4Q18, non-controlling interest in the income statement was Ps 790.1 billion, showing a 195.0% increase versus 4Q17 and a 17.8% increase versus 3Q18. The ratio of non-controlling interest to income before non-controlling interest was 48.2% in 4Q18, 46.1% in 3Q18 and 36.5% in 4Q17.
The increase in non-controlling interest is mainly driven by (i) higher net income from Corficolombiana and Banco de Bogotá and (ii) by the dilution resulting from Corficolombiana’s capitalization process in August 2018.
| 17 | |
Information related to Grupo Aval’s consolidated financial statements by geography
| Grupo Aval Acciones y Valores S.A. - Colombian Operation | ||||||||||
| Financial Statements Under Full IFRS | ||||||||||
| Information in Ps. Billions | ||||||||||
| 4Q17 | 3Q18 | 4Q18 |  | |||||||
| 4Q18 vs. 3Q18 | 4Q18 vs. 4Q17 | |||||||||
| Gross loans and receivables | 112,748.2 | 114,618.1 | 116,436.8 | 1.6% | 3.3% | |||||
| Total assets | 166,381.0 | 171,956.3 | 181,171.8 | 5.4% | 8.9% | |||||
| Customer deposits | 110,486.8 | 107,969.4 | 113,702.5 | 5.3% | 2.9% | |||||
| Total liabilities | 151,862.0 | 155,595.7 | 164,425.6 | 5.7% | 8.3% | |||||
| Net income for the period | 428.1 | 1,163.2 | 1,316.6 | 13.2% | N.A. | |||||
| Net income attributable to the owners of the parent company | 256.1 | 583.4 | 627.9 | 7.6% | 145.2% | |||||
| YTD 2017 | YTD 2018 | | ||||||||
| 2018 vs. 2017 | ||||||||||
| Net income for the period | 2,080.9 | 4,004.8 | 92.5% | |||||||
| A | Net income attributable to the owners of the parent company | 1,219.1 | 2,101.9 | 72.4% | ||||||
| Leasing Bogotá Panamá S.A.(1) | ||||||||||
| Financial Statements Under IFRS | ||||||||||
| Information in Ps. Billions | ||||||||||
| 4Q17 | 3Q18 | 4Q18 |  | |||||||
| 4Q18 vs. 3Q18 | 4Q18 vs. 4Q17 | |||||||||
| Gross loans and receivables | 46,345.5 | 47,198.6 | 52,809.8 | 11.9% | 13.9% | |||||
| Total assets | 70,157.6 | 69,530.7 | 78,503.4 | 12.9% | 11.9% | |||||
| Customer deposits | 44,398.4 | 45,219.1 | 50,656.9 | 12.0% | 14.1% | |||||
| Total liabilities | 58,805.3 | 57,985.0 | 65,695.2 | 13.3% | 11.7% | |||||
| Net income for the period | 306.5 | 289.9 | 324.2 | 11.8% | 5.8% | |||||
| Net income attributable to the owners of the parent company | 210.6 | 199.3 | 222.8 | 11.8% | 5.8% | |||||
| YTD 2017 | YTD 2018 | | ||||||||
| 2018 vs. 2017 | ||||||||||
| Net income for the period | 1,081.6 | 1,179.7 | 9.1% | |||||||
| B | Net income attributable to the owners of the parent company | 743.3 | 810.8 | 9.1% | ||||||
| A+B | Net income attributable to the owners of the parent company | 1,962.4 | 2,912.7 | 48.4% | ||||||
(1) Leasing Bogotá Panamá is the holding company that consolidates our Central American operations.
| 18 | |
Information related to Grupo Aval Acciones y Valores S.A. (Holding Company) and Grupo Aval Limited
The holding company recorded a total gross indebtedness of Ps 1,654.0 billion (Ps 544.7 billion of bank debt and Ps 1,109.3 billion of bonds denominated in Colombian pesos) as of December 31, 2018. It also guarantees irrevocably and unconditionally Grupo Aval Limited’s (144A / Reg S) 2022 (USD 1.0 billion) bonds under its respective indentures. As of December 31, 2018 the total amount outstanding (including interests payable) of such bonds was USD 1.0 billion, or Ps 3,290.1 billion when translated into pesos.
The debt at Grupo Aval Limited is serviced with interest income on loans to subsidiaries and cash & cash equivalents. Grupo Aval Limited has not required, to this date, cash from Grupo Aval Acciones y Valores S.A. to fulfill its obligations. The main sources of cash to pay the debt and debt service at Grupo Aval Acciones y Valores S.A. have been the dividend income from its subsidiaries and the returns on its cash & cash equivalents.
When combined, Grupo Aval Acciones y Valores S.A. and Grupo Aval Ltd. had Ps 2,142.0 billion of total liquid assets, a total gross indebtedness of Ps 4,924.0 billion and a net indebtedness (including callable senior loans to subsidiaries) of Ps 2,782.0 billion as of December 31, 2018. In addition to liquid assets, Grupo Aval Ltd. has Ps 790.2 billion in other loans to subsidiaries.
| Total liquid assets as of December 31, 2018 | |
| Cash and cash equivalents | 956.0 |
| Fixed income investments | 131.3 |
| Callable Senior loans to subsidiaries | 1,054.7 |
| Total liquid assets | 2,142.0 |

As of December 31, 2018 our combined double leverage (calculated as investments in subsidiaries at book value, subordinated loans to subsidiaries and goodwill as a percentage of shareholders' equity) was 1.15x. Finally, we present an evolution of our key ratios on a combined basis:
| Debt service coverage and leverage ratios | 4Q17 | 3Q18 | 4Q18 | | |||||
| 4Q18 vs. 3Q18 | 4Q18 vs. 4Q17 | ||||||||
| Double leverage (1) | 1.16x | 1.15x | 1.15x | 0.00 | -0.01 | ||||
| Net debt / Core earnings (2)(3) | 2.7x | 2.9x | 2.7x | -0.2 | 0.0 | ||||
| Net debt / Cash dividends (2)(3) | 3.6x | 3.5x | 3.6x | 0.1 | 0.0 | ||||
| Core Earnings / Interest Expense (2) | 5.5x | 5.1x | 5.3x | 0.2 | -0.3 | ||||
(1) Double leverage is calculated as investments in subsidiaries at book value (excluding revaluations), subordinated loans to subsidiaries and goodwill as a percentage of shareholders' equity; (2) Core earnings are defined as annualized recurring cash flow from dividends, investments and net operating income; (3) Net debt is calculated as total gross debt minus cash and cash equivalents and fixed income investments
| 19 | |
ABOUT GRUPO AVAL
Grupo Aval is Colombia’s largest banking group, and through our BAC Credomatic operations it is also the largest and the most profitable banking group in Central America. Grupo Aval currently operates through four commercial banks in Colombia (Banco de Bogotá, Banco de Occidente, Banco Popular and Banco AV Villas). It manages pension and severance funds through the largest pension and severance fund manager in Colombia (Porvenir) and owns the largest merchant bank in Colombia (Corficolombiana), each of which Aval controls and consolidates into its results.
Investor Relations Contacts
Tatiana Uribe Benninghoff
Vice President of Financial Planning and Investor Relations
Tel: +571 241 9700 x23422
E-mail:turibe@grupoaval.com
Alejo Sánchez García
Financial Planning and Investor Relations Manager
Tel: +571 241 9700 x23422
E-mail:asanchez@grupoaval.com
Nicolas Noreña Trujillo
Financial Planning and Investor Relations Junior Manager
Tel: +571 241 9700 x23422
E-mail:nnorena@grupoaval.com
Analysts:
Ana María Ardila Delgadillo
Juan David Gonzalez Aguilera
Karen Lorena Tabares Amado
| 20 | |
| Grupo Aval Acciones y Valores S.A. | |||||||||
| Consolidated Financial Statements Under IFRS | |||||||||
| Financial Statements Under IFRS | |||||||||
| Information in Ps. Billions | |||||||||
| Consolidated Statement of Financial Position | 4Q17 | 3Q18 | 4Q18 | | |||||
| 4Q18 vs. 3Q18 | 4Q18 vs. 4Q17 | ||||||||
| Cash and cash equivalents | 22,336.8 | 24,396.8 | 28,401.3 | 16.4% | 27.1% | ||||
| Investment and trading assets | |||||||||
| Debt securities | 2,650.5 | 2,467.3 | 3,763.0 | 52.5% | 42.0% | ||||
| Equity securities | 2,149.2 | 2,318.2 | 2,672.6 | 15.3% | 24.4% | ||||
| Derivative assets | 328.4 | 605.6 | 768.7 | 26.9% | 134.1% | ||||
| Trading assets | 5,128.1 | 5,391.2 | 7,204.3 | 33.6% | 40.5% | ||||
| Investments in debt securities at FVTPL (non compliant with SPPI test)(1) | - | - | 31.3 | N.A | N.A | ||||
| Investments in securities at FVOCI(2) | 18,614.2 | 21,083.2 | 20,052.2 | -4.9% | 7.7% | ||||
| Investments in debt securities at amortized cost | 2,899.0 | 2,999.4 | 2,972.6 | -0.9% | 2.5% | ||||
| Loss impairment | (0.0) | (0.1) | (25.9) | N.A. | N.A. | ||||
| Investment securities | 21,513.2 | 24,082.5 | 23,030.2 | -4.4% | 7.1% | ||||
| Hedging derivatives assest | 55.3 | 85.6 | 30.1 | -64.8% | -45.5% | ||||
| Loans and receivables | |||||||||
| Commercial loans and leases | 99,428.9 | 95,608.7 | 102,409.0 | 7.1% | 3.0% | ||||
| Commercial loans and leases | 92,149.8 | 91,648.3 | 94,773.8 | 3.4% | 2.8% | ||||
| Interbank & overnight funds | 7,279.0 | 3,960.3 | 7,635.2 | 92.8% | 4.9% | ||||
| Consumer loans and leases | 50,382.9 | 52,504.9 | 55,455.1 | 5.6% | 10.1% | ||||
| Mortgages and housing leases | 16,151.3 | 17,244.0 | 18,592.1 | 7.8% | 15.1% | ||||
| Microcredit loans and leases | 409.7 | 419.5 | 425.7 | 1.5% | 3.9% | ||||
| Total loans and leases operations and receivables portfolio | 166,372.8 | 165,777.0 | 176,881.8 | 6.7% | 6.3% | ||||
| Allowance for impairment of loans and receivables | (5,618.5) | (7,511.9) | (8,196.2) | 9.1% | 45.9% | ||||
| Total loans and receivables, net | 160,754.3 | 158,265.1 | 168,685.7 | 6.6% | 4.9% | ||||
| Other accounts receivable, net | 6,521.9 | 7,644.7 | 9,300.6 | 21.7% | 42.6% | ||||
| Non-current assets held for sale | 101.4 | 102.3 | 186.7 | 82.6% | 84.2% | ||||
| Investments in associates and joint ventures | 1,043.0 | 1,048.5 | 982.7 | -6.3% | -5.8% | ||||
| Own-use property, plant and equipment and equipment given in operating lease, net | 5,800.0 | 5,573.0 | 5,663.7 | 1.6% | -2.3% | ||||
| Investment properties | 787.9 | 812.9 | 840.5 | 3.4% | 6.7% | ||||
| Biological assets | 66.1 | 79.3 | 84.2 | 6.2% | 27.3% | ||||
| Tangible assets | 6,654.0 | 6,465.3 | 6,588.5 | 1.9% | -1.0% | ||||
| Goodwill | 6,901.1 | 6,882.5 | 7,318.6 | 6.3% | 6.1% | ||||
| Concession arrangement rights | 3,114.2 | 4,981.0 | 5,514.5 | 10.7% | 77.1% | ||||
| Other intangible assets | 848.7 | 974.8 | 1,033.9 | 6.1% | 21.8% | ||||
| Intangible assets | 10,863.9 | 12,838.3 | 13,867.0 | 8.0% | 27.6% | ||||
| Current | 907.5 | 518.7 | 593.8 | 14.5% | -34.6% | ||||
| Deferred | 139.4 | 198.6 | 341.3 | 71.9% | 144.8% | ||||
| Income tax assets | 1,046.9 | 717.3 | 935.2 | 30.4% | -10.7% | ||||
| Other assets | 519.8 | 449.4 | 462.9 | 3.0% | -10.9% | ||||
| Total assets | 236,538.5 | 241,487.0 | 259,675.2 | 7.5% | 9.8% | ||||
| Trading liabilities | 298.7 | 488.9 | 811.3 | 65.9% | 171.6% | ||||
| Hedging derivatives liabilities | 13.5 | 63.6 | 195.5 | N.A. | N.A. | ||||
| Customer deposits | 154,885.2 | 153,188.5 | 164,359.5 | 7.3% | 6.1% | ||||
| Checking accounts | 36,017.6 | 33,401.4 | 39,702.9 | 18.9% | 10.2% | ||||
| Time deposits | 62,616.2 | 66,265.0 | 66,853.0 | 0.9% | 6.8% | ||||
| Savings deposits | 55,778.7 | 52,925.2 | 57,221.4 | 8.1% | 2.6% | ||||
| Other deposits | 472.8 | 596.9 | 582.1 | -2.5% | 23.1% | ||||
| Financial obligations | 45,276.0 | 48,332.5 | 51,212.0 | 6.0% | 13.1% | ||||
| Interbank borrowings and overnight funds | 4,970.4 | 8,669.9 | 6,814.1 | -21.4% | 37.1% | ||||
| Borrowings from banks and others | 18,205.3 | 17,094.3 | 20,610.8 | 20.6% | 13.2% | ||||
| Bonds issued | 19,102.2 | 19,128.2 | 20,140.3 | 5.3% | 5.4% | ||||
| Borrowings from development entities | 2,998.1 | 3,440.2 | 3,646.8 | 6.0% | 21.6% | ||||
| Total financial liabilities at amortized cost | 200,161.3 | 201,521.0 | 215,571.4 | 7.0% | 7.7% | ||||
| Legal related | 165.4 | 171.5 | 125.9 | -26.6% | -23.8% | ||||
| Other provisions | 527.3 | 582.6 | 569.4 | -2.3% | 8.0% | ||||
| Provisions | 692.6 | 754.1 | 695.3 | -7.8% | 0.4% | ||||
| Current | 330.8 | 311.8 | 413.5 | 32.6% | 25.0% | ||||
| Deferred | 1,696.8 | 2,245.1 | �� 2,160.9 | -3.7% | 27.4% | ||||
| Income tax liabilities | 2,027.7 | 2,556.8 | 2,574.4 | 0.7% | 27.0% | ||||
| Employee benefits | 1,238.2 | 1,326.0 | 1,264.9 | -4.6% | 2.2% | ||||
| Other liabilities | 6,235.5 | 6,870.2 | 9,008.0 | 31.1% | 44.5% | ||||
| Total liabilities | 210,667.3 | 213,580.8 | 230,120.8 | 7.7% | 9.2% | ||||
| Controlling interest | 16,287.0 | 16,895.2 | 17,789.7 | 5.3% | 9.2% | ||||
| Non-controlling interests | 9,584.2 | 11,011.0 | 11,764.6 | 6.8% | 22.7% | ||||
| Total equity | 25,871.2 | 27,906.2 | 29,554.3 | 5.9% | 14.2% | ||||
| Total liabilities and equity | 236,538.5 | 241,487.0 | 259,675.2 | 7.5% | 9.8% | ||||
(1) After the adoption of IFRS 9, certain investment securities were designated as at fair value through profit and loss (FVTPL) because the contractual cash flows of these securities are not SPPI on the principal outstanding. The reclassified assets include certain asset-backed securities whose exposure to credit risk is higher than the exposure to credit risk of the underlying pool of financial assets. Includes commissions on banking services, office network services, credit and debit card fees, fees on drafts, checks and checkbooks and other fees
(2) FVOCI: Fair value through other comprehensive income.
| 21 | |
| Consolidated Statement of income | YTD 2017 | YTD 2018 | | 4Q17 | 3Q18 | 4Q18 | | ||||||||
| 2018 vs. 2017 | 4Q18 vs. 3Q18 | 4Q18 vs. 4Q17 | |||||||||||||
| Interest income | |||||||||||||||
| Loan portfolio | 17,900.0 | 17,390.6 | -2.8% | 4,439.5 | 4,352.2 | 4,441.3 | 2.0% | 0.0% | |||||||
| Interests on investments in debt securities | 841.9 | 966.0 | 14.7% | 183.3 | 247.1 | 250.3 | 1.3% | 36.6% | |||||||
| Total interest income | 18,741.8 | 18,356.6 | -2.1% | 4,622.8 | 4,599.3 | 4,691.6 | 2.0% | 1.5% | |||||||
| Interest expense | |||||||||||||||
| Checking accounts | 309.3 | 350.2 | 13.2% | 72.8 | 81.2 | 96.7 | 19.1% | 32.9% | |||||||
| Time deposits | 3,560.5 | 3,296.5 | -7.4% | 824.4 | 823.8 | 842.0 | 2.2% | 2.1% | |||||||
| Savings deposits | 1,979.0 | 1,497.0 | -24.4% | 449.6 | 368.0 | 361.7 | -1.7% | -19.6% | |||||||
| Total interest expenses on deposits | 5,848.8 | 5,143.7 | -12.1% | 1,346.8 | 1,273.1 | 1,300.4 | 2.1% | -3.4% | |||||||
| Interbank borrowings and overnight funds | 287.4 | 266.1 | -7.4% | 68.9 | 56.2 | 88.8 | 58.1% | 28.9% | |||||||
| Borrowings from banks and others | 770.0 | 769.2 | -0.1% | 218.9 | 193.8 | 214.2 | 10.6% | -2.1% | |||||||
| Bonds issued | 1,162.2 | 1,162.7 | 0.0% | 288.7 | 289.2 | 294.9 | 2.0% | 2.2% | |||||||
| Borrowings from development entities | 159.3 | 143.2 | -10.1% | 37.7 | 35.1 | 36.3 | 3.6% | -3.7% | |||||||
| Total interest expenses on financial obligations | 2,378.9 | 2,341.1 | -1.6% | 614.2 | 574.2 | 634.2 | 10.5% | 3.3% | |||||||
| Total interest expense | 8,227.7 | 7,484.8 | -9.0% | 1,961.0 | 1,847.3 | 1,934.7 | 4.7% | -1.3% | |||||||
| Net interest income | 10,514.1 | 10,871.8 | 3.4% | 2,661.8 | 2,752.0 | 2,757.0 | 0.2% | 3.6% | |||||||
| Impairment loss (recoveries) on financial assets | |||||||||||||||
| Loans and other accounts receivable | 4,119.3 | 4,150.0 | 0.7% | 1,125.9 | 1,013.9 | 1,359.7 | 34.1% | 20.8% | |||||||
| Other financial assets | 0.1 | (32.5) | N.A | - | 3.9 | 22.3 | N.A. | N.A | |||||||
| Recovery of charged-off financial assets | (264.6) | (320.1) | 21.0% | (78.2) | (83.4) | (81.7) | -2.0% | 4.4% | |||||||
| Impairment loss on financial assets | 3,854.9 | 3,797.3 | -1.5% | 1,047.7 | 934.4 | 1,300.4 | 39.2% | 24.1% | |||||||
| Net interest income, after impairment loss | 6,659.2 | 7,074.4 | 6.2% | 1,614.1 | 1,817.6 | 1,456.6 | -19.9% | -9.8% | |||||||
| Income from commissions and fees | |||||||||||||||
| Banking fees(1) | 3,793.7 | 3,996.5 | 5.3% | 955.8 | 975.8 | 1,082.4 | 10.9% | 13.3% | |||||||
| Trust activities | 311.8 | 312.9 | 0.3% | 83.9 | 77.3 | 81.4 | 5.4% | -3.0% | |||||||
| Pension and severance fund management | 926.8 | 987.3 | 6.5% | 231.5 | 244.1 | 254.5 | 4.2% | 9.9% | |||||||
| Bonded warehouse services | 169.8 | 156.6 | -7.8% | 41.3 | 38.9 | 41.4 | 6.4% | 0.3% | |||||||
| Total income from commissions and fees | 5,202.1 | 5,453.4 | 4.8% | 1,312.5 | 1,336.1 | 1,459.7 | 9.3% | 11.2% | |||||||
| Expenses from commissions and fees | 623.1 | 613.8 | -1.5% | 146.7 | 142.3 | 163.1 | 14.6% | 11.1% | |||||||
| Net income from commissions and fees | 4,579.0 | 4,839.6 | 5.7% | 1,165.8 | 1,193.8 | 1,296.6 | 8.6% | 11.2% | |||||||
| Income from sales of goods and services | 5,792.9 | 8,126.0 | 40.3% | 1,529.8 | 2,465.2 | 2,829.0 | 14.8% | 84.9% | |||||||
| Costs and expenses from sales of goods and services | 5,035.8 | 5,482.1 | 8.9% | 1,232.2 | 1,492.9 | 1,622.3 | 8.7% | 31.7% | |||||||
| Net income from sales of goods and services | 757.0 | 2,643.9 | N.A. | 297.6 | 972.3 | 1,206.8 | 24.1% | N.A. | |||||||
| Net trading income | 561.4 | 582.7 | 3.8% | 178.8 | 109.5 | 318.9 | 191.3% | 78.3% | |||||||
| Net income from other financial instruments designated at FVTPL(2) | 209.9 | 205.8 | -2.0% | 62.4 | 50.2 | 28.6 | -43.0% | -54.2% | |||||||
| Other income | |||||||||||||||
| Foreign exchange gains (losses), net | 424.5 | 283.4 | -33.2% | 78.2 | 106.0 | (87.9) | -182.9% | N.A | |||||||
| Net gain on sale of investments | 51.7 | 1.1 | -97.9% | 23.4 | 5.9 | 15.1 | 153.8% | -35.5% | |||||||
| Gain on the sale of non-current assets held for sale | 13.6 | 20.1 | 47.9% | 2.3 | 8.3 | 5.6 | -32.5% | 146.2% | |||||||
| Income from non-consolidated investments(3) | 222.4 | 269.2 | 21.0% | 37.5 | 58.9 | 65.6 | 11.3% | 74.8% | |||||||
| Net gains on asset valuations | 39.0 | 37.3 | -4.4% | 20.9 | 2.2 | 27.3 | N.A. | 30.3% | |||||||
| Other operating income | 400.6 | 747.6 | 86.6% | 136.1 | 116.2 | 475.1 | N.A. | N.A. | |||||||
| Total other income | 1,151.7 | 1,358.7 | 18.0% | 298.4 | 297.6 | 500.8 | 68.3% | 67.9% | |||||||
| Other expenses | |||||||||||||||
| Loss on the sale of non-current assets held for sale | 7.0 | 5.2 | -25.3% | 1.4 | 0.8 | 2.4 | N.A. | 68.7% | |||||||
| Personnel expenses | 3,671.1 | 3,877.6 | 5.6% | 929.5 | 946.8 | 1,046.2 | 10.5% | 12.5% | |||||||
| General and administrative expenses | 4,507.9 | 4,640.5 | 2.9% | 1,165.1 | 1,109.8 | 1,306.6 | 17.7% | 12.1% | |||||||
| Depreciation and amortization | 521.4 | 539.8 | 3.5% | 135.7 | 137.8 | 141.6 | 2.8% | 4.4% | |||||||
| Impairment loss on other assets | 174.3 | 166.3 | -4.6% | 156.0 | 5.5 | 148.6 | N.A. | -4.8% | |||||||
| Other operating expenses | 121.4 | 141.7 | 16.8% | 54.7 | 36.2 | 48.2 | 33.0% | -12.0% | |||||||
| Total other expenses | 9,003.1 | 9,371.0 | 4.1% | 2,442.4 | 2,236.8 | 2,693.6 | 20.4% | 10.3% | |||||||
| Net income before tax expense | 4,915.2 | 7,334.1 | 49.2% | 1,174.7 | 2,204.0 | 2,114.7 | -4.0% | 80.0% | |||||||
| Income tax expense | 1,752.8 | 2,149.6 | 22.6% | 440.2 | 750.8 | 473.9 | -36.9% | 7.7% | |||||||
| Net income for the period | 3,162.4 | 5,184.6 | 63.9% | 734.6 | 1,453.2 | 1,640.8 | 12.9% | 123.4% | |||||||
| Net income for the year attibutable to: | |||||||||||||||
| Non-controlling interest | 1,200.0 | 2,271.9 | 89.3% | 267.9 | 670.4 | 790.1 | 17.8% | 195.0% | |||||||
| Net income attributable to the owners of the parent company | 1,962.4 | 2,912.7 | 48.4% | 466.7 | 782.7 | 850.7 | 8.7% | 82.3% | |||||||
(1) Includes commissions on banking services, office network services, credit and debit card fees, fees on drafts, checks and checkbooks and other fees
(2) FVTPL: Fair value through profit and loss
(3) Includes equity method and dividends
| 22 | |
Item 2
1 IFRS 4Q18 and FY 2018 Consolidated Earnings Results
2 Disclaimer Grupo Aval Acciones y Valores S . A . (“Grupo Aval”) is an issuer of securities in Colombia and in the United States, registered with Colombia’s National Registry of Shares and Issuers ( Registro Nacional de Valores y Emisores ) and the United States Securities and Exchange Commission (“SEC”) . As such, it is subject to compliance with securities regulation in Colombia and applicable U . S . securities regulation . All of our banking subsidiaries (Banco de Bogotá, Banco de Occidente , Banco Popular and Banco AV Villas), Porvenir and Corficolombiana , are subject to inspection and supervision as financial institutions by the Superintendency of Finance . Grupo Aval is now also subject to the inspection and supervision of the Superintendency of Finance as a result of Law 1870 of 2017 , also known as Law of Financial Conglomerates, which came in effect on February 6 , 2019 . Grupo Aval, as the holding company of its financial conglomerate is responsible for the compliance with capital adequacy requirements, corporate governance standards, risk management and internal control and criteria for identifying, managing and revealing conflicts of interest, applicable to its financial conglomerate . The consolidated financial information included in this document is presented in accordance with IFRS as currently issued by the IASB . Details of the calculations of non - GAAP measures such as ROAA and ROAE, among others, are explained when required in this report . Full year and quarterly results for 2018 are not comparable to previous periods due to the prospective adoption in Colombia of IFRS 9 and IFRS 15 starting in January 1 , 2018 . This report includes forward - looking statements . In some cases, you can identify these forward - looking statements by words such as “may,” “will,” “should,” “expects,” “plans,” “anticipates,” “believes,” “estimates,” “predicts,” “potential,” or “continue,” or the negative of these and other comparable words . Actual results and events may differ materially from those anticipated herein as a consequence of changes in general, economic and business conditions, changes in interest and currency rates and other risk described from time to time in our filings with the Registro Nacional de Valores y Emisores and the SEC . Recipients of this document are responsible for the assessment and use of the information provided herein . Matters described in this presentation and our knowledge of them may change extensively and materially over time but we expressly disclaim any obligation to review, update or correct the information provided in this report, including any forward looking statements, and do not intend to provide any update for such material developments prior to our next earnings report . The content of this document and the figures included herein are intended to provide a summary of the subjects discussed rather than a comprehensive description . When applicable, in this document we refer to billions as thousands of millions .
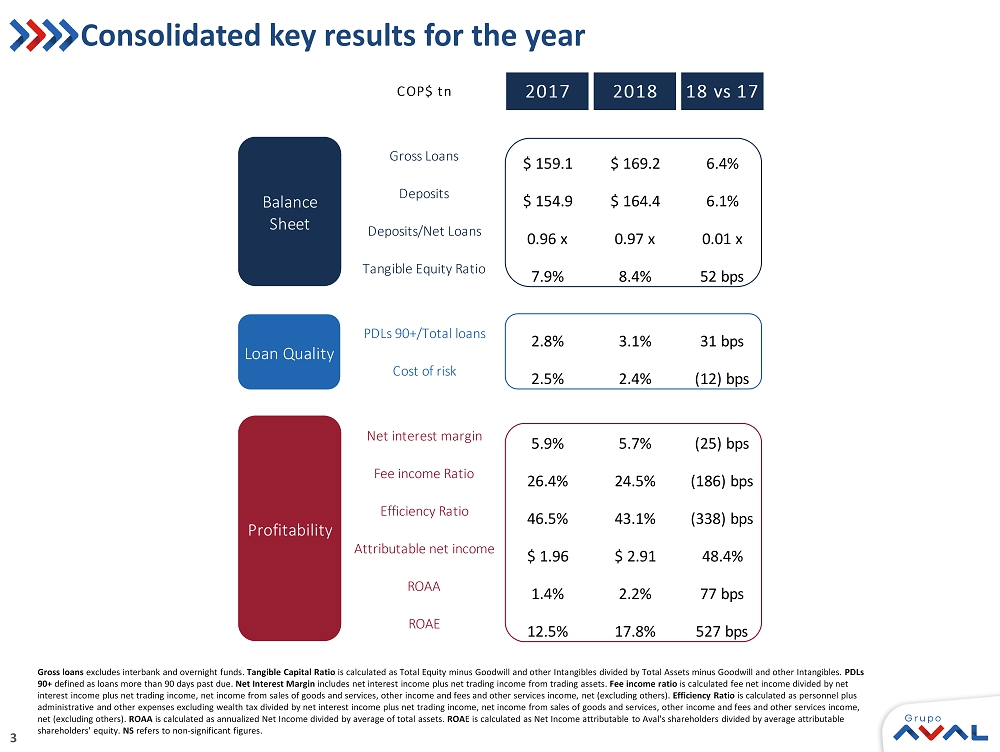
3 Consolidated key results for the year Gross loans e xcludes interbank and overnight funds. Tangible Capital Ratio is calculated as Total Equity minus Goodwill and other Intangibles divided by Total Assets minus Goodwill and other Intangibl es. PDLs 90+ defined as loans more than 90 days past due. Net Interest Margin includes net interest income plus net trading income from trading assets. Fee income ratio is calculated fee net income divided by net interest income plus net trading income, net income from sales of goods and services, other income and fees and other service s i ncome, net (excluding others). Efficiency Ratio is calculated as personnel plus administrative and other expenses excluding wealth tax divided by net interest income plus net trading income, net income fro m s ales of goods and services, other income and fees and other services income, net (excluding others). ROAA is calculated as annualized Net Income divided by average of total assets. ROA E is calculated as Net Income attributable to Aval's shareholders divided by average attributable shareholders' equity. NS refers to non - significant figures. COP$ tn 2017 2018 18 vs 17 Gross Loans $ 159.1 $ 169.2 6.4% Deposits $ 154.9 $ 164.4 6.1% Deposits/Net Loans 0.96 x 0.97 x 0.01 x Tangible Equity Ratio 7.9% 8.4% 52 bps PDLs 90+/Total loans 2.8% 3.1% 31 bps Cost of risk 2.5% 2.4% (12) bps Net interest margin 5.9% 5.7% (25) bps Fee income Ratio 26.4% 24.5% (186) bps Efficiency Ratio 46.5% 43.1% (338) bps Attributable net income $ 1.96 $ 2.91 48.4% ROAA 1.4% 2.2% 77 bps ROAE 12.5% 17.8% 527 bps Balance Sheet Loan Quality Profitability
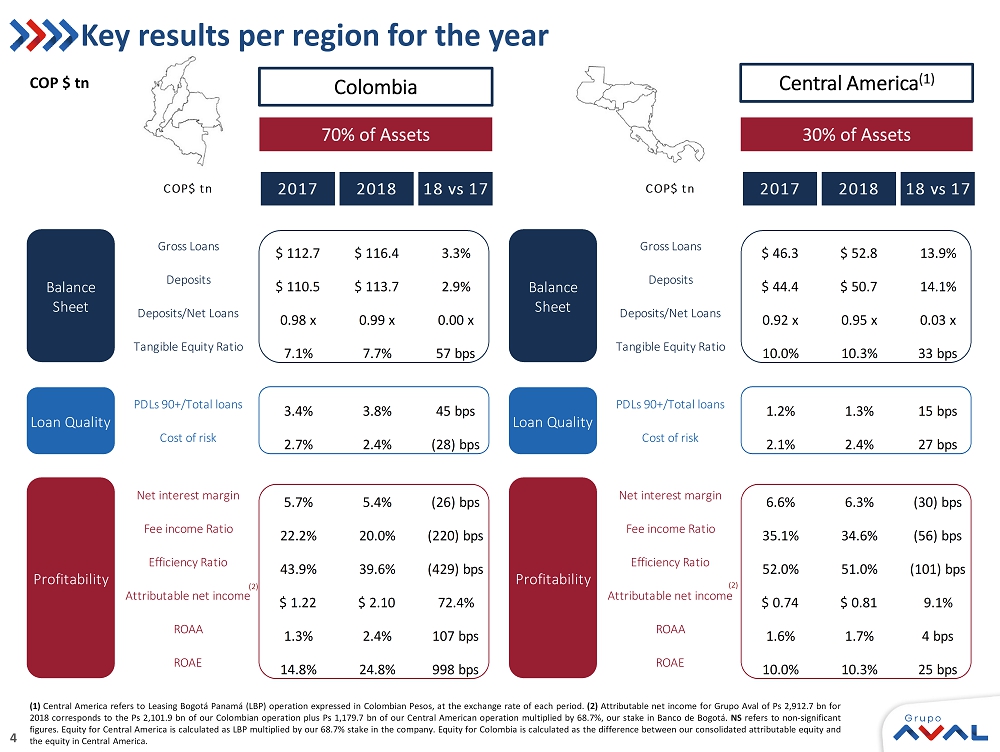
4 COP$ tn 2017 2018 18 vs 17 COP$ tn 2017 2018 18 vs 17 Gross Loans $ 112.7 $ 116.4 3.3% Gross Loans $ 46.3 $ 52.8 13.9% Deposits $ 110.5 $ 113.7 2.9% Deposits $ 44.4 $ 50.7 14.1% Deposits/Net Loans 0.98 x 0.99 x 0.00 x Deposits/Net Loans 0.92 x 0.95 x 0.03 x Tangible Equity Ratio 7.1% 7.7% 57 bps Tangible Equity Ratio 10.0% 10.3% 33 bps PDLs 90+/Total loans 3.4% 3.8% 45 bps PDLs 90+/Total loans 1.2% 1.3% 15 bps Cost of risk 2.7% 2.4% (28) bps Cost of risk 2.1% 2.4% 27 bps Net interest margin 5.7% 5.4% (26) bps Net interest margin 6.6% 6.3% (30) bps Fee income Ratio 22.2% 20.0% (220) bps Fee income Ratio 35.1% 34.6% (56) bps Efficiency Ratio 43.9% 39.6% (429) bps Efficiency Ratio 52.0% 51.0% (101) bps Attributable net income $ 1.22 $ 2.10 72.4% Attributable net income $ 0.74 $ 0.81 9.1% ROAA 1.3% 2.4% 107 bps ROAA 1.6% 1.7% 4 bps ROAE 14.8% 24.8% 998 bps ROAE 10.0% 10.3% 25 bps Balance Sheet Loan Quality Profitability Balance Sheet Loan Quality Profitability Key results per region for the year 70% of Assets COP $ tn ( 1 ) Central America refers to Leasing Bogotá Panamá (LBP) operation expressed in Colombian Pesos, at the exchange rate of each period . ( 2 ) Attributable net income for Grupo Aval of Ps 2 , 912 . 7 bn for 2018 corresponds to the Ps 2 , 101 . 9 bn of our Colombian operation plus Ps 1 , 179 . 7 bn of our Central American operation multiplied by 68 . 7 % , our stake in Banco de Bogotá . NS refers to non - significant figures . Equity for Central America is calculated as LBP multiplied by our 68 . 7 % stake in the company . Equity for Colombia is calculated as the difference between our consolidated attributable equity and the equity in Central America . Colombia (2) (2) 30% of Assets Central America (1)
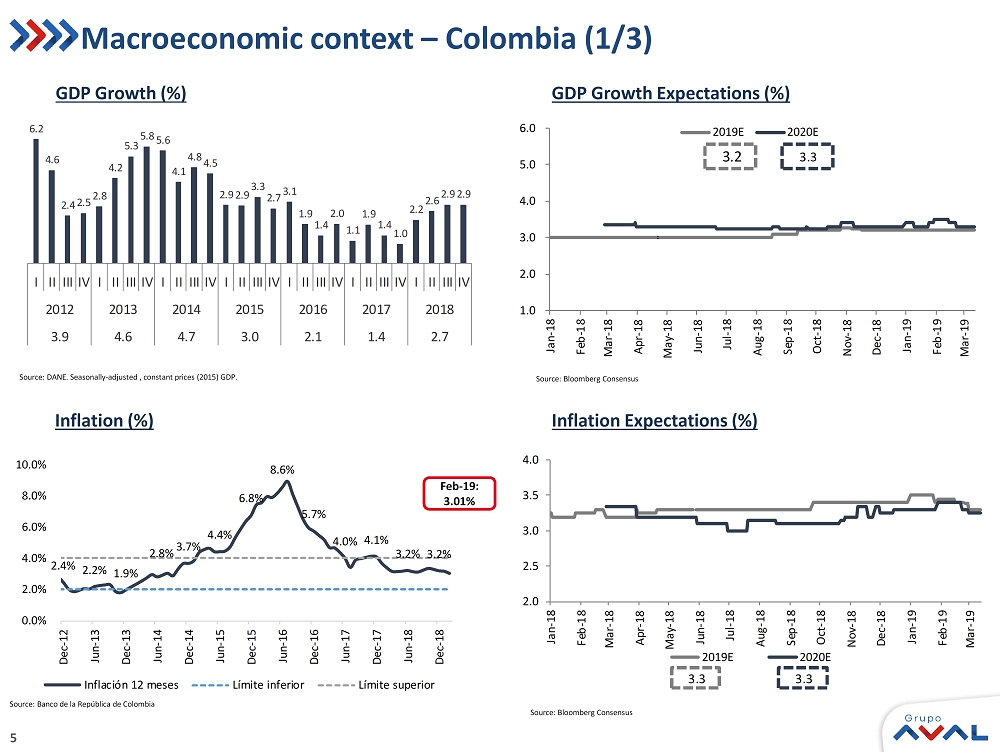
5 1.0 2.0 3.0 4.0 5.0 6.0 Jan-18 Feb-18 Mar-18 Apr-18 May-18 Jun-18 Jul-18 Aug-18 Sep-18 Oct-18 Nov-18 Dec-18 Jan-19 Feb-19 Mar-19 2019E 2020E 3.2 3.3 GDP Growth Expectations (%) Source: Bloomberg Consensus Inflation Expectations (%) Macroeconomic context – Colombia (1/3) Source: Bloomberg Consensus 2.0 2.5 3.0 3.5 4.0 Jan-18 Feb-18 Mar-18 Apr-18 May-18 Jun-18 Jul-18 Aug-18 Sep-18 Oct-18 Nov-18 Dec-18 Jan-19 Feb-19 Mar-19 2019E 2020E 3.3 3.3 Inflation (%) Source: Banco de la República de Colombia Feb - 19: 3.01% 2.4% 2.2% 1.9% 2.8% 3.7% 4.4% 6.8% 8.6% 5.7% 4.0% 4.1% 3.2% 3.2% 0.0% 2.0% 4.0% 6.0% 8.0% 10.0% Dec-12 Jun-13 Dec-13 Jun-14 Dec-14 Jun-15 Dec-15 Jun-16 Dec-16 Jun-17 Dec-17 Jun-18 Dec-18 Inflación 12 meses Límite inferior Límite superior 6.2 4.6 2.4 2.5 2.8 4.2 5.3 5.8 5.6 4.1 4.8 4.5 2.9 2.9 3.3 2.7 3.1 1.9 1.4 2.0 1.1 1.9 1.4 1.0 2.2 2.6 2.9 2.9 I II III IV I II III IV I II III IV I II III IV I II III IV I II III IV I II III IV 2012 2013 2014 2015 2016 2017 2018 3.9 4.6 4.7 3.0 2.1 1.4 2.7 GDP Growth (%) Source: DANE. Seasonally - adjusted , constant prices (2015) GDP.

6 0% 3% 5% 8% 10% 4Q12 2Q13 4Q13 2Q14 4Q14 2Q15 4Q15 2Q16 4Q16 2Q17 4Q17 2Q18 4Q18 Real GDP growth Inflation Colombian Central Bank's Interest rate 4.25% 3.01% 2.9% 2% 4% 6% 8% Dec-12 Jun-13 Dec-13 Jun-14 Dec-14 Jun-15 Dec-15 Jun-16 Dec-16 Jun-17 Dec-17 Jun-18 Dec-18 Colombian Central Bank's Interest rate (EoP) DTF(1) IBR(2) 4.64% 4.25% 4.14% Central Bank’s Monetary Policy Source: Banco de la República de Colombia. Urban unemployment defined as unemployment of 13 cities and their metropolitan areas *Last twelve month average from February 2018 to January 2019 Source : Banco de la República de Colombia. (1) End of period DTF rate (2) End of period 3 - month interbank (IBR) rate Source: Banco de la República de Colombia and DANE. GDP as of December 2018. GDP Seasonally - adjusted, constant prices (2015 basis) Macroeconomic context – Colombia (2/3) 2014: 4.7% 2015: 3.0% 2016: 2.1% 2013: 4.6% 2012: 3.9% FY GDP 2017: 1.4% Unemployment (%) 10.4% 9.6% 9.1% 8.9% 9.2% 9.4% 9.7% 9.8% 11.2% 10.6% 9.9% 9.8% 10.0% 10.6% 10.8% 10.8% 2012 2013 2014 2015 2016 2017 2018 Jan-19* Average national unemployment Average urban unemployment Mar - 19 Feb - 19 2018: 2.7%
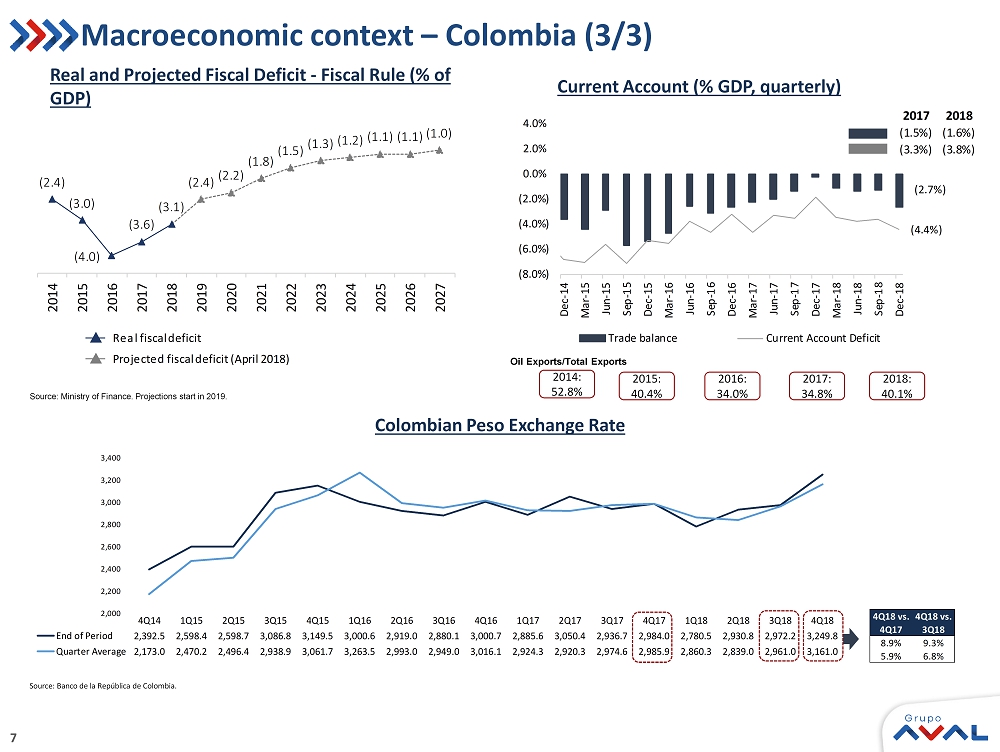
7 4Q14 1Q15 2Q15 3Q15 4Q15 1Q16 2Q16 3Q16 4Q16 1Q17 2Q17 3Q17 4Q17 1Q18 2Q18 3Q18 4Q18 End of Period 2,392.5 2,598.4 2,598.7 3,086.8 3,149.5 3,000.6 2,919.0 2,880.1 3,000.7 2,885.6 3,050.4 2,936.7 2,984.0 2,780.5 2,930.8 2,972.2 3,249.8 Quarter Average 2,173.0 2,470.2 2,496.4 2,938.9 3,061.7 3,263.5 2,993.0 2,949.0 3,016.1 2,924.3 2,920.3 2,974.6 2,985.9 2,860.3 2,839.0 2,961.0 3,161.0 2,000 2,200 2,400 2,600 2,800 3,000 3,200 3,400 4Q18 vs. 4Q17 4Q18 vs. 3Q18 8.9% 9.3% 5.9% 6.8% (2.7%) (4.4%) (8.0%) (6.0%) (4.0%) (2.0%) 0.0% 2.0% 4.0% Dec-14 Mar-15 Jun-15 Sep-15 Dec-15 Mar-16 Jun-16 Sep-16 Dec-16 Mar-17 Jun-17 Sep-17 Dec-17 Mar-18 Jun-18 Sep-18 Dec-18 Trade balance Current Account Deficit (2.4) (3.0) (4.0) (3.6) (3.1) (2.4) (2.2) (1.8) (1.5) (1.3) (1.2) (1.1) (1.1) (1.0) 2014 2015 2016 2017 2018 2019 2020 2021 2022 2023 2024 2025 2026 2027 Real fiscal deficit Projected fiscal deficit (April 2018) Source : Banco de la República de Colombia. Macroeconomic context – Colombia (3/3) Source: Ministry of Finance. Projections start in 2019. Current Account (% GDP, quarterly) Real and Projected Fiscal Deficit - Fiscal Rule (% of GDP) 2014: 52.8% 2015: 40.4% 2016: 34.0% 2017: 34.8% Oil Exports/Total Exports Colombian Peso Exchange Rate 2017 2018 (1.5%) (1.6%) (3.3%) (3.8%) 2018: 40.1%
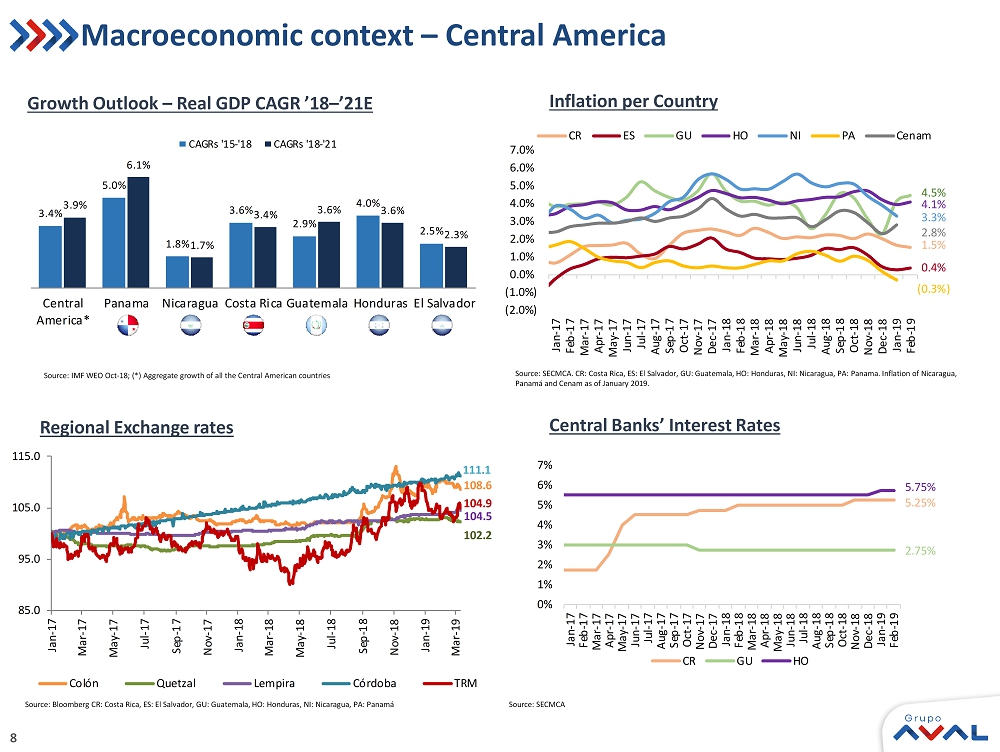
8 Macroeconomic context – Central America Growth Outlook – Real GDP CAGR ’18 – ’21E Inflation per Country Central Banks’ Interest Rates Source: Bloomberg CR : Costa Rica, ES: El Salvador, GU: Guatemala, HO: Honduras, NI: Nicaragua, PA: Panamá Source: IMF WEO Oct - 18; (*) Aggregate growth of all the Central American countries Source : SECMCA Source : SECMCA. CR : Costa Rica, ES: El Salvador, GU: Guatemala, HO: Honduras, NI: Nicaragua, PA: Panama . Inflation of Nicaragua, Panamá and Cenam as of January 2019. (2.0%) (1.0%) 0.0% 1.0% 2.0% 3.0% 4.0% 5.0% 6.0% 7.0% Jan-17 Feb-17 Mar-17 Apr-17 May-17 Jun-17 Jul-17 Aug-17 Sep-17 Oct-17 Nov-17 Dec-17 Jan-18 Feb-18 Mar-18 Apr-18 May-18 Jun-18 Jul-18 Aug-18 Sep-18 Oct-18 Nov-18 Dec-18 Jan-19 Feb-19 CR ES GU HO NI PA Cenam 3.3% 4.1% 4.5% 2.8% 1.5% 0.4% (0.3%) 0% 1% 2% 3% 4% 5% 6% 7% Jan-17 Feb-17 Mar-17 Apr-17 May-17 Jun-17 Jul-17 Aug-17 Sep-17 Oct-17 Nov-17 Dec-17 Jan-18 Feb-18 Mar-18 Apr-18 May-18 Jun-18 Jul-18 Aug-18 Sep-18 Oct-18 Nov-18 Dec-18 Jan-19 Feb-19 CR GU HO 5.75% 5.25% 2.75% 85.0 95.0 105.0 115.0 Jan-17 Mar-17 May-17 Jul-17 Sep-17 Nov-17 Jan-18 Mar-18 May-18 Jul-18 Sep-18 Nov-18 Jan-19 Mar-19 Colón Quetzal Lempira Córdoba TRM 104.9 104.5 111.1 102.2 108.6 Regional Exchange rates 3.4% 5.0% 1.8% 3.6% 2.9% 4.0% 2.5% 3.9% 6.1% 1.7% 3.4% 3.6% 3.6% 2.3% Central America* Panama Nicaragua Costa Rica Guatemala Honduras El Salvador CAGRs '15-'18 CAGRs '18-'21

9 68.0% 9.9% 1.7% Net loans and leases Fixed income investments Unconsolidated equity investments Other 68.0% 9.9% 1.7% 20.5% 4Q17 65.0% 9.9% 1.8% 23.3% 4Q18 Colombian operations , 70.3% Foreign (1) , 29.7% Colombian operations , 71.2% Foreign (1) , 28.8% Colombian operations , 69.8% Foreign (1) , 30.2% 65.5% 10.5% 1.9% 22.1% 3Q18 Assets Assets Breakdown Total Assets Figures in Ps. Trillions (1) Foreign operations reflect Central American operations. (2) Net loans and leases include interbank and overnight funds. 236.5 241.5 259.7 4Q17 3Q18 4Q18 4Q18 / 4Q17 = 9.8% 4Q18 / 3Q18 = 7.5% 4Q18 / 4Q17 = 7.0% 4Q18 / 3Q18 = 4.7% Growth excl. FX movement of Central American Operations (2)
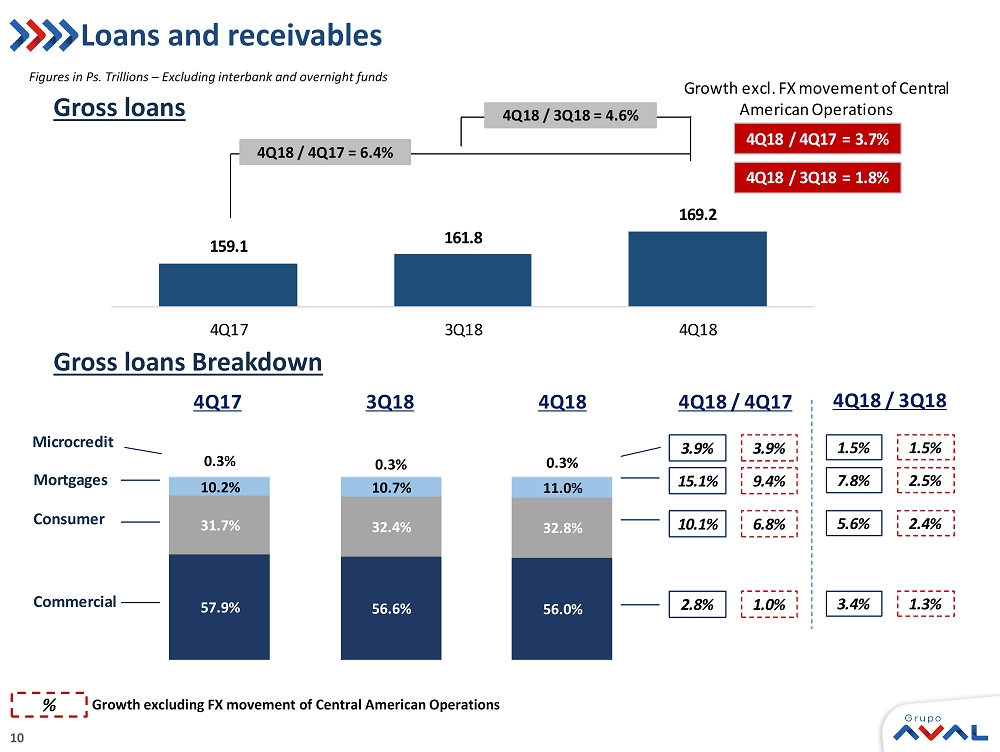
10 159.1 161.8 169.2 4Q17 3Q18 4Q18 4Q18 / 4Q17 = 6.4% 4Q18 / 3Q18 = 4.6% 4Q18 / 4Q17 = 3.7% 4Q18 / 3Q18 = 1.8% Growth excl. FX movement of Central American Operations 57.9% 56.6% 56.0% 31.7% 32.4% 32.8% 10.2% 10.7% 11.0% 0.3% 0.3% 0.3% Commercial Consumer Mortgages Microcredit 2.8% 10.1% 15.1% 3.9% 1.0% 6.8% 9.4% 3.9% 4Q18 / 4Q17 4Q17 3Q18 4Q18 4Q18 / 3Q18 3.4% 5.6% 7.8% 1.5% 1.3% 2.4% 2.5% 1.5% Loans and receivables Gross loans Gross loans Breakdown Figures in Ps. Trillions – Excluding interbank and overnight funds % Growth excluding FX movement of Central American Operations

11 2.86% 2.52% 3.29% 2.66% 2.31% 3.09% 4Q17 3Q18 4Q18 Impairment loss / Average loans Impairment loss (net of recoveries of charged-off assets) / Average loans Loan portfolio quality Charge offs / Average NPLs Impairment loss / Average loans Impairment loss , net / Average loans Cost of Risk 3.89% 4.47% 4.25% 2.75% 3.19% 3.07% 4Q17 3Q18 4Q18 30 days PDLs / Total loans 90 days PDLs / Total loans 0.67x 0.59x 0.70x 4Q17 3Q18 4Q18 3.53% 1.28x 1.45x 1.58x 0.91x 1.04x 1.14x 4Q17 3Q18 4Q18 Allowances / 90+ PDLs Allowance / 30+ PDLs 4.64% 4.84% Allowance / Gross loans FY17 FY18 2.7% 2.6% 2.5% 2.4% FY17 FY18 0.7x 0.7x

12 Loan portfolio quality 4Q17 3Q18 4Q18 4Q17 3Q18 4Q18 Commercial 3.21% 4.09% 3.88% 2.83% 3.52% 3.42% Consumer 5.09% 5.17% 4.83% 2.77% 2.89% 2.66% Mortgages 3.81% 4.08% 4.13% 2.07% 2.20% 2.25% Microcredit 15.09% 15.29% 16.52% 10.63% 11.32% 12.30% Total loans 3.89% 4.47% 4.25% 2.75% 3.19% 3.07% 30 days past due loans (1) 90 days past due loans (2) (1) Past Due Loans + 30 / Total Loans including interest accounts receivable (2) Past Due Loans + 90 / Total Loans including interest accounts receivable Figures in Ps. Billions 30 days past due formation 90 days past due formation 4Q17 1Q18 2Q18 3Q18 4Q18 Initial PDLs 6,182 6,195 6,675 6,975 7,229 New PDLs 735 1,205 1,067 1,005 872 Charge-offs (722) (726) (767) (751) (905) Final PDLs 6,195 6,675 6,975 7,229 7,195 4Q17 1Q18 2Q18 3Q18 4Q18 4,212 4,382 4,491 4,960 5,166 892 835 1,236 957 927 (722) (726) (767) (751) (905) 4,382 4,491 4,960 5,166 5,188
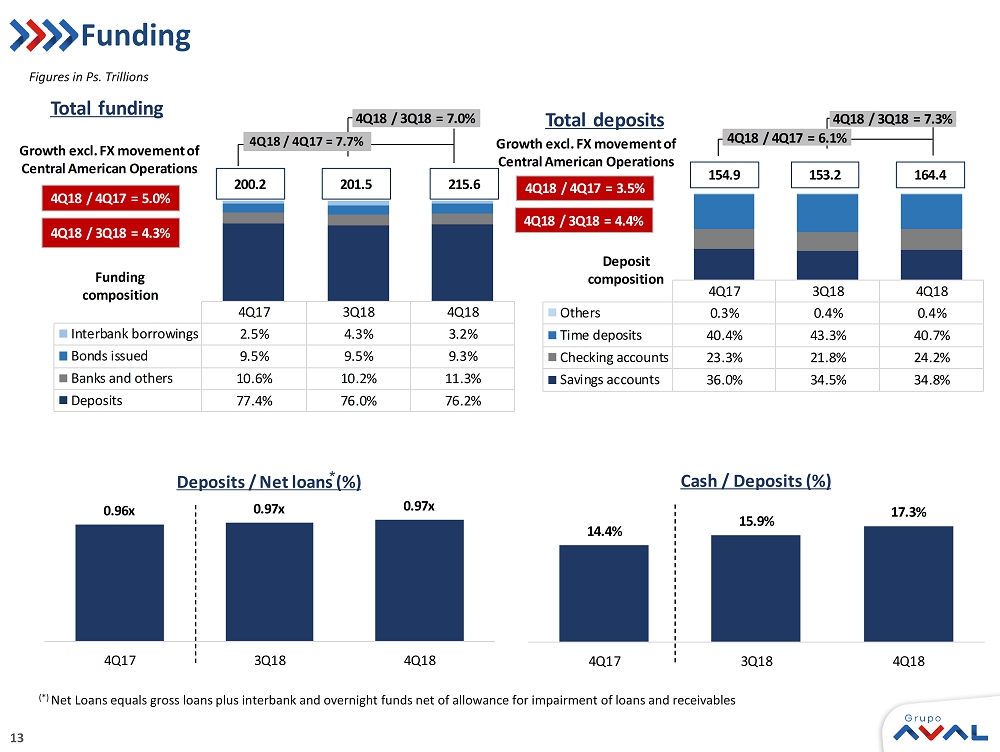
13 Funding Figures in Ps. Trillions 4Q17 3Q18 4Q18 Others 0.3% 0.4% 0.4% Time deposits 40.4% 43.3% 40.7% Checking accounts 23.3% 21.8% 24.2% Savings accounts 36.0% 34.5% 34.8% Total deposits 4Q18 / 4Q17 = 6.1% 4Q18 / 3Q18 = 7.3% 154.9 153.2 164.4 Deposit composition 4Q18 / 4Q17 = 3.5% 4Q18 / 3Q18 = 4.4% Growth excl. FX movement of Central American Operations 4Q17 3Q18 4Q18 Interbank borrowings 2.5% 4.3% 3.2% Bonds issued 9.5% 9.5% 9.3% Banks and others 10.6% 10.2% 11.3% Deposits 77.4% 76.0% 76.2% Total funding 200.2 201.5 215.6 Funding composition 4Q18 / 4Q17 = 7.7% 4Q18 / 3Q18 = 7.0% 4Q18 / 4Q17 = 5.0% 4Q18 / 3Q18 = 4.3% Growth excl. FX movement of Central American Operations 0.96x 0.97x 0.97x 4Q17 3Q18 4Q18 Deposits / Net loans (%) 14.4% 15.9% 17.3% 4Q17 3Q18 4Q18 Cash / Deposits (%) * (*) Net Loans equals gross loans plus interbank and overnight funds net of allowance for impairment of loans and receivables
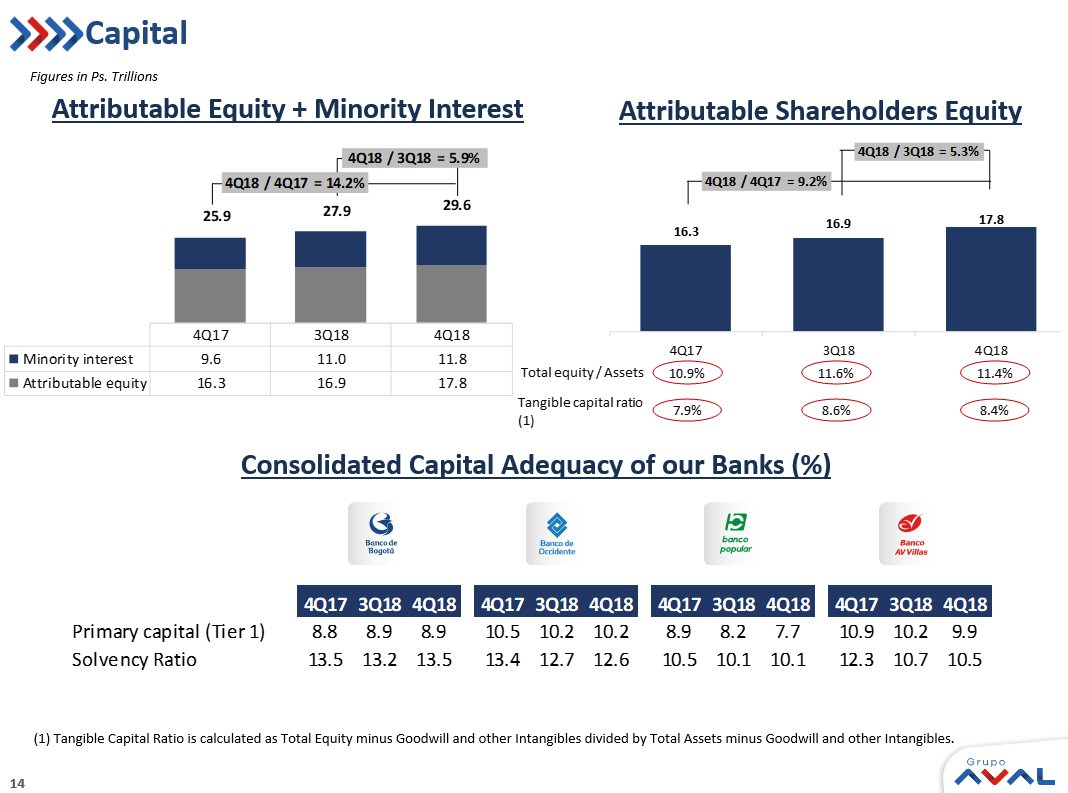
14 Capital Attributable Shareholders Equity Attributable Equity + Minority Interest Figures in Ps. Trillions Consolidated Capital Adequacy of our Banks (%) 4Q17 3Q18 4Q18 Minority interest 9.6 11.0 11.8 Attributable equity 16.3 16.9 17.8 4Q18 / 4Q17 = 14.2% 4Q18 / 3Q18 = 5.9% 25.9 27.9 29.6 16.3 16.9 17.8 4Q17 3Q18 4Q18 Attributable shareholders equity 4Q18 / 3Q18 = 5.3% 4Q18 / 4Q17 = 9.2% Total equity / Assets Tangible capital ratio (1) 10.9% 11.6% 11.4% 7.9% 8.6% 8.4% (1) Tangible Capital Ratio is calculated as Total Equity minus Goodwill and other Intangibles divided by Total Assets minus G ood will and other Intangibles. 4Q173Q184Q18 4Q173Q184Q18 4Q173Q184Q18 4Q173Q184Q18 Primary capital (Tier 1) 8.8 8.9 8.9 10.5 10.2 10.2 8.9 8.2 7.7 10.9 10.2 9.9 Solvency Ratio 13.5 13.2 13.5 13.4 12.7 12.6 10.5 10.1 10.1 12.3 10.7 10.5
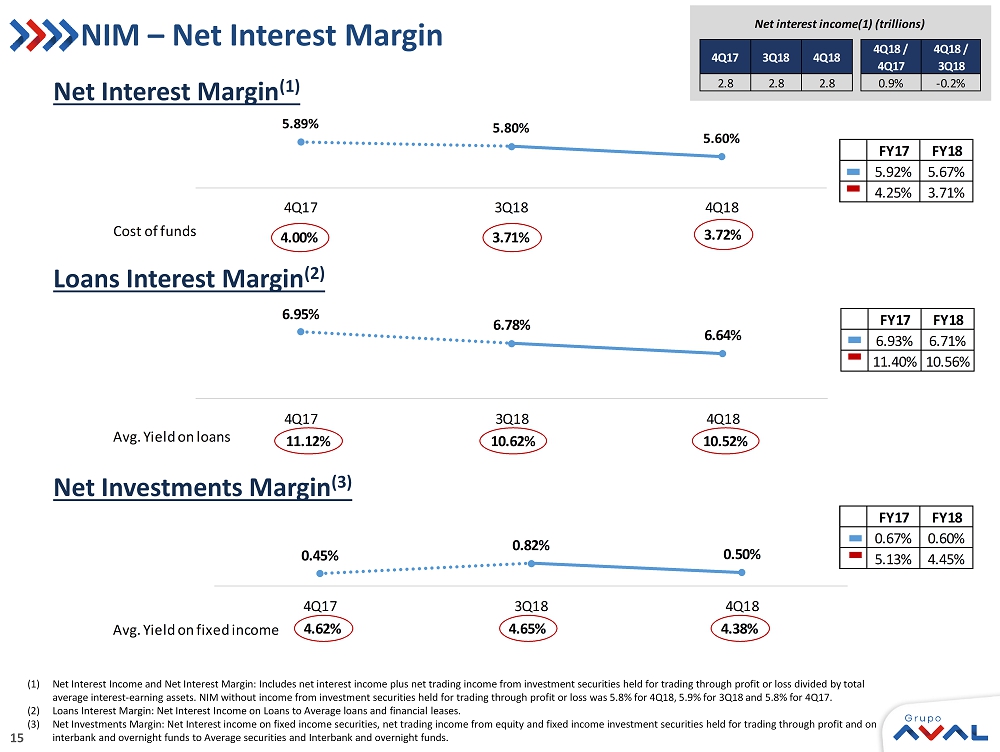
15 6.95% 6.78% 6.64% 4Q17 3Q18 4Q18 11.12% 10.62% 10.52% Avg. Yield on loans NIM – Net Interest Margin Net Interest Margin (1) Loans Interest Margin (2) Net Investments Margin (3) 4Q17 3Q18 4Q18 4Q18 / 4Q17 4Q18 / 3Q18 2.8 2.8 2.8 0.9% -0.2% Net interest income(1) (trillions) (1) Net Interest Income and Net Interest Margin: Includes net interest income plus net trading income from investment securities hel d for trading through profit or loss divided by total average interest - earning assets. NIM without income from investment securities held for trading through profit or loss was 5.8% for 4Q18, 5.9% for 3Q18 and 5. 8% for 4Q17. (2) Loans Interest Margin: Net Interest Income on Loans to Average loans and financial leases. (3) Net Investments Margin: Net Interest income on fixed income securities, net trading income from equity and fixed income inves tme nt securities held for trading through profit and on interbank and overnight funds to Average securities and Interbank and overnight funds. 5.89% 5.80% 5.60% 4Q17 3Q18 4Q18 4.00% 3.71% 3.72% Cost of funds 0.45% 0.82% 0.50% 4Q17 3Q18 4Q18 4.62% 4.65% 4.38% Avg. Yield on fixed income FY17 FY18 5.92% 5.67% 4.25% 3.71% FY17 FY18 6.93% 6.71% 11.40%10.56% FY17 FY18 0.67% 0.60% 5.13% 4.45%

16 72.8% 73.0% 74.2% 6.4% 5.8% 5.6% 17.6% 18.3% 17.4% 3.1% 2.9% 2.8% 4Q17 3Q18 4Q18 Banking fees Trust activities Pension fees Other 1,312.5 1,336.1 1,459.7 4Q18/4Q17=11.2% 4Q18/3Q18=9.3% 13.3% - 3.0% 9.9% 0.3% 4Q18/3Q18 4Q18/4Q17 10.9% 5.4% 4.2% 6.4% 4Q18/3Q18 = 6.3% 4Q18/4Q17 = 8.4% Fees and other operating income Figures in Ps. Billions (1) Includes income from trading and hedging derivatives reflected as part of the net trading income on the Statement of Profit or L oss. (2) Includes equity method income, dividend income and other income. Gross fee income Other operating income Growth excluding FX movement of Central American Operations Net income from sales of goods and services 4Q17 3Q18 4Q18 Foreign exchange gains (losses), net 78 106 -88 Net income (loss) on financial derivatives 7 25 236 Other trading income on derivatives 67 40 50 Derivatives and foreign exchange gains (losses), net (1) 152 171 198 Gains on valuation of assets 21 2 27 Net income from other financial instruments designated at FVTPL 62 50 29 Net gain on sale of investments 23 6 15 Gain on the sale of non-current assets held for sale 2 8 6 Income from non-consolidated investments 38 59 66 Other operating income 136 116 475 Total other operating income 434 413 815 (1) Reflects net NFS from Ventas y Servicios , Megalinea and Gestión y Contacto call - centers and other subsidiaries (1) FY17 FY18 424 283 -75 248 240 179 589 711 39 37 210 206 52 1 14 20 222 269 401 748 1,527 1,992 4Q17 3Q18 4Q18 FY17 FY18 Energy & gas 147 165 114 602 588 Infrastructure 220 861 1,178 412 2,325 Hotels 11 14 13 30 37 Agribusiness -41 1 -10 -49 -5 Other -40 -69 -89 -238 -301 Total 298 972 1,207 757 2,644

17 Efficiency ratio Efficiency Ratio is calculated as personnel plus administrative and other expenses excluding wealth tax divided by net interest income plus net trading income, other income and fees and other services income, net (excluding others). Operating expenses / Total Income Operating expenses / Average Assets Efficiency Ratio is calculated as annualized personnel plus administrative and other expenses excluding wealth tax divided by average of total assets. 46.3% 39.1% 41.8% 4Q17 3Q18 4Q18 FY17 46.5% FY18 43.1% 3.6% 3.5% 3.8% 4Q17 3Q18 4Q18 FY17 3.5% FY18 3.5%

18 466.7 782.7 850.7 4Q17 3Q18 4Q18 Net income attributable to controlling interest $20.9 $35.1 $38.2 EPS $29.0 Profitability (1) ROAA for each quarter is calculated as annualized Net Income divided by average of total assets. (2) ROAE for each quarter is calculated as annualized Net Income attributable to Aval's shareholders divided by average attributa ble shareholders' equity. Figures in Ps. Billions 1.3% 2.4% 2.6% 4Q17 3Q18 4Q18 ROAA (1) 2.0% 11.6% 19.1% 19.6% 4Q17 3Q18 4Q18 ROAE (2) 19.1% FY17 FY18 12.5% 17.8% FY17 FY18 1,962.42,912.7 $ 88.1 $ 130.7 FY17 FY18 1.4% 2.2%

19
SIGNATURE
Pursuant to the requirements of the Securities Exchange Act of 1934, the registrant has duly caused this report to be signed on its behalf by the undersigned, thereunto duly authorized.
Date: March 18, 2019
| GRUPO AVAL ACCIONES Y VALORES S.A. | |||||
| By: | /s/ Jorge Adrián Rincón Plata | ||||
| Name: | Jorge Adrián Rincón Plata | ||||
| Title: | Chief Legal Counsel | ||||