UNITED STATES
SECURITIES AND EXCHANGE COMMISSION
Washington, D.C. 20549
FORM 6-K
Report Of Foreign Private Issuer
Pursuant To Rule 13a-16 Or 15d-16 Of
The Securities Exchange Act Of 1934
For the month of November 2019
Commission File Number: 000-54290
Grupo Aval Acciones y Valores S.A.
(Exact name of registrant as specified in its charter)
Carrera 13 No. 26A - 47
Bogotá D.C., Colombia
(Address of principal executive office)
Indicate by check mark whether the registrant files or will file annual reports under cover of Form 20-F or Form 40-F:
| Form 20-F | ☒ | Form 40-F | ☐ |
Indicate by check mark if the registrant is submitting the Form 6-K in paper as permitted by Regulation S-T Rule 101(b)(1):
| Yes | ☐ | No | ☒ |
Indicate by check mark if the registrant is submitting the Form 6-K in paper as permitted by Regulation S-T Rule 101(b)(7):
| Yes | ☐ | No | ☒ | |
GRUPO AVAL ACCIONES Y VALORES S.A.
TABLE OF CONTENTS
| ITEM | |
| 1. | Report of Third Quarter 2019 Consolidated Results |
| 2. | Third 2019 Consolidated Earnings Results Presentation |
Item 1

Report of 3Q2019 consolidated results
Information reported in Ps billions(1)and under IFRS
(1) We refer to billions as thousands of millions.

 | Disclaimer |
Grupo Aval Acciones y Valores S.A. (“Grupo Aval”) is an issuer of securities in Colombia and in the United States, registered with Colombia’s National Registry of Shares and Issuers (Registro Nacional de Valores y Emisores) and the United States Securities and Exchange Commission (“SEC”). As such, it is subject to compliance with securities regulation in Colombia and applicable U.S. securities regulation.
All of our banking subsidiaries (Banco de Bogotá, Banco de Occidente, Banco Popular and Banco AV Villas), Porvenir and Corficolombiana, are subject to inspection and supervision as financial institutions by the Superintendency of Finance. Grupo Aval is now also subject to the inspection and supervision of the Superintendency of Finance as a result of Law 1870 of 2017, also known as Law of Financial Conglomerates, which came in effect on February 6, 2019. Grupo Aval, as the holding company of its financial conglomerate is responsible for the compliance with capital adequacy requirements, corporate governance standards, risk management and internal control and criteria for identifying, managing and revealing conflicts of interest, applicable to its financial conglomerate.
The consolidated financial information included in this document is presented in accordance with IFRS as currently issued by the IASB. Details of the calculations of non-GAAP measures such as ROAA and ROAE, among others, are explained when required in this report.
Grupo Aval has adopted IFRS 16 retrospectively from January 1, 2019 but has not restated comparatives for the 2018 reporting period, as permitted under the specific transitional provisions in the standard. The reclassifications and the adjustments arising from the new leasing rules are therefore recognized in the opening Condensed Consolidated Statement of Financial Position on January 1, 2019. Consequently, quarterly results for 2019 are not fully comparable to previous periods.
IFRS 16 introduced a single, on-balance sheet accounting model for lessees. As a result, Grupo Aval, as a lessee, has recognized right-of-use assets representing its rights to use the underlying assets and lease liabilities representing its obligation to make lease payments. Lessor accounting remains similar to previous accounting policies. Assets and liabilities arising from a lease are initially measured on a present value basis. The lease payments are discounted using the interest rate implicit in the lease, if that rate can be determined, or the group’s incremental borrowing rate.
This report includes forward-looking statements. In some cases, you can identify these forward-looking statements by words such as “may,” “will,” “should,” “expects,” “plans,” “anticipates,” “believes,” “estimates,” “predicts,” “potential,” or “continue,” or the negative of these and other comparable words. Actual results and events may differ materially from those anticipated herein as a consequence of changes in general, economic and business conditions, changes in interest and currency rates and other risk described from time to time in our filings with the Registro Nacional de Valores y Emisores and the SEC.
Recipients of this document are responsible for the assessment and use of the information provided herein. Matters described in this presentation and our knowledge of them may change extensively and materially over time but we expressly disclaim any obligation to review, update or correct the information provided in this report, including any forward looking statements, and do not intend to provide any update for such material developments prior to our next earnings report.
The content of this document and the figures included herein are intended to provide a summary of the subjects discussed rather than a comprehensive description.
When applicable, in this document we refer to billions as thousands of millions.
| 1 |  |
| Report of 3Q2019 consolidated results Information reported in Ps billions and under IFRS, except per share information |
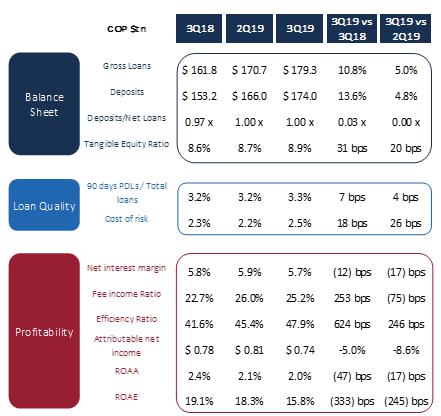
Bogotá, November 18th, 2019. Grupo Aval S.A. (NYSE:AVAL) reported a consolidated attributable net income for 3Q19 of Ps 743.2 billion versus the Ps 782.7 billion reported for 3Q18. ROAE was 15.8% and ROAA was 2.0% for the quarter.
Key results of the quarter:
| • | Accumulated attributable net income for the nine months ended September 2019 increased 12.5% versus the same period in 2018. |
| • | 3Q19 results were strong at Ps 743 billion, 33.4 pesos per share, after significant provisions for CRDS which impacted this attributable net income number in Ps 148 billion. |
| • | Strong loan portfolio growth of 11% yoy (and 5.0% in the quarter) with a pick up in the commercial portfolio. |
| • | Net Interest Margin for the quarter of 5.7%, in line with our expectations, as a result of 6.4% NIM on loans and 2.3% NIM on investments. |
| • | As expected, Cost of Risk,excluding CRDS provisions, of 1.8% for the quarter and 2.5% fully loaded. Cumulative Cost of Risk for the first three quarters of 2.2% and 1.9% excluding provisions for CDRS. |
| • | Net fee income for the nine months ended September increased by 12% when comparing versus the same period in 2018, almost 14% versus the same quarter in 2018 and remained stable versus the previous quarter, due mainly to strong banking and pension fund fees. |
| • | Continued contribution from our Non-Financial Sector investments during the quarter resulted in a 10% increase in income from non-financial investments versus the previous quarter. |
| • | Personnel, including severance costs, and SG&A expenses grew by 6.3% for the nine months ended September 2019 versus the same period in 2018. |
| • | Allowances/90+ PDL’s at 153%, Deposits/Loans at 1.00x, Liquidity at approximately 16% and Tangible Equity at 8.9%, as of September 30, 2019, complement the balance sheet´s strength. |
Gross loansexcludes interbank and overnight funds.Tangible Capital Ratio is calculated as Total Equity minus Goodwill and other Intangibles divided by Total Assets minus Goodwill and other Intangibles.PDLs 90+ defined as loans more than 90 days past due.Net Interest Margin includes net interest income plus net trading income from debt and equity investments at FVTPL divided by total average interest-earning assets.Fee income ratio is calculated as net income from commissions and fees divided by net interest income plus net income from commissions and fees, net income from sales of goods and services, net trading income, net income from other financial instruments mandatory at FVTPL and total other income (excluding others).Efficiency Ratio is calculated as total other expenses divided by net interest income plus net income from commissions and fees, net income from sales of goods and services, net trading income, net income from other financial instruments mandatory at FVTPL and total other income.ROAA is calculated as annualized Net Income divided by average of total assets.ROAE is calculated as Net Income attributable to Aval's shareholders divided by average attributable shareholders' equity.
NSrefers to non-significant figures.
| 2 | |
| Report of 3Q2019 consolidated results Information reported in Ps billions and under IFRS |
Grupo Aval Acciones y Valores S.A.
Consolidated Financial Statements Under IFRS
Information in Ps. Billions
| Consolidated Statement of Financial Position | 3Q18 | 2Q19 | 3Q19 | D | |||||
| 3Q19 vs. 2Q19 | 3Q19 vs. 3Q18 | ||||||||
| Cash and cash equivalents | 24,396.8 | 29,824.7 | 27,332.7 | -8.4% | 12.0% | ||||
| Trading assets | 5,391.2 | 7,702.0 | 9,298.4 | 20.7% | 72.5% | ||||
| Investment securities | 24,082.5 | 24,316.2 | 24,550.6 | 1.0% | 1.9% | ||||
| Hedging derivatives assets | 85.6 | 44.4 | 27.8 | -37.3% | -67.5% | ||||
| Total loans and receivables, net | 158,265.1 | 166,401.3 | 174,429.7 | 4.8% | 10.2% | ||||
| Tangible assets | 6,465.3 | 8,863.4 | 9,010.3 | 1.7% | 39.4% | ||||
| Goodwill | 6,882.5 | 7,249.3 | 7,676.3 | 5.9% | 11.5% | ||||
| Concession arrangement rights | 4,981.0 | 6,429.4 | 6,987.6 | 8.7% | 40.3% | ||||
| Other assets | 10,937.0 | 13,845.4 | 14,533.9 | 5.0% | 32.9% | ||||
| Total assets | 241,487.0 | 264,676.1 | 273,847.3 | 3.5% | 13.4% | ||||
| Trading liabilities | 488.9 | 568.3 | 832.2 | 46.5% | 70.2% | ||||
| Hedging derivatives liabilities | 63.6 | 76.7 | 115.3 | 50.3% | 81.2% | ||||
| Customer deposits | 153,188.5 | 166,000.8 | 174,048.0 | 4.8% | 13.6% | ||||
| Interbank borrowings and overnight funds | 8,669.9 | 10,416.7 | 5,721.8 | -45.1% | -34.0% | ||||
| Borrowings from banks and others | 17,094.3 | 20,278.7 | 22,633.3 | 11.6% | 32.4% | ||||
| Bonds issued | 19,128.2 | 20,105.5 | 21,457.1 | 6.7% | 12.2% | ||||
| Borrowings from development entities | 3,440.2 | 3,290.4 | 3,674.8 | 11.7% | 6.8% | ||||
| Other liabilities | 11,507.2 | 13,336.0 | 13,002.0 | -2.5% | 13.0% | ||||
| Total liabilities | 213,580.8 | 234,073.0 | 241,484.5 | 3.2% | 13.1% | ||||
| Equity attributable to owners of the parent | 16,895.2 | 18,310.6 | 19,314.3 | 5.5% | 14.3% | ||||
| Non-controlling interest | 11,011.0 | 12,292.5 | 13,048.5 | 6.2% | 18.5% | ||||
| Total equity | 27,906.2 | 30,603.1 | 32,362.8 | 5.8% | 16.0% | ||||
| Total liabilities and equity | 241,487.0 | 264,676.1 | 273,847.3 | 3.5% | 13.4% | ||||
| Consolidated Statement of Income | 3Q18 | 2Q19 | 3Q19 | D | |||||
| Interest income | 4,599.3 | 4,885.8 | 4,942.1 | 1.2% | 7.5% | ||||
| Interest expense | 1,847.3 | 2,054.4 | 2,112.8 | 2.8% | 14.4% | ||||
| Net interest income | 2,752.0 | 2,831.3 | 2,829.3 | -0.1% | 2.8% | ||||
| Loans and other accounts receivable | 1,013.9 | 1,040.9 | 1,189.3 | 14.3% | 17.3% | ||||
| Other financial assets | 3.9 | (33.2) | 1.3 | -104.0% | -66.3% | ||||
| Recovery of charged-off financial assets | (83.4) | (96.6) | (101.8) | 5.4% | 22.1% | ||||
| Net impairment loss on financial assets | 934.4 | 911.1 | 1,088.8 | 19.5% | 16.5% | ||||
| Net interest income, after impairment losses | 1,817.6 | 1,920.2 | 1,740.5 | -9.4% | -4.2% | ||||
| Net income from commissions and fees | 1,193.8 | 1,347.2 | 1,355.2 | 0.6% | 13.5% | ||||
| Net income from sales of goods and services | 972.3 | 599.7 | 661.5 | 10.3% | -32.0% | ||||
| Net trading income | 109.5 | 208.6 | 481.3 | 130.8% | N.A. | ||||
| Net income from other financial instruments mandatory at FVTPL | 50.2 | 53.4 | 55.2 | 3.4% | 10.1% | ||||
| Total other income | 297.6 | 266.1 | 104.8 | -60.6% | -64.8% | ||||
| Total other expenses | 2,236.8 | 2,409.2 | 2,626.0 | 9.0% | 17.4% | ||||
| Net income before income tax expense | 2,204.0 | 1,986.1 | 1,772.5 | -10.8% | -19.6% | ||||
| Income tax expense | 750.8 | 586.4 | 446.5 | -23.9% | -40.5% | ||||
| Net income for the period | 1,453.2 | 1,399.7 | 1,326.0 | -5.3% | -8.7% | ||||
| Non-controlling interest | 670.4 | 586.5 | 582.8 | -0.6% | -13.1% | ||||
| Net income attributable to owners of the parent | 782.7 | 813.2 | 743.2 | -8.6% | -5.0% | ||||
| Key ratios | 3Q18 | 2Q19 | 3Q19 | YTD 2018 | YTD 2019 | ||||
| Net Interest Margin(1) | 5.9% | 5.7% | 5.6% | 5.8% | 5.6% | ||||
| Net Interest Margin (including net trading income)(1) | 5.8% | 5.9% | 5.7% | 5.7% | 5.7% | ||||
| Efficiency ratio(2) | 41.6% | 45.4% | 47.9% | 46.4% | 46.0% | ||||
| ROAA(3) | 2.4% | 2.1% | 2.0% | 2.0% | 2.1% | ||||
| ROAE(4) | 19.1% | 18.3% | 15.8% | 17.2% | 17.0% | ||||
| 90 days PDL / Total loans and leases (5) | 3.2% | 3.2% | 3.3% | 3.2% | 3.3% | ||||
| Provision expense / Average loans and leases (6) | 2.3% | 2.2% | 2.5% | 2.1% | 2.2% | ||||
| Allowance / 90 days PDL (5) | 1.45 | 1.53 | 1.53 | 1.45 | 1.53 | ||||
| Allowance / Total loans and leases | 4.6% | 4.9% | 5.0% | 4.6% | 5.0% | ||||
| Charge-offs / Average loans and leases (6) | 1.9% | 2.3% | 2.0% | 1.9% | 2.2% | ||||
| Total loans and leases, net / Total assets | 65.5% | 62.9% | 63.7% | 65.5% | 63.7% | ||||
| Deposits / Total loans and leases, net | 96.8% | 99.8% | 99.8% | 96.8% | 99.8% | ||||
| Equity / Assets | 11.6% | 11.6% | 11.8% | 11.6% | 11.8% | ||||
| Tangible equity ratio (7) | 8.6% | 8.7% | 8.9% | 8.6% | 8.9% | ||||
| Shares outstanding (EoP) | 22,281,017,159 | 22,281,017,159 | 22,281,017,159 | 22,281,017,159 | 22,281,017,159 | ||||
| Shares outstanding (Average) | 22,281,017,159 | 22,281,017,159 | 22,281,017,159 | 22,281,017,159 | 22,281,017,159 | ||||
| Common share price (EoP) | 1,145.0 | 1,295.0 | 1,285.0 | 1,145.0 | 1,285.0 | ||||
| Preferred share price (EoP) | 1,165.0 | 1,285.0 | 1,300.0 | 1,165.0 | 1,300.0 | ||||
| BV/ EoP shares in Ps. | 758.3 | 821.8 | 866.9 | 758.3 | 866.9 | ||||
| EPS | 35.1 | 36.5 | 33.4 | 92.5 | 104.1 | ||||
| P/E (8) | 8.3 | 8.8 | 9.7 | 9.4 | 9.4 | ||||
| P/BV (8) | 1.5 | 1.6 | 1.5 | 1.5 | 1.5 | ||||
(1) NIM is calculated as Net Interest Income divided by the average of Interest Earning Assets; (2) Efficiency Ratio is calculated as total other expenses divided by net interest income plus net income from commissions and fees, net income from sales of goods and services, net trading income, net income from other financial instruments mandatory at FVTPL and total other income; (3) ROAA is calculated as Income before Minority Interest divided by the average of total assets for each quarter; (4) ROAE is calculated as Net Income attributable to Grupo Aval’s shareholders divided by the average of shareholders´attributable equity for each quarter; (5) PDLs 90+ defined as loans more than 90 days past due. Total loans excluding interbank and overnight funds and 30 days past due include interest accounts receivables; (6) Refers to average gross loans for the period; (7) Tangible Equity Ratio is calculated as Total Equity minus Intangibles (excluding those related to concessions) divided by Total Assets minus Intangibles (excluding those related to concessions); (8) Based on Preferred share prices.
| 3 | |
| Report of 3Q2019 consolidated results Information reported in Ps billions and under IFRS |
Statement of Financial Position Analysis
1. Assets
Total assets as of September 30th, 2019 totaled Ps 273,847.3 billion showing increases of 13.4% versus September 30th, 2018 and of 3.5% versus June 30th, 2019. Growth in assets was mainly driven by (i) a 10.2% year over year growth in total loans and receivables, net to Ps 174,429.7 billion and (ii) a 12.0% year over year growth in cash and cash equivalents to Ps 27,332.7 billion. When excluding FX movement in our Central American operation (“excluding FX”), asset growth would have been 8.1% versus September 30th, 2018 and 0.9% versus June 30th, 2019; for total loans and receivables, net growth would have been 4.8% versus September 30th, 2018 and 2.1% versus June 30th, 2019; and for cash and cash equivalents growth would have been 5.1% versus September 30th, 2018 and -11.2% versus June 30th, 2019.
1.1 Loans and receivables
Total gross loans and receivables (excluding interbank and overnight funds) increased by 10.8% between September 30th, 2018 and September 30th, 2019 to Ps 179,252.0 billion (5.5% excluding FX) mainly driven by (i) a 18.4% increase in Mortgages and housing leases to Ps 20,425.3 billion (8.2% excluding FX), (ii) a 13.0% increase in Consumer loans and leases to Ps 59,306.0 billion (6.9% excluding FX), and (iii) a 8.1% increase in Commercial loans and leases to Ps 99,107.2 billion (4.3% excluding FX).
Interbank & overnight funds increased by 4.4% to Ps 4,133.1 billion (-3.5% excluding FX) during the last twelve months.
Allowance for impairment of loans and receivables was Ps 8,955.3 billion as of September 30th, 2019 taking net loans and receivables to Ps 174,429.7 billion.
| Total loans and receivables, net | 3Q18 | 2Q19 | 3Q19 | D | |||||
| 3Q19 vs. 2Q19 | 3Q19 vs. 3Q18 | ||||||||
| Loans and receivables | |||||||||
| Commercial loans and leases | 91,648.3 | 94,475.8 | 99,107.2 | 4.9% | 8.1% | ||||
| Consumer loans and leases | 52,504.9 | 56,705.3 | 59,306.0 | 4.6% | 13.0% | ||||
| Mortgages and housing leases | 17,244.0 | 19,060.8 | 20,425.3 | 7.2% | 18.4% | ||||
| Microcredit loans and leases | 419.5 | 411.3 | 413.5 | 0.5% | -1.4% | ||||
| Loans and receivables | 161,816.7 | 170,653.2 | 179,252.0 | 5.0% | 10.8% | ||||
| Interbank & overnight funds | 3,960.3 | 4,123.6 | 4,133.1 | 0.2% | 4.4% | ||||
| Total loans and leases | 165,777.0 | 174,776.8 | 183,385.1 | 4.9% | 10.6% | ||||
| Loss allowance | (7,511.9) | (8,375.5) | (8,955.3) | 6.9% | 19.2% | ||||
| Allowance for impairment of commercial loans | (3,835.3) | (4,476.8) | (4,909.8) | 9.7% | 28.0% | ||||
| Allowance for impairment of consumer loans | (3,345.8) | (3,488.9) | (3,604.2) | 3.3% | 7.7% | ||||
| Allowance for impairment of mortgages | (248.8) | (323.6) | (352.3) | 8.9% | 41.6% | ||||
| Allowance for impairment of microcredit loans | (82.1) | (86.2) | (89.2) | 3.5% | 8.6% | ||||
| Total loans and receivables, net | 158,265.1 | 166,401.3 | 174,429.7 | 4.8% | 10.2% | ||||
| 4 | |
| Report of 3Q2019 consolidated results Information reported in Ps billions and under IFRS |
The following table shows the gross loan composition per product of each of our loan categories.
| Gross loans | 3Q18 | 2Q19 | 3Q19 | D | |||||
| 3Q19 vs. 2Q19 | 3Q19 vs. 3Q18 | ||||||||
| General purpose | 63,365.4 | 65,885.1 | 68,939.2 | 4.6% | 8.8% | ||||
| Working capital | 14,571.1 | 14,801.8 | 15,611.5 | 5.5% | 7.1% | ||||
| Financial leases | 9,785.6 | 9,958.0 | 10,313.0 | 3.6% | 5.4% | ||||
| Funded by development banks | 2,999.9 | 3,067.7 | 3,347.5 | 9.1% | 11.6% | ||||
| Overdrafts | 536.3 | 456.4 | 587.3 | 28.7% | 9.5% | ||||
| Credit cards | 390.0 | 306.7 | 308.7 | 0.6% | -20.9% | ||||
| Commercial loans and leases | 91,648.3 | 94,475.8 | 99,107.2 | 4.9% | 8.1% | ||||
| Personal loans | 32,432.2 | 35,074.8 | 36,379.9 | 3.7% | 12.2% | ||||
| Credit cards | 13,883.4 | 15,395.8 | 16,477.3 | 7.0% | 18.7% | ||||
| Automobile and vehicle | 5,703.7 | 5,746.2 | 5,936.4 | 3.3% | 4.1% | ||||
| Financial leases | 238.2 | 257.7 | 271.4 | 5.3% | 14.0% | ||||
| Overdrafts | 95.0 | 93.3 | 96.4 | 3.4% | 1.5% | ||||
| Other | 152.3 | 137.6 | 144.5 | 5.0% | -5.2% | ||||
| Consumer loans and leases | 52,504.9 | 56,705.3 | 59,306.0 | 4.6% | 13.0% | ||||
| Mortgages | 16,017.0 | 17,643.1 | 18,932.6 | 7.3% | 18.2% | ||||
| Housing leases | 1,227.0 | 1,417.7 | 1,492.7 | 5.3% | 21.7% | ||||
| Mortgages and housing leases | 17,244.0 | 19,060.8 | 20,425.3 | 7.2% | 18.4% | ||||
| Microcredit loans and leases | 419.5 | 411.3 | 413.5 | 0.5% | -1.4% | ||||
| Loans and receivables | 161,816.7 | 170,653.2 | 179,252.0 | 5.0% | 10.8% | ||||
| Interbank & overnight funds | 3,960.3 | 4,123.6 | 4,133.1 | 0.2% | 4.4% | ||||
| Total loans and leases | 165,777.0 | 174,776.8 | 183,385.1 | 4.9% | 10.6% | ||||
Over the last twelve months, credit cards, mortgages and personal loans have driven our loan portfolio growth in accordance with our bank’s strategy.
In Colombia, loans and receivables increased by 6.5% during the last twelve months and 2.6% during the quarter. As for Central America, loans and receivables grew by 21.1% between September 30th, 2018 and September 30th, 2019 and increased 10.8% in the last quarter; when excluding FX, growth would have been 3.5% and 2.1%, respectively.
Commercial loans grew by 8.1% over the year and increased 4.9% in the last quarter. In Colombia, commercial loans increased by 4.0% annually and 2.6% over the quarter. As for Central America, commercial loans grew by 22.8% over the year and 12.7% in the last quarter; when excluding FX, growth in Central America would have been 5.0% and 3.9%, respectively.
Consumer loans growth over the last year and quarter was mainly driven by credit cards and personal loans. In Colombia, personal loans grew by 11.7% during the last twelve months and 2.8% between June 30th, 2019 and September 30th, 2019, mainly in payroll lending. Growth of our Central American operations, excluding FX, was driven by credit cards, which grew 7.4% during the last twelve months and 2.0% in the quarter.
| 5 | |
| Report of 3Q2019 consolidated results Information reported in Ps billions and under IFRS |
The following table shows the loans and receivables composition per entity. During the last twelve months, Banco de Occidente showed the highest growth rate within our banking operation in Colombia, driven by a strong performance in all loan categories (commercial loans grew 12.7%, mortgages grew 20.6% and consumer loans grew 7.6%).
| Gross loans / Bank ($) | 3Q18 | 2Q19 | 3Q19 | D | |||||
| 3Q19 vs. 2Q19 | 3Q19 vs. 3Q18 | ||||||||
| Banco de Bogotá | 103,561.6 | 109,904.9 | 117,072.5 | 6.5% | 13.0% | ||||
| Domestic | 56,363.0 | 58,329.6 | 59,936.0 | 2.8% | 6.3% | ||||
| Central America | 47,198.6 | 51,575.3 | 57,136.6 | 10.8% | 21.1% | ||||
| Banco de Occidente | 27,049.2 | 29,400.7 | 30,245.4 | 2.9% | 11.8% | ||||
| Banco Popular | 18,783.2 | 19,280.8 | 19,881.6 | 3.1% | 5.8% | ||||
| Banco AV Villas | 11,049.6 | 11,883.4 | 11,804.1 | -0.7% | 6.8% | ||||
| Corficolombiana | 2,391.4 | 1,761.3 | 1,871.8 | 6.3% | -21.7% | ||||
| Eliminations | (1,018.2) | (1,578.0) | (1,623.5) | 2.9% | 59.4% | ||||
| Loans and receivables | 161,816.7 | 170,653.2 | 179,252.0 | 5.0% | 10.8% | ||||
| Interbank & overnight funds | 3,960.3 | 4,123.6 | 4,133.1 | 0.2% | 4.4% | ||||
| Total loans and receivables portfolio | 165,777.0 | 174,776.8 | 183,385.1 | 4.9% | 10.6% | ||||
| Gross loans / Bank (%) | 3Q18 | 2Q19 | 3Q19 | ||||||
| Banco de Bogotá | 64.0% | 64.4% | 65.3% | ||||||
| Domestic | 34.8% | 34.2% | 33.4% | ||||||
| Central America | 29.2% | 30.2% | 31.9% | ||||||
| Banco de Occidente | 16.7% | 17.2% | 16.9% | ||||||
| Banco Popular | 11.6% | 11.3% | 11.1% | ||||||
| Banco AV Villas | 6.8% | 7.0% | 6.6% | ||||||
| Corficolombiana | 1.5% | 1.0% | 1.0% | ||||||
| Eliminations | -0.6% | -0.9% | -0.9% | ||||||
| Loans and receivables | 100% | 100% | 100% | ||||||
Of the total loans and receivables, 67.7% are domestic and 32.3% are foreign. In terms of gross loans (excluding interbank and overnight funds), 68.1% are domestic and 31.9% are foreign (reflecting the Central American operations). Total foreign loans grew 21.1% during the past twelve months and 10.8% in the quarter (excluding interbank and overnight funds). Excluding FX, yearly and quarterly growth (excluding interbank and overnight funds) for our Central American operations would have been 3.5% and 2.1%, respectively.
| Gross loans | 3Q18 | 2Q19 | 3Q19 | D | |||||
| 3Q19 vs. 2Q19 | 3Q19 vs. 3Q18 | ||||||||
| Domestic | |||||||||
| Commercial loans and leases | 71,690.5 | 72,716.9 | 74,591.9 | 2.6% | 4.0% | ||||
| Consumer loans and leases | 34,898.9 | 37,464.6 | 38,303.8 | 2.2% | 9.8% | ||||
| Mortgages and housing leases | 7,609.2 | 8,485.0 | 8,806.2 | 3.8% | 15.7% | ||||
| Microcredit loans and leases | 419.5 | 411.3 | 413.5 | 0.5% | -1.4% | ||||
| Interbank & overnight funds | 2,057.6 | 2,509.3 | 2,075.0 | -17.3% | 0.8% | ||||
| Total domestic loans | 116,675.8 | 121,587.2 | 124,190.4 | 2.1% | 6.4% | ||||
| Foreign | |||||||||
| Commercial loans and leases | 19,957.8 | 21,758.9 | 24,515.2 | 12.7% | 22.8% | ||||
| Consumer loans and leases | 17,606.0 | 19,240.6 | 21,002.2 | 9.2% | 19.3% | ||||
| Mortgages and housing leases | 9,634.8 | 10,575.8 | 11,619.2 | 9.9% | 20.6% | ||||
| Microcredit loans and leases | - | - | - | - | - | ||||
| Interbank & overnight funds | 1,902.7 | 1,614.3 | 2,058.1 | 27.5% | 8.2% | ||||
| Total foreign loans | 49,101.3 | 53,189.6 | 59,194.6 | 11.3% | 20.6% | ||||
| Total loans and leases | 165,777.0 | 174,776.8 | 183,385.1 | 4.9% | 10.6% | ||||
| 6 | |
| Report of 3Q2019 consolidated results Information reported in Ps billions and under IFRS |
The quality of our loan portfolio remained relatively stable during the quarter.
Our 30 days PDL to total loans closed 3Q19 in 4.5%, the same level as in 2Q19 and 3Q18. The ratio of 90 days PDL to total loans was 3.3% for 3Q19 compared to 3.2% in 2Q19 and 3Q18. Finally, the ratio of CDE Loans to total loans was 7.2% in 3Q19, 7.1% in 2Q19 and 3Q18.
Commercial loans’ 30 days PDL ratio was 4.3% for 3Q19, 4.2% for 2Q19 and 4.1% for 3Q18; 90 days PDL ratio was 3.7%, 3.6% and 3.5%, respectively. Consumer loans’ 30 days PDL ratio was 4.9% for 3Q19 and 2Q19, and 5.2% for 3Q18; 90 days PDL ratio was 2.7%, 2.7% and 2.9%, respectively. Mortgages’ 30 days PDL ratio was 4.8% for 3Q19, 4.6% for 2Q19 and 4.1% for 3Q18; 90 days PDL ratio was 2.7%, 2.6% and 2.2%, respectively.
| Total loans and leases | 3Q18 | 2Q19 | 3Q19 | D | |||||
| 3Q19 vs. 2Q19 | 3Q19 vs. 3Q18 | ||||||||
| ''A'' normal risk | 145,440.1 | 153,775.8 | 160,892.9 | 4.6% | 10.6% | ||||
| ''B'' acceptable risk | 4,892.4 | 4,749.9 | 5,376.2 | 13.2% | 9.9% | ||||
| ''C'' appreciable risk | 5,213.2 | 5,394.5 | 5,368.6 | -0.5% | 3.0% | ||||
| ''D'' significant risk | 4,177.6 | 3,762.6 | 4,335.2 | 15.2% | 3.8% | ||||
| ''E'' unrecoverable | 2,093.4 | 2,970.4 | 3,279.1 | 10.4% | 56.6% | ||||
| Loans and receivables | 161,816.7 | 170,653.2 | 179,252.0 | 5.0% | 10.8% | ||||
| Interbank and overnight funds | 3,960.3 | 4,123.6 | 4,133.1 | 0.2% | 4.4% | ||||
| Total loans and leases | 165,777.0 | 174,776.8 | 183,385.1 | 4.9% | 10.6% | ||||
| CDE loans / Total loans (*) | 7.1% | 7.1% | 7.2% | ||||||
| Past due loans | 3Q18 | 2Q19 | 3Q19 | D | |||||
| 3Q19 vs. 2Q19 | 3Q19 vs. 3Q18 | ||||||||
| Performing | 87,902.3 | 90,507.7 | 94,889.8 | 4.8% | 7.9% | ||||
| Between 31 and 90 days past due | 524.5 | 552.6 | 578.7 | 4.7% | 10.3% | ||||
| +90 days past due | 3,221.5 | 3,415.4 | 3,638.6 | 6.5% | 12.9% | ||||
| Commercial loans and leases | 91,648.3 | 94,475.8 | 99,107.2 | 4.9% | 8.1% | ||||
| Performing | 49,790.2 | 53,904.5 | 56,416.8 | 4.7% | 13.3% | ||||
| Between 31 and 90 days past due | 1,197.0 | 1,273.7 | 1,289.4 | 1.2% | 7.7% | ||||
| +90 days past due | 1,517.7 | 1,527.1 | 1,599.8 | 4.8% | 5.4% | ||||
| Consumer loans and leases | 52,504.9 | 56,705.3 | 59,306.0 | 4.6% | 13.0% | ||||
| Performing | 16,539.9 | 18,183.2 | 19,448.4 | 7.0% | 17.6% | ||||
| Between 31 and 90 days past due | 324.3 | 380.5 | 423.6 | 11.3% | 30.6% | ||||
| +90 days past due | 379.7 | 497.1 | 553.4 | 11.3% | 45.7% | ||||
| Mortgages and housing leases | 17,244.0 | 19,060.8 | 20,425.3 | 7.2% | 18.4% | ||||
| Performing | 355.4 | 341.7 | 341.7 | 0.0% | -3.9% | ||||
| Between 31 and 90 days past due | 16.7 | 18.6 | 18.0 | -3.3% | 7.8% | ||||
| +90 days past due | 47.5 | 51.1 | 53.8 | 5.4% | 13.4% | ||||
| Microcredit loans and leases | 419.5 | 411.3 | 413.5 | 0.5% | -1.4% | ||||
| Loans and receivables | 161,816.7 | 170,653.2 | 179,252.0 | 5.0% | 10.8% | ||||
| Interbank & overnight funds | 3,960.3 | 4,123.6 | 4,133.1 | 0.2% | 4.4% | ||||
| Allowance for impairment of commercial loans | 165,777.0 | 174,776.8 | 183,385.1 | 4.9% | 10.6% | ||||
| 30 Days PDL / Total loans (*) | 4.5% | 4.5% | 4.5% | ||||||
| 90 Days PDL / Total loans (*) | 3.2% | 3.2% | 3.3% |
(*) Total loans excluding interbank and overnight funds. 30 days past due and 90 days past due are calculated on a capital plus interest accounts receivable basis.
| 7 | |
| Report of 3Q2019 consolidated results Information reported in Ps billions and under IFRS |
Grupo Aval’s coverage over its 90 days PDL was 1.5x for 3Q19, 2Q19, 3Q18. Allowance to CDE Loans was 0.7x for 3Q19, 2Q19 and 3Q18, and allowance to 30 days PDL was 1.1x for 3Q19 and 2Q19 and 1.0x for 3Q18. Impairment loss, net of recoveries of charged off assets to average total loans was 2.5% in 3Q19, 2.2% in 2Q19 and 2.3% in 3Q18. Charge-offs to average total loans was 2.0% in 3Q19, 2.3% in 2Q19 and 1.9% in 3Q18.
Total loans and leases | 3Q18 | 2Q19 | 3Q19 | |||
| Allowance for impairment / CDE loans | 0.7 | 0.7 | 0.7 | |||
| Allowance for impairment / 30 Days PDL | 1.0 | 1.1 | 1.1 | |||
| Allowance for impairment / 90 Days PDL | 1.5 | 1.5 | 1.5 | |||
| Allowance for impairment / Total loans (*) | 4.6% | 4.9% | 5.0% | |||
| Impairment loss / CDE loans | 0.4 | 0.3 | 0.4 | |||
| Impairment loss / 30 Days PDL | 0.6 | 0.5 | 0.6 | |||
| Impairment loss / 90 Days PDL | 0.8 | 0.8 | 0.8 | |||
| Impairment loss / Average total loans (*) | 2.5% | 2.5% | 2.7% | |||
| Impairment loss, net of recoveries of charged-off assets / Average total loans (*) | 2.3% | 2.2% | 2.5% | |||
| Charge-offs / Average total loans (*) | 1.9% | 2.3% | 2.0% |
(*) Total loans excluding interbank and overnight funds. 30 days past due and 90 days past due are calculated on a capital plus interest accounts receivable basis.
1.2 Investment securities and trading assets
Total investment securities and trading assets increased 14.8% to Ps 33,848.9 billion between September 30th, 2018 and September 30th, 2019, and 5.7% versus June 30th, 2019. Ps 28,589.0 billion of our total portfolio is invested in debt securities, which increased by 12.8% between September 30th, 2018 and September 30th, 2019 and by 5.7% since June 30th, 2019. Ps 4,604.6 billion of our total investment securities is invested in equity securities, which increased by 30.4% between September 30th, 2018 and September 30th, 2019 and by 3.9% versus June 30th, 2019.
| Investment and trading assets | 3Q18 | 2Q19 | 3Q19 | D | |||||
| 3Q19 vs. 2Q19 | 3Q19 vs. 3Q18 | ||||||||
| Debt securities | 2,467.3 | 4,011.4 | 5,351.7 | 33.4% | 116.9% | ||||
| Equity securities | 2,318.2 | 3,157.1 | 3,291.2 | 4.2% | 42.0% | ||||
| Derivative assets | 605.6 | 533.5 | 655.4 | 22.9% | 8.2% | ||||
| Trading assets | 5,391.2 | 7,702.0 | 9,298.4 | 20.7% | 72.5% | ||||
| Investments in debt securities at FVTPL (non compliant with SPPI test) | - | 25.1 | 35.8 | 42.8% | N.A | ||||
| Debt securities at FVOCI | 19,870.3 | 20,030.6 | 20,150.3 | 0.6% | 1.4% | ||||
| Equity securities at FVOCI | 1,212.9 | 1,276.0 | 1,313.3 | 2.9% | 8.3% | ||||
| Investments in securities at FVOCI | 21,083.2 | 21,306.6 | 21,463.6 | 0.7% | 1.8% | ||||
| Investments in debt securities at AC | 2,999.4 | 2,984.5 | 3,051.1 | 2.2% | 1.7% | ||||
| Investment and trading assets | 29,473.7 | 32,018.2 | 33,848.9 | 5.7% | 14.8% | ||||
| 8 | |
| Report of 3Q2019 consolidated results Information reported in Ps billions and under IFRS |
The average yield on our debt and equity investment securities (trading assets, investments in debt securities at FVTPL, investments in securities at FVOCI and investments in debt securities at AC) was 5.4% for 3Q19, 5.7% for 2Q19 and 4.3% in 3Q18.
1.3 Cash and Cash Equivalents
As of September 30th, 2019 cash and cash equivalents had a balance of Ps 27,332.7 billion showing an increase of 12.0% versus September 30th, 2018 and a decrease of 8.4% versus June 30th, 2019 ( 5.1% and -11.2% excluding FX).
The ratio of cash and cash equivalents to customer deposits was 15.7% in September 30th, 2019, 18.0% in June 30th, 2019, and 15.9% in September 30th, 2018.
1.4 Goodwill and Other Intangibles
Goodwill and other intangibles as of September 30th, 2019 reached Ps 15,780.4 billion, increasing by 22.9% versus September 30th, 2018 and 7.0% versus June 30th, 2019.
Goodwill as of September 30th, 2019 was Ps 7,676.3 billion, increasing by 11.5% versus September 30th, 2018 and 5.9% versus June 30th, 2019, explained by fluctuations in the exchange rate.
Other intangibles, which include “concession arrangement rights” and other intangibles, mainly reflect the value of road concessions recorded for the most part at Corficolombiana. Other intangibles as of September 30th, 2019 reached Ps 8,104.0 billion and grew by 36.1% versus September 30th, 2018 and 8.1% versus June 30th, 2019.
2. Liabilities
As of September 30th, 2019 funding represented 94.2% of total liabilities and other liabilities represented 5.8%.
2.1 Funding
Total Funding (Total financial liabilities at amortized cost) which includes (i) Customer deposits, (ii) Interbank borrowings and overnight funds, (iii) Borrowings from banks and others, (iv) Bonds issued, and (v) Borrowing from development entities had a balance of Ps 227,534.9 billion as of September 30th, 2019 showing an increase of 12.9% versus September 30th, 2018 and of 3.4% versus June 30th, 2019 (7.8% and 0.9% increase excluding FX). Total customer deposits represented 76.5% of total funding as of the end of 3Q19, 75.4% for 2Q19 and 76.0% for 3Q18.
Average cost of funds was 3.8% for 3Q19 and 2Q19 and 3.7% for 3Q18. Our average cost of funds reflects stability in line with a now stable interest rate scenario.
| 9 | |
| Report of 3Q2019 consolidated results Information reported in Ps billions and under IFRS |
2.1.1 Customer deposits
| Customer deposits | 3Q18 | 2Q19 | 3Q19 | D | |||||
| 3Q19 vs. 2Q19 | 3Q19 vs. 3Q18 | ||||||||
| Checking accounts | 13,668.0 | 14,811.2 | 16,298.7 | 10.0% | 19.2% | ||||
| Other deposits | 596.9 | 526.6 | 412.0 | -21.8% | -31.0% | ||||
| Non-interest bearing | 14,264.9 | 15,337.8 | 16,710.7 | 9.0% | 17.1% | ||||
| Checking accounts | 19,733.4 | 23,479.6 | 23,398.4 | -0.3% | 18.6% | ||||
| Time deposits | 66,265.0 | 71,687.7 | 76,164.2 | 6.2% | 14.9% | ||||
| Savings deposits | 52,925.2 | 55,495.7 | 57,774.6 | 4.1% | 9.2% | ||||
| Interest bearing | 138,923.7 | 150,663.0 | 157,337.2 | 4.4% | 13.3% | ||||
| Customer deposits | 153,188.5 | 166,000.8 | 174,048.0 | 4.8% | 13.6% | ||||
Of our total customer deposits as of September 30th, 2019 checking accounts represented 22.8%, time deposits 43.8%, savings accounts 33.2%, and other deposits 0.2%.
The following table shows the customer deposits composition by bank. During the last twelve months, Banco de Bogotá showed the highest growth rate in customer deposits within our banking operation in Colombia.
| Deposits / Bank ($) | 3Q18 | 2Q19 | 3Q19 | D | |||||
| 3Q19 vs. 2Q19 | 3Q19 vs. 3Q18 | ||||||||
| Banco de Bogotá | 98,944.1 | 107,408.4 | 116,875.0 | 8.8% | 18.1% | ||||
| Domestic | 53,724.9 | 56,458.0 | 60,497.2 | 7.2% | 12.6% | ||||
| Central America | 45,219.1 | 50,950.4 | 56,377.8 | 10.7% | 24.7% | ||||
| Banco de Occidente | 25,662.5 | 26,706.2 | 27,763.8 | 4.0% | 8.2% | ||||
| Banco Popular | 17,197.4 | 19,096.1 | 17,355.9 | -9.1% | 0.9% | ||||
| Banco AV Villas | 10,417.7 | 11,307.6 | 11,347.5 | 0.4% | 8.9% | ||||
| Corficolombiana | 3,727.3 | 4,006.2 | 4,189.0 | 4.6% | 12.4% | ||||
| Eliminations | (2,760.4) | (2,523.5) | (3,483.3) | 38.0% | 26.2% | ||||
| Total Grupo Aval | 153,188.5 | 166,000.8 | 174,048.0 | 4.8% | 13.6% | ||||
| Deposits / Bank (%) | 3Q18 | 2Q19 | 3Q19 | ||||||
| Banco de Bogotá | 64.6% | 64.7% | 67.2% | ||||||
| Domestic | 35.1% | 34.0% | 34.8% | ||||||
| Central America | 29.5% | 30.7% | 32.4% | ||||||
| Banco de Occidente | 16.8% | 16.1% | 16.0% | ||||||
| Banco Popular | 11.2% | 11.5% | 10.0% | ||||||
| Banco AV Villas | 6.8% | 6.8% | 6.5% | ||||||
| Corficolombiana | 2.4% | 2.4% | 2.4% | ||||||
| Eliminations | -1.8% | -1.5% | -2.0% | ||||||
| Total Grupo Aval | 100.0% | 100.0% | 100.0% | ||||||
| 10 | |
| Report of 3Q2019 consolidated results Information reported in Ps billions and under IFRS |
2.1.2 Borrowings from Banks and Other (includes borrowings from development entities)
As of September 30th, 2019 borrowings from banks and other totaled Ps 26,308.0 billion, showing an increase of 28.1% versus September 30th, 2018 and an increased of 11.6% versus June 30th, 2019. Excluding FX, borrowings from banks and other increased 19.0% versus September 30th, 2018 and increased 8.0% versus June 30th, 2019.
2.1.3 Bonds issued
Total bonds issued as of September 30th, 2019 totaled Ps 21,457.1 billion showing increases of 12.2% versus September 30th, 2018 and of 6.7% versus June 30th, 2019. Excluding FX, bonds increased 11.4% versus September 30th, 2018 and 6.2% versus June 30th, 2019.
3. Non-controlling Interest
Non-controlling Interest in Grupo Aval reflects: (i) the minority stakes that third party shareholders hold in each of its direct consolidated subsidiaries (Banco de Bogotá, Banco de Occidente, Banco Popular, Banco AV Villas and Corficolombiana), and (ii) the minority stakes that third party shareholders hold in the consolidated subsidiaries at the bank level (mainly Porvenir). As of September 30th, 2019 non-controlling interest was Ps 13,048.5 billion which increased by 18.5% versus September 30th, 2018 and 6.2% versus June 30th, 2019. Total non-controlling interest represents 40.3% of total equity as of September 30th, 2019, compared to 40.2% in 2Q19 and 39.5% in 3Q18. Total non-controlling interest derives from the sum of the combined minority interests of our banks and of Grupo Aval, applying eliminations associated with the consolidation process of Grupo Aval.
| Direct & indirect ownership of main subsidiaries | 3Q18 | 2Q19 | 3Q19 | D | |||||
| 3Q19 vs. 2Q19 | 3Q19 vs. 3Q18 | ||||||||
| Banco de Bogotá | 68.7% | 68.7% | 68.7% | - | - | ||||
| Banco de Occidente | 72.3% | 72.3% | 72.3% | - | - | ||||
| Banco Popular | 93.7% | 93.7% | 93.7% | - | - | ||||
| Banco AV Villas | 79.9% | 79.9% | 79.9% | - | - | ||||
| BAC Credomatic(1) | 68.7% | 68.7% | 68.7% | - | - | ||||
| Porvenir(2) | 75.7% | 75.7% | 75.7% | - | 0 | ||||
| Corficolombiana(3) | 38.2% | 38.6% | 38.6% | - | 40 | ||||
(1) BAC Credomatic is fully owned by Banco de Bogotá; (2) Grupo Aval indirectly owns a 100% of Porvenir as follows: 20.0% in Grupo Aval, 46.9% in Banco de Bogotá and 33.1% in Banco de Occidente. Porvenir's results consolidate into Banco de Bogotá; (3) Grupo Aval decreased its ownership in Corficolombiana as it did not exercise its right to subscribe shares in the equity issuance done in 2018. Rights of subscription were transferred to all Grupo Aval shareholders.
4. Attributable Shareholders’ Equity
Attributable shareholders’ equity as of September 30th, 2019 was Ps 19,314.3 billion, showing an increase of 14.3% versus September 30th, 2018 and of 5.5% versus June 30th, 2019.
| 11 | |
| Report of 3Q2019 consolidated results Information reported in Ps billions and under IFRS |
Income Statement Analysis
Our net income attributable to the owners of the parent company for 3Q19 of Ps 743.2 billion showed a 5.0% decrease versus 3Q18 and a 8.6% decrease versus 2Q19.
| Consolidated Statement of Income | 3Q18 | 2Q19 | 3Q19 | D | |||||
| 3Q19 vs. 2Q19 | 3Q19 vs. 3Q18 | ||||||||
| Interest income | 4,599.3 | 4,885.8 | 4,942.1 | 1.2% | 7.5% | ||||
| Interest expense | 1,847.3 | 2,054.4 | 2,112.8 | 2.8% | 14.4% | ||||
| Net interest income | 2,752.0 | 2,831.3 | 2,829.3 | -0.1% | 2.8% | ||||
| Loans and other accounts receivable | 1,013.9 | 1,040.9 | 1,189.3 | 14.3% | 17.3% | ||||
| Other financial assets | 3.9 | (33.2) | 1.3 | -104.0% | -66.3% | ||||
| Recovery of charged-off financial assets | (83.4) | (96.6) | (101.8) | 5.4% | 22.1% | ||||
| Net impairment loss on financial assets | 934.4 | 911.1 | 1,088.8 | 19.5% | 16.5% | ||||
| Net income from commissions and fees | 1,193.8 | 1,347.2 | 1,355.2 | 0.6% | 13.5% | ||||
| Net income from sales of goods and services | 972.3 | 599.7 | 661.5 | 10.3% | -32.0% | ||||
| Net trading income | 109.5 | 208.6 | 481.3 | 130.8% | N.A. | ||||
| Net income from other financial instruments mandatory at FVTPL | 50.2 | 53.4 | 55.2 | 3.4% | 10.1% | ||||
| Total other income | 297.6 | 266.1 | 104.8 | -60.6% | -64.8% | ||||
| Total other expenses | 2,236.8 | 2,409.2 | 2,626.0 | 9.0% | 17.4% | ||||
| Net income before income tax expense | 2,204.0 | 1,986.1 | 1,772.5 | -10.8% | -19.6% | ||||
| Income tax expense | 750.8 | 586.4 | 446.5 | -23.9% | -40.5% | ||||
| Net income for the period | 1,453.2 | 1,399.7 | 1,326.0 | -5.3% | -8.7% | ||||
| Non-controlling interest | 670.4 | 586.5 | 582.8 | -0.6% | -13.1% | ||||
| Net income attributable to owners of the parent | 782.7 | 813.2 | 743.2 | -8.6% | -5.0% | ||||
1. Net Interest Income
| Net interest income | 3Q18 | 2Q19 | 3Q19 | D | |||||
| 3Q19 vs. 2Q19 | 3Q19 vs. 3Q18 | ||||||||
| Interest income | |||||||||
| Commercial | 1,809.3 | 1,842.9 | 1,860.1 | 0.9% | 2.8% | ||||
| Interbank and overnight funds | 77.4 | 108.5 | 141.4 | 30.2% | 82.6% | ||||
| Consumer | 2,072.8 | 2,224.8 | 2,236.8 | 0.5% | 7.9% | ||||
| Mortgages and housing leases | 366.2 | 403.9 | 413.6 | 2.4% | 12.9% | ||||
| Microcredit | 26.4 | 25.5 | 26.4 | 3.7% | -0.1% | ||||
| Loan portfolio | 4,352.2 | 4,605.7 | 4,678.3 | 1.6% | 7.5% | ||||
| Interests on investments in debt securities | 247.1 | 280.0 | 263.8 | -5.8% | 6.8% | ||||
| Total interest income | 4,599.3 | 4,885.8 | 4,942.1 | 1.2% | 7.5% | ||||
| Interest expense | |||||||||
| Checking accounts | 81.2 | 103.6 | 108.3 | 4.5% | 33.4% | ||||
| Time deposits | 823.8 | 888.5 | 930.9 | 4.8% | 13.0% | ||||
| Savings deposits | 368.0 | 374.2 | 374.1 | 0.0% | 1.6% | ||||
| Total interest expenses on deposits | 1,273.1 | 1,366.4 | 1,413.4 | 3.4% | 11.0% | ||||
| Interbank borrowings and overnight funds | 56.2 | 84.3 | 95.9 | 13.8% | 70.7% | ||||
| Borrowings from banks and others | 193.8 | 277.3 | 263.6 | -5.0% | 36.0% | ||||
| Bonds issued | 289.2 | 294.4 | 305.7 | 3.8% | 5.7% | ||||
| Borrowings from development entities | 35.1 | 32.0 | 34.3 | 7.2% | -2.1% | ||||
| Total interest expenses on financial obligations | 574.2 | 688.0 | 699.4 | 1.7% | 21.8% | ||||
| Total interest expense | 1,847.3 | 2,054.4 | 2,112.8 | 2.8% | 14.4% | ||||
| Net interest income | 2,752.0 | 2,831.3 | 2,829.3 | -0.1% | 2.8% | ||||
| 12 | |
| Report of 3Q2019 consolidated results Information reported in Ps billions and under IFRS |
Our net interest income increased by 2.8% to Ps 2,829.3 billion for 3Q19 versus 3Q18 and slightly decreased 0.1% versus 2Q19. The increase versus 3Q18 was derived from a 7.5% increase in total interest income that was partially offset by a 14.4% increase in total interest expense.
Our Net Interest Margin(1)was 5.7% for 3Q19, 5.9% in 2Q19 and 5.8% in 3Q18. Net Interest Margin on Loans was 6.4% for 3Q19, 6.6% in 2Q19, and 6.8% in 3Q18. On the other hand, our Net Investments Margin was 2.3% in 3Q19 and 2Q19 and 0.8% in 3Q18.
In our Colombian operations, our Net Interest Margin was 5.3% for 3Q19, 5,4% for 2Q19, and 5.5% for 3Q18. Net Interest Margin on Loans was 5.9% for 3Q19, 6.2% in 2Q19 and 6.5% in 3Q18. On the other hand, our Net Investments Margin was 2.2% in 3Q19 versus 2.0% in 2Q19 and 0.7% in 3Q18.
In our Central American operations, our Net Interest Margin was 6.6% for 3Q19, 6.9% in 2Q19 and 6.5% in 3Q18. Net Interest Margin on Loans was 7.3% for 3Q19, 7.5% in 2Q19 and 7.4% in 3Q18. On the other hand, our Net Investments Margin was 2.4% in 3Q19 versus 3.0% in 2Q19 and 1.1% in 3Q18.
2. Impairment loss on financial assets, net
Our impairment loss on financial assets, net increased by 16.5% to Ps 1,088.8 billion for 3Q19 versus 3Q18 and increased 19.5% versus 2Q19.
| Net impairment loss on financial assets | 3Q18 | 2Q19 | 3Q19 | D | |||||
| 3Q19 vs. 2Q19 | 3Q19 vs. 3Q18 | ||||||||
| Loans and other accounts receivable | 1,013.9 | 1,040.9 | 1,189.3 | 14.3% | 17.3% | ||||
| Other financial assets | 3.9 | (33.2) | 1.3 | -104.0% | -66.3% | ||||
| Recovery of charged-off financial assets | (83.4) | (96.6) | (101.8) | 5.4% | 22.1% | ||||
| Net impairment loss on financial assets | 934.4 | 911.1 | 1,088.8 | 19.5% | 16.5% | ||||
Our annualized gross cost of risk was 2.7% for 3Q19, 2.5% for 2Q19 and 3Q18. Net of recoveries of charged-off assets our ratio was 2.5% for 3Q19, 2.2% for 2Q19 and 2.3% for 3Q18.
| (1) | Grupo Aval’s NIM without income from trading securities and investment in debt securities designated at fair value through profit and loss (non compliant with SPPI test) was 5.6% for 3Q19, 5.7% for 2Q19 and 5.9% for 3Q18. |
| 13 | |
| Report of 3Q2019 consolidated results Information reported in Ps billions and under IFRS |
3. Non-interest income
| Total non-interest income | 3Q18 | 2Q19 | 3Q19 | D | |||||
| 3Q19 vs. 2Q19 | 3Q19 vs. 3Q18 | ||||||||
| Income from commissions and fees | |||||||||
| Banking fees | 975.8 | 1,075.1 | 1,112.6 | 3.5% | 14.0% | ||||
| Trust activities | 77.3 | 84.4 | 87.1 | 3.3% | 12.8% | ||||
| Pension and severance fund management | 244.1 | 301.0 | 279.6 | -7.1% | 14.6% | ||||
| Bonded warehouse services | 38.9 | 40.1 | 39.8 | -0.6% | 2.4% | ||||
| Total income from commissions and fees | 1,336.1 | 1,500.6 | 1,519.2 | 1.2% | 13.7% | ||||
| Expenses from commissions and fees | 142.3 | 153.4 | 164.0 | 6.9% | 15.3% | ||||
| Net income from commissions and fees | 1,193.8 | 1,347.2 | 1,355.2 | 0.6% | 13.5% | ||||
| Income from sales of goods and services | 2,465.2 | 2,077.9 | 2,381.0 | 14.6% | -3.4% | ||||
| Costs and expenses from sales of goods and services | 1,492.9 | 1,478.1 | 1,719.5 | 16.3% | 15.2% | ||||
| Net income from sales of goods and services | 972.3 | 599.7 | 661.5 | 10.3% | -32.0% | ||||
| Net trading income | 109.5 | 208.6 | 481.3 | 130.8% | N.A. | ||||
| Net income from other financial instruments mandatory at FVTPL | 50.2 | 53.4 | 55.2 | 3.4% | 10.1% | ||||
| Other income | |||||||||
| Foreign exchange gains (losses), net | 106.0 | 16.6 | (207.8) | N.A | N.A | ||||
| Net gain on sale of investments and OCI realization | 5.9 | 65.1 | 118.9 | 82.5% | N.A. | ||||
| Gain on the sale of non-current assets held for sale | 8.3 | 6.6 | 5.6 | -14.9% | -32.4% | ||||
| Income from non-consolidated investments(2) | 58.9 | 65.9 | 68.3 | 3.6% | 15.9% | ||||
| Net gains on asset valuations | 2.2 | (7.3) | 4.8 | -164.8% | 115.1% | ||||
| Other income from operations | 116.2 | 119.2 | 115.1 | -3.4% | -0.9% | ||||
| Total other income | 297.6 | 266.1 | 104.8 | -60.6% | -64.8% | ||||
| Total non-interest income | 2,623.3 | 2,475.0 | 2,658.0 | 7.4% | 1.3% | ||||
| (1) | Includes commissions on banking services, office network services, credit and debit card fees, fees on drafts, checks and checkbooks and other fees |
| (2) | Includes share of profit of equity accounted investees, net of tax, and dividend income. |
3.1 Net income from commissions and fees
Net Income from commissions and fees increased by 13.5% to Ps 1,355.2 billion for 3Q19 versus 3Q18 and increased 0.6% in the quarter. Income from commissions and fees increased by 13.7% to Ps 1,519.2 billion in 3Q19 versus 3Q18 and increased 1.2% in the quarter. Excluding FX, net income from commissions increased 7.6% and decreased 0.7%, respectively. In Colombia, net income from commissions and fees increased by 10.3% over the last year and decreased 1.0% over the quarter. In Central America, net income from commissions and fees increased by 17.8% over the last year and 2.6% over the quarter; excluding FX, net income increased by 4.4% over the last year and decreased 0.3% during the quarter.
3.2 Net income from sales of goods and services
Net income from sales of goods and services (non-financial sector) decreased by 32.0% to Ps 661.5 billion for 3Q19 versus 3Q18 and increased 10.3% during the quarter.
| 14 | |
| Report of 3Q2019 consolidated results Information reported in Ps billions and under IFRS |
3.3 Net trading income
| Net trading income | 3Q18 | 2Q19 | 3Q19 | D | |||||
| 3Q19 vs. 2Q19 | 3Q19 vs. 3Q18 | ||||||||
| Trading investment income | 44.5 | 152.3 | 153.0 | 0.5% | N.A. | ||||
| Net income (loss) on financial derivatives | 24.9 | 31.4 | 250.1 | N.A. | N.A. | ||||
| Other trading income on derivatives | 40.0 | 24.9 | 78.2 | N.A. | 95.3% | ||||
| Net trading income | 109.5 | 208.6 | 481.3 | 130.8% | N.A. | ||||
Net trading income for Grupo Aval should be analyzed in conjunction with the foreign exchange gains (losses).
3.4 Other income
Total other income for 3Q19 totaled Ps 104.8 billion decreasing by 64.8% versus 3Q18 and decreasing 60.6% versus 2Q19. The yearly and quarterly decreases were mainly driven by less income from foreign exchange losses.
4. Other expenses
Total other expenses for 3Q19 totaled Ps 2,626.0 billion increasing by 17.4% versus 3Q18 and 9.0% versus 2Q19. Our efficiency ratio measured as total other expenses to total income was 47.9% in 3Q19, 45.4% in 2Q19 and 41.6% in 3Q18. The ratio of annualized total other expenses as a percentage of average total assets was 3.9% in 3Q19, 3.7% in 2Q19 and 3.8% in 3Q18.
In Colombia, our efficiency ratio measured as total other expenses to total income, was 43.7% in 3Q19, 40.3% in 2Q19 and 36.8% in 3Q18. The ratio of annualized total other expenses as a percentage of average total assets was 3.4% in 3Q19, 3.2% in 2Q19 and 3.3% in 3Q18.
In Central America, our efficiency ratio measured as total other expenses to total income, was 56.1% in 3Q19, 56.5% in 2Q19 and 53.4% in 3Q18. The ratio of annualized total other expenses as a percentage of average total assets was 5.1% in 3Q19, 4.9% in 2Q19 and 4.8% in 3Q18.
5. Non-controlling Interest
Non-controlling interest in Grupo Aval reflects: (i) the minority stakes that third party shareholders hold in each of its direct consolidated subsidiaries (Banco de Bogotá, Banco de Occidente, Banco Popular, Banco AV Villas and Corficolombiana), and (ii) the minority stakes that third party shareholders hold in the consolidated subsidiaries at the bank level (mainly Porvenir). For 3Q19, non-controlling interest in the income statement was Ps 582.8 billion, showing a 13.1% decrease versus 3Q18 and a decrease of 0.6% versus 2Q19. The ratio of non-controlling interest to income before non-controlling interest was 44.0% in 3Q19, 41.9% in 2Q19 and 46.1% in 3Q18.
| 15 | |
| Report of 3Q2019 consolidated results Information reported in Ps billions and under IFRS |
Information related to Grupo Aval’s consolidated financial statements by geography
Grupo Aval Acciones y Valores S.A. - Colombian Operation
Financial Statements Under Full IFRS
Information in Ps. Billions
| 3Q18 | 2Q19 | 3Q19 | D | |||||||
| 3Q19 vs. 2Q19 | 3Q19 vs. 3Q18 | |||||||||
| Gross loans and receivables | 114,618.1 | 119,077.9 | 122,115.4 | 2.6% | 6.5% | |||||
| Total assets | 171,956.3 | 186,697.0 | 188,873.0 | 1.2% | 9.8% | |||||
| Customer deposits | 107,969.4 | 115,050.4 | 117,670.2 | 2.3% | 9.0% | |||||
| Total liabilities | 155,595.7 | 169,577.4 | 171,479.7 | 1.1% | 10.2% | |||||
| Net income for the period | 1,163.2 | 1,090.7 | 996.0 | -8.7% | -14.4% | |||||
| Net income attributable to owners of the parent | 583.4 | 600.8 | 516.4 | -14.1% | -11.5% | |||||
| YTD 2018 | YTD 2019 | D | ||||||||
| 2019 vs. 2018 | ||||||||||
| Net income for the period | 2,688.2 | 3,146.6 | 17.1% | |||||||
| A | Net income attributable to owners of the parent | 1,474.0 | 1,676.1 | 13.7% | ||||||
Leasing Bogotá Panamá S.A.(1)
Financial Statements Under IFRS
Information in Ps. Billions
| 3Q18 | 2Q19 | 3Q19 | D | |||||||
| 3Q19 vs. 2Q19 | 3Q19 vs. 3Q18 | |||||||||
| Gross loans and receivables | 47,198.6 | 51,575.3 | 57,136.6 | 10.8% | 21.1% | |||||
| Total assets | 69,530.7 | 77,979.1 | 84,974.3 | 9.0% | 22.2% | |||||
| Customer deposits | 45,219.1 | 50,950.4 | 56,377.8 | 10.7% | 24.7% | |||||
| Total liabilities | 57,985.0 | 64,495.7 | 70,004.8 | 8.5% | 20.7% | |||||
| Net income for the period | 289.9 | 309.0 | 330.0 | 6.8% | 13.8% | |||||
| Net income attributable to owners of the parent | 199.3 | 212.4 | 226.8 | 6.8% | 13.8% | |||||
| YTD 2018 | YTD 2019 | D | ||||||||
| 2019 vs. 2018 | ||||||||||
| Net income for the period | 855.5 | 935.7 | 9.4% | |||||||
| B | Net income attributable to owners of the parent | 588.0 | 643.1 | 9.4% | ||||||
| A+B | Net income attributable to owners of the parent | 2,062.0 | 2,319.3 | 12.5% | ||||||
(1) Leasing Bogotá Panamá is the holding company that consolidates our Central American operations.
| 16 | |
| Report of 3Q2019 consolidated results Information reported in Ps billions and under IFRS |
Information related to Grupo Aval Acciones y Valores S.A. (Holding Company) and GrupoAval Limited
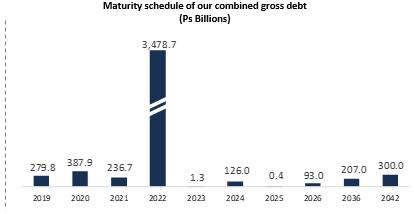
The holding company recorded a total gross indebtedness of Ps 1,662.4 billion (Ps 553.0 billion of bank debt and Ps 1,109.4 billion of bonds denominated in Colombian pesos) as of September 30th, 2019. It also guarantees irrevocably and unconditionally Grupo Aval Limited’s (144A / Reg S) 2022 (USD 1.0 billion) bonds under its respective indentures. As of September 30th, 2019 the total amount outstanding (including interests payable) of such bonds was USD 1.0 billion, or Ps 3,479.3 billion when translated into pesos.
The debt at Grupo Aval Limited is serviced with interest income on loans to subsidiaries and cash & cash equivalents. Grupo Aval Limited has not required, to this date, cash from Grupo Aval Acciones y Valores S.A. to fulfill its obligations. The main sources of cash to pay the debt and debt service at Grupo Aval Acciones y Valores S.A. have been the dividend income from its subsidiaries and the returns on its cash & cash equivalents.
When combined, Grupo Aval Acciones y Valores S.A. and Grupo Aval Ltd. had Ps 1,588.4 billion of total liquid assets, a total gross indebtedness of Ps 5,120.2 billion and a net indebtedness (including callable senior loans to subsidiaries) of Ps 3,531.8 billion as of September 30th, 2019. In addition to liquid assets, Grupo Aval Ltd. has Ps 1,489.5 billion in other loans to subsidiaries.
| Total liquid assets as of September 30, 2019 | |
| Cash and cash equivalents | 783.7 |
| Fixed income investments | 147.4 |
| Callable Senior loans to subsidiaries | 657.2 |
| Total liquid assets | 1,588.4 |
 |
As of September 30th, 2019 our combined double leverage (calculated as investments in subsidiaries at book value, subordinated loans to subsidiaries and goodwill as a percentage of shareholders' equity) was 1.14x. Finally, we present an evolution of our key ratios on a combined basis:
| Debt service coverage and leverage ratios | 3Q18 | 2Q19 | 3Q19 | D | |||||
| 3Q19 vs. 2Q19 | 3Q19 vs. 3Q18 | ||||||||
| Double leverage (1) | 1.15x | 1.14x | 1.14x | 0.00 | -0.01 | ||||
| Net debt / Core earnings (2)(3) | 2.9x | 2.7x | 2.7x | 0.1 | -0.1 | ||||
| Net debt / Cash dividends (2)(3) | 3.5x | 3.0x | 3.2x | 0.2 | -0.3 | ||||
| Core Earnings / Interest Expense (2) | 5.1x | 5.5x | 5.5x | 0.0 | 0.4 | ||||
(1) Double leverage is calculated as investments in subsidiaries at book value (excluding revaluations), subordinated loans to subsidiaries and goodwill as a percentage of shareholders' equity; (2) Core earnings are defined as annualized recurring cash flow from dividends, investments and net operating income; (3) Net debt is calculated as total gross debt minus cash and cash equivalents and fixed income investments
| 17 | |
| Report of 3Q2019 consolidated results Information reported in Ps billions and under IFRS |
Recent Developments
On October 31st, 2019, Grupo Aval announced that it had entered into an agreement to acquire Multi Financial Group (MFG), holding of Multibank Panama. As of June 30, 2019, MFG had consolidated assets of approximately USD 5 billion and a total shareholders’ equity of USD 560 million.
The price offered to acquire 100% of the MFG was 1.3x total shareholders’ equity, and the transaction is expected to close in the second quarter of 2020 after the required regulatory approval process is completed.
This transaction represents an important step in strengthening of Grupo Aval’s presence in Central America. The Group will become the second largest player in terms of assets in Panama, with a market share of 10.7%.
Through this acquisition Grupo Aval will add to its Balance Sheet approximately USD 3.4 billion in loan portfolio and USD 2.9 billion in deposits. In the last twelve months ended June 30, 2019, MFG's income amounted to approximately USD 60 million. As of June 2019 BAC Credomatic held a USD 16.0 billion loan portfolio and USD 16.0 billion of deposits.
This acquisition brings a complementary base of customers, strengthens the Group’s product offering and capabilities in Panama, particularly in commercial and corporate segments. After the transaction, Grupo Aval’s loan exposure will be approximately 13% to Panama and 35% to Central America.
| 18 | |
| Report of 3Q2019 consolidated results Information reported in Ps billions and under IFRS |
ABOUT GRUPO AVAL
Grupo Aval is Colombia’s largest banking group, and through our BAC Credomatic operations it is also the largest and the most profitable banking group in Central America. Grupo Aval currently operates through four commercial banks in Colombia (Banco de Bogotá, Banco de Occidente, Banco Popular and Banco AV Villas). It manages pension and severance funds through the largest pension and severance fund manager in Colombia (Porvenir) and owns the largest merchant bank in Colombia (Corficolombiana), each of which Aval controls and consolidates into its results.
Investor Relations Contact
Alejo Sánchez García
Financial Planning and Investor Relations Manager
Tel: +571 241 9700 x23422
E-mail:asanchez@grupoaval.com
| 19 | |
| Report of 3Q2019 consolidated results Information reported in Ps billions and under IFRS |
Grupo Aval Acciones y Valores S.A.
Consolidated Financial Statements Under IFRS
Financial Statements Under IFRS
Information in Ps. Billions
| Consolidated Statement of Financial Position | 3Q18 | 2Q19 | 3Q19 | D | |||||
| 3Q19 vs. 2Q19 | 3Q19 vs. 3Q18 | ||||||||
| Cash and cash equivalents | 24,396.8 | 29,824.7 | 27,332.7 | -8.4% | 12.0% | ||||
| Investment and trading assets | |||||||||
| Debt securities | 2,467.3 | 4,011.4 | 5,351.7 | 33.4% | 116.9% | ||||
| Equity securities | 2,318.2 | 3,157.1 | 3,291.2 | 4.2% | 42.0% | ||||
| Derivative assets | 605.6 | 533.5 | 655.4 | 22.9% | 8.2% | ||||
| Trading assets | 5,391.2 | 7,702.0 | 9,298.4 | 20.7% | 72.5% | ||||
| Investments in debt securities at FVTPL (non compliant with SPPI test) | - | 25.1 | 35.8 | 42.8% | N.A | ||||
| Equity securities at FVOCI | 1,212.9 | 1,276.0 | 1,313.3 | 2.9% | 8.3% | ||||
| Investments in securities at FVOCI | 21,083.2 | 21,306.6 | 21,463.6 | 0.7% | 1.8% | ||||
| Investments in debt securities at AC | 2,999.4 | 2,984.5 | 3,051.1 | 2.2% | 1.7% | ||||
| Investment securities | 24,082.5 | 24,316.2 | 24,550.6 | 1.0% | 1.9% | ||||
| Hedging derivatives assets | 85.6 | 44.4 | 27.8 | -37.3% | -67.5% | ||||
| Loans and receivables | |||||||||
| Commercial loans and leases | 95,608.7 | 98,599.4 | 103,240.2 | 4.7% | 8.0% | ||||
| Commercial loans and leases | 91,648.3 | 94,475.8 | 99,107.2 | 4.9% | 8.1% | ||||
| Interbank & overnight funds | 3,960.3 | 4,123.6 | 4,133.1 | 0.2% | 4.4% | ||||
| Consumer loans and leases | 52,504.9 | 56,705.3 | 59,306.0 | 4.6% | 13.0% | ||||
| Mortgages and housing leases | 17,244.0 | 19,060.8 | 20,425.3 | 7.2% | 18.4% | ||||
| Microcredit loans and leases | 419.5 | 411.3 | 413.5 | 0.5% | -1.4% | ||||
| Total loans and leases | 165,777.0 | 174,776.8 | 183,385.1 | 4.9% | 10.6% | ||||
| Loss allowance | (7,511.9) | (8,375.5) | (8,955.3) | 6.9% | 19.2% | ||||
| Total loans and receivables, net | 158,265.1 | 166,401.3 | 174,429.7 | 4.8% | 10.2% | ||||
| Other accounts receivable, net | 7,644.7 | 10,343.5 | 10,827.4 | 4.7% | 41.6% | ||||
| Non-current assets held for sale | 102.3 | 104.9 | 98.6 | -6.1% | -3.6% | ||||
| Investments in associates and joint ventures | 1,048.5 | 937.3 | 990.3 | 5.6% | -5.6% | ||||
| Own-use property, plant and equipment for own-use and given in operating lease, net | 5,573.0 | 5,711.0 | 5,786.4 | 1.3% | 3.8% | ||||
| Right-of-use assets | - | 2,132.1 | 2,176.0 | 2.1% | N.A | ||||
| Investment properties | 812.9 | 924.6 | 945.2 | 2.2% | 16.3% | ||||
| Biological assets | 79.3 | 95.7 | 102.8 | 7.4% | 29.6% | ||||
| Tangible assets | 6,465.3 | 8,863.4 | 9,010.3 | 1.7% | 39.4% | ||||
| Goodwill | 6,882.5 | 7,249.3 | 7,676.3 | 5.9% | 11.5% | ||||
| Concession arrangement rights | 4,981.0 | 6,429.4 | 6,987.6 | 8.7% | 40.3% | ||||
| Other intangible assets | 974.8 | 1,066.6 | 1,116.4 | 4.7% | 14.5% | ||||
| Intangible assets | 12,838.3 | 14,745.4 | 15,780.4 | 7.0% | 22.9% | ||||
| Current | 518.7 | 797.0 | 704.5 | -11.6% | 35.8% | ||||
| Deferred | 198.6 | 235.8 | 408.4 | 73.2% | 105.7% | ||||
| Income tax assets | 717.3 | 1,032.7 | 1,112.9 | 7.8% | 55.2% | ||||
| Other assets | 449.4 | 360.2 | 388.3 | 7.8% | -13.6% | ||||
| Total assets | 241,487.0 | 264,676.1 | 273,847.3 | 3.5% | 13.4% | ||||
| Trading liabilities | 488.9 | 568.3 | 832.2 | 46.5% | 70.2% | ||||
| Hedging derivatives liabilities | 63.6 | 76.7 | 115.3 | 50.3% | 81.2% | ||||
| Customer deposits | 153,188.5 | 166,000.8 | 174,048.0 | 4.8% | 13.6% | ||||
| Checking accounts | 33,401.4 | 38,290.8 | 39,697.1 | 3.7% | 18.8% | ||||
| Time deposits | 66,265.0 | 71,687.7 | 76,164.2 | 6.2% | 14.9% | ||||
| Savings deposits | 52,925.2 | 55,495.7 | 57,774.6 | 4.1% | 9.2% | ||||
| Other deposits | 596.9 | 526.6 | 412.0 | -21.8% | -31.0% | ||||
| Financial obligations | 48,332.5 | 54,091.2 | 53,486.9 | -1.1% | 10.7% | ||||
| Interbank borrowings and overnight funds | 8,669.9 | 10,416.7 | 5,721.8 | -45.1% | -34.0% | ||||
| Borrowings from banks and others | 17,094.3 | 20,278.7 | 22,633.3 | 11.6% | 32.4% | ||||
| Bonds issued | 19,128.2 | 20,105.5 | 21,457.1 | 6.7% | 12.2% | ||||
| Borrowings from development entities | 3,440.2 | 3,290.4 | 3,674.8 | 11.7% | 6.8% | ||||
| Total financial liabilities at amortized cost | 201,521.0 | 220,092.1 | 227,534.9 | 3.4% | 12.9% | ||||
| Legal related | 171.5 | 112.8 | 135.2 | 19.9% | -21.1% | ||||
| Other provisions | 582.6 | 607.5 | 601.2 | -1.0% | 3.2% | ||||
| Provisions | 754.1 | 720.3 | 736.4 | 2.2% | -2.3% | ||||
| Current | 311.8 | 314.8 | 404.2 | 28.4% | 29.6% | ||||
| Deferred | 2,245.1 | 2,608.6 | 2,513.9 | -3.6% | 12.0% | ||||
| Income tax liabilities | 2,556.8 | 2,923.3 | 2,918.1 | -0.2% | 14.1% | ||||
| Employee benefits | 1,326.0 | 1,151.4 | 1,356.4 | 17.8% | 2.3% | ||||
| Other liabilities | 6,870.2 | 8,541.0 | 7,991.2 | -6.4% | 16.3% | ||||
| Total liabilities | 213,580.8 | 234,073.0 | 241,484.5 | 3.2% | 13.1% | ||||
| Equity attributable to owners of the parent | 16,895.2 | 18,310.6 | 19,314.3 | 5.5% | 14.3% | ||||
| Non-controlling interest | 11,011.0 | 12,292.5 | 13,048.5 | 6.2% | 18.5% | ||||
| Total equity | 27,906.2 | 30,603.1 | 32,362.8 | 5.8% | 16.0% | ||||
| Total liabilities and equity | 241,487.0 | 264,676.1 | 273,847.3 | 3.5% | 13.4% | ||||
| 20 | |
| Report of 3Q2019 consolidated results Information reported in Ps billions and under IFRS |
Grupo Aval Acciones y Valores S.A.
Consolidated Financial Statements Under Full IFRS
Financial Statements Under IFRS
Information in Ps. Billions
| Consolidated Statement of income | YTD 2018 | YTD 2019 | D | 3Q18 | 2Q19 | 3Q19 | D | ||||||||
| 2019 vs. 2018 | 3Q19 vs. 2Q19 | 3Q19 vs. 3Q18 | |||||||||||||
| Interest income | |||||||||||||||
| Loan portfolio | 12,949.3 | 13,682.9 | 5.7% | 4,352.2 | 4,605.7 | 4,678.3 | 1.6% | 7.5% | |||||||
| Interests on investments in debt securities | 715.7 | 814.2 | 13.7% | 247.1 | 280.0 | 263.8 | -5.8% | 6.8% | |||||||
| Total interest income | 13,665.0 | 14,497.1 | 6.1% | 4,599.3 | 4,885.8 | 4,942.1 | 1.2% | 7.5% | |||||||
| Interest expense | |||||||||||||||
| Checking accounts | 253.4 | 315.2 | 24.4% | 81.2 | 103.6 | 108.3 | 4.5% | 33.4% | |||||||
| Time deposits | 2,454.5 | 2,658.4 | 8.3% | 823.8 | 888.5 | 930.9 | 4.8% | 13.0% | |||||||
| Savings deposits | 1,135.3 | 1,110.8 | -2.2% | 368.0 | 374.2 | 374.1 | 0.0% | 1.6% | |||||||
| Total interest expenses on deposits | 3,843.3 | 4,084.4 | 6.3% | 1,273.1 | 1,366.4 | 1,413.4 | 3.4% | 11.0% | |||||||
| Interbank borrowings and overnight funds | 177.3 | 257.8 | 45.4% | 56.2 | 84.3 | 95.9 | 13.8% | 70.7% | |||||||
| Borrowings from banks and others | 555.0 | 775.4 | 39.7% | 193.8 | 277.3 | 263.6 | -5.0% | 36.0% | |||||||
| Bonds issued | 867.8 | 887.6 | 2.3% | 289.2 | 294.4 | 305.7 | 3.8% | 5.7% | |||||||
| Borrowings from development entities | 106.8 | 101.7 | -4.8% | 35.1 | 32.0 | 34.3 | 7.2% | -2.1% | |||||||
| Total interest expenses on financial obligations | 1,706.9 | 2,022.5 | 18.5% | 574.2 | 688.0 | 699.4 | 1.7% | 21.8% | |||||||
| Total interest expense | 5,550.2 | 6,106.9 | 10.0% | 1,847.3 | 2,054.4 | 2,112.8 | 2.8% | 14.4% | |||||||
| Net interest income | 8,114.8 | 8,390.1 | 3.4% | 2,752.0 | 2,831.3 | 2,829.3 | -0.1% | 2.8% | |||||||
| Impairment losses (recoveries) on financial assets | |||||||||||||||
| Loans and other accounts receivable | 2,790.2 | 3,163.4 | 13.4% | 1,013.9 | 1,040.9 | 1,189.3 | 14.3% | 17.3% | |||||||
| Other financial assets | (54.8) | (54.8) | -0.2% | 3.9 | (33.2) | 1.3 | -104.0% | -66.3% | |||||||
| Recovery of charged-off financial assets | (238.4) | (275.6) | 15.6% | (83.4) | (96.6) | (101.8) | 5.4% | 22.1% | |||||||
| Net impairment loss on financial assets | 2,497.0 | 2,833.0 | 13.5% | 934.4 | 911.1 | 1,088.8 | 19.5% | 16.5% | |||||||
| Net interest income, after impairment losses | 5,617.9 | 5,557.1 | -1.1% | 1,817.6 | 1,920.2 | 1,740.5 | -9.4% | -4.2% | |||||||
| Income from commissions and fees | |||||||||||||||
| Banking fees(1) | 2,914.1 | 3,215.7 | 10.4% | 975.8 | 1,075.1 | 1,112.6 | 3.5% | 14.0% | |||||||
| Trust activities | 231.5 | 252.2 | 8.9% | 77.3 | 84.4 | 87.1 | 3.3% | 12.8% | |||||||
| Pension and severance fund management | 732.9 | 836.2 | 14.1% | 244.1 | 301.0 | 279.6 | -7.1% | 14.6% | |||||||
| Bonded warehouse services | 115.2 | 120.9 | 4.9% | 38.9 | 40.1 | 39.8 | -0.6% | 2.4% | |||||||
| Total income from commissions and fees | 3,993.7 | 4,425.0 | 10.8% | 1,336.1 | 1,500.6 | 1,519.2 | 1.2% | 13.7% | |||||||
| Expenses from commissions and fees | 450.7 | 463.6 | 2.9% | 142.3 | 153.4 | 164.0 | 6.9% | 15.3% | |||||||
| Net income from commissions and fees | 3,543.0 | 3,961.4 | 11.8% | 1,193.8 | 1,347.2 | 1,355.2 | 0.6% | 13.5% | |||||||
| Income from sales of goods and services | 5,297.0 | 6,382.3 | 20.5% | 2,465.2 | 2,077.9 | 2,381.0 | 14.6% | -3.4% | |||||||
| Costs and expenses from sales of goods and services | 3,859.8 | 4,546.5 | 17.8% | 1,492.9 | 1,478.1 | 1,719.5 | 16.3% | 15.2% | |||||||
| Net income from sales of goods and services | 1,437.1 | 1,835.8 | 27.7% | 972.3 | 599.7 | 661.5 | 10.3% | -32.0% | |||||||
| Net trading income | 263.8 | 798.1 | N.A. | 109.5 | 208.6 | 481.3 | 130.8% | N.A. | |||||||
| Net income from other financial instruments mandatory at FVTPL | 177.2 | 162.4 | -8.4% | 50.2 | 53.4 | 55.2 | 3.4% | 10.1% | |||||||
| Other income | |||||||||||||||
| Foreign exchange gains (losses), net | 371.3 | (25.2) | -106.8% | 106.0 | 16.6 | (207.8) | N.A | N.A | |||||||
| Net gain on sale of investments and OCI realization | (14.0) | 189.9 | N.A | 5.9 | 65.1 | 118.9 | 82.5% | N.A. | |||||||
| Gain on the sale of non-current assets held for sale | 14.5 | 18.2 | 25.7% | 8.3 | 6.6 | 5.6 | -14.9% | -32.4% | |||||||
| Income from non-consolidated investments(2) | 203.6 | 257.4 | 26.4% | 58.9 | 65.9 | 68.3 | 3.6% | 15.9% | |||||||
| Net gains on asset valuations | 10.0 | 2.0 | -80.3% | 2.2 | (7.3) | 4.8 | -164.8% | 115.1% | |||||||
| Other income from operations | 272.4 | 314.4 | 15.4% | 116.2 | 119.2 | 115.1 | -3.4% | -0.9% | |||||||
| Total other income | 857.9 | 756.8 | -11.8% | 297.6 | 266.1 | 104.8 | -60.6% | -64.8% | |||||||
| Other expenses | |||||||||||||||
| Loss on the sale of non-current assets held for sale | 2.8 | 3.6 | 28.4% | 0.8 | 0.7 | 1.3 | 87.1% | 70.1% | |||||||
| Personnel expenses | 2,831.4 | 3,023.9 | 6.8% | 946.8 | �� | 997.1 | 1,061.6 | 6.5% | 12.1% | ||||||
| General and administrative expenses | 3,333.9 | 3,529.7 | 5.9% | 1,109.8 | 1,149.3 | 1,293.9 | 12.6% | 16.6% | |||||||
| Depreciation and amortization | 398.1 | 671.7 | 68.7% | 137.8 | 231.9 | 231.8 | 0.0% | 68.3% | |||||||
| Impairment loss on other assets | 17.7 | 19.5 | 10.3% | 5.5 | 15.4 | 0.4 | -97.4% | -92.7% | |||||||
| Other operating expenses | 93.6 | 73.2 | -21.8% | 36.2 | 14.8 | 36.9 | 149.2% | 1.9% | |||||||
| Total other expenses | 6,677.5 | 7,321.6 | 9.6% | 2,236.8 | 2,409.2 | 2,626.0 | 9.0% | 17.4% | |||||||
| Net income before income tax expense | 5,219.4 | 5,749.8 | 10.2% | 2,204.0 | 1,986.1 | 1,772.5 | -10.8% | -19.6% | |||||||
| Income tax expense | 1,675.7 | 1,667.5 | -0.5% | 750.8 | 586.4 | 446.5 | -23.9% | -40.5% | |||||||
| Net income for the period | 3,543.8 | 4,082.3 | 15.2% | 1,453.2 | 1,399.7 | 1,326.0 | -5.3% | -8.7% | |||||||
| Net income for the period attibutable to: | |||||||||||||||
| Non-controlling interest | 1,481.8 | 1,763.1 | 19.0% | 670.4 | 586.5 | 582.8 | -0.6% | -13.1% | |||||||
| Net income attributable to owners of the parent | 2,062.0 | 2,319.3 | 12.5% | 782.7 | 813.2 | 743.2 | -8.6% | -5.0% | |||||||
| (1) | Includes commissions on banking services, office network services, credit and debit card fees, fees on drafts, checks and checkbooks and other fees |
| (2) | Includes share of profit of equity accounted investees, net of tax, and dividend income. |
| 21 | |
Item 2

1 IFRS 3Q19 Consolidated Earnings Results
2 Disclaimer Grupo Aval Acciones y Valores S . A . (“Grupo Aval”) is an issuer of securities in Colombia and in the United States, registered with Colombia’s National Registry of Shares and Issuers ( Registro Nacional de Valores y Emisores ) and the United States Securities and Exchange Commission (“SEC”) . As such, it is subject to compliance with securities regulation in Colombia and applicable U . S . securities regulation . All of our banking subsidiaries (Banco de Bogotá, Banco de Occidente , Banco Popular and Banco AV Villas), Porvenir and Corficolombiana , are subject to inspection and supervision as financial institutions by the Superintendency of Finance . Grupo Aval is now also subject to the inspection and supervision of the Superintendency of Finance as a result of Law 1870 of 2017 , also known as Law of Financial Conglomerates, which came in effect on February 6 , 2019 . Grupo Aval, as the holding company of its financial conglomerate is responsible for the compliance with capital adequacy requirements, corporate governance standards, risk management and internal control and criteria for identifying, managing and revealing conflicts of interest, applicable to its financial conglomerate . The consolidated financial information included in this document is presented in accordance with IFRS as currently issued by the IASB . Details of the calculations of non - GAAP measures such as ROAA and ROAE, among others, are explained when required in this report . Grupo Aval has adopted IFRS 16 retrospectively from January 1 , 2019 but has not restated comparatives for the 2018 reporting period, as permitted under the specific transitional provisions in the standard . The reclassifications and the adjustments arising from the new leasing rules are therefore recognized in the opening Condensed Consolidated Statement of Financial Position on January 1 , 2019 . Consequently, quarterly results for 2019 are not fully comparable to previous periods . IFRS 16 introduced a single, on - balance sheet accounting model for lessees . As a result, Grupo Aval, as a lessee, has recognized right - of - use assets representing its rights to use the underlying assets and lease liabilities representing its obligation to make lease payments . Lessor accounting remains similar to previous accounting policies . Assets and liabilities arising from a lease are initially measured on a present value basis . The lease payments are discounted using the interest rate implicit in the lease, if that rate can be determined, or the group’s incremental borrowing rate . This report includes forward - looking statements . In some cases, you can identify these forward - looking statements by words such as “may,” “will,” “should,” “expects,” “plans,” “anticipates,” “believes,” “estimates,” “predicts,” “potential,” or “continue,” or the negative of these and other comparable words . Actual results and events may differ materially from those anticipated herein as a consequence of changes in general, economic and business conditions, changes in interest and currency rates and other risk described from time to time in our filings with the Registro Nacional de Valores y Emisores and the SEC . Recipients of this document are responsible for the assessment and use of the information provided herein . Matters described in this presentation and our knowledge of them may change extensively and materially over time but we expressly disclaim any obligation to review, update or correct the information provided in this report, including any forward looking statements, and do not intend to provide any update for such material developments prior to our next earnings report . The content of this document and the figures included herein are intended to provide a summary of the subjects discussed rather than a comprehensive description . When applicable, in this document we refer to billions as thousands of millions .
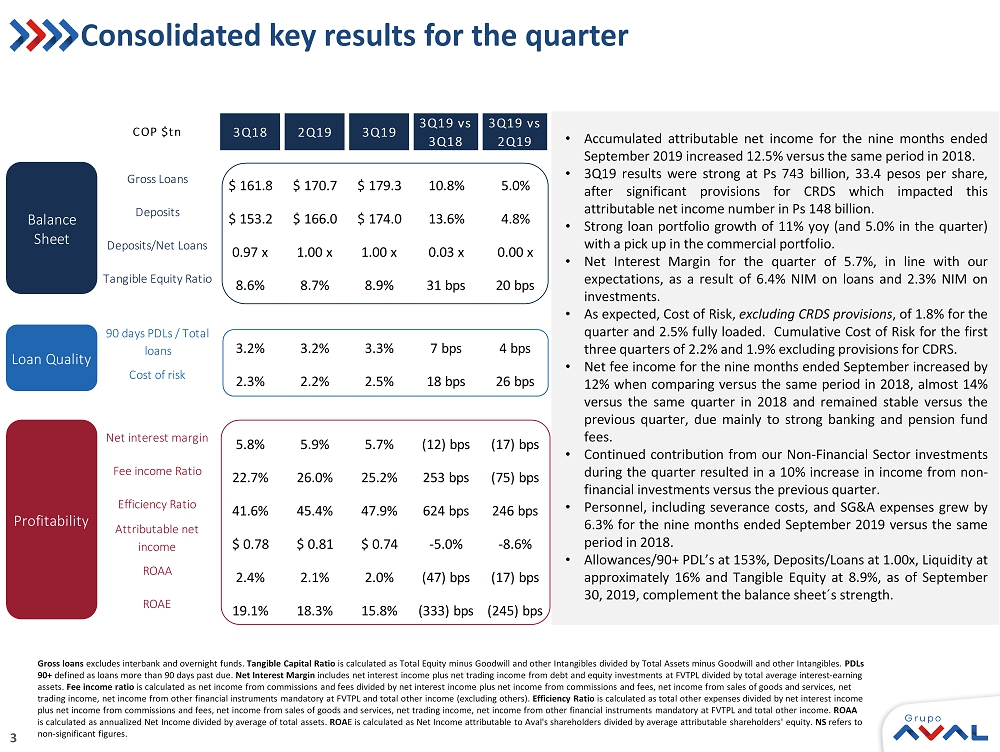
3 Consolidated key results for the quarter Gross loans e xcludes interbank and overnight funds. Tangible Capital Ratio is calculated as Total Equity minus Goodwill and other Intangibles divided by Total Assets minus Goodwill and other Intangibl es. PDLs 90+ defined as loans more than 90 days past due. Net Interest Margin includes net interest income plus net trading income from debt and equity investments at FVTPL divided by total average inter es t - earning assets. Fee income ratio is calculated as net income from commissions and fees divided by net interest income plus net income from commissions and fee s, net income from sales of goods and services, net trading income, net income from other financial instruments mandatory at FVTPL and total other income (excluding others). Efficiency Ratio is calculated as total other expenses divided by net interest income plus net income from commissions and fees, net income from sales of goods and services, net trading income, net income from o the r financial instruments mandatory at FVTPL and total other income. ROAA is calculated as annualized Net Income divided by average of total assets. ROA E is calculated as Net Income attributable to Aval's shareholders divided by average attributable shareholders' equity. NS refers to non - significant figures. COP $tn 3Q18 2Q19 3Q19 3Q19 vs 3Q18 3Q19 vs 2Q19 Gross Loans $ 161.8 $ 170.7 $ 179.3 10.8% 5.0% Deposits $ 153.2 $ 166.0 $ 174.0 13.6% 4.8% Deposits/Net Loans 0.97 x 1.00 x 1.00 x 0.03 x 0.00 x Tangible Equity Ratio 8.6% 8.7% 8.9% 31 bps 20 bps 90 days PDLs / Total loans 3.2% 3.2% 3.3% 7 bps 4 bps Cost of risk 2.3% 2.2% 2.5% 18 bps 26 bps Net interest margin 5.8% 5.9% 5.7% (12) bps (17) bps Fee income Ratio 22.7% 26.0% 25.2% 253 bps (75) bps Efficiency Ratio 41.6% 45.4% 47.9% 624 bps 246 bps Attributable net income $ 0.78 $ 0.81 $ 0.74 -5.0% -8.6% ROAA 2.4% 2.1% 2.0% (47) bps (17) bps ROAE 19.1% 18.3% 15.8% (333) bps (245) bps Balance Sheet Loan Quality Profitability • Accumulated attributable net income for the nine months ended September 2019 increased 12 . 5 % versus the same period in 2018 . • 3 Q 19 results were strong at Ps 743 billion, 33 . 4 pesos per share, after significant provisions for CRDS which impacted this attributable net income number in Ps 148 billion . • Strong loan portfolio growth of 11 % yoy (and 5 . 0 % in the quarter) with a pick up in the commercial portfolio . • Net Interest Margin for the quarter of 5 . 7 % , in line with our expectations, as a result of 6 . 4 % NIM on loans and 2 . 3 % NIM on investments . • As expected, Cost of Risk, excluding CRDS provisions , of 1 . 8 % for the quarter and 2 . 5 % fully loaded . Cumulative Cost of Risk for the first three quarters of 2 . 2 % and 1 . 9 % excluding provisions for CDRS . • Net fee income for the nine months ended September increased by 12 % when comparing versus the same period in 2018 , almost 14 % versus the same quarter in 2018 and remained stable versus the previous quarter, due mainly to strong banking and pension fund fees . • Continued contribution from our Non - Financial Sector investments during the quarter resulted in a 10 % increase in income from non - financial investments versus the previous quarter . • Personnel, including severance costs, and SG&A expenses grew by 6 . 3 % for the nine months ended September 2019 versus the same period in 2018 . • Allowances/ 90 + PDL’s at 153 % , Deposits/Loans at 1 . 00 x, Liquidity at approximately 16 % and Tangible Equity at 8 . 9 % , as of September 30 , 2019 , complement the balance sheet Dz s strength .
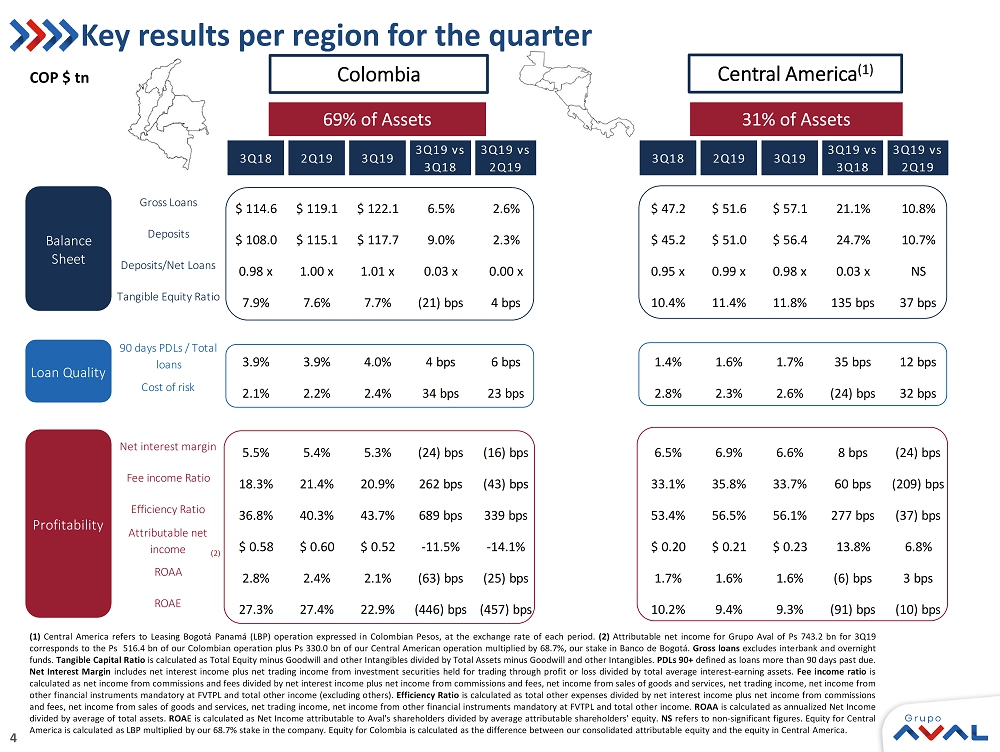
4 Key results per region for the quarter 69% of Assets 31% of Assets COP $ tn ( 1 ) Central America refers to Leasing Bogotá Panamá (LBP) operation expressed in Colombian Pesos, at the exchange rate of each period . ( 2 ) Attributable net income for Grupo Aval of Ps 743 . 2 bn for 3 Q 19 corresponds to the Ps 516 . 4 bn of our Colombian operation plus Ps 330 . 0 bn of our Central American operation multiplied by 68 . 7 % , our stake in Banco de Bogotá . Gross loans e xcludes interbank and overnight funds . Tangible Capital Ratio is calculated as Total Equity minus Goodwill and other Intangibles divided by Total Assets minus Goodwill and other Intangibles . PDLs 90 + defined as loans more than 90 days past due . Net Interest Margin includes net interest income plus net trading income from investment securities held for trading through profit or loss divided by total average interest - earning assets . Fee income ratio is calculated as net income from commissions and fees divided by net interest income plus net income from commissions and fees, net income from sales of goods and services, net trading income, net income from other financial instruments mandatory at FVTPL and total other income (excluding others) . Efficiency Ratio is calculated as total other expenses divided by net interest income plus net income from commissions and fees, net income from sales of goods and services, net trading income, net income from other financial instruments mandatory at FVTPL and total other income . ROAA is calculated as annualized Net Income divided by average of total assets . ROA E is calculated as Net Income attributable to Aval's shareholders divided by average attributable shareholders' equity . NS refers to non - significant figures . Equity for Central America is calculated as LBP multiplied by our 68 . 7 % stake in the company . Equity for Colombia is calculated as the difference between our consolidated attributable equity and the equity in Central America . Colombia Central America (1) (2) 3Q18 2Q19 3Q19 3Q19 vs 3Q18 3Q19 vs 2Q19 3Q18 2Q19 3Q19 3Q19 vs 3Q18 3Q19 vs 2Q19 Gross Loans $ 114.6 $ 119.1 $ 122.1 6.5% 2.6% $ 47.2 $ 51.6 $ 57.1 21.1% 10.8% Deposits $ 108.0 $ 115.1 $ 117.7 9.0% 2.3% $ 45.2 $ 51.0 $ 56.4 24.7% 10.7% Deposits/Net Loans 0.98 x 1.00 x 1.01 x 0.03 x 0.00 x 0.95 x 0.99 x 0.98 x 0.03 x NS Tangible Equity Ratio 7.9% 7.6% 7.7% (21) bps 4 bps 10.4% 11.4% 11.8% 135 bps 37 bps YTD 2018 90 days PDLs / Total loans 3.9% 3.9% 4.0% 4 bps 6 bps 1.4% 1.6% 1.7% 35 bps 12 bps Cost of risk 2.1% 2.2% 2.4% 34 bps 23 bps 2.8% 2.3% 2.6% (24) bps 32 bps Net interest margin 5.5% 5.4% 5.3% (24) bps (16) bps 6.5% 6.9% 6.6% 8 bps (24) bps Fee income Ratio 18.3% 21.4% 20.9% 262 bps (43) bps 33.1% 35.8% 33.7% 60 bps (209) bps Efficiency Ratio 36.8% 40.3% 43.7% 689 bps 339 bps 53.4% 56.5% 56.1% 277 bps (37) bps Attributable net income $ 0.58 $ 0.60 $ 0.52 -11.5% -14.1% $ 0.20 $ 0.21 $ 0.23 13.8% 6.8% ROAA 2.8% 2.4% 2.1% (63) bps (25) bps 1.7% 1.6% 1.6% (6) bps 3 bps ROAE 27.3% 27.4% 22.9% (446) bps (457) bps 10.2% 9.4% 9.3% (91) bps (10) bps Balance Sheet Loan Quality Profitability
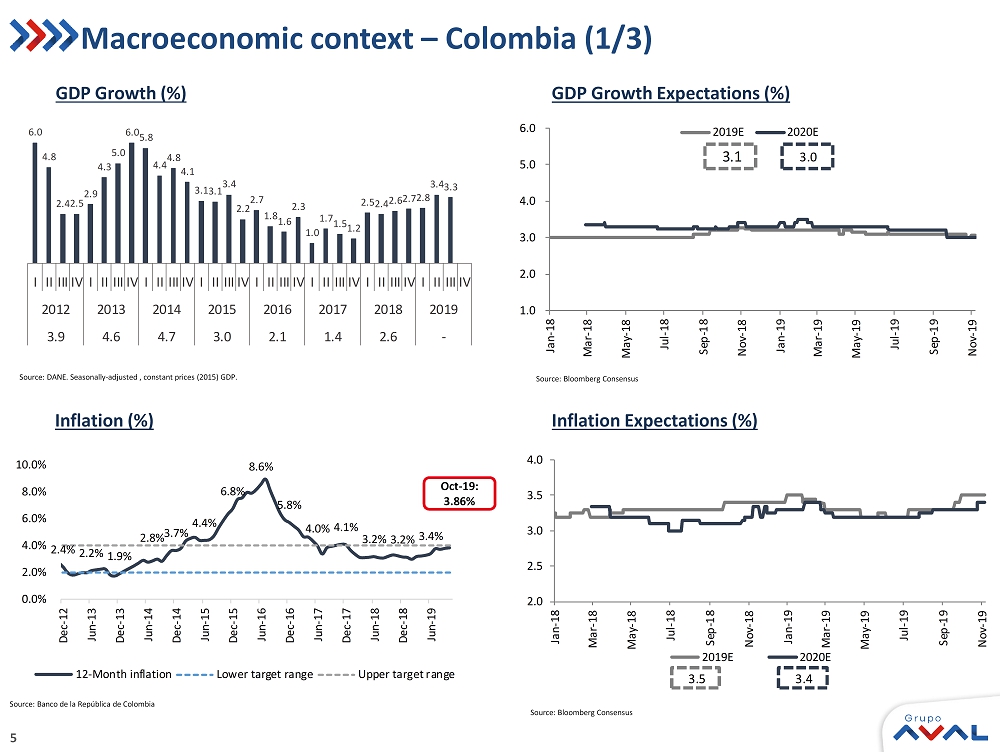
5 1.0 2.0 3.0 4.0 5.0 6.0 Jan-18 Mar-18 May-18 Jul-18 Sep-18 Nov-18 Jan-19 Mar-19 May-19 Jul-19 Sep-19 Nov-19 2019E 2020E 3.1 3.0 GDP Growth Expectations (%) Source: Bloomberg Consensus Inflation Expectations (%) Macroeconomic context – Colombia (1/3) Source: Bloomberg Consensus 2.0 2.5 3.0 3.5 4.0 Jan-18 Mar-18 May-18 Jul-18 Sep-18 Nov-18 Jan-19 Mar-19 May-19 Jul-19 Sep-19 Nov-19 2019E 2020E 3.5 3.4 Inflation (%) Source: Banco de la República de Colombia Oct - 19: 3.86% 2.4% 2.2% 1.9% 2.8% 3.7% 4.4% 6.8% 8.6% 5.8% 4.0% 4.1% 3.2% 3.2% 3.4% 0.0% 2.0% 4.0% 6.0% 8.0% 10.0% Dec-12 Jun-13 Dec-13 Jun-14 Dec-14 Jun-15 Dec-15 Jun-16 Dec-16 Jun-17 Dec-17 Jun-18 Dec-18 Jun-19 12-Month inflation Lower target range Upper target range 6.0 4.8 2.4 2.5 2.9 4.3 5.0 6.0 5.8 4.4 4.8 4.1 3.1 3.1 3.4 2.2 2.7 1.8 1.6 2.3 1.0 1.7 1.5 1.2 2.5 2.4 2.6 2.7 2.8 3.4 3.3 I II III IV I II III IV I II III IV I II III IV I II III IV I II III IV I II III IV I II III IV 2012 2013 2014 2015 2016 2017 2018 2019 3.9 4.6 4.7 3.0 2.1 1.4 2.6 - GDP Growth (%) Source: DANE. Seasonally - adjusted , constant prices (2015) GDP.
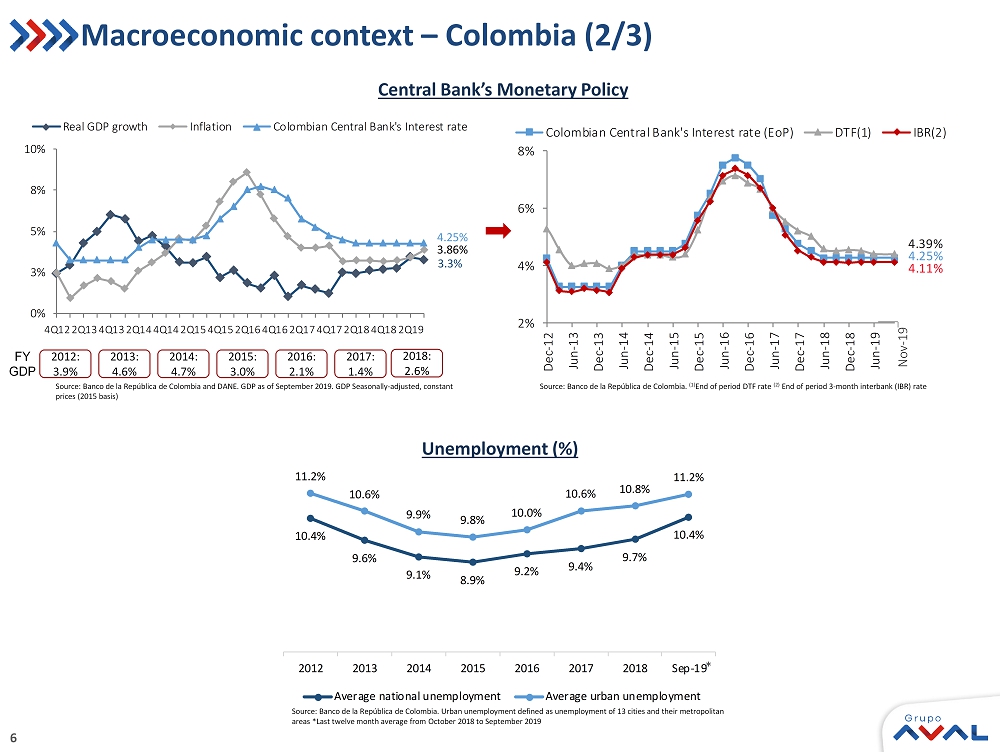
6 0% 3% 5% 8% 10% 4Q12 2Q13 4Q13 2Q14 4Q14 2Q15 4Q15 2Q16 4Q16 2Q17 4Q17 2Q18 4Q18 2Q19 Real GDP growth Inflation Colombian Central Bank's Interest rate 4.25% 3.86% 3.3% 10.4% 9.6% 9.1% 8.9% 9.2% 9.4% 9.7% 10.4% 11.2% 10.6% 9.9% 9.8% 10.0% 10.6% 10.8% 11.2% 2012 2013 2014 2015 2016 2017 2018 Sep-19 Average national unemployment Average urban unemployment 2% 4% 6% 8% Dec-12 Jun-13 Dec-13 Jun-14 Dec-14 Jun-15 Dec-15 Jun-16 Dec-16 Jun-17 Dec-17 Jun-18 Dec-18 Jun-19 Colombian Central Bank's Interest rate (EoP) DTF(1) IBR(2) 4.39% 4.25% 4.11% Central Bank’s Monetary Policy Source: Banco de la República de Colombia. Urban unemployment defined as unemployment of 13 cities and their metropolitan areas *Last twelve month average from October 2018 to September 2019 Source : Banco de la República de Colombia. (1) End of period DTF rate (2) End of period 3 - month interbank (IBR) rate Source: Banco de la República de Colombia and DANE. GDP as of September 2019. GDP Seasonally - adjusted, constant prices (2015 basis) Macroeconomic context – Colombia (2/3) Unemployment (%) 2014: 4.7% 2015: 3.0% 2016: 2.1% 2013: 4.6% 2012: 3.9% FY GDP 2017: 1.4% 2018: 2.6% Nov - 19 *
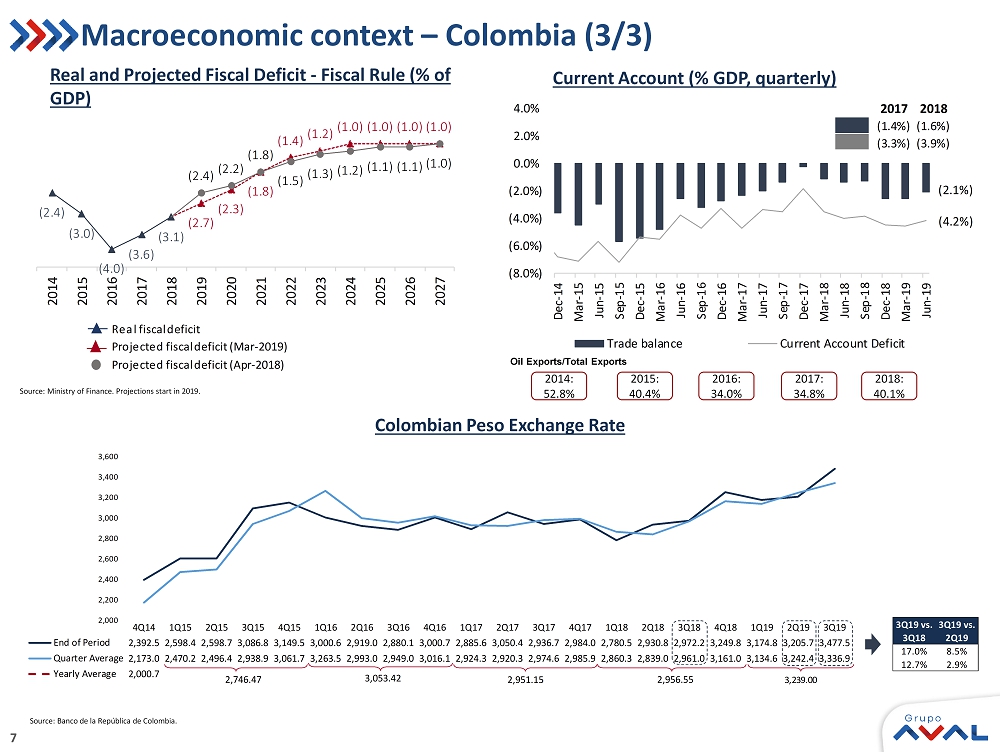
7 (2.4) (3.0) (4.0) (3.6) (3.1) (2.7) (2.3) (1.8) (1.4) (1.2) (1.0) (1.0) (1.0) (1.0) (2.4) (2.2) (1.8) (1.5) (1.3) (1.2) (1.1) (1.1) (1.0) 2014 2015 2016 2017 2018 2019 2020 2021 2022 2023 2024 2025 2026 2027 Real fiscal deficit Projected fiscal deficit (Mar - 2019) Projected fiscal deficit (Apr - 2018) Source : Banco de la República de Colombia. Macroeconomic context – Colombia (3/3) Source: Ministry of Finance. Projections start in 2019. (2.1%) (4.2%) (8.0%) (6.0%) (4.0%) (2.0%) 0.0% 2.0% 4.0% Dec-14 Mar-15 Jun-15 Sep-15 Dec-15 Mar-16 Jun-16 Sep-16 Dec-16 Mar-17 Jun-17 Sep-17 Dec-17 Mar-18 Jun-18 Sep-18 Dec-18 Mar-19 Jun-19 Trade balance Current Account Deficit Current Account (% GDP, quarterly) Real and Projected Fiscal Deficit - Fiscal Rule (% of GDP) Oil Exports/Total Exports Colombian Peso Exchange Rate x x x 4Q14 1Q15 2Q15 3Q15 4Q15 1Q16 2Q16 3Q16 4Q16 1Q17 2Q17 3Q17 4Q17 1Q18 2Q18 3Q18 4Q18 1Q19 2Q19 3Q19 End of Period 2,392.5 2,598.4 2,598.7 3,086.8 3,149.5 3,000.6 2,919.0 2,880.1 3,000.7 2,885.6 3,050.4 2,936.7 2,984.0 2,780.5 2,930.8 2,972.2 3,249.8 3,174.8 3,205.7 3,477.5 Quarter Average 2,173.0 2,470.2 2,496.4 2,938.9 3,061.7 3,263.5 2,993.0 2,949.0 3,016.1 2,924.3 2,920.3 2,974.6 2,985.9 2,860.3 2,839.0 2,961.0 3,161.0 3,134.6 3,242.4 3,336.9 Yearly Average 2,000.7 2,000 2,200 2,400 2,600 2,800 3,000 3,200 3,400 3,600 2,746.47 3,053.42 2,951.15 2,956.55 3,239.00 2014: 52.8% 2015: 40.4% 2016: 34.0% 2017: 34.8% 2018: 40.1% 3Q19 vs. 3Q18 3Q19 vs. 2Q19 17.0% 8.5% 12.7% 2.9% 2017 2018 (1.4%)(1.6%) (3.3%)(3.9%)
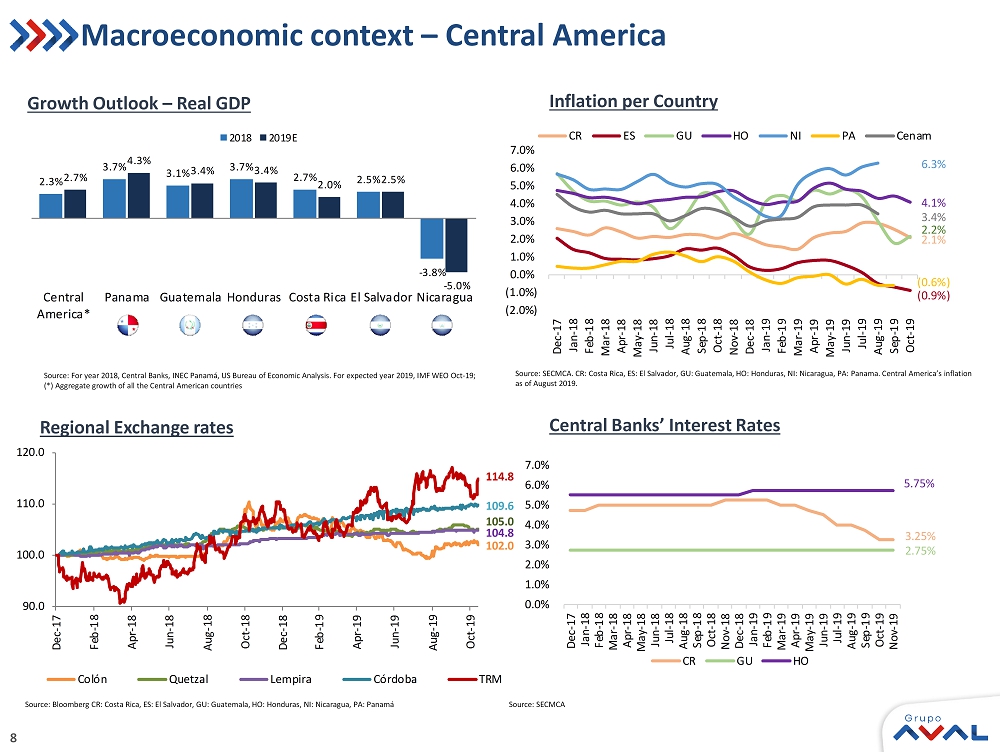
8 Macroeconomic context – Central America Growth Outlook – Real GDP Inflation per Country Central Banks’ Interest Rates Source: Bloomberg CR : Costa Rica, ES: El Salvador, GU: Guatemala, HO: Honduras, NI: Nicaragua, PA: Panamá Source: For year 2018, Central Banks, INEC Panamá, US Bureau of Economic Analysis. For expected year 2019, IMF WEO Oct - 19; (*) Aggregate growth of all the Central American countries Source : SECMCA Source : SECMCA. CR: Costa Rica, ES: El Salvador, GU: Guatemala, HO: Honduras, NI: Nicaragua, PA: Panama . Central America’s inflation as of August 2019. (2.0%) (1.0%) 0.0% 1.0% 2.0% 3.0% 4.0% 5.0% 6.0% 7.0% Dec-17 Jan-18 Feb-18 Mar-18 Apr-18 May-18 Jun-18 Jul-18 Aug-18 Sep-18 Oct-18 Nov-18 Dec-18 Jan-19 Feb-19 Mar-19 Apr-19 May-19 Jun-19 Jul-19 Aug-19 Sep-19 Oct-19 CR ES GU HO NI PA Cenam 6.3% 4.1% 2.2% 3.4% 2.1% (0.9%) (0.6%) 0.0% 1.0% 2.0% 3.0% 4.0% 5.0% 6.0% 7.0% Dec-17 Jan-18 Feb-18 Mar-18 Apr-18 May-18 Jun-18 Jul-18 Aug-18 Sep-18 Oct-18 Nov-18 Dec-18 Jan-19 Feb-19 Mar-19 Apr-19 May-19 Jun-19 Jul-19 Aug-19 Sep-19 Oct-19 Nov-19 CR GU HO 5.75% 3.25% 2.75% Regional Exchange rates 2.3% 3.7% 3.1% 3.7% 2.7% 2.5% - 3.8% 2.7% 4.3% 3.4% 3.4% 2.0% 2.5% - 5.0% Central America* Panama Guatemala Honduras Costa Rica El Salvador Nicaragua 2018 2019E 90.0 100.0 110.0 120.0 Dec-17 Feb-18 Apr-18 Jun-18 Aug-18 Oct-18 Dec-18 Feb-19 Apr-19 Jun-19 Aug-19 Oct-19 Colón Quetzal Lempira Córdoba TRM 114.8 104.8 109.6 105.0 102.0
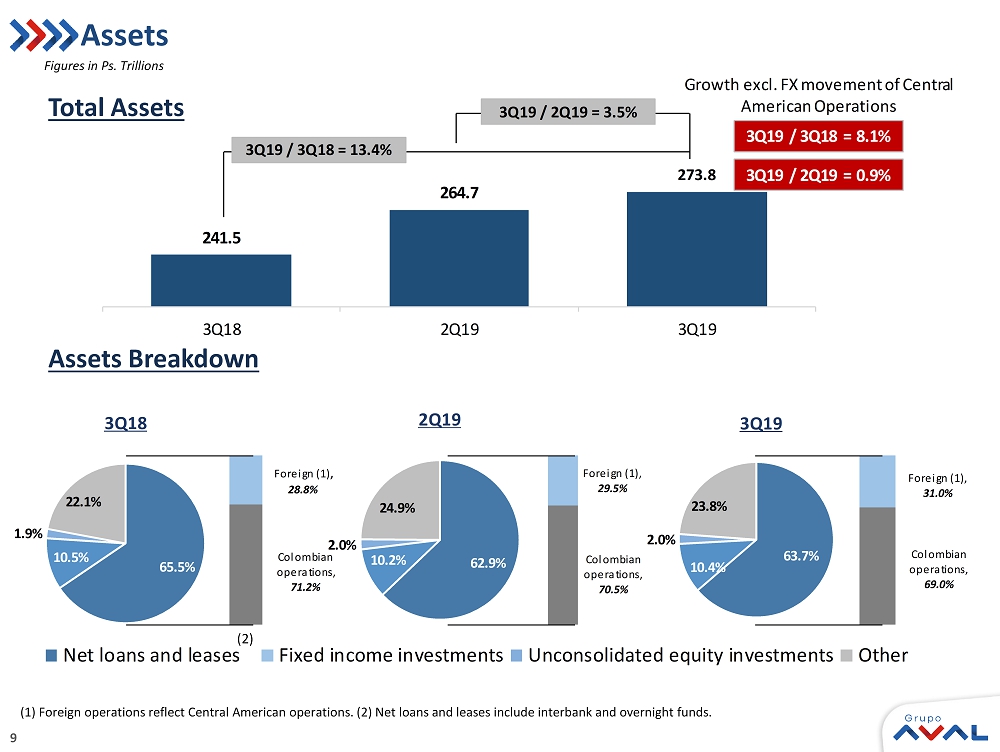
9 65.5% 10.5% 1.9% Net loans and leases Fixed income investments Unconsolidated equity investments Other 65.5% 10.5% 1.9% 22.1% 3Q18 63.7% 10.4% 2.0% 23.8% 3Q19 Colombian operations , 71.2% Foreign (1) , 28.8% Colombian operations , 70.5% Foreign (1) , 29.5% Colombian operations , 69.0% Foreign (1) , 31.0% 62.9% 10.2% 2.0% 24.9% 2Q19 Assets Assets Breakdown Total Assets Figures in Ps. Trillions (1) Foreign operations reflect Central American operations. (2) Net loans and leases include interbank and overnight funds. 241.5 264.7 273.8 3Q18 2Q19 3Q19 3Q19 / 3Q18 = 13.4% 3Q19 / 2Q19 = 3.5% 3Q19 / 3Q18 = 8.1% 3Q19 / 2Q19 = 0.9% Growth excl. FX movement of Central American Operations (2)
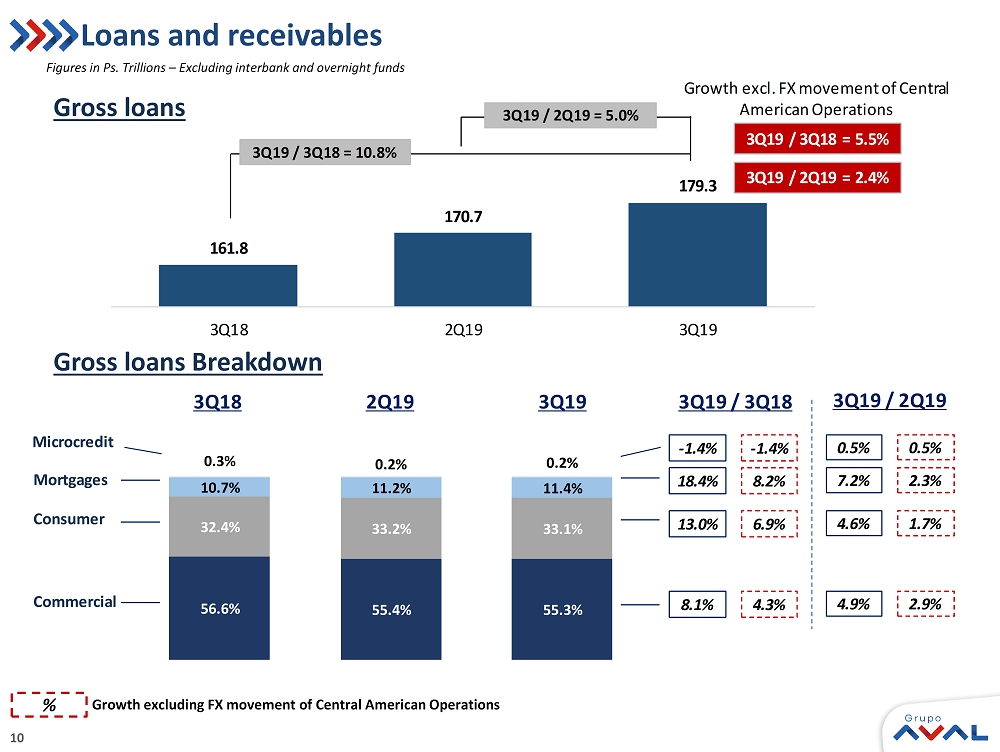
10 161.8 170.7 179.3 3Q18 2Q19 3Q19 3Q19 / 3Q18 = 10.8% 3Q19 / 2Q19 = 5.0% 3Q19 / 3Q18 = 5.5% 3Q19 / 2Q19 = 2.4% Growth excl. FX movement of Central American Operations 56.6% 55.4% 55.3% 32.4% 33.2% 33.1% 10.7% 11.2% 11.4% 0.3% 0.2% 0.2% Commercial Consumer Mortgages Microcredit 8.1% 13.0% 18.4% - 1.4% 4.3% 6.9% 8.2% - 1.4% 3Q19 / 3Q18 3Q18 2Q19 3Q19 3Q19 / 2Q19 4.9% 4.6% 7.2% 0.5% 2.9% 1.7% 2.3% 0.5% Loans and receivables Gross loans Gross loans Breakdown Figures in Ps. Trillions – Excluding interbank and overnight funds % Growth excluding FX movement of Central American Operations
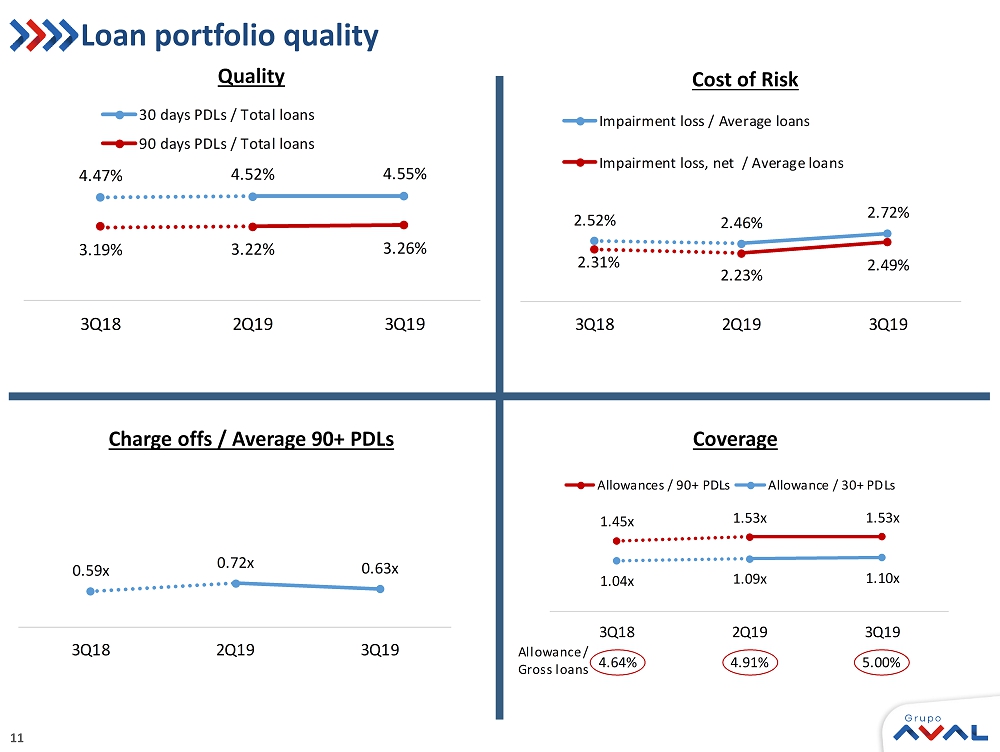
11 2.52% 2.46% 2.72% 2.31% 2.23% 2.49% 3Q18 2Q19 3Q19 Impairment loss / Average loans Impairment loss, net / Average loans Loan portfolio quality Charge offs / Average 90+ PDLs Cost of Risk 4.47% 4.52% 4.55% 3.19% 3.22% 3.26% 3Q18 2Q19 3Q19 30 days PDLs / Total loans 90 days PDLs / Total loans 0.59x 0.72x 0.63x 3Q18 2Q19 3Q19 4.64% 1.45x 1.53x 1.53x 1.04x 1.09x 1.10x 3Q18 2Q19 3Q19 Allowances / 90+ PDLs Allowance / 30+ PDLs 4.91% 5.00% Allowance / Gross loans Quality Coverage
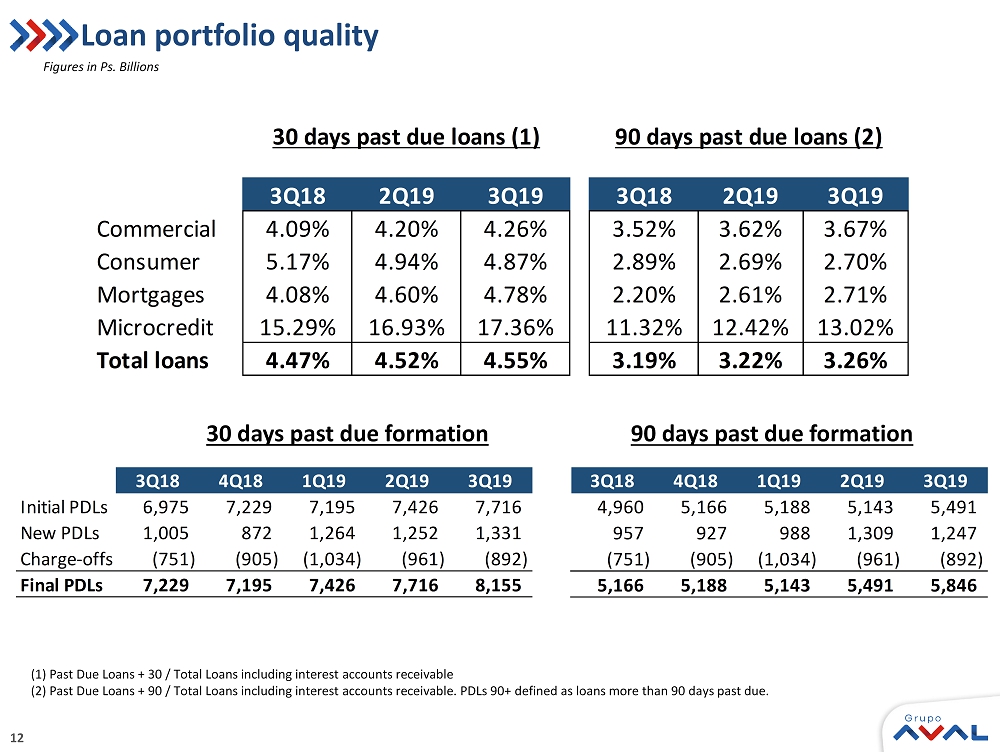
12 3Q18 4Q18 1Q19 2Q19 3Q19 4,960 5,166 5,188 5,143 5,491 957 927 988 1,309 1,247 (751) (905) (1,034) (961) (892) 5,166 5,188 5,143 5,491 5,846 Loan portfolio quality 3Q18 2Q19 3Q19 3Q18 2Q19 3Q19 Commercial 4.09% 4.20% 4.26% 3.52% 3.62% 3.67% Consumer 5.17% 4.94% 4.87% 2.89% 2.69% 2.70% Mortgages 4.08% 4.60% 4.78% 2.20% 2.61% 2.71% Microcredit 15.29% 16.93% 17.36% 11.32% 12.42% 13.02% Total loans 4.47% 4.52% 4.55% 3.19% 3.22% 3.26% 30 days past due loans (1) 90 days past due loans (2) (1) Past Due Loans + 30 / Total Loans including interest accounts receivable (2) Past Due Loans + 90 / Total Loans including interest accounts receivable. PDLs 90+ defined as loans more than 90 days pas t d ue. Figures in Ps. Billions 30 days past due formation 90 days past due formation 3Q18 4Q18 1Q19 2Q19 3Q19 Initial PDLs 6,975 7,229 7,195 7,426 7,716 New PDLs 1,005 872 1,264 1,252 1,331 Charge-offs (751) (905) (1,034) (961) (892) Final PDLs 7,229 7,195 7,426 7,716 8,155
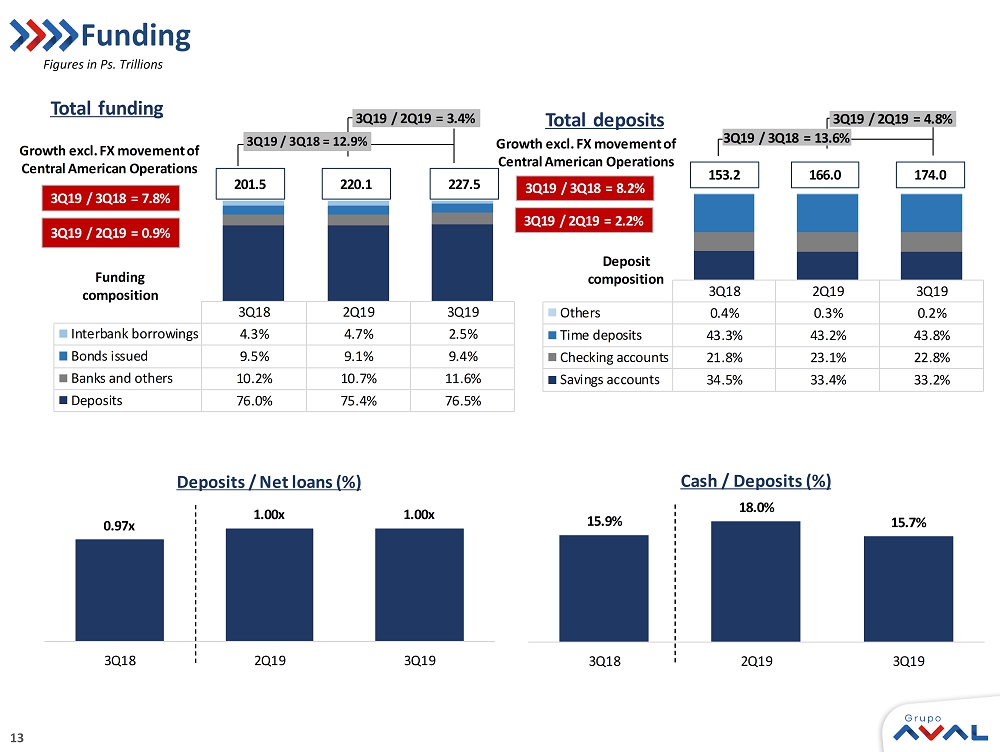
13 Funding Figures in Ps. Trillions 3Q18 2Q19 3Q19 Others 0.4% 0.3% 0.2% Time deposits 43.3% 43.2% 43.8% Checking accounts 21.8% 23.1% 22.8% Savings accounts 34.5% 33.4% 33.2% Total deposits 3Q19 / 3Q18 = 13.6% 3Q19 / 2Q19 = 4.8% 153.2 166.0 174.0 Deposit composition 3Q19 / 3Q18 = 8.2% 3Q19 / 2Q19 = 2.2% Growth excl. FX movement of Central American Operations 3Q18 2Q19 3Q19 Interbank borrowings 4.3% 4.7% 2.5% Bonds issued 9.5% 9.1% 9.4% Banks and others 10.2% 10.7% 11.6% Deposits 76.0% 75.4% 76.5% Total funding 201.5 220.1 227.5 Funding composition 3Q19 / 3Q18 = 12.9% 3Q19 / 2Q19 = 3.4% 3Q19 / 3Q18 = 7.8% 3Q19 / 2Q19 = 0.9% Growth excl. FX movement of Central American Operations 0.97x 1.00x 1.00x 3Q18 2Q19 3Q19 Deposits / Net loans (%) 15.9% 18.0% 15.7% 3Q18 2Q19 3Q19 Cash / Deposits (%)
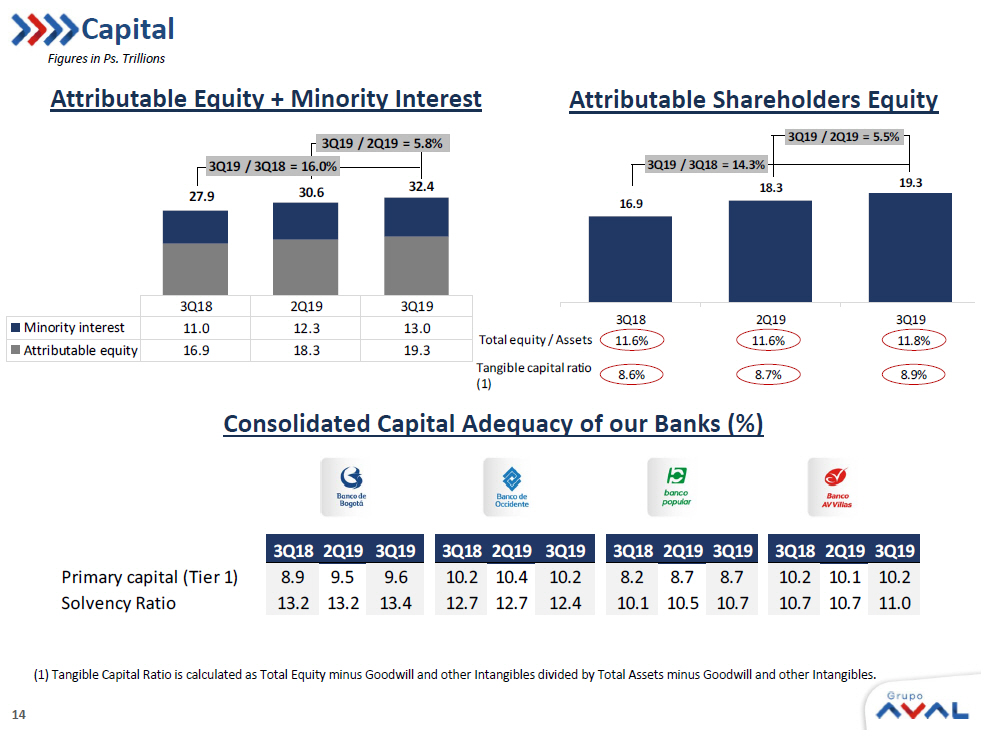
14 Capital Attributable Shareholders Equity Attributable Equity + Minority Interest Figures in Ps. Trillions Consolidated Capital Adequacy of our Banks (%) 3Q18 2Q19 3Q19 Minority interest 11.0 12.3 13.0 Attributable equity 16.9 18.3 19.3 3Q19 / 3Q18 = 16.0% 3Q19 / 2Q19 = 5.8% 27.9 30.6 32.4 16.9 18.3 19.3 3Q18 2Q19 3Q19 Attributable shareholders equity 3Q19 / 2Q19 = 5.5% 3Q19 / 3Q18 = 14.3% Total equity / Assets Tangible capital ratio (1) 11.6% 11.6% 11.8% 8.6% 8.7% 8.9% (1) Tangible Capital Ratio is calculated as Total Equity minus Goodwill and other Intangibles divided by Total Assets minus G ood will and other Intangibles. 3Q182Q19 3Q19 3Q182Q19 3Q19 3Q182Q193Q19 3Q182Q193Q19 Primary capital (Tier 1) 8.9 9.5 9.6 10.2 10.4 10.2 8.2 8.7 8.7 10.2 10.1 10.2 Solvency Ratio 13.2 13.2 13.4 12.7 12.7 12.4 10.1 10.5 10.7 10.7 10.7 11.0
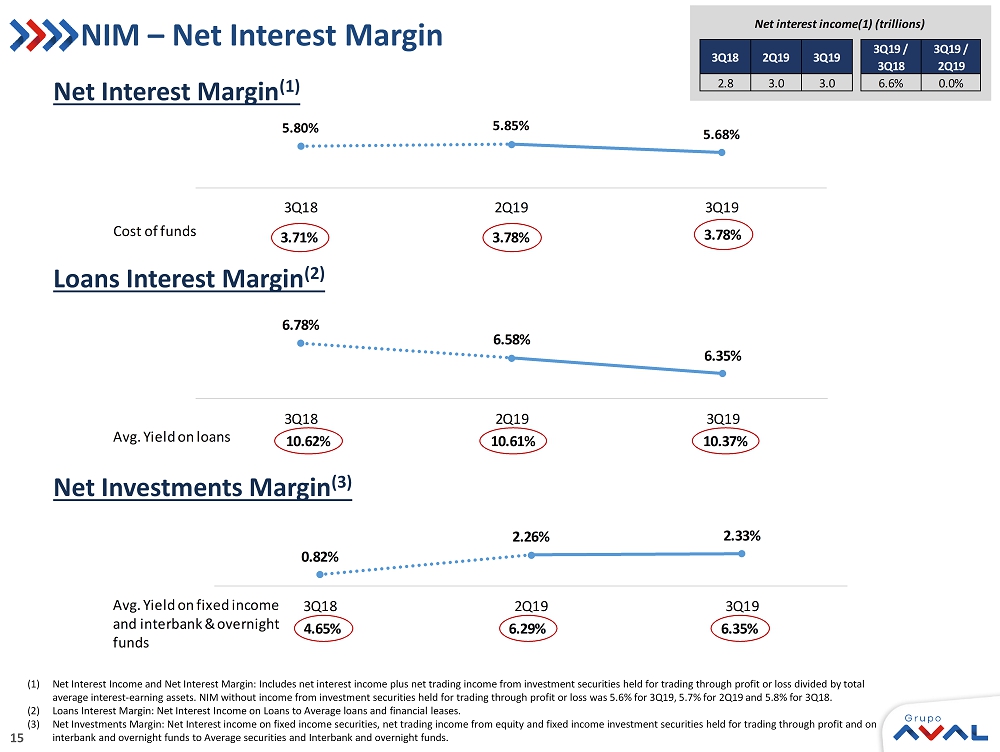
15 6.78% 6.58% 6.35% 3Q18 2Q19 3Q19 10.62% 10.61% 10.37% Avg. Yield on loans NIM – Net Interest Margin Net Interest Margin (1) Loans Interest Margin (2) Net Investments Margin (3) 3Q18 2Q19 3Q19 3Q19 / 3Q18 3Q19 / 2Q19 2.8 3.0 3.0 6.6% 0.0% Net interest income(1) (trillions) (1) Net Interest Income and Net Interest Margin: Includes net interest income plus net trading income from investment securities hel d for trading through profit or loss divided by total average interest - earning assets. NIM without income from investment securities held for trading through profit or loss was 5.6% for 3Q19, 5.7% for 2Q19 and 5. 8% for 3Q18. (2) Loans Interest Margin: Net Interest Income on Loans to Average loans and financial leases. (3) Net Investments Margin: Net Interest income on fixed income securities, net trading income from equity and fixed income inves tme nt securities held for trading through profit and on interbank and overnight funds to Average securities and Interbank and overnight funds. 5.80% 5.85% 5.68% 3Q18 2Q19 3Q19 3.71% 3.78% 3.78% Cost of funds 0.82% 2.26% 2.33% 3Q18 2Q19 3Q19 4.65% 6.29% 6.35% Avg. Yield on fixed income and interbank & overnight funds
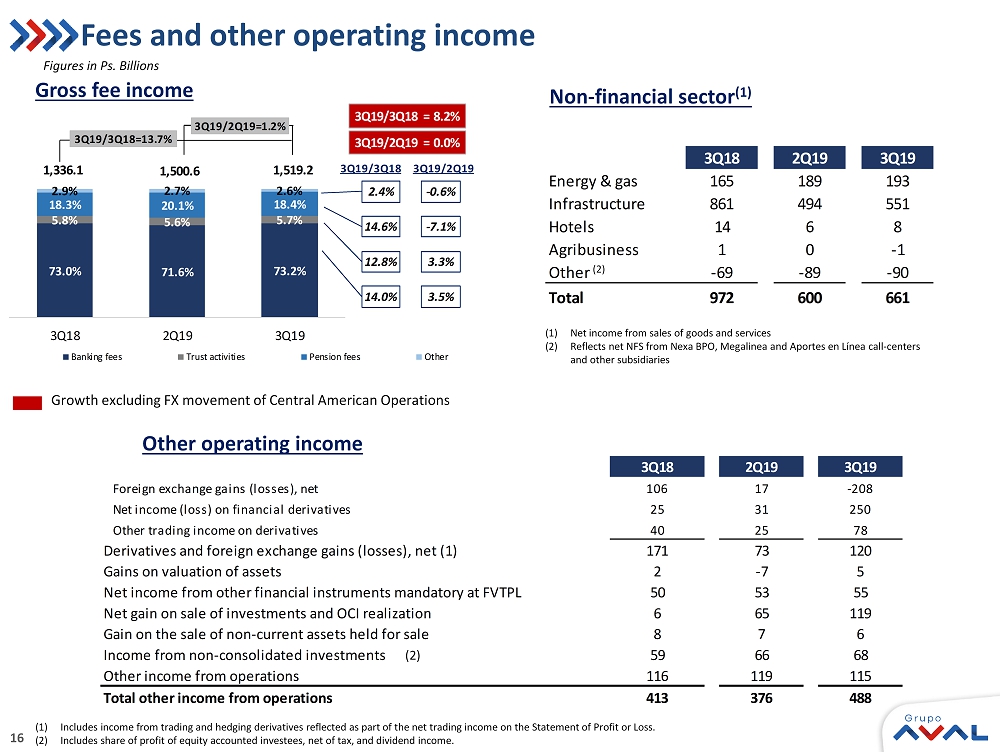
16 3Q18 2Q19 3Q19 Energy & gas 165 189 193 Infrastructure 861 494 551 Hotels 14 6 8 Agribusiness 1 0 -1 Other -69 -89 -90 Total 972 600 661 Fees and other operating income Figures in Ps. Billions (1) Includes income from trading and hedging derivatives reflected as part of the net trading income on the Statement of Profit or L oss. (2) Includes share of profit of equity accounted investees, net of tax, and dividend income. Gross fee income Other operating income Growth excluding FX movement of Central American Operations Non - financial sector (1) 3Q18 2Q19 3Q19 Foreign exchange gains (losses), net 106 17 -208 Net income (loss) on financial derivatives 25 31 250 Other trading income on derivatives 40 25 78 Derivatives and foreign exchange gains (losses), net (1) 171 73 120 Gains on valuation of assets 2 -7 5 Net income from other financial instruments mandatory at FVTPL 50 53 55 Net gain on sale of investments and OCI realization 6 65 119 Gain on the sale of non-current assets held for sale 8 7 6 Income from non-consolidated investments 59 66 68 Other income from operations 116 119 115 Total other income from operations 413 376 488 (1) Net income from sales of goods and services (2) Reflects net NFS from Nexa BPO, Megalinea and Aportes en L ínea call - centers and other subsidiaries (2) 73.0% 71.6% 73.2% 5.8% 5.6% 5.7% 18.3% 20.1% 18.4% 2.9% 2.7% 2.6% 3Q18 2Q19 3Q19 Banking fees Trust activities Pension fees Other 1,336.1 1,500.6 1,519.2 3Q19/3Q18=13.7% 3Q19/2Q19=1.2% 14.0% 12.8% 14.6% 2.4% 3Q19/2Q19 3Q19/3Q18 3.5% 3.3% - 7.1% - 0.6% 3Q19/2Q19 = 0.0% 3Q19/3Q18 = 8.2% (2)
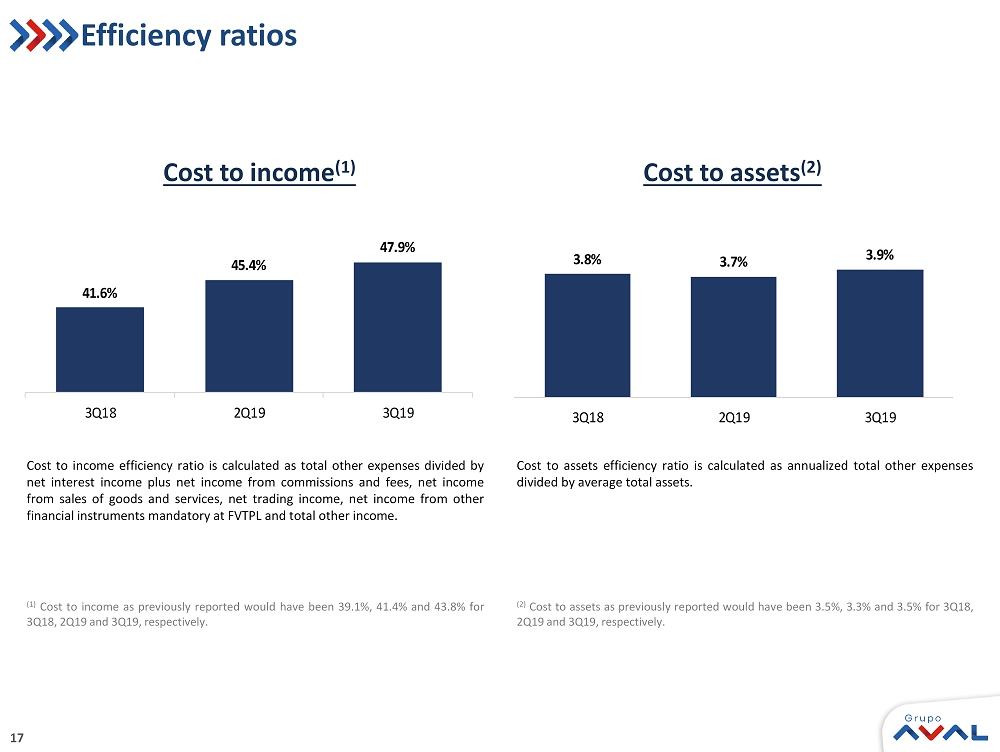
17 Efficiency ratios Cost to income efficiency ratio is calculated as total other expenses divided by net interest income plus net income from commissions and fees, net income from sales of goods and services, net trading income, net income from other financial instruments mandatory at FVTPL and total other income . Cost to income (1) Cost to assets (2) Cost to assets efficiency ratio is calculated as annualized total other expenses divided by average total assets . 41.6% 45.4% 47.9% 3Q18 2Q19 3Q19 FY17 FY18 3.8% 3.7% 3.9% 3Q18 2Q19 3Q19 FY17 FY18 ( 1 ) Cost to income as previously reported would have been 39 . 1 % , 41 . 4 % and 43 . 8 % for 3 Q 18 , 2 Q 19 and 3 Q 19 , respectively . ( 2 ) Cost to assets as previously reported would have been 3 . 5 % , 3 . 3 % and 3 . 5 % for 3 Q 18 , 2 Q 19 and 3 Q 19 , respectively .
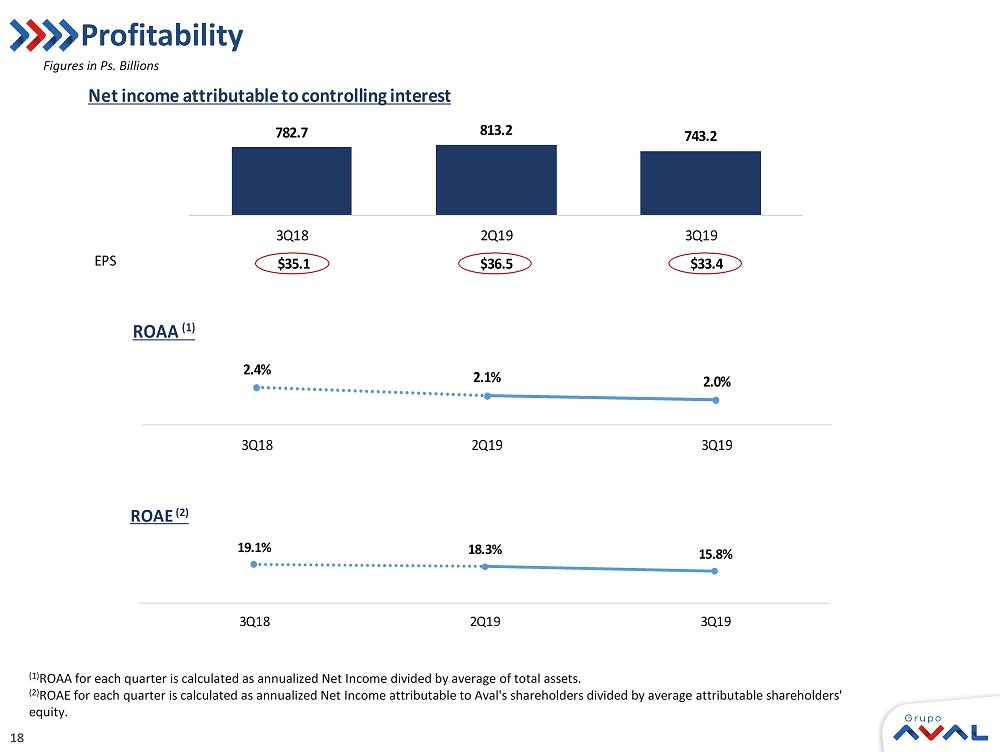
18 782.7 813.2 743.2 3Q18 2Q19 3Q19 Net income attributable to controlling interest $35.1 $36.5 $33.4 EPS $29.0 Profitability (1) ROAA for each quarter is calculated as annualized Net Income divided by average of total assets. (2) ROAE for each quarter is calculated as annualized Net Income attributable to Aval's shareholders divided by average attributa ble shareholders' equity. Figures in Ps. Billions 2.4% 2.1% 2.0% 3Q18 2Q19 3Q19 ROAA (1) 2.0% 19.1% 18.3% 15.8% 3Q18 2Q19 3Q19 ROAE (2) 18.3%
19
SIGNATURE
Pursuant to the requirements of the Securities Exchange Act of 1934, the registrant has duly caused this report to be signed on its behalf by the undersigned, thereunto duly authorized.
Date: November 21, 2019
| GRUPO AVAL ACCIONES Y VALORES S.A. | ||||||
| By: | /s/ Jorge Adrián Rincón Plata | |||||
| Name: | Jorge Adrián Rincón Plata | |||||
| Title: | Chief Legal Counsel | |||||