UNITED STATES
SECURITIES AND EXCHANGE COMMISSION
Washington, D.C. 20549
FORM 6-K
Report Of Foreign Private Issuer
Pursuant To Rule 13a-16 Or 15d-16 Of
The Securities Exchange Act Of 1934
For the month of August 2021
Commission File Number: 000-54290
Grupo Aval Acciones y Valores S.A.
(Exact name of registrant as specified in its charter)
Carrera 13 No. 26A - 47
Bogotá D.C., Colombia
(Address of principal executive office)
Indicate by check mark whether the registrant files or will file annual reports under cover of Form 20-F or Form 40-F:
| Form 20-F | X | Form 40-F |
Indicate by check mark if the registrant is submitting the Form 6-K in paper as permitted by Regulation S-T Rule 101(b)(1):
| Yes | No | X |
Indicate by check mark if the registrant is submitting the Form 6-K in paper as permitted by Regulation S-T Rule 101(b)(7):
| Yes | No | X |
GRUPO AVAL ACCIONES Y VALORES S.A.
TABLE OF CONTENTS
| ITEM | |
| 1. | Report of Second Quarter 2021 Consolidated Results |
| 2. | Second Quarter 2021 Consolidated Earnings Results Presentation |
Item 1
Report of 2Q2021 consolidated results
Information reported in Ps billions(1) and under IFRS
(1) We refer to billions as thousands of millions.

Grupo Aval Acciones y Valores S.A. (“Grupo Aval”) is an issuer of securities in Colombia and in the United States. As such, it is subject to compliance with securities regulation in Colombia and applicable U.S. securities regulation. Grupo Aval is also subject to the inspection and supervision of the Superintendency of Finance as holding company of the Aval financial conglomerate.
The consolidated financial information included in this document is presented in accordance with IFRS as currently issued by the IASB. Details of the calculations of non-GAAP measures such as ROAA and ROAE, among others, are explained when required in this report.
This report includes forward-looking statements. In some cases, you can identify these forward-looking statements by words such as “may,” “will,” “should,” “expects,” “plans,” “anticipates,” “believes,” “estimates,” “predicts,” “potential,” or “continue,” or the negative of these and other comparable words. Actual results and events may differ materially from those anticipated herein as a consequence of changes in general, economic and business conditions, changes in interest and currency rates and other risk described from time to time in our filings with the Registro Nacional de Valores y Emisores and the SEC.
Recipients of this document are responsible for the assessment and use of the information provided herein. Matters described in this presentation and our knowledge of them may change extensively and materially over time but we expressly disclaim any obligation to review, update or correct the information provided in this report, including any forward looking statements, and do not intend to provide any update for such material developments prior to our next earnings report.
The content of this document and the figures included herein are intended to provide a summary of the subjects discussed rather than a comprehensive description.
When applicable, in this document we refer to billions as thousands of millions.
| 1 |  |

Bogotá, August 11th, 2021. Grupo Aval S.A. (NYSE:AVAL) reported a consolidated attributable net income of Ps 949.5 billion (Ps 42.6 pesos per share) for 2Q2021 versus a Ps 323.4 billion (Ps 14.5 pesos per share) figure reported for 2Q2020. ROAE was 18.2% and ROAA was 2.0% for 2Q2021.
Key results of the quarter:
| • | In general, the second quarter of 2021 evidenced the continued recovery of the global economy and Colombia was not the exception as growth expectations for 2021 now exceed 7%, boosted by better unemployment numbers, renewed commercial activity and higher prices of export commodities such as coffee and oil. Central America does not lag too far behind with economic growth expectations bordering 6%. |
| • | Vaccination has been key to the economic recovery as demonstrated by the difference in economic growth recovery across regions and countries depending on the effectiveness of vaccination programs. In Colombia, more than 30 million doses have been already administered. At the current pace, the country could achieve herd immunity as early as during 3Q2021. |
| • | Grupo Aval registered its best results ever for a quarter with attributable net income of approximately 950 billion pesos, an increase of almost 20% versus the first quarter of 2021 and almost tripled the attributable net income generated during the same quarter of 2020. Aval’s attributable net income for the first half of 2021 was 1.74 trillion pesos showing an increase of 70.1% versus the same period during 2020. |
| • | ROAE for the quarter was 18.2% from 15.4% in the first quarter of 2021 and 6.6% in the same quarter of 2020. Cumulative ROAE for the first half was 16.7% vs 10.4% during the first semester of 2020. |
| • | ROAA for the quarter was 2.0% versus 1.8% in the first quarter of 2021 and 0.8% in the second quarter of last year. Cumulative ROAA was 1.9% in the first semester of 2021. |
| • | Total loans grew approximately 6% during the first semester and total assets and total deposits grew 6.6% in the same period. |
| • | Active digital clients, as of June 2021, totaled 5.2 million increasing approximately 31% in the last twelve months. |
| • | Attributable equity grew approximately 8% in the last twelve months. |
| • | Aval’s banks regulatory capital Tier 1 ratios, now reported under Basel 3, grew between 130 and 310 basis points in the last twelve months. |
| • | 90-day PDL ratios decreased 14 basis points versus the end of 2020 and remained steady versus the first quarter of 2021 at 3.4%. |
| • | Cost of Risk of 2.1% for the semester decreased by 60 basis points versus the first semester of 2020 and by 110 basis points versus the second semester of 2020. |
| • | Net Interest Margin was 4.8% in the semester versus 5.1% in the first semester of 2020 and 5.2% in the second semester. NIM on loans was 5.8% during the first semester of 2021 versus 6.0% in the first semester of 2020 and 5.9% in the second semester of 2020. |
| • | Net income from commissions and fees during the second quarter of 2021 increased by 19.2% versus the second quarter of 2020 and decreased by 3% versus the first quarter of this year, mainly explained by the impact of the violent demonstrations experienced during the second quarter of this year. During the semester, this number increased by 8.7% versus the first semester of 2020. |
| • | Income derived from Non-financial Sector investments increased by 22% during the quarter and by 60% when comparing the first semester of 2021 versus the same semester of 2020. |
| • | Efficiency on a cost to income basis was 45.4% for the quarter versus 44.7% in the first quarter of this year and on a cost to assets basis was 3.2% in the quarter versus 3.1% in the first quarter. |
| 2 | |
Bogotá, August 11th, 2021. Grupo Aval S.A. (NYSE:AVAL) reported a consolidated attributable net income of Ps 949.5 billion (Ps 42.6 pesos per share) for 2Q2021 versus a Ps 323.4 billion (Ps 14.5 pesos per share) figure reported for 2Q2020. ROAE was 18.2% and ROAA was 2.0% for 2Q2021.
| COP $tn | 2Q20 | 1Q21 | 2Q21 | 2Q21 vs 2Q20 | 2Q21 vs 1Q21 | |||||||
| Balance Sheet | Gross Loans | $ 209.3 | $ 209.5 | $ 213.8 | 2.2% | 2.1% | ||||||
| Deposits | $ 212.2 | $ 222.1 | $ 225.8 | 6.4% | 1.7% | |||||||
| Deposits/Net Loans | 1.04 x | 1.10 x | 1.10 x | 0.06 x | -0.01 x | |||||||
| Loan Quality | 90 days PDLs / Gross Loans | 3.0% | 3.4% | 3.4% | 42 bps | 1 bps | ||||||
| Allowance/90 days PDLs | 1.53 x | 1.55 x | 1.54 x | 0.01 x | -0.01 x | |||||||
| Cost of risk | 3.1% | 2.2% | 2.0% | (111) bps | (23) bps | |||||||
| Profitability | Net interest margin | 5.3% | 4.6% | 4.9% | (37) bps | 34 bps | ||||||
| Fee income Ratio | 21.4% | 23.3% | 21.6% | 18 bps | (173) bps | |||||||
| Efficiency Ratio | 51.3% | 44.7% | 45.4% | (596) bps | 64 bps | |||||||
| Attributable net income | $ 0.32 | $ 0.79 | $ 0.95 | 193.6% | 19.9% | |||||||
| ROAA | 0.8% | 1.8% | 2.0% | 123 bps | 25 bps | |||||||
| ROAE | 6.6% | 15.4% | 18.2% | 1,159 bps | 272 bps | |||||||
Gross loans excludes interbank and overnight funds. PDLs 90+ defined as loans more than 90 days past due. Cost of Risk calculated as Impairment loss on loans and other accounts receivable net of recoveries of charged-off assets divided by average gross loans. Net Interest Margin includes net interest income plus net trading income from debt and equity investments at FVTPL divided by total average interest-earning assets. Fee income ratio is calculated as net income from commissions and fees divided by net interest income plus net income from commissions and fees, gross profit from sales of goods and services, net trading income, net income from other financial instruments mandatory at FVTPL and total other income. Efficiency Ratio is calculated as total other expenses divided by net interest income plus net income from commissions and fees, gross profit from sales of goods and services, net trading income, net income from other financial instruments mandatory at FVTPL and total other income. ROAA is calculated as annualized Net Income divided by average of total assets. ROAE is calculated as Net Income attributable to Aval's shareholders divided by average attributable shareholders' equity. NS refers to non-significant figures.
| 3 | |

| Grupo Aval Acciones y Valores S.A. | |||||||||
| Consolidated Financial Statements Under IFRS | |||||||||
| Information in Ps. Billions | |||||||||
| Consolidated Statement of Financial Position | 2Q20 | 1Q21 | 2Q21 |  | |||||
| 2Q21 vs. 1Q21 | 2Q21 vs. 2Q20 | ||||||||
| Cash and cash equivalents | 40,109.2 | 35,132.0 | 35,613.6 | 1.4% | -11.2% | ||||
| Trading assets | 11,204.1 | 11,393.6 | 11,387.4 | -0.1% | 1.6% | ||||
| Investment securities | 33,302.6 | 40,790.6 | 41,889.0 | 2.7% | 25.8% | ||||
| Hedging derivatives assets | 129.0 | 29.5 | 39.7 | 34.6% | -69.2% | ||||
| Total loans, net | 203,303.0 | 201,016.7 | 205,293.6 | 2.1% | 1.0% | ||||
| Tangible assets | 9,437.8 | 9,006.0 | 8,873.8 | -1.5% | -6.0% | ||||
| Goodwill | 8,236.5 | 8,109.6 | 8,221.9 | 1.4% | -0.2% | ||||
| Concession arrangement rights | 8,154.6 | 9,540.9 | 10,025.0 | 5.1% | 22.9% | ||||
| Other assets | 19,086.7 | 21,892.6 | 22,907.8 | 4.6% | 20.0% | ||||
| Total assets | 332,963.5 | 336,911.6 | 344,251.8 | 2.2% | 3.4% | ||||
| Trading liabilities | 1,196.5 | 825.8 | 759.6 | -8.0% | -36.5% | ||||
| Hedging derivatives liabilities | 310.6 | 74.0 | 52.4 | -29.3% | -83.1% | ||||
| Customer deposits | 212,216.0 | 222,077.7 | 225,773.4 | 1.7% | 6.4% | ||||
| Interbank borrowings and overnight funds | 11,004.5 | 9,363.1 | 9,824.7 | 4.9% | -10.7% | ||||
| Borrowings from banks and others | 26,570.5 | 19,122.9 | 20,397.3 | 6.7% | -23.2% | ||||
| Bonds issued | 28,829.1 | 29,728.6 | 29,941.5 | 0.7% | 3.9% | ||||
| Borrowings from development entities | 4,103.0 | 3,878.4 | 3,718.4 | -4.1% | -9.4% | ||||
| Other liabilities | 14,572.4 | 16,646.1 | 16,835.1 | 1.1% | 15.5% | ||||
| Total liabilities | 298,802.7 | 301,716.6 | 307,302.4 | 1.9% | 2.8% | ||||
| Equity attributable to owners of the parent | 19,939.8 | 20,376.0 | 21,455.5 | 5.3% | 7.6% | ||||
| Non-controlling interest | 14,221.0 | 14,818.9 | 15,493.9 | 4.6% | 9.0% | ||||
| Total equity | 34,160.8 | 35,195.0 | 36,949.4 | 5.0% | 8.2% | ||||
| Total liabilities and equity | 332,963.5 | 336,911.6 | 344,251.8 | 2.2% | 3.4% | ||||
| Consolidated Statement of Income | 2Q20 | 1Q21 | 2Q21 | | |||||
| Interest income | 5,199.9 | 4,702.4 | 4,798.3 | 2.0% | -7.7% | ||||
| Interest expense | 2,246.4 | 1,657.0 | 1,645.4 | -0.7% | -26.8% | ||||
| Net interest income | 2,953.6 | 3,045.4 | 3,152.9 | 3.5% | 6.8% | ||||
| Loans and other accounts receivable | 1,642.1 | 1,233.3 | 1,171.2 | -5.0% | -28.7% | ||||
| Other financial assets | 43.6 | 15.6 | (8.3) | -153.3% | -119.1% | ||||
| Recovery of charged-off financial assets | (56.0) | (91.7) | (118.5) | 29.2% | 111.6% | ||||
| Net impairment loss on financial assets | 1,629.6 | 1,157.2 | 1,044.4 | -9.7% | -35.9% | ||||
| Net interest income, after impairment losses | 1,323.9 | 1,888.2 | 2,108.5 | 11.7% | 59.3% | ||||
| Net income from commissions and fees | 1,094.5 | 1,346.8 | 1,304.9 | -3.1% | 19.2% | ||||
| Gross profit from sales of goods and services | 239.4 | 770.7 | 940.9 | 22.1% | N.A. | ||||
| Net trading income | (93.6) | 197.6 | 269.0 | 36.1% | N.A | ||||
| Net income from other financial instruments mandatory at FVTPL | 59.7 | 81.6 | 62.8 | -23.1% | 5.2% | ||||
| Total other income | 853.2 | 327.9 | 306.9 | -6.4% | -64.0% | ||||
| Total other expenses | 2,621.6 | 2,581.1 | 2,739.2 | 6.1% | 4.5% | ||||
| Net income before income tax expense | 855.6 | 2,031.7 | 2,253.8 | 10.9% | 163.4% | ||||
| Income tax expense | 214.6 | 580.1 | 538.8 | -7.1% | 151.0% | ||||
| Net income for the period | 641.0 | 1,451.6 | 1,715.0 | 18.1% | 167.6% | ||||
| Non-controlling interest | 317.6 | 659.8 | 765.5 | 16.0% | 141.0% | ||||
| Net income attributable to owners of the parent | 323.4 | 791.8 | 949.5 | 19.9% | 193.6% | ||||
| Key ratios | 2Q20 | 1Q21 | 2Q21 | YTD 2020 | YTD 2021 | ||||
| Net Interest Margin(1) | 5.0% | 4.9% | 5.0% | 5.2% | 5.0% | ||||
| Net Interest Margin (including net trading income)(1) | 5.3% | 4.6% | 4.9% | 5.1% | 4.8% | ||||
| Efficiency ratio(2) | 51.3% | 44.7% | 45.4% | 49.1% | 45.1% | ||||
| ROAA(3) | 0.8% | 1.8% | 2.0% | 1.3% | 1.9% | ||||
| ROAE(4) | 6.6% | 15.4% | 18.2% | 10.4% | 16.7% | ||||
| 90 days PDL / Gross loans (5) | 3.0% | 3.4% | 3.4% | 3.0% | 3.4% | ||||
| Provision expense / Average gross loans (6) | 3.1% | 2.2% | 2.0% | 2.7% | 2.1% | ||||
| Allowance / 90 days PDL (5) | 1.53 | 1.55 | 1.54 | 1.53 | 1.54 | ||||
| Allowance / Gross loans | 4.6% | 5.3% | 5.3% | 4.6% | 5.3% | ||||
| Charge-offs / Average gross loans (6) | 1.8% | 2.7% | 2.1% | 1.9% | 2.4% | ||||
| Total loans, net / Total assets | 61.1% | 59.7% | 59.6% | 61.1% | 59.6% | ||||
| Deposits / Total loans, net | 104.4% | 110.5% | 110.0% | 104.4% | 110.0% | ||||
| Equity / Assets | 10.3% | 10.4% | 10.7% | 10.3% | 10.7% | ||||
| Tangible equity ratio (7) | 7.6% | 7.8% | 8.1% | 7.6% | 8.1% | ||||
| Shares outstanding (EoP) | 22,281,017,159 | 22,281,017,159 | 22,281,017,159 | 22,281,017,159 | 22,281,017,159 | ||||
| Shares outstanding (Average) | 22,281,017,159 | 22,281,017,159 | 22,281,017,159 | 22,281,017,159 | 22,281,017,159 | ||||
| Common share price (EoP) | 935.0 | 1,188.0 | 1,139.0 | 935.0 | 1,139.0 | ||||
| Preferred share price (EoP) | 830.0 | 1,144.0 | 1,083.0 | 830.0 | 1,083.0 | ||||
| BV/ EoP shares in Ps. | 894.9 | 914.5 | 963.0 | 894.9 | 963.0 | ||||
| EPS | 14.5 | 35.5 | 42.6 | 45.9 | 78.1 | ||||
| P/E (8) | 14.3 | 8.0 | 6.4 | 9.0 | 6.9 | ||||
| P/BV (8) | 0.9 | 1.3 | 1.1 | 0.9 | 1.1 | ||||
(1) NIM is calculated as Net Interest Income divided by the average of Interest Earning Assets; (2) Efficiency Ratio is calculated as total other expenses divided by net interest income plus net income from commissions and fees, gross profit from sales of goods and services, net trading income, net income from other financial instruments mandatory at FVTPL and total other income; (3) ROAA is calculated as Income before Minority Interest divided by the average of total assets for each quarter; (4) ROAE is calculated as Net Income attributable to Grupo Aval’s shareholders divided by the average of shareholders´ attributable equity for each quarter; (5) PDLs 90+ defined as loans more than 90 days past due include interest accounts receivables. Gross loans excluding interbank and overnight funds; (6) Refers to average gross loans for the period; (7) Tangible Equity Ratio is calculated as Total Equity minus Intangibles (excluding those related to concessions) divided by Total Assets minus Intangibles (excluding those related to concessions); (8) Based on Preferred share prices.
| 4 | |
Statement of Financial Position Analysis
1. Assets
Total assets as of June 30th, 2021 totaled Ps 344,251.8 billion showing an increase of 3.4% versus June 30th, 2020 and of 2.2% versus March 31st, 2021. Growth in assets was mainly driven by (i) a 25.8% year over year growth for investment securities equivalents to Ps 41,889.0 billion, (ii) a 20.0% yearly growth in other assets, net to Ps 22,907.8 billion and (iii) a 1.0% year over year growth in total loans, net to Ps 205,293.6 billion. When excluding FX movement in our Central American operation (“excluding FX”), asset growth would have been 3.5% versus June 30th, 2020 and 1.5% versus March 31st, 2021; for investment securities growth would have been 25.9% versus June 30th, 2020 and 1.9% versus March 31st, 2021; for other assets 20.0% versus June 30th, 2020 and 4.4% versus March 31st, 2021; and for total loans, net growth would have been 1.1% versus June 30th, 2020 and 1.4% versus March 31st, 2021.
1.1 Loan portfolio
Gross loans (excluding interbank and overnight funds) increased by 2.2% between June 30th, 2020 and June 30th, 2021 to Ps 213,824.8 billion (2.2% excluding FX) mainly driven by (i) a 8.4% increase in Consumer loans to Ps 70,562.4 billion (8.4% excluding FX), (ii) a 6.6% increase in Mortgages loans to Ps 26,831.3 billion (6.7% excluding FX) and (iii) a 2.1% decrease in Commercial loans to Ps 116,094.0 billion (-2.1% excluding FX).
Interbank & overnight funds decreased by 24.0% to Ps 2,725.7 billion (-23.9% excluding FX) during the last twelve months.
Loss allowance was Ps 11,256.9 billion as of June 30th, 2021 taking net loans to Ps 205,293.6 billion.
| Total loans, net | 2Q20 | 1Q21 | 2Q21 | | |||||
| 2Q21 vs. 1Q21 | 2Q21 vs. 2Q20 | ||||||||
| Gross loans | |||||||||
| Commercial loans | 118,617.5 | 114,497.6 | 116,094.0 | 1.4% | -2.1% | ||||
| Consumer loans | 65,122.3 | 68,626.8 | 70,562.4 | 2.8% | 8.4% | ||||
| Mortgages loans | 25,168.6 | 26,030.9 | 26,831.3 | 3.1% | 6.6% | ||||
| Microcredit loans | 384.4 | 358.8 | 337.0 | -6.1% | -12.3% | ||||
| Gross loans | 209,292.9 | 209,514.1 | 213,824.8 | 2.1% | 2.2% | ||||
| Interbank & overnight funds | 3,585.4 | 2,561.9 | 2,725.7 | 6.4% | -24.0% | ||||
| Total gross loans | 212,878.3 | 212,076.0 | 216,550.5 | 2.1% | 1.7% | ||||
| Loss allowance | (9,575.2) | (11,059.2) | (11,256.9) | 1.8% | 17.6% | ||||
| Allowance for impairment of commercial loans | (5,212.3) | (5,307.4) | (5,533.9) | 4.3% | 6.2% | ||||
| Allowance for impairment of consumer loans | (3,843.9) | (5,003.9) | (4,909.2) | -1.9% | 27.7% | ||||
| Allowance for impairment of mortgages | (429.6) | (626.7) | (692.5) | 10.5% | 61.2% | ||||
| Allowance for impairment of microcredit loans | (89.5) | (121.2) | (121.3) | 0.1% | 35.6% | ||||
| Total loans, net | 203,303.0 | 201,016.7 | 205,293.6 | 2.1% | 1.0% | ||||
| 5 | |
The following table shows the gross loan composition per product of each of our loan categories.
| Gross loans | 2Q20 | 1Q21 | 2Q21 | | |||||
| 2Q21 vs. 1Q21 | 2Q21 vs. 2Q20 | ||||||||
| General purpose | 81,815.3 | 82,185.2 | 83,041.8 | 1.0% | 1.5% | ||||
| Working capital | 21,197.9 | 16,927.7 | 17,868.2 | 5.6% | -15.7% | ||||
| Financial leases | 10,747.4 | 10,754.6 | 10,772.6 | 0.2% | 0.2% | ||||
| Funded by development banks | 3,950.9 | 3,741.8 | 3,619.5 | -3.3% | -8.4% | ||||
| Overdrafts | 635.5 | 567.7 | 524.6 | -7.6% | -17.4% | ||||
| Credit cards | 270.5 | 320.5 | 267.3 | -16.6% | -1.2% | ||||
| Commercial loans | 118,617.5 | 114,497.6 | 116,094.0 | 1.4% | -2.1% | ||||
| Payroll loans | 28,630.9 | 32,483.8 | 33,503.0 | 3.1% | 17.0% | ||||
| Personal loans | 11,451.6 | 11,292.0 | 11,410.2 | 1.0% | -0.4% | ||||
| Credit cards | 17,095.3 | 16,790.5 | 17,429.9 | 3.8% | 2.0% | ||||
| Automobile and vehicle | 7,447.8 | 7,468.8 | 7,625.5 | 2.1% | 2.4% | ||||
| Financial leases | 287.3 | 360.3 | 363.1 | 0.8% | 26.4% | ||||
| Overdrafts | 80.6 | 92.4 | 92.5 | 0.2% | 14.9% | ||||
| Other | 128.8 | 139.2 | 138.1 | -0.8% | 7.2% | ||||
| Consumer loans | 65,122.3 | 68,626.8 | 70,562.4 | 2.8% | 8.4% | ||||
| Mortgages | 23,510.1 | 24,181.7 | 24,919.0 | 3.0% | 6.0% | ||||
| Housing leases | 1,658.5 | 1,849.2 | 1,912.3 | 3.4% | 15.3% | ||||
| Mortgages loans | 25,168.6 | 26,030.9 | 26,831.3 | 3.1% | 6.6% | ||||
| Microcredit loans | 384.4 | 358.8 | 337.0 | -6.1% | -12.3% | ||||
| Gross loans | 209,292.9 | 209,514.1 | 213,824.8 | 2.1% | 2.2% | ||||
| Interbank & overnight funds | 3,585.4 | 2,561.9 | 2,725.7 | 6.4% | -24.0% | ||||
| Total gross loans | 212,878.3 | 212,076.0 | 216,550.5 | 2.1% | 1.7% | ||||
Over the last twelve months, guaranteed products such as payroll loans have driven our loan portfolio growth in accordance with our banks’ strategies.
In Colombia, gross loans increased by 1.5% during the last twelve months and 1.0% during the quarter. As for Central America, loans and receivables grew by 3.4% between June 30th, 2020 and June 30th, 2021 and 3.9% in the last quarter; when excluding FX, growth would have been 3.6% and 2.0%, respectively.
Commercial loans decreased by 2.1% over the year and grew 1.4% in the last quarter. In Colombia, commercial loans decreased by 4.4% annually and increased 0.4% over the quarter. As for Central America, commercial loans grew by 3.2% over the year and 3.6% in the last quarter; when excluding FX, growth in Central America would have been 3.4% and 1.7%, respectively.
Consumer loans growth over the last year and quarter was mainly driven by payrolls loans. In Colombia, Consumer loans grew by 11.3% during the last twelve months and 1.7% between March 31st, 2021 and June 30th, 2021. Growth of our Central American operations was 3.7% over the year and 4.9% in the last quarter, excluding FX, growth would have been 3.9% during the last twelve months and 2.9% in the quarter.
| 6 | |
The following table shows the loans and receivables composition per entity. During the last twelve months, Banco de Bogotá and Banco AVV Villas showed the highest growth rate within our banking operation in Colombia, for Banco de Bogotá driven by a strong performance in consumer loans which grew 11.3% and mortgages which grew 18.2% and for AVV Villas growth was driven by a 6.2% increase in consumer loans.
| Gross loans / Bank ($) | 2Q20 | 1Q21 | 2Q21 | | |||||
| 2Q21 vs. 1Q21 | 2Q21 vs. 2Q20 | ||||||||
| Banco de Bogotá | 141,757.5 | 142,669.8 | 145,860.4 | 2.2% | 2.9% | ||||
| Domestic | 65,237.0 | 66,527.1 | 66,746.8 | 0.3% | 2.3% | ||||
| Central America | 76,520.5 | 76,142.8 | 79,113.6 | 3.9% | 3.4% | ||||
| Banco de Occidente | 33,942.2 | 33,145.2 | 33,971.3 | 2.5% | 0.1% | ||||
| Banco Popular | 21,469.1 | 21,766.2 | 21,893.1 | 0.6% | 2.0% | ||||
| Banco AV Villas | 12,051.4 | 11,977.9 | 12,332.8 | 3.0% | 2.3% | ||||
| Corficolombiana | 1,821.3 | 1,739.8 | 1,766.7 | 1.5% | -3.0% | ||||
| Eliminations | (1,748.7) | (1,784.8) | (1,999.5) | 12.0% | 14.3% | ||||
| Gross loans | 209,292.9 | 209,514.1 | 213,824.8 | 2.1% | 2.2% | ||||
| Interbank & overnight funds | 3,585.4 | 2,561.9 | 2,725.7 | 6.4% | -24.0% | ||||
| Total gross loans | 212,878.3 | 212,076.0 | 216,550.5 | 2.1% | 1.7% | ||||
| Gross loans / Bank (%) | 2Q20 | 1Q21 | 2Q21 | |||
| Banco de Bogotá | 67.7% | 68.1% | 68.2% | |||
| Domestic | 31.2% | 31.8% | 31.2% | |||
| Central America | 36.6% | 36.3% | 37.0% | |||
| Banco de Occidente | 16.2% | 15.8% | 15.9% | |||
| Banco Popular | 10.3% | 10.4% | 10.2% | |||
| Banco AV Villas | 5.8% | 5.7% | 5.8% | |||
| Corficolombiana | 0.9% | 0.8% | 0.8% | |||
| Eliminations | -0.8% | -0.9% | -0.9% | |||
| Gross loans | 100% | 100% | 100% |
Of the total gross loans, 62.9% are domestic and 37.1% are foreign. In terms of gross loans (excluding interbank and overnight funds), 63.0% are domestic and 37.0% are foreign (reflecting the Central American operations).
| Gross loans | 2Q20 | 1Q21 | 2Q21 | | |||||
| 2Q21 vs. 1Q21 | 2Q21 vs. 2Q20 | ||||||||
| Domestic | |||||||||
| Commercial loans | 82,806.2 | 78,819.5 | 79,125.0 | 0.4% | -4.4% | ||||
| Consumer loans | 39,985.9 | 43,773.0 | 44,501.7 | 1.7% | 11.3% | ||||
| Mortgages loans | 9,595.8 | 10,420.0 | 10,747.4 | 3.1% | 12.0% | ||||
| Microcredit loans | 384.4 | 358.8 | 337.0 | -6.1% | -12.3% | ||||
| Interbank & overnight funds | 1,471.4 | 1,077.3 | 1,434.5 | 33.2% | -2.5% | ||||
| Total domestic loans | 134,243.7 | 134,448.6 | 136,145.7 | 1.3% | 1.4% | ||||
| Foreign | |||||||||
| Commercial loans | 35,811.2 | 35,678.1 | 36,969.0 | 3.6% | 3.2% | ||||
| Consumer loans | 25,136.4 | 24,853.8 | 26,060.7 | 4.9% | 3.7% | ||||
| Mortgages loans | 15,572.8 | 15,610.9 | 16,083.8 | 3.0% | 3.3% | ||||
| Microcredit loans | - | - | - | - | - | ||||
| Interbank & overnight funds | 2,114.0 | 1,484.6 | 1,291.3 | -13.0% | -38.9% | ||||
| Total foreign loans | 78,634.5 | 77,627.4 | 80,404.8 | 3.6% | 2.3% | ||||
| Total gross loans | 212,878.3 | 212,076.0 | 216,550.5 | 2.1% | 1.7% | ||||
| 7 | |
The quality of our loan portfolio was steady during the quarter.
Our 30 days PDL to total loans closed in 4.8% for 2Q21 and 1Q21, and 4.1% in 2Q20. The ratio of 90 days PDL to total loans was 3.4% for 2Q21 and 1Q21, and 3.0% in 2Q20.
Commercial loans 30 days PDL ratio was 4.3% for 2Q21, 4.4% for 1Q21 and 4.1% for 2Q20; 90 days PDL ratio was 3.8, 3.8% and 3.6%, respectively. Consumer loans 30 days PDL ratio was 5.3% for 2Q21, 5.2% for 1Q21 and 3.8% for 2Q20; 90 days PDL ratio was 3.0% for 2Q21, 2.9% for 1Q21 and 2.0% for 2Q20. Mortgages’ 30 days PDL ratio was 4.9% for 2Q21 and 1Q21, and 4.4% for 2Q20; 90 days PDL ratio was 2.8%, 2.9% and 2.7%, respectively.
| Total gross loans | 2Q20 | 1Q21 | 2Q21 | | |||||
| 2Q21 vs. 1Q21 | 2Q21 vs. 2Q20 | ||||||||
| ''A'' normal risk | 188,606.9 | 184,653.8 | 186,543.8 | 1.0% | -1.1% | ||||
| ''B'' acceptable risk | 6,491.7 | 8,070.9 | 8,646.9 | 7.1% | 33.2% | ||||
| ''C'' appreciable risk | 6,562.8 | 7,294.0 | 8,780.6 | 20.4% | 33.8% | ||||
| ''D'' significant risk | 3,875.4 | 5,877.4 | 6,096.3 | 3.7% | 57.3% | ||||
| ''E'' unrecoverable | 3,756.1 | 3,618.0 | 3,757.1 | 3.8% | 0.0% | ||||
| Gross loans | 209,292.9 | 209,514.1 | 213,824.8 | 2.1% | 2.2% | ||||
| Interbank and overnight funds | 3,585.4 | 2,561.9 | 2,725.7 | 6.4% | -24.0% | ||||
| Total gross loans | 212,878.3 | 212,076.0 | 216,550.5 | 2.1% | 1.7% | ||||
| CDE loans / gross loans (*) | 6.8% | 8.0% | 8.7% |
| Past due loans | 2Q20 | 1Q21 | 2Q21 | | |||||
| 2Q21 vs. 1Q21 | 2Q21 vs. 2Q20 | ||||||||
| Performing | 113,778.3 | 109,505.3 | 111,071.3 | 1.4% | -2.4% | ||||
| Between 31 and 90 days past due | 574.4 | 665.7 | 667.1 | 0.2% | 16.1% | ||||
| +90 days past due | 4,264.8 | 4,326.6 | 4,355.6 | 0.7% | 2.1% | ||||
| Commercial loans | 118,617.5 | 114,497.6 | 116,094.0 | 1.4% | -2.1% | ||||
| Performing | 62,647.4 | 65,040.6 | 66,827.2 | 2.7% | 6.7% | ||||
| Between 31 and 90 days past due | 1,198.3 | 1,609.3 | 1,625.6 | 1.0% | 35.7% | ||||
| +90 days past due | 1,276.6 | 1,977.0 | 2,109.7 | 6.7% | 65.3% | ||||
| Consumer loans | 65,122.3 | 68,626.8 | 70,562.4 | 2.8% | 8.4% | ||||
| Performing | 24,050.9 | 24,747.6 | 25,519.0 | 3.1% | 6.1% | ||||
| Between 31 and 90 days past due | 435.0 | 516.5 | 553.2 | 7.1% | 27.2% | ||||
| +90 days past due | 682.8 | 766.8 | 759.1 | -1.0% | 11.2% | ||||
| Mortgages loans | 25,168.6 | 26,030.9 | 26,831.3 | 3.1% | 6.6% | ||||
| Performing | 333.2 | 260.3 | 229.1 | -12.0% | -31.2% | ||||
| Between 31 and 90 days past due | 4.6 | 29.6 | 26.8 | -9.3% | N.A. | ||||
| +90 days past due | 46.7 | 68.9 | 81.1 | 17.7% | 73.8% | ||||
| Microcredit loans | 384.4 | 358.8 | 337.0 | -6.1% | -12.3% | ||||
| Gross loans | 209,292.9 | 209,514.1 | 213,824.8 | 2.1% | 2.2% | ||||
| Interbank & overnight funds | 3,585.4 | 2,561.9 | 2,725.7 | 6.4% | -24.0% | ||||
| Total gross loans | 212,878.3 | 212,076.0 | 216,550.5 | 2.1% | 1.7% | ||||
| 30 Days PDL / gross loans (*) | 4.1% | 4.8% | 4.8% | |||
| 90 Days PDL / gross loans (*) | 3.0% | 3.4% | 3.4% |
| Loans by stages (%) | 2Q20 | 1Q21 | 2Q21 | |||
| Loans classified as Stage 2 / gross loans | 6.5% | 13.9% | 13.2% | |||
| Loans classified as Stage 3 / gross loans | 5.5% | 6.1% | 6.4% | |||
| Loans classified as Stage 2 and 3 / gross loans | 12.0% | 20.0% | 19.6% | |||
| Allowance for Stage 1 loans / Stage 1 loans | 1.2% | 1.0% | 1.0% | |||
| Allowance for Stage 2 loans / Stage 2 loans | 12.6% | 10.8% | 10.5% | |||
| Allowance for Stage 3 loans / Stage 3 loans | 49.0% | 48.2% | 47.7% | |||
| Allowance for Stage 2 and 3 loans / Stage 2 and 3 loans | 29.3% | 22.2% | 22.7% |
(*) Gross loans exclude interbank and overnight funds. 30 days past due and 90 days past due are calculated on a capital plus interest accounts receivable basis.
| 8 | |
Grupo Aval’s coverage over its 90 days PDL was 1.5x for 2Q21, 1Q21 and 2Q20. Allowance to CDE Loans was 0.6x for 2Q21, 0.7x for 1Q21 and 2Q20, and allowance to 30 days PDL was 1.1x for 2Q21, 1Q21 and 2Q20. Impairment loss, net of recoveries of charged off assets to average gross loans was 2.0% in 2Q21, 2.2% in 1Q21 and 3.1% in 2Q20. Charge-offs to average gross loans was 2.1% in 2Q21, 2.7% in 1Q21, and 1.8% in 2Q20.
| Total gross loans | 2Q20 | 1Q21 | 2Q21 | |||
| Allowance for impairment / CDE loans | 0.7 | 0.7 | 0.6 | |||
| Allowance for impairment / 30 days PDL | 1.1 | 1.1 | 1.1 | |||
| Allowance for impairment / 90 days PDL | 1.5 | 1.5 | 1.5 | |||
| Allowance for impairment / gross loans (*) | 4.6% | 5.3% | 5.3% | |||
| Impairment loss / CDE loans | 0.5 | 0.3 | 0.3 | |||
| Impairment loss / 30 days PDL | 0.8 | 0.5 | 0.5 | |||
| Impairment loss / 90 days PDL | 1.0 | 0.7 | 0.6 | |||
| Impairment loss / average gross loans (*) | 3.2% | 2.4% | 2.2% | |||
| Impairment loss, net of recoveries of charged-off assets / average gross loans (*) | 3.1% | 2.2% | 2.0% | |||
| Charge-offs / average gross loans (*) | 1.8% | 2.7% | 2.1% |
(*) Gross loans exclude interbank and overnight funds. 30 days past due and 90 days past due are calculated on a capital plus interest accounts receivable basis.
1.2 Investment securities and trading assets
Total investment securities and trading assets increased 19.7% to Ps 53,276.5 billion between June 30th, 2020 and June 30th , 2021 and 2.1% versus March 31st , 2021. Ps 45,837.0 billion of our total portfolio is invested in debt securities, which increased by 22.2% between June 30th, 2020 and June 30th , 2021 and by 1.6% since March 31st , 2021. Ps 6,734.3 billion of our total investment securities is invested in equity securities, which increased by 19.8% between June 30th, 2020 and June 30th , 2021 and by 7.7% versus March 31st , 2021.
| Investment and trading assets | 2Q20 | 1Q21 | 2Q21 | | |||||
| 2Q21 vs. 1Q21 | 2Q21 vs. 2Q20 | ||||||||
| Debt securities | 5,600.7 | 5,844.5 | 5,418.1 | -7.3% | -3.3% | ||||
| Equity securities | 4,234.8 | 4,713.7 | 5,264.1 | 11.7% | 24.3% | ||||
| Derivative assets | 1,368.5 | 835.4 | 705.2 | -15.6% | -48.5% | ||||
| Trading assets | 11,204.1 | 11,393.6 | 11,387.4 | -0.1% | 1.6% | ||||
| Investments in debt securities at FVTPL (non compliant with SPPI test) | 8.8 | 6.6 | 6.0 | -10.2% | -32.4% | ||||
| Debt securities at FVOCI | 27,001.1 | 33,550.0 | 34,683.1 | 3.4% | 28.5% | ||||
| Equity securities at FVOCI | 1,384.8 | 1,539.0 | 1,470.2 | -4.5% | 6.2% | ||||
| Investments in securities at FVOCI | 28,386.0 | 35,089.0 | 36,153.3 | 3.0% | 27.4% | ||||
| Investments in debt securities at AC | 4,907.8 | 5,695.0 | 5,729.8 | 0.6% | 16.7% | ||||
| Investment and trading assets | 44,506.7 | 52,184.2 | 53,276.5 | 2.1% | 19.7% | ||||
| 9 | |
The average yield on our debt and equity investment securities (trading assets, investments in debt securities at FVTPL, investments in securities at FVOCI and investments in debt securities at AC) was 3.8% for 2Q21, 2.0% for 1Q21 and 6.6% in 2Q20.
1.3 Cash and Cash Equivalents
As of June 30th , 2021 cash and cash equivalents had a balance of Ps 35,613.6 billion showing a decrease of 11.2% versus June 30th , 2020 and increasing 1.4% versus March 31st, 2021 (-11.1% and 0.4% excluding FX).
The ratio of cash and cash equivalents to customer deposits was 15.8% at June 30th, 2021 and March 31st, 2021, and 18.9% at June 30th , 2020.
1.4 Goodwill and Other Intangibles
Goodwill and other intangibles as of June 30th, 2021 reached Ps 19,997.4 billion, increasing by 12.0% versus June 30th, 2020 and 3.3% versus March 31st, 2021.
Goodwill as of June 30th, 2021 was Ps 8,221.9 billion, decreasing by 0.2% versus June 30th 2020 and increasing 1.4% versus March 31st, 2021.
Other intangibles, which include “concession arrangement rights” and other intangibles, mainly reflect the value of road concessions recorded for the most part at Corficolombiana. Other intangibles as of June 30th, 2021 reached Ps 11,775.5 billion and grew by 22.4% versus June 30th, 2020 and 4.7% versus March 31st, 2021.
2. Liabilities
As of June 30th, 2021 Total Funding represented 94.3% of total liabilities and other liabilities represented 5.7%.
2.1 Funding
Total Funding (Total financial liabilities at amortized cost) which includes (i) Customer deposits, (ii) Interbank borrowings and overnight funds, (iii) Borrowings from banks and others, (iv) Bonds issued, and (v) Borrowing from development entities had a balance of Ps 289,655.3 billion as of June 30th, 2021 showing an increase of 2.5% versus June 30th, 2020 and 1.9% versus March 31st, 2021 (2.5% and 1.2% excluding FX). Total customer deposits represented 77.9% of total funding as of the end of 2Q21, 78.1% for 1Q21 and 75.1% for 2Q20.
Average cost of funds was 2.3% for 2Q21, 2.4% for 1Q21 and 3.3% for 2Q20.
| 10 | |
2.1.1 Customer deposits
| Customer deposits | 2Q20 | 1Q21 | 2Q21 | | |||||
| 2Q21 vs. 1Q21 | 2Q21 vs. 2Q20 | ||||||||
| Checking accounts | 25,290.1 | 22,486.4 | 22,993.5 | 2.3% | -9.1% | ||||
| Other deposits | 499.8 | 430.0 | 619.2 | 44.0% | 23.9% | ||||
| Non-interest bearing | 25,789.9 | 22,916.4 | 23,612.7 | 3.0% | -8.4% | ||||
| Checking accounts | 26,486.3 | 32,803.2 | 32,887.2 | 0.3% | 24.2% | ||||
| Time deposits | 86,638.2 | 85,597.1 | 84,637.9 | -1.1% | -2.3% | ||||
| Savings deposits | 73,301.6 | 80,761.0 | 84,635.6 | 4.8% | 15.5% | ||||
| Interest bearing | 186,426.2 | 199,161.3 | 202,160.7 | 1.5% | 8.4% | ||||
| Customer deposits | 212,216.0 | 222,077.7 | 225,773.4 | 1.7% | 6.4% | ||||
Of our total customer deposits as of June 30th, 2021 checking accounts represented 24.8%, time deposits 37.5%, savings accounts 37.5%, and other deposits 0.3%.
The following table shows the customer deposits composition by bank. During the last twelve months, Banco de Occidente showed the highest growth rate in customer deposits within our banking operation in Colombia.
| Deposits / Bank ($) | 2Q20 | 1Q21 | 2Q21 | | |||||
| 2Q21 vs. 1Q21 | 2Q21 vs. 2Q20 | ||||||||
| Banco de Bogotá | 148,550.2 | 154,927.8 | 158,944.4 | 2.6% | 7.0% | ||||
| Domestic | 67,964.0 | 67,049.7 | 69,206.1 | 3.2% | 1.8% | ||||
| Central America | 80,586.2 | 87,878.1 | 89,738.3 | 2.1% | 11.4% | ||||
| Banco de Occidente | 30,764.9 | 34,117.7 | 32,552.0 | -4.6% | 5.8% | ||||
| Banco Popular | 21,579.6 | 20,570.5 | 21,195.4 | 3.0% | -1.8% | ||||
| Banco AV Villas | 12,821.0 | 13,036.5 | 12,772.3 | -2.0% | -0.4% | ||||
| Corficolombiana | 4,765.1 | 4,934.3 | 5,473.6 | 10.9% | 14.9% | ||||
| Eliminations | (6,264.7) | (5,509.1) | (5,164.3) | -6.3% | -17.6% | ||||
| Total Grupo Aval | 212,216.0 | 222,077.7 | 225,773.4 | 1.7% | 6.4% | ||||
| Deposits / Bank (%) | 2Q20 | 1Q21 | 2Q21 | ||||||
| Banco de Bogotá | 70.0% | 69.8% | 70.4% | ||||||
| Domestic | 32.0% | 30.2% | 30.7% | ||||||
| Central America | 38.0% | 39.6% | 39.7% | ||||||
| Banco de Occidente | 14.5% | 15.4% | 14.4% | ||||||
| Banco Popular | 10.2% | 9.3% | 9.4% | ||||||
| Banco AV Villas | 6.0% | 5.9% | 5.7% | ||||||
| Corficolombiana | 2.2% | 2.2% | 2.4% | ||||||
| Eliminations | -3.0% | -2.5% | -2.3% | ||||||
| Total Grupo Aval | 100.0% | 100.0% | 100.0% |
| 11 | |
2.1.2 Borrowings from Banks and Other (includes borrowings from development entities)
As of June 30th, 2021 borrowings from banks and other totaled Ps 24,115.7 billion, decreasing 21.4% annually and increasing 4.8% versus March 31st, 2021. Excluding FX, borrowings from banks and other decreased 21.3% versus June 30th, 2020 and increased 4.1% versus March 31st, 2021.
2.1.3 Bonds issued
Total bonds issued as of June 30th, 2021 totaled Ps 29,941.5 billion and increased 3.9% versus June 30th, 2020 and 0.7% versus March 31st, 2021. Excluding FX, bonds increased 3.9% versus June 30th, 2020 and 0.4% versus March 31st, 2021.
3. Non-controlling Interest
Non-controlling Interest in Grupo Aval reflects: (i) the minority stakes that third party shareholders hold in each of its direct consolidated subsidiaries (Banco de Bogotá, Banco de Occidente, Banco Popular, Banco AV Villas and Corficolombiana), and (ii) the minority stakes that third party shareholders hold in the consolidated subsidiaries at the bank level (mainly Porvenir). As of June 30th, 2021 non-controlling interest was Ps 15,493.9 billion which increased by 9.0% versus June 30th, 2020 and 4.6% versus March 31st, 2021. Total non-controlling interest represents 41.9% of total equity as of 2Q21, compared to 42.1% in 1Q21 and 41.6% in 2Q20. Total non-controlling interest derives from the sum of the combined minority interests of our banks and of Grupo Aval, applying eliminations associated with the consolidation process of Grupo Aval.
| Percentage consolidated by Aval | 2Q20 | 1Q21 | 2Q21 | | |||||
| 2Q21 vs. 1Q21 | 2Q21 vs. 2Q20 | ||||||||
| Banco de Bogotá | 68.7% | 68.7% | 68.7% | - | - | ||||
| Banco de Occidente | 72.3% | 72.3% | 72.3% | - | - | ||||
| Banco Popular | 93.7% | 93.7% | 93.7% | - | - | ||||
| Banco AV Villas | 79.9% | 79.9% | 79.9% | - | - | ||||
| BAC Credomatic (1) | 68.7% | 68.7% | 68.7% | - | - | ||||
| Porvenir (2) | 75.7% | 75.7% | 75.7% | - | 0 | ||||
| Corficolombiana | 38.6% | 39.6% | 40.0% | 40 | 135 | ||||
(1) BAC Credomatic is fully owned by Banco de Bogotá; (2) Grupo Aval indirectly owns a 100% of Porvenir as follows: 20.0% in Grupo Aval, 46.9% in Banco de Bogotá and 33.1% in Banco de Occidente. Porvenir's results consolidate into Banco de Bogotá.
4. Attributable Shareholders’ Equity
Attributable shareholders’ equity as of June 30th, 2021 was Ps 21,455.0 billion, showing an increase of 7.6% versus June 30th, 2020 and of 5.3% versus March 31st, 2021.
| 12 | |
Income Statement Analysis
Our net income attributable to the owners of the parent company for 2Q21 of Ps 949.5 billion showed a 193.6% increase versus 2Q20 and a 19.9% increase versus 1Q21.
| Consolidated Statement of Income | 2Q20 | 1Q21 | 2Q21 | | |||||
| 2Q21 vs. 1Q21 | 2Q21 vs. 2Q20 | ||||||||
| Interest income | 5,199.9 | 4,702.4 | 4,798.3 | 2.0% | -7.7% | ||||
| Interest expense | 2,246.4 | 1,657.0 | 1,645.4 | -0.7% | -26.8% | ||||
| Net interest income | 2,953.6 | 3,045.4 | 3,152.9 | 3.5% | 6.8% | ||||
| Loans and other accounts receivable | 1,642.1 | 1,233.3 | 1,171.2 | -5.0% | -28.7% | ||||
| Other financial assets | 43.6 | 15.6 | (8.3) | -153.3% | -119.1% | ||||
| Recovery of charged-off financial assets | (56.0) | (91.7) | (118.5) | 29.2% | 111.6% | ||||
| Net impairment loss on financial assets | 1,629.6 | 1,157.2 | 1,044.4 | -9.7% | -35.9% | ||||
| Net income from commissions and fees | 1,094.5 | 1,346.8 | 1,304.9 | -3.1% | 19.2% | ||||
| Gross profit from sales of goods and services | 239.4 | 770.7 | 940.9 | 22.1% | N.A. | ||||
| Net trading income | (93.6) | 197.6 | 269.0 | 36.1% | N.A | ||||
| Net income from other financial instruments mandatory at FVTPL | 59.7 | 81.6 | 62.8 | -23.1% | 5.2% | ||||
| Total other income | 853.2 | 327.9 | 306.9 | -6.4% | -64.0% | ||||
| Total other expenses | 2,621.6 | 2,581.1 | 2,739.2 | 6.1% | 4.5% | ||||
| Net income before income tax expense | 855.6 | 2,031.7 | 2,253.8 | 10.9% | 163.4% | ||||
| Income tax expense | 214.6 | 580.1 | 538.8 | -7.1% | 151.0% | ||||
| Net income for the period | 641.0 | 1,451.6 | 1,715.0 | 18.1% | 167.6% | ||||
| Non-controlling interest | 317.6 | 659.8 | 765.5 | 16.0% | 141.0% | ||||
| Net income attributable to owners of the parent | 323.4 | 791.8 | 949.5 | 19.9% | 193.6% | ||||
1. Net Interest Income
| Net interest income | 2Q20 | 1Q21 | 2Q21 | | |||||
| 2Q21 vs. 1Q21 | 2Q21 vs. 2Q20 | ||||||||
| Interest income | |||||||||
| Commercial | 1,963.6 | 1,600.4 | 1,605.0 | 0.3% | -18.3% | ||||
| Interbank and overnight funds | 43.7 | 41.5 | 37.1 | -10.5% | -15.1% | ||||
| Consumer | 2,374.0 | 2,205.1 | 2,259.1 | 2.5% | -4.8% | ||||
| Mortgages and housing leases | 466.1 | 480.5 | 497.4 | 3.5% | 6.7% | ||||
| Microcredit | 22.5 | 21.8 | 20.5 | -5.8% | -8.9% | ||||
| Loan portfolio | 4,870.0 | 4,349.2 | 4,419.0 | 1.6% | -9.3% | ||||
| Interests on investments in debt securities | 330.0 | 353.2 | 379.2 | 7.4% | 14.9% | ||||
| Total interest income | 5,199.9 | 4,702.4 | 4,798.3 | 2.0% | -7.7% | ||||
| Interest expense | |||||||||
| Checking accounts | 81.7 | 71.2 | 66.5 | -6.6% | -18.7% | ||||
| Time deposits | 968.9 | 770.9 | 737.9 | -4.3% | -23.8% | ||||
| Savings deposits | 422.4 | 244.6 | 248.6 | 1.6% | -41.2% | ||||
| Total interest expenses on deposits | 1,473.0 | 1,086.7 | 1,052.9 | -3.1% | -28.5% | ||||
| Interbank borrowings and overnight funds | 97.7 | 24.4 | 40.1 | 64.4% | -59.0% | ||||
| Borrowings from banks and others | 242.3 | 160.1 | 156.5 | -2.3% | -35.4% | ||||
| Bonds issued | 397.8 | 362.5 | 374.3 | 3.2% | -5.9% | ||||
| Borrowings from development entities | 35.7 | 23.3 | 21.6 | -7.3% | -39.4% | ||||
| Total interest expenses on financial obligations | 773.4 | 570.4 | 592.5 | 3.9% | -23.4% | ||||
| Total interest expense | 2,246.4 | 1,657.0 | 1,645.4 | -0.7% | -26.8% | ||||
| Net interest income | 2,953.6 | 3,045.4 | 3,152.9 | 3.5% | 6.8% | ||||
| 13 | |
Our net interest income increased by 6.8% to Ps 3,152.9 billion for 2Q21 versus 2Q20 and by 3.5% versus 1Q21.The increase versus 2Q20 was derived mainly from a 26.8% decrease in total interest expense.
Our Net Interest Margin(1) was 4.9% for 2Q21, 4.6% in 1Q21 and 5.3% in 2Q20. Net Interest Margin on Loans was 5.8% for 2Q21, 1Q21 and 2Q20. On the other hand, our Net Investments Margin was 1.4% in 2Q21, -0.4% in 1Q21 and 2.9% in 2Q20.
In our Colombian operations, our Net Interest Margin was 4.9% for 2Q21 and 4.3% for 1Q21 and 4.9% in 2Q20. Net Interest Margin on Loans was 5.7% for 2Q21 and 1Q21, versus 5.3% in 2Q20. On the other hand, our Net Investments Margin was 1.6% in 2Q21 versus -1.2% in 1Q21 and 3.4% in 2Q20.
In our Central American operations, our Net Interest Margin was 5.0% for 2Q21 and 1Q21 versus 6.0% in 2Q20. Net Interest Margin on Loans was 6.0% for 2Q21 and 5.9% in 1Q21, and 6.8% in 2Q20. On the other hand, our Net Investments Margin was 1.2% for 2Q21 and 1Q21 versus 1.5% in 2Q20.
2. Impairment loss on financial assets, net
Our impairment loss on financial assets, net decreased by 35.9% to Ps 1,044.4 billion for 2Q21 versus 2Q20 and decreased by 9.7% versus 1Q21.
| Net impairment loss on financial assets | 2Q20 | 1Q21 | 2Q21 | | |||||
| 2Q21 vs. 1Q21 | 2Q21 vs. 2Q20 | ||||||||
| Loans and other accounts receivable | 1,642.1 | 1,233.3 | 1,171.2 | -5.0% | -28.7% | ||||
| Other financial assets | 43.6 | 15.6 | (8.3) | -153.3% | -119.1% | ||||
| Recovery of charged-off financial assets | (56.0) | (91.7) | (118.5) | 29.2% | 111.6% | ||||
| Net impairment loss on financial assets | 1,629.6 | 1,157.2 | 1,044.4 | -9.7% | -35.9% | ||||
Our annualized gross cost of risk was 2.2% for 2Q21, 2.4% for 1Q21 and 3.2% for 2Q20. Net of recoveries of charged-off assets our ratio was 2.0% for 2Q21, 2.2% for 1Q21 and 3.1% for 2Q20.
| (1) | Grupo Aval’s NIM without income from trading securities and investment in debt securities designated at fair value through profit and loss (non compliant with SPPI test) was 5.0% for 2Q21 and 2Q20, and 4.9% for 1Q21. |
| 14 | |
3. Non-interest income
| Total non-interest income | 2Q20 | 1Q21 | 2Q21 | | |||||
| 2Q21 vs. 1Q21 | 2Q21 vs. 2Q20 | ||||||||
| Income from commissions and fees | |||||||||
| Banking fees (1) | 893.5 | 1,108.4 | 1,078.1 | -2.7% | 20.7% | ||||
| Trust activities | 78.9 | 88.6 | 81.5 | -8.0% | 3.3% | ||||
| Pension and severance fund management | 260.9 | 315.9 | 296.3 | -6.2% | 13.6% | ||||
| Bonded warehouse services | 35.0 | 38.0 | 38.7 | 1.9% | 10.8% | ||||
| Total income from commissions and fees | 1,268.3 | 1,550.9 | 1,494.6 | -3.6% | 17.9% | ||||
| Expenses from commissions and fees | 173.7 | 204.2 | 189.7 | -7.1% | 9.2% | ||||
| Net income from commissions and fees | 1,094.5 | 1,346.8 | 1,304.9 | -3.1% | 19.2% | ||||
| Income from sales of goods and services | 1,528.3 | 2,373.5 | 2,668.5 | 12.4% | 74.6% | ||||
| Costs and expenses from sales of goods and services | 1,288.9 | 1,602.8 | 1,727.6 | 7.8% | 34.0% | ||||
| Gross profit from sales of goods and services | 239.4 | 770.7 | 940.9 | 22.1% | 293.0% | ||||
| Net trading income | (93.6) | 197.6 | 269.0 | 36.1% | N.A | ||||
| Net income from other financial instruments mandatory at FVTPL | 59.7 | 81.6 | 62.8 | -23.1% | 5.2% | ||||
| Other income | |||||||||
| Foreign exchange gains (losses), net | 557.7 | (70.4) | 47.5 | -167.5% | -91.5% | ||||
| Net gain on sale of investments and OCI realization | 106.2 | 129.1 | 74.6 | -42.2% | -29.8% | ||||
| Gain on the sale of non-current assets held for sale | 6.6 | 8.7 | 10.7 | 22.7% | 61.1% | ||||
| Income from non-consolidated investments (2) | 43.4 | 164.0 | 87.0 | -47.0% | 100.6% | ||||
| Net gains on asset valuations | (1.8) | 2.0 | (0.0) | -101.4% | -98.5% | ||||
| Other income from operations | 141.1 | 94.4 | 87.2 | -7.7% | -38.2% | ||||
| Total other income | 853.2 | 327.9 | 306.9 | -6.4% | -64.0% | ||||
| Total non-interest income | 2,153.3 | 2,724.6 | 2,884.5 | 5.9% | 34.0% | ||||
(1)Includes commissions on banking services, office network services, credit and debit card fees, fees on drafts, checks and checkbooks and other fees
(2) Includes share of profit of equity accounted investees, net of tax, and dividend income.
3.1 Net income from commissions and fees
Net income from commissions and fees totaled Ps 1,304.9 billion and increased by 19.2% annually and decreased 3.1% in the quarter. Income from commissions and fees increased by 17.9% to Ps 1,494.6 billion in 2Q21 versus 2Q20 but decreased 3.6% in the quarter. Excluding FX, net income from commissions increased 21.2% and decreased 4.8%, respectively. In Colombia, net income from commissions and fees increased by 19.0% over the last year but decreased 3.9% over the quarter. In Central America, net income from commissions and fees increased by 19.5% over the last year and decreased 2.2% over the quarter; excluding FX, net income increased by 24.1% over the last year and decreased 5.9% during the quarter.
3.2 Gross profit from sales of goods and services
Gross profit from sales of goods and services (non-financial sector) increased by 22.1% to Ps 940.9 billion for 2Q21 versus 1Q21, the quarterly increase was due to a strong contribution from the infrastructure and energy & gas sectors.
| 15 | |
3.3 Net trading income
| Net trading income | 2Q20 | 1Q21 | 2Q21 | | |||||
| 2Q21 vs. 1Q21 | 2Q21 vs. 2Q20 | ||||||||
| Trading investment income | 316.8 | (111.9) | 104.8 | -193.7% | -66.9% | ||||
| Net income (loss) on financial derivatives | (364.0) | 284.2 | 139.8 | -50.8% | -138.4% | ||||
| Other trading income on derivatives | (46.4) | 25.3 | 24.4 | -3.5% | -152.6% | ||||
| Net trading income | (93.6) | 197.6 | 269.0 | 36.1% | N.A | ||||
Net trading income for Grupo Aval should be analyzed in conjunction with the foreign exchange gains (losses).
3.4 Other income
Total other income for 2Q21 totaled Ps 306.9 billion decreasing by 64.0% versus 2Q20 and 6.4% versus 1Q21. The yearly decrease was mainly driven lower foreign exchange gains, net in our Colombia operations and lower gains on sale of investments. The quarterly decrease can be explained by lower income from non-consolidated investments associated to dividends paid during 1Q21 and lower gains on sale of investments.
4. Other expenses
Total other expenses for 2Q21 totaled Ps 2,739.2 billion and increased 4.5% annually and 6.1% quarterly (6.2% and 4.3% excluding FX). Our efficiency ratio measured as total other expenses to total income was 45.4% in 2Q21, 44.7% in 1Q21 and 51.3% in 2Q20. The ratio of annualized total other expenses as a percentage of average total assets was 3.2% in 2Q21 and 2Q20, and 3.1% in 1Q21.
In Colombia, our efficiency ratio measured as total other expenses to total income, was 39.0% in 2Q21, 38.3% in 1Q21 and 47.4% in 2Q20. The ratio of annualized total other expenses as a percentage of average total assets was 2.8% in 2Q21 and 2Q20, and 2.7% in 1Q21.
In Central America, our efficiency ratio measured as total other expenses to total income, was 57.6% in 2Q21, 57.1% in 1Q21 and 57.8% in 2Q20. The ratio of annualized total other expenses as a percentage of average total assets was 3.9% in 2Q21 and 1Q21, and 4.0% in 2Q20.
5. Non-controlling Interest
Non-controlling interest in Grupo Aval reflects: (i) the minority stakes that third party shareholders hold in each of its direct consolidated subsidiaries (Banco de Bogotá, Banco de Occidente, Banco Popular, Banco AV Villas and Corficolombiana), and (ii) the minority stakes that third party shareholders hold in the consolidated subsidiaries at the bank level (mainly Porvenir). For 2Q21, non-controlling interest in the income statement was Ps 765.5 billion, showing a 141.0% increase versus 2Q20 and of 16.0% versus 1Q21. The ratio of non-controlling interest to income before non-controlling interest was 44.6% in 2Q21, 45.5% in 1Q21 and 49.6% in 2Q20.
| 16 | |
Information related to Grupo Aval’s consolidated financial statements by geography
Grupo Aval Acciones y Valores S.A. - Colombian Operation
Financial Statements Under Full IFRS
Information in Ps. Billions
| 2Q20 | 1Q21 | 2Q21 | | |||||||
| 2Q21 vs. 1Q21 | 2Q21 vs. 2Q20 | |||||||||
| Gross loans and receivables | 132,772.4 | 133,371.3 | 134,711.2 | 1.0% | 1.5% | |||||
| Total assets | 213,888.5 | 216,255.9 | 221,135.5 | 2.3% | 3.4% | |||||
| Customer deposits | 131,629.9 | 134,199.6 | 136,035.1 | 1.4% | 3.3% | |||||
| Total liabilities | 197,380.3 | 197,242.5 | 201,242.6 | 2.0% | 2.0% | |||||
| Net income for the period | 401.7 | 1,058.2 | 1,292.0 | 22.1% | N.A. | |||||
| Net income attributable to owners of the parent | 158.9 | 521.5 | 658.8 | 26.3% | N.A. | |||||
| YTD 2020 | YTD 2021 | | ||||||||
| 2021 vs. 2020 | ||||||||||
| Net income for the period | 1,303.6 | 2,350.2 | 80.3% | |||||||
| A | Net income attributable to owners of the parent | 554.0 | 1,180.2 | 113.0% | ||||||
Leasing Bogotá Panamá S.A.(1)
Financial Statements Under IFRS
Information in Ps. Billions
| 2Q20 | 1Q21 | 2Q21 | | |||||||
| 2Q21 vs. 1Q21 | 2Q21 vs. 2Q20 | |||||||||
| Gross loans and receivables | 76,520.5 | 76,142.8 | 79,113.6 | 3.9% | 3.4% | |||||
| Total assets | 119,075.0 | 120,655.7 | 123,116.3 | 2.0% | 3.4% | |||||
| Customer deposits | 80,586.2 | 87,878.1 | 89,738.3 | 2.1% | 11.4% | |||||
| Total liabilities | 101,422.4 | 104,474.1 | 106,059.8 | 1.5% | 4.6% | |||||
| Net income for the period | 239.3 | 393.4 | 423.0 | 7.5% | 76.8% | |||||
| Net income attributable to owners of the parent | 164.5 | 270.3 | 290.7 | 7.6% | 76.8% | |||||
| YTD 2020 | YTD 2021 | | ||||||||
| 2021 vs. 2020 | ||||||||||
| Net income for the period | 683.2 | 816.4 | 19.5% | |||||||
| B | Net income attributable to owners of the parent | 469.5 | 561.0 | 19.5% | ||||||
| A+B | Net income attributable to owners of the parent | 1,023.6 | 1,741.3 | 70.1% | ||||||
(1) Leasing Bogotá Panamá is the holding company that consolidates our Central American operations.
| 17 | |
Information related to Grupo Aval Acciones y Valores S.A. (Holding Company) and Grupo Aval Limited
The holding company recorded a total gross indebtedness of Ps 1,660.1 billion (Ps 529.7 billion of bank debt and Ps 1,130.4 billion of bonds denominated in Colombian pesos) as of June 30th 2021. It also guarantees irrevocably and unconditionally Grupo Aval Limited’s (144A / Reg S) 2022 (USD 1.0 billion) bonds and Grupo Aval Limited’s (144A / Reg S) 2030 (USD 1.0 billion) bonds under its respective indentures. As of June 30th, 2021 the total amount outstanding (including interests payable) of such bonds was USD 2.0 billion, or Ps 7,578.0 billion when translated into pesos.
The debt at Grupo Aval Limited is serviced with interest income on loans to subsidiaries and cash & cash equivalents. Grupo Aval Limited has not required, to this date, cash from Grupo Aval Acciones y Valores S.A. to fulfill its obligations. The main sources of cash to pay the debt and debt service at Grupo Aval Acciones y Valores S.A. have been the dividend income from its subsidiaries and the returns on its cash & cash equivalents.
When combined, Grupo Aval Acciones y Valores S.A. and Grupo Aval Ltd. had Ps 3,230.5 billion of total liquid assets, a total gross indebtedness of Ps 9,238.1 billion and a net indebtedness (including callable senior loans to subsidiaries) of Ps 6,007.7 billion as of June 30th, 2021. In addition to liquid assets, Grupo Aval Ltd. has Ps 2,041.1 billion in other loans to subsidiaries and investments in AT1 instruments of Ps 1,942.2 billion.
| Total liquid assets as of June 30, 2021 | |
| Cash and cash equivalents | 2,229.8 |
| Fixed income investments | 311.0 |
| Callable Senior loans to subsidiaries | 689.7 |
| Total liquid assets | 3,230.5 |
 | Maturity schedule of our combined gross debt
|
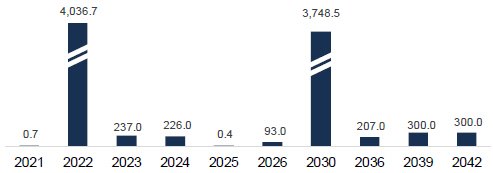
As of June 30th, 2021 our combined double leverage (calculated as investments in subsidiaries at book value, subordinated loans to subsidiaries and goodwill as a percentage of shareholders' equity) was 1.19x. Finally, we present an evolution of our key ratios on a combined basis:
| Debt service coverage and leverage ratios | 2Q20 | 1Q21 | 2Q21 | | |||||
| 2Q21 vs. 1Q21 | 2Q21 vs. 2Q20 | ||||||||
| Double leverage (1) | 1.20x | 1.19x | 1.19x | -0.01 | -0.01 | ||||
| Net debt / Core earnings (2)(3) | 3.3x | 3.5x | 3.9x | 0.40 | 0.58 | ||||
| Net debt / Cash dividends (2)(3) | 4.3x | 4.7x | 5.8x | 1.16 | 1.52 | ||||
| Core Earnings / Interest Expense (2) | 3.9x | 4.6x | 4.1x | -0.53 | 0.19 | ||||
(1) Double leverage is calculated as investments in subsidiaries at book value (excluding revaluations), subordinated loans to subsidiaries and goodwill as a percentage of shareholders' equity; (2) Core earnings are defined as annualized recurring cash flow from dividends, investments and net operating income; (3) Net debt is calculated as total gross debt minus cash and cash equivalents and fixed income investments
| 18 | |
ABOUT GRUPO AVAL
Grupo Aval is Colombia’s largest banking group, and through our BAC Credomatic and Multi Financial Group operations it is also the largest and one of the most profitable banking groups in Central America. Grupo Aval currently operates through four commercial banks in Colombia (Banco de Bogotá, Banco de Occidente, Banco Popular and Banco AV Villas). It manages pension and severance funds through the largest pension and severance fund manager in Colombia (Porvenir) and owns the largest merchant bank in Colombia (Corficolombiana), each of which Aval controls and consolidates into its results.
Investor Relations Contact
Alejo Sánchez García
Strategic Planning and Investor Relations Manager
Tel: +571 743 32 22 x 23422
E-mail: asanchez@grupoaval.com
| 19 | |
Grupo Aval Acciones y Valores S.A.
Consolidated Financial Statements Under IFRS
Financial Statements Under IFRS
Information in Ps. Billions
| Consolidated Statement of Financial Position | 2Q20 | 1Q21 | 2Q21 | | |||||
| 2Q21 vs. 1Q21 | 2Q21 vs. 2Q20 | ||||||||
| Cash and cash equivalents | 40,109.2 | 35,132.0 | 35,613.6 | 1.4% | -11.2% | ||||
| Investment and trading assets | |||||||||
| Debt securities | 5,600.7 | 5,844.5 | 5,418.1 | -7.3% | -3.3% | ||||
| Equity securities | 4,234.8 | 4,713.7 | 5,264.1 | 11.7% | 24.3% | ||||
| Derivative assets | 1,368.5 | 835.4 | 705.2 | -15.6% | -48.5% | ||||
| Trading assets | 11,204.1 | 11,393.6 | 11,387.4 | -0.1% | 1.6% | ||||
| Investments in debt securities at FVTPL (non compliant with SPPI test) | 8.8 | 6.6 | 6.0 | -10.2% | -32.4% | ||||
| Investments in securities at FVOCI | 28,386.0 | 35,089.0 | 36,153.3 | 3.0% | 27.4% | ||||
| Investments in debt securities at AC | 4,907.8 | 5,695.0 | 5,729.8 | 0.6% | 16.7% | ||||
| Investment securities | 33,302.6 | 40,790.6 | 41,889.0 | 2.7% | 25.8% | ||||
| Hedging derivatives assets | 129.0 | 29.5 | 39.7 | 34.6% | -69.2% | ||||
| Gross loans | |||||||||
| Commercial loans | 122,202.9 | 117,059.5 | 118,819.8 | 1.5% | -2.8% | ||||
| Commercial loans | 118,617.5 | 114,497.6 | 116,094.0 | 1.4% | -2.1% | ||||
| Interbank & overnight funds | 3,585.4 | 2,561.9 | 2,725.7 | 6.4% | -24.0% | ||||
| Consumer loans | 65,122.3 | 68,626.8 | 70,562.4 | 2.8% | 8.4% | ||||
| Mortgages loans | 25,168.6 | 26,030.9 | 26,831.3 | 3.1% | 6.6% | ||||
| Microcredit loans | 384.4 | 358.8 | 337.0 | -6.1% | -12.3% | ||||
| Total gross loans | 212,878.3 | 212,076.0 | 216,550.5 | 2.1% | 1.7% | ||||
| Loss allowance | (9,575.2) | (11,059.2) | (11,256.9) | 1.8% | 17.6% | ||||
| Total loans, net | 203,303.0 | 201,016.7 | 205,293.6 | 2.1% | 1.0% | ||||
| Other accounts receivable, net | 13,548.9 | 16,310.0 | 16,893.4 | 3.6% | 24.7% | ||||
| Non-current assets held for sale | 441.1 | 250.6 | 125.4 | -49.9% | -71.6% | ||||
| Investments in associates and joint ventures | 999.5 | 969.8 | 1,057.1 | 9.0% | 5.8% | ||||
| Own-use property, plant and equipment for own-use and given in operating lease, net | 6,070.0 | 6,022.6 | 5,974.4 | -0.8% | -1.6% | ||||
| Right-of-use assets | 2,328.0 | 2,031.4 | 1,936.4 | -4.7% | -16.8% | ||||
| Investment properties | 927.8 | 827.5 | 832.2 | 0.6% | -10.3% | ||||
| Biological assets | 112.0 | 124.5 | 130.8 | 5.1% | 16.8% | ||||
| Tangible assets | 9,437.8 | 9,006.0 | 8,873.8 | -1.5% | -6.0% | ||||
| Goodwill | 8,236.5 | 8,109.6 | 8,221.9 | 1.4% | -0.2% | ||||
| Concession arrangement rights | 8,154.6 | 9,540.9 | 10,025.0 | 5.1% | 22.9% | ||||
| Other intangible assets | 1,465.8 | 1,704.8 | 1,750.5 | 2.7% | 19.4% | ||||
| Intangible assets | 17,856.9 | 19,355.3 | 19,997.4 | 3.3% | 12.0% | ||||
| Current | 1,142.2 | 992.5 | 1,256.0 | 26.5% | 10.0% | ||||
| Deferred | 949.8 | 1,166.8 | 1,200.4 | 2.9% | 26.4% | ||||
| Income tax assets | 2,092.0 | 2,159.3 | 2,456.4 | 13.8% | 17.4% | ||||
| Other assets | 539.5 | 498.3 | 625.0 | 25.4% | 15.9% | ||||
| Total assets | 332,963.5 | 336,911.6 | 344,251.8 | 2.2% | 3.4% | ||||
| Trading liabilities | 1,196.5 | 825.8 | 759.6 | -8.0% | -36.5% | ||||
| Hedging derivatives liabilities | 310.6 | 74.0 | 52.4 | -29.3% | -83.1% | ||||
| Customer deposits | 212,216.0 | 222,077.7 | 225,773.4 | 1.7% | 6.4% | ||||
| Checking accounts | 51,776.4 | 55,289.6 | 55,880.7 | 1.1% | 7.9% | ||||
| Time deposits | 86,638.2 | 85,597.1 | 84,637.9 | -1.1% | -2.3% | ||||
| Savings deposits | 73,301.6 | 80,761.0 | 84,635.6 | 4.8% | 15.5% | ||||
| Other deposits | 499.8 | 430.0 | 619.2 | 44.0% | 23.9% | ||||
| Financial obligations | 70,507.1 | 62,093.0 | 63,882.0 | 2.9% | -9.4% | ||||
| Interbank borrowings and overnight funds | 11,004.5 | 9,363.1 | 9,824.7 | 4.9% | -10.7% | ||||
| Borrowings from banks and others | 26,570.5 | 19,122.9 | 20,397.3 | 6.7% | -23.2% | ||||
| Bonds issued | 28,829.1 | 29,728.6 | 29,941.5 | 0.7% | 3.9% | ||||
| Borrowings from development entities | 4,103.0 | 3,878.4 | 3,718.4 | -4.1% | -9.4% | ||||
| Total financial liabilities at amortized cost | 282,723.1 | 284,170.7 | 289,655.3 | 1.9% | 2.5% | ||||
| Legal related | 180.4 | 256.2 | 225.1 | -12.2% | 24.7% | ||||
| Other provisions | 729.4 | 653.2 | 670.2 | 2.6% | -8.1% | ||||
| Provisions | 909.8 | 909.4 | 895.3 | -1.6% | -1.6% | ||||
| Current | 267.3 | 378.7 | 173.6 | -54.2% | -35.0% | ||||
| Deferred | 2,788.6 | 3,336.5 | 3,637.1 | 9.0% | 30.4% | ||||
| Income tax liabilities | 3,055.9 | 3,715.2 | 3,810.7 | 2.6% | 24.7% | ||||
| Employee benefits | 1,250.1 | 1,212.2 | 1,176.1 | -3.0% | -5.9% | ||||
| Other liabilities | 9,356.6 | 10,809.3 | 10,952.9 | 1.3% | 17.1% | ||||
| Total liabilities | 298,802.7 | 301,716.6 | 307,302.4 | 1.9% | 2.8% | ||||
| Equity attributable to owners of the parent | 19,939.8 | 20,376.0 | 21,455.5 | 5.3% | 7.6% | ||||
| Non-controlling interest | 14,221.0 | 14,818.9 | 15,493.9 | 4.6% | 9.0% | ||||
| Total equity | 34,160.8 | 35,195.0 | 36,949.4 | 5.0% | 8.2% | ||||
| Total liabilities and equity | 332,963.5 | 336,911.6 | 344,251.8 | 2.2% | 3.4% | ||||
| 20 | |
Grupo Aval Acciones y Valores S.A.
Consolidated Financial Statements Under Full IFRS
Financial Statements Under IFRS
Information in Ps. Billions
| Consolidated Statement of income | YTD 2020 | YTD 2021 | | 2Q20 | 1Q21 | 2Q21 | | ||||||||
| 2021 vs. 2020 | 2Q21 vs. 1Q21 | 2Q21 vs. 2Q20 | |||||||||||||
| Interest income | |||||||||||||||
| Loan portfolio | 9,644.8 | 8,768.2 | -9.1% | 4,870.0 | 4,349.2 | 4,419.0 | 1.6% | -9.3% | |||||||
| Interests on investments in debt securities | 652.6 | 732.5 | 12.2% | 330.0 | 353.2 | 379.2 | 7.4% | 14.9% | |||||||
| Total interest income | 10,297.4 | 9,500.7 | -7.7% | 5,199.9 | 4,702.4 | 4,798.3 | 2.0% | -7.7% | |||||||
| Interest expense | |||||||||||||||
| Checking accounts | 175.4 | 137.6 | -21.5% | 81.7 | 71.2 | 66.5 | -6.6% | -18.7% | |||||||
| Time deposits | 1,917.3 | 1,508.7 | -21.3% | 968.9 | 770.9 | 737.9 | -4.3% | -23.8% | |||||||
| Savings deposits | 849.5 | 493.2 | -42.0% | 422.4 | 244.6 | 248.6 | 1.6% | -41.2% | |||||||
| Total interest expenses on deposits | 2,942.2 | 2,139.5 | -27.3% | 1,473.0 | 1,086.7 | 1,052.9 | -3.1% | -28.5% | |||||||
| Interbank borrowings and overnight funds | 182.2 | 64.5 | -64.6% | 97.7 | 24.4 | 40.1 | 64.4% | -59.0% | |||||||
| Borrowings from banks and others | 462.6 | 316.6 | -31.6% | 242.3 | 160.1 | 156.5 | -2.3% | -35.4% | |||||||
| Bonds issued | 757.1 | 736.8 | -2.7% | 397.8 | 362.5 | 374.3 | 3.2% | -5.9% | |||||||
| Borrowings from development entities | 74.2 | 44.9 | -39.4% | 35.7 | 23.3 | 21.6 | -7.3% | -39.4% | |||||||
| Total interest expenses on financial obligations | 1,476.2 | 1,162.8 | -21.2% | 773.4 | 570.4 | 592.5 | 3.9% | -23.4% | |||||||
| Total interest expense | 4,418.3 | 3,302.4 | -25.3% | 2,246.4 | 1,657.0 | 1,645.4 | -0.7% | -26.8% | |||||||
| Net interest income | 5,879.1 | 6,198.3 | 5.4% | 2,953.6 | 3,045.4 | 3,152.9 | 3.5% | 6.8% | |||||||
| Impairment losses (recoveries) on financial assets | |||||||||||||||
| Loans and other accounts receivable | 2,743.4 | 2,404.5 | -12.4% | 1,642.1 | 1,233.3 | 1,171.2 | -5.0% | -28.7% | |||||||
| Other financial assets | 58.4 | 7.3 | -87.5% | 43.6 | 15.6 | (8.3) | -153.3% | -119.1% | |||||||
| Recovery of charged-off financial assets | (135.7) | (210.2) | 54.9% | (56.0) | (91.7) | (118.5) | 29.2% | 111.6% | |||||||
| Net impairment loss on financial assets | 2,666.1 | 2,201.6 | -17.4% | 1,629.6 | 1,157.2 | 1,044.4 | -9.7% | -35.9% | |||||||
| Net interest income, after impairment losses | 3,212.9 | 3,996.7 | 24.4% | 1,323.9 | 1,888.2 | 2,108.5 | 11.7% | 59.3% | |||||||
| Income from commissions and fees | |||||||||||||||
| Banking fees(1) | 2,002.5 | 2,186.5 | 9.2% | 893.5 | 1,108.4 | 1,078.1 | -2.7% | 20.7% | |||||||
| Trust activities | 160.3 | 170.1 | 6.2% | 78.9 | 88.6 | 81.5 | -8.0% | 3.3% | |||||||
| Pension and severance fund management | 568.6 | 612.2 | 7.7% | 260.9 | 315.9 | 296.3 | -6.2% | 13.6% | |||||||
| Bonded warehouse services | 71.7 | 76.7 | 7.1% | 35.0 | 38.0 | 38.7 | 1.9% | 10.8% | |||||||
| Total income from commissions and fees | 2,803.1 | 3,045.6 | 8.7% | 1,268.3 | 1,550.9 | 1,494.6 | -3.6% | 17.9% | |||||||
| Expenses from commissions and fees | 362.7 | 393.9 | 8.6% | 173.7 | 204.2 | 189.7 | -7.1% | 9.2% | |||||||
| Net income from commissions and fees | 2,440.3 | 2,651.7 | 8.7% | 1,094.5 | 1,346.8 | 1,304.9 | -3.1% | 19.2% | |||||||
| Income from sales of goods and services | 3,991.9 | 5,042.0 | 26.3% | 1,528.3 | 2,373.5 | 2,668.5 | 12.4% | 74.6% | |||||||
| Costs and expenses from sales of goods and services | 2,918.8 | 3,330.4 | 14.1% | 1,288.9 | 1,602.8 | 1,727.6 | 7.8% | 34.0% | |||||||
| Gross profit from sales of goods and services | 1,073.1 | 1,711.5 | 59.5% | 239.4 | 770.7 | 940.9 | 22.1% | N.A. | |||||||
| Net trading income | 1,007.6 | 466.7 | -53.7% | (93.6) | 197.6 | 269.0 | 36.1% | N.A | |||||||
| Net income from other financial instruments mandatory at FVTPL | 133.0 | 144.5 | 8.6% | 59.7 | 81.6 | 62.8 | -23.1% | 5.2% | |||||||
| Other income | |||||||||||||||
| Foreign exchange gains (losses), net | (590.1) | (22.8) | -96.1% | 557.7 | (70.4) | 47.5 | -167.5% | -91.5% | |||||||
| Net gain on sale of investments and OCI realization | 200.5 | 203.7 | 1.6% | 106.2 | 129.1 | 74.6 | -42.2% | -29.8% | |||||||
| Gain on the sale of non-current assets held for sale | 35.2 | 19.4 | -45.0% | 6.6 | 8.7 | 10.7 | 22.7% | 61.1% | |||||||
| Income from non-consolidated investments(2) | 191.5 | 251.0 | 31.1% | 43.4 | 164.0 | 87.0 | -47.0% | 100.6% | |||||||
| Net gains on asset valuations | 1.5 | 1.9 | 28.8% | (1.8) | 2.0 | (0.0) | -101.4% | -98.5% | |||||||
| Other income from operations | 210.3 | 181.6 | -13.6% | 141.1 | 94.4 | 87.2 | -7.7% | -38.2% | |||||||
| Total other income | 48.9 | 634.8 | N.A. | 853.2 | 327.9 | 306.9 | -6.4% | -64.0% | |||||||
| Other expenses | |||||||||||||||
| Loss on the sale of non-current assets held for sale | 2.3 | 2.0 | -12.6% | 0.4 | 0.6 | 1.4 | 145.9% | N.A. | |||||||
| Personnel expenses | 2,175.5 | 2,188.3 | 0.6% | 1,088.5 | 1,071.0 | 1,117.3 | 4.3% | 2.6% | |||||||
| General and administrative expenses | 2,394.3 | 2,515.4 | 5.1% | 1,172.6 | 1,200.9 | 1,314.5 | 9.5% | 12.1% | |||||||
| Depreciation and amortization | 484.5 | 500.3 | 3.3% | 249.3 | 254.0 | 246.3 | -3.0% | -1.2% | |||||||
| Impairment loss on other assets | 4.1 | 6.3 | 52.1% | 0.4 | 5.2 | 1.1 | -78.4% | 182.1% | |||||||
| Other operating expenses | 137.3 | 108.0 | -21.3% | 110.3 | 49.4 | 58.6 | 18.6% | -46.8% | |||||||
| Total other expenses | 5,197.9 | 5,320.3 | 2.4% | 2,621.6 | 2,581.1 | 2,739.2 | 6.1% | 4.5% | |||||||
| Net income before income tax expense | 2,717.9 | 4,285.5 | 57.7% | 855.6 | 2,031.7 | 2,253.8 | 10.9% | 163.4% | |||||||
| Income tax expense | 731.0 | 1,118.9 | 53.1% | 214.6 | 580.1 | 538.8 | -7.1% | 151.0% | |||||||
| Net income for the period | 1,986.8 | 3,166.6 | 59.4% | 641.0 | 1,451.6 | 1,715.0 | 18.1% | 167.6% | |||||||
| Net income for the period attibutable to: | |||||||||||||||
| Non-controlling interest | 963.2 | 1,425.4 | 48.0% | 317.6 | 659.8 | 765.5 | 16.0% | 141.0% | |||||||
| Net income attributable to owners of the parent | 1,023.6 | 1,741.3 | 70.1% | 323.4 | 791.8 | 949.5 | 19.9% | 193.6% | |||||||
| (1) Includes commissions on banking services, office network services, credit and debit card fees, fees on drafts, checks and checkbooks and other fees | |
| (2) Includes share of profit of equity accounted investees, net of tax, and dividend income. |
| 21 | |
Item 2

1 2Q21 Consolidated Earnings Results IFRS
2 Disclaimer Grupo Aval Acciones y Valores S . A . (“Grupo Aval”) is an issuer of securities in Colombia and in the United States .. As such, it is subject to compliance with securities regulation in Colombia and applicable U . S . securities regulation . Grupo Aval is also subject to the inspection and supervision of the Superintendency of Finance as holding company of the Aval financial conglomerate . The consolidated financial information included in this document is presented in accordance with IFRS as currently issued by the IASB . Details of the calculations of non - GAAP measures such as ROAA and ROAE, among others, are explained when required in this report . This report includes forward - looking statements . In some cases, you can identify these forward - looking statements by words such as “may,” “will,” “should,” “expects,” “plans,” “anticipates,” “believes,” “estimates,” “predicts,” “potential,” or “continue,” or the negative of these and other comparable words . Actual results and events may differ materially from those anticipated herein as a consequence of changes in general, economic and business conditions, changes in interest and currency rates and other risk described from time to time in our filings with the Registro Nacional de Valores y Emisores and the SEC . Recipients of this document are responsible for the assessment and use of the information provided herein . Matters described in this presentation and our knowledge of them may change extensively and materially over time but we expressly disclaim any obligation to review, update or correct the information provided in this report, including any forward looking statements, and do not intend to provide any update for such material developments prior to our next earnings report . The content of this document and the figures included herein are intended to provide a summary of the subjects discussed rather than a comprehensive description . When applicable, in this document we refer to billions as thousands of millions .
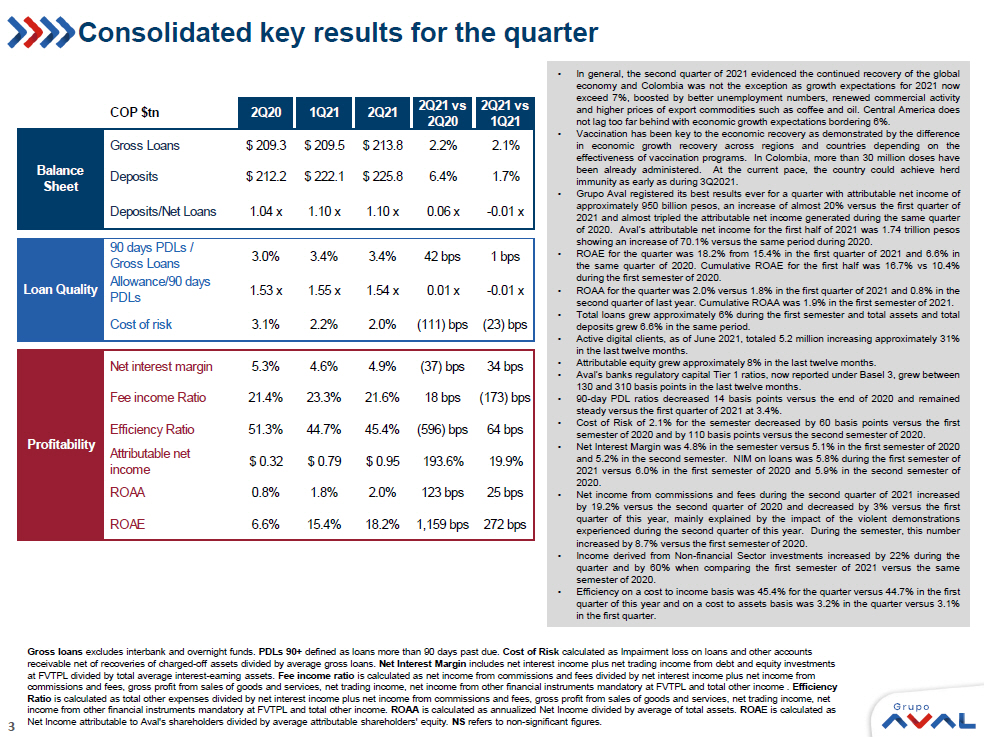
3 Consolidated key results for the quarter Gross loans e xcludes interbank and overnight funds. PDLs 90+ defined as loans more than 90 days past due. Cost of Risk c alculated as Impairment loss on loans and other accounts receivable net of recoveries of charged - off assets divided by average gross loans. Net Interest Margin includes net interest income plus net trading income from debt and equity investments at FVTPL divided by total average interest - earning assets. Fee income ratio is calculated as net income from commissions and fees divided by net interest income plus net income from commissions and fees, gross profit from sales of goods and services, net trading income, net income from other financial inst rum ents mandatory at FVTPL and total other income . Efficiency Ratio is calculated as total other expenses divided by net interest income plus net income from commissions and fees, gross profit fro m sales of goods and services, net trading income, net income from other financial instruments mandatory at FVTPL and total other income. ROAA is calculated as annualized Net Income divided by average of total assets. ROA E is calculated as Net Income attributable to Aval's shareholders divided by average attributable shareholders' equity. NS refers to non - significant figures. COP $tn 2Q20 1Q21 2Q21 2Q21 vs 2Q20 2Q21 vs 1Q21 Gross Loans $ 209.3 $ 209.5 $ 213.8 2.2% 2.1% Deposits $ 212.2 $ 222.1 $ 225.8 6.4% 1.7% Deposits/Net Loans 1.04 x 1.10 x 1.10 x 0.06 x -0.01 x 90 days PDLs / Gross Loans 3.0% 3.4% 3.4% 42 bps 1 bps Allowance/90 days PDLs 1.53 x 1.55 x 1.54 x 0.01 x -0.01 x Cost of risk 3.1% 2.2% 2.0% (111) bps (23) bps Net interest margin 5.3% 4.6% 4.9% (37) bps 34 bps Fee income Ratio 21.4% 23.3% 21.6% 18 bps (173) bps Efficiency Ratio 51.3% 44.7% 45.4% (596) bps 64 bps Attributable net income $ 0.32 $ 0.79 $ 0.95 193.6% 19.9% ROAA 0.8% 1.8% 2.0% 123 bps 25 bps ROAE 6.6% 15.4% 18.2% 1,159 bps 272 bps Balance Sheet Loan Quality Profitability • In general, the second quarter of 2021 evidenced the continued recovery of the global economy and Colombia was not the exception as growth expectations for 2021 now exceed 7 % , boosted by better unemployment numbers, renewed commercial activity and higher prices of export commodities such as coffee and oil . Central America does not lag too far behind with economic growth expectations bordering 6 % . • Vaccination has been key to the economic recovery as demonstrated by the difference in economic growth recovery across regions and countries depending on the effectiveness of vaccination programs . In Colombia, more than 30 million doses have been already administered . At the current pace, the country could achieve herd immunity as early as during 3 Q 2021 . • Grupo Aval registered its best results ever for a quarter with attributable net income of approximately 950 billion pesos, an increase of almost 20 % versus the first quarter of 2021 and almost tripled the attributable net income generated during the same quarter of 2020 . Aval’s attributable net income for the first half of 2021 was 1 . 74 trillion pesos showing an increase of 70 . 1 % versus the same period during 2020 . • ROAE for the quarter was 18 . 2 % from 15 . 4 % in the first quarter of 2021 and 6 . 6 % in the same quarter of 2020 . Cumulative ROAE for the first half was 16 . 7 % vs 10 . 4 % during the first semester of 2020 . • ROAA for the quarter was 2 . 0 % versus 1 . 8 % in the first quarter of 2021 and 0 . 8 % in the second quarter of last year . Cumulative ROAA was 1 . 9 % in the first semester of 2021 . • Total loans grew approximately 6 % during the first semester and total assets and total deposits grew 6 . 6 % in the same period . • Active digital clients, as of June 2021 , totaled 5 . 2 million increasing approximately 31 % in the last twelve months . • Attributable equity grew approximately 8 % in the last twelve months . • Aval’s banks regulatory capital Tier 1 ratios, now reported under Basel 3 , grew between 130 and 310 basis points in the last twelve months . • 90 - day PDL ratios decreased 14 basis points versus the end of 2020 and remained steady versus the first quarter of 2021 at 3 . 4 % . • Cost of Risk of 2 . 1 % for the semester decreased by 60 basis points versus the first semester of 2020 and by 110 basis points versus the second semester of 2020 . • Net Interest Margin was 4 . 8 % in the semester versus 5 . 1 % in the first semester of 2020 and 5 . 2 % in the second semester . NIM on loans was 5 . 8 % during the first semester of 2021 versus 6 . 0 % in the first semester of 2020 and 5 . 9 % in the second semester of 2020 . • Net income from commissions and fees during the second quarter of 2021 increased by 19 . 2 % versus the second quarter of 2020 and decreased by 3 % versus the first quarter of this year, mainly explained by the impact of the violent demonstrations experienced during the second quarter of this year . During the semester, this number increased by 8 . 7 % versus the first semester of 2020 . • Income derived from Non - financial Sector investments increased by 22 % during the quarter and by 60 % when comparing the first semester of 2021 versus the same semester of 2020 . • Efficiency on a cost to income basis was 45 . 4 % for the quarter versus 44 . 7 % in the first quarter of this year and on a cost to assets basis was 3 . 2 % in the quarter versus 3 . 1 % in the first quarter .
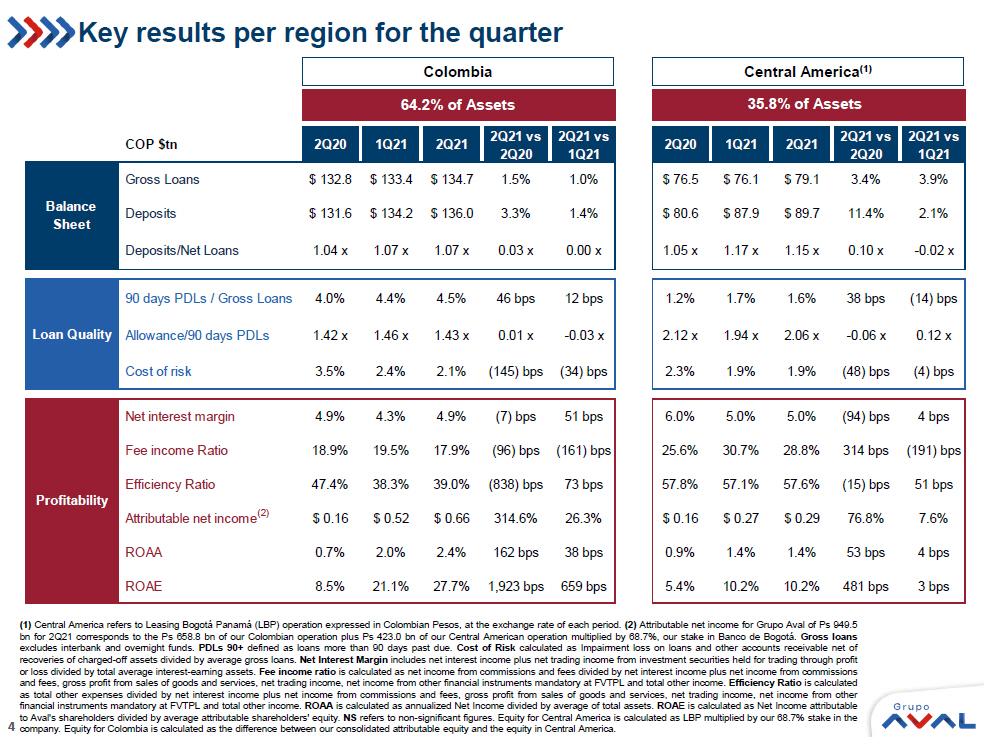
4 COP $tn 2Q20 1Q21 2Q21 2Q21 vs 2Q20 2Q21 vs 1Q21 2Q20 1Q21 2Q21 2Q21 vs 2Q20 2Q21 vs 1Q21 Gross Loans $ 132.8 $ 133.4 $ 134.7 1.5% 1.0% $ 76.5 $ 76.1 $ 79.1 3.4% 3.9% Deposits $ 131.6 $ 134.2 $ 136.0 3.3% 1.4% $ 80.6 $ 87.9 $ 89.7 11.4% 2.1% Deposits/Net Loans 1.04 x 1.07 x 1.07 x 0.03 x 0.00 x 1.05 x 1.17 x 1.15 x 0.10 x -0.02 x 90 days PDLs / Gross Loans 4.0% 4.4% 4.5% 46 bps 12 bps 1.2% 1.7% 1.6% 38 bps (14) bps Allowance/90 days PDLs 1.42 x 1.46 x 1.43 x 0.01 x -0.03 x 2.12 x 1.94 x 2.06 x -0.06 x 0.12 x Cost of risk 3.5% 2.4% 2.1% (145) bps (34) bps 2.3% 1.9% 1.9% (48) bps (4) bps Net interest margin 4.9% 4.3% 4.9% (7) bps 51 bps 6.0% 5.0% 5.0% (94) bps 4 bps Fee income Ratio 18.9% 19.5% 17.9% (96) bps (161) bps 25.6% 30.7% 28.8% 314 bps (191) bps Efficiency Ratio 47.4% 38.3% 39.0% (838) bps 73 bps 57.8% 57.1% 57.6% (15) bps 51 bps Attributable net income $ 0.16 $ 0.52 $ 0.66 314.6% 26.3% $ 0.16 $ 0.27 $ 0.29 76.8% 7.6% ROAA 0.7% 2.0% 2.4% 162 bps 38 bps 0.9% 1.4% 1.4% 53 bps 4 bps ROAE 8.5% 21.1% 27.7% 1,923 bps 659 bps 5.4% 10.2% 10.2% 481 bps 3 bps Balance Sheet Loan Quality Profitability Key results per region for the quarter ( 1 ) Central America refers to Leasing Bogotá Panamá (LBP) operation expressed in Colombian Pesos, at the exchange rate of each period . ( 2 ) Attributable net income for Grupo Aval of Ps 949 . 5 bn for 2 Q 21 corresponds to the Ps 658 . 8 bn of our Colombian operation plus Ps 423 . 0 bn of our Central American operation multiplied by 68 . 7 % , our stake in Banco de Bogotá . Gross loans e xcludes interbank and overnight funds . PDLs 90 + defined as loans more than 90 days past due . Cost of Risk c alculated as Impairment loss on loans and other accounts receivable net of recoveries of charged - off assets divided by average gross loans . Net Interest Margin includes net interest income plus net trading income from investment securities held for trading through profit or loss divided by total average interest - earning assets . Fee income ratio is calculated as net income from commissions and fees divided by net interest income plus net income from commissions and fees, gross profit from sales of goods and services, net trading income, net income from other financial instruments mandatory at FVTPL and total other income . Efficiency Ratio is calculated as total other expenses divided by net interest income plus net income from commissions and fees, gross profit from sales of goods and services, net trading income, net income from other financial instruments mandatory at FVTPL and total other income . ROAA is calculated as annualized Net Income divided by average of total assets . ROA E is calculated as Net Income attributable to Aval's shareholders divided by average attributable shareholders' equity . NS refers to non - significant figures . Equity for Central America is calculated as LBP multiplied by our 68 . 7 % stake in the company . Equity for Colombia is calculated as the difference between our consolidated attributable equity and the equity in Central America . Colombia Central America (1) (2) 64.2% of Assets 35.8% of Assets
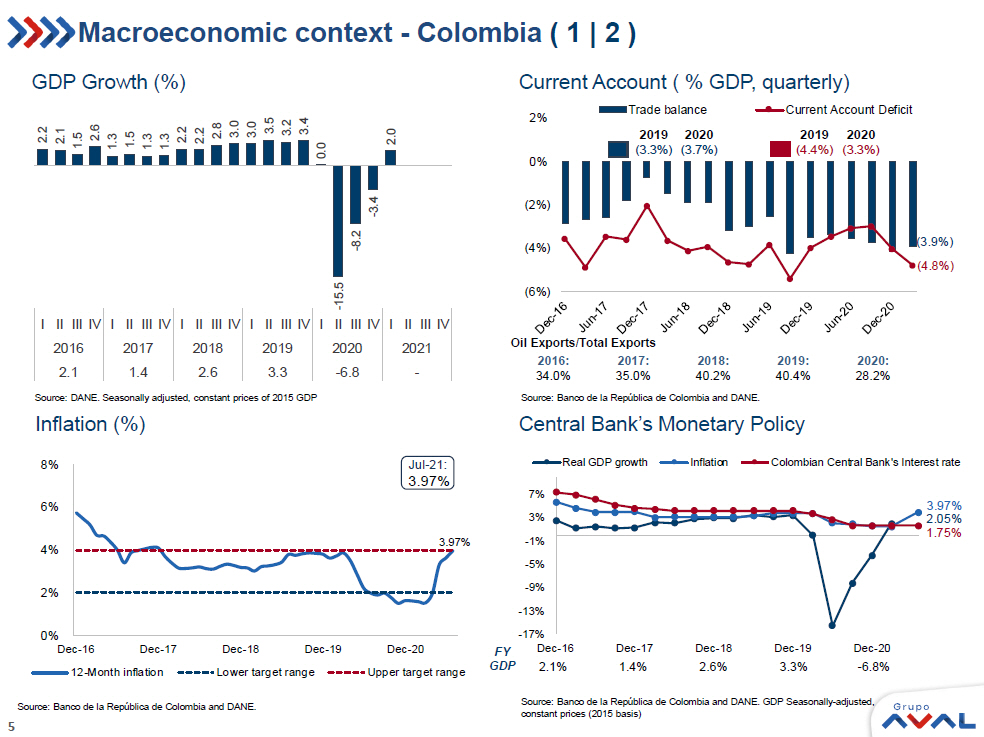
5 Macroeconomic context - Colombia ( 1 | 2 ) Source: Banco de la República de Colombia and DANE. Source: DANE. Seasonally adjusted, constant prices o f 2015 GDP Oil Exports/Total Exports 2016: 34.0% 2017: 35.0% 2018: 40.2% Source : Banco de la República de Colombia and DANE. 2019: 40.4% Source: Banco de la República de Colombia and DANE. GDP Seasonally - adjusted, constant prices (2015 basis) FY GDP 2.1% 1.4% 2.6% 3.3% - 6.8% Inflation (%) Central Bank’s Monetary Policy GDP Growth (%) Current Account ( % GDP, quarterly) 2020: 28.2% 2.2 2.1 1.5 2.6 1.3 1.5 1.3 1.3 2.2 2.2 2.8 3.0 3.0 3.5 3.2 3.4 0.0 - 15.5 - 8.2 - 3.4 2.0 I II III IV I II III IV I II III IV I II III IV I II III IV I II III IV 2016 2017 2018 2019 2020 2021 2.1 1.4 2.6 3.3 -6.8 - -17% -13% -9% -5% -1% 3% 7% Dec-16 Dec-17 Dec-18 Dec-19 Dec-20 Real GDP growth Inflation Colombian Central Bank's Interest rate 1.75% 3.97% 2.05% 3.97% 0% 2% 4% 6% 8% Dec-16 Dec-17 Dec-18 Dec-19 Dec-20 12-Month inflation Lower target range Upper target range 3.97% Jul - 21: (3.9%) (4.8%) (6%) (4%) (2%) 0% 2% Trade balance Current Account Deficit 2019 2020 2019 2020(3.3%) (3.7%) (4.4%) (3.3%)
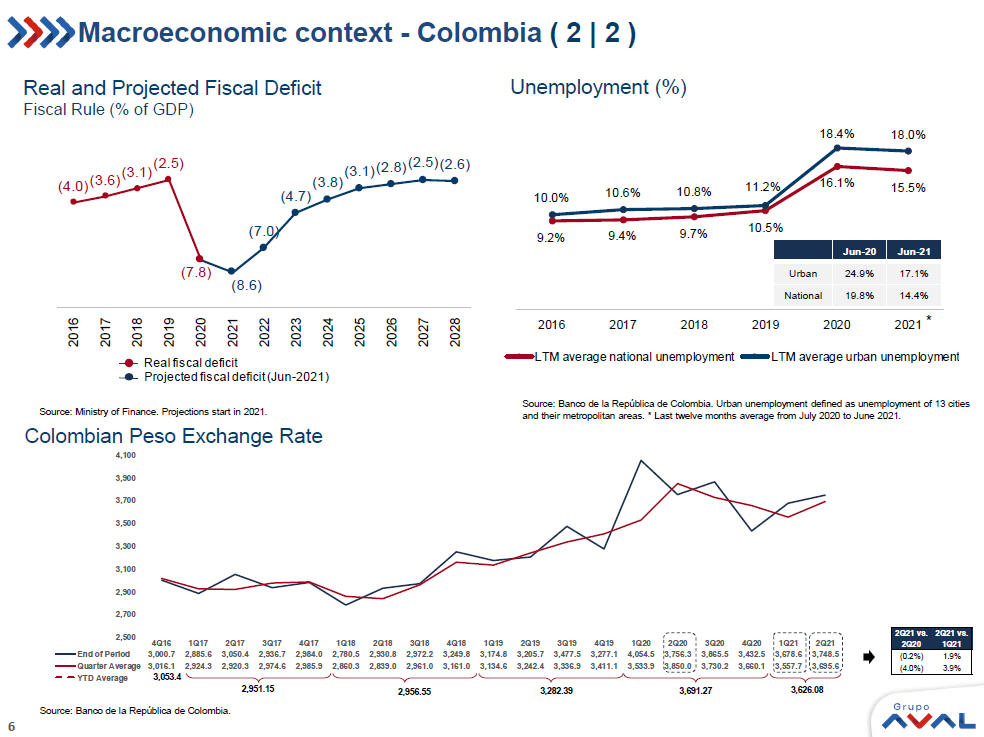
6 Macroeconomic context - Colombia ( 2 | 2 ) Source: Ministry of Finance. Projections start in 2021. Real and Projected Fiscal Deficit Fiscal Rule (% of GDP) Colombian Peso Exchange Rate Source: Banco de la República de Colombia. (4.0) (3.6) (3.1) (2.5) (7.8) (8.6) (7.0) (4.7) (3.8) (3.1) (2.8) (2.5) (2.6) 2016 2017 2018 2019 2020 2021 2022 2023 2024 2025 2026 2027 2028 Real fiscal deficit Projected fiscal deficit (Jun - 2021) 9.2% 9.4% 9.7% 10.5% 16.1% 15.5% 10.0% 10.6% 10.8% 11.2% 18.4% 18.0% 2016 2017 2018 2019 2020 2021 LTM average national unemployment LTM average urban unemployment Jun - 20 Jun - 21 Urban 24.9% 17.1% National 19.8% 14.4% Unemployment (%) Source: Banco de la República de Colombia. Urban unemployment defined as unemployment of 13 cities and their metropolitan areas. * Last twelve months average from July 2020 to June 2021. * 4Q16 1Q17 2Q17 3Q17 4Q17 1Q18 2Q18 3Q18 4Q18 1Q19 2Q19 3Q19 4Q19 1Q20 2Q20 3Q20 4Q20 1Q21 2Q21 End of Period 3,000.7 2,885.6 3,050.4 2,936.7 2,984.0 2,780.5 2,930.8 2,972.2 3,249.8 3,174.8 3,205.7 3,477.5 3,277.1 4,054.5 3,756.3 3,865.5 3,432.5 3,678.6 3,748.5 Quarter Average 3,016.1 2,924.3 2,920.3 2,974.6 2,985.9 2,860.3 2,839.0 2,961.0 3,161.0 3,134.6 3,242.4 3,336.9 3,411.1 3,533.9 3,850.0 3,730.2 3,660.1 3,557.7 3,695.6 YTD Average 2,500 2,700 2,900 3,100 3,300 3,500 3,700 3,900 4,100 2,951.15 2,956.55 3,282.39 3,691.27 3,053.4 3,626.08
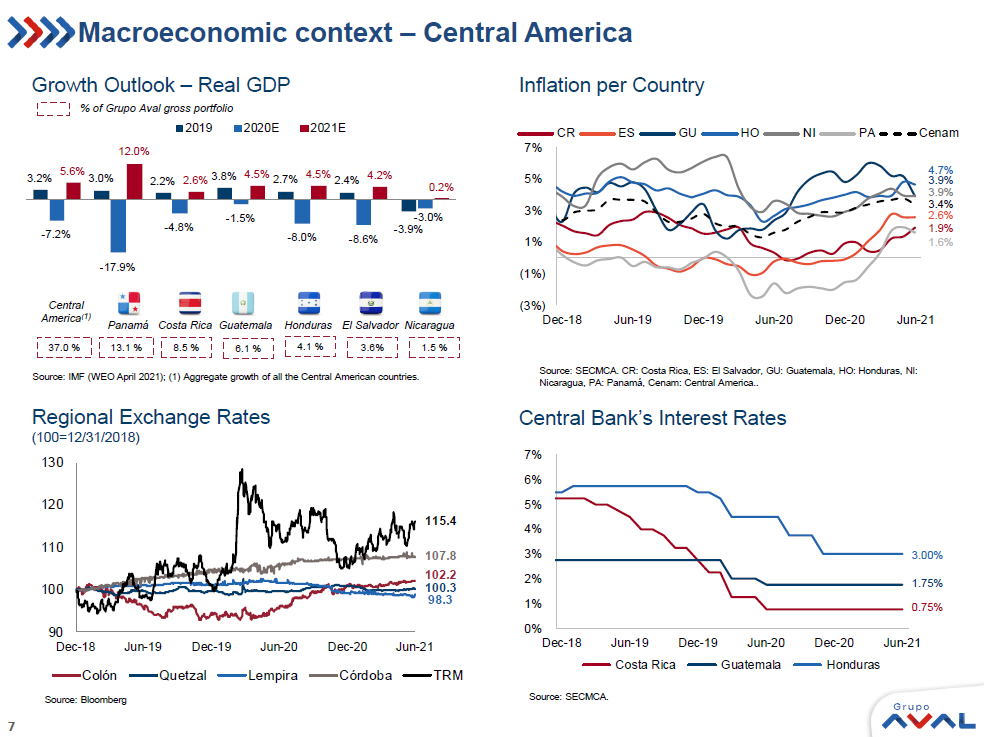
7 90 100 110 120 130 Dec-18 Jun-19 Dec-19 Jun-20 Dec-20 Jun-21 Colón Quetzal Lempira Córdoba TRM 115.4 98.3 107.8 100.3 102.2 3.2% 3.0% 2.2% 3.8% 2.7% 2.4% - 3.9% - 7.2% - 17.9% - 4.8% - 1.5% - 8.0% - 8.6% - 3.0% 5.6% 12.0% 2.6% 4.5% 4.5% 4.2% 0.2% 2019 2020E 2021E (3%) (1%) 1% 3% 5% 7% Dec-18 Jun-19 Dec-19 Jun-20 Dec-20 Jun-21 CR ES GU HO NI PA Cenam 3.9% 4.7% 3.9% 3.4% 1.9% 2.6% 1.6% Macroeconomic context – Central America Panamá Nicaragua Costa Rica Honduras Guatemala El Salvador Central America ( 1) Source: IMF (WEO April 2021); (1) Aggregate growth of all the Central American countries. Source: SECMCA. CR: Costa Rica, ES: El Salvador, GU: Guatemala, HO: Honduras, NI: Nicaragua, PA: Panamá, Cenam : Central America .. Source: SECMCA. Source: Bloomberg Regional Exchange Rates (100=12/31/2018) Central Bank’s Interest Rates Growth Outlook – Real GDP Inflation per Country % of Grupo Aval gross portfolio 37.0 % 13.1 % 6.1 % 4.1 % 8.5 % 3.6% 1.5 % 0% 1% 2% 3% 4% 5% 6% 7% Dec-18 Jun-19 Dec-19 Jun-20 Dec-20 Jun-21 Costa Rica Guatemala Honduras 3.00% 0.75% 1.75%
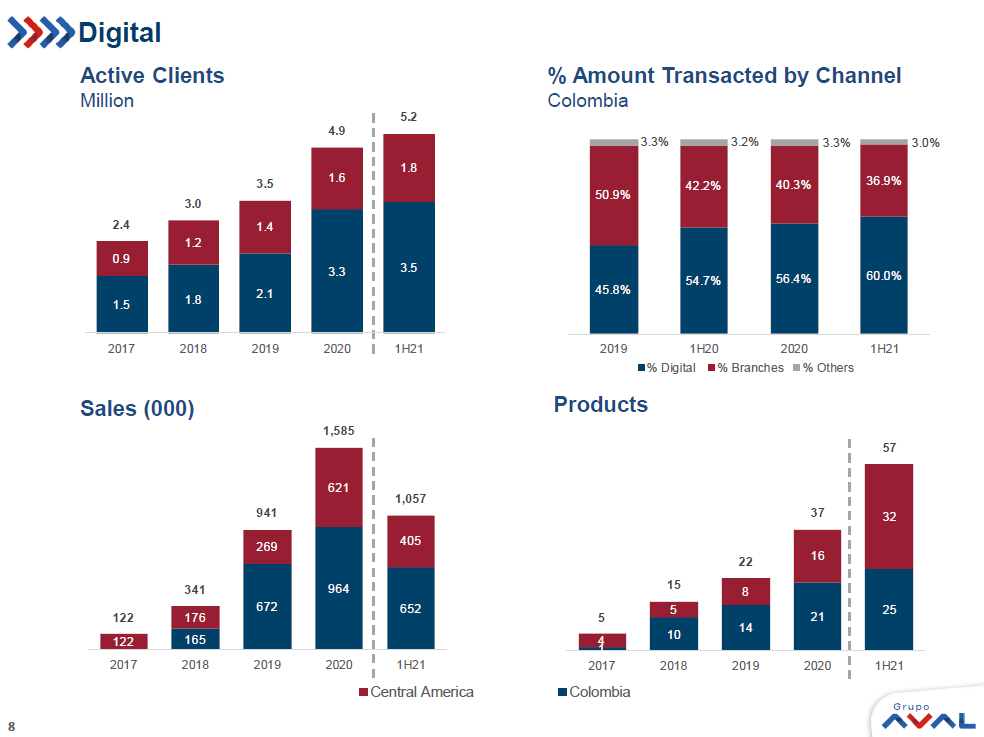
8 1 10 14 21 25 4 5 8 16 32 5 15 22 37 57 2017 2018 2019 2020 1H21 Active Clients Million Sales (000) Products 164 672 956 Central America Colombia D igital % Amount Transacted by Channel Colombia 165 672 964 652 122 176 269 621 405 122 341 941 1,585 1,057 2017 2018 2019 2020 1H21 1.5 1.8 2.1 3.3 3.5 0.9 1.2 1.4 1.6 1.8 2.4 3.0 3.5 4.9 5.2 2017 2018 2019 2020 1H21 45.8% 54.7% 56.4% 60.0% 50.9% 42.2% 40.3% 36.9% 3.3% 3.2% 3.3% 3.0% 2019 1H20 2020 1H21 % Digital % Branches % Others
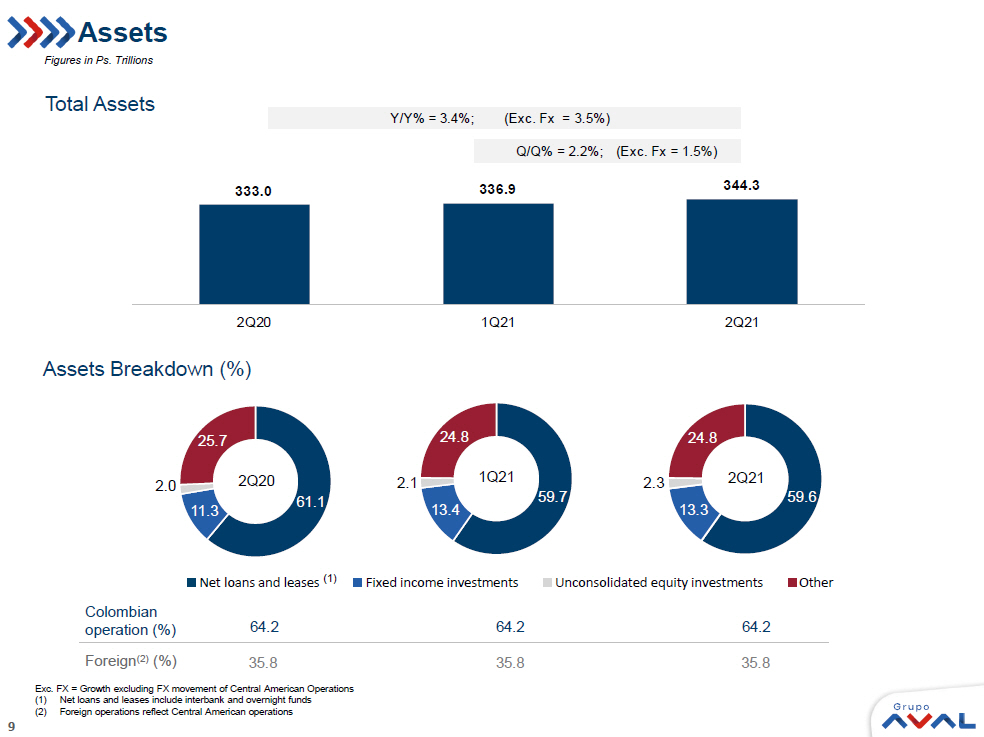
9 Net loans and leases Fixed income investments Unconsolidated equity investments Other Assets Assets Breakdown (%) Total Assets Exc. FX = Growth excluding FX movement of Central American Operations (1) Net loans and leases include interbank and overnight funds (2) Foreign operations reflect Central American operations (1) Colombian operation (%) Foreign (2) (%) 333.0 336.9 344.3 2Q20 1Q21 2Q21 Y/Y% = 3.4%; (Exc. Fx = 3.5%) Q/Q% = 2.2%; (Exc. Fx = 1.5%) Figures in Ps. Trillions 61.1 11.3 2.0 25.7 2Q20 59.7 13.4 2.1 24.8 1Q21 59.6 13.3 2.3 24.8 2Q21 64.2 35.8 64.2 35.8 35.8 64.2
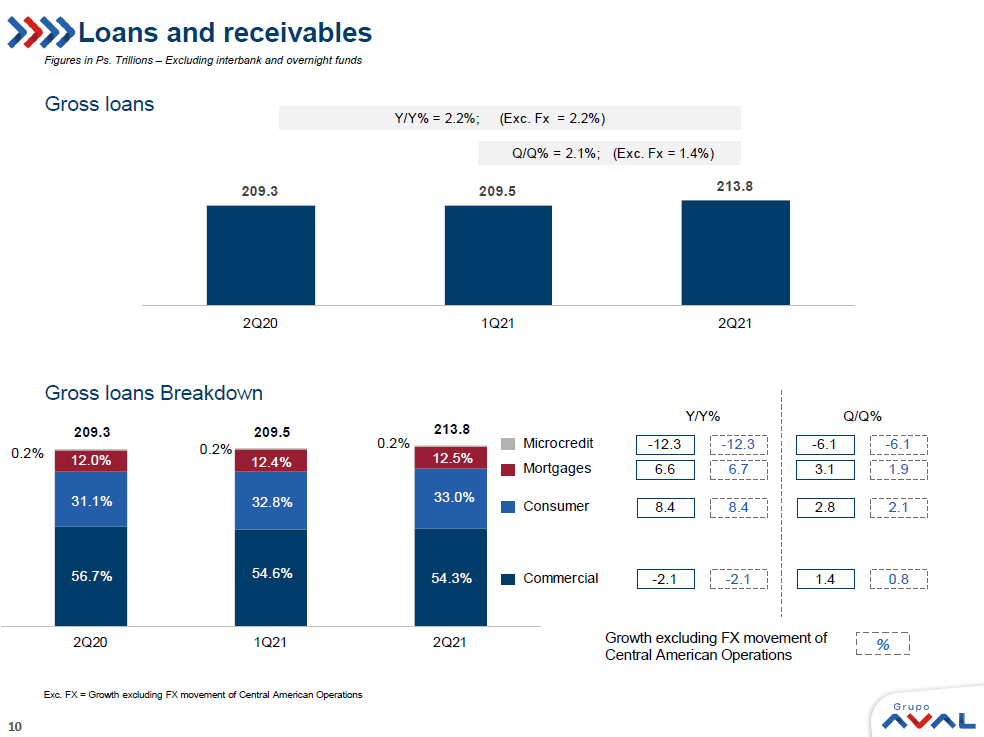
10 Loans and receivables Gross loans Gross loans Breakdown % Growth excluding FX movement of Central American Operations Exc. FX = Growth excluding FX movement of Central American Operations 209.3 209.5 213.8 2Q20 1Q21 2Q21 - 2.1 8.4 - 2.1 8.4 1.4 2.8 0.8 2.1 6.6 - 12.3 6.7 - 12.3 3.1 - 6.1 1.9 - 6.1 56.7% 54.6% 54.3% 31.1% 32.8% 33.0% 12.0% 12.4% 12.5% 0.2% 0.2% 0.2% Y/Y% Q/Q% Commercial Consumer Mortgages Microcredit 209.3 209.5 213.8 2Q20 1Q21 2Q21 Y/Y% = 2.2%; (Exc. Fx = 2.2%) Q/Q% = 2.1%; (Exc. Fx = 1.4%) Figures in Ps. Trillions – Excluding interbank and overnight funds
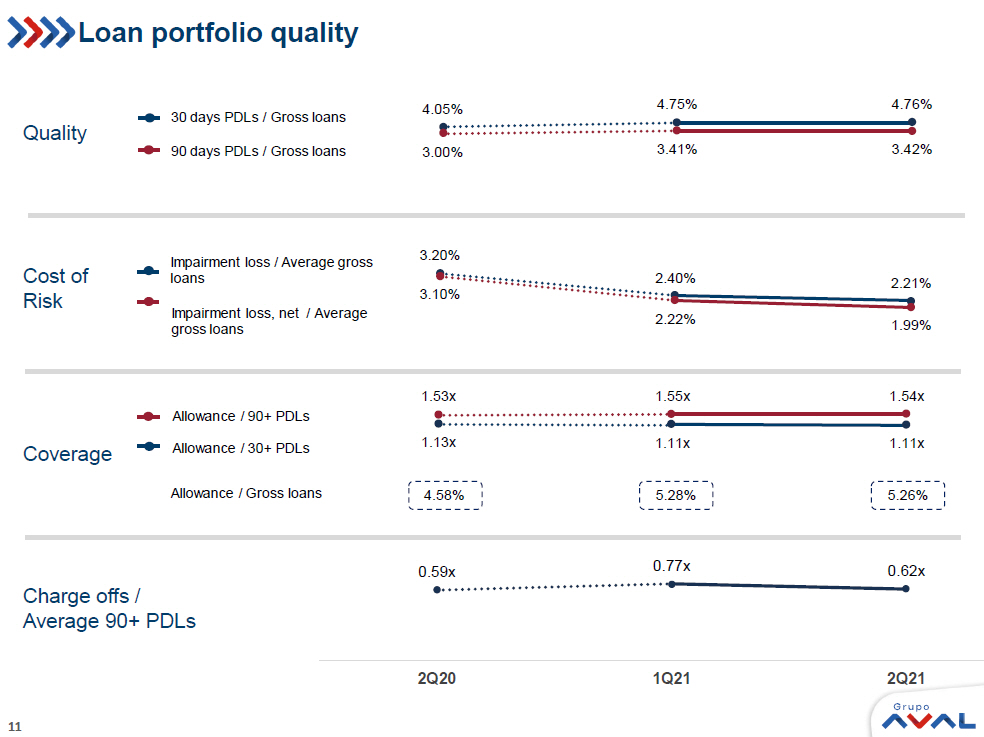
11 Loan portfolio quality Charge offs / Average 90+ PDLs Cost of Risk Quality Coverage 4.05% 4.75% 4.76% 3.00% 3.41% 3.42% 30 days PDLs / Gross loans 90 days PDLs / Gross loans 3.20% 2.40% 2.21% 3.10% 2.22% 1.99% Impairment loss / Average gross loans Impairment loss, net / Average gross loans 1.53x 1.55x 1.54x 1.13x 1.11x 1.11x 4.58% 5.28% 5.26% Allowance / Gross loans Allowance / 90+ PDLs Allowance / 30+ PDLs 0.59x 0.77x 0.62x 2Q20 1Q21 2Q21
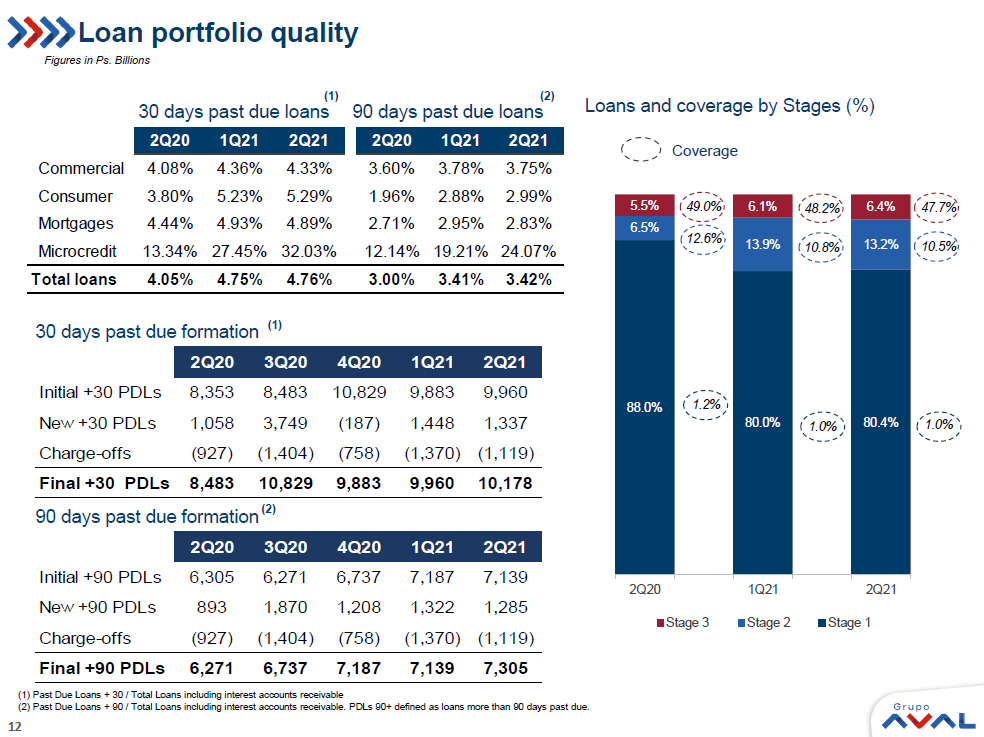
12 Loan portfolio quality 30 days past due formation 90 days past due formation (1) (2) 30 days past due loans 90 days past due loans Loans and coverage by Stages (%) (1) Past Due Loans + 30 / Total Loans including interest accounts receivable (2) Past Due Loans + 90 / Total Loans including interest accounts receivable. PDLs 90+ defined as loans more than 90 days pas t d ue. Figures in Ps. Billions (1) (2) 2Q20 1Q21 2Q21 2Q20 1Q21 2Q21 Commercial 4.08% 4.36% 4.33% 3.60% 3.78% 3.75% Consumer 3.80% 5.23% 5.29% 1.96% 2.88% 2.99% Mortgages 4.44% 4.93% 4.89% 2.71% 2.95% 2.83% Microcredit 13.34% 27.45% 32.03% 12.14% 19.21% 24.07% Total loans 4.05% 4.75% 4.76% 3.00% 3.41% 3.42% 88.0% 80.0% 80.4% 6.5% 13.9% 13.2% 5.5% 6.1% 6.4% 2Q20 1Q21 2Q21 Stage 3 Stage 2 Stage 1 49.0% 48.2% 47.7% 12.6% 10.8% 10.5% 1.2% 1.0% 1.0% Coverage 2Q20 3Q20 4Q20 1Q21 2Q21 Initial +30 PDLs 8,353 8,483 10,829 9,883 9,960 New +30 PDLs 1,058 3,749 (187) 1,448 1,337 Charge-offs (927) (1,404) (758) (1,370) (1,119) Final +30 PDLs 8,483 10,829 9,883 9,960 10,178 2Q20 3Q20 4Q20 1Q21 2Q21 Initial +90 PDLs 6,305 6,271 6,737 7,187 7,139 New +90 PDLs 893 1,870 1,208 1,322 1,285 Charge-offs (927) (1,404) (758) (1,370) (1,119) Final +90 PDLs 6,271 6,737 7,187 7,139 7,305
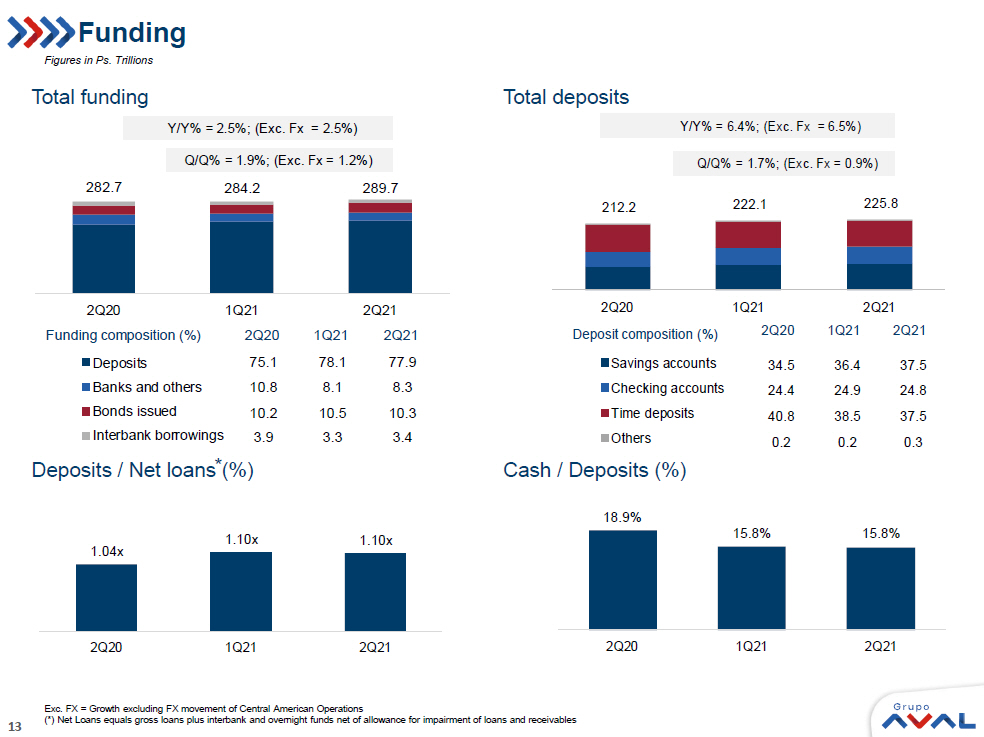
13 282.7 284.2 289.7 2Q20 1Q21 2Q21 Deposits Banks and others Bonds issued Interbank borrowings Funding composition (%) 2Q20 1Q21 2Q21 8.3 77.9 8.1 78.1 10.8 75.1 3.4 10.3 3.3 10.5 3.9 10.2 Q/Q% = 1.9%; (Exc. Fx = 1.2%) Y/Y% = 2.5%; (Exc. Fx = 2.5%) 18.9% 15.8% 15.8% 2Q20 1Q21 2Q21 1.04x 1.10x 1.10x 2Q20 1Q21 2Q21 Funding Deposits / Net loans (%) * Deposit composition (%) Exc. FX = Growth excluding FX movement of Central American Operations (*) Net Loans equals gross loans plus interbank and overnight funds net of allowance for impairment of loans and receivables 212.2 222.1 225.8 2Q20 1Q21 2Q21 Savings accounts Checking accounts Time deposits Others 0.3 24.8 37.5 37.5 Deposit composition (%) 2Q20 1Q21 2Q21 0.2 24.9 36.4 38.5 0.2 24.4 34.5 40.8 Y/Y% = 6.4%; (Exc. Fx = 6.5%) Q/Q% = 1.7%; (Exc. Fx = 0.9%) Total deposits Total funding Figures in Ps. Trillions Cash / Deposits (%)

14 2Q20 B II 1Q21 B III 2Q21 B III 2Q20 B II 1Q21 B III 2Q21 B III 2Q20 B II 1Q21 B III 2Q21 B III 2Q20 B II 1Q21 B III 2Q21 B III Primary capital (Tier 1) 9.8 10.4 10.2 8.7 11.4 11.4 7.8 11.6 11.8 11.0 12.6 12.5 Solvency Ratio 12.4 12.8 12.5 10.5 13.4 13.7 9.1 13.3 13.5 11.5 13.4 13.2 19.9 20.4 21.5 14.2 14.8 15.5 34.2 35.2 36.9 2Q20 1Q21 2Q21 Attributable equity Minority interest Q/Q% = 5.0% Y/Y% = 8.2% 19.9 20.4 21.5 2Q20 1Q21 2Q21 Q/Q% = 5.3% Y/Y% = 7.6% Total equity / Assets 8.1% 7.6% 10.7% 10.4% 10.3% 7.8% Tangible equity ratio (1) Attributable Shareholders Equity Attributable Equity + Minority Interest Figures in Ps. Trillions Consolidated Capital Adequacy of our Banks (%) Capital (1) Tangible Equity Ratio is calculated as Total Equity minus Goodwill and other Intangibles divided by Total Assets minus Goodwi ll and other Intangibles (2) For 2Q20 Total Tier 1: CET1 :8.6% and AT1: 1.1%, for 1Q21 under Basel III : Total Tier 1: CET1 :9.1% and AT1: 1.2% and for 2Q 21 under Basel III : Total Tier 1: CET1 :8.9% and AT1: 1.2% . (2) (2) (2)
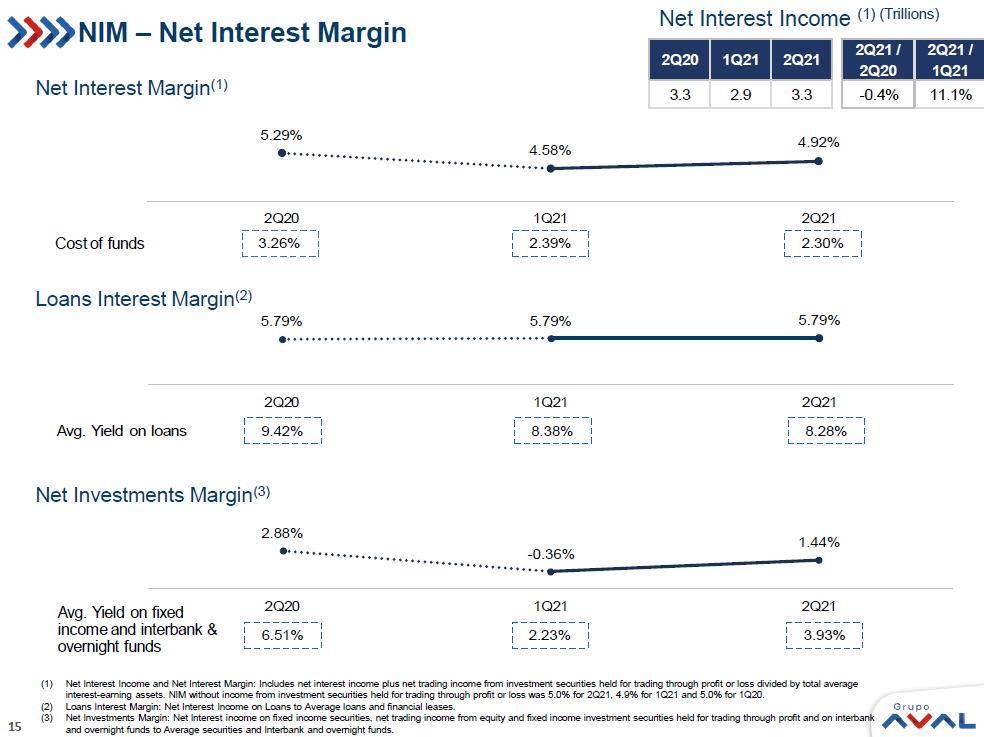
15 5.29% 4.58% 4.92% 2Q20 1Q21 2Q21 2.30% 2.39% 3.26% Cost of funds NIM – Net Interest Margin Net Interest Margin (1) Loans Interest Margin (2) Net Investments Margin (3) Net Interest Income (1) (Trillions) (1) Net Interest Income and Net Interest Margin: Includes net interest income plus net trading income from investment securities hel d for trading through profit or loss divided by total average interest - earning assets. NIM without income from investment securities held for trading through profit or loss was 5.0% for 2Q21 , 4.9% for 1Q21 and 5.0% for 1Q20. (2) Loans Interest Margin: Net Interest Income on Loans to Average loans and financial leases. (3) Net Investments Margin: Net Interest income on fixed income securities, net trading income from equity and fixed income inves tme nt securities held for trading through profit and on interbank and overnight funds to Average securities and Interbank and overnight funds. 5.79% 5.79% 5.79% 2Q20 1Q21 2Q21 Avg. Yield on loans 9.42% 8.38% 8.28% 2.88% - 0.36% 1.44% 2Q20 1Q21 2Q21 Avg. Yield on fixed income and interbank & overnight funds 3.93% 2.23% 6.51% 2Q20 1Q21 2Q21 2Q21 / 2Q20 2Q21 / 1Q21 3.3 2.9 3.3 -0.4% 11.1%
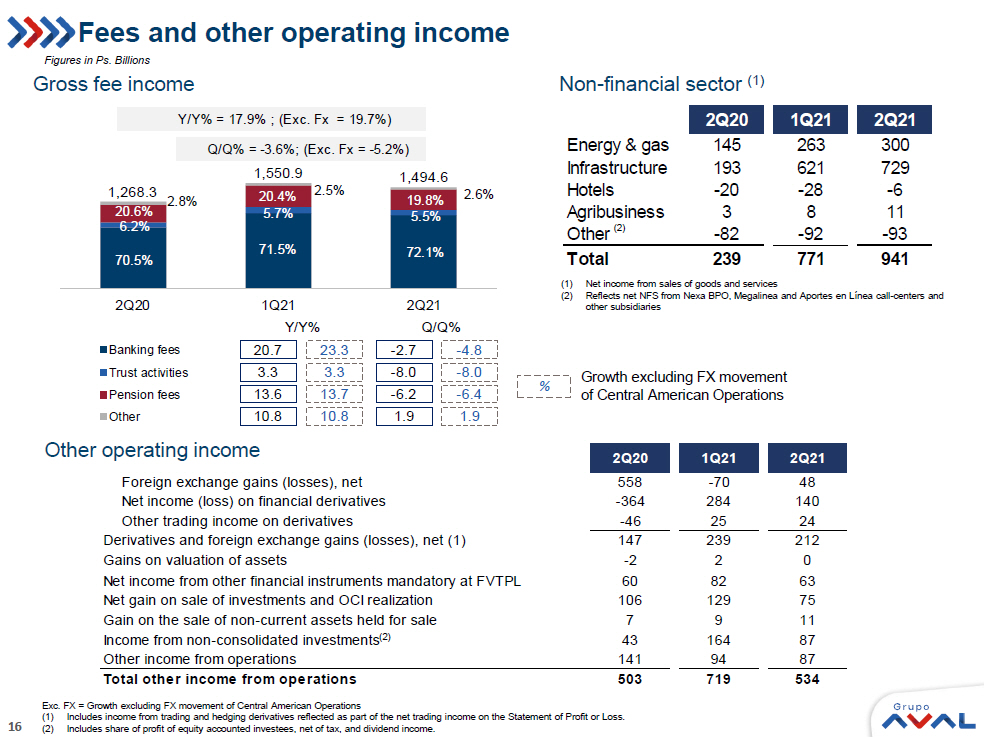
16 Fees and other operating income Gross fee income Other operating income Non - financial sector (1) (1) Net income from sales of goods and services (2) Reflects net NFS from Nexa BPO, Megalinea and Aportes en L ínea call - centers and other subsidiaries (2) (2) Exc. FX = Growth excluding FX movement of Central American Operations (1) Includes income from trading and hedging derivatives reflected as part of the net trading income on the Statement of Profit or L oss. (2) Includes share of profit of equity accounted investees, net of tax, and dividend income. 1,268.3 1,550.9 1,494.6 2Q20 1Q21 2Q21 Banking fees Trust activities Pension fees Other 70.5% 71.5% 72.1% 20.6% 20.4% 19.8% 6.2% 5.7% 5.5% 2.8% 2.5% 2.6% Y/Y% Q/Q% 20.7 3.3 13.6 10.8 - 2.7 - 8.0 - 6.2 1.9 - 4.8 - 8.0 - 6.4 1.9 23.3 3.3 13.7 10.8 Y/Y% = 17.9% ; (Exc. Fx = 19.7%) Q/Q% = - 3.6%; (Exc. Fx = - 5.2%) % Growth excluding FX movement of Central American Operations Figures in Ps. Billions 2Q20 1Q21 2Q21 Foreign exchange gains (losses), net 558 -70 48 Net income (loss) on financial derivatives -364 284 140 Other trading income on derivatives -46 25 24 Derivatives and foreign exchange gains (losses), net (1) 147 239 212 Gains on valuation of assets -2 2 0 Net income from other financial instruments mandatory at FVTPL 60 82 63 Net gain on sale of investments and OCI realization 106 129 75 Gain on the sale of non-current assets held for sale 7 9 11 Income from non-consolidated investments 43 164 87 Other income from operations 141 94 87 Total other income from operations 503 719 534 2Q20 1Q21 2Q21 Energy & gas 145 263 300 Infrastructure 193 621 729 Hotels -20 -28 -6 Agribusiness 3 8 11 Other -82 -92 -93 Total 239 771 941
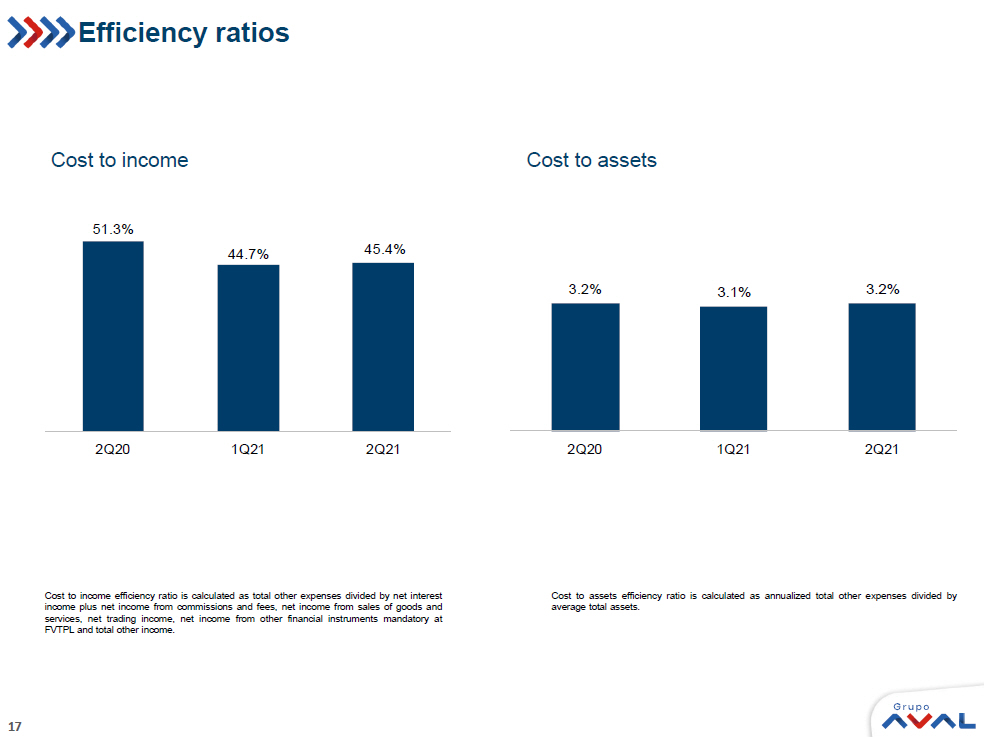
17 3.2% 3.1% 3.2% 2Q20 1Q21 2Q21 Efficiency ratios Cost to income efficiency ratio is calculated as total other expenses divided by net interest income plus net income from commissions and fees, net income from sales of goods and services, net trading income, net income from other financial instruments mandatory at FVTPL and total other income . Cost to income Cost to assets Cost to assets efficiency ratio is calculated as annualized total other expenses divided by average total assets . 51.3% 44.7% 45.4% 2Q20 1Q21 2Q21
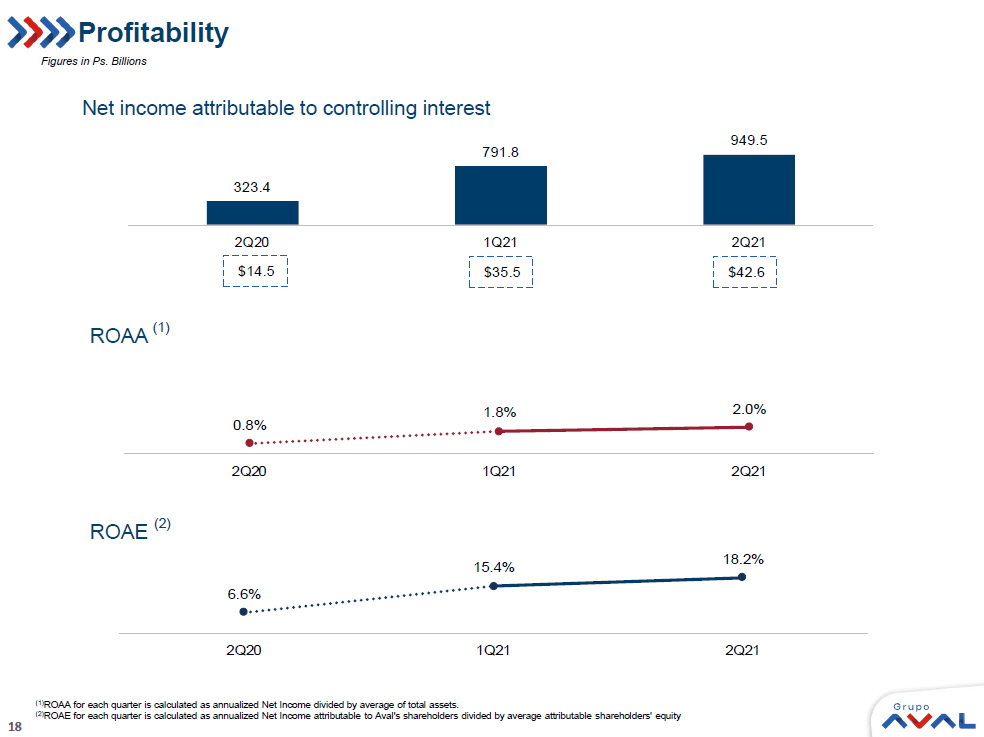
18 Profitability Figures in Ps. Billions Net income attributable to controlling interest ROAA (1) ROAE (2) (1) ROAA for each quarter is calculated as annualized Net Income divided by average of total assets. (2) ROAE for each quarter is calculated as annualized Net Income attributable to Aval's shareholders divided by average attributa ble shareholders' equity 323.4 791.8 949.5 2Q20 1Q21 2Q21 $42.6 $35.5 $14.5 0.8% 1.8% 2.0% 2Q20 1Q21 2Q21 6.6% 15.4% 18.2% 2Q20 1Q21 2Q21
19
SIGNATURE
Pursuant to the requirements of the Securities Exchange Act of 1934, the registrant has duly caused this report to be signed on its behalf by the undersigned, thereunto duly authorized.
Date: August 12, 2021
| GRUPO AVAL ACCIONES Y VALORES S.A. | |||||
| By: | /s/ Jorge Adrián Rincón Plata | ||||
| Name: | Jorge Adrián Rincón Plata | ||||
| Title: | Chief Legal Counsel | ||||