UNITED STATES
SECURITIES AND EXCHANGE COMMISSION
Washington, D.C. 20549
FORM 6-K
Report Of Foreign Private Issuer
Pursuant To Rule 13a-16 Or 15d-16 Of
The Securities Exchange Act Of 1934
For the month of August 2022
Commission File Number: 000-54290
Grupo Aval Acciones y Valores S.A.
(Exact name of registrant as specified in its charter)
Carrera 13 No. 26A - 47
Bogotá D.C., Colombia
(Address of principal executive office)
Indicate by check mark whether the registrant files or will file annual reports under cover of Form 20-F or Form 40-F:
| Form 20-F | X | Form 40-F |
Indicate by check mark if the registrant is submitting the Form 6-K in paper as permitted by Regulation S-T Rule 101(b)(1):
| Yes | No | X |
Indicate by check mark if the registrant is submitting the Form 6-K in paper as permitted by Regulation S-T Rule 101(b)(7):
| Yes | No | X |
GRUPO AVAL ACCIONES Y VALORES S.A.
TABLE OF CONTENTS
| ITEM | |
| 1. | Report of Second Quarter 2022 Consolidated Results |
| 2. | Second Quarter 2022 Consolidated Earnings Results Presentation |
Item 1

Grupo Aval Acciones y Valores S.A. (“Grupo Aval”) is an issuer of securities in Colombia and in the United States (“SEC”). As such, it is subject to compliance with securities regulation in Colombia and applicable U.S. securities regulation. Grupo Aval is also subject to the inspection and supervision of the Superintendency of Finance as holding company of the Aval financial conglomerate.
The consolidated financial information included in this document is presented in accordance with IFRS as currently issued by the IASB. Details of the calculations of non-IFRS measures such as ROAA and ROAE, among others, are explained when required in this report.
Banco de Bogotá executed a spin-off of a 75% equity stake in BAC Holding International, Corp (“BHI”); to its shareholders and Grupo Aval subsequently spun-off its equity interest to its shareholders on March 29, 2022. Prior to the spin-off, Banco de Bogotá was the direct parent of BHI. Grupo Aval has retained an indirect stake of approximately 17.2% in BHI (representing our proportional interest in the 25% equity stake in BHI retained by Banco de Bogotá). This interest in BHI is reported as discontinued operations for reporting periods prior to the spin-off and will be reported under the “share of profit of equity accounted investees, net of tax (equity method)” line item for subsequent periods.
As a result, for comparability purposes, we have prepared and present supplemental unaudited pro forma financial information for the six months ended June 30, 2021 that assumes the spin-off was completed on January 1, 2021. The supplemental unaudited pro forma financial information does not purport to be indicative of our results of operations or financial position had the relevant transactions occurred on the dates assumed and does not project our results of operations or financial position for any future period or date. The pro forma financial information is unaudited and the completion of the external audit for the year ended December 31, 2022 may result in adjustments to the unaudited pro forma financial information presented herein any such adjustments may be material.
This report includes forward-looking statements. In some cases, you can identify these forward-looking statements by words such as “may,” “will,” “should,” “expects,” “plans,” “anticipates,” “believes,” “estimates,” “predicts,” “potential,” or “continue,” or the negative of these and other comparable words. Actual results and events may differ materially from those anticipated herein as a consequence of changes in general, economic and business conditions, changes in interest and currency rates and other risk described from time to time in our filings with the Registro Nacional de Valores y Emisores and the SEC.
Recipients of this document are responsible for the assessment and use of the information provided herein. Matters described in this presentation and our knowledge of them may change extensively and materially over time but we expressly disclaim any obligation to review, update or correct the information provided in this report, including any forward looking statements, and do not intend to provide any update for such material developments prior to our next earnings report.
The content of this document and the figures included herein are intended to provide a summary of the subjects discussed rather than a comprehensive description.
When applicable, in this document we refer to billions as thousands of millions.
| 1 |  |

Bogotá, August 10th, 2022. Grupo Aval S.A. (NYSE:AVAL) reported a consolidated attributable net income of Ps 675.5 billion (Ps 29.7 pesos per share) for 2Q22. ROAE was 16.6% and ROAA was 2.1% for 2Q22.
Key results of the quarter:
Despite a challenging global economic outlook, early indicators point to GDP growth in Colombia during 2Q22 of approximately 11% when compared to the same quarter in 2021.
Because the spin-off of 75% of BHI was completed at the end of this year’s first quarter, this quarter’s results do not include net income from discontinued operations, which totaled PS 1.6 trillion during 1Q22, or PS 1.1 trillion in attributable net income. The PS 1.1 trillion number included a one-time gain of approximately Ps 720 billion, mostly because of the realization of OCI accounts related to the spin-off.
Aval registered a strong quarter. Attributable net income during 2Q22 reached approximately 680 billion pesos or Ps 29.7 per share (based on average shares outstanding during the quarter), an increase of approximately 7% versus 1Q22’s attributable net income for continued operations (Ps 0.63 trillion, excluding the PS 1.1 trillion in attributable net income from discontinued operations). ROAE was 16.6% and ROAA was 2.1%.
For ease of analysis the 2Q22 results are compared versus adjusted historical figures expressed on a pro-forma basis to reflect consolidated numbers excluding BHI’s contribution. As such,
| • | The quality of Aval’s loan portfolios continues to improve; the ratio of +30 days past due loans improved by 115 basis points, from 5.53% at the end of 2Q21 to 4.38% at the end of 2Q22 (27 bps improvement vs 1Q22). +30 day past due loans for our commercial and consumer loan portfolios improved by 124 and 118 basis points, respectively, versus 2Q21. +90 day past due loans improved by 94 basis points, from 4.27% at the end of 2Q21 to 3.33% at the end of 2Q22 (20 bps improvement vs 1Q22). Additionally, year-on-year, IFRS Stage 1 loans increased by 360 basis points (170 bps in the quarter), while Stage 2 loans decreased by 280 basis points (140 bps in the quarter) and Stage 3 loans decreased by 80 basis points (30 bps in the quarter). |
| • | Cost of Risk (1.4%) improved by 65 basis points when compared to 2Q21 (2.05%) and improved by 33 basis points vs 1Q22. |
| • | NIM on loans decreased by 19 basis points in the quarter to 4.91%, while total NIM (3.64%) contracted 50 bps during the quarter mainly driven by a 187 bps decrease in NIM on Investments. |
| • | Aval’s Efficiency on a cost-to-income basis was 41.1% versus 38.2% in 1Q22. On a cost to assets, basis efficiency was 2.6%, stable vs. 1Q22. |
| • | Income from our non-financial sector grew strongly (by 53%) when compared to 2Q21 and also when compared to 1Q22 (by 41%), mostly due to robust contributions from the infrastructure sector. |
| 2 | |

Bogotá, August 10th, 2022. Grupo Aval S.A. (NYSE:AVAL) reported a consolidated attributable net income of Ps 675.5 billion (Ps 29.7 pesos per share) for 2Q22. ROAE was 16.6% and ROAA was 2.1% for 2Q22.
| Presented for comparability purposes | ||||||||||||
| COP $tn | Pro forma 2Q21 | Pro forma (PF) where indicated 1Q22 | 2Q22 | 2Q22 vs Pro forma (PF) where indicated 1Q22 | 2Q22 vs Pro forma 2Q21 | |||||||
| Balance Sheet | Gross Loans | $ 147.7 | $ 158.3 | $ 166.6 | 5.2% | 12.8% | ||||||
| Deposits | $ 148.3 | $ 152.7 | $ 160.0 | 4.8% | 7.9% | |||||||
| Deposits/Net Loans | 1.06 x | 0.99 x | 1.00 x | 0.01 x | -0.05 x | |||||||
| Loan Quality | 90 days PDLs / Gross Loans | 4.3% | 3.5% | 3.3% | (20) bps | (94) bps | ||||||
| Allowance/90 days PDLs | 1.40 x | 1.58 x | 1.61 x | 0.03 x | 0.21 x | |||||||
| Cost of risk | 2.0% |  1.7% 1.7% | 1.4% | (33) bps | (65) bps | |||||||
| Other ratios | Net interest margin | 4.6% | 4.1% | 3.6% | (50) bps | (94) bps | ||||||
| Fee income Ratio | 17.7% | 16.2%(1) | 16.3% | 15 bps | (139) bps | |||||||
| Efficiency Ratio | 39.8% | 38.2%(1) | 41.1% | 283 bps | 130 bps | |||||||
| Reported 2Q21 | 1Q22 | 2Q22 | 2Q22 vs 1Q22 | 2Q22 vs Reported 2Q21 | ||||||||
| Profitability | Attributable net income | $ 0.95 | $ 1.73 | $ 0.68 | -60.9% | -28.9% | ||||||
| ROAA | 2.0% | 3.8% | 2.1% | (173) bps | 5 bps | |||||||
| ROAE | 18.2% | 35.3% | 16.6% | (1,871) bps | (161) bps |
| • | Pro-forma Loans, Allowances, Net Interest, Fees and Operating costs for 2Q21 are calculated based on the previously reported consolidated figures excluding BHI’s contribution to these numbers. |
| • | Pro-forma ratios for 2Q21 are calculated based on the pro-forma figures explained above. |
| • | Pro-forma ratios for 1Q22 are based on reported revenues and expenses, associated to each ratio; however, the denominators averages used to calculate these ratios contain pro-forma figures from previous quarters. |
(1) Excludes from the denominator Ps 1.053 bn related to gains from loss of control in subsidiaries, included in 1Q22 under other income from operations, included in this report under net income of discontinued operations.
Gross loans excludes interbank and overnight funds. PDLs 90+ defined as loans more than 90 days past due. Cost of Risk calculated as Impairment loss on loans and other accounts receivable net of recoveries of charged-off assets divided by average gross loans. Net Interest Margin includes net interest income plus net trading income from debt and equity investments at FVTPL divided by total average interest-earning assets. Fee income ratio is calculated as net income from commissions and fees divided by net interest income plus net income from commissions and fees, gross profit from sales of goods and services, net trading income, net income from other financial instruments mandatory at FVTPL and total other income. Efficiency Ratio is calculated as total other expenses divided by net interest income plus net income from commissions and fees, gross profit from sales of goods and services, net trading income, net income from other financial instruments mandatory at FVTPL and total other income. ROAA is calculated as annualized Net Income divided by average of total assets. ROAE is calculated as Net Income attributable to Aval's shareholders divided by average attributable shareholders' equity. NS refers to non-significant figures.
| 3 | |

| Grupo Aval Acciones y Valores S.A. |
| Consolidated Financial Statements |
| Supplemental unaudited pro forma financial information |
| Information in Ps. Billions |
| Consolidated Statement of Financial Position | Pro forma 2Q21 | 1Q22 | 2Q22 | D | ||||||
| 2Q22 vs. 1Q22 | 2Q22 vs. Pro forma 2Q21 | |||||||||
| Cash and cash equivalents | 18,471.8 | 16,407.1 | 21,441.1 | 30.7% | 16.1% | |||||
| Trading assets | 11,245.5 | 9,846.7 | 10,888.4 | 10.6% | -3.2% | |||||
| Investment securities | 31,655.7 | 31,550.3 | 31,690.5 | 0.4% | 0.1% | |||||
| Hedging derivatives assets | 39.7 | 53.8 | 49.1 | -8.7% | 23.5% | |||||
| Total loans, net | 140,431.7 | 154,054.5 | 159,651.9 | 3.6% | 13.7% | |||||
| Tangible assets | 6,936.6 | 7,003.4 | 7,043.9 | 0.6% | 1.5% | |||||
| Goodwill | 2,331.1 | 2,220.5 | 2,234.9 | 0.6% | -4.1% | |||||
| Concession arrangement rights | 10,025.0 | 11,338.9 | 12,032.2 | 6.1% | 20.0% | |||||
| Other assets | 21,347.9 | 28,648.9 | 31,079.0 | 8.5% | 45.6% | |||||
| Spun-off assets from BHI | 101,766.7 | - | - | N.A | N.A | |||||
| Total assets | 344,251.8 | 261,124.1 | 276,111.0 | 5.7% | -19.8% | |||||
| Trading liabilities | 759.6 | 1,360.4 | 1,893.8 | 39.2% | 149.3% | |||||
| Hedging derivatives liabilities | 52.4 | 52.6 | 5.8 | -88.9% | -88.9% | |||||
| Customer deposits | 148,267.7 | 152,708.1 | 160,029.3 | 4.8% | 7.9% | |||||
| Interbank borrowings and overnight funds | 9,578.0 | 11,156.8 | 10,499.9 | -5.9% | 9.6% | |||||
| Borrowings from banks and others | 14,931.4 | 17,937.9 | 22,945.6 | 27.9% | 53.7% | |||||
| Bonds issued | 29,110.7 | 30,414.2 | 31,973.1 | 5.1% | 9.8% | |||||
| Borrowings from development entities | 3,718.4 | 3,270.0 | 3,235.0 | -1.1% | -13.0% | |||||
| Other liabilities | 14,418.6 | 14,623.5 | 15,378.9 | 5.2% | 6.7% | |||||
| Spun-off liabilities from BHI | 86,465.6 | - | - | N.A | N.A | |||||
| Total liabilities | 307,302.4 | 231,523.5 | 245,961.5 | 6.2% | -20.0% | |||||
| Equity attributable to owners of the parent | 21,455.8 | 16,230.3 | 16,420.0 | 1.2% | -23.5% | |||||
| Non-controlling interest | 15,493.6 | 13,370.3 | 13,729.6 | 2.7% | -11.4% | |||||
| Total equity | 36,949.4 | 29,600.6 | 30,149.6 | 1.9% | -18.4% | |||||
| Total liabilities and equity | 344,251.8 | 261,124.1 | 276,111.0 | 5.7% | -19.8% | |||||
| Consolidated Statement of Income Continued operations | 2Q21 | 1Q22 | 2Q22 | D | ||||||||
| Interest income | 3,144.4 | 3,759.8 | 4,286.7 | 14.0% | 36.3% | |||||||
| Interest expense | 1,093.0 | 1,679.2 | 2,312.3 | 37.7% | 111.6% | |||||||
| Net interest income | 2,051.3 | 2,080.6 | 1,974.4 | -5.1% | -3.8% | |||||||
| Loans and other accounts receivable | 862.9 | 807.3 | 719.6 | -10.9% | -16.6% | |||||||
| Other financial assets | (0.1) | 18.9 | (1.0) | -105.2% | N.A. | |||||||
| Recovery of charged-off financial assets | (111.6) | (130.8) | (151.8) | 16.0% | 36.0% | |||||||
| Net impairment loss on financial assets | 751.3 | 695.4 | 566.8 | -18.5% | -24.6% | |||||||
| Net interest income, after impairment losses | 1,300.1 | 1,385.2 | 1,407.6 | 1.6% | 8.3% | |||||||
| Net income from commissions and fees | 731.1 | 710.0 | 697.3 | -1.8% | -4.6% | |||||||
| Gross profit from sales of goods and services | 940.9 | 1,020.6 | 1,440.8 | 41.2% | 53.1% | |||||||
| Net trading income | 262.4 | (287.3) | 481.5 | N.A | 83.5% | |||||||
| Net income from other financial instruments mandatory at FVTPL | 62.8 | 73.9 | 68.4 | -7.4% | 8.9% | |||||||
| Total other income | 79.4 | 793.3 | (390.7) | -149.2% | N.A | |||||||
| Total other expenses | 1,642.0 | 1,679.5 | 1,754.6 | 4.5% | 6.9% | |||||||
| Net income before income tax expense | 1,734.7 | 2,016.2 | 1,950.4 | -3.3% | 12.4% | |||||||
| Income tax expense | 440.4 | 633.0 | 564.3 | -10.8% | 28.1% | |||||||
| Net income for the period of continued operations | 1,294.2 | 1,383.2 | 1,386.1 | 0.2% | 7.1% | |||||||
| Net income for the period of discontinued operations | 420.8 | 1,597.5 | (0.0) | -100.0% | -100.0% | |||||||
| Net income for the period | 1,715.0 | 2,980.8 | 1,386.1 | -53.5% | -19.2% | |||||||
| Non-controlling interest | 765.5 | 1,251.1 | 710.6 | -43.2% | -7.2% | |||||||
| Net income attributable to owners of the parent | 949.5 | 1,729.7 | 675.5 | -60.9% | -28.9% | |||||||
| Key ratios | Pro forma 2Q21 | Pro forma (PF) where indicated 1Q22 | 2Q22 | Pro forma YTD 2021 | Pro forma YTD 2022 | |||||||
| Net Interest Margin(1) | 4.6% | 4.4% | 4.0% | 4.6% | 4.2% | |||||||
| Net Interest Margin (including net trading income)(1) | 4.6% | 4.1% | 3.6% | 4.4% | 3.9% | |||||||
| Efficiency ratio(2) | 39.8% | 38.2%(*) | 41.1% | 39.4% | 39.6%(*) | |||||||
| 90 days PDL / Gross loans (5) | 4.3% | 3.5% | 3.3% | 4.3% | 3.3% | |||||||
| Provision expense / Average gross loans (6) | 2.0% | 1.7% | 1.4% | 2.2% | 1.6% | |||||||
| Allowance / 90 days PDL (5) | 1.40 | 1.58 | 1.61 | 1.40 | 1.61 | |||||||
| Allowance / Gross loans | 6.0% | 5.6% | 5.4% | 6.0% | 5.4% | |||||||
| Charge-offs / Average gross loans (6) | 2.1% | 2.0% | 1.9% | 2.5% | 1.9% | |||||||
| Total loans, net / Total assets | 57.9% | 59.0% | 57.8% | 57.9% | 57.8% | |||||||
| Deposits / Total loans, net | 105.6% | 99.1% | 100.2% | 105.6% | 100.2% | |||||||
| Key ratios | 2Q21 | 1Q22 | 2Q22 | YTD 2021 | YTD 2022 | |||||||
| Equity / Assets | 10.7% | 11.3% | 10.9% | 10.7% | 10.9% | |||||||
| Tangible equity ratio (7) | 8.1% | 10.0% | 9.6% | 8.1% | 9.6% | |||||||
| ROAA(3) | 2.0% | 3.8% | 2.1% | 1.9% | 2.9% | |||||||
| ROAE(4) | 18.2% | 35.3% | 16.6% | 16.7% | 25.9% | |||||||
| Shares outstanding (EoP) | 22,281,017,159 | 22,281,017,159 | 23,743,475,754 | 22,281,017,159 | 23,743,475,754 | |||||||
| Shares outstanding (Average) | 22,281,017,159 | 22,281,017,159 | 22,779,217,340 | 22,281,017,159 | 22,511,066,826 | |||||||
| Common share price (EoP) | 1,139.0 | 965.0 | 757.0 | 1,139.0 | 757.0 | |||||||
| Preferred share price (EoP) | 1,083.0 | 852.0 | 750.0 | 1,083.0 | 750.0 | |||||||
| BV/ EoP shares in Ps. | 963.0 | 728.4 | 691.6 | 963.0 | 691.6 | |||||||
| EPS | 42.6 | 77.6 | 29.7 | 78.1 | 106.8 | |||||||
| P/E (8) | 6.4 | 2.7 | 6.3 | 6.9 | 3.5 | |||||||
| P/BV (8) | 1.1 | 1.2 | 1.1 | 1.1 | 1.1 | |||||||
| • | Pro-forma Loans, Allowances, Net Interest, Fees and Operating costs for 2Q21 are calculated based on the previously reported consolidated figures excluding BHI’s contribution to these numbers. |
| • | Pro-forma ratios for 2Q21 are calculated based on the pro-forma figures explained above. |
| • | Pro-forma ratios for 1Q22 are based on reported revenues and expenses, associated to each ratio; however, the denominators averages used to calculate these ratios contain pro-forma figures from previous quarters. |
(*) Excludes from the denominator Ps 1.053 bn related to gains from loss of control in subsidiaries, included in 1Q22 under other income from operations, included in this report under net income of discontinued operations.
(1) NIM is calculated as Net Interest Income divided by the average of Interest Earning Assets;
(2) Efficiency Ratio is calculated as total other expenses divided by net interest income plus net income from commissions and fees, gross profit from sales of goods and services, net trading income, net income from other financial instruments mandatory at FVTPL and total other income;
(3) ROAA is calculated as Income before Minority Interest divided by the average of total assets for each quarter;
(4) ROAE is calculated as Net Income attributable to Grupo Aval’s shareholders divided by the average of shareholders´ attributable equity for each quarter;
(5) PDLs 90+ defined as loans more than 90 days past due include interest accounts receivables. Gross loans excluding interbank and overnight funds;
(6) Refers to average gross loans for the period;
(7) Tangible Equity Ratio is calculated as Total Equity minus Intangibles (excluding those related to concessions) divided by Total Assets minus Intangibles (excluding those related to concessions);
(8) Based on Preferred share prices.
| 4 | |
Statement of Financial Position Analysis
| • | Pro-forma figures for 2Q21 are calculated based on the previously reported consolidated figures excluding BHI’s contribution to these numbers. |
| • | Pro-forma ratios for 2Q21 are calculated based on the pro-forma figures explained above. |
| • | Pro-forma ratios for 1Q22 are based on reported revenues and expenses, associated to each ratio; however, the denominators averages used to calculate these ratios contain pro-forma figures from previous quarters. |
1. Assets (1)
Total assets as of June 30th, 2022 totaled Ps 276,110.0 billion showing an increase of 13.9% versus pro forma total assets in June 30th, 2021 and an increase of 5.7% versus March 31st, 2022. Growth was mainly driven by (i) a 13.7% year over year growth in total loans, net to Ps 159,651.9 billion, (ii) a 45.6% yearly growth in other assets, net to Ps 31,079.0 billion and (iii) a 16.1% year over year growth in cash and cash equivalents to Ps 21,441.1 billion.
Reported total assets as of June 30th, 2021 were Ps 344,251.8 billion.
1.1 Loan portfolio (1)
Gross loans (excluding interbank and overnight funds) increased by 12.8% between June 30th, 2022 and pro forma June 30th, 2021 to Ps 166,589.5 billion mainly driven by (i) a 18.1% increase in Mortgages loans to Ps 15,883.6 billion, (ii) a 14.7% increase in Consumer loans to Ps 54,481.2 billion and (iii) a 11.0% increase in Commercial loans to Ps 95,946.0 billion.
Interbank & overnight funds increased by 29.5% to Ps 2,004.1 billion versus the pro forma 2Q21.
Loss allowance was Ps 8,941.7 billion as of June 30th, 2022 taking net loans to Ps 159,651.9 billion.
| Total loans, net | Pro forma 2Q21 | 1Q22 | 2Q22 | D | |||||
| 2Q22 vs. 1Q22 | 2Q22 vs. Pro forma 2Q21 | ||||||||
| Gross loans | |||||||||
| Commercial loans | 86,430.8 | 91,006.7 | 95,946.0 | 5.4% | 11.0% | ||||
| Consumer loans | 47,490.1 | 51,984.3 | 54,481.2 | 4.8% | 14.7% | ||||
| Mortgages loans | 13,454.8 | 15,010.3 | 15,883.6 | 5.8% | 18.1% | ||||
| Microcredit loans | 337.0 | 292.6 | 278.6 | -4.8% | -17.3% | ||||
| Gross loans | 147,712.7 | 158,293.9 | 166,589.5 | 5.2% | 12.8% | ||||
| Interbank & overnight funds | 1,548.0 | 4,584.7 | 2,004.1 | -56.3% | 29.5% | ||||
| Total gross loans | 149,260.6 | 162,878.7 | 168,593.6 | 3.5% | 13.0% | ||||
| Loss allowance | (8,828.9) | (8,824.2) | (8,941.7) | 1.3% | 1.3% | ||||
| Allowance for impairment of commercial loans | (4,916.3) | (5,346.5) | (5,392.9) | 0.9% | 9.7% | ||||
| Allowance for impairment of consumer loans | (3,409.6) | (3,014.8) | (3,094.4) | 2.6% | -9.2% | ||||
| Allowance for impairment of mortgages | (381.7) | (373.4) | (382.7) | 2.5% | 0.3% | ||||
| Allowance for impairment of microcredit loans | (121.3) | (89.5) | (71.6) | -20.0% | -40.9% | ||||
| Total loans, net | 140,431.7 | 154,054.5 | 159,651.9 | 3.6% | 13.7% | ||||
Reported total loans, net as of June 30th, 2021 were Ps 205,293.6 billion.
(1) Pro-forma total assets and total loans, net for 2Q21 are calculated based on the reported consolidated figures excluding BHI’s contribution to these numbers.
| 5 | |
The following table shows the gross loan composition per product of each of our loan categories.
| Gross loans | Pro forma 2Q21 (1) | 1Q22 | 2Q22 | D | |||||
| 2Q22 vs. 1Q22 | 2Q22 vs. Pro forma 2Q21 | ||||||||
| General purpose | 62,075.8 | 65,254.4 | 68,335.8 | 4.7% | 10.1% | ||||
| Working capital | 10,223.5 | 11,682.5 | 13,420.5 | 14.9% | 31.3% | ||||
| Financial leases | 9,910.8 | 10,042.3 | 10,207.8 | 1.6% | 3.0% | ||||
| Funded by development banks | 3,619.5 | 3,250.1 | 3,191.3 | -1.8% | -11.8% | ||||
| Overdrafts | 333.8 | 413.5 | 467.7 | 13.1% | 40.1% | ||||
| Credit cards | 267.3 | 363.8 | 323.0 | -11.2% | 20.8% | ||||
| Commercial loans | 86,430.8 | 91,006.7 | 95,946.0 | 5.4% | 11.0% | ||||
| Payroll loans | 28,195.5 | 30,860.5 | 32,026.6 | 3.8% | 13.6% | ||||
| Personal loans | 9,334.5 | 10,429.1 | 11,182.4 | 7.2% | 19.8% | ||||
| Credit cards | 5,560.0 | 5,932.9 | 6,277.0 | 5.8% | 12.9% | ||||
| Automobile and vehicle | 4,179.5 | 4,557.9 | 4,791.2 | 5.1% | 14.6% | ||||
| Financial leases | 29.1 | 23.9 | 22.0 | -8.2% | -24.5% | ||||
| Overdrafts | 53.5 | 50.4 | 53.0 | 5.1% | -0.9% | ||||
| Other | 138.1 | 129.6 | 129.0 | -0.5% | -6.6% | ||||
| Consumer loans | 47,490.1 | 51,984.3 | 54,481.2 | 4.8% | 14.7% | ||||
| Mortgages | 11,542.5 | 12,878.1 | 13,665.6 | 6.1% | 18.4% | ||||
| Housing leases | 1,912.3 | 2,132.2 | 2,218.0 | 4.0% | 16.0% | ||||
| Mortgages loans | 13,454.8 | 15,010.3 | 15,883.6 | 5.8% | 18.1% | ||||
| Microcredit loans | 337.0 | 292.6 | 278.6 | -4.8% | -17.3% | ||||
| Gross loans | 147,712.7 | 158,293.9 | 166,589.5 | 5.2% | 12.8% | ||||
| Interbank & overnight funds | 1,548.0 | 4,584.7 | 2,004.1 | -56.3% | 29.5% | ||||
| Total gross loans | 149,260.6 | 162,878.7 | 168,593.6 | 3.5% | 13.0% | ||||
Over the last twelve months, our retail products have driven our loan portfolio growth.
Commercial loans increased by 11.0% versus pro forma 2Q21 and 5.4% versus 1Q22.
Consumer loans growth compared with pro forma figures over the last year and quarter was mainly driven by payrolls and personal loans. Consumer loans grew by 14.7% during the last twelve months and 4.8% between June 30th, 2022 and March 31st, 2022.
Mortgages loans increased by 18.1% versus pro forma 2Q21 and 5.8% versus 1Q22.
On June 30th, 2021 reported commercial loans reached Ps 116,094.0 billion, consumer loans totaled Ps 70,562.4 billion and mortgages loans reached Ps 26,831.3 billion.
The following table shows the loans and receivables composition per entity. During the last twelve months, Banco de Occidente showed the highest growth rate within our banking operation in Colombia, driven by a strong performance in all types of loans with consumer loans growing 21.7%, commercial loans 19.1% and mortgages growing 13.7%.
(1) Pro-forma gross loans and breakdown for 2Q21 are calculated based on the reported consolidated figures excluding BHI’s contribution to these numbers.
| 6 | |
| Gross loans / Bank ($) | Pro forma 2Q21 (1) | 1Q22 | 2Q22 | D | |||||
| 2Q22 vs. 1Q22 | 2Q22 vs. Pro forma 2Q21 | ||||||||
| Banco de Bogotá | 79,725.5 | 83,017.5 | 87,511.5 | 5.4% | 9.8% | ||||
| Banco de Occidente | 33,971.3 | 38,124.3 | 40,557.7 | 6.4% | 19.4% | ||||
| Banco Popular | 21,893.1 | 23,509.7 | 24,131.4 | 2.6% | 10.2% | ||||
| Banco AV Villas | 12,332.8 | 13,627.7 | 14,277.2 | 4.8% | 15.8% | ||||
| Corficolombiana | 1,766.7 | 1,849.9 | 1,962.1 | 6.1% | 11.1% | ||||
| Eliminations | (1,976.7) | (1,835.2) | (1,850.5) | 0.8% | -6.4% | ||||
| Gross loans | 147,712.7 | 158,293.9 | 166,589.5 | 5.2% | 12.8% | ||||
| Interbank & overnight funds | 1,548.0 | 4,584.7 | 2,004.1 | -56.3% | 29.5% | ||||
| Total gross loans | 149,260.6 | 162,878.7 | 168,593.6 | 3.5% | 13.0% | ||||
| Gross loans / Bank (%) | Pro forma 2Q21 | 1Q22 | 2Q22 | |||
| Banco de Bogotá | 54.0% | 52.4% | 52.5% | |||
| Banco de Occidente | 23.0% | 24.1% | 24.3% | |||
| Banco Popular | 14.8% | 14.9% | 14.5% | |||
| Banco AV Villas | 8.3% | 8.6% | 8.6% | |||
| Corficolombiana | 1.2% | 1.2% | 1.2% | |||
| Eliminations | -1.3% | -1.2% | -1.1% | |||
| Gross loans | 100% | 100% | 100% |
Of the total gross loans, 90.8% are domestic and 9.2% are foreign. In terms of gross loans (excluding interbank and overnight funds), 90.7% are domestic and 9.3% are foreign (reflecting the Multi Financial Group operation).
The quality of our loan portfolio improved during the quarter.
Our 30 days PDL to total loans closed in 4.4% for 2Q22, 4.6% for 1Q22, and 5.5% in pro forma 2Q21. The ratio of 90 days PDL to total loans was 3.3% for 2Q22, 3.5% for 1Q22 and 4.3% for pro forma 2Q21.
Commercial loans 30 days PDL ratio was 4.1% for 2Q22, 4.5% for 1Q22 and 5.4% for pro forma 2Q21; 90 days PDL ratio was 3.7%, 4.0% and 4.8%, respectively. Consumer loans 30 days PDL ratio was 4.5% for 2Q22 and 1Q22, and 5.6% for pro forma 2Q21; 90 days PDL ratio was 2.7%, 2.7% and 3.5%, respectively. Mortgages’ 30 days PDL ratio was 5.3% for 2Q22 and 5.5% for 1Q22 and pro forma 2Q21; 90 days PDL ratio was 3.2%, 3.3% and 3.3%, respectively.
| Total gross loans | Pro forma 2Q21 (1) | 1Q22 | 2Q22 | D | |||||
| 2Q22 vs. 1Q22 | 2Q22 vs. Pro forma 2Q21 | ||||||||
| ''A'' normal risk | 132,344.4 | 141,769.7 | 150,039.4 | 5.8% | 13.4% | ||||
| ''B'' acceptable risk | 3,552.0 | 3,965.2 | 3,731.6 | -5.9% | 5.1% | ||||
| ''C'' appreciable risk | 4,726.9 | 4,180.5 | 4,266.6 | 2.1% | -9.7% | ||||
| ''D'' significant risk | 3,870.1 | 4,501.9 | 4,527.1 | 0.6% | 17.0% | ||||
| ''E'' unrecoverable | 3,219.3 | 3,876.7 | 4,024.7 | 3.8% | 25.0% | ||||
| Gross loans | 147,712.7 | 158,293.9 | 166,589.5 | 5.2% | 12.8% | ||||
| Interbank and overnight funds | 1,548.0 | 4,584.7 | 2,004.1 | -56.3% | 29.5% | ||||
| Total gross loans | 149,260.6 | 162,878.7 | 168,593.6 | 3.5% | 13.0% | ||||
| CDE loans / gross loans (*) | 8.0% | 7.9% | 7.7% | ||||||
(1) Pro-forma gross loans, total gross loans and breakdown for 2Q21 are calculated based on the reported consolidated figures excluding BHI’s contribution to these numbers. Pro-forma PDLs for 2Q21 are calculated based on the pro-forma figures explained above.
| 7 | |
| Past due loans | Pro forma 2Q21 (1) | 1Q22 | 2Q22 | D | |||||
| 2Q22 vs. 1Q22 | 2Q22 vs. Pro forma 2Q21 | ||||||||
| Performing | 81,788.7 | 86,882.8 | 91,979.8 | 5.9% | 12.5% | ||||
| Between 31 and 90 days past due | 535.5 | 476.5 | 459.6 | -3.6% | -14.2% | ||||
| +90 days past due | 4,106.6 | 3,647.4 | 3,506.6 | -3.9% | -14.6% | ||||
| Commercial loans | 86,430.8 | 91,006.7 | 95,946.0 | 5.4% | 11.0% | ||||
| Performing | 44,815.6 | 49,657.5 | 52,056.1 | 4.8% | 16.2% | ||||
| Between 31 and 90 days past due | 992.8 | 947.2 | 956.2 | 0.9% | -3.7% | ||||
| +90 days past due | 1,681.7 | 1,379.6 | 1,468.9 | 6.5% | -12.7% | ||||
| Consumer loans | 47,490.1 | 51,984.3 | 54,481.2 | 4.8% | 14.7% | ||||
| Performing | 12,714.5 | 14,190.7 | 15,044.3 | 6.0% | 18.3% | ||||
| Between 31 and 90 days past due | 301.7 | 329.8 | 325.8 | -1.2% | 8.0% | ||||
| +90 days past due | 438.5 | 489.8 | 513.5 | 4.8% | 17.1% | ||||
| Mortgages loans | 13,454.8 | 15,010.3 | 15,883.6 | 5.8% | 18.1% | ||||
| Performing | 229.1 | 209.0 | 211.6 | 1.2% | -7.6% | ||||
| Between 31 and 90 days past due | 26.8 | 10.3 | 9.3 | -9.4% | -65.2% | ||||
| +90 days past due | 81.1 | 73.3 | 57.7 | -21.3% | -28.9% | ||||
| Microcredit loans | 337.0 | 292.6 | 278.6 | -4.8% | -17.3% | ||||
| Gross loans | 147,712.7 | 158,293.9 | 166,589.5 | 5.2% | 12.8% | ||||
| Interbank & overnight funds | 1,548.0 | 4,584.7 | 2,004.1 | -56.3% | 29.5% | ||||
| Total gross loans | 149,260.6 | 162,878.7 | 168,593.6 | 3.5% | 13.0% | ||||
| 30 Days PDL / gross loans (*) | 5.5% | 4.6% | 4.4% | |||
| 90 Days PDL / gross loans (*) | 4.3% | 3.5% | 3.3% |
| Loans by stages (%) | Pro forma 2Q21 (1) | 1Q22 | 2Q22 | |||
| Loans classified as Stage 2 / gross loans | 11.9% | 10.5% | 9.1% | |||
| Loans classified as Stage 3 / gross loans | 7.4% | 6.9% | 6.6% | |||
| Loans classified as Stage 2 and 3 / gross loans | 19.3% | 17.4% | 15.7% | |||
| Allowance for Stage 1 loans / Stage 1 loans | 1.0% | 0.9% | 0.9% | |||
| Allowance for Stage 2 loans / Stage 2 loans | 10.8% | 10.5% | 10.7% | |||
| Allowance for Stage 3 loans / Stage 3 loans | 52.1% | 53.5% | 54.4% | |||
| Allowance for Stage 2 y 3 loans / Stage 2 y 3 loans | 26.7% | 27.5% | 29.2% |
Grupo Aval’s coverage over its 90 days PDL was 1.6x for 2Q22 and 1Q22, and 1.4x for pro forma 2Q21. Allowance to CDE Loans was 0.7x for 2Q22, 1Q22 and for pro forma 2Q21, allowance to 30 days PDL was 1.2x in 2Q22 and 1Q22, and 1.1x for pro forma 2Q21. Impairment loss, net of recoveries of charged off assets to average gross loans was 1.4% for 2Q22, 1.7% in pro forma 1Q22, and 2.0% in pro forma 2Q21. Charge-offs to average gross loans was 1.9% for 2Q22, 2.0% in pro forma 1Q22, and 2.1% in pro forma 2Q21.
| Total gross loans | Pro forma 2Q21 (1) | 1Q22 (2) | 2Q22 | |||
| Allowance for impairment / CDE loans | 0.7 | 0.7 | 0.7 | |||
| Allowance for impairment / 30 days PDL | 1.1 | 1.2 | 1.2 | |||
| Allowance for impairment / 90 days PDL | 1.4 | 1.6 | 1.6 | |||
| Allowance for impairment / gross loans (*) | 6.0% | 5.6% | 5.4% | |||
| Impairment loss / CDE loans | 0.3 | 0.3 | 0.2 | |||
| Impairment loss / 30 days PDL | 0.4 | 0.4 | 0.4 | |||
| Impairment loss / 90 days PDL | 0.5 | 0.6 | 0.5 | |||
| Impairment loss / average gross loans (*) | 2.4% | 2.1% | 1.8% | |||
| Impairment loss, net of recoveries of charged-off assets / average gross loans (*) | 2.0% | 1.7% | 1.4% | |||
| Charge-offs / average gross loans (*) | 2.1% | 2.0% | 1.9% |
| (*) | Gross loans exclude interbank and overnight funds. 30 days past due and 90 days past due are calculated on a capital plus interest accounts receivable basis. |
| (1) | Pro-forma past due loans, loans by stages and total gross loans and breakdown for 2Q21 are calculated based on the reported consolidated figures excluding BHI’s contribution to these numbers. Pro-forma ratios for 2Q21 are calculated based on the pro-forma figures explained above. |
| (2) | Pro-forma ratios for 1Q22 are based on reported revenues and expenses, associated to each ratio; however, the denominators averages used to calculate these ratios contain pro-forma figures from previous quarters. |
| 8 | |
1.2 Investment securities and trading assets (1)
Total investment securities and trading assets decreased 0.8% to Ps 42,579.0 billion between June 30th, 2022 and pro forma June 30th, 2021 and increased 2.9% versus March 31st, 2022.
Ps 34,557.6 billion of our total portfolio is invested in debt securities, which decreased by 2.7% between June 30th, 2022 and pro forma June 30th, 2021 and increased by 3.4% versus March 31st, 2022. Ps 6,135.1 billion of our total investment securities is invested in equity securities, which decreased by 8.1% between June 30th, 2022 and pro forma June 30th, 2021 and by 7.4% versus March 31st, 2022.
Reported investment securities and trading assets as of June 30th, 2021 were Ps 53,276.5 billion.
| Investment and trading assets | Pro forma 2Q21 (1) | 1Q22 | 2Q22 | D | |||||
| 2Q22 vs. 1Q22 | 2Q22 vs. Pro forma 2Q21 | ||||||||
| Debt securities | 5,318.3 | 3,247.3 | 3,980.0 | 22.6% | -25.2% | ||||
| Equity securities | 5,222.0 | 5,254.7 | 5,022.2 | -4.4% | -3.8% | ||||
| Derivative assets | 705.1 | 1,344.8 | 1,886.3 | 40.3% | 167.5% | ||||
| Trading assets | 11,245.5 | 9,846.7 | 10,888.4 | 10.6% | -3.2% | ||||
| Investments in debt securities at FVTPL (non compliant with SPPI test) | 6.0 | - | - | N.A | N.A | ||||
| Debt securities at FVOCI | 22,454.0 | 22,591.1 | 21,995.6 | -2.6% | -2.0% | ||||
| Equity securities at FVOCI | 1,451.5 | 1,373.8 | 1,113.0 | -19.0% | -23.3% | ||||
| Investments in securities at FVOCI | 23,905.5 | 23,964.9 | 23,108.5 | -3.6% | -3.3% | ||||
| Investments in debt securities at AC | 7,744.3 | 7,585.4 | 8,582.0 | 13.1% | 10.8% | ||||
| Investment and trading assets | 42,901.2 | 41,397.0 | 42,579.0 | 2.9% | -0.8% | ||||
The average yield on our debt and equity investment securities (trading assets, investments in debt securities at FVTPL, investments in securities at FVOCI and investments in debt securities at AC) was 3.0% for 2Q22, 3.6% for pro forma 1Q22 and 3.4% for pro forma 2Q21.
1.3 Cash and Cash Equivalents (1)
As of June 30th, 2022 cash and cash equivalents had a balance of Ps 21,441.1 billion showing an increase of 30.7% versus pro forma June 30th, 2021 and 16.1% versus March 31st, 2022.
The ratio of cash and cash equivalents to customer deposits was 13.4% at June 30th, 2022, 10.7% at March 31st, 2022, and 12.5% at pro forma June 30th, 2021.
Reported cash and cash equivalents as of June 30th, 2021 were Ps 35,613.6 billion.
(1) Pro-forma investment and trading assets and cash and cash equivalents for 2Q21 are calculated based on the reported consolidated figures excluding BHI’s contribution to these numbers.
| 9 | |
1.4 Goodwill and Other Intangibles (1)
Goodwill and other intangibles as of June 30th, 2022 reached Ps 16,036.3 billion, increasing by 15.4% versus pro forma June 30th, 2021 and 5.2% versus March 31st, 2022.
Goodwill as of June 30th, 2022 was Ps 2,234.9 billion, decreasing by 4.1% versus pro forma June 30th, 2021 and increasing 0.6% versus March 31st, 2022.
Other intangibles, which include “concession arrangement rights” and other intangibles, mainly reflect the value of road concessions recorded for the most part at Corficolombiana. Other intangibles as of June 30th, 2022 reached Ps 13,801.4 billion and grew by 19.3% versus pro forma June 30th, 2021 and 6.0% versus March 31st, 2022.
Reported goodwill and other intangibles as of June 30th, 2021 were Ps 19,997.4 billion.
2. Liabilities
As of June 30th, 2022 Total Funding represented 93.0% of total liabilities and other liabilities represented 7.0%.
2.1 Funding (1)
Total Funding (Total financial liabilities at amortized cost) which includes (i) Customer deposits, (ii) Interbank borrowings and overnight funds, (iii) Borrowings from banks and others, (iv) Bonds issued, and (v) Borrowing from development entities had a balance of Ps 228,683.0 billion as of June 30th, 2022 showing an increase of 11.2% versus pro forma June 30th, 2021 and 6.1% versus March 31st, 2022. Total customer deposits represented 70.0% of total funding as of 2Q22, 70.9% for 1Q22, and 72.1% for pro forma 2Q21.
Average cost of funds was 4.2% for 2Q22, 3.2% for pro forma 1Q22 and 2.2% for pro forma 2Q21.
Reported total funding as of June 30th, 2021 were Ps 289,655.3 billion.
2.1.1 Customer deposits (1)
| Customer deposits | Pro forma 2Q21 (1) | 1Q22 | 2Q22 | D | |||||
| 2Q22 vs. 1Q22 | 2Q22 vs. Pro forma 2Q21 | ||||||||
| Checking accounts | 18,390.6 | 19,617.1 | 19,975.7 | 1.8% | 8.6% | ||||
| Other deposits | 318.1 | 302.9 | 399.6 | 31.9% | 25.6% | ||||
| Non-interest bearing | 18,708.7 | 19,920.0 | 20,375.4 | 2.3% | 8.9% | ||||
| Checking accounts | 8,757.3 | 8,599.8 | 6,486.4 | -24.6% | -25.9% | ||||
| Time deposits | 53,481.6 | 53,221.1 | 60,524.8 | 13.7% | 13.2% | ||||
| Savings deposits | 67,320.0 | 70,967.2 | 72,642.8 | 2.4% | 7.9% | ||||
| Interest bearing | 129,558.9 | 132,788.1 | 139,653.9 | 5.2% | 7.8% | ||||
| Customer deposits | 148,267.7 | 152,708.1 | 160,029.3 | 4.8% | 7.9% | ||||
(1) Pro-forma goodwill and other intangibles, funding and deposits for 2Q21 are calculated based on the reported consolidated figures excluding BHI’s contribution to these numbers.
| 10 | |
Of our total customer deposits as of June 30th, 2022, checking accounts represented 16.5%, time deposits 37.8%, savings accounts 45.4%, and other deposits 0.2%.
The following table shows the customer deposits composition by bank. During the last twelve months, Banco de Occidente showed the highest growth rate in customer deposits within our banking operation in Colombia.
| Deposits / Bank ($) | Pro forma 2Q21 (1) | 1Q22 | 2Q22 | D | |||||
| 2Q22 vs. 1Q22 | 2Q22 vs. Pro forma 2Q21 | ||||||||
| Banco de Bogotá | 80,572.6 | 77,045.3 | 84,388.8 | 9.5% | 4.7% | ||||
| Banco de Occidente | 32,552.0 | 37,561.3 | 38,737.3 | 3.1% | 19.0% | ||||
| Banco Popular | 21,195.4 | 23,068.5 | 23,205.6 | 0.6% | 9.5% | ||||
| Banco AV Villas | 12,772.3 | 13,557.0 | 14,494.7 | 6.9% | 13.5% | ||||
| Corficolombiana | 5,473.6 | 5,440.7 | 5,936.9 | 9.1% | 8.5% | ||||
| Eliminations | (4,298.3) | (3,964.7) | (6,733.9) | 69.8% | 56.7% | ||||
| Total Grupo Aval | 148,267.7 | 152,708.1 | 160,029.3 | 4.8% | 7.9% | ||||
| Deposits / Bank (%) | Pro forma 2Q21 (1) | 1Q22 | 2Q22 | |||
| Banco de Bogotá | 54.3% | 50.5% | 52.7% | |||
| Banco de Occidente | 22.0% | 24.6% | 24.2% | |||
| Banco Popular | 14.3% | 15.1% | 14.5% | |||
| Banco AV Villas | 8.6% | 8.9% | 9.1% | |||
| Corficolombiana | 3.7% | 3.6% | 3.7% | |||
| Eliminations | -2.9% | -2.6% | -4.2% | |||
| Total Grupo Aval | 100.0% | 100.0% | 100.0% |
Reported customer deposits as of June 30th, 2021 were Ps 225,773.4 billion.
2.1.2 Borrowings from Banks and Other (includes borrowings from development entities) (1)
As of June 30th, 2022 borrowings from banks and other totaled Ps 26,180.7 billion, increasing 40.4% versus pro forma June 30th, 2021 and 23.4% versus March 31st, 2022.
Reported borrowings from banks and others as of June 30th, 2021 were Ps 24,115.7 billion.
2.1.3 Bonds issued (1)
Total bonds issued as of June 30th, 2022 totaled Ps 31,973.1 billion and increased 9.8% versus pro forma June 30th, 2021 and 5.1% versus March 31st, 2022 .
(1) Pro-forma deposits, borrowings from banks and other and bond issued for 2Q21 are calculated based on the reported consolidated figures excluding BHI’s contribution to these numbers.
| 11 | |
3. Non-controlling Interest
Non-controlling Interest in Grupo Aval reflects the minority stakes that third party shareholders hold in each of its direct consolidated subsidiaries (Banco de Bogotá, Banco de Occidente, Banco Popular, Banco AV Villas, Corficolombiana and Porvenir).
As of June 30th, 2022 non-controlling interest was Ps 13,729.6 billion which decreased by 11.4% versus June 30th, 2021 and increased by 2.7% versus March 31st, 2022. Total non-controlling interest represents 45.5% of total equity as of 2Q22, compared to 45.2% in 1Q22 and 41.9% in 2Q21.
Total non-controlling interest derives from the sum of the combined minority interests of our banks and of Grupo Aval, applying eliminations associated with the consolidation process of Grupo Aval.
| Percentage consolidated by Aval | 2Q21 | 1Q22 | 2Q22 | D | |||||
| 2Q22 vs. 1Q22 | 2Q22 vs. 2Q21 | ||||||||
| Banco de Bogotá | 68.7% | 68.7% | 68.9% | 19 | 19 | ||||
| Banco de Occidente | 72.3% | 72.3% | 72.3% | - | - | ||||
| Banco Popular | 93.7% | 93.7% | 93.7% | - | - | ||||
| Banco AV Villas | 79.9% | 79.9% | 79.9% | - | - | ||||
| Porvenir (1) | 75.7% | 75.7% | 75.8% | 9 | 9 | ||||
| Corficolombiana | 40.0% | 40.0% | 40.4% | 42 | 42 | ||||
(1) Grupo Aval is the direct controlling entity of Porvenir.
4. Attributable Shareholders’ Equity
Attributable shareholders’ equity as of June 30th, 2022 was Ps 16,420.0 billion, showing a decrease of 23.5% versus June 30th, 2021 and an increase of 1.2% versus March 31st, 2022.
| 12 | |
Income Statement Analysis
Our net income attributable to the owners of the parent company for 2Q22 of Ps 675.5 billion showed a 28.9% decrease versus 2Q21 and a 60.9% decrease versus 1Q22.
| Consolidated Statement of Income Continued operations | Pro forma 2Q21 (1) | 1Q22 | 2Q22 | D | |||||
| 2Q22 vs. 1Q22 | 2Q22 vs. Pro forma 2Q21 | ||||||||
| Interest income | 3,144.4 | 3,759.8 | 4,286.7 | 14.0% | 36.3% | ||||
| Interest expense | 1,093.0 | 1,679.2 | 2,312.3 | 37.7% | 111.6% | ||||
| Net interest income | 2,051.3 | 2,080.6 | 1,974.4 | -5.1% | -3.8% | ||||
| Loans and other accounts receivable | 862.9 | 807.3 | 719.6 | -10.9% | -16.6% | ||||
| Other financial assets | (0.1) | 18.9 | (1.0) | -105.2% | N.A. | ||||
| Recovery of charged-off financial assets | (111.6) | (130.8) | (151.8) | 16.0% | 36.0% | ||||
| Net impairment loss on financial assets | 751.3 | 695.4 | 566.8 | -18.5% | -24.6% | ||||
| Net income from commissions and fees | 731.1 | 710.0 | 697.3 | -1.8% | -4.6% | ||||
| Gross profit from sales of goods and services | 940.9 | 1,020.6 | 1,440.8 | 41.2% | 53.1% | ||||
| Net trading income | 262.4 | (287.3) | 481.5 | N.A | 83.5% | ||||
| Net income from other financial instruments mandatory at FVTPL | 62.8 | 73.9 | 68.4 | -7.4% | 8.9% | ||||
| Total other income | 79.4 | 793.3 | (390.7) | -149.2% | N.A | ||||
| Total other expenses | 1,642.0 | 1,679.5 | 1,754.6 | 4.5% | 6.9% | ||||
| Net income before income tax expense | 1,734.7 | 2,016.2 | 1,950.4 | -3.3% | 12.4% | ||||
| Income tax expense | 440.4 | 633.0 | 564.3 | -10.8% | 28.1% | ||||
| Net income for the period of continued operations | 1,294.2 | 1,383.2 | 1,386.1 | 0.2% | 7.1% | ||||
| Net income for the period of discontinued operations | 420.8 | (2) 1,597.5 | (0.0) | -100.0% | -100.0% | ||||
| Net income for the period | 1,715.0 | 2,980.8 | 1,386.1 | -53.5% | -19.2% | ||||
| Non-controlling interest | 765.5 | 1,251.1 | 710.6 | -43.2% | -7.2% | ||||
| Net income attributable to owners of the parent | 949.5 | 1,729.7 | 675.5 | -60.9% | -28.9% | ||||
1. Net Interest Income (1)
| Net interest income | Pro forma 2Q21 (1) | 1Q22 | 2Q22 | D | |||||
| 2Q22 vs. 1Q22 | 2Q22 vs. Pro forma 2Q21 | ||||||||
| Interest income | |||||||||
| Commercial | 1,140.2 | 1,456.9 | 1,824.8 | 25.3% | 60.0% | ||||
| Interbank and overnight funds | 19.8 | 68.6 | 54.0 | -21.3% | 173.1% | ||||
| Consumer | 1,460.3 | 1,559.8 | 1,653.0 | 6.0% | 13.2% | ||||
| Mortgages and housing leases | 267.3 | 278.0 | 335.5 | 20.7% | 25.5% | ||||
| Microcredit | 20.5 | 16.6 | 15.9 | -4.5% | -22.5% | ||||
| Loan portfolio | 2,908.1 | 3,379.8 | 3,883.2 | 14.9% | 33.5% | ||||
| Interests on investments in debt securities | 236.3 | 380.0 | 403.5 | 6.2% | 70.8% | ||||
| Total interest income | 3,144.4 | 3,759.8 | 4,286.7 | 14.0% | 36.3% | ||||
| Interest expense | |||||||||
| Checking accounts | 14.6 | 29.9 | 28.6 | -4.3% | 96.3% | ||||
| Time deposits | 393.4 | 544.2 | 759.7 | 39.6% | 93.1% | ||||
| Savings deposits | 202.8 | 407.9 | 671.8 | 64.7% | N.A. | ||||
| Total interest expenses on deposits | 610.8 | 982.0 | 1,460.2 | 48.7% | 139.1% | ||||
| Interbank borrowings and overnight funds | 39.0 | 76.5 | 121.3 | 58.6% | N.A. | ||||
| Borrowings from banks and others | 99.2 | 124.5 | 169.6 | 36.2% | 71.0% | ||||
| Bonds issued | 322.4 | 466.9 | 515.8 | 10.5% | 60.0% | ||||
| Borrowings from development entities | 21.6 | 29.3 | 45.5 | 55.2% | 110.5% | ||||
| Total interest expenses on financial obligations | 482.2 | 697.1 | 852.2 | 22.2% | 76.7% | ||||
| Total interest expense | 1,093.0 | 1,679.2 | 2,312.3 | 37.7% | 111.6% | ||||
| Net interest income | 2,051.3 | 2,080.6 | 1,974.4 | -5.1% | -3.8% | ||||
| (1) | Pro-forma figures for 2Q21 are calculated based on the reported consolidated figures excluding BHI’s contribution to these numbers. |
| (2) | Increases Ps. 1,053 bn related to gains from loss of control in subsidiaries, included in 1Q22 under other income from operations, included in this report under net income of discontinued operations. |
| 13 | |
Our net interest income decreased by 3.8% to Ps 1,974.4 billion for 2Q22 versus pro forma 2Q21 and by 5.1% versus 1Q22. The decrease versus pro forma 2Q21 was derived mainly from a 36.3% increase in total interest income offset by a 111.6% increase in total interest expense.
Our Net Interest Margin(*) was 3.6% for 2Q22, 4.1%(2) for pro forma 1Q22, and 4.6%(1) in pro forma 2Q21. Net Interest Margin on Loans was 4.9% for 2Q22, 5.1%(2) for pro forma 1Q22, and 5.5%(1) for pro forma 2Q21. On the other hand, our Net Investments Margin was -1.3% for 2Q22, 0.6%(2) for pro forma 1Q22 and 1.1%(1) for pro forma 2Q21.
Reported Net Interest Margin was 4.9% for 2Q21, Net Interest Margin on Loans was 5.8% for 2Q21 and our Net Investments Margin was 1.4% for 2Q21.
2. Impairment loss on financial assets, net (1)
Our impairment loss on financial assets, net decreased by 24.6% to Ps 566.8 billion for 2Q22 versus pro forma 2Q21 and decreased by 18.5% versus 1Q22.
| Net impairment loss on financial assets | Pro forma 2Q21(1) | 1Q22 | 2Q22 | D | |||||
| 2Q22 vs. 1Q22 | 2Q22 vs. Pro forma 2Q21 | ||||||||
| Loans and other accounts receivable | 862.9 | 807.3 | 719.6 | -10.9% | -16.6% | ||||
| Other financial assets | (0.1) | 18.9 | (1.0) | -105.2% | N.A. | ||||
| Recovery of charged-off financial assets | (111.6) | (130.8) | (151.8) | 16.0% | 36.0% | ||||
| Net impairment loss on financial assets | 751.3 | 695.4 | 566.8 | -18.5% | -24.6% | ||||
Our annualized gross cost of risk was 1.8% for 2Q22, 2.1%(2) for pro forma 1Q22, and 2.4% for pro forma 2Q21. Net of recoveries of charged-off assets our ratio was 1.4% for 2Q22, 1.7%(2) for pro forma 1Q22, and 2.0% for pro forma 2Q21.
Annualized gross cost of risk as reported was 2.2% for 2Q21. Net of recoveries of charged-off assets our ratio was 2.0% for 2Q21.
(*) Grupo Aval’s NIM without income from trading securities and investment in debt securities designated at fair value through profit and loss (non compliant with SPPI test) was 4.0% for 2Q22, 4.4% for pro forma 1Q22, and 4.6% for pro forma 2Q21 .
| (1) | Pro-forma NIM, NIM on loans and NIM on Investments and Net impairment loss on financial assets for 2Q21 are calculated based on the reported consolidated figures excluding BHI’s contribution to these numbers. Pro-forma ratios for 2Q21 are calculated based on the pro-forma figures explained above. |
| (2) | Pro-forma ratios for 1Q22 are based on reported revenues and expenses, associated to each ratio; however, the denominators averages used to calculate these ratios contain pro-forma figures from previous quarters. |
| 14 | |
3. Non-interest income (1)
| Total non-interest income | Pro forma 2Q21(1) | 1Q22 | 2Q22 | D | |||||
| 2Q22 vs. 1Q22 | 2Q22 vs. Pro forma 2Q21 | ||||||||
| Income from commissions and fees | |||||||||
| Banking fees (1) | 491.7 | 564.6 | 584.3 | 3.5% | 18.8% | ||||
| Trust activities | 81.5 | 83.9 | 85.1 | 1.5% | 4.3% | ||||
| Pension and severance fund management | 284.0 | 303.7 | 199.0 | -34.5% | -29.9% | ||||
| Bonded warehouse services | 38.7 | 43.0 | 44.5 | 3.6% | 14.8% | ||||
| Total income from commissions and fees | 895.9 | 995.1 | 912.8 | -8.3% | 1.9% | ||||
| Expenses from commissions and fees | 164.8 | 285.0 | 215.5 | -24.4% | 30.7% | ||||
| Net income from commissions and fees | 731.1 | 710.0 | 697.3 | -1.8% | -4.6% | ||||
| Income from sales of goods and services | 2,668.5 | 2,667.9 | 3,231.6 | 21.1% | 21.1% | ||||
| Costs and expenses from sales of goods and services | 1,727.6 | 1,647.3 | 1,790.8 | 8.7% | 3.7% | ||||
| Gross profit from sales of goods and services | 940.9 | 1,020.6 | 1,440.8 | 41.2% | 53.1% | ||||
| Net trading income | 262.4 | (287.3) | 481.5 | -267.6% | 83.5% | ||||
| Net income from other financial instruments mandatory at FVTPL | 62.8 | 73.9 | 68.4 | -7.4% | 8.9% | ||||
| Other income | |||||||||
| Foreign exchange gains (losses), net | (82.7) | 369.2 | (702.5) | -290.3% | N.A. | ||||
| Net gain on sale of investments and OCI realization | 8.4 | (2.6) | (8.3) | 225.4% | -199.8% | ||||
| Gain on the sale of non-current assets held for sale | 4.1 | 3.9 | 1.9 | -51.3% | -53.2% | ||||
| Income from non-consolidated investments (2) | 86.2 | 203.3 | 247.2 | 21.6% | 186.8% | ||||
| Net gains on asset valuations | (0.0) | 0.3 | 12.5 | N.A. | N.A | ||||
| Other income from operations | 63.5 | 219.2 | 58.5 | -73.3% | -7.8% | ||||
| Total other income | 79.4 | 793.3 | (390.7) | -149.2% | N.A | ||||
| Total non-interest income | 2,076.6 | 2,310.5 | 2,297.4 | -0.6% | 10.6% | ||||
(1) Includes commissions on banking services, office network services, credit and debit card fees, fees on drafts, checks and checkbooks and other fees
(2) Includes share of profit of equity accounted investees, net of tax, and dividend income.
3.1 Net income from commissions and fees(1)
Net income from commissions and fees for 2Q22 totaled Ps 697.3 billion and decreased by 4.6% versus pro forma 2Q21 and decreased by 1.8% versus 1Q22. Income from commissions and fees increased by 1.9% to Ps 912.8 billion in 2Q22 versus pro forma 2Q21 and decreased 8.3% versus 1Q22.
Reported net income from commissions and fees for 2Q21 totaled Ps 1,304.9 billion and reported income from commissions and fees totaled Ps 1,494.6 billion.
3.2 Gross profit from sales of goods and services
Gross profit from sales of goods and services (non-financial sector) increased by 53.1% to Ps 1,440.8 billion for 2Q22 versus 2Q21 and 41.2% quarterly, due to a strong contribution from infrastructure sector.
(1) Pro-forma non-interest income, net income from commissions and fees for 2Q21 are calculated based on the reported consolidated figures excluding BHI’s contribution to these numbers.
| 15 | |
3.3 Net trading income (1)
| Net trading income | Pro forma 2Q21(1) | 1Q22 | 2Q22 | D | |||||
| 2Q22 vs. 1Q22 | 2Q22 vs. Pro forma 2Q21 | ||||||||
| Trading investment income | 99.3 | (18.3) | (111.7) | N.A. | -212.5% | ||||
| Net income (loss) on financial derivatives | 138.7 | (301.7) | 593.3 | -296.7% | N.A. | ||||
| Other trading income on derivatives | 24.4 | 32.6 | (0.1) | -100.3% | -100.5% | ||||
| Net trading income | 262.4 | (287.3) | 481.5 | -267.6% | 83.5% | ||||
Net trading income for Grupo Aval should be analyzed in conjunction with the foreign exchange gains (losses).
3.4 Other income (1)
Total other income for 2Q22 totaled Ps -390.7 billion. The quarterly decrease can be explained by foreign exchange losses, net accounting for Ps -702.5 billion. The yearly increase on Income from non-consolidated investments was driven by the recognition of the indirect stake of approximately 17.2% in BHI in this quarter.
Reported total other income for 1Q21 totaled Ps 306.9 billion.
4. Other expenses (1)
Total other expenses for 2Q22 totaled Ps 1,754.6 billion and increased by 6.9% versus pro forma 2Q21 and increased by 4.5% versus 1Q22. Our efficiency ratio measured as total other expenses to total income was 41.1% in 2Q22, 38.2%(*) in 1Q22 and 39.8%(1) for pro forma 2Q21. The ratio of annualized total other expenses as a percentage of average total assets was 2.6% for 2Q22 and for pro forma 1Q22(2), and 2.7%(1) for pro forma 2Q21.
Reported total other expenses for 2Q21 totaled Ps 2,739.2 billion.
5. Non-controlling Interest
Non-controlling interest in Grupo Aval mainly reflects the minority stakes that third party shareholders hold in each of its direct consolidated subsidiaries (Banco de Bogotá, Banco de Occidente, Banco Popular, Banco AV Villas, Corficolombiana and Porvenir).
Non-controlling interest in the income statement decreased to Ps 710.6 billion, showing a 7.2% decrease versus 2Q21 and a 43.2% decrease versus 1Q22. In addition, the ratio of non-controlling interest to income before non-controlling interest was 51.3% in 2Q22, 42.0% in 1Q22 and 44.6% in 2Q21.
(*) Excludes from the denominator Ps 1.053 bn related to gains from loss of control in subsidiaries, included in 1Q22 under other income from operations, included in this report under net income of discontinued operations.
(1) Pro-forma net trading income, total other income and total other expenses for 2Q21 are calculated based on the reported consolidated figures excluding BHI’s contribution to these numbers. Pro-forma ratios for 2Q21 are calculated based on the pro-forma figures explained above.
(2) Pro-forma ratios for 2Q22 are based on reported revenues and expenses, associated to each ratio; however, the denominators averages used to calculate these ratios contain pro-forma figures from previous quarters.
| 16 | |
Information related to Grupo Aval Acciones y Valores S.A. (Holding Company) and Grupo Aval Limited
The holding company recorded a total gross indebtedness of Ps 1,669.3 billion (Ps 533.3 billion of bank debt and Ps 1,136.1 billion of bonds denominated in Colombian pesos) as of June 30th 2022. It also guarantees irrevocably and unconditionally Grupo Aval Limited’s (144A / Reg S) 2022 (USD 1.0 billion) bonds and Grupo Aval Limited’s (144A / Reg S) 2030 (USD 1.0 billion) bonds under its respective indentures. As of June 30th 2022 the total amount outstanding (including interests payable) of such bonds was USD 2.0 billion, or Ps 8,395.6 billion when converted into pesos.
The debt at Grupo Aval Limited is serviced with interest income on loans to subsidiaries and cash & cash equivalents. Grupo Aval Limited has not required, to this date, cash from Grupo Aval Acciones y Valores S.A. to fulfill its obligations. The main sources of cash to pay the debt and debt service at Grupo Aval Acciones y Valores S.A. have been the dividend income from its subsidiaries and the returns on its cash & cash equivalents.
When combined, Grupo Aval Acciones y Valores S.A. and Grupo Aval Ltd. had Ps 5,779.0 billion of total liquid assets (including callable senior loans to subsidiaries), a total gross indebtedness of Ps 10,065.0 billion and a net indebtedness of Ps 4,286.0 billion as of June 30th 2022. In addition to liquid assets, Grupo Aval Ltd. has Ps 2,147.5 billion in investments in AT1 instruments.
| Total liquid assets as of June 30, 2022 | ||||
| Cash and cash equivalents | 4,412.4 | |||
| Fixed income investments | 291.4 | |||
| Callable Senior loans to subsidiaries | 1,075.2 | |||
| Total liquid assets | 5,779.0 | |||
 |
As of June 30th, 2022 our combined double leverage (calculated as investments in subsidiaries at book value, subordinated loans to subsidiaries, AT1 investments, and goodwill as a percentage of shareholders' equity) was 1.25x. Finally, we present an evolution of our key ratios on a combined basis:
| Debt service coverage and leverage ratios | 2Q21 | 1Q22 | 2Q22 | D | |||||
| 2Q22 vs. 1Q22 | 2Q22 vs. 2Q21 | ||||||||
| Double leverage (1) | 1.19x | 1.22x | 1.25x | 0.02 | 0.06 | ||||
| Net debt / Core earnings (2)(3) | 3.9x | 4.6x | 5.7x | 1.07 | 1.81 | ||||
| Net debt / Cash dividends (2)(3) | 5.8x | 6.2x | 14.4x | 8.15 | 8.53 | ||||
| Core Earnings / Interest Expense (2) | 4.1x | 3.1x | 1.8x | -1.31 | -2.28 | ||||
(1) Double leverage is calculated as investments in subsidiaries at book value (excluding revaluations), subordinated loans to subsidiaries and goodwill as a percentage of shareholders' equity;
(2) Core earnings are defined as annualized recurring cash flow from dividends, investments and net operating income;
(3) Net debt is calculated as total gross debt minus cash and cash equivalents and fixed income investments
| 17 | |
ABOUT GRUPO AVAL
Grupo Aval, leading financial conglomerate in Colombia, operates through: four commercial banks in Colombia (Banco de Bogotá, Banco de Occidente, Banco Popular and Banco AV Villas), the largest private pension and severance fund manager in Colombia (Porvenir), and the largest financial corporation in Colombia (Corficolombiana). Additionally, it operates in Central America through Multi Financial Holding Group in Panama and has a 25% investment in BAC Holding International Corporation (BHI) through Banco de Bogota
Investor Relations Contact
Andrea Arevalo
Strategic Planning and Investor Relations Manager
Tel: +571 743 32 22 x 23422
E-mail: aarevalo@grupoaval.com
| 18 | |
| Grupo Aval Acciones y Valores S.A. | ||
| Consolidated Financial Statements | ||
| Supplemental unaudited pro forma financial information | ||
| Information in Ps. Billions | 2Q21 | |
| Consolidated Statement of Financial Position | 2Q21 | BHI 2Q21 (1) | Pro forma 2Q21 | 1Q22 | 2Q22 | D | ||||||||
| 2Q22 vs. 2Q21 | 2Q22 vs. Pro forma 2Q21 | 2Q22 vs. 1Q22 | ||||||||||||
| Cash and cash equivalents | 35,613.6 | (17,141.8) | 18,471.8 | 16,407.1 | 21,441.1 | -39.8% | 16.1% | 30.7% | ||||||
| Investment and trading assets | ||||||||||||||
| Debt securities | 5,418.1 | (99.8) | 5,318.3 | 3,247.3 | 3,980.0 | -26.5% | -25.2% | 22.6% | ||||||
| Equity securities | 5,264.1 | (42.1) | 5,222.0 | 5,254.7 | 5,022.2 | -4.6% | -3.8% | -4.4% | ||||||
| Derivative assets | 705.2 | (0.1) | 705.1 | 1,344.8 | 1,886.3 | 167.5% | 167.5% | 40.3% | ||||||
| Trading assets | 11,387.4 | (141.9) | 11,245.5 | 9,846.7 | 10,888.4 | -4.4% | -3.2% | 10.6% | ||||||
| Investments in debt securities at FVTPL (non compliant with SPPI test) | 6.0 | - | 6.0 | - | - | -100.0% | -100.0% | N.A | ||||||
| Investments in securities at FVOCI | 36,153.3 | (12,247.8) | 23,905.5 | 23,964.9 | 23,108.5 | -36.1% | -3.3% | -3.6% | ||||||
| Investments in debt securities at AC | 5,729.8 | 2,014.5 | 7,744.3 | 7,585.4 | 8,582.0 | 49.8% | 10.8% | 13.1% | ||||||
| Investment securities | 41,889.0 | (10,233.3) | 31,655.7 | 31,550.3 | 31,690.5 | -24.3% | 0.1% | 0.4% | ||||||
| Hedging derivatives assets | 39.7 | - | 39.7 | 53.8 | 49.1 | 23.5% | 23.5% | -8.7% | ||||||
| Gross loans | ||||||||||||||
| Commercial loans | 118,819.8 | (30,841.0) | 87,978.7 | 95,591.4 | 97,950.2 | -17.6% | 11.3% | 2.5% | ||||||
| Commercial loans | 116,094.0 | (29,663.3) | 86,430.8 | 91,006.7 | 95,946.0 | -17.4% | 11.0% | 5.4% | ||||||
| Interbank & overnight funds | 2,725.7 | (1,177.8) | 1,548.0 | 4,584.7 | 2,004.1 | -26.5% | 29.5% | -56.3% | ||||||
| Consumer loans | 70,562.4 | (23,072.3) | 47,490.1 | 51,984.3 | 54,481.2 | -22.8% | 14.7% | 4.8% | ||||||
| Mortgages loans | 26,831.3 | (13,376.5) | 13,454.8 | 15,010.3 | 15,883.6 | -40.8% | 18.1% | 5.8% | ||||||
| Microcredit loans | 337.0 | - | 337.0 | 292.6 | 278.6 | -17.3% | -17.3% | -4.8% | ||||||
| Total gross loans | 216,550.5 | (67,289.9) | 149,260.6 | 162,878.7 | 168,593.6 | -22.1% | 13.0% | 3.5% | ||||||
| Loss allowance | (11,256.9) | 2,428.0 | (8,828.9) | (8,824.2) | (8,941.7) | -20.6% | 1.3% | 1.3% | ||||||
| Total loans, net | 205,293.6 | (64,861.9) | 140,431.7 | 154,054.5 | 159,651.9 | -22.2% | 13.7% | 3.6% | ||||||
| Other accounts receivable, net | 16,893.4 | (889.5) | 16,003.8 | 19,587.4 | 20,799.0 | 23.1% | 30.0% | 6.2% | ||||||
| Non-current assets held for sale | 125.4 | (29.6) | 95.8 | 147.2 | 144.9 | 15.5% | 51.1% | -1.6% | ||||||
| Investments in associates and joint ventures | 1,057.1 | (0.6) | 1,056.5 | 4,356.9 | 4,882.0 | N.A. | N.A. | 12.1% | ||||||
| Own-use property, plant and equipment for own-use and given in operating lease, net | 5,974.4 | (1,330.0) | 4,644.3 | 4,593.0 | 4,615.9 | -22.7% | -0.6% | 0.5% | ||||||
| Right-of-use assets | 1,936.4 | (607.1) | 1,329.3 | 1,362.0 | 1,336.9 | -31.0% | 0.6% | -1.8% | ||||||
| Investment properties | 832.2 | - | 832.2 | 894.5 | 923.9 | 11.0% | 11.0% | 3.3% | ||||||
| Biological assets | 130.8 | - | 130.8 | 153.8 | 167.2 | 27.9% | 27.9% | 8.7% | ||||||
| Tangible assets | 8,873.8 | (1,937.2) | 6,936.6 | 7,003.4 | 7,043.9 | -20.6% | 1.5% | 0.6% | ||||||
| Goodwill | 8,221.9 | (5,890.8) | 2,331.1 | 2,220.5 | 2,234.9 | -72.8% | -4.1% | 0.6% | ||||||
| Concession arrangement rights | 10,025.0 | - | 10,025.0 | 11,338.9 | 12,032.2 | 20.0% | 20.0% | 6.1% | ||||||
| Other intangible assets | 1,750.5 | (210.7) | 1,539.8 | 1,687.2 | 1,769.2 | 1.1% | 14.9% | 4.9% | ||||||
| Intangible assets | 19,997.4 | (6,101.5) | 13,895.9 | 15,246.5 | 16,036.3 | -19.8% | 15.4% | 5.2% | ||||||
| Current | 1,256.0 | (39.7) | 1,216.3 | 983.7 | 1,346.2 | 7.2% | 10.7% | 36.8% | ||||||
| Deferred | 1,200.4 | (224.9) | 975.4 | 1,406.4 | 1,610.5 | 34.2% | 65.1% | 14.5% | ||||||
| Income tax assets | 2,456.4 | (264.7) | 2,191.7 | 2,390.1 | 2,956.7 | 20.4% | 34.9% | 23.7% | ||||||
| Other assets | 625.0 | (164.8) | 460.3 | 480.1 | 527.2 | -15.6% | 14.5% | 9.8% | ||||||
| Spun-off assets from BHI | - | 101,766.7 | 101,766.7 | - | N.A | -100.0% | N.A | |||||||
| Total assets | 344,251.8 | - | 344,251.8 | 261,124.1 | 276,111.0 | -19.8% | -19.8% | 5.7% | ||||||
| Trading derivative liabilities | 759.6 | - | 759.6 | 1,360.4 | 1,893.8 | 149.3% | 149.3% | 39.2% | ||||||
| Hedging derivatives liabilities | 52.4 | - | 52.4 | 52.6 | 5.8 | -88.9% | -88.9% | -88.9% | ||||||
| Customer deposits | 225,773.4 | (77,505.7) | 148,267.7 | 152,708.1 | 160,029.3 | -29.1% | 7.9% | 4.8% | ||||||
| Checking accounts | 55,880.7 | (28,732.8) | 27,147.9 | 28,216.9 | 26,462.1 | -52.6% | -2.5% | -6.2% | ||||||
| Time deposits | 84,637.9 | (31,156.3) | 53,481.6 | 53,221.1 | 60,524.8 | -28.5% | 13.2% | 13.7% | ||||||
| Savings deposits | 84,635.6 | (17,315.6) | 67,320.0 | 70,967.2 | 72,642.8 | -14.2% | 7.9% | 2.4% | ||||||
| Other deposits | 619.2 | (301.1) | 318.1 | 302.9 | 399.6 | -35.5% | 25.6% | 31.9% | ||||||
| Financial obligations | 63,882.0 | (6,543.4) | 57,338.5 | 62,778.9 | 68,653.7 | 7.5% | 19.7% | 9.4% | ||||||
| Interbank borrowings and overnight funds | 9,824.7 | (246.7) | 9,578.0 | 11,156.8 | 10,499.9 | 6.9% | 9.6% | -5.9% | ||||||
| Borrowings from banks and others | 20,397.3 | (5,465.8) | 14,931.4 | 17,937.9 | 22,945.6 | 12.5% | 53.7% | 27.9% | ||||||
| Bonds issued | 29,941.5 | (830.8) | 29,110.7 | 30,414.2 | 31,973.1 | 6.8% | 9.8% | 5.1% | ||||||
| Borrowings from development entities | 3,718.4 | - | 3,718.4 | 3,270.0 | 3,235.0 | -13.0% | -13.0% | -1.1% | ||||||
| Total financial liabilities at amortized cost | 289,655.3 | (84,049.1) | 205,606.2 | 215,487.1 | 228,683.0 | -21.0% | 11.2% | 6.1% | ||||||
| Legal related | 225.1 | (10.3) | 214.8 | 252.0 | 217.1 | -3.5% | 1.1% | -13.8% | ||||||
| Other provisions | 670.2 | (34.0) | 636.2 | 844.4 | 858.9 | 28.2% | 35.0% | 1.7% | ||||||
| Provisions | 895.3 | (44.2) | 851.0 | 1,096.4 | 1,076.0 | 20.2% | 26.4% | -1.9% | ||||||
| Current | 173.6 | (93.8) | 79.8 | 245.6 | 109.0 | -37.2% | 36.6% | -55.6% | ||||||
| Deferred | 3,637.1 | (344.8) | 3,292.3 | 4,186.6 | 4,522.2 | 24.3% | 37.4% | 8.0% | ||||||
| Income tax liabilities | 3,810.7 | (438.7) | 3,372.1 | 4,432.2 | 4,631.3 | 21.5% | 37.3% | 4.5% | ||||||
| Employee benefits | 1,176.1 | (228.5) | 947.6 | 950.6 | 846.3 | -28.0% | -10.7% | -11.0% | ||||||
| Other liabilities | 10,952.9 | (1,705.0) | 9,247.9 | 8,144.3 | 8,825.3 | -19.4% | -4.6% | 8.4% | ||||||
| Spun-off liabilities from BHI | - | 86,465.6 | 86,465.6 | - | - | N.A | -100.0% | N.A | ||||||
| Total liabilities | 307,302.4 | - | 307,302.4 | 231,523.5 | 245,961.5 | -20.0% | -20.0% | 6.2% | ||||||
| Equity attributable to owners of the parent | 21,455.5 | - | 21,455.8 | 16,230.3 | 16,420.0 | -23.5% | -23.5% | 1.2% | ||||||
| Non-controlling interest | 15,493.9 | - | 15,493.6 | 13,370.3 | 13,729.6 | -11.4% | -11.4% | 2.7% | ||||||
| Total equity | 36,949.4 | - | 36,949.4 | 29,600.6 | 30,149.6 | -18.4% | -18.4% | 1.9% | ||||||
| Total liabilities and equity | 344,251.8 | - | 344,251.8 | 261,124.1 | 276,111.0 | -19.8% | -19.8% | 5.7% | ||||||
(1) BHI’s contribution to previously reported consolidated figures.
| 19 | |
| Grupo Aval Acciones y Valores S.A. |
| Consolidated Financial Statements Under Full IFRS |
| Financial Statements Under IFRS |
| Information in Ps. Billions |
| Continued Operations |
| Consolidated Statement of income | (1) YTD 2021 | YTD 2022 | D | (1) 2Q21 | 1Q22 | 2Q22 | D | ||||||||
| 2022 vs. 2021 | 2Q22 vs. 1Q22 | 2Q22 vs. 2Q21 | |||||||||||||
| Interest income | |||||||||||||||
| Loan portfolio | 5,825.9 | 7,263.0 | 24.7% | 2,908.1 | 3,379.8 | 3,883.2 | 14.9% | 33.5% | |||||||
| Interests on investments in debt securities | 430.3 | 783.5 | 82.1% | 236.3 | 380.0 | 403.5 | 6.2% | 70.8% | |||||||
| Total interest income | 6,256.2 | 8,046.5 | 28.6% | 3,144.4 | 3,759.8 | 4,286.7 | 14.0% | 36.3% | |||||||
| Interest expense | |||||||||||||||
| Checking accounts | 30.9 | 58.5 | 89.2% | 14.6 | 29.9 | 28.6 | -4.3% | 96.3% | |||||||
| Time deposits | 822.5 | 1,303.9 | 58.5% | 393.4 | 544.2 | 759.7 | 39.6% | 93.1% | |||||||
| Savings deposits | 406.5 | 1,079.8 | 165.7% | 202.8 | 407.9 | 671.8 | 64.7% | N.A. | |||||||
| Total interest expenses on deposits | 1,259.9 | 2,442.2 | 93.8% | 610.8 | 982.0 | 1,460.2 | 48.7% | 139.1% | |||||||
| Interbank borrowings and overnight funds | 63.1 | 197.7 | N.A. | 39.0 | 76.5 | 121.3 | 58.6% | N.A. | |||||||
| Borrowings from banks and others | 192.7 | 294.0 | 52.6% | 99.2 | 124.5 | 169.6 | 36.2% | 71.0% | |||||||
| Bonds issued | 618.0 | 982.7 | 59.0% | 322.4 | 466.9 | 515.8 | 10.5% | 60.0% | |||||||
| Borrowings from development entities | 44.9 | 74.9 | 66.5% | 21.6 | 29.3 | 45.5 | 55.2% | 110.5% | |||||||
| Total interest expenses on financial obligations | 918.8 | 1,549.3 | 68.6% | 482.2 | 697.1 | 852.2 | 22.2% | 76.7% | |||||||
| Total interest expense | 2,178.6 | 3,991.5 | 83.2% | 1,093.0 | 1,679.2 | 2,312.3 | 37.7% | 111.6% | |||||||
| Net interest income | 4,077.5 | 4,055.0 | -0.6% | 2,051.3 | 2,080.6 | 1,974.4 | -5.1% | -3.8% | |||||||
| Impairment losses (recoveries) on financial assets | |||||||||||||||
| Loans and other accounts receivable | 1,792.7 | 1,526.9 | -14.8% | 862.9 | 807.3 | 719.6 | -10.9% | -16.6% | |||||||
| Other financial assets | 0.6 | 18.0 | N.A. | (0.1) | 18.9 | (1.0) | -105.2% | N.A. | |||||||
| Recovery of charged-off financial assets | (203.3) | (282.6) | 39.0% | (111.6) | (130.8) | (151.8) | 16.0% | 36.0% | |||||||
| Net impairment loss on financial assets | 1,590.0 | 1,262.2 | -20.6% | 751.3 | 695.4 | 566.8 | -18.5% | -24.6% | |||||||
| Net interest income, after impairment losses | 2,487.5 | 2,792.7 | 12.3% | 1,300.1 | 1,385.2 | 1,407.6 | 1.6% | 8.3% | |||||||
| Income from commissions and fees | |||||||||||||||
| Banking fees (2) | 995.6 | 1,148.9 | 15.4% | 491.7 | 564.6 | 584.3 | 3.5% | 18.8% | |||||||
| Trust activities | 170.1 | 169.0 | -0.7% | 81.5 | 83.9 | 85.1 | 1.5% | 4.3% | |||||||
| Pension and severance fund management | 587.3 | 502.6 | -14.4% | 284.0 | 303.7 | 199.0 | -34.5% | -29.9% | |||||||
| Bonded warehouse services | 76.7 | 87.4 | 13.9% | 38.7 | 43.0 | 44.5 | 3.6% | 14.8% | |||||||
| Income from commissions and fees | 1,829.8 | 1,907.9 | 4.3% | 895.9 | 995.1 | 912.8 | -8.3% | 1.9% | |||||||
| Expenses from commissions and fees | 342.4 | 500.5 | 46.2% | 164.8 | 285.0 | 215.5 | -24.4% | 30.7% | |||||||
| Net income from commissions and fees | 1,487.3 | 1,407.4 | -5.4% | 731.1 | 710.0 | 697.3 | -1.8% | -4.6% | |||||||
| Income from sales of goods and services | 5,042.0 | 5,899.5 | 17.0% | 2,668.5 | 2,667.9 | 3,231.6 | 21.1% | 21.1% | |||||||
| Costs and expenses from sales of goods and services | 3,330.4 | 3,438.1 | 3.2% | 1,727.6 | 1,647.3 | 1,790.8 | 8.7% | 3.7% | |||||||
| Gross profit from sales of goods and services | 1,711.5 | 2,461.4 | 43.8% | 940.9 | 1,020.6 | 1,440.8 | 41.2% | 53.1% | |||||||
| Net trading income | 452.1 | 194.1 | -57.1% | 262.4 | (287.3) | 481.5 | N.A | 83.5% | |||||||
| Net income from other financial instruments mandatory at FVTPL | 144.5 | 142.3 | -1.5% | 62.8 | 73.9 | 68.4 | -7.4% | 8.9% | |||||||
| Other income | |||||||||||||||
| Foreign exchange gains (losses), net | (250.1) | (333.3) | 33.3% | (82.7) | 369.2 | (702.5) | N.A | N.A. | |||||||
| Net gain on sale of investments and OCI realization | 79.4 | (10.9) | -113.7% | 8.4 | (2.6) | (8.3) | N.A. | -199.8% | |||||||
| Gain on the sale of non-current assets held for sale | 8.0 | 5.8 | -27.3% | 4.1 | 3.9 | 1.9 | -51.3% | -53.2% | |||||||
| Income from non-consolidated investments (3) | 248.7 | 450.5 | 81.1% | 86.2 | 203.3 | 247.2 | 21.6% | 186.8% | |||||||
| Net gains on asset valuations | 1.9 | 12.8 | N.A. | (0.0) | 0.3 | 12.5 | N.A. | N.A | |||||||
| Other income from operations | 131.6 | 277.7 | 111.0% | 63.5 | 219.2 | 58.5 | -73.3% | -7.8% | |||||||
| Total other income | 219.6 | 402.6 | 83.3% | 79.4 | 793.3 | (390.7) | -149.2% | N.A | |||||||
| Other expenses | |||||||||||||||
| Loss on the sale of non-current assets held for sale | 1.9 | 0.3 | -83.4% | 1.4 | 0.3 | (0.0) | -110.1% | -102.5% | |||||||
| Personnel expenses | 1,280.8 | 1,353.2 | 5.6% | 648.3 | 680.0 | 673.2 | -1.0% | 3.8% | |||||||
| General and administrative expenses | 1,521.8 | 1,671.7 | 9.9% | 781.0 | 797.9 | 873.8 | 9.5% | 11.9% | |||||||
| Depreciation and amortization | 293.4 | 316.4 | 7.8% | 143.6 | 155.5 | 160.8 | 3.4% | 12.0% | |||||||
| Impairment loss on other assets | 5.9 | 12.0 | 102.9% | 0.8 | 10.5 | 1.5 | -85.3% | 87.4% | |||||||
| Other operating expenses | 86.4 | 80.5 | -6.8% | 66.9 | 35.2 | 45.3 | 28.8% | -32.3% | |||||||
| Total other expenses | 3,190.2 | 3,434.0 | 7.6% | 1,642.0 | 1,679.5 | 1,754.6 | 4.5% | 6.9% | |||||||
| Net income before income tax expense | 3,312.3 | 3,966.6 | 19.8% | 1,734.7 | 2,016.2 | 1,950.4 | -3.3% | 12.4% | |||||||
| Income tax expense | 932.4 | 1,197.2 | 28.4% | 440.4 | 633.0 | 564.3 | -10.8% | 28.1% | |||||||
| Net income for the period of continued operations | 2,380.0 | 2,769.3 | 16.4% | 1,294.2 | 1,383.2 | 1,386.1 | 0.2% | 7.1% | |||||||
| Net income for the period of discontinued operations | 786.6 | 1,597.5 | 103.1% | 420.8 | (4)1,597.5 | (0.0) | -100.0% | -100.0% | |||||||
| Net income for the period | 3,166.6 | 4,366.8 | 37.9% | 1,715.0 | 2,980.8 | 1,386.1 | -53.5% | -19.2% | |||||||
| Net income for the period attibutable to: | |||||||||||||||
| Non-controlling interest | 1,425.4 | 1,961.6 | 37.6% | 765.5 | 1,251.1 | 710.6 | -43.2% | -7.2% | |||||||
| Net income attributable to owners of the parent | 1,741.3 | 2,405.2 | 38.1% | 949.5 | 1,729.7 | 675.5 | -60.9% | -28.9% | |||||||
(1) Information was modified considering the discontinued operation.
(2) Includes commissions on banking services, office network services, credit and debit card fees, fees on drafts, checks and checkbooks and other fees
(3) Includes share of profit of equity accounted investees, net of tax, and dividend income.
(4) Increases Ps. 1,053 bn related to gains from loss of control in subsidiaries, included in 1Q22 under other income from operations, included in this report under net income of discontinued operations
| 20 | |
Item 2

1 2Q22 Consolidated Earnings Results IFRS
2 Disclaimer Grupo Aval Acciones y Valores S . A . (“Grupo Aval”) is an issuer of securities in Colombia and in the United States (“SEC”) . As such, it is subject to compliance with securities regulation in Colombia and applicable U . S . securities regulation . Grupo Aval is also subject to the inspection and supervision of the Superintendency of Finance as holding company of the Aval financial conglomerate . The consolidated financial information included in this document is presented in accordance with IFRS as currently issued by the IASB . Details of the calculations of non - IFRS measures such as ROAA and ROAE, among others, are explained when required in this report . Banco de Bogotá executed a spin - off of a 75 % equity stake in BAC Holding International, Corp (“BHI”) ; to its shareholders and Grupo Aval subsequently spun - off its equity interest to its shareholders on March 29 , 2022 . Prior to the spin - off, Banco de Bogotá was the direct parent of BHI . Grupo Aval has retained an indirect stake of approximately 17 . 2 % in BHI (representing our proportional interest in the 25 % equity stake in BHI retained by Banco de Bogotá) . This interest in BHI is reported as discontinued operations for reporting periods prior to the spin - off and will be reported under the “share of profit of equity accounted investees, net of tax (equity method)” line item for subsequent periods . As a result, for comparability purposes, we have prepared and present supplemental unaudited pro forma financial information for the six months ended June 30 , 2021 that assumes the spin - off was completed on January 1 , 2021 . The supplemental unaudited pro forma financial information does not purport to be indicative of our results of operations or financial position had the relevant transactions occurred on the dates assumed and does not project our results of operations or financial position for any future period or date . The pro forma financial information is unaudited and the completion of the external audit for the year ended December 31 , 2022 may result in adjustments to the unaudited pro forma financial information presented herein any such adjustments may be material . For further information, please see the supplemental unaudited pro forma financial information in our Q 2 earnings release dated August 10 , 2022 . This report includes forward - looking statements . In some cases, you can identify these forward - looking statements by words such as “may,” “will,” “should,” “expects,” “plans,” “anticipates,” “believes,” “estimates,” “predicts,” “potential,” or “continue,” or the negative of these and other comparable words . Actual results and events may differ materially from those anticipated herein as a consequence of changes in general, economic and business conditions, changes in interest and currency rates and other risk described from time to time in our filings with the Registro Nacional de Valores y Emisores and the SEC . Recipients of this document are responsible for the assessment and use of the information provided herein . Matters described in this presentation and our knowledge of them may change extensively and materially over time but we expressly disclaim any obligation to review, update or correct the information provided in this report, including any forward looking statements, and do not intend to provide any update for such material developments prior to our next earnings report . The content of this document and the figures included herein are intended to provide a summary of the subjects discussed rather than a comprehensive description . When applicable, in this document we refer to billions as thousands of millions .

3 Consolidated key results for the quarter Gross loans e xcludes interbank and overnight funds . PDLs 90 + defined as loans more than 90 days past due . Cost of Risk c alculated as Impairment loss on loans and other accounts receivable net of recoveries of charged - off assets divided by average gross loans . Net Interest Margin includes net interest income plus net trading income from investment securities held for trading through profit or loss divided by total average interest - earning assets . Fee income ratio is calculated as net income from commissions and fees divided by net interest income plus net income from commissions and fees, gross profit from sales of goods and services, net trading income, net income from other financial instruments mandatory at FVTPL and total other income . Efficiency Ratio is calculated as total other expenses divided by net interest income plus net income from commissions and fees, gross profit from sales of goods and services, net trading income, net income from other financial instruments mandatory at FVTPL and total other income . ROAA is calculated as annualized Net Income divided by average of total assets . ROAE is calculated as Net Income attributable to Aval's shareholders divided by average attributable shareholders' equity . NS refers to non - significant figures . COP $tn Pro forma 2Q21 Pro forma (PF) where indicated 1Q22 2Q22 2Q22 vs Pro forma (PF) where indicated 1Q22 2Q22 vs Pro forma 2Q21 Gross Loans $ 147.7 $ 158.3 $ 166.6 5.2% 12.8% Deposits $ 148.3 $ 152.7 $ 160.0 4.8% 7.9% Deposits/Net Loans 1.06 x 0.99 x 1.00 x 0.01 x -0.05 x 90 days PDLs / Gross Loans 4.3% 3.5% 3.3% (20) bps (94) bps Allowance/90 days PDLs 1.40 x 1.58 x 1.61 x 0.03 x 0.21 x Cost of risk 2.0% 1.7% 1.4% (33) bps (65) bps Net interest margin 4.6% 4.1% 3.6% (50) bps (94) bps Fee income Ratio 17.7% 16.2% 16.3% 15 bps (139) bps Efficiency Ratio 39.8% 38.2% 41.1% 283 bps 130 bps Reported 2Q21 1Q22 2Q22 2Q22 vs 1Q22 2Q22 vs Reported 2Q21 Attributable net income $ 0.95 $ 1.73 $ 0.68 -60.9% -28.9% ROAA 2.0% 3.8% 2.1% (173) bps 5 bps ROAE 18.2% 35.3% 16.6% (1,871) bps (161) bps Presented for comparability purposes Other ratios Profitability Balance Sheet Loan Quality PF PF • Pro - forma Loans, Allowances, Net Interest, Fees and Operating costs for 2Q21 are calculated based on the previously reported con solidated figures excluding BHI’s contribution to these numbers. • Pro - forma ratios for 2Q21 are calculated based on the pro - forma figures explained above. • Pro - forma ratios for 1Q22 are based on reported revenues and expenses, associated to each ratio; however, the denominators avera ges used to calculate these ratios contain pro - forma figures from previous quarters. (1) Excludes from the denominator Ps 1.053 bn related to gains from loss of control in subsidiaries, included in 1Q22 under other in come from operations, included in this report under net income of discontinued operations. (1) (1)

4 5.62% 0% 2% 4% 6% 8% 10% 12% Dec-17 Dec-18 Dec-19 Dec-20 Dec-21 12-Month inflation Lower target range Upper target range 10.21% Jul - 22: Dec - 21: -17% -7% 3% 13% Dec-17 Dec-18 Dec-19 Dec-20 Dec-21 Real GDP growth Inflation Colombian Central Bank's Interest rate 9.00% 10.21% 8.15% (5.2%) (6.4%) (9%) (7%) (5%) (3%) (1%) 1% Trade balance Current Account Deficit Source: Banco de la República de Colombia and DANE. Source: DANE. Seasonally adjusted, constant prices o f 2015 GDP Oil Exports/Total Exports Source : Banco de la República de Colombia and DANE. Source: Banco de la República de Colombia and DANE. GDP Seasonally - adjusted, constant prices (2015 basis) FY GDP 1.4% 2.6% 3.2% - 7.0% 10.7% 2017: 35.0% 2018: 40.2% 2019: 40.4% 2020: 28.2% 2021: 32.4% Macroeconomic context - Colombia ( 1 | 2 ) Inflation (%) Central Bank’s Monetary Policy GDP Growth (%) Current Account ( % GDP, quarterly) 2020 2021 2020 2021(3.7%) (4.9%) (3.4%) (5.7%) 0.8 1.7 1.6 1.4 2.1 2.4 2.9 2.9 3.1 3.4 3.3 3.0 0.7 - 16.5 - 8.7 - 3.6 1.2 18.2 13.9 10.8 8.2 I II III IV I II III IV I II III IV I II III IV I II III IV I II III IV 2017 2018 2019 2020 2021 2022 1.4 2.6 3.2 -7.0 10.7 NA
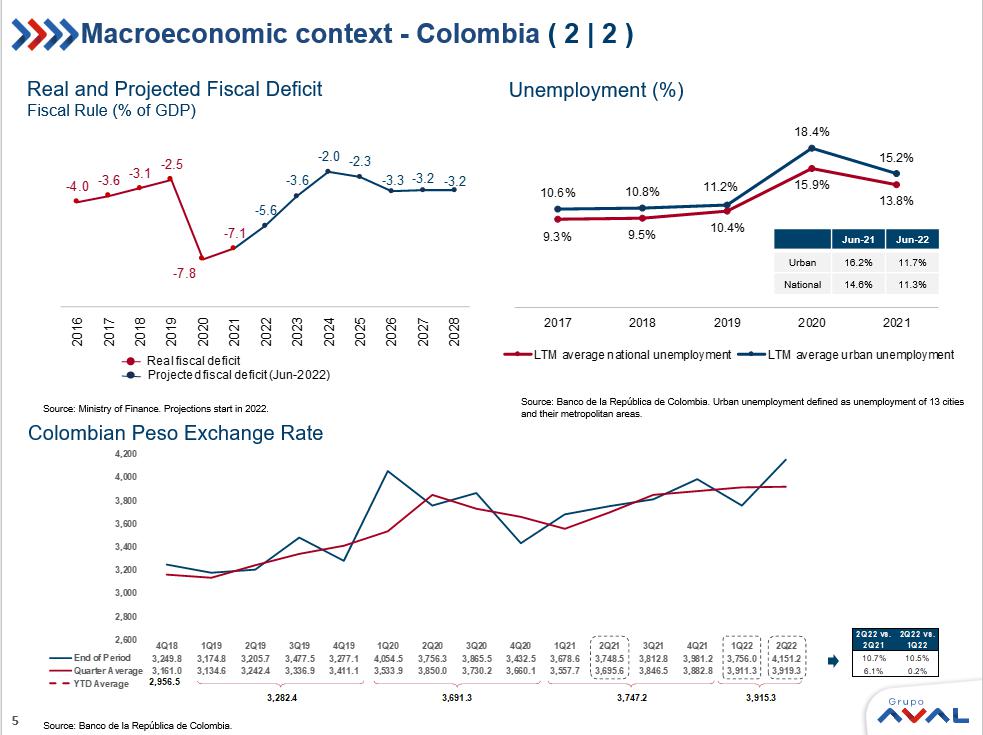
5 - 5.6 - 3.6 - 2.0 - 2.3 - 3.3 - 3.2 - 3.2 - 4.0 - 3.6 - 3.1 - 2.5 - 7.8 - 7.1 2016 2017 2018 2019 2020 2021 2022 2023 2024 2025 2026 2027 2028 Real fiscal deficit Projected fiscal deficit (Jun - 2022) 9.3% 9.5% 10.4% 15.9% 13.8% 10.6% 10.8% 11.2% 18.4% 15.2% 2017 2018 2019 2020 2021 LTM average national unemployment LTM average urban unemployment Source: Ministry of Finance. Projections start in 2022. Source: Banco de la República de Colombia. Source: Banco de la República de Colombia. Urban unemployment defined as unemployment of 13 cities and their metropolitan areas. Jun - 21 Jun - 22 Urban 16.2% 11.7% National 14.6% 11.3% Macroeconomic context - Colombia ( 2 | 2 ) Real and Projected Fiscal Deficit Fiscal Rule (% of GDP) Colombian Peso Exchange Rate Unemployment (%) 4Q18 1Q19 2Q19 3Q19 4Q19 1Q20 2Q20 3Q20 4Q20 1Q21 2Q21 3Q21 4Q21 1Q22 2Q22 End of Period 3,249.8 3,174.8 3,205.7 3,477.5 3,277.1 4,054.5 3,756.3 3,865.5 3,432.5 3,678.6 3,748.5 3,812.8 3,981.2 3,756.0 4,151.2 Quarter Average 3,161.0 3,134.6 3,242.4 3,336.9 3,411.1 3,533.9 3,850.0 3,730.2 3,660.1 3,557.7 3,695.6 3,846.5 3,882.8 3,911.3 3,919.3 YTD Average 2,600 2,800 3,000 3,200 3,400 3,600 3,800 4,000 4,200 2,956.5 3,282.4 3,691.3 3,747.2 3,915.3

6 Assets Assets breakdown (%) Total assets (1) Pro - forma Total assets, net loans and leases, fixed income investments, unconsolidated equity investments and other assets for 2 Q21 are calculated based on the reported consolidated figures excluding BHI’s contribution to these numbers. (2) Net loans and leases include interbank and overnight funds Figures in Ps. Trillions 242.5 261.1 276.1 Pro forma 2Q21 1Q22 2Q22 Y/Y% = 13.9% Q/Q% = 5.7% 7.6 57.9 14.6 3.2 16.6 Pro forma 2Q21 6.3 59.0 12.8 4.2 17.7 1Q22 7.8 57.8 12.5 4.0 17.9 2Q22 (1) (1) Cash and equivalents Net loans and leases Fixed income investments Unconsolidated equity investments Other (2)
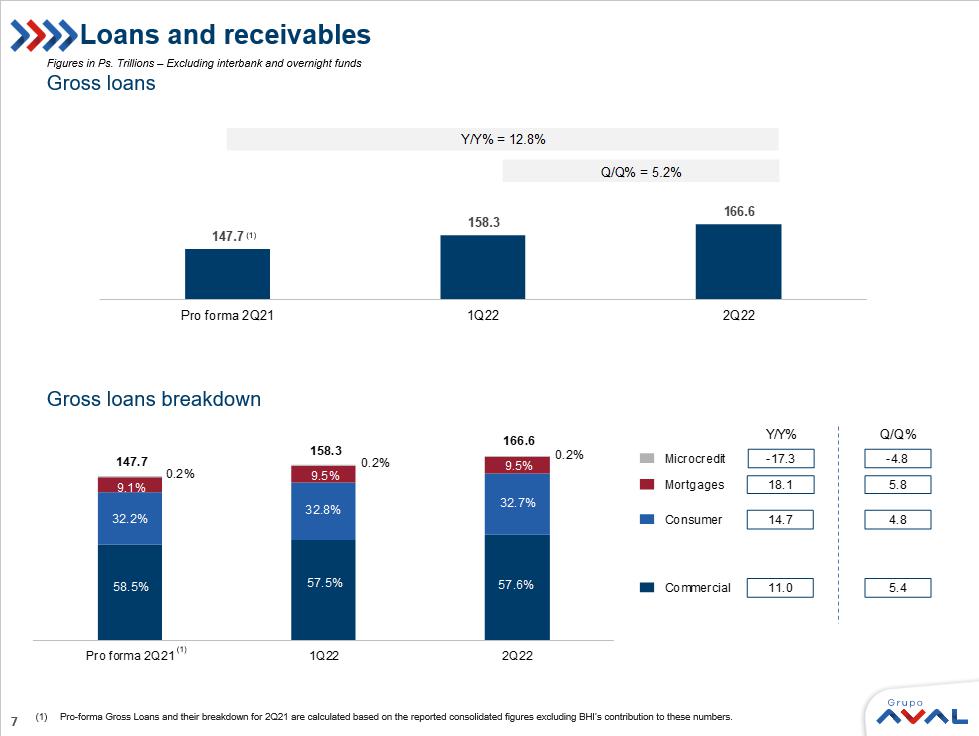
7 (1) Pro - forma Gross Loans and their breakdown for 2Q21 are calculated based on the reported consolidated figures excluding BHI’s con tribution to these numbers. 147.7 158.3 166.6 Pro forma 2Q21 1Q22 2Q22 Y/Y% = 12.8% Q/Q% = 5.2% Loans and receivables Gross loans Gross loans breakdown Figures in Ps. Trillions – Excluding interbank and overnight funds 147.7 158.3 166.6 Pro forma 2Q21 1Q22 2Q22 11.0 14.7 5.4 4.8 18.1 - 17.3 5.8 - 4.8 58.5% 57.5% 57.6% 32.2% 32.8% 32.7% 9.1% 9.5% 9.5% 0.2% 0.2% 0.2% Y/Y% Q/Q% Commercial Consumer Mortgages Microcredit (1) (1)
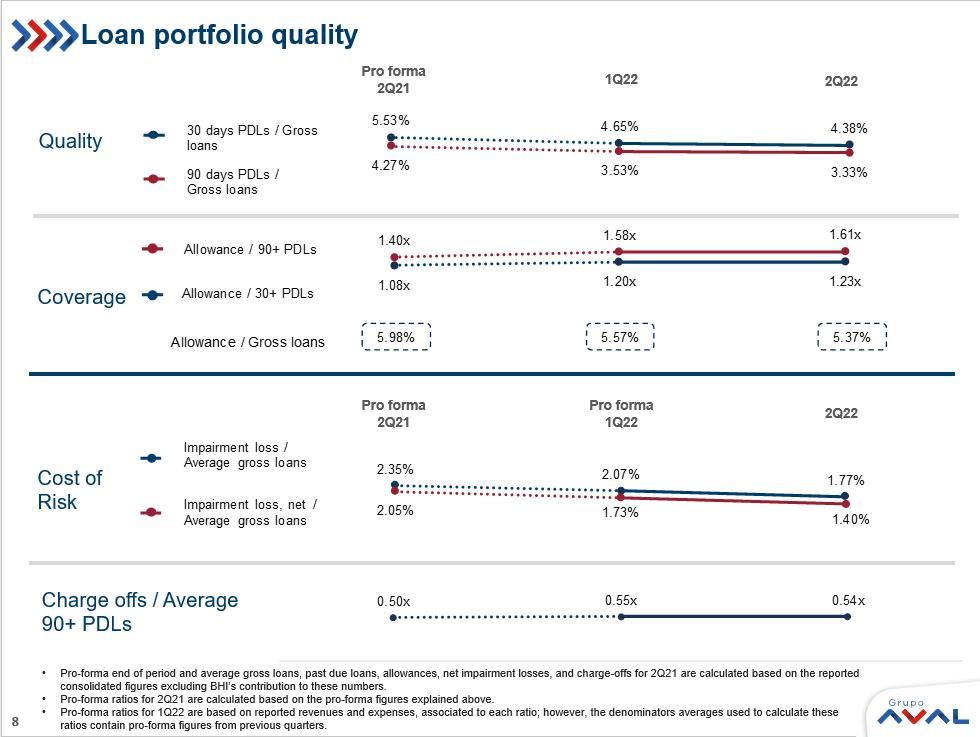
8 Loan portfolio quality Charge offs / Average 90+ PDLs Cost of Risk Quality Coverage Pro forma 2Q21 1Q22 2Q22 5.53% 4.65% 4.38% 4.27% 3.53% 3.33% 30 days PDLs / Gross loans 90 days PDLs / Gross loans 2.35% 2.07% 1.77% 2.05% 1.73% 1.40% Impairment loss / Average gross loans Impairment loss, net / Average gross loans 1.40x 1.58x 1.61x 1.08x 1.20x 1.23x 5.98% 5.57% 5.37% Allowance / Gross loans Allowance / 90+ PDLs Allowance / 30+ PDLs 0.50x 0.55x 0.54x Pro forma 2Q21 Pro forma 1Q22 2Q22 • Pro - forma end of period and average gross loans, past due loans, allowances, net impairment losses, and charge - offs for 2Q21 are calculated based on the reported consolidated figures excluding BHI’s contribution to these numbers. • Pro - forma ratios for 2Q21 are calculated based on the pro - forma figures explained above. • Pro - forma ratios for 1Q22 are based on reported revenues and expenses, associated to each ratio; however, the denominators avera ges used to calculate these ratios contain pro - forma figures from previous quarters.
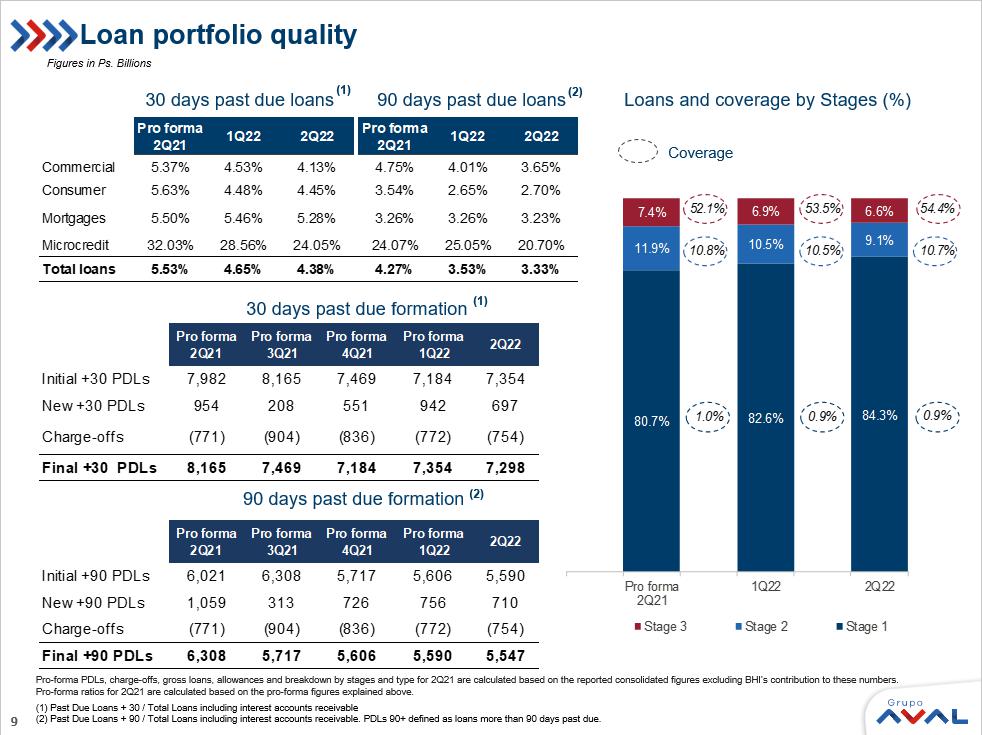
9 Loan portfolio quality 30 days past due formation (1) 90 days past due formation (2) Loans and coverage by Stages (%) Pro - forma PDLs, charge - offs, gross loans, allowances and breakdown by stages and type for 2Q21 are calculated based on the repor ted consolidated figures excluding BHI’s contribution to these numbers. Pro - forma ratios for 2Q21 are calculated based on the pro - forma figures explained above. (1) Past Due Loans + 30 / Total Loans including interest accounts receivable (2) Past Due Loans + 90 / Total Loans including interest accounts receivable. PDLs 90+ defined as loans more than 90 days pas t d ue. Figures in Ps. Billions 30 days past due loans (1) 90 days past due loans (2) Coverage Pro forma 2Q21 1Q22 2Q22 Pro forma 2Q21 1Q22 2Q22 Commercial 5.37% 4.53% 4.13% 4.75% 4.01% 3.65% Consumer 5.63% 4.48% 4.45% 3.54% 2.65% 2.70% Mortgages 5.50% 5.46% 5.28% 3.26% 3.26% 3.23% Microcredit 32.03% 28.56% 24.05% 24.07% 25.05% 20.70% Total loans 5.53% 4.65% 4.38% 4.27% 3.53% 3.33% 80.7% 82.6% 84.3% 11.9% 10.5% 9.1% 7.4% 6.9% 6.6% Pro forma 2Q21 1Q22 2Q22 Stage 3 Stage 2 Stage 1 52.1% 53.5% 54.4% 10.8% 10.5% 10.7% 1.0% 0.9% 0.9% Pro forma 2Q21 Pro forma 3Q21 Pro forma 4Q21 Pro forma 1Q22 2Q22 Initial +30 PDLs 7,982 8,165 7,469 7,184 7,354 New +30 PDLs 954 208 551 942 697 Charge-offs (771) (904) (836) (772) (754) Final +30 PDLs 8,165 7,469 7,184 7,354 7,298 Pro forma 2Q21 Pro forma 3Q21 Pro forma 4Q21 Pro forma 1Q22 2Q22 Initial +90 PDLs 6,021 6,308 5,717 5,606 5,590 New +90 PDLs 1,059 313 726 756 710 Charge-offs (771) (904) (836) (772) (754) Final +90 PDLs 6,308 5,717 5,606 5,590 5,547
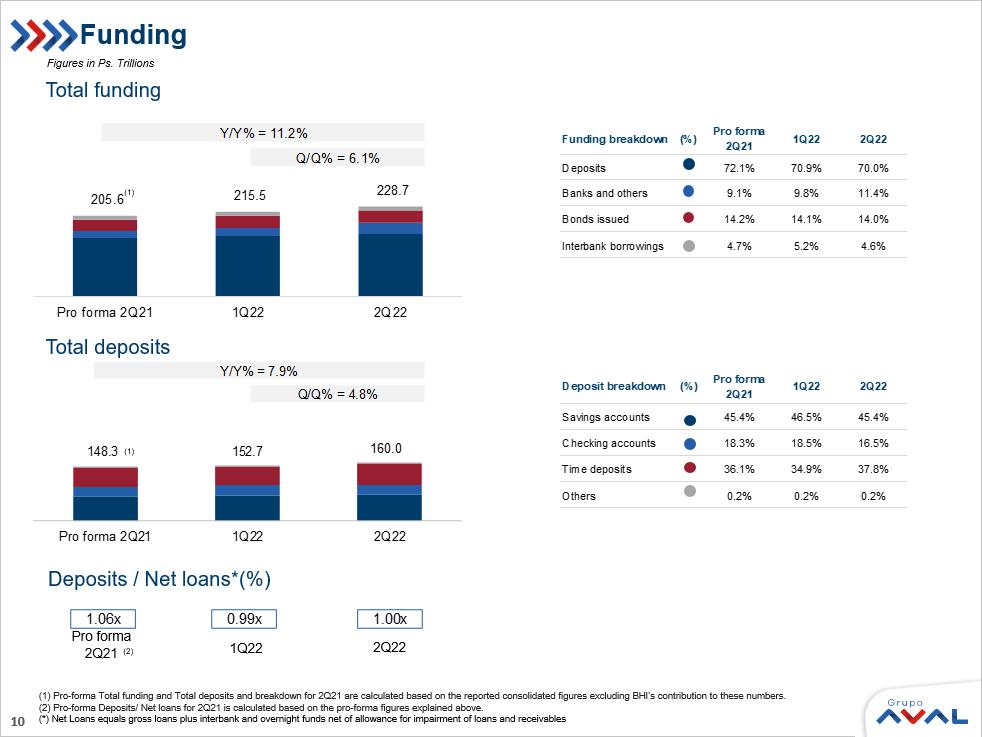
10 148.3 152.7 160.0 Pro forma 2Q21 1Q22 2Q22 Y/Y% = 7.9% Q/Q% = 4.8% = 1.06x 0.99x 1.00x Funding breakdown (%) Pro forma 2Q21 1Q22 2Q22 Deposits 72.1% 70.9% 70.0% Banks and others 9.1% 9.8% 11.4% Bonds issued 14.2% 14.1% 14.0% Interbank borrowings 4.7% 5.2% 4.6% Funding (1) Pro - forma Total funding and Total deposits and breakdown for 2Q21 are calculated based on the reported consolidated figures excluding BHI’s contribution to these numbers. (2) Pro - forma Deposits/ Net loans for 2Q21 is calculated based on the pro - forma figures explained above. (*) Net Loans equals gross loans plus interbank and overnight funds net of allowance for impairment of loans and receivables Total deposits Total funding Figures in Ps. Trillions Deposits / Net loans*(%) Pro forma 2Q21 1Q22 2Q22 Deposit breakdown (%) Pro forma 2Q21 1Q22 2Q22 Savings accounts 45.4% 46.5% 45.4% Checking accounts 18.3% 18.5% 16.5% Time deposits 36.1% 34.9% 37.8% Others 0.2% 0.2% 0.2% 205.6 215.5 228.7 Pro forma 2Q21 1Q22 2Q22 Q/Q% = 6.1% Y/Y% = 11.2% (1) (1) (2)

11 2Q21 1Q22 2Q22 2Q21 1Q22 2Q22 2Q21 1Q22 2Q22 2Q21 1Q22 2Q22 Core Equity Tier 1 8.9 10.4 10.0 11.4 10.0 10.3 11.8 12.4 12.1 12.5 10.8 10.6 AT1 1.2 - - - - - - - - - - - Primary capital (Tier 1) 10.2 10.4 10.0 11.4 10.0 10.3 11.8 12.4 12.1 12.5 10.8 10.6 Solvency Ratio 12.5 13.0 12.8 13.7 11.0 11.2 13.5 13.2 12.9 13.2 11.4 11.1 Attributable Equity + Minority Interest Figures in Ps. Trillions Consolidated Capital Adequacy of our Banks (%) Capital as reported (1) Tangible Equity Ratio is calculated as Total Equity minus Goodwill and other Intangibles divided by Total Assets minus Goodwi ll and other Intangibles Attributable Shareholders Equity 21.5 16.2 16.4 15.5 13.4 13.7 36.9 29.6 30.1 2Q21 1Q22 2Q22 Attributable equity Minority interest Q/Q% = 1.9% Y/Y% = - 18.4% 21.5 16.2 16.4 2Q21 1Q22 2Q22 Q/Q% = 1.2% Y/Y% = - 23.5% Tangible equity ratio (1) 9.6% 8.1% 10.0% Total equity / Assets 10.9% 11.3% 10.7%
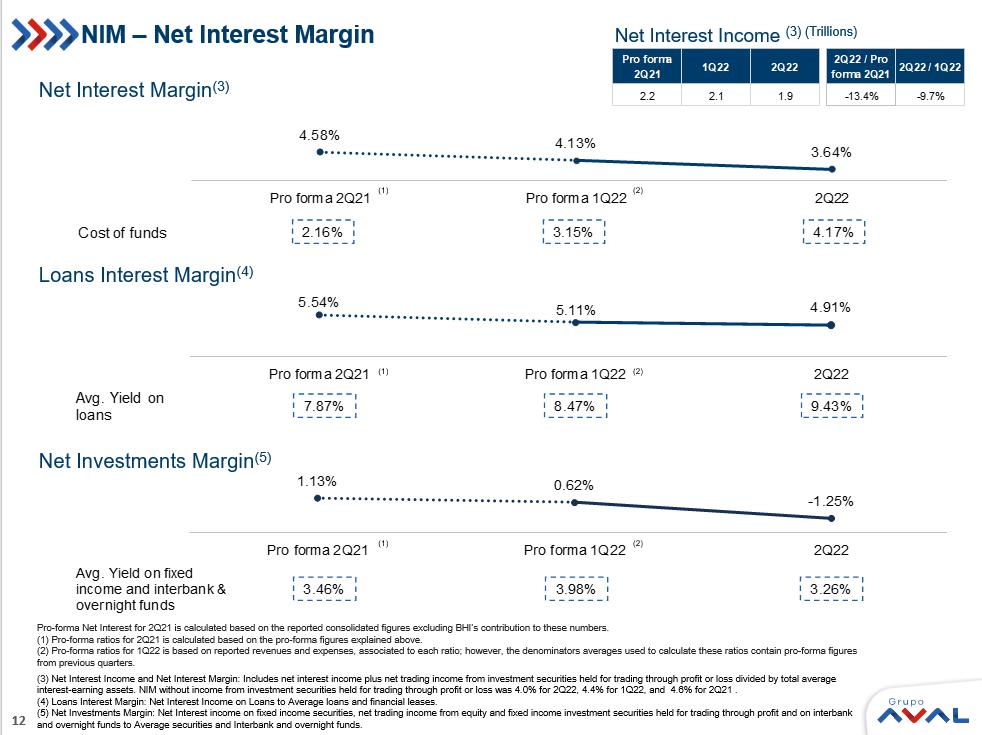
12 NIM – Net Interest Margin Net Interest Margin (3) Loans Interest Margin (4) Net Investments Margin (5) Net Interest Income (3) (Trillions) Pro - forma Net Interest for 2Q21 is calculated based on the reported consolidated figures excluding BHI’s contribution to these numbers. (1) Pro - forma ratios for 2Q21 is calculated based on the pro - forma figures explained above. (2) Pro - forma ratios for 1Q22 is based on reported revenues and expenses, associated to each ratio; however, the denominators av erages used to calculate these ratios contain pro - forma figures from previous quarters. (3) Net Interest Income and Net Interest Margin: Includes net interest income plus net trading income from investment securities hel d for trading through profit or loss divided by total average interest - earning assets. NIM without income from investment securities held for trading through profit or loss was 4.0% for 2Q22 , 4.4% for 1Q22, and 4.6% for 2Q21 . (4) Loans Interest Margin: Net Interest Income on Loans to Average loans and financial leases. (5) Net Investments Margin: Net Interest income on fixed income securities, net trading income from equity and fixed income i nve stment securities held for trading through profit and on interbank and overnight funds to Average securities and Interbank and overnight funds. 5.54% 5.11% 4.91% Pro forma 2Q21 Pro forma 1Q22 2Q22 Avg. Yield on loans 7.87% 8.47% 9.43% 1.13% 0.62% - 1.25% Pro forma 2Q21 Pro forma 1Q22 2Q22 Avg. Yield on fixed income and interbank & overnight funds 3.26% 3.98% 3.46% 4.58% 4.13% 3.64% Pro forma 2Q21 Pro forma 1Q22 2Q22 Cost of funds 2.16% 3.15% 4.17% (1) (1) (1) (2) (2) (2) Pro forma 2Q21 1Q22 2Q22 2Q22 / Pro forma 2Q21 2Q22 / 1Q22 2.2 2.1 1.9 -13.4% -9.7%

13 Fees, other operating income and discontinued operations Gross fee income Other operating income Non - financial sector (*) (*) Net income from sales of goods and services (**) Reflects net NFS from Nexa BPO, Megalinea and Aportes en L ínea call - centers and other subsidiaries (**) (1) Pro - forma Fees, other operating income and their breakdowns for 2Q21 are calculated based on the reported consolidated figures excluding BHI’s contribution to these numbers. (2) Includes income from trading and hedging derivatives reflected as part of the net trading income on the Statement of Profit or L oss. (3) Includes share of profit of equity accounted investees, net of tax, and dividend income. (4) Includes Ps 1.053 bn related to gains from loss of control in subsidiaries, included in 1Q22 under other income from operations, inclu ded in this report under net income of discontinued operations. Figures in Ps. Billions 895.9 995.1 912.8 Pro forma 2Q21 1Q22 2Q22 Banking fees Trust activities Pension fees Other 54.9% 56.7% 64.0% 31.7% 30.5% 21.8% 9.1% 8.4% 9.3% 4.3% 4.3% 4.9% Y/Y% Q/Q% 18.8 4.3 - 29.9 14.8 3.5 1.5 - 34.5 3.6 Y/Y% = 1.9% Q/Q% = - 8.3% Net fee income 697.3 710.0 731.1 Includes BHI income as a non - consolidated investment (1) (3) 2Q21 1Q22 2Q22 Energy & gas 300 380 303 Infrastructure 729 697 1,190 Hotels -6 15 16 Agribusiness 11 16 20 Other -93 -87 -88 Total 941 1,021 1,441 Pro forma 2Q21 1Q22 2Q22 Foreign exchange gains (losses), net -83 369 -702 Net income (loss) on financial derivatives 139 -302 593 Other trading income on derivatives 24 33 0 Derivatives and foreign exchange gains (losses), net (2) 80 100 -109 Gains on valuation of assets 0 0 12 Net income from other financial instruments mandatory at FVTPL 63 74 68 Net gain on sale of investments and OCI realization 8 -3 -8 Gain on the sale of non-current assets held for sale 4 4 2 Income from non-consolidated investments 86 203 247 Other income from operations 64 219 59 Total other income from operations 305 598 271 Net income of discontinued operations 421 1,598 0 (4) (1)

14 2.7% 2.6% 2.6% Pro forma 2Q21 Pro forma 1Q22 2Q22 Efficiency ratios Cost to income (1) Cost to assets (2) Pro - forma total other expenses, net interest income, net income from commissions and fees, net income from sales of goods and services, net trading income, net income from other financial instruments mandatory at FVTPL and total other income for 2Q21 are calculated based on the reported consolidated figures excluding BHI’s contribution to these numbers. • Pro - forma ratios for 2Q21 are calculated based on the pro - forma figures explained above. • Pro - forma ratios for 1Q22 are based on reported revenues and expenses, associated to each ratio; however, the denominators avera ges used to calculate these ratios contain pro - forma figures from previous quarters. (1) Cost to income efficiency ratio is calculated as total other expenses divided by net interest income plus net income from co mmissions and fees, net income from sales of goods and services, net trading income, net income from other financial instruments mandatory at FVTPL and total oth er income. (2) Cost to assets efficiency ratio is calculated as annualized total other expenses divided by average total assets. (3) Excludes from the denominator Ps 1.053 bn related to gains from loss of control in subsidiaries, included in 1Q22 under other income from operations, inclu ded in this report under net income of discontinued operations . (3) 39.8% 38.2% 41.1% Pro forma 2Q21 1Q22 2Q22

15 949.5 1,729.7 675.5 2Q21 1Q22 2Q22 $29.7 $77.6 $42.6 Profitability as reported Figures in Ps. Billions Net income attributable to controlling interest ROAA reported (2) ROAE reported (3) (1) The outstanding shares at the end of March 31, 2022 were 22,281,017,159 shares and the outstanding shares at the end of June 30, 2022 were 23,743,475,754 shares, the average outstanding shares for 2Q22 were 22,779,217,340 shares. (2) ROAA for each quarter is calculated as annualized Net Income divided by average of total assets. (3) ROAE for each quarter is calculated as annualized Net Income attributable to Aval's shareholders divided by average attributa ble shareholders' equity EPS 2.0% 3.8% 2.1% 2Q21 1Q22 2Q22 18.2% 35.3% 16.6% 2Q21 1Q22 2Q22 (1)

16
SIGNATURE
Pursuant to the requirements of the Securities Exchange Act of 1934, the registrant has duly caused this report to be signed on its behalf by the undersigned, thereunto duly authorized.
Date: August 11, 2022
| GRUPO AVAL ACCIONES Y VALORES S.A. | ||||
| By: | /s/ Jorge Adrián Rincón Plata | |||
| Name: | Jorge Adrián Rincón Plata | |||
| Title: | Chief Legal Counsel | |||