UNITED STATES
SECURITIES AND EXCHANGE COMMISSION
Washington, D.C. 20549
FORM 6-K
Report Of Foreign Private Issuer
Pursuant To Rule 13a-16 Or 15d-16 Of
The Securities Exchange Act Of 1934
For the month of August 2023
Commission File Number: 001-36631
Grupo Aval Acciones y Valores S.A.
(Exact name of registrant as specified in its charter)
Carrera 13 No. 26A - 47
Bogotá D.C., Colombia
(Address of principal executive office)
Indicate by check mark whether the registrant files or will file annual reports under cover of Form 20-F or Form 40-F:
| Form 20-F | X | Form 40-F |
GRUPO AVAL ACCIONES Y VALORES S.A.
TABLE OF CONTENTS
| ITEM | |
| 1. | Report of Second Quarter 2023 Consolidated Results |
Item 1

Grupo Aval Acciones y Valores S.A. (“Grupo Aval”) is an issuer of securities in Colombia and in the United States (“SEC”). As such, it is subject to compliance with securities regulation in Colombia and applicable U.S. securities regulation. Grupo Aval is also subject to the inspection and supervision of the Superintendency of Finance as holding company of the Aval financial conglomerate.
The consolidated financial information included in this document is presented in accordance with IFRS as currently issued by the IASB. Details of the calculations of non-IFRS measures such as ROAA and ROAE, among others, are explained when required in this report.
Banco de Bogotá executed a spin-off of a 75% equity stake in BAC Holding International Corp (“BHI”); to its shareholders and Grupo Aval subsequently spun-off its equity interest to its shareholders on March 29, 2022. On December 19, 2022, Banco de Bogotá sold 20.89% of the outstanding investment of BHI through a tender offer. As of December 31, 2022, Banco de Bogotá held 4.11% of BHI. This investment is reflected as an investment at fair value through other comprehensive income. Following the sale, the equity method recognized under the “share of profit of equity accounted investees, net of tax (equity method)” between April and November was reclassified to discontinued operations. For comparability purposes of this presentation, we have reclassified BHI’s equity method for the second and third quarter of 2022 to net income from discontinued operations. Banco de Bogotá’s remaining 4.11% interest in BHI was disposed of in March 2023.
This report includes forward-looking statements. In some cases, you can identify these forward-looking statements by words such as “may,” “will,” “should,” “expects,” “plans,” “anticipates,” “believes,” “estimates,” “predicts,” “potential,” or “continue,” or the negative of these and other comparable words. Actual results and events may differ materially from those anticipated herein as a consequence of changes in general, economic and business conditions, changes in interest and currency rates and other risk described from time to time in our filings with the Registro Nacional de Valores y Emisores and the SEC.
Recipients of this document are responsible for the assessment and use of the information provided herein. Matters described in this presentation and our knowledge of them may change extensively and materially over time, but we expressly disclaim any obligation to review, update or correct the information provided in this report, including any forward looking statements, and do not intend to provide any update for such material developments prior to our next earnings report.
The content of this document and the figures included herein are intended to provide a summary of the subjects discussed rather than a comprehensive description.
When applicable, in this document we refer to billions as thousands of millions.
| 1 |  |

ABOUT GRUPO AVAL
Grupo Aval, leading financial conglomerate in Colombia, operates through: four commercial banks in Colombia (Banco de Bogotá, Banco de Occidente, Banco Popular and Banco AV Villas), the largest private pensions and severance fund manager in Colombia (Porvenir), and the largest financial corporation in Colombia (Corficolombiana). In addition, it is present in Central America through Multibank's operation in Panama through Banco de Bogotá.
Grupo Aval Acciones y Valores S.A. ("Grupo Aval") is an issuer of securities in Colombia and the
United States ("SEC").
As of June 30, 2023, the Company has the following issuances:
| Stocks | Securities issues in force | |
| Type of security | Common stock | Preferred stock |
| Trading system | Stock exchange | Stock exchange |
| Stock exchange | Colombian Stock Exchange (BVC) | |
| Outstanding Shares (*) | 16,201,932,169 | 7,541,543,585 |
| Issue amount(*) | 16,201,932,169 | 7,541,543,585 |
| Amount placed(*) | 16,201,932,169 | 7,541,543,585 |
| Local Bonds | |||
| Year | Principal (million) | Rate | Rating |
| Issue of 2009 - Series A - 15 years | 124,520 | IPC+5.2% | AAA –BRC Investor Services S.A.
|
| Issue of 2016 - Series A - 10 years | 93,000 | IPC+3.86% | |
| Issue of 2016 - Series A - 20 years | 207,000 | IPC+4.15% | |
| Issue of 2017 - Series A - 25 years | 300,000 | IPC +3.99% | |
| Issue of 2019 - Series C - 5 years | 100,000 | 6.42% | |
| Issue of 2019 - Series A - 20 years | 300,000 | IPC +3.69% | |
| 1,124,520 |
| ||
| International Bonds | |||
Issue of 2020 - 10 years
| US 1,000,000
| 4.375%
| Ba2 / Negative (Moody’s)
BB+ Stable (Fitch) |
Main domicile: Bogotá D.C., Colombia
Address: Carrera 13 No 26A – 47- 23rd Floor
| 2 | |

| Key results of 2Q23 | 4 |
| Consolidated Financial Results | 6 |
| – | Statement of Financial Position Analysis | 6 |
| – | Income Statement Analysis… | 14 |
| Risk Management | 18 |
| Quantitative and Qualitative disclosure about market risk | 18 |
| Corporate Governance | 18 |
| ESG | 18 |
| Separated Financial Results… | 19 |
| – | Statement of Financial Position Analysis | 19 |
| – | Income Statement Analysis | 20 |
| Grupo Aval + Grupo Aval Limited… | 21 |
| Definitions | 25 |
EXHIBIT 1 : CONSOLIDATED FINANCIAL RESULTS
EXHIBIT 2 : SEPARATE FINANCIAL RESULTS
| 3 | |

Bogotá, August 14th, 2023. Grupo Aval S.A. (NYSE:AVAL) reported a consolidated attributable net income of Ps 166.2 billion (Ps 7.0 pesos per share) for 2Q23. ROAE was 4.1% and ROAA was 0.6% for 2Q23.
| COP $tn | 2Q22 | 1Q23 | 2Q23 | 2Q23 vs 1Q23 | 2Q23 vs 2Q22 | |||||||
| Balance Sheet | Gross Loans | $ 166.6 | $ 184.6 | $ 184.4 | -0.1% | 10.7% | ||||||
| Deposits | $ 160.0 | $ 178.4 | $ 180.2 | 1.1% | 12.6% | |||||||
| Deposits/Net Loans | 1.00 x | 1.00 x | 1.01 x | 0.02 x | 0.01 x | |||||||
| Loan Quality | 90 days PDLs / Gross Loans | 3.3% | 3.4% | 3.6% | 12 bps | 24 bps | ||||||
| Allowance/90 days PDLs | 1.61 x | 1.48 x | 1.43 x | -0.05 x | -0.18 x | |||||||
| Cost of risk | 1.4% | 1.7% | 2.2% | 45 bps | 77 bps | |||||||
| Profitability | Net interest margin | 3.6% | 3.7% | 3.4% | (30) bps | (23) bps | ||||||
| Fee income Ratio | 16.9% | 19.0% | 22.7% | 377 bps | 580 bps | |||||||
| Efficiency Ratio | 42.6% | 46.7% | 53.7% | 698 bps | 1,112 bps | |||||||
| Attributable net income | $ 0.68 | $ 0.43 | $ 0.17 | -60.9% | -75.4% | |||||||
| ROAA | 2.1% | 1.4% | 0.6% | (79) bps | (145) bps | |||||||
| ROAE | 16.6% | 10.4% | 4.1% | (634) bps | (1,248) bps |
Gross loans excludes interbank and overnight funds. PDLs 90+ defined as loans more than 90 days past due. Cost of Risk calculated as Impairment loss on loans and other accounts receivable net of recoveries of charged-off assets divided by average gross loans. Net Interest Margin includes net interest income plus net trading income from debt and equity investments at FVTPL divided by total average interest-earning assets. Fee income ratio is calculated as net income from commissions and fees divided by net interest income plus net income from commissions and fees, gross profit from sales of goods and services, net trading income, net income from other financial instruments mandatory at FVTPL and total other income. Efficiency Ratio is calculated as total other expenses divided by net interest income plus net income from commissions and fees, gross profit from sales of goods and services, net trading income, net income from other financial instruments mandatory at FVTPL and total other income. ROAA is calculated as annualized Net Income divided by average of total assets. ROAE is calculated as Net Income attributable to Aval's shareholders divided by average attributable shareholders' equity. NS refers to non-significant figures.
| 4 | |

Grupo Aval Acciones y Valores S.A.
Consolidated Financial Statements Under IFRS
Financial Statements Under IFRS
Information in Ps. Billions
| Consolidated Statement of Financial Position | 2Q22 | 1Q23 | 2Q23 | D | |||||
| 2Q23 vs. 1Q23 | 2Q23 vs. 2Q22 | ||||||||
| Cash and cash equivalents | 21,441.1 | 19,327.8 | 19,195.7 | -0.7% | -10.5% | ||||
| Trading assets | 10,888.4 | 13,585.5 | 13,256.1 | -2.4% | 21.7% | ||||
| Investment securities | 31,690.5 | 31,969.1 | 32,829.6 | 2.7% | 3.6% | ||||
| Hedging derivatives assets | 49.1 | 35.1 | 69.4 | 97.8% | 41.5% | ||||
| Total loans, net | 159,651.9 | 179,102.9 | 177,912.5 | -0.7% | 11.4% | ||||
| Tangible assets | 7,043.9 | 7,247.8 | 7,113.6 | -1.9% | 1.0% | ||||
| Goodwill | 2,234.9 | 2,232.2 | 2,215.2 | -0.8% | -0.9% | ||||
| Concession arrangement rights | 12,032.2 | 13,536.2 | 13,558.6 | 0.2% | 12.7% | ||||
| Other assets | 31,079.0 | 31,841.5 | 31,910.8 | 0.2% | 2.7% | ||||
| Total assets | 276,111.0 | 298,878.2 | 298,061.6 | -0.3% | 7.9% | ||||
| Trading liabilities | 1,893.8 | 1,517.6 | 1,859.9 | 22.6% | -1.8% | ||||
| Hedging derivatives liabilities | 5.8 | 5.6 | 8.9 | 59.6% | 52.2% | ||||
| Customer deposits | 160,029.3 | 178,352.4 | 180,244.5 | 1.1% | 12.6% | ||||
| Interbank borrowings and overnight funds | 10,499.9 | 8,799.8 | 13,459.9 | 53.0% | 28.2% | ||||
| Borrowings from banks and others | 22,945.6 | 29,346.9 | 23,916.9 | -18.5% | 4.2% | ||||
| Bonds issued | 31,973.1 | 27,352.4 | 25,424.8 | -7.0% | -20.5% | ||||
| Borrowings from development entities | 3,235.0 | 4,539.5 | 4,122.4 | -9.2% | 27.4% | ||||
| Other liabilities | 15,378.9 | 18,737.1 | 18,262.4 | -2.5% | 18.7% | ||||
| Total liabilities | 245,961.5 | 268,651.1 | 267,299.6 | -0.5% | 8.7% | ||||
| Equity attributable to owners of the parent | 16,420.0 | 16,175.7 | 16,465.4 | 1.8% | 0.3% | ||||
| Non-controlling interest | 13,729.6 | 14,051.3 | 14,296.6 | 1.7% | 4.1% | ||||
| Total equity | 30,149.6 | 30,227.0 | 30,762.0 | 1.8% | 2.0% | ||||
| Total liabilities and equity | 276,111.0 | 298,878.2 | 298,061.6 | -0.3% | 7.9% | ||||
| Consolidated Statement of Income | 2Q22 | 1Q23 | 2Q23 | D | |||||
| 2Q23 vs. 1Q23 | 2Q23 vs. 2Q22 | ||||||||
| Interest income | 4,286.7 | 7,008.3 | 7,154.6 | 2.1% | 66.9% | ||||
| Interest expense | 2,312.3 | 5,459.5 | 5,579.1 | 2.2% | 141.3% | ||||
| Net interest income | 1,974.4 | 1,548.8 | 1,575.5 | 1.7% | -20.2% | ||||
| Loans and other accounts receivable | 719.6 | 920.5 | 1,138.6 | 23.7% | 58.2% | ||||
| Other financial assets | (1.0) | (0.3) | (9.6) | N.A. | N.A. | ||||
| Recovery of charged-off financial assets | (151.8) | (133.7) | (140.8) | 5.3% | -7.3% | ||||
| Net impairment loss on financial assets | 566.8 | 786.5 | 988.3 | 25.7% | 74.4% | ||||
| Net interest income, after impairment losses | 1,407.6 | 762.3 | 587.2 | -23.0% | -58.3% | ||||
| Net income from commissions and fees | 697.3 | 842.3 | 883.9 | 4.9% | 26.8% | ||||
| Gross profit from sales of goods and services | 1,440.8 | 1,163.6 | 619.2 | -46.8% | -57.0% | ||||
| Net trading income | 481.5 | (81.3) | (783.1) | N.A. | N.A | ||||
| Net income from other financial instruments mandatory at FVTPL | 68.4 | 93.9 | 76.6 | -18.5% | 11.9% | ||||
| Total other income | (544.7) | 875.9 | 1,516.6 | 73.2% | N.A | ||||
| Total other expenses | 1,754.6 | 2,077.0 | 2,089.2 | 0.6% | 19.1% | ||||
| Net income before income tax expense | 1,796.4 | 1,579.8 | 811.2 | -48.7% | -54.8% | ||||
| Income tax expense | 564.3 | 532.6 | 350.6 | -34.2% | -37.9% | ||||
| Net income for the period of continued operations | 1,232.1 | 1,047.3 | 460.6 | -56.0% | -62.6% | ||||
| Net income for the period of discontinued operations | 154.0 | - | - | N.A | -100.0% | ||||
| Net income for the period | 1,386.1 | 1,047.3 | 460.6 | -56.0% | -66.8% | ||||
| Non-controlling interest | 710.6 | 622.2 | 294.4 | -52.7% | -58.6% | ||||
| Net income attributable to owners of the parent | 675.5 | 425.1 | 166.2 | -60.9% | -75.4% | ||||
| Key ratios | 2Q22 | 1Q23 | 2Q23 | YTD 2022 | YTD 2023 | ||||
| Net Interest Margin(1) | 4.0% | 2.8% | 2.9% | 4.2% | 2.8% | ||||
| Net Interest Margin (including net trading income)(1) | 3.6% | 3.7% | 3.4% | 3.9% | 3.6% | ||||
| Efficiency ratio(2) | 42.6% | 46.7% | 53.7% | 40.4% | 50.0% | ||||
| 90 days PDL / Gross loans (5) | 3.3% | 3.4% | 3.6% | 3.3% | 3.6% | ||||
| Provision expense / Average gross loans (6) | 1.4% | 1.7% | 2.2% | 1.6% | 1.9% | ||||
| Allowance / 90 days PDL (5) | 1.61 | 1.48 | 1.43 | 1.61 | 1.43 | ||||
| Allowance / Gross loans | 5.4% | 5.1% | 5.1% | 5.4% | 5.1% | ||||
| Charge-offs / Average gross loans (6) | 1.9% | 1.8% | 2.7% | 1.9% | 2.3% | ||||
| Total loans, net / Total assets | 57.8% | 59.9% | 59.7% | 57.8% | 59.7% | ||||
| Deposits / Total loans, net | 100.2% | 99.6% | 101.3% | 100.2% | 101.3% | ||||
| Equity / Assets | 10.9% | 10.1% | 10.3% | 10.9% | 10.3% | ||||
| Tangible equity ratio (7) | 9.6% | 8.8% | 9.0% | 9.6% | 9.0% | ||||
| ROAA(3) | 2.1% | 1.4% | 0.6% | 2.9% | 1.0% | ||||
| ROAE(4) | 16.6% | 10.4% | 4.1% | 25.9% | 7.2% | ||||
| Shares outstanding (EoP) | 23,743,475,754 | 23,743,475,754 | 23,743,475,754 | 23,743,475,754 | 23,743,475,754 | ||||
| Shares outstanding (Average) | 22,779,217,340 | 23,743,475,754 | 23,743,475,754 | 22,531,493,493 | 23,743,475,754 | ||||
| Common share price (EoP) | 757.0 | 555.0 | 476.9 | 757.0 | 476.9 | ||||
| Preferred share price (EoP) | 750.0 | 558.9 | 486.0 | 750.0 | 486.0 | ||||
| BV/ EoP shares in Ps. | 691.6 | 681.3 | 693.5 | 691.6 | 693.5 | ||||
| EPS | 29.7 | 17.9 | 7.0 | 106.7 | 24.9 | ||||
| P/E (8) | 6.3 | 7.8 | 17.4 | 3.5 | 9.8 | ||||
| P/BV (8) | 1.1 | 0.8 | 0.7 | 1.2 | 0.7 | ||||

| • | Pro-forma ratios for YTD 2022 are based on reported revenues and expenses, associated to each ratio; however, the denominators averages used to calculate these ratios contain pro-forma figures from previous quarters. |
NIM is calculated as Net Interest Income divided by the average of Interest Earning Assets; (2) Efficiency Ratio is calculated as total other expenses divided by net interest income plus net income from commissions and fees, gross profit from sales of goods and services, net trading income, net income from other financial instruments mandatory at FVTPL and total other income; (3) ROAA is calculated as Income before Minority Interest divided by the average of total assets for each quarter; (4) ROAE is calculated as Net Income attributable to Grupo Aval’s shareholders divided by the average of shareholders´ attributable equity for each quarter; (5) PDLs 90+ defined as loans more than 90 days past due include interest accounts receivables. Gross loans excluding interbank and overnight funds; (6) Refers to average gross loans for the period; (7) Tangible Equity Ratio is calculated as Total Equity minus Intangibles (excluding those related to concessions) divided by Total Assets minus Intangibles (excluding those related to concessions); (8) Based on Preferred share prices.
| 5 | |
Consolidated Financial Results
Statement of Financial Position Analysis
| 1. | Assets |
Total assets as of June 30th, 2023 totaled Ps 298,061.6 billion showing an increase of 7.9% versus June 30th, 2022 and a decrease of 0.3% versus March 31st, 2023. Growth was mainly driven by (i) a 11.4% year over year growth in total loans, net to Ps 177,912.5 billion, (ii) a 21.7% yearly growth in trading assets, net to Ps 13,256.1 billion and (iii) a 12.7% yearly growth in concession arrangement rights, net to Ps 13,558.6 billion.
| 1.1 | Loan portfolio |
Gross loans (excluding interbank and overnight funds) increased by 10.7% between June 30th, 2023 and June 30th, 2022 to Ps 184,409.6 billion mainly driven by (i) a 11.8% increase in Mortgages loans to Ps 17,756.5 billion, (ii) a 10.8% increase in Commercial loans to Ps 106,350.8 billion and (iii) a 10.2% increase in Consumer loans to Ps 60,033.8 billion.
Interbank & overnight funds increased by 46.6% to Ps 2,938.1 billion during the last twelve months.
Loss allowance was Ps 9,435.2 billion as of June 30th, 2023 taking net loans to Ps 177,912.5 billion.
| Total loans, net | 2Q22 | 1Q23 | 2Q23 | D | |||||
| 2Q23 vs. 1Q23 | 2Q23 vs. 2Q22 | ||||||||
| Gross loans | |||||||||
| Commercial loans | 95,946.0 | 106,129.9 | 106,350.8 | 0.2% | 10.8% | ||||
| Consumer loans | 54,481.2 | 60,186.9 | 60,033.8 | -0.3% | 10.2% | ||||
| Mortgages loans | 15,883.6 | 18,026.1 | 17,756.5 | -1.5% | 11.8% | ||||
| Microcredit loans | 278.6 | 267.6 | 268.5 | 0.3% | -3.6% | ||||
| Gross loans | 166,589.5 | 184,610.5 | 184,409.6 | -0.1% | 10.7% | ||||
| Interbank & overnight funds | 2,004.1 | 3,920.0 | 2,938.1 | -25.0% | 46.6% | ||||
| Total gross loans | 168,593.6 | 188,530.4 | 187,347.7 | -0.6% | 11.1% | ||||
| Loss allowance | (8,941.7) | (9,427.5) | (9,435.2) | 0.1% | 5.5% | ||||
| Allowance for impairment of commercial loans | (5,392.9) | (5,380.1) | (5,189.7) | -3.5% | -3.8% | ||||
| Allowance for impairment of consumer loans | (3,094.4) | (3,630.9) | (3,828.3) | 5.4% | 23.7% | ||||
| Allowance for impairment of mortgages | (382.7) | (376.2) | (372.7) | -0.9% | -2.6% | ||||
| Allowance for impairment of microcredit loans | (71.6) | (40.3) | (44.5) | 10.5% | -37.9% | ||||
| Total loans, net | 159,651.9 | 179,102.9 | 177,912.5 | -0.7% | 11.4% | ||||
| 6 | |
The following table shows the gross loan composition per product of each of our loan categories.
| Gross loans | 2Q22 | 1Q23 | 2Q23 | D | |||||
| 2Q23 vs. 1Q23 | 2Q23 vs. 2Q22 | ||||||||
| General purpose | 68,335.8 | 74,955.1 | 74,522.8 | -0.6% | 9.1% | ||||
| Working capital | 13,420.5 | 14,930.6 | 15,703.4 | 5.2% | 17.0% | ||||
| Financial leases | 10,207.8 | 10,892.9 | 11,134.7 | 2.2% | 9.1% | ||||
| Funded by development banks | 3,191.3 | 4,397.1 | 4,047.3 | -8.0% | 26.8% | ||||
| Overdrafts | 467.7 | 521.8 | 587.7 | 12.6% | 25.7% | ||||
| Credit cards | 323.0 | 432.4 | 354.9 | -17.9% | 9.9% | ||||
| Commercial loans | 95,946.0 | 106,129.9 | 106,350.8 | 0.2% | 10.8% | ||||
| Payroll loans | 32,026.6 | 33,360.4 | 32,836.8 | -1.6% | 2.5% | ||||
| Personal loans | 11,182.4 | 13,981.4 | 14,289.6 | 2.2% | 27.8% | ||||
| Credit cards | 6,277.0 | 7,192.8 | 7,406.3 | 3.0% | 18.0% | ||||
| Automobile and vehicle | 4,791.2 | 5,439.0 | 5,296.6 | -2.6% | 10.5% | ||||
| Financial leases | 22.0 | 17.2 | 16.3 | -5.3% | -25.6% | ||||
| Overdrafts | 53.0 | 73.4 | 74.4 | 1.4% | 40.3% | ||||
| Other | 129.0 | 122.6 | 113.8 | -7.2% | -11.8% | ||||
| Consumer loans | 54,481.2 | 60,186.9 | 60,033.8 | -0.3% | 10.2% | ||||
| Mortgages | 13,665.6 | 15,596.4 | 15,542.0 | -0.3% | 13.7% | ||||
| Housing leases | 2,218.0 | 2,429.7 | 2,214.5 | -8.9% | -0.2% | ||||
| Mortgages loans | 15,883.6 | 18,026.1 | 17,756.5 | -1.5% | 11.8% | ||||
| Microcredit loans | 278.6 | 267.6 | 268.5 | 0.3% | -3.6% | ||||
| Gross loans | 166,589.5 | 184,610.4 | 184,409.6 | -0.1% | 10.7% | ||||
| Interbank & overnight funds | 2,004.1 | 3,920.0 | 2,938.1 | -25.0% | 46.6% | ||||
| Total gross loans | 168,593.6 | 188,530.4 | 187,347.7 | -0.6% | 11.1% | ||||
In terms of gross loans (excluding interbank and overnight funds), 91.5% are domestic and 8.5% are foreign (reflecting the Multi Financial Holding operation).
Over the last twelve months we observed a strong performance in all types of loans. Quarterly performance was negatively impacted by a 10.1% appreciation of the Colombian Peso.
Commercial loans increased by 10.8% during the last twelve months and 0.2% during the quarter. Consumer loans growth over the last year was driven by personal loans and credit cards. Consumer loans grew by 10.2% annually and decreased 0.3% over the quarter. Mortgages loans increased by 11.8% over the year and decreased 1.5% in the last quarter.
The following table shows the gross loans composition per entity. During the last twelve months, Banco de Occidente showed the highest growth rate within our banks, driven by a strong performance in all types of loans with consumer loans growing 19.5%, commercial loans 16.0% and mortgages growing 6.5%.
| 7 | |
| Gross loans / Bank ($) | 2Q22 | 1Q23 | 2Q23 | D | |||||
| 2Q23 vs. 1Q23 | 2Q23 vs. 2Q22 | ||||||||
| Banco de Bogotá | 87,511.5 | 97,023.9 | 97,725.8 | 0.7% | 11.7% | ||||
| Banco de Occidente | 40,557.7 | 46,260.2 | 47,168.0 | 2.0% | 16.3% | ||||
| Banco Popular | 24,131.4 | 24,901.0 | 23,913.9 | -4.0% | -0.9% | ||||
| Banco AV Villas | 14,277.2 | 15,026.9 | 14,744.8 | -1.9% | 3.3% | ||||
| Corficolombiana | 1,962.1 | 2,177.3 | 2,060.4 | -5.4% | 5.0% | ||||
| Grupo Aval Holding | - | 1,260.4 | 1,133.5 | -10.1% | N.A. | ||||
| Eliminations | (1,850.5) | (2,039.2) | (2,336.9) | 14.6% | 26.3% | ||||
| Gross loans | 166,589.5 | 184,610.5 | 184,409.6 | -0.1% | 10.7% | ||||
| Interbank & overnight funds | 2,004.1 | 3,920.0 | 2,938.1 | -25.0% | 46.6% | ||||
| Total gross loans | 168,593.6 | 188,530.4 | 187,347.7 | -0.6% | 11.1% | ||||
| Gross loans / Bank (%) | 2Q22 | 1Q23 | 2Q23 | ||||||
| Banco de Bogotá | 52.5% | 52.6% | 53.0% | ||||||
| Banco de Occidente | 24.3% | 25.1% | 25.6% | ||||||
| Banco Popular | 14.5% | 13.5% | 13.0% | ||||||
| Banco AV Villas | 8.6% | 8.1% | 8.0% | ||||||
| Corficolombiana | 1.2% | 1.2% | 1.1% | ||||||
| Grupo Aval Holding | 0.0% | 0.7% | 0.6% | ||||||
| Eliminations | -1.1% | -1.1% | -1.3% | ||||||
| Gross loans | 100% | 100% | 100% | ||||||
Figures for Grupo Aval Holding reflect the credit operation entered into with Esadinco S.A. (Related Party) in December 2022. This transaction was conducted on substantially the same terms, including interest rates and collateral, as those prevailing at the time for comparable transactions with other persons, and did not involve more than the normal risk of collectability or present other unfavorable features.
High interest rates, inflationary pressures and the economic slowdown have led to a deterioration in the quality of our loan portfolio both over the quarter and the year.
Our 30 days PDL to total loans were 5.1% for 2Q23, 4.9% for 1Q23 and 4.4% for 2Q22. The ratio of 90 days PDL to total loans was 3.6% for 2Q23, 3.4% for 1Q23 and 3.3% for 2Q22.
30 days PDL ratio for commercial loans was 4.5% for 2Q23, 4.4% for 1Q23 and 4.1% for 2Q22; 90 days PDL ratio was 3.8%, 3.7% and 3.7%, respectively. 30 days PDL ratio for consumer loans was 5.8% for 2Q23, 5.4% for 1Q23, and 4.5% for 2Q22.
90 days PDL ratio was 3.1%, 3.0% and 2.7%, respectively. 30 days PDL ratio for mortgages was 6.2% for 2Q23, 5.5% for 1Q23, and 5.3% for 2Q22; 90 days PDL ratio was 3.4%, 3.1% and 3.2%, respectively.
| 8 | |
| Past due loans | 2Q22 | 1Q23 | 2Q23 | D | |||||
| 2Q23 vs. 1Q23 | 2Q23 vs. 2Q22 | ||||||||
| Performing | 91,979.8 | 101,440.5 | 101,590.3 | 0.1% | 10.4% | ||||
| Between 31 and 90 days past due | 459.6 | 710.3 | 700.1 | -1.4% | 52.3% | ||||
| +90 days past due | 3,506.6 | 3,979.1 | 4,060.3 | 2.0% | 15.8% | ||||
| Commercial loans | 95,946.0 | 106,129.9 | 106,350.8 | 0.2% | 10.8% | ||||
| Performing | 52,056.1 | 56,924.8 | 56,544.9 | -0.7% | 8.6% | ||||
| Between 31 and 90 days past due | 956.2 | 1,473.7 | 1,610.6 | 9.3% | 68.4% | ||||
| +90 days past due | 1,468.9 | 1,788.3 | 1,878.3 | 5.0% | 27.9% | ||||
| Consumer loans | 54,481.2 | 60,186.9 | 60,033.8 | -0.3% | 10.2% | ||||
| Performing | 15,044.3 | 17,042.5 | 16,663.4 | -2.2% | 10.8% | ||||
| Between 31 and 90 days past due | 325.8 | 420.4 | 488.2 | 16.1% | 49.9% | ||||
| +90 days past due | 513.5 | 563.2 | 605.0 | 7.4% | 17.8% | ||||
| Mortgages loans | 15,883.6 | 18,026.1 | 17,756.5 | -1.5% | 11.8% | ||||
| Performing | 211.6 | 229.5 | 226.7 | -1.2% | 7.1% | ||||
| Between 31 and 90 days past due | 9.3 | 8.4 | 10.1 | 21.3% | 8.8% | ||||
| +90 days past due | 57.7 | 29.8 | 31.7 | 6.5% | -45.1% | ||||
| Microcredit loans | 278.6 | 267.6 | 268.5 | 0.3% | -3.6% | ||||
| Gross loans | 166,589.5 | 184,610.5 | 184,409.6 | -0.1% | 10.7% | ||||
| Interbank & overnight funds | 2,004.1 | 3,920.0 | 2,938.1 | -25.0% | 46.6% | ||||
| Total gross loans | 168,593.6 | 188,530.4 | 187,347.7 | -0.6% | 11.1% | ||||
| 30 Days PDL / gross loans (*) | 4.4% | 4.9% | 5.1% | ||||||
| 90 Days PDL / gross loans (*) | 3.3% | 3.4% | 3.6% | ||||||
| Loans by stages (%) | 2Q22 | 1Q23 | 2Q23 | ||||||
| Loans classified as Stage 2 / gross loans | 9.1% | 6.3% | 4.8% | ||||||
| Loans classified as Stage 3 / gross loans | 6.6% | 6.4% | 6.4% | ||||||
| Loans classified as Stage 2 and 3 / gross loans | 15.7% | 12.7% | 11.3% | ||||||
| Allowance for Stage 1 loans / Stage 1 loans | 0.9% | 0.9% | 1.0% | ||||||
| Allowance for Stage 2 loans / Stage 2 loans | 10.7% | 12.1% | 14.0% | ||||||
| Allowance for Stage 3 loans / Stage 3 loans | 54.4% | 55.5% | 54.7% | ||||||
| Allowance for Stage 2 y 3 loans / Stage 2 and 3 loans | 29.2% | 33.9% | 37.3% | ||||||
Grupo Aval’s coverage over its 90 days PDL was 1.4x for 2Q23, 1.5x for 1Q23, and 1.6x for 2Q22, coverage over its 30 days PDL was 1.0x in 2Q23, 1.1x for 1Q23 and 1.2x 2Q22.
Impairment loss, net of recoveries of charged off assets to average gross loans was 2.2% for 2Q23, 1.7% for 1Q23, and 1.4% 2Q22. Charge-offs to average gross loans was 2.7% for 2Q23, 1.8% for 1Q23, and 1.9% in 2Q22.
| Coverage and cost of risk | 2Q22 | 1Q23 | 2Q23 | |||
| Allowance for impairment / 30 days PDL | 1.2 | 1.1 | 1.0 | |||
| Allowance for impairment / 90 days PDL | 1.6 | 1.5 | 1.4 | |||
| Allowance for impairment / gross loans (*) | 5.4% | 5.1% | 5.1% | |||
| Impairment loss / 30 days PDL | 0.4 | 0.4 | 0.5 | |||
| Impairment loss / 90 days PDL | 0.5 | 0.6 | 0.7 | |||
| Impairment loss / average gross loans (*) | 1.8% | 2.0% | 2.5% | |||
| Impairment loss, net of recoveries of charged-off assets / average gross loans (*) | 1.4% | 1.7% | 2.2% | |||
| Charge-offs / average gross loans (*) | 1.9% | 1.8% | 2.7% |
(*) Gross loans exclude interbank and overnight funds. 30 days past due and 90 days past due are calculated on a capital plus interest accounts receivable basis.
| 9 | |
| 1.2 | Investment securities and trading assets |
Total investment securities and trading assets increased 8.2% to Ps 46,085.7 billion between June 30th, 2023 and June 30th, 2022 and increased 1.2% versus March 31st, 2023.
Ps 37,118.7 billion of our total portfolio is invested in debt securities, which increased by 7.4% between June 30th, 2023 and June 30th, 2022 and increased by 2.5% versus March 31st, 2023. Ps 7,053.0 billion of our total investment securities is invested in equity securities, which increased by 15.0% between June 30th, 2023 and June 30th, 2022 and decreased by 5.1% versus March 31st, 2023.
| Investment and trading assets | 2Q22 | 1Q23 | 2Q23 | D | |||||
| 2Q23 vs. 1Q23 | 2Q23 vs. 2Q22 | ||||||||
| Debt securities | 3,980.0 | 5,145.6 | 5,323.3 | 3.5% | 33.8% | ||||
| Equity securities | 5,022.2 | 6,525.1 | 6,018.7 | -7.8% | 19.8% | ||||
| Derivative assets | 1,886.3 | 1,914.8 | 1,914.1 | 0.0% | 1.5% | ||||
| Trading assets | 10,888.4 | 13,585.5 | 13,256.1 | -2.4% | 21.7% | ||||
| Investments in debt securities at FVTPL (non compliant with SPPI test) | - | 1.4 | 1.4 | 0.0% | 0.0% | ||||
| Debt securities at FVOCI | 21,995.6 | 21,275.0 | 22,055.6 | 3.7% | 0.3% | ||||
| Equity securities at FVOCI | 1,113.0 | 903.1 | 1,034.2 | 14.5% | -7.1% | ||||
| Investments in securities at FVOCI | 23,108.5 | 22,178.1 | 23,089.9 | 4.1% | -0.1% | ||||
| Investments in debt securities at AC | 8,582.0 | 9,789.6 | 9,738.4 | -0.5% | 13.5% | ||||
| Investment and trading assets | 42,579.0 | 45,554.5 | 46,085.7 | 1.2% | 8.2% | ||||
The average yield on our debt and equity investment securities (trading assets, investments in debt securities at FVTPL, investments in securities at FVOCI and investments in debt securities at AC) was 9.1% for 2Q23, 11.7% for 1Q23 and 3.0% for 2Q22.
| 1.3 | Cash and Cash Equivalents |
As of June 30th, 2023 cash and cash equivalents had a balance of Ps 19,195.7 billion showing a decrease of 10.5% versus June 30th, 2022 and a decrease of 0.7% versus March 31st, 2023
The ratio of cash and cash equivalents to customer deposits was 10.6% at June 30th, 2023, 10.8% at March 31st, 2023, and 13.4% at June 30th, 2022.
| 10 | |
| 1.4 | Goodwill and Other Intangibles |
Goodwill and other intangibles as of June 30th, 2023 reached Ps 17,950.1 billion, increasing by 11.9% versus June 30th, 2022 and 0.6% versus March 31st, 2023.
Goodwill as of June 30th, 2023 was Ps 2,215.2 billion, decreasing by 0.9% versus June 30th, 2022 and 0.8% versus March 31st, 2023.
Other intangibles, which include “concession arrangement rights” and other intangibles, mainly reflect the value of road concessions recorded for the most part at Corficolombiana. Other intangibles as of June 30th, 2023 reached Ps 15,734.9 billion and grew by 14.0% versus June 30th, 2022 and increased by 0.7% versus March 31st, 2023.
| 2. | Liabilities |
As of June 30th, 2023 Total Funding represented 92.5% of total liabilities and other liabilities represented 7.5%.
| 2.1 | Funding |
Total Funding (Total financial liabilities at amortized cost) which includes (i) Customer deposits, (ii) Interbank borrowings and overnight funds, (iii) Borrowings from banks and others, (iv) Bonds issued, and (v) Borrowing from development entities had a balance of Ps 247,168.4 billion as of June 30th, 2023 showing an increase of 8.1% versus June 30th, 2022 and a decrease of 0.5% versus March 31st, 2023. Total customer deposits represented 72.9% of total funding as of 2Q23, 71.8% for 1Q23, and 70.0% 2Q22.
Average cost of funds was 9.0% for 2Q23, 8.9% for 1Q23 and 4.2% for 2Q22.
2.1.1 Customer deposits
| Customer deposits | 2Q22 | 1Q23 | 2Q23 | D | |||||
| 2Q23 vs. 1Q23 | 2Q23 vs. 2Q22 | ||||||||
| Checking accounts | 19,975.7 | 17,917.7 | 17,387.8 | -3.0% | -13.0% | ||||
| Other deposits | 399.6 | 928.3 | 440.2 | -52.6% | 10.1% | ||||
| Non-interest bearing | 20,375.4 | 18,846.0 | 17,828.0 | -5.4% | -12.5% | ||||
| Checking accounts | 6,486.4 | 6,041.7 | 6,156.7 | 1.9% | -5.1% | ||||
| Time deposits | 60,524.8 | 85,133.4 | 85,946.1 | 1.0% | 42.0% | ||||
| Savings deposits | 72,642.8 | 68,331.2 | 70,313.7 | 2.9% | -3.2% | ||||
| Interest bearing | 139,653.9 | 159,506.4 | 162,416.6 | 1.8% | 16.3% | ||||
| Customer deposits | 160,029.3 | 178,352.4 | 180,244.5 | 1.1% | 12.6% | ||||
| 11 | |
Of our total customer deposits as of June 30th, 2023, checking accounts represented 13.1%, time deposits 47.7%, savings accounts 39.0%, and other deposits 0.2%.
The following table shows the customer deposits composition by bank. During the last twelve months, Banco de Occidente showed the highest growth rate in customer deposits within our banking operation in Colombia, in line with gross loan growth.
| Deposits / Bank ($) | 2Q22 | 1Q23 | 2Q23 | D | |||||
| 2Q23 vs. 1Q23 | 2Q23 vs. 2Q22 | ||||||||
| Banco de Bogotá | 84,388.8 | 89,606.3 | 90,336.7 | 0.8% | 7.0% | ||||
| Banco de Occidente | 38,737.3 | 46,703.8 | 46,515.2 | -0.4% | 20.1% | ||||
| Banco Popular | 23,205.6 | 24,904.7 | 24,347.5 | -2.2% | 4.9% | ||||
| Banco AV Villas | 14,494.7 | 13,929.9 | 14,642.5 | 5.1% | 1.0% | ||||
| Corficolombiana | 5,936.9 | 6,719.7 | 7,220.9 | 7.5% | 21.6% | ||||
| Eliminations | (6,733.9) | (3,512.0) | (2,818.3) | -19.8% | -58.1% | ||||
| Total Grupo Aval | 160,029.3 | 178,352.4 | 180,244.5 | 1.1% | 12.6% | ||||
| Deposits / Bank (%) | 2Q22 | 1Q23 | 2Q23 | ||||||
| Banco de Bogotá | 52.7% | 50.2% | 50.1% | ||||||
| Banco de Occidente | 24.2% | 26.2% | 25.8% | ||||||
| Banco Popular | 14.5% | 14.0% | 13.5% | ||||||
| Banco AV Villas | 9.1% | 7.8% | 8.1% | ||||||
| Corficolombiana | 3.7% | 3.8% | 4.0% | ||||||
| Eliminations | -4.2% | -2.0% | -1.6% | ||||||
| Total Grupo Aval | 100.0% | 100.0% | 100.0% | ||||||
2.1.2 Borrowings from Banks and Other (includes borrowings from development entities)
As of June 30th, 2023 borrowings from banks and other totaled Ps 28,039.3 billion, increasing 7.1% versus June 30th, 2022 and decreasing 17.3% versus March 31st, 2023.
2.1.3 Bonds issued
Total bonds issued as of June 30th, 2023 totaled Ps 25,424.8 billion and decreased 20.5% versus June 30th, 2022 and 7.0% versus March 31st, 2023. The maturity of Grupo Aval’s US$1 billion bond in September 2022 and Banco de Bogotá’s US$500 million bond in February 2023 explain the yearly performance. The quarterly decrease is mainly explained by the 10.1% appreciation of the Colombian Peso on our Us$ denominated bonds.
| 12 | |
| 3. | Non-controlling Interest |
Non-controlling Interest in Grupo Aval reflects the minority stakes that third party shareholders hold in each of its direct consolidated subsidiaries (Banco de Bogotá, Banco de Occidente, Banco Popular, Banco AV Villas, Corficolombiana and Porvenir).
As of June 30th, 2023 non-controlling interest was Ps 14,296.6 billion which increased by 4.1% versus June 30th, 2022 and 1.7% versus March 31st, 2023. Total non-controlling interest represents 46.5% of total equity as of 2Q23, compared to 46.5% in 1Q23 and 45.5% in 2Q22.
Total non-controlling interest derives from the sum of the combined minority interests of our banks and of Grupo Aval, applying eliminations associated with the consolidation process of Grupo Aval.
| Percentage consolidated by Aval | 2Q22 | 1Q23 | 2Q23 | D | |||||
| 2Q23 vs. 1Q23 | 2Q23 vs. 2Q22 | ||||||||
| Banco de Bogotá | 68.9% | 68.9% | 68.9% | - | - | ||||
| Banco de Occidente | 72.3% | 72.3% | 72.3% | - | - | ||||
| Banco Popular | 93.7% | 93.7% | 93.7% | - | - | ||||
| Banco AV Villas | 79.9% | 79.9% | 79.9% | - | - | ||||
| Porvenir (1) | 75.8% | 75.8% | 75.8% | - | 0 | ||||
| Corficolombiana | 40.4% | 40.5% | 40.5% | - | 13 | ||||
| 4. | Attributable Shareholders’ Equity |
Attributable shareholders’ equity as of June 30th, 2023 was Ps 16,465.4 billion, showing an increase of 0.3% versus June 30th, 2022 and a 1.8% versus March 31st, 2023.
| 13 | |
Income Statement Analysis
Our net income attributable to the owners of the parent company for 2Q23 was Ps 166.2 billion.
| Consolidated Statement of Income | 2Q22 | 1Q23 | 2Q23 | D | |||||
| 2Q23 vs. 1Q23 | 2Q23 vs. 2Q22 | ||||||||
| Interest income | 4,286.7 | 7,008.3 | 7,154.6 | 2.1% | 66.9% | ||||
| Interest expense | 2,312.3 | 5,459.5 | 5,579.1 | 2.2% | 141.3% | ||||
| Net interest income | 1,974.4 | 1,548.8 | 1,575.5 | 1.7% | -20.2% | ||||
| Loans and other accounts receivable | 719.6 | 920.5 | 1,138.6 | 23.7% | 58.2% | ||||
| Other financial assets | (1.0) | (0.3) | (9.6) | N.A. | N.A. | ||||
| Recovery of charged-off financial assets | (151.8) | (133.7) | (140.8) | 5.3% | -7.3% | ||||
| Net impairment loss on financial assets | 566.8 | 786.5 | 988.3 | 25.7% | 74.4% | ||||
| Net income from commissions and fees | 697.3 | 842.3 | 883.9 | 4.9% | 26.8% | ||||
| Gross profit from sales of goods and services | 1,440.8 | 1,163.6 | 619.2 | -46.8% | -57.0% | ||||
| Net trading income | 481.5 | (81.3) | (783.1) | N.A. | -262.6% | ||||
| Net income from other financial instruments mandatory at FVTPL | 68.4 | 93.9 | 76.6 | -18.5% | 11.9% | ||||
| Total other income | (544.7) | 875.9 | 1,516.6 | 73.2% | N.A | ||||
| Total other expenses | 1,754.6 | 2,077.0 | 2,089.2 | 0.6% | 19.1% | ||||
| Net income before income tax expense | 1,796.4 | 1,579.8 | 811.2 | -48.7% | -54.8% | ||||
| Income tax expense | 564.3 | 532.6 | 350.6 | -34.2% | -37.9% | ||||
| Net income for the period of continued operations | 1,232.1 | 1,047.3 | 460.6 | -56.0% | -62.6% | ||||
| Net income for the period of discontinued operations | 154.0 | - | - | N.A | -100.0% | ||||
| Net income for the period | 1,386.1 | 1,047.3 | 460.6 | -56.0% | -66.8% | ||||
| Non-controlling interest | 710.6 | 622.2 | 294.4 | -52.7% | -58.6% | ||||
| Net income attributable to owners of the parent | 675.5 | 425.1 | 166.2 | -60.9% | -75.4% | ||||
| 1. | Net Interest Income |
| Net interest income | 2Q22 | 1Q23 | 2Q23 | D | |||||
| 2Q23 vs. 1Q23 | 2Q23 vs. 2Q22 | ||||||||
| Interest income | |||||||||
| Commercial | 1,824.8 | 3,382.1 | 3,623.3 | 7.1% | 98.6% | ||||
| Interbank and overnight funds | 54.0 | 375.0 | 252.6 | -32.6% | N.A. | ||||
| Consumer | 1,653.0 | 2,178.6 | 2,268.9 | 4.1% | 37.3% | ||||
| Mortgages and housing leases | 335.5 | 408.4 | 412.4 | 1.0% | 22.9% | ||||
| Microcredit | 15.9 | 17.3 | 17.5 | 1.3% | 10.3% | ||||
| Loan portfolio | 3,883.2 | 6,361.4 | 6,574.9 | 3.4% | 69.3% | ||||
| Interests on investments in debt securities | 403.5 | 646.9 | 579.7 | -10.4% | 43.7% | ||||
| Total interest income | 4,286.7 | 7,008.3 | 7,154.6 | 2.1% | 66.9% | ||||
| Interest expense | |||||||||
| Checking accounts | 28.6 | 62.5 | 71.6 | 14.6% | 150.1% | ||||
| Time deposits | 759.7 | 2,216.4 | 2,519.9 | 13.7% | 231.7% | ||||
| Savings deposits | 671.8 | 1,591.8 | 1,343.0 | -15.6% | 99.9% | ||||
| Total interest expenses on deposits | 1,460.2 | 3,870.6 | 3,934.4 | 1.6% | 169.4% | ||||
| Interbank borrowings and overnight funds | 121.3 | 395.9 | 494.8 | 25.0% | N.A. | ||||
| Borrowings from banks and others | 169.6 | 487.7 | 456.1 | -6.5% | 169.0% | ||||
| Bonds issued | 515.8 | 562.6 | 561.1 | -0.3% | 8.8% | ||||
| Borrowings from development entities | 45.5 | 142.6 | 132.6 | -7.0% | 191.4% | ||||
| Total interest expenses on financial obligations | 852.2 | 1,588.9 | 1,644.7 | 3.5% | 93.0% | ||||
| Total interest expense | 2,312.3 | 5,459.5 | 5,579.1 | 2.2% | 141.3% | ||||
| Net interest income | 1,974.4 | 1,548.8 | 1,575.5 | 1.7% | -20.2% | ||||
| 14 | |
Our net interest income decreased by 20.2% to Ps 1,575.5 billion for 2Q23 versus 2Q22 and increased by 1.7% versus 1Q23. The decrease versus 2Q22 was derived mainly from a 66.9% increase in total interest income offset by a 141.3% increase in total interest expense.
Our Net Interest Margin(*) was 3.4% for 2Q23, 3.7% for 1Q23, and 3.6% in 2Q22. Net Interest Margin on Loans was 4.0% for 2Q23, 3.6% for 1Q23, and 4.9% for 2Q22. On the other hand, our Net Investments Margin was 0.9% for 2Q23, 4.2% for 1Q23 and -1.3% for 2Q22.
| 2. | Impairment loss on financial assets, net |
Our impairment loss on financial assets, net increased by 74.4% to Ps 988.3 billion for 2Q23 versus 2Q22 and by 25.7% versus 1Q23.
| Net impairment loss on financial assets | 2Q22 | 1Q23 | 2Q23 | D | |||||
| 2Q23 vs. 1Q23 | 2Q23 vs. 2Q22 | ||||||||
| Loans and other accounts receivable | 719.6 | 920.5 | 1,138.6 | 23.7% | 58.2% | ||||
| Other financial assets | (1.0) | (0.3) | (9.6) | N.A. | N.A. | ||||
| Recovery of charged-off financial assets | (151.8) | (133.7) | (140.8) | 5.3% | -7.3% | ||||
| Net impairment loss on financial assets | 566.8 | 786.5 | 988.3 | 25.7% | 74.4% | ||||
Our annualized gross cost of risk was 2.5% for 2Q23, 2.0% for 1Q23, and 1.8% for 2Q22. Net of recoveries of charged-off assets our ratio was 2.2% for 2Q23, 1.7% 1Q23, and 1.4% for 2Q22.
(*) Grupo Aval’s NIM without income from trading securities and investment in debt securities designated at fair value through profit and loss (non compliant with SPPI test) was 2.9% for 2Q23, 2.8% for 1Q23, and 4.0% for 2Q22 .
| 15 | |
| 3. | Non-interest income |
| Total non-interest income | 2Q22 | 1Q23 | 2Q23 | D | |||||
| 2Q23 vs. 1Q23 | 2Q23 vs. 2Q22 | ||||||||
| Income from commissions and fees | |||||||||
| Banking fees(1) | 584.3 | 664.4 | 675.3 | 1.6% | 15.6% | ||||
| Trust activities and management services | 85.1 | 122.9 | 114.7 | -6.7% | 34.8% | ||||
| Pension and severance fund management | 199.0 | 250.0 | 271.4 | 8.6% | 36.4% | ||||
| Bonded warehouse services | 44.5 | 47.3 | 47.5 | 0.4% | 6.8% | ||||
| Total income from commissions and fees | 912.8 | 1,084.5 | 1,108.9 | 2.2% | 21.5% | ||||
| Expenses from commissions and fees | 215.5 | 242.2 | 225.0 | -7.1% | 4.4% | ||||
| Net income from commissions and fees | 697.3 | 842.3 | 883.9 | 4.9% | 26.8% | ||||
| Income from sales of goods and services | 3,231.6 | 2,927.5 | 2,675.8 | -8.6% | -17.2% | ||||
| Costs and expenses from sales of goods and services | 1,790.8 | 1,763.8 | 2,056.6 | 16.6% | 14.8% | ||||
| Gross profit from sales of goods and services | 1,440.8 | 1,163.6 | 619.2 | -46.8% | -57.0% | ||||
| Total trading investment income | (111.7) | 591.0 | 392.1 | -33.7% | N.A | ||||
| Total derivatives income | 593.2 | (672.3) | (1,175.2) | 74.8% | -298.1% | ||||
| Net trading income | 481.5 | (81.3) | (783.1) | N.A. | -262.6% | ||||
| Net income from other financial instruments mandatory at FVTPL | 68.4 | 93.9 | 76.6 | -18.5% | 11.9% | ||||
| Other income | |||||||||
| Foreign exchange gains (losses), net | (702.5) | 488.5 | 1,196.3 | 144.9% | 270.3% | ||||
| Net gain on sale of investments and OCI realization | (8.3) | 27.5 | 32.6 | 18.4% | N.A | ||||
| Gain on the sale of non-current assets held for sale | 1.9 | 1.1 | 20.6 | N.A. | N.A. | ||||
| Income from non-consolidated investments(2) | 93.2 | 214.5 | 101.8 | -52.5% | 9.2% | ||||
| Net gains on asset valuations | 12.5 | 0.0 | (29.4) | N.A | N.A | ||||
| Other income from operations | 58.5 | 144.2 | 194.7 | 35.0% | 232.6% | ||||
| Total other income | (544.7) | 875.9 | 1,516.6 | 73.2% | N.A | ||||
| Total non-interest income | 2,143.4 | 2,894.5 | 2,313.1 | -20.1% | 7.9% | ||||
(1) Includes commissions on banking services, office network services, credit and debit card fees, fees on drafts, checks and checkbooks and other fees
(2) Includes share of profit of equity accounted investees, net of tax, and dividend income.
| 3.1 | Net income from commissions and fees |
Net income from commissions and fees for 2Q23 totaled Ps 883.9 billion and increased by 26.8% versus 2Q22 and by 4.9% versus 1Q23. Income from commissions and fees increased by 21.5% to Ps 1,108.9 billion for 2Q23 versus 2Q22 and increased by 2.2% versus 1Q23.
Pension and severance fund management fees increased over the quarter due to higher contribution-based fees as wages increases are reflected in commissions charged by mandatory pension funds. Fees related to trust activities and portfolio management services decreased over the quarter because of lower performance-based fees.
| 3.2 | Gross profit from sales of goods and services |
Gross profit from sales of goods and services (non-financial sector) decreased by 57.0% to Ps
619.2 billion for 2Q23 versus 2Q22 and 46.8% versus 1Q23. Income from the non-financial sector, specifically infrastructure, was negatively impacted by the effects of the US$60.6 million or Ps 253.0 billion resolution with the DOJ and SEC. In addition, results for infrastructure were lower on a quarterly basis due to i) softer monthly inflation metrics lowered interest income on financial assets, ii) negative impact of FX on concession arrangements assets with Dollar exposure, which is hedged with effect in other income from foreign exchange gains (losses), net and total derivatives income and iii) slower work progress in Covioriente due to unfavorable weather conditions.
| 16 | |
| 3.3 | Net trading income and other income |
| Other income | 2Q22 | 1Q23 | 2Q23 | D | |||||
| 2Q23 vs. 1Q23 | 2Q23 vs. 2Q22 | ||||||||
| Total derivatives income | 593.2 | (672.3) | (1,175.2) | 74.8% | 298.1% | ||||
| Foreign exchange gains (losses), net | (702.5) | 488.5 | 1,196.3 | 144.9% | 270.3% | ||||
| Derivatives and foreign exchange gains (losses), net (1) | (109.3) | (183.7) | 21.1 | 111.5% | 119.3% | ||||
| Net gains on asset valuations | 12.5 | 0.0 | (29.4) | N.A | N.A | ||||
| Net income from other financial instruments mandatory at FVTPL | 68.4 | 93.9 | 76.6 | -18.5% | 11.9% | ||||
| Net gain on sale of investments and OCI realization | (8.3) | 27.5 | 32.6 | -18.4% | N.A | ||||
| Gain on the sale of non-current assets held for sale | 1.9 | 1.1 | 20.6 | N.A. | N.A. | ||||
| Income from non-consolidated investments | 93.2 | 214.5 | 101.8 | -52.5% | 9.2% | ||||
| Other income from operations | 58.5 | 144.2 | 194.7 | 35.0% | 232.6% | ||||
| Total other income from operations | 116.9 | 297.6 | 417.9 | 40.5% | 257.4% | ||||
(1) Includes income from trading and hedging derivatives reflected as part of the net trading income on the statement of profit and loss.
Total other income for 2Q23 totaled Ps 417.9 billion, the 257.4% yearly increase was due THE 270.3% increase in foreign exchange gains, net. The quarterly increase was 40.5% due to the 111.5% increase in derivative and foreign exchange losses, net, mainly explained by gains related with our non-financial sector as previously noted.
| 4. | Other expenses |
Total other expenses for 2Q23 totaled Ps 2,089.2 billion and increased by 19.1% versus 2Q22, and by 0.6% versus 1Q23. Our efficiency ratio measured as total other expenses to total income was 53.7% in 2Q23, 46.7% in 1Q23 and 42.6% in 2Q22.
3.2% of the quarterly increase is explained by the resolutions with the U.S. agencies, 1.3% is related with dividends seasonality in 1Q23 and the remaining 2.4% increase was driven by the results from our non-financial sector. The ratio of annualized total other expenses as a percentage of average total assets was 2.8% for 2Q23 and 1Q23, and 2.6% for 2Q22.
| 5. | Non-controlling Interest |
Non-controlling interest in Grupo Aval mainly reflects the minority stakes that third party shareholders hold in each of its direct consolidated subsidiaries (Banco de Bogotá, Banco de Occidente, Banco Popular, Banco AV Villas, Corficolombiana and Porvenir).
Non-controlling interest in the income statement was Ps 294.4 billion, showing a 58.6% decrease versus 2Q22 and 52.7% versus 1Q23. In addition, the ratio of non-controlling interest to income before non-controlling interest was 63.9% in 2Q23, 59.4% in 1Q23 and 51.3% in 2Q22.
| 17 | |
RISK MANAGEMENT
During the first quarter of 2023, there were no material changes in the degree of exposure to the relevant risks disclosed in the report as of December 2022, nor have new relevant risks been identified that merit disclosure as of March 31st , 2023, according to the instructions given in paragraph 8.4.1.2.1 of Exhibit 1 «Información periódica de los emisores» in Chapter I of Title V of Part III of the Basic Legal Circular Jurídica «Registro Nacional de Valores y Emisores – RNVE.
Despite de above, it should be highlighted that the increased inflation registered since December 2021 (5.62%) up to 13.12% in December 2022, triggered Board of Directors of the Banco de la Republica, to raise the Monetary Policy Rate from 3% in December 2021 to 13.25% in May 2023. This represents a 1025 basis points increase in 17 months. Due to the demand for resources by the productive sectors of the economy, after the contraction in consumption and production as a result of the pandemic declared by the COVID-19 virus, the financial sector demanded more resources to fund its commercial activities, while meeting the short- and medium-term liquidity requirements.
The rate of adjustment of interest rates for funding instruments (time deposits, bonds, money market) resulted in a margins contraction for banks in Colombia. The magnitude of the contraction depends on each bank’s balance sheet structure and the degree of exposure to mismatch risks.
This situation also affects Grupo Aval’s banks in Colombia and the speed of return to desired margins will depend on the fulfillment of our strategic objectives and the stabilization of the local and international economic environment.
QUANTITATIVE AND QUALITATIVE ANALYSIS OF MARKET RISK
During 2Q23, there were no material qualitative and quantitative changes in market risk in comparison with the information reported in the report as of 1Q23, that merit disclosure as of June 30th, 2023, in accordance with the instructions given in paragraph 8.4.1.1.4 of Exhibit 1 «Información periódica de los emisores» in Chapter I of Title V of Part III of the Basic Legal Circular «Registro Nacional de Valores y Emisores – RNVE
CORPORATE GOVERNANCE
In terms of Corporate Governance, during this quarter there have been no material changes that should be reported.
ESG
In terms of ESG, during this quarter there have been no material changes that should be reported.
| 18 | |
GRUPO AVAL ACCIONES Y VALORES S.A.
Separate Financial Statements
Below, we present a summary of our financial statements at the separate level by the end of the second quarter of 2023. The results presented are in accordance with the Colombian International Financial Reporting Standards (Colombian IFRS). The information reported below is expressed in Colombian Pesos (Ps) billion, except where otherwise indicated.
Assets
The assets are mainly represented by the interests we have in Banco de Bogotá (68.9%), Banco de Occidente (72.3%), Banco Popular (93.7%), Banco AV Villas (79.9%), AFP Porvenir (20.0%), Corficolombiana (8.7%) and 100.0% of Grupo Aval Ltd. (GAL).
Total assets as of June 30th, 2023 totaled Ps 20,639.2 billion, decreasing 0.5% or Ps 104.3
billion versus March 31st, 2023 and increasing Ps 1,968.1 billion versus June 30th, 2022.
The annual variation is mainly explained by the credit operation disbursed to related parties in December 2022 and which as of June 30th, 2023 amounted to Ps 1,335.9 billion. Secondly, the increase in investments in subsidiaries and associates Ps 113.9 billion.
On a quarterly basis, the variation is mainly explained by the decrease in current accounts receivable from related parties, due the reduction of Ps 261.7 billion of dividends receivable and the decrease in non-current accounts receivable from related parties of 8.7% related to the FX movements on the Dollar denominated portion of the credit operation with related parties, the appreciation of the Colombian Peso in the quarter was 10.1%. The increase in investments in subsidiaries and associates of 1.5% or Ps 272.3 billion is related to the recognition of the equity method.
Liabilities
Total liabilities as of June 30th, 2023 totaled Ps 3,673.9 billion, decreasing 9.3% or Ps 377.0 billion versus March 31st, 2023 and increasing Ps 1,875.7 billion versus June 30th, 2022.
The annual variation is mainly explained by the increase of Ps 1,109.5 billion in the balance of financial obligations at amortized cost, mainly explained by the US$270 million loan entered into with Grupo Aval Limited (GAL) in December 2022 to fund a portion of the loan extended to related parties (as of June 30th, 2023, the loan with GAL amounted to Ps 1,113.5 billion) and (ii) the increase of Ps 758.9 billion in dividends payable as a result of the dividend declared by Grupo Aval on March 30th, 2023.
Regarding the quarterly variation, this is mainly explained by (i) a Ps 256.3 billion decrease of dividends payable and (ii) a Ps 126.5 billion decrease in the balance of dollar denominated debt with GAL, in line with the quarterly appreciation of the Colombian Peso. The financial indebtedness of Grupo Aval did not present material changes compared to what was reported as of March 30th, 2023.
| 19 | |
Equity
As of June 30th, 2023, shareholders' equity was Ps 16,965.3, 0.5% more than that reported on June 30th, 2022 and increasing 1.6% or Ps 92.4 from the equity reported as of March 31st, 2022. This movement reflects mainly recognition of profits and equity method.
Net Income
Net income in our separate financial statements is derived primarily from equity method income from our investments and other income, net of the Holding's operating, financial and tax expenses.
During the 2Q23 we presented a net profit from continuing operations of Ps 159.6 billion, decreasing 61.6% versus 1Q23 and 77.0% versus 2Q22. The decrease in profits is explained by a lower equity method income. Our banking subsidiaries continue to experience challenges on their intermediation margins as a result of the rapid increase in the cost of funds. Net income for the quarter was negatively impacted by the effects on Grupo Aval’s net income of the US$24.5 million or Ps 102.5 billion resolution with the DOJ and SEC, which amounted to US$60.6 million and Ps 253.0 billion in Corficolombiana.
| 20 | |

Information related to Grupo Aval Acciones y Valores S.A. (Holding Company) and Grupo Aval Limited
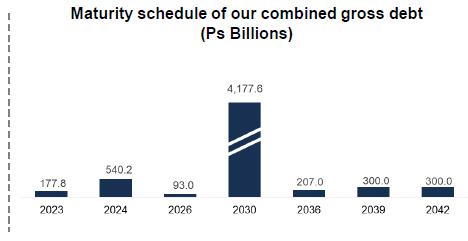
The holding company recorded a total gross indebtedness of Ps 1,648.0 billion (Ps 509.2 billion of bank debt and Ps 1,138.8 billion of bonds denominated in Colombian pesos) as of June 30th 2023. It also guarantees irrevocably and unconditionally Grupo Aval Limited’s (144A / Reg S) 2030 (USD 1.0 billion) bonds under its respective indentures. As of June 30th 2023, the total amount outstanding (including interests payable) of such bonds was USD 1.0 billion, or Ps 4,223.2 billion when converted into pesos.
The debt at Grupo Aval Limited is serviced with interest income on loans to subsidiaries and cash & cash equivalents. Grupo Aval Limited has not required, to this date, cash from Grupo Aval Acciones y Valores S.A. to fulfill its obligations. The main sources of cash to pay the debt and debt service at Grupo Aval Acciones y Valores S.A. have been the dividend income from its subsidiaries and the returns on its cash & cash equivalents.
When combined, Grupo Aval Acciones y Valores S.A. and Grupo Aval Ltd. had Ps 519.2 billion of total liquid assets, a total gross indebtedness of Ps 5,871.2 billion and a net indebtedness of Ps 5,352.0 billion as of June 30th 2023. In addition to liquid assets, has Ps 1,327.9 billion in loans with related parties and Grupo Aval Ltd. has Ps 2,182.0 billion in investments in AT1 instruments.
| Total liquid assets as of June 30, 2023 | |
| Cash and cash equivalents | 392.1 |
| Fixed income investments | 127.1 |
| Total liquid assets | 519.2 |
As of June 30th 2023 our combined double leverage (calculated as investments in subsidiaries at book value, subordinated loans to subsidiaries, AT1 investments, and goodwill as a percentage of shareholders' equity) was 1.25x. Finally, we present an evolution of our key ratios on a combined basis:
| Debt service coverage and leverage ratios | 2Q22 | 1Q23 | 2Q23 | D | |||||
| 2Q23 vs. 1Q23 | 2Q23 vs. 2Q22 | ||||||||
| Double leverage (1) | 1.25x | 1.27x | 1.25x | -0.02 | 0.00 | ||||
| Net debt / Core earnings (2)(3) | 5.66x | 6.21x | 3.48x | -2.73 | -2.18 | ||||
| Net debt / Cash dividends (2)(3) | 14.36x | 14.73x | 5.14x | -9.59 | -9.21 | ||||
| Core Earnings / Interest Expense (2) | 1.78x | 2.06x | 3.43x | 1.36 | 1.65 | ||||
(1) Double leverage is calculated as investments in subsidiaries at book value (excluding revaluations), subordinated loans to subsidiaries and goodwill as a percentage of shareholders' equity; (2) Core earnings are defined as annualized recurring cash flow from dividends, investments and net operating income; (3) Net debt is calculated as total gross debt minus cash and cash equivalents and fixed income investments
| 21 | |
Grupo Aval Acciones y Valores S.A.
Consolidated Financial Statements Under IFRS
Financial Statements Under IFRS
Information in Ps. Billions
| Consolidated Statement of Financial Position | 2Q22 | 1Q23 | 2Q23 | D | |||||
| 2Q23 vs. 1Q23 | 2Q23 vs. 2Q22 | ||||||||
| Cash and cash equivalents | 21,441.1 | 19,327.8 | 19,195.7 | -0.7% | -10.5% | ||||
| Investment and trading assets | |||||||||
| Debt securities | 3,980.0 | 5,145.6 | 5,323.3 | 3.5% | 33.8% | ||||
| Equity securities | 5,022.2 | 6,525.1 | 6,018.7 | -7.8% | 19.8% | ||||
| Derivative assets | 1,886.3 | 1,914.8 | 1,914.1 | 0.0% | 1.5% | ||||
| Trading assets | 10,888.4 | 13,585.5 | 13,256.1 | -2.4% | 21.7% | ||||
| Investments in debt securities at FVTPL (non compliant with SPPI test) | - | 1.4 | 1.4 | 0.0% | N.A | ||||
| Investments in securities at FVOCI | 23,108.5 | 22,178.1 | 23,089.9 | 4.1% | -0.1% | ||||
| Investments in debt securities at AC | 8,582.0 | 9,789.6 | 9,738.4 | -0.5% | 13.5% | ||||
| Investment securities | 31,690.5 | 31,969.1 | 32,829.6 | 2.7% | 3.6% | ||||
| Hedging derivatives assets | 49.1 | 35.1 | 69.4 | 97.8% | 41.5% | ||||
| Gross loans | |||||||||
| Commercial loans | 97,950.2 | 110,049.8 | 109,288.9 | -0.7% | 11.6% | ||||
| Commercial loans | 95,946.0 | 106,129.9 | 106,350.8 | 0.2% | 10.8% | ||||
| Interbank & overnight funds | 2,004.1 | 3,920.0 | 2,938.1 | -25.0% | 46.6% | ||||
| Consumer loans | 54,481.2 | 60,186.9 | 60,033.8 | -0.3% | 10.2% | ||||
| Mortgages loans | 15,883.6 | 18,026.1 | 17,756.5 | -1.5% | 11.8% | ||||
| Microcredit loans | 278.6 | 267.6 | 268.5 | 0.3% | -3.6% | ||||
| Total gross loans | 168,593.6 | 188,530.4 | 187,347.7 | -0.6% | 11.1% | ||||
| Loss allowance | (8,941.7) | (9,427.5) | (9,435.2) | 0.1% | 5.5% | ||||
| Total loans, net | 159,651.9 | 179,102.9 | 177,912.5 | -0.7% | 11.4% | ||||
| Other accounts receivable, net | 20,799.0 | 24,384.5 | 24,200.3 | -0.8% | 16.4% | ||||
| Non-current assets held for sale | 144.9 | 100.1 | 117.5 | 17.4% | -18.9% | ||||
| Investments in associates and joint ventures | 4,882.0 | 1,191.4 | 1,211.4 | 1.7% | -75.2% | ||||
| Own-use property, plant and equipment for own-use and given in operating lease, net | 4,615.9 | 4,695.6 | 4,597.2 | -2.1% | -0.4% | ||||
| Right-of-use assets | 1,336.9 | 1,382.7 | 1,338.9 | -3.2% | 0.2% | ||||
| Investment properties | 923.9 | 956.5 | 959.8 | 0.4% | 3.9% | ||||
| Biological assets | 167.2 | 213.1 | 217.6 | 2.1% | 30.1% | ||||
| Tangible assets | 7,043.9 | 7,247.8 | 7,113.6 | -1.9% | 1.0% | ||||
| Goodwill | 2,234.9 | 2,232.2 | 2,215.2 | -0.8% | -0.9% | ||||
| Concession arrangement rights | 12,032.2 | 13,536.2 | 13,558.6 | 0.2% | 12.7% | ||||
| Other intangible assets | 1,769.2 | 2,082.7 | 2,176.3 | 4.5% | 23.0% | ||||
| Intangible assets | 16,036.3 | 17,851.1 | 17,950.1 | 0.6% | 11.9% | ||||
| Current | 1,346.2 | 1,950.1 | 2,363.9 | 21.2% | 75.6% | ||||
| Deferred | 1,610.5 | 1,525.4 | 1,318.2 | -13.6% | -18.1% | ||||
| Income tax assets | 2,956.7 | 3,475.5 | 3,682.1 | 5.9% | 24.5% | ||||
| Other assets | 527.2 | 607.4 | 523.1 | -13.9% | -0.8% | ||||
| Total assets | 276,111.0 | 298,878.2 | 298,061.6 | -0.3% | 7.9% | ||||
| Trading liabilities | 1,893.8 | 1,517.6 | 1,859.9 | 22.6% | -1.8% | ||||
| Hedging derivatives liabilities | 5.8 | 5.6 | 8.9 | 59.6% | 52.2% | ||||
| Customer deposits | 160,029.3 | 178,352.4 | 180,244.5 | 1.1% | 12.6% | ||||
| Checking accounts | 26,462.1 | 23,959.4 | 23,544.5 | -1.7% | -11.0% | ||||
| Time deposits | 60,524.8 | 85,133.4 | 85,946.1 | 1.0% | 42.0% | ||||
| Savings deposits | 72,642.8 | 68,331.2 | 70,313.7 | 2.9% | -3.2% | ||||
| Other deposits | 399.6 | 928.3 | 440.2 | -52.6% | 10.1% | ||||
| Financial obligations | 68,653.7 | 70,038.5 | 66,923.9 | -4.4% | -2.5% | ||||
| Interbank borrowings and overnight funds | 10,499.9 | 8,799.8 | 13,459.9 | 53.0% | 28.2% | ||||
| Borrowings from banks and others | 22,945.6 | 29,346.9 | 23,916.9 | -18.5% | 4.2% | ||||
| Bonds issued | 31,973.1 | 27,352.4 | 25,424.8 | -7.0% | -20.5% | ||||
| Borrowings from development entities | 3,235.0 | 4,539.5 | 4,122.4 | -9.2% | 27.4% | ||||
| Total financial liabilities at amortized cost | 228,683.0 | 248,390.9 | 247,168.4 | -0.5% | 8.1% | ||||
| Legal related | 217.1 | 228.0 | 237.4 | 4.1% | 9.3% | ||||
| Other provisions | 858.9 | 914.0 | 790.7 | -13.5% | -7.9% | ||||
| Provisions | 1,076.0 | 1,142.0 | 1,028.1 | -10.0% | -4.5% | ||||
| Current | 109.0 | 319.8 | 118.7 | -62.9% | 8.9% | ||||
| Deferred | 4,522.2 | 5,244.3 | 5,457.9 | 4.1% | 20.7% | ||||
| Income tax liabilities | 4,631.3 | 5,564.2 | 5,576.6 | 0.2% | 20.4% | ||||
| Employee benefits | 846.3 | 886.9 | 842.4 | -5.0% | -0.5% | ||||
| Other liabilities | 8,825.3 | 11,144.0 | 10,815.3 | -2.9% | 22.5% | ||||
| Total liabilities | 245,961.5 | 268,651.1 | 267,299.6 | -0.5% | 8.7% | ||||
| Equity attributable to owners of the parent | 16,420.0 | 16,175.7 | 16,465.4 | 1.8% | 0.3% | ||||
| Non-controlling interest | 13,729.6 | 14,051.3 | 14,296.6 | 1.7% | 4.1% | ||||
| Total equity | 30,149.6 | 30,227.0 | 30,762.0 | 1.8% | 2.0% | ||||
| Total liabilities and equity | 276,111.0 | 298,878.2 | 298,061.6 | -0.3% | 7.9% | ||||
| 22 | |
Grupo Aval Acciones y Valores S.A.
Consolidated Financial Statements Under Full IFRS
Financial Statements Under IFRS
Information in Ps. Billions
| Consolidated Statement of income | YTD 2022 | YTD 2023 | D | 2Q22 | 1Q23 | 2Q23 | D | ||||||||
| 2023 vs. 2022 | 2Q23 vs. 1Q23 | 2Q23 vs. 2Q22 | |||||||||||||
| Interest income | |||||||||||||||
| Loan portfolio | 7,263.0 | 12,936.3 | 78.1% | 3,883.2 | 6,361.4 | 6,574.9 | 3.4% | 69.3% | |||||||
| Interests on investments in debt securities | 783.5 | 1,226.6 | 56.6% | 403.5 | 646.9 | 579.7 | -10.4% | 43.7% | |||||||
| Total interest income | 8,046.5 | 14,162.9 | 76.0% | 4,286.7 | 7,008.3 | 7,154.6 | 2.1% | 66.9% | |||||||
| Interest expense | |||||||||||||||
| Checking accounts | 58.5 | 134.0 | 129.1% | 28.6 | 62.5 | 71.6 | 14.6% | 150.1% | |||||||
| Time deposits | 1,303.9 | 4,736.2 | N.A. | 759.7 | 2,216.4 | 2,519.9 | 13.7% | N.A. | |||||||
| Savings deposits | 1,079.8 | 2,934.7 | 171.8% | 671.8 | 1,591.8 | 1,343.0 | -15.6% | 99.9% | |||||||
| Total interest expenses on deposits | 2,442.2 | 7,805.0 | N.A. | 1,460.2 | 3,870.6 | 3,934.4 | 1.6% | 169.4% | |||||||
| Interbank borrowings and overnight funds | 197.7 | 890.8 | N.A. | 121.3 | 395.9 | 494.8 | 25.0% | N.A. | |||||||
| Borrowings from banks and others | 294.0 | 943.9 | N.A. | 169.6 | 487.7 | 456.1 | -6.5% | 169.0% | |||||||
| Bonds issued | 982.7 | 1,123.7 | 14.4% | 515.8 | 562.6 | 561.1 | -0.3% | 8.8% | |||||||
| Borrowings from development entities | 74.9 | 275.3 | N.A. | 45.5 | 142.6 | 132.6 | -7.0% | 191.4% | |||||||
| Total interest expenses on financial obligations | 1,549.3 | 3,233.6 | 108.7% | 852.2 | 1,588.9 | 1,644.7 | 3.5% | 93.0% | |||||||
| Total interest expense | 3,991.5 | 11,038.6 | 176.6% | 2,312.3 | 5,459.5 | 5,579.1 | 2.2% | 141.3% | |||||||
| Net interest income | 4,055.0 | 3,124.3 | -23.0% | 1,974.4 | 1,548.8 | 1,575.5 | 1.7% | -20.2% | |||||||
| Impairment losses (recoveries) on financial assets | |||||||||||||||
| Loans and other accounts receivable | 1,526.9 | 2,059.1 | 34.9% | 719.6 | 920.5 | 1,138.6 | 23.7% | 58.2% | |||||||
| Other financial assets | 18.0 | (9.9) | -155.0% | (1.0) | (0.3) | (9.6) | N.A. | N.A. | |||||||
| Recovery of charged-off financial assets | (282.6) | (274.5) | -2.9% | (151.8) | (133.7) | (140.8) | 5.3% | -7.3% | |||||||
| Net impairment loss on financial assets | 1,262.2 | 1,774.8 | 40.6% | 566.8 | 786.5 | 988.3 | 25.7% | 74.4% | |||||||
| Net interest income, after impairment losses | 2,792.7 | 1,349.5 | -51.7% | 1,407.6 | 762.3 | 587.2 | -23.0% | -58.3% | |||||||
| Income from commissions and fees | |||||||||||||||
| Banking fees(1) | 1,148.9 | 1,339.6 | 16.6% | 584.3 | 664.4 | 675.3 | 1.6% | 15.6% | |||||||
| Trust activities | 169.0 | 237.6 | 40.6% | 85.1 | 122.9 | 114.7 | -6.7% | 34.8% | |||||||
| Pension and severance fund management | 502.6 | 521.3 | 3.7% | 199.0 | 250.0 | 271.4 | 8.6% | 36.4% | |||||||
| Bonded warehouse services | 87.4 | 94.8 | 8.5% | 44.5 | 47.3 | 47.5 | 0.4% | 6.8% | |||||||
| Income from commissions and fees | 1,907.9 | 2,193.4 | 15.0% | 912.8 | 1,084.5 | 1,108.9 | 2.2% | 21.5% | |||||||
| Expenses from commissions and fees | 500.5 | 467.2 | -6.7% | 215.5 | 242.2 | 225.0 | -7.1% | 4.4% | |||||||
| Net income from commissions and fees | 1,407.4 | 1,726.2 | 22.7% | 697.3 | 842.3 | 883.9 | 4.9% | 26.8% | |||||||
| Income from sales of goods and services | 5,899.5 | 5,603.3 | -5.0% | 3,231.6 | 2,927.5 | 2,675.8 | -8.6% | -17.2% | |||||||
| Costs and expenses from sales of goods and services | 3,438.1 | 3,820.4 | 11.1% | 1,790.8 | 1,763.8 | 2,056.6 | 16.6% | 14.8% | |||||||
| Gross profit from sales of goods and services | 2,461.4 | 1,782.9 | -27.6% | 1,440.8 | 1,163.6 | 619.2 | -46.8% | -57.0% | |||||||
| Total trading investment income | (130.0) | 983.1 | N.A | (111.7) | 591.0 | 392.1 | -33.7% | N.A | |||||||
| Total derivatives income | 324.1 | (1,847.5) | N.A | 593.2 | (672.3) | (1,175.2) | 74.8% | N.A | |||||||
| Net trading income | 194.1 | (864.4) | N.A | 481.5 | (81.3) | (783.1) | N.A. | N.A | |||||||
| Net income from other financial instruments mandatory at FVTPL | 142.3 | 170.5 | 19.8% | 68.4 | 93.9 | 76.6 | -18.5% | 11.9% | |||||||
| Other income | |||||||||||||||
| Foreign exchange gains (losses), net | (333.3) | 1,684.8 | N.A | (702.5) | 488.5 | 1,196.3 | 144.9% | N.A | |||||||
| Net gain on sale of investments and OCI realization | (10.9) | 60.1 | N.A | (8.3) | 27.5 | 32.6 | 18.4% | N.A | |||||||
| Gain on the sale of non-current assets held for sale | 5.8 | 21.6 | N.A. | 1.9 | 1.1 | 20.6 | N.A. | N.A. | |||||||
| Income from non-consolidated investments(2) | 296.5 | 316.3 | 6.7% | 93.2 | 214.5 | 101.8 | -52.5% | 9.2% | |||||||
| Net gains on asset valuations | 12.8 | (29.4) | N.A | 12.5 | 0.0 | (29.4) | N.A | N.A | |||||||
| Other income from operations | 277.7 | 338.9 | 22.0% | 58.5 | 144.2 | 194.7 | 35.0% | N.A. | |||||||
| Total other income | 248.6 | 2,392.4 | N.A. | (544.7) | 875.9 | 1,516.6 | 73.2% | N.A | |||||||
| Other expenses | |||||||||||||||
| Loss on the sale of non-current assets held for sale | 0.3 | 0.4 | 35.5% | (0.0) | 0.2 | 0.2 | 14.2% | N.A | |||||||
| Personnel expenses | 1,353.2 | 1,555.3 | 14.9% | 673.2 | 773.4 | 781.9 | 1.1% | 16.2% | |||||||
| General and administrative expenses | 1,671.7 | 2,175.4 | 30.1% | 873.8 | 1,087.2 | 1,088.2 | 0.1% | 24.5% | |||||||
| Depreciation and amortization | 316.4 | 338.4 | 7.0% | 160.8 | 166.6 | 171.8 | 3.1% | 6.8% | |||||||
| Impairment loss on other assets | 12.0 | 0.3 | -97.6% | 1.5 | 0.4 | (0.1) | -123.3% | -105.7% | |||||||
| Other operating expenses | 80.5 | 96.4 | 19.8% | 45.3 | 49.2 | 47.2 | -4.2% | 4.1% | |||||||
| Total other expenses | 3,434.0 | 4,166.2 | 21.3% | 1,754.6 | 2,077.0 | 2,089.2 | 0.6% | 19.1% | |||||||
| Net income before income tax expense | 3,812.6 | 2,391.0 | -37.3% | 1,796.4 | 1,579.8 | 811.2 | -48.7% | -54.8% | |||||||
| Income tax expense | 1,197.2 | 883.1 | -26.2% | 564.3 | 532.6 | 350.6 | -34.2% | -37.9% | |||||||
| Net income for the period of continued operations | 2,615.3 | 1,507.8 | -42.3% | 1,232.1 | 1,047.3 | 460.6 | -56.0% | -62.6% | |||||||
| Net income for the period of discontinued operations | 1,751.5 | - | -100.0% | 154.0 | - | - | N.A | -100.0% | |||||||
| Net income for the period | 4,366.8 | 1,507.8 | -65.5% | 1,386.1 | 1,047.3 | 460.6 | -56.0% | -66.8% | |||||||
| Net income for the period attibutable to: | |||||||||||||||
| Non-controlling interest | 1,961.6 | 916.5 | -53.3% | 710.6 | 622.2 | 294.4 | -52.7% | -58.6% | |||||||
| Net income attributable to owners of the parent | 2,405.2 | 591.3 | -75.4% | 675.5 | 425.1 | 166.2 | -60.9% | -75.4% | |||||||
(1) Includes commissions on banking services, office network services, credit and debit card fees, fees on drafts, checks and checkbooks and other fees
(2) Includes share of profit of equity accounted investees, net of tax, and dividend income.
| 23 | |

GRUPO AVAL ACCIONES Y VALORES S.A.
Separate Financial Statements
Financial Statements Under Colombian IFRS
Information in Ps. Billions
| Separate Statement of Financial Position | 2Q22 | 1Q23 | 2Q23 | D | |||||
| 2Q23 vs. 1Q23 | 2Q23 vs. 2Q22 | ||||||||
| Current assets | |||||||||
| Cash and cash equivalents | 140.5 | 166.1 | 178.2 | 7.3% | 26.9% | ||||
| Trading securities | 0.7 | 0.2 | 0.2 | 2.6% | -70.9% | ||||
| Accounts receivable from related parties | 278.6 | 1,029.9 | 768.5 | -25.4% | 175.8% | ||||
| Taxes paid in advance | 4.9 | 6.9 | 6.0 | -13.4% | 20.9% | ||||
| Other accounts receivable | 0.2 | 0.0 | 0.0 | -50.0% | -95.5% | ||||
| Other non-financial assets | 0.0 | 0.1 | 0.1 | 0.0% | 130.2% | ||||
| Total current assets | 424.9 | 1,203.1 | 952.9 | -20.8% | 124.3% | ||||
| Non-current Assets | |||||||||
| Investments in subsidiaries and associates | 18,241.1 | 18,082.6 | 18,354.9 | 1.5% | 0.6% | ||||
| Accounts receivable from related parties | 0.0 | 1,454.4 | 1,327.9 | -8.7% | N.A | ||||
| Property and equipment, net | 4.9 | 3.2 | 3.2 | -2.7% | -35.3% | ||||
| Deferred tax assets | 0.3 | 0.1 | 0.3 | 104.0% | -9.0% | ||||
| Total non-current Assets | 18,246.2 | 19,540.4 | 19,686.3 | 0.7% | 7.9% | ||||
| Total assets | 18,671.1 | 20,743.5 | 20,639.2 | -0.5% | 10.5% | ||||
| Liabilities and shareholders' equity | |||||||||
| Current liabilities | |||||||||
| Borrowings at amortized cost | 343.8 | 21.0 | # | 1,148.1 | N.A | N.A. | |||
| Outstanding bonds at amortized cost | 11.5 | 14.3 | # | 14.3 | 0.0% | 23.7% | |||
| Accounts payable | 114.4 | 1,129.6 | # | 873.3 | -22.7% | N.A. | |||
| Employee benefits | 2.2 | 2.3 | # | 2.4 | 2.5% | 8.5% | |||
| Tax liabilities | 11.1 | 8.6 | # | 15.4 | 78.1% | 39.1% | |||
| Other non-financial liabilities | 1.2 | 1.2 | # | 1.2 | 0.0% | 0.0% | |||
| Total current liabilities | 484.2 | 1,177.1 | 2,054.7 | 74.6% | N.A. | ||||
| Long-term liabilities | |||||||||
| Borrowings at amortized cost | 189.5 | 1,749.3 | 494.7 | -71.7% | 161.1% | ||||
| Outstanding bonds | 1,124.5 | 1,124.5 | 1,124.5 | 0.0% | 0.0% | ||||
| Total long-term liabilities | 1,314.0 | 2,873.8 | 1,619.2 | -43.7% | 23.2% | ||||
| Total liabilities | 1,798.2 | 4,050.9 | 3,673.9 | -9.3% | 104.3% | ||||
| Shareholders' equity | |||||||||
| Subscribed and paid capital | 23.7 | 23.7 | 23.7 | 0.0% | 0.0% | ||||
| Additional paid-in capital | 9,695.2 | 9,695.2 | 9,695.2 | 0.0% | 0.0% | ||||
| Retained earnings | 5,979.8 | 7,469.6 | 7,457.2 | -0.2% | 24.7% | ||||
| Earnings from first-time adoption | 0.0 | 0.0 | 0.0 | N.A | N.A | ||||
| Net income | 2,426.1 | 415.9 | 575.5 | 38.4% | -76.3% | ||||
| Other equity accounts | -1,252.0 | -911.9 | -786.4 | -13.8% | -37.2% | ||||
| Total shareholders' equity | 16,872.9 | 16,692.6 | 16,965.3 | 1.6% | 0.5% | ||||
GRUPO AVAL ACCIONES Y VALORES S.A.
Separate Financial Statements
Financial Statements Under Colombian IFRS
Information in Ps. Billions
| Separate Statement of Financial Position | YTD 2022 | YTD 2023 | D | 2Q22 | 1Q23 | 2Q23 | D | |||||||||
| 2023 vs. 2022 | 2Q23 vs. 1Q23 | 2Q23 vs. 2Q22 | ||||||||||||||
| Operating revenue | ||||||||||||||||
| Equity method income, net | 1,314.3 | 571.0 | -56.6% | 683.6 | 412.5 | 158.6 | -61.6% | -76.81% | ||||||||
| Other revenue from ordinary activities | 145.4 | 234.4 | 61.2% | 73.1 | 116.6 | 117.8 | 1.0% | 61.21% | ||||||||
| Total operating revenue | 1,459.7 | 805.4 | -44.8% | 756.7 | 529.1 | 276.3 | -47.8% | -63.5% | ||||||||
| Expenses, net | ||||||||||||||||
| Administrative expenses | 54.3 | 38.7 | -28.8% | 21.7 | 18.7 | 20.0 | 6.7% | -8.15% | ||||||||
| Other expenses | 0.9 | -0.2 | -123.3% | 0.9 | -0.1 | -0.1 | 13.1% | -112.56% | ||||||||
| Losses from exchange differences | -0.4 | 0.3 | -183.2% | 0.5 | -0.1 | 0.5 | N.A | 4.19% | ||||||||
| Operating income | 1,404.1 | 766.6 | -45.4% | 733.6 | 510.4 | 256.0 | -49.8% | -65.1% | ||||||||
| Financial expenses | 76.8 | 165.3 | 115.2% | 42.8 | 81.5 | 83.8 | 2.8% | 95.78% | ||||||||
| Earnings before taxes | 1,327.3 | 601.3 | -54.7% | 690.8 | 428.8 | 172.2 | -59.8% | -75.1% | ||||||||
| Income tax expense | 1.9 | 25.8 | N.A. | -3.8 | 13.2 | 12.6 | -4.1% | N.A | ||||||||
| N.A | ||||||||||||||||
| Net income from continuing operations | 1,325.4 | 575.5 | -56.6% | 694.6 | 415.7 | 159.6 | -61.6% | -77.0% | ||||||||
| Discontinued operations | ||||||||||||||||
| Equity method income from discontinued operations | 1,100.7 | 0.0 | -100.0% | 0.0 | 0.0 | 0.0 | N.A | N.A | ||||||||
| Income from discontinued operations | 1,100.7 | 0.0 | -100.0% | 0.0 | 0.0 | 0.0 | N.A | N.A | ||||||||
| Net income | 2,426.1 | 575.3 | -76.3% | 694.6 | 415.7 | 159.6 | -61.6% | -77.0% | ||||||||
| 24 | |

DEFINITIONS
Cost of Risk calculated as Impairment loss on loans and other accounts receivable net of recoveries of charged-off assets divided by average gross loans
Efficiency Ratio is calculated as total other expenses divided by net interest income plus net income from commissions and fees, gross profit from sales of goods and services, net trading income, net income from other financial instruments mandatory at FVTPL and total other income
Fee income ratio is calculated as net income from commissions and fees divided by net interest income plus net income from commissions and fees, gross profit from sales of goods and services, net trading income, net income from other financial instruments mandatory at FVTPL and total other income.
Gross loans excludes interbank and overnight funds.
Interest Earning Assets are calculated as the sum of average gross loans, average
interbanks and average investments.
Net Interest Income is the difference between Total Interest Income and Total Interest Expense.
Net Interest Margin includes net interest income plus net trading income from debt and equity investments at FVTPL divided by total average interest-earning assets.
NIM on Loans is calculated as Net Interest Income on Loans to Average loans and financial leases.
NIM on Investments is calculated as Net Interest income on fixed income securities, net trading income from equity and fixed income investment securities held for trading through profit and on interbank and overnight funds to Average securities and Interbank and overnight funds
Non-controlling interest refers to the participation of minority shareholders in a subsidiary’s equity or net income.
ROAA is calculated as annualized Net Income divided by average of total assets.
ROAE is calculated as Net Income attributable to Aval's shareholders divided by average attributable shareholders' equity.
| 25 | |
Investor Relations Contact
INVESTORRELATIONS@grupoaval.com
Nicolás Noreña
Financial Planning and Investor Relations Senior Manager
Tel: +571 743 32 22 x 23400
E-mail: nnorena@grupoaval.com
Simón Franky
Strategic Planning and Investor Relations Director
Tel601 743 32 22 x 23351
Email sfranky@grupoaval com
Silvana Palacio
Investor Relations Analyst
Tel601 743 32 22 x 2337
Email mpalacio@grupoaval com
| 26 | |
EXHIBIT 1
CONSOLIDATED FINANCIAL STATEMENTS
 | KPMG S.A.S. Calle 90 No. 19c - 74 Bogotá D.C. - Colombia
| Phone | +57 (601) 618 8000 +57 (601) 618 8100 www.kpmg.com/co
|
(FREE TRANSLATION OF THE REPORT ORIGINALLY ISSUED IN SPANISH)
STATUTORY AUDITOR'S REPORT ON THE
EXTENSIBLE BUSINESS REPORTING LANGUAGE (XBRL) REPORT
To the Shareholders
Grupo Aval Acciones y Valores S.A.,
Introduction
I have reviewed the eXtensible Business Reporting Language (XBRL) Report as of June 30, 2023 of Grupo Aval Acciones y Valores S.A. and Subsidiaries (the Group), which incorporates the following consolidated interim financial information:
| · | the consolidated statement of financial position as at June 30, 2023; |
| · | the consolidated statement of income for the three- and six-month periods ended June 30, 2023; |
| · | the consolidated statement of other comprehensive income for the three- and six-month periods ended June 30, 2023; |
| · | the consolidated statement of changes in equity for the six-month period ended June 30, 2023; |
| · | the consolidated statement of cash flows for the six-month period ended June 30, 2023; and |
| · | the notes to the report. |
The Management is responsible for the preparation and presentation of this Report in eXtensible Business Reporting Language (XBRL) that incorporates the consolidated interim financial information in accordance with International Accounting Standard 34 (IAS 34) - Interim Financial Reporting contained in the Accounting and Financial Reporting Standards accepted in Colombia, and for the presentation of said Report in XBRL as instructed by the Financial Superintendence of Colombia. My responsibility is to express a conclusion on the aforementioned Report that incorporates the consolidated interim financial information, based on my review.
Scope of the Review
I have conducted my review in accordance with International Standard on Review Engagements 2410 - "Review of Interim Financial Information Performed by the Independent Auditor of the Entity", included in the Information Assurance Standards accepted in Colombia. A review of interim financial information consists of making inquiries, mainly with the persons responsible for financial and accounting matters, and the application of analytical and other review procedures. The scope of a review is substantially less than that of an audit performed in accordance with International Standards on Auditing accepted in Colombia and, consequently, does not allow me to obtain assurance that I am aware of all significant matters that I could have identified in an audit. Accordingly, I do not express an audit opinion.
© 2023 KPMG S.A.S., a Colombian joint-stock simplified corporation and member of the global organization of independent member firms of KPMG International Limited, a private English entity limited by guarantee. All rights reserved.
| KPMG S.A.S. Tax ID.: 860.000.846-4
|

Conclusion
Based on my review, nothing has come to my attention that causes me to believe that the XBRL Report, which incorporates the consolidated interim financial information of the Group as of June 30, 2023 has not been prepared, in all material respects, in accordance with International Accounting Standard 34 (IAS 34) - Interim Financial Reporting contained in the Accounting and Financial Reporting Standards accepted in Colombia, and the instructions of the Financial Superintendence of Colombia.
(Original file signed)
Diana Alexandra Rozo Muñoz
Statutory Auditor of Grupo Aval Acciones y Valores S.A.
Registration 120741-T
Member of KPMG S.A.S.
August 14, 2023
 | KPMG S.A.S. Calle 90 No. 19c - 74 Bogotá D.C. - Colombia
| Phone | +57 (601) 618 8000 +57 (601) 618 8100 www.kpmg.com/co
|
(FREE TRANSLATION OF THE REPORT ORIGINALLY ISSUED IN SPANISH)
STATUTORY AUDITOR’S REPORT ON THE REVIEW OF THE CONDENSED SEPARATE INTERIM FINANCIAL
INFORMATION
To the Shareholders
Grupo Aval Acciones y Valores S.A.,
Introduction
I have reviewed the accompanying condensed separate interim financial information as of June 30, 2023 of Grupo Aval Acciones y Valores S.A. (the Company), which comprises:
| · | the condensed separate statement of financial position as at June 30, 2023; |
| · | the condensed separate statement of income for the three- and six-month periods ended June 30, 2023; |
| · | the condensed separate statement of other comprehensive income for the three- and six-month periods ended June 30, 2023; |
| · | the condensed separate statement of changes in equity for the six-month period ended June 30, 2023; |
| · | the condensed separate statement of cash flows for the six-month period ended June 30, 2023; and |
| · | the notes to the condensed financial information. |
The Management is responsible for the preparation and fair presentation of this condensed separate interim financial information in accordance with International Accounting Standard 34 (IAS 34) - Interim Financial Information contained in the Accounting and Financial Reporting Standards accepted in Colombia. My responsibility is to express a conclusion on this condensed separate interim financial information based on my review.
Scope of the Review
I have conducted my review in accordance with International Standard on Review Engagements 2410 - "Review of Interim Financial Information Performed by the Independent Auditor of the Entity", included in the Information Assurance Standards accepted in Colombia. A review of condensed separate interim financial information consists of making inquiries, mainly with the persons responsible for financial and accounting matters, and the application of analytical and other review procedures. The scope of a review is substantially less than that of an audit performed in accordance with International Standards on Auditing accepted in Colombia and, consequently, does not allow me to obtain assurance that I am aware of all significant matters that I could have identified in an audit. Accordingly, I do not express an audit opinion.
Conclusion
© 2023 KPMG S.A.S., a Colombian joint-stock simplified corporation and member of the global organization of independent member firms of KPMG International Limited, a private English entity limited by guarantee. All rights reserved.
| KPMG S.A.S. Tax ID.: 860.000.846-4
|

Based on my review, nothing has come to my attention that causes me to believe that the accompanying condensed separate interim financial information of the Group as of June 30, 2023 has not been prepared, in all material respects, in accordance with International Accounting Standard 34 (IAS 34) - Interim Financial Reporting contained in the Accounting and Financial Reporting Standards accepted in Colombia.
(Original file signed)
Diana Alexandra Rozo Muñoz
Statutory Auditor of Grupo Aval Acciones y Valores S.A.
Registration 120741-T
Member of KPMG S.A.S.
August 14, 2023
Grupo Aval Acciones y Valores S.A. and Subsidiaries
Condensed Consolidated Statement of Financial Position
(Amounts expressed in millions of Colombian pesos)
| Notes | June 30, 2023 | December 31, 2022 | ||||||||
| Assets | ||||||||||
| Cash and cash equivalents | Ps. | 19,195,667 | Ps. | 17,032,857 | ||||||
| Trading assets | 13,256,089 | 11,841,407 | ||||||||
| Investment securities | 32,829,631 | 33,674,477 | ||||||||
| Hedging derivative assets | 4 | 69,427 | 20,854 | |||||||
| Loans, net | 4 | 177,912,548 | 179,115,847 | |||||||
| Other accounts receivable, net | 4 | 24,200,326 | 23,380,573 | |||||||
| Non-current assets held for sale | 117,544 | 92,830 | ||||||||
| Investments in associates and joint ventures | 6 | 1,211,400 | 1,423,343 | |||||||
| Tangible assets | 7 | 7,113,576 | 7,235,441 | |||||||
| Concessions arrangements rights | 8 | 13,558,614 | 13,242,706 | |||||||
| Goodwill | 9 | 2,215,172 | 2,248,217 | |||||||
| Other Intangibles | 2,176,317 | 2,040,158 | ||||||||
| Income tax assets | 3,682,128 | 3,633,876 | ||||||||
| Other assets | 523,135 | 608,650 | ||||||||
| Total assets | Ps. | 298,061,574 | Ps. | 295,591,236 | ||||||
| Liabilities and equity | ||||||||||
| Liabilities | ||||||||||
| Trading liabilities | 4 | Ps. | 1,859,861 | Ps. | 1,757,606 | |||||
| Hedging derivative liabilities | 4 | 8,868 | 3,568 | |||||||
| Customer deposits | 4 | 180,244,522 | 173,341,149 | |||||||
| Financial obligations | 4 | 66,923,900 | 72,116,775 | |||||||
| Provisions | 11 | 1,028,066 | 1,227,171 | |||||||
| Income tax liabilities | 5,576,624 | 5,291,487 | ||||||||
| Employee benefits | 12 | 842,400 | 890,019 | |||||||
| Other liabilities | 13 | 10,815,317 | 10,141,802 | |||||||
| Total liabilities | Ps. | 267,299,558 | Ps. | 264,769,577 | ||||||
| Equity | ||||||||||
| Owners of the parent: | ||||||||||
| Subscribed and paid-in capital | Ps. | 23,744 | Ps. | 23,744 | ||||||
| Additional paid-in capital | 9,571,374 | 9,571,374 | ||||||||
| Retained earnings | 7,584,503 | 8,018,417 | ||||||||
| Other comprehensive income | (714,174 | ) | (1,146,565 | ) | ||||||
| Equity attributable to owners of the parent | 16,465,447 | 16,466,970 | ||||||||
| Non-controlling interest | 14,296,569 | 14,354,689 | ||||||||
| Total equity | 30,762,016 | 30,821,659 | ||||||||
| Total liabilities and equity | Ps. | 298,061,574 | Ps. | 295,591,236 | ||||||
The accompanying notes are an integral part of the consolidated financial statements.
Grupo Aval Acciones y Valores S.A. and Subsidiaries
Condensed Consolidated Statement of Income
(Amounts expressed in millions of Colombian pesos)
| For the three-months periods ended June 30, | For the six-months periods ended June 30, | |||||||||||||||||
| Notes | 2023 | 2022 | 2023 | 2022 (1) | ||||||||||||||
| Continuing operations | ||||||||||||||||||
| Interest income | 4 | Ps. | 7,154,573 | Ps. | 4,286,674 | Ps. | 14,162,897 | Ps. | 8,046,465 | |||||||||
| Interest expense | 4 | (5,579,086 | ) | (2,312,320 | ) | (11,038,587 | ) | (3,991,500 | ) | |||||||||
| Net interest income | 1,575,487 | 1,974,354 | 3,124,310 | 4,054,965 | ||||||||||||||
| Net impairment loss on financial assets | (988,285 | ) | (566,799 | ) | (1,774,774 | ) | (1,262,221 | ) | ||||||||||
| Net interest income, after impairment losses | 587,202 | 1,407,555 | 1,349,536 | 2,792,744 | ||||||||||||||
| Income from commissions and fees | 1,108,866 | 912,818 | 2,193,396 | 1,907,893 | ||||||||||||||
| Expenses from commissions and fees | (224,977 | ) | (215,488 | ) | (467,204 | ) | (500,524 | ) | ||||||||||
| Net income from commissions and fees | 16 | 883,889 | 697,330 | 1,726,192 | 1,407,369 | |||||||||||||
| Income from sales of goods and services | 2,675,797 | 3,231,601 | 5,603,278 | 5,899,491 | ||||||||||||||
| Costs and expenses of sales goods and services | (2,056,571 | ) | (1,790,801 | ) | (3,820,414 | ) | (3,438,097 | ) | ||||||||||
| Gross profit from sales of goods and services | 16 | 619,226 | 1,440,800 | 1,782,864 | 2,461,394 | |||||||||||||
| Net trading loss | 17 | (783,145 | ) | 481,492 | (864,425 | ) | 194,147 | |||||||||||
| Net income from other financial instruments mandatorily at fair value through profit or loss | 76,579 | 68,429 | 170,528 | 142,337 | ||||||||||||||
| 6 | - | 0 | 0 | 0 | ||||||||||||||
| Other income | 18 | 1,516,570 | (390,668 | ) | 2,392,442 | 402,616 | ||||||||||||
| Other expenses | 18 | (2,089,168 | ) | (1,754,564 | ) | (4,166,180 | ) | (3,434,041 | ) | |||||||||
| Net income before tax expense | 811,153 | 1,950,374 | 2,390,957 | 3,966,566 | ||||||||||||||
| Income tax expense | 10 | (350,561 | ) | (564,290 | ) | (883,112 | ) | (1,197,240 | ) | |||||||||
| Net income from continuing operations | Ps. | 460,592 | Ps. | 1,386,084 | Ps. | 1,507,845 | Ps. | 2,769,326 | ||||||||||
| Discontinued operations | ||||||||||||||||||
| Net income from discontinued operations, net of tax | (1) | Ps. | - | Ps. | - | Ps. | - | Ps. | 1,597,512 | |||||||||
| Net income | Ps. | 460,592 | Ps. | 1,386,084 | Ps. | 1,507,845 | Ps. | 4,366,838 | ||||||||||
| Net income attributable to owners of the parent | ||||||||||||||||||
| Net income for the period from continuing operations | 166,211 | 675,488 | 591,300 | 1,307,119 | ||||||||||||||
| Net income for the period from discontinued operations, net of tax | (1) | - | - | - | 1,098,073 | |||||||||||||
| Owners of the parent | Ps. | 166,211 | Ps. | 675,488 | Ps. | 591,300 | Ps. | 2,405,192 | ||||||||||
| Net income attributable to non-controlling interests | ||||||||||||||||||
| Net income for the period from continuing operations | 294,381 | 710,596 | 916,545 | 1,462,207 | ||||||||||||||
| Net income for the period from discontinued operations, net of tax | (1) | - | - | - | 499,439 | |||||||||||||
| Non-controlling interests | Ps. | 294,381 | Ps. | 710,596 | Ps. | 916,545 | Ps. | 1,961,646 | ||||||||||
| Net Income | Ps. | 460,592 | Ps. | 1,386,084 | Ps. | 1,507,845 | Ps. | 4,366,838 | ||||||||||
| Net income per share basic and diluted (in Colombian pesos) | 14 | Ps. | 7.00 | Ps. | 29.65 | Ps. | 24.90 | Ps. | 106.75 | |||||||||

| (1) | See note 1.1 “Discontinued operations of BAC Holding”. |
The accompanying notes are an integral part of the consolidated financial statements.
Grupo Aval Acciones y Valores S.A. and Subsidiaries
Condensed Consolidated Statement of Other Comprehensive Income
(Amounts expressed in millions of Colombian pesos)
| For the three-months periods ended June 30, | For the six-months periods ended June 30, | |||||||||||||||||
| Notes | 2023 | 2022 | 2023 | 2022 | ||||||||||||||
| Net income | Ps. | 460,592 | Ps. | 1,386,084 | Ps. | 1,507,845 | Ps. | 4,366,838 | ||||||||||
| Other comprehensive income | ||||||||||||||||||
| Items that may be reclassified to profit or loss | ||||||||||||||||||
| Net gain (loss) on hedges of net investments in foreign operations | ||||||||||||||||||
| Foreign currency translation differences from hedged foreign operations | 5 | (383,011 | ) | 673,207 | (506,163 | ) | (6,832,516 | ) | ||||||||||
| Hedging derivative instrument | 5 | 0 | (881 | ) | 0 | 4,051,829 | ||||||||||||
| Hedging non-derivative instrument | 5 | 361,940 | (567,720 | ) | 482,180 | 2,589,366 | ||||||||||||
| Cash flow hedges | 4,868 | 1,460 | 1,754 | (4,242 | ) | |||||||||||||
| Foreign currency translation differences from unhedged foreign operations | (168,084 | ) | 113,746 | (233,158 | ) | 1,146,612 | ||||||||||||
| Investments in associates and joint ventures | (27,119 | ) | (124,896 | ) | (26,525 | ) | (128,427 | ) | ||||||||||
| Unrealized (losses) gains on securities at FVOCI | 503,528 | (780,321 | ) | 1,238,689 | (1,913,292 | ) | ||||||||||||
| Income tax | (318,349 | ) | 349,477 | (563,288 | ) | (2,027,578 | ) | |||||||||||
| (26,227 | ) | (335,928 | ) | Ps. | 393,489 | Ps. | (3,118,248 | ) | ||||||||||
| Items that will not be reclassified to profit or loss | ||||||||||||||||||
| Transfer from owner-occupied property to investment property | 0 | 199 | 0 | 199 | ||||||||||||||
| Gains (Losses) unrealized on equity securities at FVOCI | 131,172 | (260,883 | ) | 77,462 | (282,946 | ) | ||||||||||||
| Actuarial (losses) gains from defined benefit pension plans | (19,923 | ) | 46,782 | (19,924 | ) | 80,409 | ||||||||||||
| Income tax | 6,852 | (20,287 | ) | 6,830 | (31,245 | ) | ||||||||||||
| 118,101 | (234,189 | ) | Ps. | 64,368 | Ps. | (233,583 | ) | |||||||||||
| Other comprehensive income, net of taxes | 91,874 | (570,117 | ) | 457,857 | (3,351,831 | ) | ||||||||||||
| Total comprehensive income, net of taxes | Ps. | 552,466 | Ps. | 815,967 | Ps. | 1,965,702 | Ps. | 1,015,007 | ||||||||||
| Total comprehensive income for the periods attributable to: | ||||||||||||||||||
| Owners of the parent | Ps. | 299,883 | Ps. | 293,739 | 1,023,691 | 153,656 | ||||||||||||
| Non-controlling interest | 252,583 | 522,228 | 942,011 | 861,351 | ||||||||||||||
| Ps. | 552,466 | Ps. | 815,967 | Ps. | 1,965,702 | Ps. | 1,015,007 | |||||||||||
The accompanying notes are an integral part of the consolidated financial statements.
Grupo Aval Acciones y Valores S.A. and Subsidiaries
Consolidated Statement of Changes in Equity for the six-month periods ended June 30, 2023 and 2022 (Amounts expressed in millions of Colombian pesos)
| Subscribed and paid-in capital | Additional paid – in capital | Appropriated retained earnings | Other comprehensive income (OCI) | Equity attributable to owners of the parent | Non-controlling interest (NCI) | Total equity | ||||||||||||||||||||||
| Balance as of December 31, 2021 | Ps. | 22,281 | Ps. | 8,490,799 | Ps. | 13,383,391 | Ps. | 1,117,182 | Ps. | 23,013,653 | Ps. | 16,457,994 | Ps. | 39,471,647 | ||||||||||||||
| Issuance of shares | 1,463 | 1,082,307 | — | — | 1,083,770 | 572,136 | 1,655,906 | |||||||||||||||||||||
| Dividends declared in cash | — | — | (1,083,770 | ) | — | (1,083,770 | ) | (572,007 | ) | (1,655,777 | ) | |||||||||||||||||
| Dividends declared in cash | — | — | (119,405 | ) | — | (119,405 | ) | (550,390 | ) | (669,795 | ) | |||||||||||||||||
| Equity transactions | — | 13,241 | — | — | 13,241 | (13,241 | ) | — | ||||||||||||||||||||
| Spin Off(1) | — | — | (6,638,961 | ) | — | (6,638,961 | ) | (3,019,613 | ) | (9,658,574 | ) | |||||||||||||||||
| Effect of realization of equity instruments(1) | — | — | (5,432 | ) | — | (5,432 | ) | (6,093 | ) | (11,525 | ) | |||||||||||||||||
| Other comprehensive income | — | — | — | (2,251,536 | ) | (2,251,536 | ) | (1,100,295 | ) | (3,351,831 | ) | |||||||||||||||||
| Withholding Tax over dividends | — | — | 3,212 | — | 3,212 | (543 | ) | 2,669 | ||||||||||||||||||||
| Net income | — | — | 2,405,192 | — | 2,405,192 | 1,961,646 | 4,366,838 | |||||||||||||||||||||
| Balance as of June 30, 2022 | Ps. | 23,744 | Ps. | 9,586,347 | Ps. | 7,944,227 | Ps. | (1,134,354 | ) | Ps. | 16,419,964 | Ps. | 13,729,594 | Ps. | 30,149,558 | |||||||||||||
| Subscribed and paid-in capital | Additional paid – in capital | Appropriated retained earnings | Other comprehensive income (OCI) | Equity attributable to owners of the parent | Non-controlling interest (NCI) | Total equity | ||||||||||||||||||||||
| Balance as of December 31, 2022 | Ps. | 23,744 | Ps. | 9,571,374 | Ps. | 8,018,417 | Ps. | (1,146,565 | ) | Ps. | 16,466,970 | Ps. | 14,354,689 | Ps. | 30,821,659 | |||||||||||||
| Issuance of shares | — | — | — | — | — | — | — | |||||||||||||||||||||
| Dividends declared in cash | — | — | (1,025,718 | ) | — | (1,025,718 | ) | (1,014,789 | ) | (2,040,507 | ) | |||||||||||||||||
| Other comprehensive income | — | — | — | 432,391 | 432,391 | 25,466 | 457,857 | |||||||||||||||||||||
| Withholding Tax over dividends | — | — | 504 | — | 504 | 14,658 | 15,162 | |||||||||||||||||||||
| Net income | — | — | 591,300 | — | 591,300 | 916,545 | 1,507,845 | |||||||||||||||||||||
| Balance as of June 30, 2023 | Ps. | 23,744 | Ps. | 9,571,374 | Ps. | 7,584,503 | Ps. | (714,174 | ) | Ps. | 16,465,447 | Ps. | 14,296,569 | Ps. | 30,762,016 | |||||||||||||

(1) See note 1.1 “Discontinued operations of BAC Holding”.
The accompanying notes are an integral part of the consolidated financial statements.
Grupo Aval Acciones y Valores S.A. and Subsidiaries
Condensed Consolidated Statement of Cash Flows for the six-month periods ended June 30, 2023 and 2022
(Amounts expressed in millions of Colombian pesos)
| … | Notes | June 30, 2023 | June 30, 2022 (1) | |||||||
| Cash flows from operating activities: | ||||||||||
| Net income before income tax | Ps. | 2,390,957 | Ps. | 3,966,566 | ||||||
| Reconciliation of net income before taxes and net cash provided by operating activities: | ||||||||||
| Depreciation and amortization | 16-18 | 562,169 | 533,926 | |||||||
| Impairment losses of loans and receivables, net | 4-16 | 2,089,746 | 1,551,680 | |||||||
| Net income in concession agreements | (2,222,425 | ) | (2,648,074 | ) | ||||||
| Net interest income | (3,124,310 | ) | (4,054,965 | ) | ||||||
| Sales of non-current assets held for sale, net | (21,193 | ) | (5,517 | ) | ||||||
| Gain on sales of tangible assets | (101,106 | ) | (14,967 | ) | ||||||
| Foreign exchange losses | 18 | (1,684,847 | ) | 333,290 | ||||||
| Share of profit of equity accounted investees, net of tax | 18 | (194,276 | ) | (341,888 | ) | |||||
| Dividends caused | 18 | (122,046 | ) | (108,630 | ) | |||||
| Fair value adjustments on: | ||||||||||
| Derivatives | 17 | 1,847,476 | (324,107 | ) | ||||||
| Non-current assets held for sale | (142 | ) | 158 | |||||||
| Investment property | 32,497 | (13,379 | ) | |||||||
| Biological assets | (7,284 | ) | (9,050 | ) | ||||||
| Changes in operating assets and liabilities: | ||||||||||
| Derivatives | (1,675,141 | ) | 429,022 | |||||||
| Trading assets | (1,306,429 | ) | 668,252 | |||||||
| Accounts receivable | (1,038,184 | ) | 99,908 | |||||||
| Other assets | (72,588 | ) | (24,129 | ) | ||||||
| Other liabilities and provisions | (428,869 | ) | (208,182 | ) | ||||||
| Employee benefit | (139,822 | ) | (49,363 | ) | ||||||
| Loan portfolio | (11,753,255 | ) | (12,267,881 | ) | ||||||
| Customer deposits | 10,328,635 | 11,308,833 | ||||||||
| Interbank borrowings and overnight funds | 4,353,468 | 251,330 | ||||||||
| Borrowings from development entities | (257,965 | ) | 1,845 | |||||||
| Borrowings from banks | (3,433,623 | ) | 3,874,364 | |||||||
| Interest received | 19,347,490 | 7,157,283 | ||||||||
| Interest paid | (9,983,489 | ) | (3,779,107 | ) | ||||||
| Lease interest | (87,908 | ) | (74,927 | ) | ||||||
| Income tax payments | (1,335,382 | ) | (982,108 | ) | ||||||
| Net cash provided by operating activities | Ps. | 1,962,154 | Ps. | 5,270,183 | ||||||
| Cash flows from investing activities: | ||||||||||
| Purchases of amortized cost financial assets | Ps. | (4,254,988 | ) | Ps. | (3,751,243 | ) | ||||
| Redemptions of amortized cost financial assets | 4,365,996 | 3,439,631 | ||||||||
| Purchases of FVOCI | (8,210,405 | ) | (5,752,138 | ) | ||||||
| Proceeds from sales of FVOCI | 9,956,352 | 6,990,738 | ||||||||
| Acquisition of associates investment and join ventures | — | (2,667 | ) | |||||||
| Purchases tangible assets | (247,840 | ) | (165,664 | ) | ||||||
| Proceeds from sales of property, plant and equipment | 66,574 | 79,749 | ||||||||
| Proceeds from sales of non-current assets held for sale | 22,150 | 17,590 | ||||||||
| Additions of concession arrangement rights | 1,074,882 | (496,085 | ) | |||||||
| Additions of other intangible assets | (215,357 | ) | (216,687 | ) | ||||||
| Dividends received | 283,857 | 272,264 | ||||||||
| (Decrease) to deconsolidation of subsidiaries | — | (17,570,390 | ) | |||||||
| Net cash provided (used) in by investing activities | Ps. | 2,841,221 | Ps. | (17,154,902 | ) | |||||
| Cash flows from financing activities: | ||||||||||
| Dividends paid to shareholders | Ps. | (256,500 | ) | Ps. | (409,876 | ) | ||||
| Dividends paid to non-controlling interest | (340,372 | ) | (421,326 | ) | ||||||
| Issuance of debt securities | 2,592,076 | 543,355 | ||||||||
| Payment of outstanding debt securities | (3,323,937 | ) | (964,283 | ) | ||||||
| Leases | (203,338 | ) | (183,880 | ) | ||||||
| Issuance of shares | — | 129 | ||||||||
| Net cash used by financing activities | Ps. | (1,532,071 | ) | Ps. | (1,435,881 | ) | ||||
| Effect of foreign currency changes on cash and equivalents | (1,108,494 | ) | (487,517 | ) | ||||||
| Decrease in cash and cash equivalents in joint operations | — | (1,393,602 | ) | |||||||
| Increase (decrease) in cash and cash equivalents | 2,162,810 | (15,201,719 | ) | |||||||
| Cash and cash equivalents at beginning of period | Ps. | 17,032,857 | Ps. | 36,642,829 | ||||||
| Cash and cash equivalents at end of period | Ps. | 19,195,667 | Ps. | 21,441,110 | ||||||

(1) See note 1.1 “Discontinued operations of BAC Holding”.
The accompanying notes are an integral part of the consolidated financial statements.
EXHIBIT 2
SEPARATE FINANCIAL STATEMENTS
 | KPMG S.A.S. Calle 90 No. 19c - 74 Bogotá D.C. - Colombia
| Phone | +57 (601) 618 8000 +57 (601) 618 8100 www.kpmg.com/co
|
(FREE TRANSLATION OF THE REPORT ORIGINALLY ISSUED IN SPANISH)
STATUTORY AUDITOR’S REPORT ON THE REVIEW OF THE CONDENSED SEPARATE INTERIM FINANCIAL
INFORMATION
To the Shareholders
Grupo Aval Acciones y Valores S.A.,
Introduction
I have reviewed the accompanying condensed separate interim financial information as of June 30, 2023 of Grupo Aval Acciones y Valores S.A. (the Company), which comprises:
| · | the condensed separate statement of financial position as at June 30, 2023; |
| · | the condensed separate statement of income for the three- and six-month periods ended June 30, 2023; |
| · | the condensed separate statement of other comprehensive income for the three- and six-month periods ended June 30, 2023; |
| · | the condensed separate statement of changes in equity for the six-month period ended June 30, 2023; |
| · | the condensed separate statement of cash flows for the six-month period ended June 30, 2023; and |
| · | the notes to the condensed financial information. |
The Management is responsible for the preparation and fair presentation of this condensed separate interim financial information in accordance with International Accounting Standard 34 (IAS 34) - Interim Financial Information contained in the Accounting and Financial Reporting Standards accepted in Colombia. My responsibility is to express a conclusion on this condensed separate interim financial information based on my review.
Scope of the Review
I have conducted my review in accordance with International Standard on Review Engagements 2410 - "Review of Interim Financial Information Performed by the Independent Auditor of the Entity", included in the Information Assurance Standards accepted in Colombia. A review of condensed separate interim financial information consists of making inquiries, mainly with the persons responsible for financial and accounting matters, and the application of analytical and other review procedures. The scope of a review is substantially less than that of an audit performed in accordance with International Standards on Auditing accepted in Colombia and, consequently, does not allow me to obtain assurance that I am aware of all significant matters that I could have identified in an audit. Accordingly, I do not express an audit opinion.
Conclusion
| © 2023 KPMG S.A.S., a Colombian joint-stock simplified corporation and member of the global organization of independent member firms of KPMG International Limited, a private English entity limited by guarantee. All rights reserved. | KPMG S.A.S. Tax ID.: 860.000.846-4 |

Based on my review, nothing has come to my attention that causes me to believe that the accompanying condensed separate interim financial information of the Group as of June 30, 2023 has not been prepared, in all material respects, in accordance with International Accounting Standard 34 (IAS 34) - Interim Financial Reporting contained in the Accounting and Financial Reporting Standards accepted in Colombia.
(Original file signed)
Diana Alexandra Rozo Muñoz
Statutory Auditor of Grupo Aval Acciones y Valores S.A.
Registration 120741-T
Member of KPMG S.A.S.
Member of KPMG S.A.S.
August 14, 2023
| GRUPO AVAL ACCIONES Y VALORES S.A. | ||
| Statement of financial position | ||
| For the period ended as of june 30th 2023 and december 31st 2022 | ||
| (Stated in millions of Colombian pesos) | ||
| June 30th | December 31st | |||||||||
| Notes | 2023 | 2022 | ||||||||
| Assets | ||||||||||
| Current assets | ||||||||||
| Cash and cash equivalents | 5 | Ps. | 178,172 | 67,439 | ||||||
| Trading securities | 4 | 199 | 764 | |||||||
| Accounts receivable from related parties | 6 | 768,479 | 96,081 | |||||||
| Taxes paid in advance | 6 | 5,952 | 7,577 | |||||||
| Other accounts receivable | 6 | 7 | 161 | |||||||
| Other non-financial assets | 99 | 52 | ||||||||
| Total current assets | 952,908 | 172,074 | ||||||||
| Non-current Assets | ||||||||||
| Investments in subsidiaries and associates | 7 | Ps. | 18,354,911 | 18,361,916 | ||||||
| Accounts receivable from related parties | 6 | 1,327,947 | 1,498,754 | |||||||
| Property and equipment, net | 8 | 3,152 | 4,083 | |||||||
| Deferred tax assets | 253 | 127 | ||||||||
| Total non-current Assets | 19,686,263 | 19,864,880 | ||||||||
| Total assets | 20,639,171 | 20,036,954 | ||||||||
Liabilities and shareholders' equity
Current liabilities
| Borrowings at amortized cost | 10 | Ps. | 1,148,082 | 20,255 | ||||||
| Outstanding bonds at amortized cost | 10 | 14,273 | 14,093 | |||||||
| Accounts payable | 12 | 873,344 | 106,101 | |||||||
| Employee benefits | 11 | 2,382 | 2,486 | |||||||
| Tax liabilities | 12 | 15,385 | 11,920 | |||||||
| Other non-financial liabilities | 12 | 1,214 | 1,214 | |||||||
| Total current liabilities | 2,054,680 | 156,069 | ||||||||
Long-term liabilities Borrowings at amortized cost | 10 | Ps. | 494,667 | 1,794,089 | ||||||
| Outstanding bonds | 10 | 1,124,520 | 1,124,520 | |||||||
| Total long-term liabilities | 1,619,187 | 2,918,609 | ||||||||
| Total liabilities | Ps. | 3,673,867 | 3,074,678 | |||||||
Shareholders' equity Subscribed and paid capital | 13 | Ps. | 23,743 | 23,743 | ||||||
| Additional paid-in capital | 13 | 9,695,243 | 9,695,243 | |||||||
| Retained earnings | 13 | 7,457,219 | 5,939,430 | |||||||
| Net income | 575,539 | 2,541,179 | ||||||||
| Other equity accounts | 13 | (786,440 | ) | (1,237,319 | ) | |||||
| Total shareholders' equity | Ps. | 16,965,304 | 16,962,276 | |||||||
Total liabilities and shareholders' equity | Ps. | 20,639,171 | 20,036,954 |
GRUPO AVAL ACCIONES Y VALORES S.A.
Statement of income
(Stated in millions of Colombian pesos, except earnings per share)
| For the quarter period | For the accumulated period | |||||||||||||||||
| June 30th | June 30th | June 30th | June 30th | |||||||||||||||
| 2023 | 2022 | 2023 | 2022 | |||||||||||||||
| Notes | ||||||||||||||||||
| Operating revenue | ||||||||||||||||||
| Equity method income, net | 15 | Ps. | 158,553 | Ps. | 683,609 | Ps. | 571,049 | Ps. | 1,314,292 | |||||||||
| Other revenue from ordinary activities | 15 | 117,766 | 73,050 | 234,376 | 145,423 | |||||||||||||
| Total operating revenue | Ps. | 276,319 | Ps. | 756,659 | Ps. | 805,425 | Ps. | 1,459,715 | ||||||||||
| Expenses, net | ||||||||||||||||||
| Administrative expenses | 16 | Ps. | 19,958 | Ps. | 21,730 | Ps. | 38,671 | Ps. | 54,278 | |||||||||
| Other expenses | 16 | (112 | ) | 892 | (211 | ) | 906 | |||||||||||
| revenue from exchange differences | 16 | 472 | 453 | 342 | 411 | |||||||||||||
| Operating income | Ps. | 256,001 | Ps. | 733,584 | Ps. | 766,623 | Ps. | 1,404,120 | ||||||||||
| Financial expenses | 16 | 83,786 | 42,797 | 165,318 | 76,837 | |||||||||||||
| Earnings before taxes | Ps. | 172,215 | Ps. | 690,787 | Ps. | 601,305 | Ps. | 1,327,283 | ||||||||||
| Income tax expense | 12,616 | (3,836 | ) | 25,766 | 1,882 | |||||||||||||
| Net income from continuing operations | Ps. | 159,599 | Ps. | 694,623 | Ps. | 575,539 | Ps. | 1,325,401 | ||||||||||
| Discontinued operations | ||||||||||||||||||
| Equity method income from discontinued operations | 15 | 0 | 0 | 0 | 1,100,730 | |||||||||||||
| Income from discontinued operations | Ps. | 0 | Ps. | 0 | Ps. | 0 | Ps. | 1,100,730 | ||||||||||
| Net income | Ps. | 159,599 | Ps. | 694,623 | Ps. | 575,539 | Ps. | 2,426,131 | ||||||||||
| Net income per share from continuing operations | 6.72 | 30.83 | 24.24 | Ps. | 58.83 | |||||||||||||
| Net income per share from discontinued operations | 0.00 | 0.00 | 0.00 | Ps. | 48.85 | |||||||||||||
GRUPO AVAL ACCIONES Y VALORES S.A.
Statement of Other Comprehensive Income
(Stated in millions of Colombian pesos)
IFRS
| For the quarter period | For the accumulated period | |||||||||||||||
| June 30th | June 30th | June 30th | June 30th | |||||||||||||
| 2023 | 2022 | 2023 | 2022 | |||||||||||||
| Net income | Ps. | 159,599 | 694,623 | 575,539 | Ps. | 2,426,131 | ||||||||||
| Other comprehensive income (OCI), net of taxes | ||||||||||||||||
| Participation in other comprehensive income | ||||||||||||||||
| reported using the equity method | 125,442 | (398,050 | ) | 450,879 | (2,265,641 | ) | ||||||||||
| Comprehensive income, net | Ps. | 285,041 | 296,573 | 1,026,418 | Ps. | 160,490 | ||||||||||
GRUPO AVAL ACCIONES Y VALORES S.A.
Statement of shareholders' equity
For the period ended as of june 30th 2023
(Stated in million of Colombian pesos)
| Retained earnings (losses) | ||||||||||||||||||||||||||||||||||||
| Subscribed and paid capital | Paid-in Capital | Legal reserve | Occasional reserve | Retained earnings (losses) | Operations with shareholders | Net Income | Other equity accounts | Shareholders' equity | ||||||||||||||||||||||||||||
| Balance as of december 31 st. 2021 | Ps. | 22,281 | Ps. | 8,612,936 | 11,140 | Ps. | 10,706,543 | Ps. | (393,822 | ) | Ps. | - | Ps. | 3,502,758 | Ps. | 1,013,600 | Ps. | 23,475,436 | ||||||||||||||||||
| Constitution of reserves for future distributions net income 2021 | 3,502,758 | (3,502,758 | ) | - | ||||||||||||||||||||||||||||||||
| Reserve appropriation | (188,208 | ) | 188,208 | - | ||||||||||||||||||||||||||||||||
| To distribute a stock dividend of Ps. 54 per share , over 22,281,017,159 shares outstanding as of december 31st 2021. These dividends will be paid at the rate of 1 share for each 13.74233 common or preferential shares as of december 31st, 2021. | (1,203,175 | ) | (1,203,175 | ) | ||||||||||||||||||||||||||||||||
| Issuance of shares | 1,462 | 1,082,307 | 1,083,769 | |||||||||||||||||||||||||||||||||
| Application of the equity method | (1,547,423 | ) | (1,547,423 | ) | ||||||||||||||||||||||||||||||||
| Application of the equity method (Spin-off) | (6,644,277 | ) | (718,218 | ) | (7,362,495 | ) | ||||||||||||||||||||||||||||||
| Witholding tax on dividends | 636 | 636 | ||||||||||||||||||||||||||||||||||
| Net Income | 2,426,131 | 2,426,131 | ||||||||||||||||||||||||||||||||||
| Balance as of June 30th 2022 | Ps. | 23,743 | Ps. | 9,695,243 | 11,140 | Ps. | 12,817,918 | Ps. | (204,978 | ) | Ps. | (6,644,277 | ) | Ps. | 2,426,131 | Ps. | (1,252,041 | ) | Ps. | 16,872,879 | ||||||||||||||||
| Balance as of december 31st 2022 | Ps. | 23,743 | Ps. | 9,695,243 | 11,872 | Ps. | 12,817,186 | Ps. | (245,351 | ) | Ps. | (6,644,277 | ) | Ps. | 2,541,179 | Ps. | (1,237,319 | ) | Ps. | 16,962,276 | ||||||||||||||||
| Constitution of reserves for future distributions net income 2022 | 2,541,179 | (2,541,179 | ) | - | ||||||||||||||||||||||||||||||||
| Reserve appropriation | (7,111,764 | ) | 467,487 | 6,644,277 | - | |||||||||||||||||||||||||||||||
| To distribute a cash dividend of Ps. 3.60 per share per month from April 2023 to March 2024 including those two months, over 23.743.475.754 outstanding shares as of the date of this meeting. | (1,025,718 | ) | (1,025,718 | ) | ||||||||||||||||||||||||||||||||
| Issuance of shares | - | |||||||||||||||||||||||||||||||||||
| Application of the equity method | 450,879 | 450,879 | ||||||||||||||||||||||||||||||||||
| Witholding tax on dividends | 2,328 | 2,328 | ||||||||||||||||||||||||||||||||||
| Net Income | 575,539 | 575,539 | ||||||||||||||||||||||||||||||||||
| Balance as of June 30th 2023 | Ps. | 23,743 | Ps. | 9,695,243 | 11,872 | Ps. | 7,220,883 | Ps. | 224,464 | Ps. | 0 | Ps. | 575,539 | Ps. | (786,440 | ) | Ps. | 16,965,304 | ||||||||||||||||||
GRUPO AVAL ACCIONES Y VALORES S.A.
Individual statement of cash flow
For the period ended as of june 30th 2023 and 2022
(Stated in millions of Colombian pesos)
| For the accumulated period | ||||||||||
| June 30th | June 30th | |||||||||
| Notes | 2023 | 2022 | ||||||||
| Cash flow from operating activity: | ||||||||||
| Net Income | 575,539 | Ps. | 2,426,131 | |||||||
| Adjustments to reconcile net profit with net cash used in operating activities | ||||||||||
| Income tax expense | 25,766 | Ps. | 1,882 | |||||||
| Property and equipment depreciation and amortization | 16 | 838 | 872 | |||||||
| Impairment of receivables | 6 | (238 | ) | - | ||||||
| Equity method income | 15 | (571,049 | ) | (1,314,292 | ) | |||||
| Equity method income from discontinued operations | 15 | - | (1,100,730 | ) | ||||||
| Changes in operating assets and liabilities: | ||||||||||
| Decrease (Increase) in trading securities | 565 | (636 | ) | |||||||
| Decrease in receivables | - | 825,252 | ||||||||
| Acquisition of permanent investments | - | (823,597 | ) | |||||||
| Increase in interest receivables | (609 | ) | - | |||||||
| Decrease in other assets and liabilities, net: prepaid taxes, prepaid expenses; taxes, accounts payable, employee liabilities, estimated liabilities and provisions. | (21,923 | ) | (16,257 | ) | ||||||
| Increase in interests payable | 344 | 5,449 | ||||||||
| Interest payment on lease agreements (IFRS 16) | 16 | (267 | ) | (124 | ) | |||||
| Dividends received by subsidiaries | 358,854 | 375,659 | ||||||||
| Income tax paid | - | (3,354 | ) | |||||||
| Net cash used in operating activities | 367,820 | Ps. | 376,255 | |||||||
| Cash flow from investing activities: | ||||||||||
| Acquisition of property and equipment | - | (55 | ) | |||||||
| Net cash used in investing activities | - | Ps. | (55 | ) | ||||||
| Cash flow from financing activities: | ||||||||||
| Dividends paid | (256,500 | ) | (409,876 | ) | ||||||
| Payment of liabilities arising from lease agreements | 10 | (587 | ) | (656 | ) | |||||
| Net cash from financing activities | (257,087 | ) | Ps. | (410,532 | ) | |||||
| Change in cash and cash equivalents | 110,733 | (34,332 | ) | |||||||
| Cash and cash equivalents as of the beginning of the period | 67,439 | 174,784 | ||||||||
| Cash and cash equivalents as of the end of the period | 178,172 | Ps. | 140,452 | |||||||
| Additional information: | ||||||||||
| Payment of Interest | 165,228 | Ps. | 71,462 | |||||||
SIGNATURE
Pursuant to the requirements of the Securities Exchange Act of 1934, the registrant has duly caused this report to be signed on its behalf by the undersigned, thereunto duly authorized.
Date: August 15, 2023
| GRUPO AVAL ACCIONES Y VALORES S.A. | |||||
| By: | /s/ Jorge Adrián Rincón Plata | ||||
| Name: | Jorge Adrián Rincón Plata | ||||
| Title: | Chief Legal Counsel | ||||