UNITED STATES
SECURITIES AND EXCHANGE COMMISSION
Washington, D.C. 20549
FORM N-CSR
CERTIFIED SHAREHOLDER REPORT OF REGISTERED MANAGEMENT INVESTMENT COMPANIES
Investment Company Act file number 811-22492
MainGate Trust
(Exact name of registrant as specified in charter)
6075 Poplar Avenue, Suite 402, Memphis, TN 38119
(Address of principal executive offices) (Zip code)
Geoffrey Mavar
6075 Poplar Avenue, Suite 402, Memphis, TN 38119
(Name and address of agent for service)
(901) 537-1866
Registrant's telephone number, including area code
Date of fiscal year end: November 30
Date of reporting period: November 30, 2012
Item 1. Reports to Stockholders.
MainGate MLP Fund
Class A (AMLPX)
Class I (IMLPX)
6075 Poplar Avenue, Suite 402 | Memphis, TN 38119 | 855.MLP.FUND (855.657.3863) | www.maingatefunds.com
Annual Report
November 30, 2012
| | |
| | |
| 5 |
| | |
| 9 |
| | |
| 9 |
| | |
| 10 |
| | |
| 11 |
| | |
| 11 |
| | |
| 12 |
| | |
| 12 |
| | |
| 13 |
| | |
| 14 |
| | |
| 15 |
| | |
| 16 |
| | |
| 21 |
| | |
| 22 |
| | |
| 23 |
| | |
| 24 |
| | |
| 25 |
MainGate mlp fund
We continue to believe that the investment future for MLPs remains bright. MLPs may offer investors the distinct opportunity for a combination of competitive yields coupled with the potential for growth. We believe this combination of income and growth potential may lead to an opportunity for solid total returns for MLPs and the Fund.
Fund Return
The MainGate MLP Fund (“Fund”) had the following returns through its fiscal year-end of November 30, 2012 compared to the S&P 500 Index:
| Annualized Return | | 1 Year |
| MainGate MLP Fund – Class A (without load) | 12.89% |
| MainGate MLP Fund – Class A (with 5.75% load) | 6.35% |
| MainGate MLP Fund – Class I | 13.06% |
| S&P 500 Index | 16.13% |
During the prior fiscal year ended November 30, 2012, the Fund benefitted from healthy MLP distributions and growth from the Fund’s MLP positions. The Fund had weaker relative returns than the broader market (as measured by the S&P 500 Index) which may have been influenced by heavy MLP equity issuance and general uncertainties surrounding the changes associated with the fiscal cliff. Market participants may have been more attracted to the broader market than to the opportunity for a combination of quarterly distributions and growth in the MLP market.
Overview
The Federal Reserve continued its Quantitative Easing strategy over the past year which has been successful in achieving the intended effect of lowering the market yield on fixed income and other yield oriented securities. We believe that investors should be prepared for the continuation of a low yield investment environment based on recent Federal Open Market Committee (“FOMC”) statement:
| | “To support continued progress toward maximum employment and price stability, the Committee expects that a highly accommodative stance of monetary policy will remain appropriate for a considerable time after the economic recovery strengthens. In particular, the Committee also decided today to keep the target range for the federal funds rate at 0 to 1/4 percent and currently anticipates that exceptionally low levels for the federal funds rate are likely to be warranted at least through mid-2015.” | |
Board of Governors of the Federal Reserve System, FOMC Statement, September 13, 2012
ANNUAL REPORT 2012 • 5
In addition to their attractive historical yield, we believe growth may remain robust for MLPs due to (1) structural growth factors such as higher volumes and rate increases, (2) organic growth projects, and (3) accretive acquisitions.
For example, petroleum pipelines received an annual rate increase of the Producer Price Index (“PPI”) + 2.65% in the current environment. This formula generated an 8.6% rate increase for interstate petroleum pipelines regulated by the Federal Energy Regulatory commission (“FERC”) in July 2012.
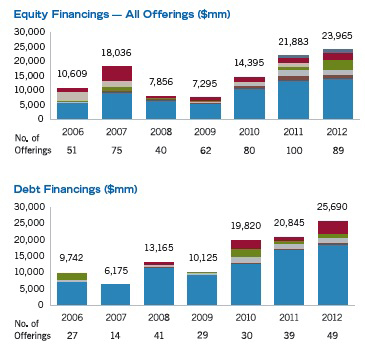
Organic growth projects continue in the various energy basins such as the Bakken, Eagle Ford, Marcellus, and Permian. During 2012, expected organic growth projects totaled $23.7 billion of new investment. In June 2011, the Interstate Natural Gas Association of America’s foundation, the INGAA Foundation, Inc. (“INGAA”) released its study that outlined the need for an additional $205 billion of new gas infrastructure through 2035. INGAA expects over $8 billion of average annual expenditure for gas infrastructure through 2035. New infrastructure is expected to be constructed for gas storage, gathering and processing, and mainline gas transmission pipelines.
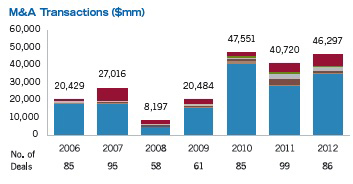
Lastly, the acquisition market has been strong over the past year. Total merger and acquisition (“M&A”) volume for the MLP market stood at $46 billion through November 30, 2012.
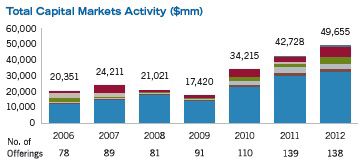
MLP capital markets were very active during 2012, with MLPs accessing over $49 billion of capital, consisting of $23 billion in equity through 89 offerings, and $25 billion of debt through 49 offerings as of November 30, 2012.
6 | MainGate mlp fund
Outlook
We believe the average MLP may have the potential grow its distribution at a 5-6% rate over the next year. With steady valuations, the MLP market could offer the possibility of attractive total returns supported by a healthy yield.
The Fund has exposure to sectors which may benefit from new infrastructure investment opportunities. Sectors such as the Natural Gas/Natural Gas Liquid Pipelines and Storage sector could provide healthy returns to the Fund. We believe that the third largest position in the Fund, Enterprise Product Partners, LP (EPD, $51.83), is well positioned to potentially benefit from future growth opportunities associated with the development of natural gas infrastructure. The Crude/Refined Products Pipelines and Storage sector may benefit from the potential growth of domestic onshore production and is represented with our largest holding, Plains All American Pipeline, LP (PAA, $46.58). In addition, the Fund has exposure to the Natural Gas Gathering/Processing sector with the Fund’s second largest position, Copano Energy, LLC (CPNO, $31.53), and the Fund’s fifth largest position, Crosstex Energy, Inc. (XTXI, $12.85), as of November 30, 2012.
We believe an environment supported by the need for additional energy infrastructure could provide an attractive investment climate for the Fund.
Sincerely,
 |  |
Geoffrey P. Mavar, Chairman | Matthew G. Mead, CEO |
ANNUAL REPORT 2012 • 7
Past performance is not a guarantee of future results.
Opinions expressed are those of MainGate and are subject to change, are not guaranteed, and should not be considered investment advice.
The information contained in this report is authorized for use when preceded or accompanied by a prospectus.
Mutual fund investing involves risk. Principal loss is possible. The Fund is nondiversified, meaning it may concentrate its assets in fewer individual holdings than a diversified fund. Therefore, the Fund is more exposed to individual security price volatility than a diversified fund. The Fund will invest in Master Limited Partnerships (MLPs) which concentrate investments in the natural resource sector and are subject to the risks of energy prices and demand and the volatility of commodity investments. Damage to facilities and infrastructure of MLPs may significantly affect the value of an investment and may incur environmental costs and liabilities due to the nature of their business. MLPs are subject to significant regulation and may be adversely affected by changes in the regulatory environment. Investments in smaller companies involve additional risks, such as limited liquidity and greater volatility. Investments in foreign securities involve greater volatility and political, economic and currency risks and differences in accounting methods. MLPs are subject to certain risks inherent in the structure of MLPs, including complex tax structure risks, limited ability for election or removal of management, limited voting rights, potential dependence on parent companies or sponsors for revenues to satisfy obligations, and potential conflicts of interest between partners, members and affiliates.
Producer Price Index (PPI): Measures the average change over time in the selling prices received by domestic producers for their output.
Public GP: Refers to publicly traded shares of entities that own and control the general partner interest of an MLP.
E&P: Refers to Exploration and Production energy MLPs which are engaged in the exploration and production of oil and gas properties.
S&P 500 Index: A broad based unmanaged index of 500 stocks, which is widely recognized as representative of the equity market in general.
You cannot invest directly in an index.
Fund holdings and sector allocations are subject to change at any time and should not be considered a recommendation to buy or sell any security. Please refer to the schedule of investments for a complete listing of fund holdings.
The Fund does not receive the same tax benefits of a direct investment in an MLP.
The Fund is subject to U.S. federal income tax on its taxable income at rates applicable to corporations (currently at a maximum rate of 35%) as well as state and local income taxes.
The Fund accrues deferred income taxes for future tax liabilities associated with the portion of MLP distributions considered to be a tax-deferred return of capital and for any net operating gains as well as capital appreciation of its investments. This deferred tax liability is reflected in the daily NAV and as a result the MLP Fund’s after-tax performance could differ significantly from the underlying assets even if the pre-tax performance is closely tracked.
The potential tax benefits from investing in MLPs depend on MLPs being treated as partnerships for federal income tax purposes.
If the MLP is deemed to be a corporation then its income would be subject to federal taxation, reducing the amount of cash available for distribution to the Fund which could result in a reduction of the Fund’s value.
The MainGate MLP Fund is distributed by Quasar Distributors, LLC.
8 | MainGate mlp fund
unaudited
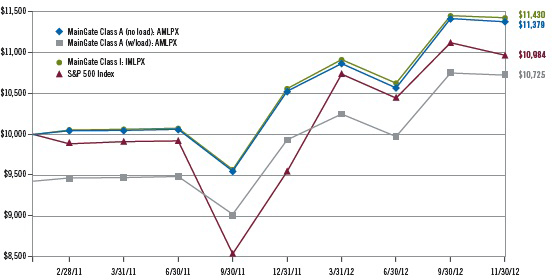
This chart illustrates the performance of a hypothetical $10,000 investment made in the Fund as of the Fund’s inception date on 2/17/11. Assumes reinvestment of dividends and capital gains. This chart does not imply any future performance.
November 30, 2012
| | | | | | | |
| | 1 Year | | Since Fund’s Inception | | Inception Date | |
| Class A (without sales load) | 12.89% | | 7.51% | | 2/17/11 | |
| Class A (with sales load) | 6.35% | | 4.00% | | 2/17/11 | |
| Class I | 13.06% | | 7.78% | | 2/17/11 | |
| S&P 500 Index | 16.13% | | 5.41% | | n/a | |
Performance data quoted represents past performance; past performance does not guarantee future results. The investment return and principal value of an investment will fluctuate so that an investor’s shares, when redeemed, may be worth more or less than their original cost. Current performance of the Fund may be lower or higher than the performance quoted. Performance data current to the most recent month end may be obtained by calling 855.MLP.FUND (855.657.3863) or by visiting www.maingatefunds.com.
Class A and Class I shares were first available on February 17, 2011.
Class A (with sales load) performance reflects the maximum sales charge of 5.75%. Class I is not subject to a sales charge.
The S&P 500 Index is a broad based unmanaged index of 500 stocks, which is widely recognized as representative of the equity market in general. You cannot invest directly in an index.
The graph and table do not reflect the deduction of taxes that a shareholder would pay on Fund distributions or the redemption of the Fund shares.
ANNUAL REPORT 2012 • 9

As a shareholder of the Fund, you incur two types of costs: (1) transaction costs, including sales charges (loads) on purchase payments, reinvested dividends, or other distributions; and exchange fees; and (2) ongoing costs, including management fees; distribution and/or service (12b-1) fees; and other Fund expenses. This example is intended to help you understand your ongoing costs (in dollars) of investing in the Fund and to compare these costs with the ongoing costs of investing in other mutual funds. The example is based on an investment of $1,000 invested on June 1, 2012 and held for the six- month period ending November 30, 2012. Actual Expenses For each class, the first line of the table below provides information about actual account values and actual expenses. You may use the information in this line, together with the amount you invested, to estimate the expenses that you paid over the period. Simply divide your account value by $1,000 (for example, an $8,600 account value divided by $1,000 = 8.6), then multiply the result by the number in the first line under the heading entitled “Expenses Paid During Period” to estimate the expenses you paid on your account during this period. | | Hypothetical Example for Comparison Purposes
For each class, the second line of the table below provides information about hypothetical account values and hypothetical expenses based on the Fund’s actual expense ratio and an assumed rate of return of 5% per year before expenses, which is not the Fund’s actual return. The hypothetical account values and expenses may not be used to estimate the actual ending account balance or expense you paid for the period. You may use this information to compare the ongoing costs of investing in the Fund and other funds. To do so, compare this 5% hypothetical example with the 5% hypothetical examples that appear in the shareholder reports of the other funds.
Please note that the expenses shown in the table are meant to highlight your ongoing costs only and do not reflect current and deferred income tax expense or any transactional costs, such as sales charges (loads) or exchange fees. Therefore, the second line of the table for each class is useful in comparing ongoing costs only, and will not help you determine the relative total costs of owning different funds. In addition, if these current and deferred income tax expense and transaction costs were included, your costs would have been higher.
|
| | Beginning Account Value (6/1/2012) | | Ending Account Value (11/30/2012) | | Expenses Paid During Period(1) (6/1/2012 – 11/30/2012) | | Net Annualized Expense Ratio(2) | |
| | | | | | | | | |
| Class A Actual | $1,000.00 | | $1,092.20 | | $9.15 | | 1.75% | |
| Class A Hypothetical | $1,000.00 | | $1,016.25 | | $8.82 | | 1.75% | |
| (5% return before expenses) | | | | | | | | |
| Class I Actual | $1,000.00 | | $1,092.80 | | $7.85 | | 1.50% | |
| Class I Hypothetical | $1,000.00 | | $1,017.50 | | $7.57 | | 1.50% | |
| (5% return before expenses) | | | | | | | | |
| (1) | Expenses are equal to the Fund’s annualized expense ratio multiplied by the average account value over the period, multiplied by 183 days (the number of days in the most recent period)/366 days (to reflect the period). |
| | |
| (2) | Annualized expense ratio excludes current and deferred income tax expense. |
10 | MainGate mlp fund
|
*Master Limited Partnerships and Related Companies
|
| November 30, 2012 | unaudited |
| (expressed as a percentage of total investments) |
| | | | |
 | Crude/Refined Products | 36.7% | |
| | Pipelines and Storage* | | |
 | Natural Gas Gathering/Processing* | 34.0% | |
 | Natural Gas/Natural Gas Liquid | 29.3% | |
| | Pipelines and Storage* | | |
| | | | | | | | | | | |
Master Limited Partnerships and Related Companies, United States: 101.1%(1) | | Shares | | | Fair Value | |
Crude/Refined Products Pipelines and Storage: 37.1%(1) | | | | | | | | | | |
| Genesis Energy, L.P. | | | 198,000 | | | | | $7,102,260 | | |
Kinder Morgan Management, LLC(2) | | | 25,000 | | | | | 1,897,517 | | |
| Magellan Midstream Partners, L.P. | | | 132,000 | | | | | 5,871,360 | | |
MPLX, L.P.(3) | | | 87,000 | | | | | 2,510,820 | | |
| Oiltanking Partners, L.P. | | | 156,000 | | | | | 5,781,360 | | |
| Plains All American Pipeline, L.P. | | | 207,000 | | | | | 9,642,060 | | |
| Sunoco Logistics Partners, L.P. | | | 107,112 | | | | | 5,443,432 | | |
| Tesoro Logistics, L.P. | | | 121,200 | | | | | 5,587,320 | | |
| | | | | | | | | 43,836,129 | | |
Natural Gas/Natural Gas Liquid Pipelines and Storage: 29.7%(1) | | | | | | | | | | |
| El Paso Pipeline Partners, L.P. | | | 131,000 | | | | | 4,890,230 | | |
| Energy Transfer Equity, L.P. | | | 127,200 | | | | | 5,783,784 | | |
| Enterprise Products Partners, L.P. | | | 183,000 | | | | | 9,484,890 | | |
| Oneok Partners, L.P. | | | 41,000 | | | | | 2,388,250 | | |
| Western Gas Partners, L.P. | | | 71,000 | | | | | 3,476,160 | | |
Williams Companies, Inc.(4) | | | 164,400 | | | | | 5,398,896 | | |
| Williams Partners, L.P. | | | 70,000 | | | | | 3,563,700 | | |
| | | | | | | | | 34,985,910 | | |
Natural Gas Gathering/Processing: 34.3%(1) | | | | | | | | | | |
| Copano Energy, LLC | | | 302,000 | | | | | 9,522,060 | | |
Crosstex Energy, Inc.(4) | | | 513,700 | | | | | 6,601,045 | | |
| Crosstex Energy, L.P. | | | 80,000 | | | | | 1,206,400 | | |
| Eagle Rock Energy Partners, L.P. | | | 256,000 | | | | | 2,311,680 | | |
| MarkWest Energy Partners, L.P. | | | 114,000 | | | | | 5,891,520 | | |
| Regency Energy Partners, L.P. | | | 251,000 | | | | | 5,614,870 | | |
Targa Resources Corp.(4) | | | 114,000 | | | | | 5,710,260 | | |
| Targa Resources Partners, L.P. | | | 97,000 | | | | | 3,653,990 | | |
| | | | | | | | | 40,511,825 | | |
| | | | | | | | | | | |
| Total Master Limited Partnerships and Related Companies (Cost $105,228,663) | | | | | | | $119,333,864 | | |
Total Investments: 101.1%(1) (Cost $105,228,663) | | | | | | | $119,333,864 | | |
Liabilities in Excess of Other Assets: (1.1)%(1) | | | | | | | (1,303,363) | | |
Net Assets Applicable to Shareholders: 100.0%(1) | | | | | | | $118,030,501 | | |
(1) Calculated as a percentage of net assets applicable to shareholders. (2) Security distributions are paid-in-kind. (3) Non-income producing security. (4) MLP general partner interest.
| See Accompanying Notes to the Financial Statements. | ANNUAL REPORT 2012 • 11 |
| | |
| and Liabilities | | Operations |
| | | |
| November 30, 2012 | | November 30, 2012 |
| | | | | | |
| Assets | | Investment Income |
| Investments at fair value (cost $105,228,663) | | $119,333,864 | | Distributions received from master limited partnerships | $4,524,057 |
| Cash and cash equivalents | | 3,435,528 | | Less: return of capital on distributions | (4,327,004) |
| Receivable for Fund shares sold | | 738,479 | | Distribution income from master limited partnerships | 197,053 |
| Prepaid expenses | | 13,479 | | Dividends from common stock | 453,239 |
| Total assets | | 123,521,350 | | Total Investment Income | 650,292 |
| | | | | | |
| Liabilities | | | | Expenses | |
| Payable to Adviser | | 117,068 | | Advisory fees | 939,163 |
| Deferred tax liability | | 4,886,335 | | Administrator fees | 94,087 |
| Payable for Fund shares redeemed | | 342,459 | | Reports to shareholders | 76,604 |
| Accrued expenses and other liabilities | | 144,987 | | Transfer agent expense | 73,100 |
| Total liabilities | | 5,490,849 | | Professional fees | 67,452 |
| | | | | Registration fees | 43,194 |
| Net assets applicable to common shareholders | | $118,030,501 | | Insurance expense | 41,279 |
| | | | | Compliance fees | 34,200 |
| Net Assets Applicable to Common Shareholders Consist of | | Trustees’ fees | 32,775 |
| Additional paid-in capital | | $110,055,178 | | Offering costs | 12,092 |
| Undistributed net investment loss, net of deferred taxes | | (334,719) | | Custodian fees and expenses | 8,884 |
| Accumulated realized loss, net of deferred taxes | | (435,183) | | Fund accounting fees | 889 |
| Net unrealized gain on investments, net of deferred taxes | | 8,745,225 | | 12b-1 shareholder servicing fee - Class A | 30,820 |
| Net assets applicable to common shareholders | | $118,030,501 | | Other expenses | 11,079 |
| | | | | Total Expenses | 1,465,618 |
| Unlimited shares authorized, no par value | Class A | Class I | | Less: expense reimbursement by Adviser | (307,802) |
| Net assets | $27,756,364 | $90,274,137 | | Net Expenses | 1,157,816 |
| Shares issued and outstanding | 2,677,479 | 8,662,090 | | Net Investment Loss, before Deferred Taxes | (507,524) |
| Net asset value, redemption price and | $10.37 | $10.42 | | Deferred tax benefit | 192,859 |
| minimum offering price per share | | | | Net Investment Loss | (314,665) |
| Maximum offering price per share ($10.37/0.9425) | $11.00 | NA | | | |
| | | | | Realized and Unrealized Loss on Investments | |
| | | | | Net realized loss on investments, before deferred taxes | (680,073) |
| | | | | Deferred tax benefit | 258,428 |
| | | | | Net realized loss on investments | (421,645) |
| | | | | Net change in unrealized appreciation of investments, | 13,076,395 |
| | | | | before deferred taxes | |
| | | | | Deferred tax expense | (4,969,030) |
| | | | | Net change in unrealized appreciation of investments | 8,107,365 |
| | | | | Net Realized and Unrealized Gain on Investments | 7,685,720 |
| | | | | Increase in Net Assets Applicable to Common Shareholders | $7,371,055 |
| | | | | Resulting from Operations | |
12 | MainGate mlp fund | See Accompanying Notes to the Financial Statements. |

| | | | | | |
| Operations | Year Ended November 30, 2012 | | February 17, 2011(1) – November 30, 2011 |
| Net investment loss, net of deferred taxes | $(314,665) | | | $(20,054) | |
| Net realized loss on investments, net of deferred taxes | (421,645) | | | (13,538) | |
| Net change in unrealized appreciation | 8,107,365 | | | 637,860 | |
| of investments, net of deferred taxes | | | | | |
| Net increase in net assets applicable to common | 7,371,055 | | | 604,268 | |
| shareholders resulting from operations | | | | | |
| | | | | | |
| Dividends and Distributions to Class A Shareholders | | | | | |
| Return of capital | (781,898) | | | (24,962) | |
| Dividends and Distributions to Class I Shareholders | | | | | |
| Return of capital | (3,834,851) | | | (208,109) | |
| Total dividends and distributions to common shareholders | (4,616,749) | | | (233,071) | |
| | | | | | |
| Capital Share Transactions (Note 8) | | | | | |
| Proceeds from shareholder subscriptions | 92,801,563 | | | 26,965,692 | |
| Dividend reinvestments | 3,939,814 | | | 199,474 | |
| Payments for redemptions | (7,360,645) | | | (1,640,900) | |
| Net increase in net assets applicable to common | 89,380,732 | | | 25,524,266 | |
| shareholders from capital share transactions | | | | | |
| Total increase in net assets applicable to common shareholders | 92,135,038 | | | 25,895,463 | |
| | | | | | |
| Net Assets | | | | | |
| Beginning of period | 25,895,463 | | | — | |
| End of period | $118,030,501 | | | $25,895,463 | |
| Undistributed net investment loss at the end of the period, | $(334,719) | | | $(20,054) | |
| net of income taxes | | | | | |
(1) Commencement of operations.
See Accompanying Notes to the Financial Statements. | ANNUAL REPORT 2012 • 13 |
Per Common Share Data(2) | | Year Ended November 30, 2012 | | February 17, 2011(1) – November 30, 2011 |
| Net Asset Value, beginning of period | | $9.76 | | $— |
| Public offering price | | | | 10.00 |
| | | | | |
| Income from Investment Operations | | | | |
Net investment loss(3) | | (0.06) | | (0.05) |
Net realized and unrealized gain on investments(9) | | 1.30 | | 0.13 |
| Total increase from investment operations | | 1.24 | | 0.08 |
| Less Distributions to Common Shareholders | | | | |
| Return of capital | | (0.63) | | (0.32) |
| Total distributions to common shareholders | | (0.63) | | (0.32) |
| Net Asset Value, end of period | | $10.37 | | $9.76 |
| Total Investment Return | | 12.89% | | 0.80%(4) |
| | | | | |
| Supplemental Data and Ratios | | | | |
| Net assets applicable to common shareholders, end of period | | $27,756,364 | | $1,769,297 |
Ratio of waiver to average net assets(5) | | 0.41% | | 9.31% |
Ratio of net deferred income tax (benefit) expense to average net assets(5,6) | | 6.01% | | 8.53% |
| Ratio of expenses (including net deferred income tax (benefit) expense) | | | | |
to average net assets before waiver(5,6) | | 8.17% | | 19.59% |
| Ratio of expenses (including net deferred income tax (benefit) expense) | | | | |
to average net assets after waiver(5,6) | | 7.76% | | 10.28% |
| Ratio of expenses (excluding net deferred income tax (benefit) expense) | | | | |
to average net assets before waiver(5,6) | | 2.16% | | 11.06% |
| Ratio of expenses (excluding net deferred income tax (benefit) expense) | | | | |
to average net assets after waiver(5,6) | | 1.75% | | 1.75% |
| Ratio of net investment loss (including net deferred income tax | | | | |
benefit) to average net assets before waiver(5,7) | | (1.04)% | | (9.99)% |
| Ratio of net investment loss (including net deferred income tax | | | | |
benefit) to average net assets after waiver(5,7) | | (0.63)% | | (0.68)% |
| Ratio of net investment loss (excluding net deferred income tax | | | | |
benefit) to average net assets before waiver(5,7) | | (1.29)% | | (10.27)% |
| Ratio of net investment loss (excluding net deferred income tax | | | | |
benefit) to average net assets after waiver(5,7) | | (0.88)% | | (0.97)% |
Portfolio turnover rate(8) | | 106.26% | | 175.43%(4) |
| (1) | Commencement of operations. |
| (2) | Information presented relates to a share of common stock outstanding for the entire period. |
| (3) | Calculated using average shares outstanding method. |
| (4) | Not Annualized. |
| (5) | For periods less than one full year all income and expenses are annualized. |
| (6) | For the year ended November 30, 2012, the Fund accrued $4,517,743 in net deferred tax expense, of which $741,282 is attributable to Class A.
For the period from February 17, 2011 to November 30, 2011, the Fund accrued $370,357 in net deferred tax expense, of which $42,955 is attributable to Class A. |
| (7) | For the year ended November 30, 2012, the Fund accrued $192,859 in net deferred tax benefit, of which $31,645 is attributable to Class A.
For the period from February 17, 2011 to November 30, 2011, the Fund accrued $12,291 in net deferred tax benefit, of which $1,426 is attributable to Class A. |
| (8) | Portfolio turnover is calculated on the basis of the Fund as a whole without distinguishing between the classes of shares issued. |
| (9) | Realized and unrealized gains and losses per share in this caption are balancing amounts necessary to reconcile the change in net asset value per share for the period, and may not reconcile with the aggregate gains and losses in the Statement of Operations due to share transactions in the period. |
14 | MainGate mlp fund | See Accompanying Notes to the Financial Statements. |
| | | | | |
Per Common Share Data(2) | | Year Ended November 30, 2012 | | February 17, 2011(1) – November 30, 2011 |
| Net Asset Value, beginning of period | | $9.79 | | $— |
| Public offering price | | | | 10.00 |
| | | | | |
| Income from Investment Operations | | | | |
Net investment loss(3) | | (0.04) | | (0.03) |
Net realized and unrealized gain on investments(9) | | 1.30 | | 0.14 |
| Total increase from investment operations | | 1.26 | | 0.11 |
| Less Distributions to Common Shareholders | | | | |
| Return of capital | | (0.63) | | (0.32) |
| Total distributions to common shareholders | | (0.63) | | (0.32) |
| Net Asset Value, end of period | | $10.42 | | $9.79 |
| Total Investment Return | | 13.06% | | 1.10%(4) |
| | | | | |
| Supplemental Data and Ratios | | | | |
| Net assets applicable to common shareholders, end of period | | $90,274,137 | | $24,126,166 |
Ratio of waiver to average net assets(5) | | 0.41% | | 9.31% |
Ratio of net deferred income tax (benefit) expense to average net assets(5,6) | | 6.01% | | 8.53% |
| Ratio of expenses (including net deferred income tax (benefit) expense) | | | | |
to average net assets before waiver(5,6) | | 7.92% | | 19.34% |
| Ratio of expenses (including net deferred income tax (benefit) expense) | | | | |
to average net assets after waiver(5,6) | | 7.51% | | 10.03% |
| Ratio of expenses (excluding net deferred income tax (benefit) expense) | | | | |
to average net assets before waiver(5,6) | | 1.91% | | 10.81% |
| Ratio of expenses (excluding net deferred income tax (benefit) expense) | | | | |
to average net assets after waiver(5,6) | | 1.50% | | 1.50% |
| Ratio of net investment loss (including net deferred income tax | | | | |
benefit) to average net assets before waiver(5,7) | | (0.79)% | | (9.74)% |
| Ratio of net investment loss (including net deferred income tax | | | | |
benefit) to average net assets after waiver(5,7) | | (0.38)% | | (0.43)% |
| Ratio of net investment loss (excluding net deferred income tax | | | | |
benefit) to average net assets before waiver(5,7) | | (1.04)% | | (10.02)% |
| Ratio of net investment loss (excluding net deferred income tax | | | | |
benefit) to average net assets after waiver(5,7) | | (0.63)% | | (0.72)% |
Portfolio turnover rate(8) | | 106.26% | | 175.43%(4) |
| (1) | Commencement of operations. |
| (2) | Information presented relates to a share of common stock outstanding for the entire period. |
| (3) | Calculated using average shares outstanding method. |
| (4) | Not Annualized. |
| (5) | For periods less than one full year all income and expenses are annualized. |
| (6) | For the year ended November 30, 2012, the Fund accrued $4,517,743 in net deferred tax expense, of which $3,776,461 is attributable to Class I.
For the period from February 17, 2011 to November 30, 2011, the Fund accrued $370,357 in net deferred tax expense, of which $327,402 is attributable to Class I. |
| (7) | For the year ended November 30, 2012, the Fund accrued $192,859 in net deferred tax benefit, of which $161,214 is attributable to Class I.
For the period from February 17, 2011 to November 30, 2011, the Fund accrued $12,291 in net deferred tax benefit, of which $10,865 is attributable to Class I. |
| (8) | Portfolio turnover is calculated on the basis of the Fund as a whole without distinguishing between the classes of shares issued. |
| (9) | Realized and unrealized gains and losses per share in this caption are balancing amounts necessary to reconcile the change in net asset value per share for the period, and may not reconcile with the aggregate gains and losses in the Statement of Operations due to share transactions in the period. |
See Accompanying Notes to the Financial Statements. | ANNUAL REPORT 2012 • 15 |
| | | |
Financial Statements November 30, 2012 1. Organization MainGate MLP Fund (the “Fund”), a series of MainGate Trust (the “Trust”), is registered under the Investment Company Act of 1940 as an open-end, non-diversified investment company and was established under the laws of Delaware by an Agreement and Declaration of Trust dated November 3, 2010. The Fund’s investment objective is total return. The Fund commenced operations on February 17, 2011. The Fund offers two classes of shares, Class A and Class I. Class A shares are subject to a 5.75% front-end sales charge. Class I shares have no sales charge. 2. Significant Accounting Policies A. Use of Estimates. The preparation of financial statements in conformity with accounting principles generally accepted in the United States of America requires management to make estimates and assumptions that affect the reported amount of assets and liabilities and disclosure of contingent assets and liabilities at the date of the financial statements and the recognition of distribution income and the reported amounts of increases and decreases in net assets from operations during the reporting period. Actual results could differ from those estimates. B. Investment Valuation. The Fund uses the following valuation methods to determine fair value as either current market value for investments for which market quotations are available, or if not available, a fair value, as determined in good faith pursuant to such policies and procedures as may be approved by the Trust’s Board of Trustees (“Board of Trustees”) from time to time. The valuation of the portfolio securities of the Fund currently includes the following processes: • Equity Securities: Securities listed on a securities exchange or an automated quotation system for which quotations are readily available, including securities traded over the counter, will be valued at the last quoted sale price on the principal exchange on which they are traded on the valuation date (or at approximately 4:00 p.m. Eastern Time if a security’s principal exchange is normally open at that time), or, if there is no such reported sale on the valuation date, at the most recent quoted bid price. • Fixed Income Securities: Debt and fixed income securities will be priced by independent, third-party pricing agents approved by the Board of Trustees. These third-party pricing agents will employ methodologies that they believe are appropriate, including | | actual market transactions, broker-dealer supplied valuations, matrix pricing, or other electronic data processing techniques. These techniques generally consider such factors as security prices, yields, maturities, call features, ratings and developments relating to specific securities in arriving at valuations. Debt obligations with remaining maturities of sixty days or less will be valued at their amortized cost, which approximates fair market value. • Foreign Securities: Foreign securities are often principally traded on markets that close at different hours than U.S. markets. Such securities will be valued at their most recent closing prices on the relevant principal exchange even if the close of that exchange is earlier than the time of the Fund’s net asset value (“NAV”) calculation. However, securities traded in foreign markets which remain open as of the time of the NAV calculation will be valued at the most recent sales price as of the time of the NAV calculation. In addition, prices for certain foreign securities may be obtained from the Fund’s approved pricing sources. The Adviser also monitors for the occurrence of significant events that may cast doubts on the reliability of previously obtained market prices for foreign securities held by the Fund. The prices for foreign securities will be reported in local currency and converted to U.S. dollars using currency exchange rates. Exchange rates will be provided daily by recognized independent pricing agents. The exchange rates used for the conversion will be captured as of the London close each day. C. Security Transactions, Investment Income and Expenses. Security transactions are accounted for on the date the securities are purchased or sold (trade date). Realized gains and losses are reported on a specific identified cost basis. Interest income is recognized on the accrual basis, including amortization of premiums and accretion of discounts. Distributions are recorded on the ex- dividend date. Distributions received from the Fund’s investments in master limited partnerships (“MLPs”) generally are comprised of ordinary income, capital gains and return of capital from the MLP. Distributions received from the Fund’s investment in MLP general partner interests generally are comprised of ordinary income. The Fund records investment income on the ex-date of the distributions. For financial statement purposes, the Fund uses return of capital and income estimates to allocate the dividend income received. Such estimates are based on historical information available from each MLP and other industry sources. These estimates may subsequently be revised based on information received from MLPs after their tax reporting periods are concluded, as the actual character of these distributions is not known until after the fiscal year end of the Fund. The Fund estimates the allocation of investment income and return of capital for the distributions received from MLPs within the Statement of Operations. The Fund has estimated approximately 5% of the distributions to be from investment income with the remaining balance to be return of capital. |
16 | MainGate mlp fund
| | | |
Expenses are recorded on the accrual basis. The Fund expensed organizational costs as incurred and amortizes offering costs over a one-year period from the commencement of operations. These costs consisted of legal fees pertaining to the Fund’s shares offered for sale, preparing the initial registration statement and printing the prospectus, and SEC and state registration fees. For the period February 17, 2011 (commencement of operations) through November 30, 2011, $43,784 of offering costs were amortized. For the year ended November 30, 2012, the remaining offering costs of $12,092 have been amortized and included in offering costs in the Statement of Operations. D. Dividends and Distributions to Shareholders. Dividends and distributions to common shareholders will be recorded on the ex-dividend date. The character of dividends and distributions to common shareholders made during the period may differ from their ultimate characterization for federal income tax purposes. For the year ended November 30, 2012, the Fund’s dividends and distributions were expected to be comprised of 100% return of capital. The tax character of distributions paid for the year ended November 30, 2012 will be determined in early 2013. E. Federal Income Taxation. The Fund, taxed as a corporation, is obligated to pay federal and state income tax on its taxable income. Currently, the maximum marginal regular federal income tax rate for a corporation is 35%. The Fund may be subject to a 20% federal alternative minimum tax on its federal alternative minimum taxable income to the extent that its alternative minimum tax exceeds its regular federal income tax. The Fund invests its assets primarily in MLPs, which generally are treated as partnerships for federal income tax purposes. As a limited partner in the MLPs, the Fund reports its allocable share of the MLP’s taxable income in computing its own taxable income. The Fund’s tax expense or benefit is included in the Statement of Operations based on the component of income or gains (losses) to which such expense or benefit relates. Deferred income taxes reflect the net tax effects of temporary differences between the carrying amounts of assets and liabilities for financial reporting purposes and the amounts used for income tax purposes. A valuation allowance is recognized if, based on the weight of available evidence, it is more likely than not that some portion or all of the deferred income tax asset will not be realized. The Fund’s policy is to classify interest and penalties associated with underpayment of federal and state income taxes as an income tax expense on the Statement of Operations. For the year ended November 30, 2012, the Fund did not have interest or penalties associated with underpayment of income taxes. F. Cash Distribution Information. The Fund intends to make quarterly distributions from investments, which include the amount received as cash distributions from MLPs and common stock dividends. These activities will be reported in the Statements of Changes in Net Assets. | | G. Indemnifications. Under the Fund’s organizational documents, its officers and trustees are indemnified against certain liabilities arising out of the performance of their duties to the Fund. In addition, in the normal course of business, the Fund may enter into contracts that provide general indemnification to other parties. The Fund’s maximum exposure under these arrangements is unknown, as this would involve future claims that may be made against the Fund that have not yet occurred, and may not occur. However, the Fund has not had prior claims or losses pursuant to these contracts and expects the risk of loss to be remote. H. Recent Accounting Pronouncement. In May 2011, the FASB issued ASU No. 2011-04 “Amendments to Achieve Common Fair Value Measurement and Disclosure Requirements” in GAAP and the International Financial Reporting Standards (“IFRSs”). ASU No. 2011-04 amends FASB ASC Topic 820, Fair Value Measurements and Disclosures, to establish common requirements for measuring fair value and for disclosing information about fair value measurements in accordance with GAAP and IFRSs. ASU No. 2011-04 is effective for fiscal years beginning after December 15, 2011 and for interim periods within those fiscal years. The Fund has adopted these ammendments and they did not have a material impact on the Financial Statements. 3. Fair Value Measurements Various inputs that are used in determining the fair value of the Fund’s investments are summarized in the three broad levels listed below: • Level 1: quoted prices in active markets for identical securities • Level 2: other significant observable inputs (including quoted prices for similar securities, interest rates, prepayment speeds, credit risk, etc.) • Level 3: significant unobservable inputs (including the Fund’s own assumptions in determining the fair value of investments) The inputs or methodology used for valuing securities are not necessarily an indication of the risk associated with investing in those securities. These inputs are summarized in the three broad levels that follow. |
ANNUAL REPORT 2012 • 17
| | | | | | | | | | | | |
| | | | | | | Fair Value Measurements at Reporting Date Using: | |
| | Description | | | Fair Value at May 31, 2012 | | Quoted Prices in Active Markets for Identical Assets (Level 1) | | Significant Other Observable Inputs (Level 2) | | Significant Unobservable Inputs (Level 3) | |
| | Equity Securities | | | | | | | | | |
| | Master Limited Partnerships and and Related Companies(1) | | $119,333,864 | | $119,333,864 | | $ — | | $ — | |
| | Total | | $119,333,864 | | $119,333,864 | | $ — | | $ — | |
| | (1) All other industry classifications are identified in the Schedule of Investments. | |
| |
The Fund did not hold Level 2 or Level 3 investments at any time during the fiscal year ended November 30, 2012. There were no transfers into and out of all Levels during the current period presented. It is the Fund’s policy to record transfers between all Levels as of the end of the reporting period. |
| | | | |
4. Concentrations of Risk The Fund’s investment objective is to seek to generate total return. The Fund seeks to achieve its investment objective by investing, under normal market conditions, at least 80% of its net assets, plus any borrowings for investment purposes, in MLP interests. 5. Agreements and Related Party Transactions The Trust has entered into an Investment Advisory Agreement (the “Agreement”) with Chickasaw Capital Management, LLC (the “Adviser”). Under the terms of the Agreement, the Fund will pay the Adviser a fee, payable at the end of each calendar month, at an annual rate equal to 1.25% of the average daily net assets of the Fund. The Adviser paid the initial organizational expenses of the Fund, which amounted to $51,184. The Adviser has agreed to waive its advisory fee and/or reimburse certain expenses of the Fund, until at least March 31, 2014, but only to the extent necessary so that the Fund’s total annual expenses, excluding brokerage fees and commissions; borrowing costs (such as (a) interest and (b) dividend expenses on securities sold short); taxes, including accrued deferred tax liability; any indirect expenses, such as acquired fund fees and expenses; 12b-1 fees, and extraordinary expenses, do not exceed 1.50% of the average daily net assets of each class of the Fund. Any payment by the Adviser of the Fund’s operating, organizational and offering expenses are subject to repayment by the Fund in the three fiscal years following the fiscal year in which the payment was made; provided that the Fund is able to make the repayment without exceeding the 1.50% expense limitation. For the period from February 17, 2011 (commencement of operations) to November 30, 2011, the Adviser waived and reimbursed expenses in the amount of $454,971, $403,787 after commencement and $51,184 related to | | organizational costs prior to commencement, which can be recouped on or before November 30 and February 3, 2014, respectively. For the year ended November 30, 2012, the Adviser waived expenses in the amount of $307,802. The Fund’s waived expenses that are subject to potential recovery are as follows: |
| Expiration Date: | |
| February 3, 2014 | $51,184 |
| November 30, 2014 | 403,787 |
| November 30, 2015 | 307,802 |
| | $762,773 |
Certain Trustees and Officers of the Trust are also Officers of the Adviser. The Fund has entered into a Rule 12b-1 distribution agreement with Quasar Distributors, LLC (“Quasar”). Class A shareholders pay Rule 12b-1 fees to Quasar at the annual rate of 0.25% of average daily net assets. For the year ended November 30, 2012, 12b-1 distribution expenses of $30,820 were accrued by Class A shares. The Fund has engaged U.S. Bancorp Fund Services, LLC to serve as the Fund’s administrator. The Fund pays the administrator a monthly fee computed at an annual rate of 0.10% of the first $75,000,000 of the Fund’s average daily net assets, 0.08% on the next $250,000,000 of average daily net assets and 0.05% on the balance of the Fund’s average daily net assets, with a minimum annual fee of $64,000, imposed upon the Fund reaching certain asset levels. |
18 | MainGate mlp fund

| | | | | | |
U.S. Bancorp Fund Services, LLC serves as the Fund’s transfer agent, dividend paying agent, and agent for the automatic dividend reinvestment plan. The Fund pays the transfer agent a $30,000 flat fee, imposed upon the Fund reaching certain asset levels, plus transaction and other out-of-pocket charges. U.S. Bank, N.A. serves as the Fund’s custodian. The Fund pays the custodian a monthly fee computed at an annual rate of 0.0075% of the first $250 million of market value and 0.0050% of the balance, with a minimum annual fee of $4,800, imposed upon Fund reaching certain asset levels. 6. Income Taxes Deferred income taxes reflect the net tax effect of temporary differences between the carrying amount of assets and liabilities for financial reporting and tax purposes. A valuation allowance is recognized if, based on the weight of available evidence, it is more likely than not that some portion or all of a deferred income tax asset will not be realized. From time to time, as new information becomes available, the Fund will modify its estimates or assumption regarding the deferred tax liabilities or assets. Components of the Fund’s deferred tax assets and liabilities as of November 30, 2012, are as follows: | | For corporations, capital losses can only be used to offset capital gains and cannot be used to offset ordinary income. The capital loss may be carried forward for 5 years and, accordingly, would begin to expire as of November 30, 2016. The net operating loss can be carried forward for 20 years and, accordingly, would begin to expire as of November 30, 2032. Total income tax expense (current and deferred) differs from the amount computed by applying the federal statutory income tax rate of 35% to net investment income and realized and unrealized gains (losses) on investments before taxes for the year ended November 30, 2012, as follows: |
| Application of statutory income tax rate | $4,161,079 |
| State income taxes (net of federal benefit) | 356,664 |
| Total tax expense | $4,517,743 |
At November 30, 2012, the Fund did not have a current tax expense or benefit. At November 30, 2012, the cost basis of investments was $104,554,117 and gross unrealized appreciation and depreciation of investments for federal income tax purposes were as follows: |
| Gross unrealized appreciation | $14,779,747 |
| Deferred tax assets: | | | Gross unrealized depreciation | — |
| Net operating loss carryforward (tax basis) | $247,806 | Net unrealized appreciation | $14,779,747 |
| Capital loss carryforward (tax basis) | 482,173 | The differences between book-basis and tax-basis unrealized appreciation (depreciation) are primarily due to timing differences of income recognition from the MLP investments. The Fund recognizes the tax benefits of uncertain tax positions only where the position is “more likely than not” to be sustained assuming examination by tax authorities. Management has analyzed the Fund’s tax positions, and has concluded that no liability for unrecognized tax benefits should be recorded related to uncertain tax positions taken on U.S. tax returns and state tax returns filed or expected to be filed since inception of the Fund. No income tax returns are currently under examination. The tax periods since inception remain subject to examination by the tax authorities in the United States. Due to the nature of the Fund’s investments, the Fund may be required to file income tax returns in several states. The Fund is not aware of any tax positions for which it is reasonably possible that the total amounts of unrecognized tax benefits will change materially in the next 12 months. 7. Investment Transactions For the year ended November 30, 2012, the Fund purchased (at cost) and sold securities (proceeds) in the amount of $165,539,031 and $80,052,633 (excluding short-term securities), respectively. |
| Total deferred tax assets | 729,979 |
| Less: Deferred tax liabilities: | |
| Unrealized gain on investment securities (tax basis) | (5,616,314) |
| Net deferred tax asset (liability) | $(4,886,335) |
The net operating loss carryforward and capital loss carryforward are available to offset future taxable income. The Fund has the following net operating loss and capital loss amounts: |
| Fiscal Year Ended Net Operating Loss | | Amount | | | Expiration | |
| November 30, 2012 | $652,122 | November 30, 2032 |
| Total Fiscal Year Ended Net Operating Loss | $652,122 | |
| Fiscal Year Ended Capital Loss | | |
| November 30, 2011 | $83,591 | November 30, 2016 |
| November 30, 2012 | 1,185,287 | November 30, 2017 |
| Total Fiscal Year Ended Capital Loss | $1,268,878 | |
ANNUAL REPORT 2012 • 19
8. Common Stock
Transactions of shares of the Fund were as follows:
| | | | | | | | | | |
| | | Year Ended November 30, 2012 | February 17, 2011(1) – November 30, 2011 | |
| | | | | | | | | | |
| | Class A Shares | | | | Amount | | | | Shares | | | | Amount | | | | Shares | | |
| Sold | | $27,673,166 | | 2,714,045 | | $3,253,057 | | 340,077 | |
| Dividends Reinvested | | 535,022 | | 51,988 | | 19,579 | | 2,080 | |
| Redeemed | | (2,794,559) | | (269,774) | | (1,562,610) | | (160,937) | |
| Net Increase | | $25,413,629 | | 2,496,259 | | $1,710,026 | | 181,220 | |
| | | | | | | | | | | | | | | | | | | | |
| | Class I Shares | | | | Amount | | | | Shares | | | | Amount | | | | Shares | | |
| Sold | | $65,128,397 | | 6,309,711 | | $23,712,635 | | 2,449,150 | |
| Dividends Reinvested | | 3,404,792 | | 329,733 | | 179,895 | | 23,981 | |
| Redeemed | | (4,566,086) | | (442,346) | | (78,290) | | (8,139) | |
| Net Increase | | $63,967,103 | | 6,197,098 | | $23,814,240 | | 2,464,992 | |
(1) Commencement of operations. | | | | | | | | | |
9. Subsequent Events
The Fund has adopted standards which establish general standards of accounting for disclosure of events that occur after the Statement of Assets & Liabilities date, but before the financial statements are issued. The Fund has performed an evaluation of subsequent events through the date the financial statements were issued.
The Fund declared a distribution of $0.1575 per share payable on January 25, 2013 to shareholders of record on January 23, 2013.
20 | MainGate mlp fund
| | |
| | Report of Independent Registered Public Accounting Firm |
| | |
| | To the Shareholders and Board of Trustees of MainGate MLP Fund (a series of MainGate Trust)
We have audited the accompanying statement of assets and liabilities, including the schedule of investments, of MainGate Trust, comprising MainGate MLP Fund (the “Fund”), as of November 30, 2012, and the related statement of operations for the year then ended, and the statements of changes in net assets and the financial highlights for each of the two periods in the period then ended. These financial statements and financial highlights are the responsibility of the Fund’s management. Our responsibility is to express an opinion on these financial statements and financial highlights based on our audits.
We conducted our audits in accordance with the standards of the Public Company Accounting Oversight Board (United States). Those standards require that we plan and perform the audit to obtain reasonable assurance about whether the financial statements and financial highlights are free of material misstatement. An audit includes examining, on a test basis, evidence supporting the amounts and disclosures in the financial statements. Our procedures included confirmation of securities owned as of November 30, 2012, by correspondence with the custodian. An audit also includes assessing the accounting principles used and significant estimates made by management, as well as evaluating the overall financial statement presentation. We believe that our audits provide a reasonable basis for our opinion.
In our opinion, the financial statements and financial highlights referred to above present fairly, in all material respects, the financial position of MainGate MLP Fund as of November 30, 2012, the results of its operations for the year then ended, and the changes its net assets, and the financial highlights for each of the two periods in the period then ended, in conformity with accounting principles generally accepted in the United States of America.
COHEN FUND AUDIT SERVICES, LTD. Cleveland, Ohio January 29, 2013 |
| | |
| | ANNUAL REPORT 2012 • 21 |
November 30, 2012 | unaudited
Set forth below is information with respect to each of the Trustees and Officers of the Fund, including their principal occupation during the past five years. The business address of the Fund, its Trustees and Officers is 6075 Poplar Ave., Suite 402, Memphis, TN 38119.
| | | | | | | | | | | | | | | | | | |
| Name and Age | | | | Position(s) with Trust, Term of Office and Length of Time Served | | | | Principal Occupation(s) During Past Five Years | | | | Number of Portfolios in Fund Complex Overseen by Trustee | | | | Other Directorships Held by Trustee During Past Five Years | |
| Independent Trustees | | | | | | | | |
Robert A. Reed Age: 46 | | Lead Independent Trustee since January 2011 | | President, CEO and founder, ABC Polymer Industries, LLC since 1994 | | 1 | | Director, Oakworth Capital Bank since 2008; Director, Robert E. Reed Gastrointestinal Oncology Research Foundation, 2001-present; Member of the Young Presidents Organization International, 2010; Member, Society of International Business Fellows, 1999-present |
Darrison N. Wharton Age: 41 | | Independent Trustee since January 2011 | | Assistant Vice President and Client Advocate, Willis of Tennessee, Inc. in Memphis, TN since 2005 | | 1 | | Board member, Goodwill Club of the Boys and Girls Clubs of Greater Memphis since 2009; President, Phoenix Club, a non-profit group dedicated to raising money for the Boys and Girls Clubs of Greater Memphis from 2006-2007 |
David C. Burns, CPA Age: 51 | | Independent Trustee and Chairman of the Audit Committee since January 2011 | | Partner and cofounder, Cross Keys Capital, LLC since 2004 | | 1 | | Board member, Ryan Taylor & Co. since 2002; Board member, The Haven since 2007; Board member, Mountainside Holdings since 2011 |
Marshall K. Gramm Age: 39 | | Independent Trustee since January 2011 | | Associate Professor of Economics, Rhodes College, 2006-present | | 1 | | None |
Barry Samuels, CPA Age: 47 | | Independent Trustee since January 2011 | | Private investor, 2009 to present; Director-Private Wealth Management, Deutsche Bank, 2003 to 2009 | | 1 | | None |
Moss W. Davis Age: 50 | | Independent Trustee and Chairman of the Pricing Committee since January 2011 | | Director and head of Business Development, Midtown Consulting Group, 2012 to present; President and Founder, Fairview Consulting Group, 2008 to 2012; Vice President, Experient Group, Consulting and Staffing Firm, 2005 to 2008 | | 1 | | None |
| Interested Trustees and Officers | | | | | | |
Matthew G. Mead(1) Age: 45 | | Interested Trustee, President and Chief Executive Officer since January 2011 | | Principal, Chickasaw Capital Management, LLC since 2003; President, Chickasaw Securities | | 1 | | Director, Oakworth Capital Bank; Director, AGRI, Inc. |
Geoffrey Mavar(1) Age: 50 | | Interested Trustee, Treasurer and Chief Financial Officer since January 2011 | | Principal, Chickasaw Capital Management, LLC since 2003; Chief Financial Officer, Chickasaw Securities | | 1 | | None |
Salvatore Faia Age: 50 | | Chief Compliance Officer since January 2011 | | President, Vigilant Compliance Services | | 1 | | Trustee, EIP Growth & Income Fund |
(1) This person’s status as an “interested” Trustee arises from his affiliation with the Adviser.
22 | MainGate mlp fund
| | | |
| | |
| | | |
| November 30, 2012 | unaudited | | |
| | | |
Trustee and Officer Compensation The Fund does not compensate any of its trustees who are interested persons nor any of its officers. For the year ended November 30, 2012, the aggregate compensation paid by the Fund to the independent trustees was $22,500. The Fund did not pay any special compensation to any of its trustees or officers. The Fund’s Statement of Additional Information includes additional information about the trustees and is available on the Fund’s Web site at www.maingatefunds.com or the SEC’s Web site at www.sec.gov. Cautionary Note Regarding Forward-Looking Statements This report contains “forward-looking statements” as defined under the U.S. federal securities laws. Generally, the words “believe,” “expect,” “intend,” “estimate,” “anticipate,” “project,” “will” and similar expressions identify forward-looking statements, which generally are not historical in nature. Forward-looking statements are subject to certain risks and uncertainties that could cause actual results to materially differ from the Fund’s historical experience and its present expectations or projections indicated in any forward-looking statements. These risks include, but are not limited to, changes in economic and political conditions; regulatory and legal changes; MLP industry risk; concentration risk; energy sector risk; commodities risk; MLP and other tax risks, such as deferred tax assets and liabilities risk; and other risks discussed in the Fund’s filings with the SEC. You should not place undue reliance on forward-looking statements, which speak only as of the date they are made. The Fund undertakes no obligation to update or revise any forward-looking statements made herein. There is no assurance that the Fund’s investment objectives will be attained. Proxy Voting Policies A description of the policies and procedures that the Fund uses to determine how to vote proxies relating to portfolio securities owned by the Fund and information regarding how the Fund voted proxies relating to the portfolio of securities during the 12-month period ended June 30, 2012 are available to shareholders without charge by visiting the SEC’s Web site at www.sec.gov. Form N-Q The Fund files its complete schedule of portfolio holdings for the first and third quarters of each fiscal year with the SEC on Form N-Q. The Fund’s Form N-Q and statement of additional information are available without charge by visiting the SEC’s Web site at www.sec. gov. In addition, you may review and copy the Fund’s Form N-Q at the SEC’s Public Reference Room in Washington D.C. You may obtain information on the operation of the Public Reference Room by calling (800) SEC-0330. | | Householding In an effort to decrease costs, the Fund intends to reduce the number of duplicate prospectuses, annual and semi-annual reports, proxy statements and other similar documents you receive by sending only one copy of each to those addresses shared by two or more accounts and to shareholders that the Transfer Agent reasonably believes are from the same family or household. Once implemented, if you would like to discontinue householding for your accounts, please call toll-free at 855. MLP.FUND (855.657.3863) to request individual copies of these documents. Once the Transfer Agent receives notice to stop householding, the Transfer Agent will begin sending individual copies thirty days after receiving your request. This policy does not apply to account statements. |
| | | |
| | | ANNUAL REPORT 2012 • 23 |
| | | |
| | The following is a description of the Fund’s policies regarding disclosure of nonpublic personal information that you provide to the Fund or that the Fund collects from other sources. In the event that you hold shares of the Fund through a broker-dealer or other financial intermediary, the privacy policy of your financial intermediary would govern how your nonpublic personal information would be shared with nonaffiliated third parties. | |
| | | |
| | Categories of Information the Fund Collects. The Fund collects the following nonpublic personal information about you: | |
| | | • | Information the Fund receives from you on applications or other forms, correspondence, or conversations (such as your name, address, phone number, social security number, and date of birth); and | | |
| | | | | | |
| | | • | Information about your transactions with the Fund, its affiliates, or others (such as your account number and balance, payment history, cost basis information, and other financial information). | | |
| | Categories of Information the Fund Discloses. The Fund does not disclose any nonpublic personal information about its current or former shareholders to unaffiliated third parties, except as required or permitted by law. The Fund is permitted by law to disclose all of the information it collects, as described above, to service providers (such as the Fund’s custodian, administrator, transfer agent, accountant and legal counsel) to process your transactions and otherwise provide services to you. | |
| | | |
| | Confidentiality and Security. The Fund restricts access to your nonpublic personal information to those persons who require such information to provide products or services to you. The Fund maintains physical, electronic, and procedural safeguards that comply with federal standards to guard your nonpublic personal information. | |
| | | |
| | Disposal of Information. The Fund, through its transfer agent, has taken steps to reasonably ensure that the privacy of your nonpublic personal information is maintained at all times, including in connection with the disposal of information that is no longer required to be maintained by the Fund. Such steps shall include, whenever possible, shredding paper documents and records prior to disposal, requiring off-site storage vendors to shred documents maintained in such locations prior to disposal, and erasing and/or obliterating any data contained on electronic media in such a manner that the information can no longer be read or reconstructed. | |
24 | MainGate mlp fund
November 30, 2012
Board of Trustees
Geoffrey P. Mavar*, Chairman of the Board
Robert A. Reed, Lead Independent Trustee
David C. Burns, Independent Trustee
Moss W. Davis, Independent Trustee
Marshall K. Gramm, Independent Trustee
Matthew G. Mead*, Interested Trustee
Barry A. Samuels, Independent Trustee
Darrison N. Wharton, Independent Trustee
Officers
Matthew G. Mead*, President and Chief Executive Officer
Geoffrey P. Mavar*, Treasurer and Chief Financial Officer
Salvatore Faia, Chief Compliance Officer
Debra McAdoo*, Secretary
Investment Adviser
Chickasaw Capital Management, LLC
6075 Poplar Avenue, Suite 402, Memphis, TN 38119
Distributor
Quasar Distributors, LLC
615 East Michigan Street, Milwaukee, WI 53202
Custodian
U.S. Bank, N.A.
1555 N. River Center Drive, Suite 302, Milwaukee, WI 53212
Transfer Agent
U.S. Bancorp Fund Services, LLC
615 East Michigan Street, 3rd Floor, Milwaukee, WI 53202
Administrator
U.S. Bancorp Fund Services, LLC
777 East Wisconsin Street, 5th Floor, Milwaukee, WI 53202
Legal Counsel
Thompson Coburn LLP
One U.S. Bank Plaza, St. Louis, MO 63101
Independent Registered Public Accounting Firm
Cohen Fund Audit Services, Ltd.
1350 Euclid Avenue, Suite 800, Cleveland, OH 44115
*Employed by Chickasaw Capital Management, LLC.
ANNUAL REPORT 2012 • 25
26 | MainGate mlp fund
THIS PAGE INTENTIONALLY BLANK
Item 2. Code of Ethics.
The registrant has adopted a code of ethics that applies to the registrant’s principal executive officer and principal financial officer. The registrant has not made any amendments to its code of ethics during the period covered by this report. The registrant has not granted any waivers from any provisions of the code of ethics during the period covered by this report.
The registrant undertakes to provide to any person without charge, upon request, a copy of its code of ethics by mail when they call the registrant at 1-855-657-3863
Item 3. Audit Committee Financial Expert.
The registrant’s board of trustees has determined that there is at least one audit committee financial expert serving on its audit committee. Mr. David Burns is the “audit committee financial expert” and is considered to be “independent” as each term is defined in Item 3 of Form N-CSR.
Item 4. Principal Accountant Fees and Services.
The registrant has engaged its principal accountant to perform audit services, audit-related services, tax services and other services during the past two fiscal years. “Audit services” refer to performing an audit of the registrant's annual financial statements or services that are normally provided by the accountant in connection with statutory and regulatory filings or engagements for those fiscal years. “Audit-related services” refer to the assurance and related services by the principal accountant that are reasonably related to the performance of the audit. “Tax services” refer to professional services rendered by the principal accountant for tax compliance, tax advice, and tax planning. There were no “Other services” provided by the principal accountant. The following table details the aggregate fees billed or expected to be billed for each of the last two fiscal years for audit fees, audit-related fees, tax fees and other fees by the principal accountant.
| | FYE 11/30/2012 | FYE 11/30/2011 |
| Audit Fees | 25,800 | 25,800 |
| Audit-Related Fees | None | None |
| Tax Fees | 12,250 | 12,250 |
| All Other Fees | None | None |
The audit committee has adopted pre-approval policies and procedures that require the audit committee to pre-approve all audit and non-audit services of the registrant, including services provided to any entity affiliated with the registrant.
The percentage of fees billed by Cohen Fund Audit Services applicable to non-audit services pursuant to waiver of pre-approval requirement were as follows:
| | FYE 11/30/2012 | FYE 11/30/2011 |
| Audit-Related Fees | 0% | 0% |
| Tax Fees | 0% | 0% |
| All Other Fees | 0% | 0% |
All of the principal accountant’s hours spent on auditing the registrant’s financial statements were attributed to work performed by full-time permanent employees of the principal accountant.
The following table indicates the non-audit fees billed or expected to be billed by the registrant’s accountant for services to the registrant and to the registrant’s investment adviser (and any other controlling entity, etc.—not sub-adviser) for the last two years. The audit committee of the board of trustees/directors has considered whether the provision of non-audit services that were rendered to the registrant's investment adviser is compatible with maintaining the principal accountant's independence and has concluded that the provision of such non-audit services by the accountant has not compromised the accountant’s independence.
| Non-Audit Related Fees | FYE 11/30/2012 | FYE 11/30/2011 |
| Registrant | None | None |
| Registrant’s Investment Adviser | None | None |
Item 5. Audit Committee of Listed Registrants.
Not applicable to registrants who are not listed issuers (as defined in Rule 10A-3 under the Securities Exchange Act of 1934).
Item 6. Investments.
| (a) | Schedule of Investments is included as part of the report to shareholders filed under Item 1 of this Form. |
Item 7. Disclosure of Proxy Voting Policies and Procedures for Closed-End Management Investment Companies.
Not applicable to open-end investment companies.
Item 8. Portfolio Managers of Closed-End Management Investment Companies.
Not applicable to open-end investment companies.
Item 9. Purchases of Equity Securities by Closed-End Management Investment Company and Affiliated Purchasers.
Not applicable to open-end investment companies.
Item 10. Submission of Matters to a Vote of Security Holders.
Not Applicable.
Item 11. Controls and Procedures.
| (a) | The Registrant’s President and Chief Financial Officer have reviewed the Registrant's disclosure controls and procedures (as defined in Rule 30a-3(c) under the Investment Company Act of 1940 (the “Act”)) as of a date within 90 days of the filing of this report, as required by Rule 30a-3(b) under the Act and Rules 13a-15(b) or 15d-15(b) under the Securities Exchange Act of 1934. Based on their review, such officers have concluded that the disclosure controls and procedures are effective in ensuring that information required to be disclosed in this report is appropriately recorded, processed, summarized and reported and made known to them by others within the Registrant and by the Registrant’s service provider. |
| (b) | There were no changes in the Registrant's internal control over financial reporting (as defined in Rule 30a-3(d) under the Act) that occurred during the second fiscal quarter of the period covered by this report that has materially affected, or is reasonably likely to materially affect, the Registrant's internal control over financial reporting. |
Item 12. Exhibits.
| (a) | (1) | Any code of ethics or amendment thereto, that is the subject of the disclosure required by Item 2, to the extent that the registrant intends to satisfy Item 2 requirements through filing an exhibit. Incorporated by reference to the Registrant’s Form N-CSR filed February 7, 2012. |
| | (2) | A separate certification for each principal executive and principal financial officer pursuant to Section 302 of the Sarbanes-Oxley Act of 2002. Filed herewith. |
| | (3) | Any written solicitation to purchase securities under Rule 23c-1 under the Act sent or given during the period covered by the report by or on behalf of the registrant to 10 or more persons. Not applicable to open-end investment companies. |
| (b) | Certifications pursuant to Section 906 of the Sarbanes-Oxley Act of 2002. Furnished herewith. |
SIGNATURES
Pursuant to the requirements of the Securities Exchange Act of 1934 and the Investment Company Act of 1940, the registrant has duly caused this report to be signed on its behalf by the undersigned, thereunto duly authorized.
(Registrant) MainGate Trust
By (Signature and Title)* /s/Matthew G. Mead Matthew G. Mead, President & Chief Executive Officer
Date 1/29/13
Pursuant to the requirements of the Securities Exchange Act of 1934 and the Investment Company Act of 1940, this report has been signed below by the following persons on behalf of the registrant and in the capacities and on the dates indicated.
By (Signature and Title)* /s/Matthew G. Mead
Matthew G. Mead, President & Chief Executive Officer
Date 1/29/13
By (Signature and Title)* /s/Geoffrey P. Mavar
Geoffrey P. Mavar, Treasurer & Chief Financial Officer
Date 1/29/13