UNITED STATES
SECURITIES AND EXCHANGE COMMISSION
Washington, D.C. 20549
FORM N-CSR
CERTIFIED SHAREHOLDER REPORT OF REGISTERED
MANAGEMENT INVESTMENT COMPANIES
Investment Company Act file number | 811-22495 |
|
Curian Series Trust |
(Exact name of registrant as specified in charter) |
|
7601 Technology Way, Denver, Colorado | | 80237 |
(Address of principal executive offices) | | (Zip code) |
|
Daniel W. Koors Jackson National Asset Management, LLC 225 West Wacker Drive, Suite 1200 Chicago, Illinois 60606 |
(Name and address of agent for service) |
|
Registrant’s telephone number, including area code: | (312) 338-5800 | |
|
Date of fiscal year end: | October 31 | |
|
Date of reporting period: | October 31, 2013 | |
| | | | | | | | |
Form N-CSR is to be used by management investment companies to file reports with the Commission not later than 10 days after the transmission to stockholders of any report that is required to be transmitted to stockholders under Rule 30e-1 under the Investment Company Act of 1940 (17 CFR 270.30e-1). The Commission may use the information provided on Form N-CSR in its regulatory, disclosure review, inspection, and policymaking roles.
A registrant is required to disclose the information specified by Form N-CSR, and the Commission will make this information public. A registrant is not required to respond to the collection of information contained in Form N-CSR unless the Form displays a currently valid Office of Management and Budget (“OMB”) control number. Please direct comments concerning the accuracy of the information collection burden estimate and any suggestions for reducing the burden to Secretary, Securities and Exchange Commission, 450 Fifth Street, NW, Washington, DC 20549-0609. The OMB has reviewed this collection of information under the clearance requirements of 44 U.S.C. §3507.
Item 1. Report to Shareholders.

ANNUAL REPORT | October 31, 2013 |
Curian/PIMCO Income Fund
Curian/PIMCO Total Return Fund
Curian/WMC International Equity Fund
Curian Series Trust
October 31, 2013
Table of Contents
President’s Letter | 1 |
Management’s Discussion and Fund Performance | 2 |
Schedules of Investments | 5 |
Statements of Assets and Liabilities | 26 |
Statements of Operations | 27 |
Statements of Changes in Net Assets | 28 |
Financial Highlights | 30 |
Notes to Financial Statements | 31 |
Report of Independent Registered Public Accounting Firm | 46 |
Additional Disclosures | 47 |
Trustees and Officers Information | 49 |
Investment Advisory and Sub-Advisory Agreements | 55 |
Curian Series Trust
October 31, 2013
President’s Letter

Dear Fellow Investor,
Enclosed is the annual report for the Curian Series Trust for the year ended October 31, 2013, together with Management’s Discussion of Fund Performance for each of the “Funds”.
From an economic perspective, most global economies showed signs of improvement during the period from November 2012 through October 2013, including the Eurozone, which climbed out of recession during the second quarter of 2013. However, Europe’s recovery was quite weak, with the Eurozone gross domestic product (“GDP”) posting quarterly, non-annualized growth of only 0.3% during the second quarter and 0.1% during the third quarter (secondary estimate). In contrast, the U.S. economy delivered stronger growth during 2013, with GDP expanding over the prior quarter at an annual rate of 2.5% during the second quarter and, according to an advance estimate, 3.6% in the third quarter. China’s economy also showed improved growth during the third quarter of 2013, with year over year GDP growth rebounding to 7.8% from 7.5% during the second quarter.
In the U.S., investors appeared to focus more on fundamentals rather than the political impasse in Washington that partially shut down the federal government and brought the country uncomfortably close to the debt ceiling. Strong increases in home prices, steadily improving unemployment data and the decision by the U.S. Federal Reserve to delay the tapering of their bond buying program helped support a remarkable equity market rally.
Domestic equity markets delivered impressive returns during the 12-month period ended October 31, 2013, with the S&P 500® Index and the Dow Jones Industrial Average (“DJIA”) reaching new all-time closing highs. The S&P 500 Index and the DJIA gained 27.18% and 21.82%, respectively, during the period, while the Nasdaq Composite Index rose 33.54%.
International stocks also performed strongly as a result of improving economic conditions, particularly in Europe and Japan. The Morgan Stanley Capital International (“MSCI”) EAFE Index posted a gain of 26.88% over the 12-month period ended October 31, 2013, while the MSCI Emerging Markets Index returned 6.53%.
As for the fixed income markets, overall bond performance was challenged by rising interest rates during 2013. Despite achieving positive results during September and October 2013, most fixed income sectors posted declines during the 12-month period, with the exception of high yield corporate and preferred stock. Over the 12-month period, the Barclays U.S. Corporate High Yield Bond Index returned 8.87%, while the Barclays U.S. Corporate Investment Grade Bond Index declined -1.40% and the Barclays U.S. Treasury Bond Index fell -1.45%.
Compared to the traditional stock and bond market returns, the performance of the alternatives markets reflected similar tendencies during the 12-month period, with equity based asset classes and strategies performing stronger than other sectors. Investors often consider incorporating alternative asset classes and strategies into their portfolios due to their diversifying influences, often behaving differently from traditional assets under the same market conditions. For example, during the 12-month period, volatile trend patterns negatively impacted the performance of alternative funds focused on commodities and currencies. On the other hand, listed private equity was the standout in the alternatives market, with returns among the best of any asset class.
In summary, investors were rewarded handsomely from increasing their risk exposure during the 12-month period ended October 31, 2013, with domestic and global equities delivering particularly strong returns.
For the 12-month period ended October 31, 2013, all three of the Curian Series Trust Funds outperformed their respective benchmark index. The Curian/WMC International Equity Fund gained 22.36%, while the MSCI All Country World Index ex. US Index returned 20.28%. In contrast, the Curian/PIMCO Total Return Fund declined -0.46% over the period, compared to a decline of -1.08% for the Barclays Capital U.S. Aggregate Bond Index. The Curian/PIMCO Income Fund fell -0.66%, outperforming the Barclays Capital U.S. Credit Index, which declined -1.58%.
Through your financial professional, Curian provides a comprehensive array of goals based investment portfolios designed to help you reach your financial goals. Thank you for choosing Curian for your investment needs.

Michael A. Bell
President and Chief Executive Officer
Curian Series Trust

Pacific Investment Management Company LLC (Unaudited)
Market Summary: In a largely status quo election, Americans voted President Barack Obama to a second term in office at the end of 2012. Market participants then quickly turned their attention to the uncertainty surrounding the impending fiscal cliff. Ultimately, hopes of a grand bargain abated and gave way to a short term deal, thus opening the door to further fiscal negotiations, most notably on a debt ceiling increase and spending cuts in 2013.
Despite the rhetoric surrounding the fiscal cliff and the damage from Hurricane Sandy, there was positive economic data released during the quarter. According to gross domestic product data, in 2012 the U.S. economy grew at a higher than expected 3.1% annual rate during the third quarter, up from 1.3% during the second quarter. Additionally, the housing market continued to show improvement during the fourth quarter amid record low mortgage rates.
During the first quarter of 2013, U.S. equity indices reached new highs and Treasuries sold off across the curve during the quarter as signs of renewed momentum in the world's largest economy fueled risk appetite. Investors discounted negative fiscal policy developments — including Congress' failure to reach a deal on sequestration and instead focused on positive news out of the housing and labor markets.
Conditions in financial markets then deteriorated during the second quarter as investors reacted to signals by the U.S. Federal Reserve ("Fed") that it would begin to slow the pace of asset purchases later this year. The shift in tone fueled a broad based sell off of fixed income assets, undermining market liquidity, and sending yields higher across the risk spectrum.
While the Fed's choice to later eschew market consensus in the third quarter and delay tapering left investors in a state of disbelief, a few key factors guided its hand. Chief among them was economic data. Ever since the Fed began hinting at tapering this spring, headline indicators of economic growth have been unconvincing. The question many are asking now is to what extent the economy's current bout of cyclical weakness is of the Fed's own doing.
The Fed is also keeping a wary eye on the uncertain fiscal policy landscape. The economy is unlikely to escape both a government shutdown and another debt ceiling debate unscathed. Against this backdrop of elevated economic and fiscal policy uncertainty, the Fed continues to enhance one source of certainty for investors: the Fed Funds rate. The Fed will not begin raising rates until a "considerable time" after the third quantitative easing ("QE3") has been wound down; the longer the withdrawal from QE3 is delayed, the further the Fed pushes out the eventual first rate hike.
Portfolio Composition†:
Financials | | | 29.2 | % | |
Energy | | | 13.4 | | |
Government Securities | | | 8.7 | | |
Non-U.S. Government Agency ABS | | | 6.6 | | |
Telecommunication Services | | | 5.1 | | |
Consumer Discretionary | | | 4.5 | | |
Health Care | | | 3.8 | | |
Materials | | | 3.7 | | |
Utilities | | | 3.6 | | |
Consumer Staples | | | 3.4 | | |
U.S. Government Agency MBS | | | 3.3 | | |
Industrials | | | 3.1 | | |
Information Technology | | | 1.8 | | |
Purchased Options | | | 0.1 | | |
Short Term Investments | | | 9.7 | | |
Total Investments | | | 100.0 | % | |
†Total Investments at October 31, 2013
Portfolio Manager Commentary: For the year ended October 31, 2013 Curian/PIMCO Income Fund outperformed its benchmark by posting a return of -0.66% compared to -1.58% for the Barclays Capital U.S. Credit Index.
The investment concentration differences relative to the benchmark included an underweight to investment grade credit and an allocation to
emerging markets ("EM"), with U.S. government exposure fluctuating around the benchmark over the year. The Fund also had out of index exposure to mortgages, high yield and non U.S. developed corporate bonds. During the year, the Fund decreased exposure to investment grade corporates, while increasing exposure to mortgages, high yield and municipal bonds.
The net outperformance relative to the benchmark resulted from several strategies. Curve positioning, particularly an underweight to longer dated maturities, was positive for performance as the yield curve steepened over the year. Interest rate exposure to specific developed economies, such as Spain and Italy, also added to returns as yields fell across the curve. Conversely, tactical exposure to select EM local rates, such as Brazil, detracted from performance as yields rose. Within investment grade corporate bonds, an emphasis on banks, which outperformed the broader market, also contributed to outperformance. In high yield, an emphasis on the bonds of financial and industrial companies contributed to returns. Within mortgages, an out of benchmark allocation to non-agency mortgages added to returns, as they benefitted from the ongoing housing recovery. Lastly, the Fund's exposure to U.S. dollar denominated EM debt detracted from returns
as taper talk and increasing yields domestically impacted the sector negatively.
Derivatives were used in the Fund and are instrumental in attaining specific exposures targeted to gain from anticipated market developments. The Fund's U.S. duration positioning, which was positive for returns, was partly facilitated through the use of interest rate swaps. The allocation to EM local debt, which detracted from relative performance, included exposure to local debt in Brazil that was implemented using zero coupon interest rate swaps. Additionally, investment grade corporate exposure was positive for performance, and was implemented partially through the use of credit default swaps.
PIMCO expects the global economy to grow at a real rate of 2.25% to 2.75% over the year ahead. While PIMCO expects a step up in U.S. growth, we think that it will fall short of highly optimistic consensus expectations. Eurozone growth will also improve but disappoint relative to consensus, managing a minor acceleration from a low base. Japan's cyclical momentum will continue to rely heavily on implementation of aggressive fiscal and monetary policies. Finally, on the inflation front, an environment of muted inflation will likely persist over the next six to nine months.
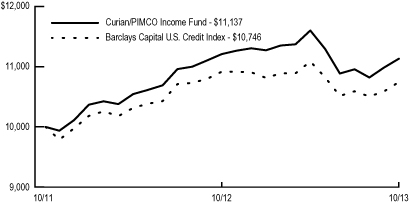
Total Return*
| 1 Year | | | -0.66 | % | |
Since Inception | | | 5.54 | | |
(Inception date November 2, 2011) | |
Expense Ratios**
Net Expense Ratio | |
Prospectus | | | 0.85 | % | |
Year ended October 31, 2013 | | | 0.85 | | |
Gross Expense Ratio | |
Prospectus | | | 1.03 | % | |
Year ended October 31, 2013 | | | 1.02 | | |
*Past performance is not predictive of future performance. Investment return and principal value will fluctuate so that an investor's shares, when redeemed, may be worth more or less than their original cost. Performance numbers are net of all Fund operating expenses, however, performance results do not reflect the deduction of taxes that a shareholder would pay on Fund distributions or the redemption of Fund shares.
**The prospectus expense ratios are from the Fund's prospectus dated February 28, 2013. Net expense ratio is net of contractual waivers.
The Fund's investment adviser waived/reimbursed certain expenses of the Fund. Performance results shown reflect the waiver, without which they would have been lower.
2

Pacific Investment Management Company LLC (Unaudited)
Curian/PIMCO Total Return Fund
Portfolio Composition†:
U.S. Government Agency MBS | | | 28.5 | % | |
Government Securities | | | 24.9 | | |
Financials | | | 10.5 | | |
Non-U.S. Government Agency ABS | | | 7.8 | | |
Health Care | | | 1.4 | | |
Industrials | | | 0.9 | | |
Energy | | | 0.4 | | |
Telecommunication Services | | | 0.4 | | |
Materials | | | 0.1 | | |
Utilities | | | 0.0 | | |
Short Term Investments | | | 25.1 | | |
Total Investments | | | 100.0 | % | |
†Total Investments at October 31, 2013
Portfolio Manager Commentary: For the year ended October 31, 2013 Curian/PIMCO Total Return Fund outperformed its benchmark by posting a return of -0.46% compared to -1.08% for the Barclays Capital U.S. Aggregate Bond Index.
The investment concentration differences relative to the benchmark included an overweight to mortgages and an underweight to investment grade credit and U.S. government. The Fund also
had out of index exposure to high yield, emerging markets ("EM") and non U.S. developed corporate bonds. During the year, the Fund decreased exposure to investment grade corporates and non U.S. developed corporate bonds, while increasing exposure to mortgages.
The net outperformance relative to the benchmark resulted from several strategies. Curve positioning, particularly an underweight to longer dated maturities, was positive for performance as the yield curve steepened over the year. Interest rate exposure to specific developed economies, such as Spain and Italy, also added to returns as yields fell across the curve. Within investment grade corporate bonds, an emphasis on banks, which outperformed the broader market, also contributed to outperformance. In high yield, an emphasis on the bonds of financial and industrial companies contributed to returns. Within mortgages, an out of benchmark allocation to non-agency mortgages added to returns, as they benefitted from the ongoing housing recovery. Lastly, the Fund's holdings of Treasury Inflation Protected Securities detracted from returns as taper talk and increasing yields domestically impacted the sector negatively.
Derivatives were used in the Fund and are instrumental in attaining specific exposures targeted to gain from anticipated market developments. The Fund's U.S. duration positioning, which was positive for returns, was partly facilitated through the use of interest rate swaps. An allocation to EM local debt, which was additive to relative performance, included exposure to local debt in Brazil that was implemented using zero coupon interest rate swaps. Additionally, investment grade corporate exposure was positive for performance, and was implemented partially through the use of credit default swaps.
PIMCO expects the global economy to grow at a real rate of 2.25% to 2.75% over the year ahead. While PIMCO expects a step up in U.S. growth, we think that it will fall short of highly optimistic consensus expectations. Eurozone growth will also improve but disappoint relative to consensus, managing a minor acceleration from a low base. Japan's cyclical momentum will continue to rely heavily on implementation of aggressive fiscal and monetary policies. Finally, on the inflation front, an environment of muted inflation will likely persist over the next six to nine months.
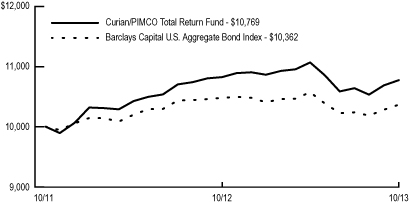
Total Return*
| 1 Year | | | -0.46 | % | |
Since Inception | | | 3.78 | | |
(Inception date November 2, 2011) | |
Expense Ratios**
Net Expense Ratio | |
Prospectus | | | 0.80 | % | |
Year ended October 31, 2013 | | | 0.80 | | |
Gross Expense Ratio | |
Prospectus | | | 1.02 | % | |
Year ended October 31, 2013 | | | 0.99 | | |
*Past performance is not predictive of future performance. Investment return and principal value will fluctuate so that an investor's shares, when redeemed, may be worth more or less than their original cost. Performance numbers are net of all Fund operating expenses, however, performance results do not reflect the deduction of taxes that a shareholder would pay on Fund distributions or the redemption of Fund shares.
**The prospectus expense ratios are from the Fund's prospectus dated February 28, 2013. Net expense ratio is net of contractual waivers.
The Fund's investment adviser waived/reimbursed certain expenses of the Fund. Performance results shown reflect the waiver, without which they would have been lower.
3

Wellington Management Company, LLP (Unaudited)
Market Summary: Global equities finished 2012 on a strong note despite concerns about the looming U.S. fiscal cliff, tepid corporate revenue results, and economic malaise in Europe. Investors bid up risk assets amid signs of a recovery in China and a strengthening U.S. housing market. Enthusiasm for stocks continued through the first quarter of 2013. Global equities surged on the back of solid corporate earnings results and favorable global liquidity dynamics. Further monetary easing by the Bank of Japan and a steadily improving U.S. economy also fueled the rally, which continued at a more modest pace in the second quarter. Solid gains in April and the first part of May paused following comments by U.S. Federal Reserve ("Fed") Chairman Ben Bernanke that suggested the Fed might begin to slow quantitative easing sooner than investors anticipated. Nonetheless, equities continued their advance in the third quarter as the surprising "no taper" decision by the Federal Open Market Committee eased near term concerns about rapidly
rising interest rates derailing the recovery. Additionally, accommodative rhetoric from the European Central Bank, along with encouraging data in China, further evidence of a European economic recovery and solid corporate earnings contributed to a broad based global rally. The quarter, however, ended on a sour note stemming from concerns about an imminent U.S. government shutdown and an even more contentious debt ceiling battle in October. After the U.S. Congress reached a temporary agreement to end the shutdown, equities resumed their ascent and finished October on a strong note.
In this environment, the MSCI All Country World ex. U.S. Index recorded a positive return of 20.28%. Within the index, nine out of ten sectors posted positive returns. Consumer discretionary, health care and telecommunication services were the strongest performing sectors, while materials declined and energy and utilities lagged the broader index.
Curian/WMC International Equity Fund
Portfolio Composition†:
Financials | | | 26.0 | % | |
Industrials | | | 15.3 | | |
Consumer Discretionary | | | 13.1 | | |
Health Care | | | 11.6 | | |
Consumer Staples | | | 9.3 | | |
Information Technology | | | 8.2 | | |
Energy | | | 4.3 | | |
Materials | | | 4.2 | | |
Utilities | | | 2.7 | | |
Telecommunication Services | | | 1.0 | | |
Investment Companies | | | 1.4 | | |
Short Term Investments | | | 2.9 | | |
Total Investments | | | 100.0 | % | |
†Total Investments at October 31, 2013
Portfolio Manager Commentary: For the year ended October 31, 2013, Curian/WMC International Equity Fund outperformed its benchmark by posting a return of 22.36% compared to 20.28% for the MSCI All Country World ex. U.S. Index. Stock selection was the primary driver of outperformance during the period. Allocation among sectors, a residual of the bottom-up stock
selection process, also modestly contributed to positive relative performance.
The Fund benefitted from strong security selection within materials, financials, industrials and information technology. Partially offsetting positive relative results was the Fund's weak selection within energy and consumer staples. Sector allocation benefited from an underweight to materials and energy, as well as an overweight to industrials. An underweight to telecommunication services and overweight to health care as well as a modest cash position in a rising equity market partially offset positive results. From a regional perspective, security selection was strongest within Developed Europe (ex UK) and Developed North America but weakest in the UK and Japan. An underweight to emerging markets ("EM") and overweight exposure to Developed Europe (ex UK) contributed most to relative performance. Partially offsetting positive results was an overweight to Japan, which lagged in the third quarter of 2013 and through the end of October.
Top contributors to relative performance during the year included France based global insurance and investment management company AXA SA, Swiss based pharmaceutical and diagnostics holding company Roche Holding AG and large France based bank BNP Paribas SA. Top detractors from relative performance included Brazil based water utility company Cia de Saneamento Basico do Estado de Sao Paulo, Japan based real estate and construction company Daito Trust Construction Co. Ltd. and Luxembourg based mining and steel company ArcelorMittal S.A.
The Fund ended the year with overweight exposures to industrials, particularly capital goods companies, health care and consumer discretionary stocks. The Fund was most underweight to energy, telecommunication services and materials at the end of the year. Regionally, the Fund ended the year most overweight Developed Europe (ex UK) and Japan, while most underweight EM and Pacific Developed (ex Japan).
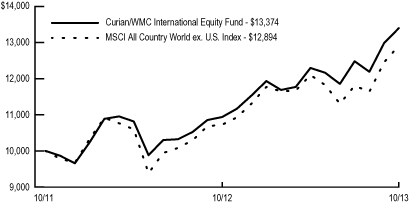
Total Return*
| 1 Year | | | 22.36 | % | |
Since Inception | | | 15.67 | | |
(Inception date November 2, 2011) | |
Expense Ratios**
Net Expense Ratio | |
Prospectus | | | 1.32 | % | |
Year ended October 31, 2013 | | | 1.32 | | |
Gross Expense Ratio
Prospectus | | | 1.48 | % | |
Year ended October 31, 2013 | | | 1.46 | | |
*Past performance is not predictive of future performance. Investment return and principal value will fluctuate so that an investor's shares, when redeemed, may be worth more or less than their original cost. Performance numbers are net of all Fund operating expenses, however, performance results do not reflect the deduction of taxes that a shareholder would pay on Fund distributions or the redemption of Fund shares.
**The prospectus expense ratios are from the Fund's prospectus dated February 28, 2013. Net expense ratio is net of contractual waivers.
The Fund's investment adviser waived/reimbursed certain expenses of the Fund. Performance results shown reflect the waiver, without which they would have been lower.
4
Curian Series Trust
Schedules of Investments
October 31, 2013
| | Shares/Par † | | Value | |
Curian/PIMCO Income Fund | | | | | |
NON-U.S. GOVERNMENT AGENCY ASSET-BACKED SECURITIES - 7.8% | | | | | |
Asset Backed Securities Corp. Home Equity Loan Trust REMIC, 0.80%, 09/25/34 (a) | | $ | 430,949 | | $ | 389,034 | |
Asset-Backed Pass-Through Certificates REMIC, 0.62%, 04/25/35 (a) | | 1,468,281 | | 1,439,298 | |
Banc of America Large Loan Trust REMIC, 2.47%, 11/15/15 (a) (b) | | 3,079,724 | | 3,080,411 | |
Banc of America Mortgage Trust REMIC, 2.75%, 09/25/34 (a) | | 1,308,868 | | 1,297,605 | |
Bear Stearns Asset Backed Securities Trust REMIC | | | | | |
0.66%, 07/25/35 (a) | | 367,897 | | 359,978 | |
1.37%, 01/25/45 (a) | | 554,214 | | 433,042 | |
Citigroup Mortgage Loan Trust REMIC, 5.74%, 09/25/37 (a) | | 409,662 | | 342,349 | |
Continental Airlines Pass-Through Trust | | | | | |
5.50%, 10/29/20 | | 1,300,000 | | 1,316,250 | |
4.00%, 10/29/24 | | 1,000,000 | | 986,000 | |
Countrywide Asset-Backed Certificates REMIC | | | | | |
1.03%, 08/25/34 (a) | | 1,100,000 | | 1,020,649 | |
0.82%, 06/25/35 (a) | | 600,000 | | 590,194 | |
Countrywide Home Loans Inc. Alternative Loan Trust REMIC, 3.40%, 08/25/18 | | 1,155,211 | | 1,161,277 | |
CVS Pass-Through Trust, 5.93%, 01/10/34 (b) | | 1,438,741 | | 1,588,150 | |
Delta Air Lines Inc. Pass-Through Trust | | | | | |
7.75%, 12/17/19 | | 571,379 | | 651,372 | |
6.72%, 01/02/23 | | 829,285 | | 916,360 | |
Federal Express Corp. Pass-Through Trust, 2.63%, 01/15/18 (c) | | 1,238,924 | | 1,251,561 | |
First Franklin Mortgage Loan Trust REMIC, 0.65%, 05/25/35 (a) | | 1,200,000 | | 1,082,932 | |
Home Equity Asset Trust REMIC, 1.27%, 07/25/35 (a) | | 1,950,000 | | 1,703,029 | |
HomeBanc Mortgage Trust REMIC, 0.44%, 10/25/35 (a) | | 744,311 | | 636,549 | |
Inwood Park CDO Ltd., 0.47%, 01/20/21 (a) (b) | | 152,259 | | 151,148 | |
Morgan Stanley ABS Capital I Inc. Trust REMIC, 0.78%, 03/25/35 (a) | | 1,000,000 | | 804,795 | |
New Century Home Equity Loan Trust REMIC, 0.45%, 10/25/35 (a) | | 2,420,774 | | 2,357,296 | |
Park Place Securities Inc. Asset-Backed Pass-Through Certificates REMIC | | | | | |
1.16%, 09/25/34 (a) | | 2,051,741 | | 1,804,572 | |
0.67%, 07/25/35 (a) | | 1,200,000 | | 1,127,952 | |
Progress Trust, 4.12%, 06/18/44 (a), AUD | | 994,952 | | 955,588 | |
Residential Asset Securities Corp. Trust REMIC, 0.61%, 01/25/36 (a) | | 1,500,000 | | 1,321,129 | |
SBA Tower Trust | | | | | |
4.25%, 04/15/15 (c) | | 1,000,000 | | 1,018,240 | |
5.10%, 04/17/17 (b) | | 1,000,000 | | 1,081,320 | |
REMIC, 3.60%, 04/15/18 (b) | | 2,300,000 | | 2,302,079 | |
Structured Asset Investment Loan Trust REMIC, 1.15%, 10/25/33 (a) | | 3,015,644 | | 2,873,966 | |
Structured Asset Securities Corp. Mortgage Pass-Through Certificates REMIC, 2.45%, 09/25/33 (a) | | 1,011,409 | | 992,123 | |
United Air Lines Inc. Pass-Through Trust | | | | | |
10.40%, 11/01/16 | | 931,319 | | 1,052,391 | |
9.75%, 01/15/17 | | 527,100 | | 606,165 | |
Washington Mutual Mortgage Pass-Through Certificates REMIC, 2.43%, 01/25/35 (a) | | 945,116 | | 932,445 | |
Wells Fargo Mortgage Backed Securities Trust REMIC | | | | | |
2.62%, 01/25/35 (a) | | 1,733,595 | | 1,719,121 | |
5.50%, 01/25/36 | | 57,773 | | 54,549 | |
WG Horizons CLO, 0.52%, 05/24/19 (a) (b) | | 621,645 | | 611,774 | |
Total Non-U.S. Government Agency Asset-Backed Securities (cost $41,577,801) | | | | 42,012,693 | |
| | | | | |
CORPORATE BONDS AND NOTES - 80.3% | | | | | |
CONSUMER DISCRETIONARY - 5.1% | | | | | |
Cablevision Systems Corp. Term Loan B, 2.67%, 04/15/20 (a) | | 798,000 | | 790,770 | |
Clear Channel Worldwide Holdings Inc., 6.50%, 11/15/22 | | 1,000,000 | | 1,050,000 | |
Corp. GEO SAB de CV, 8.88%, 03/27/22 (b) | | 800,000 | | 120,000 | |
COX Communications Inc., 6.25%, 06/01/18 (b) | | 2,000,000 | | 2,280,544 | |
D.R. Horton Inc., 4.75%, 05/15/17 | | 1,400,000 | | 1,480,500 | |
DISH DBS Corp., 5.88%, 07/15/22 | | 1,000,000 | | 1,023,750 | |
MCE Finance Ltd., 5.00%, 02/15/21 (b) | | 1,000,000 | | 990,000 | |
MGM Resorts International Term Loan B, 3.50%, 12/20/19 (a) | | 1,588,000 | | 1,585,443 | |
NBCUniversal Enterprise Inc., 5.25%, (callable at 100 beginning 03/19/21) (b) (d) | | 400,000 | | 396,000 | |
NBCUniversal Media LLC, 5.15%, 04/30/20 | | 3,000,000 | | 3,429,111 | |
Pearson Funding Five Plc, 3.25%, 05/08/23 (b) | | 1,000,000 | | 926,247 | |
Time Warner Cable Inc., 6.75%, 07/01/18 | | 2,000,000 | | 2,254,226 | |
Toll Brothers Finance Corp., 6.75%, 11/01/19 (e) | | 2,000,000 | | 2,255,000 | |
Viacom Inc. | | | | | |
4.25%, 09/01/23 | | 1,000,000 | | 1,021,388 | |
4.50%, 02/27/42 | | 2,000,000 | | 1,748,092 | |
Volkswagen International Finance NV | | | | | |
0.86%, 11/20/14 (a) (b) (e) | | 1,500,000 | | 1,506,410 | |
1.60%, 11/20/17 (c) | | 1,500,000 | | 1,490,235 | |
Whirlpool Corp., 4.70%, 06/01/22 | | 300,000 | | 316,247 | |
Wynn Las Vegas LLC, 5.38%, 03/15/22 (e) | | 1,209,000 | | 1,243,831 | |
Wynn Macau Ltd., 5.25%, 10/15/21 (c) | | 1,500,000 | | 1,533,750 | |
| | | | 27,441,544 | |
CONSUMER STAPLES - 3.6% | | | | | |
Altria Group Inc. | | | | | |
7.75%, 02/06/14 (f) | | 1,000,000 | | 1,018,077 | |
9.70%, 11/10/18 (f) | | 338,000 | | 453,760 | |
9.25%, 08/06/19 (f) | | 338,000 | | 450,995 | |
Anheuser-Busch InBev Worldwide Inc., 7.75%, 01/15/19 | | 4,000,000 | | 5,064,212 | |
Diageo Capital Plc, 4.83%, 07/15/20 | | 2,000,000 | | 2,250,016 | |
Kraft Foods Group Inc., 6.13%, 08/23/18 | | 2,700,000 | | 3,188,568 | |
PepsiCo Inc., 0.44%, 07/30/15 (a) | | 1,500,000 | | 1,500,881 | |
SABMiller Holdings Inc., 1.85%, 01/15/15 (b) | | 2,200,000 | | 2,227,735 | |
Tesco Plc, 2.00%, 12/05/14 (b) | | 1,500,000 | | 1,519,257 | |
Wesfarmers Ltd., 2.98%, 05/18/16 (b) | | 1,000,000 | | 1,047,250 | |
Woolworths Ltd., 2.55%, 09/22/15 (b) | | 519,000 | | 534,958 | |
| | | | 19,255,709 | |
| | | | | | | |
See accompanying Notes to Financial Statements.
| | Shares/Par † | | Value | |
ENERGY - 15.2% | | | | | |
AK Transneft OJSC Via TransCapitalInvest Ltd., 5.67%, 03/05/14 | | 1,400,000 | | 1,422,540 | |
Anadarko Petroleum Corp., 8.70%, 03/15/19 | | 3,000,000 | | 3,893,076 | |
Arch Coal Inc. | | | | | |
7.25%, 10/01/20 (e) | | 600,000 | | 456,750 | |
7.25%, 06/15/21 (e) | | 1,100,000 | | 838,750 | |
BG Energy Capital Plc, 4.00%, 10/15/21 (b) | | 3,000,000 | | 3,124,611 | |
BP AMI Leasing Inc., 5.52%, 05/08/19 (b) | | 3,610,000 | | 4,128,847 | |
Canadian Oil Sands Ltd., 4.50%, 04/01/22 (b) | | 100,000 | | 101,686 | |
CNOOC Curtis Funding No. 1 Pty Ltd, 4.50%, 10/03/23 (b) | | 700,000 | | 715,330 | |
CNOOC Finance 2013 Ltd. | | | | | |
1.75%, 05/09/18 | | 800,000 | | 786,057 | |
3.00%, 05/09/23 | | 1,800,000 | | 1,638,851 | |
Concho Resources Inc., 5.50%, 04/01/23 | | 1,500,000 | | 1,556,250 | |
Continental Resources Inc., 5.00%, 09/15/22 | | 1,100,000 | | 1,145,375 | |
Devon Energy Corp., 3.25%, 05/15/22 | | 400,000 | | 388,398 | |
EP Energy LLC, 6.88%, 05/01/19 | | 300,000 | | 322,500 | |
Gazprom OAO Via Gaz Capital SA | | | | | |
8.13%, 07/31/14 (b) | | 1,300,000 | | 1,367,210 | |
8.15%, 04/11/18 (b) | | 600,000 | | 706,500 | |
9.25%, 04/23/19 | | 1,000,000 | | 1,247,500 | |
Harvest Operations Corp., 6.88%, 10/01/17 | | 620,000 | | 665,725 | |
KazMunayGas National Co. JSC, 4.40%, 04/30/23 (b) (e) | | 600,000 | | 569,220 | |
Kinder Morgan Energy Partners LP, 6.00%, 02/01/17 | | 2,300,000 | | 2,612,844 | |
Lukoil International Finance BV, 3.42%, 04/24/18 (b) | | 1,100,000 | | 1,108,250 | |
MarkWest Energy Partners LP | | | | | |
5.50%, 02/15/23 | | 1,300,000 | | 1,345,500 | |
4.50%, 07/15/23 | | 1,900,000 | | 1,843,000 | |
Midcontinent Express Pipeline LLC, 6.70%, 09/15/19 (c) | | 2,100,000 | | 2,046,540 | |
Midstates Petroleum Co. Inc., 10.75%, 10/01/20 | | 1,250,000 | | 1,350,000 | |
Nabors Industries Inc., 2.35%, 09/15/16 (c) | | 500,000 | | 506,666 | |
NGPL PipeCo LLC | | | | | |
7.12%, 12/15/17 (b) (e) | | 2,600,000 | | 2,457,000 | |
9.63%, 06/01/19 (b) | | 2,000,000 | | 2,000,000 | |
Noble Holding International Ltd., 3.95%, 03/15/22 (e) | | 1,500,000 | | 1,486,374 | |
Northwest Pipeline LLC, 6.05%, 06/15/18 | | 2,000,000 | | 2,344,694 | |
Novatek OAO via Novatek Finance Ltd., 4.42%, 12/13/22 (b) | | 1,600,000 | | 1,522,000 | |
OGX Austria GmbH | | | | | |
8.50%, 06/01/18 (b) (e) (g) (h) | | 2,500,000 | | 237,500 | |
8.38%, 04/01/22 (b) (g) (h) | | 1,000,000 | | 95,000 | |
ONEOK Partners LP | | | | | |
3.38%, 10/01/22 | | 800,000 | | 760,014 | |
5.00%, 09/15/23 | | 1,100,000 | | 1,175,089 | |
Pacific Rubiales Energy Corp., 5.13%, 03/28/23 (b) | | 400,000 | | 383,000 | |
Petrofac Ltd., 3.40%, 10/10/18 (c) | | 700,000 | | 710,884 | |
Petrohawk Energy Corp., 6.25%, 06/01/19 | | 2,000,000 | | 2,192,042 | |
Pioneer Natural Resources Co. | | | | | |
5.88%, 07/15/16 | | 600,000 | | 669,575 | |
6.88%, 05/01/18 | | 500,000 | | 595,911 | |
7.50%, 01/15/20 | | 1,600,000 | | 1,983,842 | |
Plains All American Pipeline LP | | | | | |
8.75%, 05/01/19 | | 1,000,000 | | 1,290,903 | |
5.00%, 02/01/21 | | 1,510,000 | | 1,653,781 | |
Pride International Inc. | | | | | |
8.50%, 06/15/19 | | 900,000 | | 1,148,621 | |
6.88%, 08/15/20 | | 700,000 | | 839,593 | |
Rockies Express Pipeline LLC | | | | | |
3.90%, 04/15/15 (b) | | 600,000 | | 600,000 | |
6.00%, 01/15/19 (b) (e) | | 2,450,000 | | 2,174,375 | |
Rosneft Finance SA | | | | | |
7.50%, 07/18/16 (b) | | 1,300,000 | | 1,457,625 | |
7.88%, 03/13/18 | | 1,000,000 | | 1,161,250 | |
Rosneft Oil Co. via Rosneft International Finance Ltd. | | | | | |
3.15%, 03/06/17 (b) | | 1,000,000 | | 1,007,500 | |
4.20%, 03/06/22 (b) | | 600,000 | | 562,500 | |
Southern Natural Gas Co. LLC, 4.40%, 06/15/21 | | 2,000,000 | | 2,096,238 | |
Southwestern Energy Co., 4.10%, 03/15/22 | | 1,125,000 | | 1,136,972 | |
Statoil ASA, 6.70%, 01/15/18 | | 1,500,000 | | 1,775,755 | |
Sunoco Logistics Partners Operations LP, 3.45%, 01/15/23 | | 500,000 | | 471,666 | |
Targa Resources Partners LP | | | | | |
6.88%, 02/01/21 | | 50,000 | | 53,875 | |
6.38%, 08/01/22 | | 1,725,000 | | 1,837,125 | |
5.25%, 05/01/23 | | 1,030,000 | | 1,030,000 | |
Total Capital Canada Ltd., 0.62%, 01/15/16 (a) | | 1,200,000 | | 1,206,695 | |
Total Capital International SA, 0.83%, 08/10/18 (a) | | 1,500,000 | | 1,508,436 | |
Transocean Inc., 6.00%, 03/15/18 | | 2,500,000 | | 2,827,550 | |
Walter Energy Inc., 9.88%, 12/15/20 (b) (e) | | 610,000 | | 539,850 | |
Western Gas Partners LP, 4.00%, 07/01/22 | | 1,000,000 | | 992,295 | |
| | | | 81,873,506 | |
FINANCIALS - 32.6% | | | | | |
Ally Financial Inc., 4.50%, 02/11/14 | | 500,000 | | 503,750 | |
American Campus Communities Operating Partnership LP, 3.75%, 04/15/23 | | 650,000 | | 624,493 | |
American Express Co., 6.15%, 08/28/17 | | 2,200,000 | | 2,567,635 | |
American Express Credit Corp., 0.75%, 07/29/16 (a) | | 1,200,000 | | 1,205,908 | |
American Tower Corp., 4.50%, 01/15/18 | | 2,000,000 | | 2,151,044 | |
Banco Continental SA via Continental Senior Trustees II Cayman Ltd., 5.75%, 01/18/17 (b) (e) | | 1,000,000 | | 1,085,000 | |
Banco de Credito del Peru, 4.25%, 04/01/23 (b) (e) | | 800,000 | | 762,000 | |
Banco de Credito e Inversiones, 4.00%, 02/11/23 (b) | | 400,000 | | 373,454 | |
Banco del Estado de Chile, 2.00%, 11/09/17 (b) | | 1,850,000 | | 1,816,463 | |
Banco do Brasil SA, 3.88%, 10/10/22 | | 900,000 | | 819,000 | |
Banco Santander Brasil SA | | | | | |
4.50%, 04/06/15 (b) | | 1,000,000 | | 1,035,000 | |
4.25%, 01/14/16 (b) | | 2,000,000 | | 2,077,000 | |
4.63%, 02/13/17 (b) (e) | | 1,700,000 | | 1,785,000 | |
Bank of America Corp. | | | | | |
0.00%, 01/04/17 (i) | | 3,200,000 | | 3,036,256 | |
7.63%, 06/01/19 | | 8,500,000 | | 10,593,388 | |
See accompanying Notes to Financial Statements.
| | Shares/Par † | | Value | |
Banque PSA Finance SA | | | | | |
2.14%, 04/04/14 (a) (c) | | 200,000 | | 199,440 | |
4.38%, 04/04/16 (b) | | 1,700,000 | | 1,756,707 | |
Barclays Bank Plc, 14.00%, (callable at 100 beginning 12/15/19) (d), GBP | | 1,200,000 | | 2,631,199 | |
BBVA US Senior SAU, 4.66%, 10/09/15 | | 1,900,000 | | 2,000,506 | |
Bear Stearns Cos. LLC, 6.40%, 10/02/17 | | 1,300,000 | | 1,519,990 | |
Biomed Realty LP, 4.25%, 07/15/22 | | 1,200,000 | | 1,178,648 | |
BPCE SA, 5.70%, 10/22/23 (c) | | 800,000 | | 820,118 | |
Caterpillar Financial Services Corp., 5.45%, 04/15/18 | | 2,000,000 | | 2,306,046 | |
CIT Group Inc., 4.25%, 08/15/17 | | 700,000 | | 734,125 | |
Citigroup Inc. | | | | | |
5.50%, 10/15/14 | | 445,000 | | 464,887 | |
1.04%, 04/01/16 (a) (e) | | 5,000,000 | | 5,019,300 | |
1.20%, 07/25/16 (a) | | 600,000 | | 605,508 | |
5.95% (callable at 100 beginning 01/30/23) (d) | | 1,300,000 | | 1,239,875 | |
Countrywide Financial Corp., 6.25%, 05/15/16 | | 400,000 | | 443,068 | |
Credit Suisse AG, 6.50%, 08/08/23 (c) | | 700,000 | | 747,180 | |
Eksportfinans ASA | | | | | |
2.38%, 05/25/16 | | 500,000 | | 487,250 | |
5.50%, 05/25/16 | | 1,540,000 | | 1,612,380 | |
5.50%, 06/26/17 | | 700,000 | | 733,600 | |
Experian Finance Plc, 2.38%, 06/15/17 (b) | | 1,200,000 | | 1,194,937 | |
Fidelity National Financial Inc., 5.50%, 09/01/22 | | 900,000 | | 954,865 | |
First American Financial Corp., 4.30%, 02/01/23 | | 1,100,000 | | 1,070,449 | |
Ford Motor Credit Co. LLC | | | | | |
8.00%, 06/01/14 | | 200,000 | | 208,524 | |
1.36%, 08/28/14 (a) | | 1,300,000 | | 1,307,933 | |
8.70%, 10/01/14 | | 2,300,000 | | 2,464,537 | |
2.75%, 05/15/15 | | 1,700,000 | | 1,745,065 | |
12.00%, 05/15/15 | | 1,050,000 | | 1,221,731 | |
2.50%, 01/15/16 | | 1,400,000 | | 1,436,865 | |
Goldman Sachs Group Inc., 5.95%, 01/18/18 | | 10,600,000 | | 12,165,132 | |
HSBC Finance Corp. | | | | | |
0.69%, 06/01/16 (a) (e) | | 600,000 | | 598,340 | |
6.68%, 01/15/21 | | 3,900,000 | | 4,531,047 | |
ICICI Bank Ltd. | | | | | |
5.50%, 03/25/15 | | 500,000 | | 519,033 | |
4.75%, 11/25/16 (b) | | 682,000 | | 709,557 | |
ING Bank NV, 2.00%, 09/25/15 (c) | | 1,000,000 | | 1,015,710 | |
International Lease Finance Corp., 6.75%, 09/01/16 (b) | | 4,000,000 | | 4,445,000 | |
Intesa Sanpaolo SpA, 3.13%, 01/15/16 | | 3,500,000 | | 3,569,003 | |
Itau Unibanco Holding SA, 6.20%, 12/21/21 (b) (e) | | 600,000 | | 622,500 | |
JPMorgan Chase & Co., 0.96%, 03/31/16 (a) | | 1,500,000 | | 1,479,884 | |
JPMorgan Chase Bank NA | | | | | |
0.58%, 06/13/16 (a) | | 1,000,000 | | 990,528 | |
5.38%, 09/28/16, GBP | | 1,000,000 | | 1,760,081 | |
0.89%, 05/31/17 (a), EUR | | 3,500,000 | | 4,685,612 | |
6.00%, 07/05/17 | | 1,000,000 | | 1,142,708 | |
6.00%, 10/01/17 | | 7,000,000 | | 8,067,395 | |
Korea Development Bank, 3.00%, 09/14/22 (e) | | 1,000,000 | | 960,786 | |
Korea Exchange Bank, 3.13%, 06/26/17 (b) | | 1,100,000 | | 1,134,719 | |
Lazard Group LLC, 7.13%, 05/15/15 | | 2,800,000 | | 3,023,798 | |
LBG Capital No.1 Plc | | | | | |
7.59%, 05/12/20, GBP | | 900,000 | | 1,518,832 | |
8.00% (callable at 100 beginning 06/15/20) (b) (d) | | 1,000,000 | | 1,062,500 | |
LBG Capital No.2 Plc | | | | | |
7.63%, 12/09/19, GBP | | 300,000 | | 496,272 | |
15.00%, 12/21/19, EUR | | 500,000 | | 1,006,436 | |
LeasePlan Corp. NV, 2.50%, 05/16/18 (c) | | 3,000,000 | | 2,955,963 | |
Lloyds Bank Plc, 12.00%, (callable at 100 beginning 12/16/24) (b) (d) | | 1,200,000 | | 1,614,000 | |
Merrill Lynch & Co. Inc., 6.88%, 04/25/18 | | 2,500,000 | | 2,968,498 | |
Moody’s Corp., 4.88%, 02/15/24 | | 3,400,000 | | 3,442,616 | |
Morgan Stanley | | | | | |
5.95%, 12/28/17 | | 1,000,000 | | 1,143,237 | |
7.30%, 05/13/19 | | 2,100,000 | | 2,563,846 | |
5.63%, 09/23/19 | | 1,300,000 | | 1,482,936 | |
Nationstar Mortgage LLC | | | | | |
9.63%, 05/01/19 | | 150,000 | | 169,125 | |
7.88%, 10/01/20 | | 150,000 | | 160,313 | |
6.50%, 07/01/21 | | 300,000 | | 294,750 | |
Nippon Life Insurance Co., 5.00%, 10/18/42 (a) (b) | | 600,000 | | 609,000 | |
NYSE Euronext, 2.00%, 10/05/17 | | 1,500,000 | | 1,507,461 | |
Piper Jaffray Cos., 4.25%, 05/31/14 (a) (c) | | 700,000 | | 700,909 | |
QBE Insurance Group Ltd., 2.40%, 05/01/18 (b) | | 1,100,000 | | 1,079,392 | |
RCI Banque SA, 3.50%, 04/03/18 (c) (e) | | 1,100,000 | | 1,131,837 | |
RPI Finance Trust Term Loan B, 3.50%, 05/09/18 (a) | | 1,454,962 | | 1,467,692 | |
Sberbank of Russia Via SB Capital SA | | | | | |
5.40%, 03/24/17 | | 800,000 | | 863,000 | |
5.18%, 06/28/19 | | 1,500,000 | | 1,591,650 | |
SL Green Realty Corp., 4.50%, 12/01/22 | | 1,500,000 | | 1,461,920 | |
SLM Corp. | | | | | |
5.38%, 05/15/14 | | 1,300,000 | | 1,327,625 | |
6.25%, 01/25/16 | | 2,300,000 | | 2,504,125 | |
8.45%, 06/15/18 | | 2,900,000 | | 3,385,750 | |
SSIF Nevada LP, 0.94%, 04/14/14 (a) (b) | | 1,500,000 | | 1,504,149 | |
SteelRiver Transmission Co. LLC, 4.71%, 06/30/17 (c) | | 239,261 | | 249,007 | |
Sydney Airport Finance Co. Pty Ltd., 5.13%, 02/22/21 (b) (f) | | 1,560,000 | | 1,667,195 | |
UBS AG, 7.63%, 08/17/22 | | 1,200,000 | | 1,367,639 | |
Union Bank NA, 1.00%, 09/26/16 (a) | | 500,000 | | 503,866 | |
Wachovia Corp., 5.75%, 02/01/18 | | 5,400,000 | | 6,300,855 | |
Walter Investment Management Corp. Term Loan B, 5.75%, 12/01/17 (a) | | 1,924,051 | | 1,940,482 | |
Weyerhaeuser Co., 7.38%, 10/01/19 | | 2,800,000 | | 3,429,882 | |
Woodside Finance Ltd., 4.60%, 05/10/21 (b) | | 2,000,000 | | 2,137,598 | |
| | | | 175,571,315 | |
HEALTH CARE - 4.3% | | | | | |
AbbVie Inc., 1.20%, 11/06/15 | | 1,900,000 | | 1,913,285 | |
Amgen Inc. | | | | | |
2.30%, 06/15/16 | | 4,850,000 | | 5,009,672 | |
4.50%, 03/15/20 | | 1,400,000 | | 1,517,473 | |
4.10%, 06/15/21 | | 200,000 | | 208,934 | |
3.88%, 11/15/21 | | 1,100,000 | | 1,138,612 | |
3.63%, 05/15/22 | | 700,000 | | 707,323 | |
5.15%, 11/15/41 | | 600,000 | | 604,393 | |
Gilead Sciences Inc., 2.40%, 12/01/14 | | 1,900,000 | | 1,935,524 | |
HCA Inc. Term Loan B-4, 2.93%, 05/01/18 (a) | | 2,500,000 | | 2,502,825 | |
Hospira Inc., 6.05%, 03/30/17 | | 1,200,000 | | 1,323,755 | |
Mylan Inc., 1.80%, 06/24/16 (c) | | 700,000 | | 705,061 | |
Sanofi, 2.63%, 03/29/16 | | 3,000,000 | | 3,134,346 | |
See accompanying Notes to Financial Statements.
| | Shares/Par † | | Value | |
Teva Pharmaceutical Finance Co. BV, 3.65%, 11/10/21 | | 1,500,000 | | 1,491,875 | |
Valeant Pharmaceuticals Term Loan BD, 3.75%, 02/13/19 (a) | | 987,500 | | 995,212 | |
| | | | 23,188,290 | |
INDUSTRIALS - 3.5% | | | | | |
AABS Ltd. Term Loan A, 4.88%, 01/10/38 (a) (c) (j) | | 953,125 | | 962,919 | |
ADT Corp. | | | | | |
3.50%, 07/15/22 | | 100,000 | | 87,656 | |
4.13%, 06/15/23 | | 600,000 | | 540,836 | |
Asciano Finance Ltd., 4.63%, 09/23/20 (b) | | 1,000,000 | | 1,018,025 | |
Aviation Capital Group Corp. | | | | | |
3.88%, 09/27/16 (c) | | 1,700,000 | | 1,720,789 | |
4.63%, 01/31/18 (c) | | 1,400,000 | | 1,427,286 | |
7.13%, 10/15/20 (b) | | 1,000,000 | | 1,109,196 | |
AWAS Aviation Capital Ltd., 7.00%, 10/17/16 (b) | | 712,000 | | 738,700 | |
Burlington Northern Santa Fe LLC | | | | | |
5.40%, 06/01/41 | | 2,500,000 | | 2,640,870 | |
4.38%, 09/01/42 | | 1,000,000 | | 916,444 | |
CSX Corp., 4.75%, 05/30/42 | | 500,000 | | 488,508 | |
Heathrow Funding Ltd., 2.50%, 06/25/15 (b) | | 1,100,000 | | 1,114,938 | |
Masco Corp. | | | | | |
6.13%, 10/03/16 | | 1,000,000 | | 1,115,000 | |
7.13%, 03/15/20 | | 1,000,000 | | 1,140,000 | |
Penske Truck Leasing Co. LP | | | | | |
3.75%, 05/11/17 (b) | | 1,000,000 | | 1,049,489 | |
3.38%, 03/15/18 (b) | | 1,000,000 | | 1,029,755 | |
USG Corp., 7.88%, 03/30/20 (c) (e) | | 800,000 | | 880,000 | |
Verisk Analytics Inc., 4.13%, 09/12/22 | | 975,000 | | 969,685 | |
| | | | 18,950,096 | |
INFORMATION TECHNOLOGY - 2.0% | | | | | |
Activision Blizzard Inc. Term Loan B, 3.25%, 09/15/20 (a) | | 400,000 | | 401,216 | |
Autodesk Inc., 1.95%, 12/15/17 | | 1,200,000 | | 1,180,007 | |
Baidu Inc., 3.25%, 08/06/18 | | 2,400,000 | | 2,451,171 | |
Dell Inc Term Loan B, 3.50%, 03/24/20 (a) | | 1,600,000 | | 1,590,160 | |
Hewlett-Packard Co. | | | | | |
0.66%, 05/30/14 (a) | | 2,000,000 | | 2,000,586 | |
1.80%, 09/19/14 (a) | | 1,700,000 | | 1,715,866 | |
Symantec Corp., 3.95%, 06/15/22 | | 1,400,000 | | 1,389,984 | |
| | | | 10,728,990 | |
MATERIALS - 4.1% | | | | | |
Anglo American Capital Plc, 2.63%, 04/03/17 (b) | | 1,050,000 | | 1,057,422 | |
Barrick North America Finance LLC, 4.40%, 05/30/21 | | 2,500,000 | | 2,400,447 | |
Building Materials Corp. of America, 6.75%, 05/01/21 (b) | | 1,230,000 | | 1,337,625 | |
Cemex SAB de CV | | | | | |
9.50%, 06/15/18 (b) | | 400,000 | | 455,000 | |
5.88%, 03/25/19 (b) | | 1,200,000 | | 1,174,500 | |
Cliffs Natural Resources Inc., 4.88%, 04/01/21 (k) | | 1,500,000 | | 1,474,910 | |
Dow Chemical Co., 8.55%, 05/15/19 (f) | | 300,000 | | 388,170 | |
Ecolab Inc. | | | | | |
2.38%, 12/08/14 | | 800,000 | | 814,130 | |
4.35%, 12/08/21 | | 2,000,000 | | 2,121,918 | |
EuroChem Mineral & Chemical Co. OJSC via EuroChem GI Ltd., 5.13%, 12/12/17 (b) | | 600,000 | | 605,250 | |
Freeport-McMoRan Copper & Gold Inc. | | | | | |
1.40%, 02/13/15 | | 2,000,000 | | 2,010,152 | |
3.88%, 03/15/23 | | 700,000 | | 662,292 | |
Georgia-Pacific LLC, 5.40%, 11/01/20 (b) | | 500,000 | | 565,099 | |
LyondellBasell Industries NV, 5.75%, 04/15/24 | | 600,000 | | 686,773 | |
Mongolian Mining Corp., 8.88%, 03/29/17 (b) (e) | | 700,000 | | 572,250 | |
New Gold Inc., 6.25%, 11/15/22 (b) | | 900,000 | | 886,500 | |
OJSC Novolipetsk Steel via Steel Funding Ltd., 4.45%, 02/19/18 (c) | | 700,000 | | 700,000 | |
Rock Tenn Co., 3.50%, 03/01/20 | | 1,000,000 | | 997,787 | |
Walter Energy Inc., 8.50%, 04/15/21 (b) (e) | | 575,000 | | 487,313 | |
Westlake Chemical Corp., 3.60%, 07/15/22 | | 1,200,000 | | 1,157,395 | |
Xstrata Finance Canada Ltd., 2.70%, 10/25/17 (c) | | 1,700,000 | | 1,707,662 | |
| | | | 22,262,595 | |
TELECOMMUNICATION SERVICES - 5.8% | | | | | |
CC Holdings GS V LLC, 2.38%, 12/15/17 | | 550,000 | | 544,318 | |
Crown Castle Towers LLC, 5.50%, 01/15/17 (b) | | 1,500,000 | | 1,657,328 | |
Deutsche Telekom International Finance BV, 3.13%, 04/11/16 (b) | | 2,600,000 | | 2,718,453 | |
Intelsat Jackson Holdings SA Term Loan B-1, 4.25%, 04/02/18 (a) | | 1,342,495 | | 1,348,925 | |
MetroPCS Wireless Inc., 6.25%, 04/01/21 (b) | | 1,100,000 | | 1,150,875 | |
Telecom Italia Capital SA | | | | | |
5.25%, 11/15/13 | | 200,000 | | 200,297 | |
6.18%, 06/18/14 | | 650,000 | | 667,767 | |
Telefonica Emisiones SAU | | | | | |
5.43%, 02/03/14, EUR | | 450,000 | | 618,166 | |
4.67%, 02/07/14, EUR | | 450,000 | | 617,313 | |
4.97%, 02/03/16, EUR | | 1,000,000 | | 1,461,305 | |
6.42%, 06/20/16 | | 500,000 | | 556,664 | |
Telstra Corp. Ltd., 4.80%, 10/12/21 (b) | | 2,000,000 | | 2,193,206 | |
Verizon Communications Inc. | | | | | |
4.50%, 09/15/20 | | 1,200,000 | | 1,298,302 | |
5.15%, 09/15/23 | | 6,600,000 | | 7,157,878 | |
6.55%, 09/15/43 | | 3,000,000 | | 3,478,734 | |
Verizon Wireless Capital LLC, 8.50%, 11/15/18 | | 3,000,000 | | 3,858,963 | |
Vimpel Communications Via VIP Finance Ireland Ltd. OJSC, 7.75%, 02/02/21 (b) | | 700,000 | | 766,500 | |
Virgin Media Secured Finance Plc, 5.38%, 04/15/21 (b) | | 800,000 | | 804,000 | |
| | | | 31,098,994 | |
UTILITIES - 4.1% | | | | | |
Appalachian Power Co., 5.00%, 06/01/17 | | 2,000,000 | | 2,202,380 | |
CMS Energy Corp., 5.05%, 02/15/18 | | 1,500,000 | | 1,664,017 | |
Dominion Resources Inc., 5.15%, 07/15/15 | | 4,850,000 | | 5,197,726 | |
Duquesne Light Holdings Inc., 5.90%, 12/01/21 (b) | | 1,400,000 | | 1,576,903 | |
Energy Future Intermediate Holding Co. LLC, 6.88%, 08/15/17 (b) (e) | | 2,000,000 | | 2,045,000 | |
ENN Energy Holdings Ltd., 6.00%, 05/13/21 | | 400,000 | | 429,134 | |
IPALCO Enterprises Inc., 7.25%, 04/01/16 (b) | | 1,400,000 | | 1,540,000 | |
Jersey Central Power & Light Co., 4.80%, 06/15/18 | | 3,000,000 | | 3,224,478 | |
See accompanying Notes to Financial Statements.
| | Shares/Par † | | Value | |
MidAmerican Energy Holdings Co., 5.95%, 05/15/37 | | 1,500,000 | | 1,675,711 | |
Puget Energy Inc., 6.50%, 12/15/20 | | 1,500,000 | | 1,710,372 | |
Tokyo Electric Power Co. Inc., 4.50%, 03/24/14, EUR | | 500,000 | | 680,982 | |
| | | | 21,946,703 | |
| | | | | |
Total Corporate Bonds and Notes (cost $428,974,334) | | | | 432,317,742 | |
| | | | | |
GOVERNMENT AND AGENCY OBLIGATIONS - 13.5% | | | | | |
GOVERNMENT SECURITIES - 9.8% | | | | | |
Municipals - 1.6% | | | | | |
City of New York, GO, 5.97%, 03/01/36 | | 1,000,000 | | 1,134,720 | |
Los Angeles Community College District, GO, 6.75%, 08/01/49 | | 1,165,000 | | 1,479,666 | |
Metropolitan Transportation Authority, RB, 6.81%, 11/15/40 | | 1,000,000 | | 1,218,010 | |
New Jersey State Turnpike Authority, RB, 7.10%, 01/01/41 | | 1,420,000 | | 1,832,425 | |
Port Authority of New York & New Jersey, RB, 4.93%, 10/01/51 | | 1,000,000 | | 973,320 | |
Sacramento Municipal Utility District, RB, 6.16%, 05/15/36 | | 1,000,000 | | 1,099,000 | |
Triborough Bridge & Tunnel Authority, RB, 5.50%, 11/15/39 | | 1,000,000 | | 1,045,910 | |
| | | | 8,783,051 | |
Sovereign - 1.8% | | | | | |
Autonomous Community of Valencia, Spain, 4.38%, 07/16/15, EUR | | 200,000 | | 275,624 | |
Italy Buoni Poliennali Del Tesoro, 3.50%, 06/01/18, EUR | | 2,700,000 | | 3,788,380 | |
Junta de Castilla y Leon, 6.51%, 03/01/19, EUR | | 400,000 | | 622,835 | |
Xunta de Galicia, 5.76%, 04/03/17, EUR | | 3,400,000 | | 5,032,994 | |
| | | | 9,719,833 | |
U.S. Treasury Securities - 6.4% | | | | | |
U.S. Treasury Bond | | | | | |
3.13%, 02/15/42 (k) | | 20,000,000 | | 18,203,120 | |
3.00%, 05/15/42 (k) (l) | | 3,600,000 | | 3,189,377 | |
2.75%, 08/15/42 (k) | | 600,000 | | 502,875 | |
2.75%, 11/15/42 (k) (l) | | 6,200,000 | | 5,186,684 | |
U.S. Treasury Note, 1.63%, 11/15/22 (k) (l) | | 7,700,000 | | 7,185,063 | |
| | | | 34,267,119 | |
U.S. GOVERNMENT AGENCY MORTGAGE-BACKED SECURITIES - 3.7% | | | | | |
Federal National Mortgage Association - 3.7% | | | | | |
Federal National Mortgage Association | | | | | |
4.00%, 01/01/41 - 05/01/42 (k) | | 6,005,514 | | 6,329,059 | |
3.00%, 12/15/42, TBA (l) | | 14,000,000 | | 13,770,312 | |
| | | | 20,099,371 | |
| | | | | |
Total Government and Agency Obligations (cost $72,991,389) | | | | 72,869,374 | |
| | | | | |
COMMON STOCKS - 0.0% | | | | | |
SFX Entertainment Inc. (h) | | 433 | | 3,715 | |
Total Common Stocks (cost $5,629) | | | | 3,715 | |
| | | | | |
PREFERRED STOCKS - 0.4% | | | | | |
FINANCIALS - 0.4% | | | | | |
CoBank ACB, 6.25%, (callable at 100 beginning 10/01/22) (c) (d) | | 20,000 | | 1,981,250 | |
Total Preferred Stocks (cost $2,125,000) | | | | 1,981,250 | |
| | | | | |
PURCHASED OPTIONS - 0.1% | | | | | |
Interest Rate Put Swaption, 3 month LIBOR versus 3.45% fixed, Expiration 09/21/15, DUB | | 50 | | 628,971 | |
Total Purchased Options (cost $396,342) | | | | 628,971 | |
| | | | | |
SHORT TERM INVESTMENTS - 11.0% | | | | | |
Certificates of Deposit - 0.5% | | | | | |
Itau Unibanco NY, 1.33%, 03/03/14 | | $ | 2,500,000 | | 2,487,380 | |
Commercial Paper - 4.7% | | | | | |
BP Capital Markets Plc, 0.09%, 11/21/13 | | 7,000,000 | | 6,999,650 | |
E. I. du Pont de Nemours & Co., 0.08%, 12/04/13 | | 2,000,000 | | 1,999,853 | |
Electricite de France SA, 0.12%, 11/21/13 | | 4,000,000 | | 3,999,733 | |
Ford Motor Credit Co. LLC, 1.00%, 11/22/13 | | 1,000,000 | | 999,425 | |
Philip Morris International Inc., 0.17%, 11/20/13 | | 2,500,000 | | 2,499,776 | |
Sanofi, 0.09%, 11/27/13 | | 3,000,000 | | 2,999,805 | |
Toyota Motor Credit Corp., 0.11%, 11/01/13 | | 3,000,000 | | 2,999,990 | |
Wal-Mart Stores Inc., 0.18%, 11/25/13 | | 2,500,000 | | 2,499,708 | |
| | | | 24,997,940 | |
Federal Home Loan Mortgage Corp. - 1.9% (m) | | | | | |
Federal Home Loan Mortgage Corp., 0.11%, 07/11/14 | | 10,400,000 | | 10,393,448 | |
Securities Lending Collateral - 3.5% | | | | | |
Fidelity Institutional Money Market Portfolio, 0.08% (n) | | 10,000,000 | | 10,000,000 | |
Repurchase Agreement with DUB, 0.10% (Collateralized by $4,712,910 U.S. Treasury Bond Strip, due 08/15/20-11/15/42, value $2,910,660, $4,377,284 U.S. Treasury Note, 0.75-3.75%, due 05/31/14-01/15/20, value $4,800,679, $728,459 U.S. Treasury Bond, 2.75-8.75%, due 08/15/20-08/15/42, value $952,369, and $69,310 U.S. Treasury Inflation Indexed Note, 3.38%, due 04/15/32, value $128,821) acquired on 10/31/13, due 11/01/13 at $8,620,149 | | $ | 8,620,125 | | 8,620,125 | |
| | | | 18,620,125 | |
Treasury Securities - 0.4% | | | | | |
U.S. Treasury Bill | | | | | |
0.04%, 01/02/14 (k) | | 2,026,000 | | 2,025,913 | |
0.11%, 05/01/14 (k) | | 23,000 | | 22,991 | |
0.14%, 08/21/14 (k) | | 285,000 | | 284,820 | |
See accompanying Notes to Financial Statements.
| | Shares/Par † | | Value | |
0.00%, 10/16/14 (k) | | 43,000 | | 42,961 | |
| | | | 2,376,685 | |
Total Short Term Investments (cost $58,875,258) | | | | 58,875,578 | |
| | | | | |
Total Investments - 113.1% (cost $604,945,753) | | | | 608,689,323 | |
Total Forward Sales Commitments - (1.0%) (proceeds $5,228,906) | | | | (5,266,406 | ) |
Other Assets and Liabilities, Net - (12.1%) | | | | (65,058,539 | ) |
Total Net Assets - 100.0% | | | | $ | 538,364,378 | |
| | | | | |
FORWARD SALES COMMITMENTS - 1.0% | | | | | |
GOVERNMENT AND AGENCY OBLIGATIONS - 1.0% | | | | | |
U.S. GOVERNMENT AGENCY MORTGAGE-BACKED SECURITIES - 1.0% | | | | | |
Federal National Mortgage Association - 1.0% | | | | | |
Federal National Mortgage Association, 4.00%, 11/15/43 , TBA (l) | | $ | 5,000,000 | | $ | 5,266,406 | |
| | | | | |
Total Government and Agency Obligations - 1.0% (proceeds $5,228,906) | | | | $ | 5,266,406 | |
| | | | | | | |
(a) | | Variable rate security. Rate stated was in effect as of October 31, 2013. |
(b) | | Rule 144A, Section 4(2) of the Securities Act of 1933 or other security which is restricted to resale to institutional investors. The Sub-Adviser has deemed these securities to be liquid based on procedures approved by the Trust’s Board of Trustees. As of October 31, 2013, the value of Rule 144A and Section 4(2) liquid securities was $101,345,786. |
(c) | | Rule 144A, Section 4(2) of the Securities Act of 1933 or other security which is restricted to resale to institutional investors. The Sub-Adviser has not deemed these securities to be liquid based on procedures approved by the Trust’s Board of Trustees. See Restricted Securities Note in these Schedules of Investments. |
(d) | | Perpetual maturity security. |
(e) | | All or portion of the security was on loan. |
(f) | | The interest rate for this security is inversely affected by upgrades or downgrades to the credit rating of the issuer. |
(g) | | Security is in default relating to principal, dividends and/or interest. |
(h) | | Non-income producing security. |
(i) | | Security issued with a zero coupon. Income is recognized through the accretion of discount. |
(j) | | Security fair valued in good faith in accordance with the procedures approved by the Trust’s Board of Trustees. Good faith fair valued securities may be classified as Level 2 or Level 3 for Financial Accounting Standards Board (“FASB”) Accounting Standards Codification (“ASC”) Topic 820 “Fair Value Measurements and Disclosures” based on the applicable valuation inputs. See FASB ASC Topic 820 “Fair Value Measurements and Disclosures” in the Notes to the Financial Statements. |
(k) | | All or a portion of the securities is pledged or segregated as collateral. See Pledged or Segregated Collateral note in the Notes to the Financial Statements. |
(l) | | All or a portion of the investment was purchased on a delayed delivery basis. As of October 31, 2013, the total cost of investments purchased on a delayed delivery basis was $29,347,239. |
(m) | | The securities in this category are direct debt of the agency and not collateralized by mortgages. |
(n) | | Yield changes daily to reflect current market conditions. Rate was the quoted yield as of October 31, 2013. |
Investments by Country* | | Percentage of Total
Long-Term
Investments | |
Australia | | 2.0 | % |
Belgium | | 0.9 | |
Brazil | | 1.2 | |
Canada | | 1.1 | |
Cayman Islands | | 0.1 | |
Chile | | 0.4 | |
China | | 1.3 | |
Colombia | | 0.1 | |
France | | 1.8 | |
Germany | | 1.1 | |
India | | 0.2 | |
Ireland | | 0.1 | |
Israel | | 0.3 | |
Italy | | 1.5 | |
Japan | | 0.2 | |
Kazakhstan | | 0.1 | |
Luxembourg | | 0.2 | |
Macau | | 0.3 | |
Mexico | | 0.3 | |
Mongolia | | 0.1 | |
Netherlands | | 0.7 | |
Norway | | 0.9 | |
Peru | | 0.3 | |
Russian Federation | | 2.7 | |
South Korea | | 0.4 | |
Spain | | 2.1 | |
Switzerland | | 0.4 | |
United Kingdom | | 3.9 | |
United States | | 75.3 | |
Total Long-Term Investments | | 100.0 | % |
* The country table is presented for this Fund because its strategy includes investment in non-U.S. securities as deemed significant by the Fund’s Adviser.
See accompanying Notes to Financial Statements.
Restricted Securities - Restricted securities are often purchased in private placement transactions and cannot be sold without prior registration unless the sale is pursuant to an exemption under the Securities Act of 1933, as amended. The following table details restricted securities, including Rule 144A securities that have not been deemed liquid, held by the Fund at October 31, 2013.
| | Initial
Acquisition
Date | | Cost | | Ending
Value | | Percent of
Net Assets | |
AABS Ltd. Term Loan A, 4.88%, 01/10/38 | | 01/28/2013 | | $ | 962,656 | | $ | 962,919 | | 0.2 | % |
Aviation Capital Group Corp., 3.88%, 09/27/16 | | 09/25/2013 | | 1,700,000 | | 1,720,789 | | 0.3 | |
Aviation Capital Group Corp., 4.63%, 01/31/18 | | 02/12/2013 | | 1,422,797 | | 1,427,286 | | 0.3 | |
BPCE SA, 5.70%, 10/22/23 | | 10/16/2013 | | 798,675 | | 820,118 | | 0.2 | |
Banque PSA Finance SA, 2.14%, 04/04/14 | | 02/20/2013 | | 199,520 | | 199,440 | | — | |
CoBank ACB, 6.25%, (callable at 100 beginning 10/01/22) | | 06/03/2013 | | 2,125,000 | | 1,981,250 | | 0.4 | |
Credit Suisse AG, 6.50%, 08/08/23 | | 08/23/2013 | | 701,727 | | 747,180 | | 0.1 | |
Federal Express Corp. Pass-Through Trust, 2.63%, 01/15/18 | | 01/23/2012 | | 1,238,924 | | 1,251,561 | | 0.2 | |
ING Bank NV, 2.00%, 09/25/15 | | 09/19/2012 | | 998,151 | | 1,015,710 | | 0.2 | |
LeasePlan Corp. NV, 2.50%, 05/16/18 | | 05/08/2013 | | 2,987,230 | | 2,955,963 | | 0.6 | |
Midcontinent Express Pipeline LLC, 6.70%, 09/15/19 | | 12/12/2011 | | 2,255,205 | | 2,046,540 | | 0.4 | |
Mylan Inc., 1.80%, 06/24/16 | | 10/22/2013 | | 706,930 | | 705,061 | | 0.1 | |
Nabors Industries Inc., 2.35%, 09/15/16 | | 10/22/2013 | | 506,432 | | 506,666 | | 0.1 | |
OJSC Novolipetsk Steel via Steel Funding Ltd., 4.45%, 02/19/18 | | 02/12/2013 | | 700,000 | | 700,000 | | 0.1 | |
Petrofac Ltd., 3.40%, 10/10/18 | | 10/04/2013 | | 697,418 | | 710,884 | | 0.1 | |
Piper Jaffray Cos., 4.25%, 05/31/14 | | 11/30/2012 | | 700,000 | | 700,909 | | 0.1 | |
RCI Banque SA, 3.50%, 04/03/18 | | 03/26/2013 | | 1,098,478 | | 1,131,837 | | 0.2 | |
SBA Tower Trust, 4.25%, 04/15/15 | | 12/12/2011 | | 1,022,315 | | 1,018,240 | | 0.2 | |
SteelRiver Transmission Co. LLC, 4.71%, 06/30/17 | | 01/20/2012 | | 245,292 | | 249,007 | | — | |
USG Corp., 7.88%, 03/30/20 | | 01/15/2013 | | 897,698 | | 880,000 | | 0.2 | |
Volkswagen International Finance NV, 1.60%, 11/20/17 | | 11/14/2012 | | 1,495,614 | | 1,490,235 | | 0.3 | |
Wynn Macau Ltd., 5.25%, 10/15/21 | | 10/10/2013 | | 1,500,000 | | 1,533,750 | | 0.3 | |
Xstrata Finance Canada Ltd., 2.70%, 10/25/17 | | 10/19/2012 | | 1,697,695 | | 1,707,662 | | 0.3 | |
| | | | $ | 26,657,757 | | $ | 26,463,007 | | 4.9 | % |
Schedule of Written Options
| | Expiration
Date | | Exercise
Price | | Contracts | | Value | |
Index Options | | | | | | | | | |
CDX.NA.IG-20 Call Option, BOA | | 12/18/2013 | | 0.65 | | 65 | | $ | (9,564 | ) |
CDX.NA.IG-20 Put Option, BNP | | 12/18/2013 | | 1.00 | | 40 | | (445 | ) |
CDX.NA.IG-20 Put Option, BOA | | 12/18/2013 | | 0.90 | | 52 | | (1,307 | ) |
CDX.NA.IG-20 Put Option, BOA | | 12/18/2013 | | 1.00 | | 93 | | (1,035 | ) |
CDX.NA.IG-20 Put Option, BOA | | 12/18/2013 | | 1.10 | | 39 | | (203 | ) |
CDX.NA.IG-20 Put Option, MSS | | 12/18/2013 | | 1.00 | | 96 | | (1,069 | ) |
CDX.NA.IG-20 Put Option, MSS | | 12/18/2013 | | 1.10 | | 39 | | (203 | ) |
| | | | | | 424 | | $ | (13,826 | ) |
Interest Rate Swaptions | | | | | | | | | |
Call Swaption, 3 month EURIBOR versus 0.40% fixed, BBP | | 03/14/2014 | | N/A | | 18 | | $ | (2,952 | ) |
Call Swaption, 3 month EURIBOR versus 0.40% fixed, BOA | | 03/12/2014 | | N/A | | 65 | | (10,746 | ) |
Call Swaption, 3 month EURIBOR versus 0.40% fixed, DUB | | 03/12/2014 | | N/A | | 38 | | (6,282 | ) |
Call Swaption, 3 month EURIBOR versus 0.40% fixed, GSB | | 03/12/2014 | | N/A | | 20 | | (3,306 | ) |
Call Swaption, 3 month LIBOR versus 1.30% fixed, GSB | | 03/17/2014 | | N/A | | 452 | | (65,708 | ) |
Put Swaption, 3 month EURIBOR versus 0.40% fixed, BBP | | 03/14/2014 | | N/A | | 18 | | (1,050 | ) |
Put Swaption, 3 month EURIBOR versus 0.40% fixed, BOA | | 03/12/2014 | | N/A | | 65 | | (3,790 | ) |
Put Swaption, 3 month EURIBOR versus 0.40% fixed, DUB | | 03/14/2014 | | N/A | | 38 | | (2,216 | ) |
Put Swaption, 3 month EURIBOR versus 0.40% fixed, GSB | | 03/12/2014 | | N/A | | 20 | | (1,166 | ) |
Put Swaption, 3 month LIBOR versus 1.90% fixed, GSB | | 03/17/2014 | | N/A | | 452 | | (206,871 | ) |
Put Swaption, 3 month LIBOR versus 2.00% fixed, GSB | | 03/31/2014 | | N/A | | 1,414 | | (164,019 | ) |
Put Swaption, 3 month LIBOR versus 2.50% fixed, DUB | | 09/21/2015 | | N/A | | 208 | | (588,332 | ) |
| | | | | | 2,808 | | $ | (1,056,438 | ) |
See accompanying Notes to Financial Statements.
Summary of Written Options
| | Contracts | | Premiums | |
Options outstanding at October 31, 2012 | | 896 | | $ | 1,128,390 | |
Options written during the year | | 3,805,636 | | 1,640,181 | |
Options closed during the year | | (1,900,580 | ) | (439,525 | ) |
Options expired during the year | | (1,902,720 | ) | (1,369,785 | ) |
Options outstanding at October 31, 2013 | | 3,232 | | $ | 959,261 | |
Schedule of Open Futures Contracts
| | Expiration | | Contracts
Long | | Unrealized
Appreciation | |
90-Day Eurodollar Future | | December 2014 | | 47 | | $ | 11,480 | |
90-Day Eurodollar Future | | March 2015 | | 625 | | 154,744 | |
90-Day Eurodollar Future | | June 2015 | | 599 | | 229,959 | |
Euro-Bund Future | | December 2013 | | 5 | | 26,969 | |
U.S. Treasury Note Future, 10-Year | | December 2013 | | 172 | | 725,433 | |
| | | | | | $ | 1,148,585 | |
Schedule of Open Forward Foreign Currency Contracts
Purchased/
Sold | | Settlement
Date | | CounterParty | | Notional
Amount | | Value | | Unrealized
Gain/(Loss) | |
BRL/USD | | 11/04/2013 | | CSI | | BRL | 5,693,874 | | $ | 2,541,681 | | $ | 89,328 | |
BRL/USD | | 12/03/2013 | | MSC | | BRL | 5,693,874 | | 2,523,933 | | (82,854 | ) |
EUR/USD | | 11/04/2013 | | UBS | | EUR | 1,053,000 | | 1,429,716 | | 8,453 | |
EUR/USD | | 11/04/2013 | | MSC | | EUR | 1,879,000 | | 2,551,221 | | (7,772 | ) |
EUR/USD | | 11/04/2013 | | BCL | | EUR | 13,754,000 | | 18,674,560 | | (271,575 | ) |
GBP/USD | | 12/12/2013 | | BNP | | GBP | 1,554,000 | | 2,490,973 | | 13,081 | |
GBP/USD | | 12/12/2013 | | BCL | | GBP | 577,000 | | 924,898 | | (6,085 | ) |
MXN/USD | | 12/17/2013 | | DUB | | MXN | 18,051,880 | | 1,378,785 | | (21,215 | ) |
MXN/USD | | 12/17/2013 | | BOA | | MXN | 6,535,500 | | 499,175 | | (825 | ) |
USD/AUD | | 11/04/2013 | | UBS | | AUD | (1,688,000 | ) | (1,595,418 | ) | (24,734 | ) |
USD/AUD | | 11/04/2013 | | BNP | | AUD | (112,000 | ) | (105,857 | ) | (154 | ) |
USD/AUD | | 12/03/2013 | | BNP | | AUD | (1,576,000 | ) | (1,486,736 | ) | 9,282 | |
USD/BRL | | 11/04/2013 | | CSI | | BRL | (5,693,874 | ) | (2,541,681 | ) | 82,224 | |
USD/CAD | | 12/23/2013 | | DUB | | CAD | (354,000 | ) | (339,089 | ) | 5,659 | |
USD/EUR | | 11/04/2013 | | CSI | | EUR | (195,000 | ) | (264,762 | ) | 3,741 | |
USD/EUR | | 11/04/2013 | | UBS | | EUR | (68,000 | ) | (92,327 | ) | (622 | ) |
USD/EUR | | 11/04/2013 | | GSC | | EUR | (16,423,000 | ) | (22,298,407 | ) | (72,849 | ) |
USD/EUR | | 12/03/2013 | | BCL | | EUR | (13,754,000 | ) | (18,675,785 | ) | 271,684 | |
USD/GBP | | 12/12/2013 | | CSI | | GBP | (5,999,000 | ) | (9,616,053 | ) | (200,382 | ) |
USD/JPY | | 11/18/2013 | | MSC | | JPY | (17,800,000 | ) | (181,036 | ) | (883 | ) |
USD/MXN | | 12/17/2013 | | GSC | | MXN | (9,700,703 | ) | (740,930 | ) | (4,465 | ) |
USD/RUB | | 01/15/2014 | | UBS | | RUB | (425,600 | ) | (13,097 | ) | (156 | ) |
ZAR/USD | | 01/15/2014 | | DUB | | ZAR | 1,274,818 | | 125,572 | | (4,765 | ) |
| | | | | | | | | $ | (24,810,664 | ) | $ | (215,884 | ) |
Schedule of Interest Rate Swap Agreements
Counterparty | | Floating Rate Index | | Fund Paying
Floating Rate | | Fixed Rate | | Expiration
Date | | Notional
Amount(1) | | Unrealized
Appreciation /
(Depreciation) | |
Over the Counter Interest Rate Swap Agreements | | | | | | | | | | |
BBP | | Mexican Interbank Rate | | Paying | | 5.50 | % | 09/13/2017 | | MXN | 16,200,000 | | $ | 29,158 | |
BOA | | Mexican Interbank Rate | | Paying | | 5.50 | % | 09/13/2017 | | MXN | 2,600,000 | | 4,874 | |
BOA | | Mexican Interbank Rate | | Paying | | 5.50 | % | 09/13/2017 | | MXN | 9,200,000 | | 15,424 | |
GSB | | Brazil Interbank Deposit Rate | | Paying | | 8.30 | % | 01/02/2017 | | BRL | 74,300,000 | | (2,134,562 | ) |
GSB | | Mexican Interbank Rate | | Paying | | 5.50 | % | 09/13/2017 | | MXN | 9,300,000 | | 17,251 | |
GSB | | Mexican Interbank Rate | | Paying | | 5.00 | % | 02/22/2023 | | MXN | 50,000,000 | | (358,040 | ) |
MSC | | Mexican Interbank Rate | | Paying | | 5.60 | % | 09/06/2016 | | MXN | 47,500,000 | | 106,001 | |
| | | | | | | | | | | | | | | |
See accompanying Notes to Financial Statements.
Counterparty | | Floating Rate Index | | Fund
Paying/Receiving
Floating Rate | | Fixed Rate | | Expiration
Date | | Notional
Amount(1) | | Unrealized
Appreciation /
(Depreciation) | |
Over the Counter Interest Rate Swap Agreements (continued) | | | | | | | | |
MSC | | Mexican Interbank Rate | | Paying | | 5.00 | % | 09/13/2017 | | MXN | 20,000,000 | | $ | 8,886 | |
MSC | | Mexican Interbank Rate | | Paying | | 5.25 | % | 09/06/2019 | | MXN | 78,800,000 | | (66,792 | ) |
| | | | | | | | | | | | | $ | (2,377,800 | ) |
| | | | | | | | | | | | | | |
Centrally Cleared Interest Rate Swap Agreements | | | | | | | | | | |
N/A | | 3-Month LIBOR | | Paying | | 2.65 | % | 07/31/2023 | | | 1,400,000 | | $ | 635 | |
N/A | | 6-Month Australian Bank Bill | | Paying | | 4.00 | % | 03/15/2023 | | AUD | 10,100,000 | | (270,602 | ) |
N/A | | 6-Month EURIBOR | | Receiving | | 2.25 | % | 09/19/2024 | | EUR | 4,000,000 | | (138,640 | ) |
N/A | | British Bankers’ Association Yen LIBOR | | Receiving | | 1.00 | % | 09/18/2023 | | JPY | 770,000,000 | | (194,476 | ) |
| | | | | | | | | | | | | $ | (603,083 | ) |
Schedule of Credit Default Swap Agreements
Counterparty | | Reference Obligation | | Implied
Credit
Spread(3) | | Fixed
Rate(6) | | Expiration
Date | | Notional
Amount (1),(5) | | Value(4) | | Unrealized
Appreciation /
(Depreciation) | |
Over the Counter Credit Default Swap Agreements | | | | | | | | | | | |
Credit default swap agreements - sell protection (2) | | | | | | | | | | | |
CSI | | Devon Energy Corp., 7.95%, 04/15/2032 | | 0.68 | % | 1.00 | % | 06/20/2018 | | $ | (300,000 | ) | $ | 4,338 | | $ | 5,276 | |
DUB | | Devon Energy Corp., 7.95%, 04/15/2032 | | 0.68 | % | 1.00 | % | 06/20/2018 | | (300,000 | ) | 4,338 | | 5,570 | |
CSI | | Encana Corp., 4.75%, 10/15/2013 | | 0.94 | % | 1.00 | % | 03/20/2018 | | (2,000,000 | ) | 5,166 | | 33,991 | |
MSC | | Federated Republic of Brazil, 12.25%, 03/06/2030 | | 1.24 | % | 1.00 | % | 12/20/2016 | | (6,500,000 | ) | (49,049 | ) | 52,177 | |
BBP | | Ford Motor Co., 6.50%, 08/01/2018 | | 0.48 | % | 5.00 | % | 12/20/2015 | | (1,050,000 | ) | 101,663 | | 12,373 | |
CSI | | Glencore Finance Europe, 6.50%, 02/27/2019 | | 1.60 | % | 1.00 | % | 12/20/2018 | | (882,541 | ) | (25,813 | ) | (551 | ) |
DUB | | Goldman Sachs Group Inc., 5.95%, 01/18/2018 | | 0.31 | % | 1.00 | % | 06/20/2014 | | (1,900,000 | ) | 8,412 | | 1,763 | |
CSI | | HJ Heinz Co., 6.38%, 07/15/2028 | | 1.18 | % | 1.00 | % | 03/20/2018 | | (100,000 | ) | (762 | ) | 2,333 | |
BOA | | KB Home, 9.10%, 09/15/2017 | | 3.27 | % | 5.00 | % | 09/20/2018 | | (500,000 | ) | 38,589 | | 15,943 | |
GSI | | KB Home, 9.10%, 09/15/2017 | | 3.27 | % | 5.00 | % | 09/20/2018 | | (700,000 | ) | 54,024 | | 22,829 | |
BBP | | Kingdom of Spain, 5.50%, 07/30/2017 | | 1.82 | % | 1.00 | % | 12/20/2018 | | (500,000 | ) | (19,700 | ) | 10,322 | |
BOA | | Kingdom of Spain, 5.50%, 07/30/2017 | | 1.82 | % | 1.00 | % | 12/20/2018 | | (100,000 | ) | (3,940 | ) | 2,073 | |
BBP | | Metlife Inc., 4.75%, 02/08/2021 | | 0.87 | % | 1.00 | % | 12/20/2018 | | (3,000,000 | ) | 19,831 | | 23,331 | |
DUB | | Morgan Stanley, 6.00%, 04/28/2015 | | 0.30 | % | 1.00 | % | 06/20/2014 | | (2,500,000 | ) | 11,304 | | 3,659 | |
BOA | | NRG Energy Inc., 8.50%, 06/15/2019 | | 2.09 | % | 5.00 | % | 06/20/2017 | | (150,000 | ) | 15,328 | | 26,924 | |
BBP | | People’s Republic of China, 4.25%, 10/28/2014 | | 0.81 | % | 1.00 | % | 12/20/2018 | | (1,000,000 | ) | 12,780 | | 1,971 | |
GSI | | People’s Republic of China, 4.75%, 10/29/2013 | | 0.80 | % | 1.00 | % | 12/20/2018 | | (1,000,000 | ) | 9,903 | | (244 | ) |
BBP | | Petrobras International Finance Co., 8.38%, 12/10/2018 | | 0.92 | % | 1.00 | % | 03/20/2014 | | (3,800,000 | ) | 1,187 | | 14,754 | |
DUB | | Petrobras International Finance Co., 8.38%, 12/10/2018 | | 1.37 | % | 1.00 | % | 03/20/2015 | | (700,000 | ) | (3,628 | ) | 3,527 | |
DUB | | Petrobras International Finance Co., 8.38%, 12/10/2018 | | 1.50 | % | 1.00 | % | 06/20/2015 | | (1,200,000 | ) | (9,750 | ) | (4,915 | ) |
DUB | | Prudential Financial Inc., 6.10%, 06/15/2017 | | 0.93 | % | 1.00 | % | 12/20/2018 | | (2,500,000 | ) | 8,751 | | 11,668 | |
BNP | | Rio Tinto Finance USA Ltd., 6.50%, 07/15/2018 | | 0.60 | % | 1.00 | % | 03/20/2017 | | (2,000,000 | ) | 26,624 | | 86,582 | |
GSI | | Russia - Eurobond, 7.50%, 03/31/2030 | | 1.14 | % | 1.00 | % | 12/20/2016 | | (2,300,000 | ) | (9,795 | ) | 115,616 | |
BBP | | Sony Corporation, 1.57%, 06/19/2015 | | 1.25 | % | 1.00 | % | 03/20/2018 | | (101,698 | ) | (1,084 | ) | 6,126 | |
BOA | | Sony Corporation, 1.57%, 06/19/2015 | | 1.25 | % | 1.00 | % | 03/20/2018 | | (101,698 | ) | (1,084 | ) | 6,126 | |
DUB | | Sony Corporation, 1.57%, 06/19/2015 | | 1.25 | % | 1.00 | % | 03/20/2018 | | (101,698 | ) | (1,084 | ) | 6,365 | |
GSI | | Sony Corporation, 1.57%, 06/19/2015 | | 1.25 | % | 1.00 | % | 03/20/2018 | | (508,492 | ) | (5,418 | ) | 30,928 | |
BBP | | The Republic of Italy, 6.88%, 09/27/2023 | | 2.06 | % | 1.00 | % | 12/20/2018 | | (400,000 | ) | (20,100 | ) | 6,594 | |
BBP | | The Republic of Italy, 6.88%, 09/27/2023 | | 2.06 | % | 1.00 | % | 12/20/2018 | | (1,200,000 | ) | (60,300 | ) | 33,149 | |
GSI | | The Republic of Italy, 6.88%, 09/27/2023 | | 2.06 | % | 1.00 | % | 12/20/2018 | | (1,100,000 | ) | (55,275 | ) | 17,653 | |
MSS | | The Republic of Italy, 6.88%, 09/27/2023 | | 2.06 | % | 1.00 | % | 12/20/2018 | | (500,000 | ) | (25,125 | ) | 8,024 | |
BOA | | Tokyo Electric Power Co., 0.68%, 05/30/2013 | | 2.46 | % | 1.00 | % | 12/20/2013 | | (813,587 | ) | (1,647 | ) | 101,143 | |
DUB | | UK Gilt Treasury Bond, 4.25%, 06/07/2032 | | 0.14 | % | 1.00 | % | 12/20/2016 | | (3,000,000 | ) | 80,808 | | 75,274 | |
MSC | | United Mexican States, 5.95%, 03/19/2019 | | 0.65 | % | 1.00 | % | 12/20/2016 | | (6,000,000 | ) | 66,241 | | 153,888 | |
DUB | | Whirlpool Corp., 7.75%, 07/15/2016 | | 0.76 | % | 1.00 | % | 03/20/2018 | | (1,400,000 | ) | 14,628 | | 33,897 | |
| | | | | | | | | | $ | (50,209,714 | ) | $ | 190,361 | | $ | 926,139 | |
See accompanying Notes to Financial Statements.
Counterparty | | Reference Obligation | | Implied
Credit
Spread(3) | | Fixed
Rate(6) | | Expiration
Date | | Notional
Amount(1),(5) | | Value(4) | | Unrealized
Appreciation /
(Depreciation) | |
Centrally Cleared Credit Default Swap Agreements | | | | | | | | | |
Credit default swap agreements - sell protection (2) | | | | | | | | | |
N/A | | CDX.NA.IG-17 | | N/A | | 1.00 | % | 12/20/2016 | | $ | (4,830,000 | ) | $ | 92,705 | | $ | 18,067 | |
N/A | | CDX.NA.IG-17 | | N/A | | 1.00 | % | 12/20/2021 | | (75,000 | ) | (297 | ) | 638 | |
N/A | | CDX.NA.IG-18 | | N/A | | 1.00 | % | 12/20/2022 | | (3,200,000 | ) | (29,910 | ) | 62,111 | |
N/A | | CDX.NA.IG-19 | | N/A | | 1.00 | % | 12/20/2017 | | (8,000,000 | ) | 145,856 | | 57,887 | |
N/A | | CDX.NA.IG-21 | | N/A | | 1.00 | % | 12/20/2018 | | (10,000,000 | ) | 133,480 | | (16,390 | ) |
N/A | | iTraxx Europe Series 20 | | N/A | | 1.00 | % | 12/20/2018 | | (7,467,652 | ) | 61,003 | | 48,183 | |
| | | | | | | | | | $ | (33,572,652 | ) | $ | 402,837 | | $ | 170,496 | |
(1)Notional amount is stated in USD unless otherwise noted.
(2)If the Fund is a seller of protection and a credit event occurs, as defined under the terms of that particular swap agreement, the Fund will either (i) pay the buyer of protection an amount equal to the notional amount of the referenced obligation and take delivery of the referenced obligation or underlying securities comprising the referenced index or (ii) pay a net settlement amount in the form of cash or securities equal to the notional amount of the swap agreement less the recovery value of the reference obligation or underlying securities comprising the referenced index.
(3)Implied credit spreads, represented in absolute terms, utilized in determining the value of credit default swap agreements on corporate issues and sovereign issues serve as an indicator of the current status of the payment/performance risk and represent the likelihood or risk of default for the credit derivative. The implied credit spread of a particular referenced entity reflects the cost of buying/selling protection and may include upfront payments required to be made to enter into the agreement. Wider credit spreads represent a deterioration of the referenced entity’s credit soundness and a greater likelihood or risk of default or other credit event occurring as defined under the terms of the applicable agreement.
(4)The prices and resulting values for credit default swap agreements on credit indices serve as an indicator of the current status of the payment/performance risk and represent the likelihood or risk of default for the credit derivative. Increasing market values, in absolute terms when compared to the notional amount of the swap, represent a deterioration of the referenced entity’s credit soundness and a greater likelihood or risk of default or other credit event occurring as defined under the terms of the agreement.
(5)The maximum potential amount the Fund could be required to pay as a seller of credit protection or receive as a buyer of credit protection if a credit event occurs is limited to the total notional amount which is defined under the terms of each swap agreement.
(6)If the Fund is a seller of protection, the Fund receives the fixed rate.
See accompanying Notes to Financial Statements.
| | Shares/Par † | | Value | |
Curian/PIMCO Total Return Fund | | | | | |
NON-U.S. GOVERNMENT AGENCY ASSET-BACKED SECURITIES - 9.5% | | | | | |
Accredited Mortgage Loan Trust REMIC, 0.43%, 09/25/36 (a) | | $ | 10,000,000 | | $ | 7,269,330 | |
ACE Securities Corp. Home Equity Loan Trust REMIC, 1.21%, 10/25/34 (a) | | 3,049,125 | | 2,836,388 | |
Asset Backed Securities Corp. Home Equity Loan Trust REMIC, 1.52%, 04/15/33 (a) | | 2,205,119 | | 2,088,472 | |
Banc of America Funding Trust REMIC, 5.02%, 02/20/35 (a) | | 722,370 | | 717,006 | |
Bear Stearns Asset Backed Securities I Trust REMIC, 0.66%, 09/25/35 (a) | | 6,000,000 | | 4,199,946 | |
Citigroup Mortgage Loan Trust REMIC, 2.51%, 10/25/35 (a) | | 185,403 | | 181,484 | |
Collegiate Funding Services Education Loan Trust, 0.35%, 12/28/21 (a) | | 416,095 | | 415,910 | |
Countrywide Asset-Backed Certificates REMIC, 0.92%, 06/25/34 (a) | | 6,700,000 | | 6,256,366 | |
Credit Suisse Commercial Mortgage Trust REMIC, 5.38%, 02/15/40 | | 682,035 | | 738,669 | |
Delta Air Lines Inc. Pass-Through Trust, 7.75%, 12/17/19 | | 285,689 | | 325,686 | |
Delta Funding Corp. Home Equity Loan Trust, 2.05%, 12/25/31 (a) | | 5,374,332 | | 4,943,838 | |
First Horizon Alternative Mortgage Securities Trust REMIC, 2.30%, 06/25/34 (a) | | 838,219 | | 810,928 | |
First Horizon Mortgage Pass-Through Trust REMIC, 2.56%, 06/25/35 (a) | | 2,771,117 | | 2,702,914 | |
Greenwich Capital Commercial Funding Corp. Commercial Mortgage Trust REMIC, 5.44%, 03/10/39 | | 1,200,000 | | 1,329,092 | |
GSAA Trust REMIC, 0.44%, 06/25/35 (a) | | 1,016,625 | | 939,104 | |
GSR Mortgage Loan Trust REMIC, 2.65%, 09/25/35 (a) | | 1,948,316 | | 1,934,857 | |
Impac Secured Assets Trust REMIC, 0.34%, 01/25/37 (a) | | 12,568,486 | | 9,384,436 | |
IndyMac INDX Mortgage Loan Trust REMIC, 0.42%, 09/25/37 (a) | | 1,168,779 | | 965,776 | |
JPMorgan Chase Commercial Mortgage Securities Trust REMIC | | | | | |
5.34%, 05/15/47 | | 1,400,000 | | 1,540,032 | |
5.42%, 01/15/49 | | 400,000 | | 443,430 | |
JPMorgan Mortgage Trust REMIC, 5.50%, 04/25/36 | | 304,501 | | 301,052 | |
Lehman Mortgage Trust REMIC, 6.00%, 09/25/37 | | 1,482,890 | | 1,383,131 | |
Lehman XS Trust REMIC, 0.35%, 07/25/37 (a) | | 9,365,094 | | 6,225,605 | |
Merit Securities Corp. REMIC, 0.79%, 04/28/27 (a) (b) | | 75,254 | | 64,651 | |
Merrill Lynch/Countrywide Commercial Mortgage Trust REMIC, 5.49%, 03/12/51 (a) | | 1,500,000 | | 1,658,378 | |
Morgan Stanley Mortgage Loan Trust REMIC, 0.43%, 04/25/35 (a) | | 350,130 | | 311,282 | |
Morgan Stanley Re-REMIC Trust, 5.80%, 08/12/45 (a) (b) | | 1,500,000 | | 1,655,493 | |
MortgageIT Trust REMIC, 0.47%, 08/25/35 (a) | | 1,435,444 | | 1,357,106 | |
Northwest Airlines Pass-Through Trust, 7.15%, 10/01/19 | | 6,056,438 | | 6,472,819 | |
Panhandle-Plains Higher Education Authority Inc. REMIC, 1.38%, 10/01/35 (a) | | 3,682,370 | | 3,738,026 | |
PHH Mortgage Capital LLC REMIC, 5.56%, 07/18/35 (a) | | 1,546,178 | | 1,567,928 | |
Provident Funding Mortgage Loan Trust REMIC, 2.69%, 10/25/35 (a) | | 1,265,663 | | 1,239,784 | |
SG Mortgage Securities Trust REMIC, 0.38%, 10/25/36 (a) | | 6,703,000 | | 3,062,922 | |
SLM Private Education Loan Trust, 1.27%, 08/15/23 (a) (b) | | 6,350,275 | | 6,376,426 | |
Soundview Home Loan Trust REMIC | | | | | |
0.41%, 07/25/36 (a) | | 1,900,000 | | 904,128 | |
0.30%, 12/25/36 (a) | | 700,074 | | 663,243 | |
Wachovia Bank Commercial Mortgage Trust REMIC, 5.34%, 12/15/43 | | 1,000,000 | | 1,109,974 | |
Washington Mutual Mortgage Pass-Through Certificates REMIC | | | | | |
2.42%, 08/25/35 (a) | | 338,866 | | 340,145 | |
1.35%, 11/25/42 (a) | | 5,332,123 | | 4,992,904 | |
Total Non-U.S. Government Agency Asset-Backed Securities (cost $89,108,072) | | | | 93,448,661 | |
| | | | | |
CORPORATE BONDS AND NOTES - 16.3% | | | | | |
ENERGY - 0.5% | | | | | |
Gazprom OAO Via Gaz Capital SA | | | | | |
8.13%, 07/31/14 (b) | | 600,000 | | 631,020 | |
8.15%, 04/11/18 (b) | | 1,000,000 | | 1,177,500 | |
Gazprom OAO Via White Nights Finance BV, 10.50%, 03/25/14 | | 100,000 | | 103,500 | |
Petrobras Global Finance BV, 3.00%, 01/15/19 | | 300,000 | | 285,389 | |
Petrobras International Finance Co. | | | | | |
7.88%, 03/15/19 | | 300,000 | | 349,320 | |
5.75%, 01/20/20 | | 1,200,000 | | 1,267,155 | |
Rosneft Finance SA, 7.50%, 07/18/16 | | 900,000 | | 1,009,125 | |
| | | | 4,823,009 | |
FINANCIALS - 12.4% | | | | | |
Ally Financial Inc. | | | | | |
7.50%, 12/31/13 | | 1,900,000 | | 1,915,770 | |
6.75%, 12/01/14 | | 2,900,000 | | 3,052,250 | |
6.75%, 12/01/14 (c) | | 900,000 | | 947,250 | |
8.30%, 02/12/15 | | 2,800,000 | | 3,034,500 | |
4.63%, 06/26/15 | | 700,000 | | 730,668 | |
5.50%, 02/15/17 | | 1,100,000 | | 1,188,000 | |
American Express Bank FSB, 6.00%, 09/13/17 | | 3,300,000 | | 3,835,689 | |
American Express Co., 6.80%, 09/01/66 (a) | | 3,489,000 | | 3,724,508 | |
American International Group Inc. | | | | | |
8.25%, 08/15/18 | | 2,500,000 | | 3,161,805 | |
8.18%, 05/15/58 (a) | | 5,600,000 | | 6,902,000 | |
Banco do Brasil SA | | | | | |
4.50%, 01/22/15 (b) (c) | | 1,300,000 | | 1,345,500 | |
6.00%, 01/22/20 (b) (c) | | 400,000 | | 435,000 | |
Banco Mercantil del Norte SA, 4.38%, 07/19/15 (b) | | 2,900,000 | | 3,045,000 | |
Banco Santander Brasil SA | | | | | |
2.35%, 03/18/14 (a) (d) | | 7,700,000 | | 7,699,969 | |
4.25%, 01/14/16 (b) | | 1,000,000 | | 1,038,500 | |
Bank of America Corp., 0.90%, 05/23/17 (a), EUR | | 1,200,000 | | 1,560,112 | |
Barclays Bank Plc | | | | | |
2.38%, 01/13/14 | | 400,000 | | 401,572 | |
| | | | | | | |
See accompanying Notes to Financial Statements.
| | Shares/Par † | | Value | |
5.20%, 07/10/14 | | 200,000 | | 206,484 | |
BNP Paribas SA, 1.14%, 01/10/14 (a) | | 1,300,000 | | 1,302,015 | |
Cantor Fitzgerald LP, 7.88%, 10/15/19 (b) | | 850,000 | | 885,713 | |
Citigroup Inc. | | | | | |
5.00%, 09/15/14 | | 4,900,000 | | 5,070,642 | |
4.59%, 12/15/15 | | 4,300,000 | | 4,603,855 | |
Credit Agricole Home Loan SFH, 0.99%, 07/21/14 (a) (b) | | 1,800,000 | | 1,806,388 | |
Credit Agricole SA, 1.69%, 01/21/14 (a) (c) (d) | | 1,500,000 | | 1,504,305 | |
Dexia Credit Local SA, 2.75%, 04/29/14 | | 1,000,000 | | 1,010,910 | |
Ford Motor Credit Co. LLC, 8.00%, 06/01/14 | | 1,800,000 | | 1,876,720 | |
HBOS Plc | | | | | |
0.96%, 09/06/17 (a) | | 2,571,000 | | 2,441,807 | |
6.75%, 05/21/18 (b) | | 900,000 | | 1,011,931 | |
ICICI Bank Ltd., 5.75%, 11/16/20 | | 2,700,000 | | 2,797,178 | |
Industrial Bank of Korea, 3.75%, 09/29/16 (b) | | 1,500,000 | | 1,587,197 | |
International Lease Finance Corp., 6.63%, 11/15/13 | | 1,300,000 | | 1,302,557 | |
Intesa Sanpaolo SpA | | | | | |
2.66%, 02/24/14 (a) (b) | | 1,700,000 | | 1,707,191 | |
3.13%, 01/15/16 | | 600,000 | | 611,829 | |
KeyBank NA, 7.41%, 05/06/15 | | 3,300,000 | | 3,600,406 | |
Korea Development Bank, 8.00%, 01/23/14 | | 100,000 | | 101,601 | |
Merrill Lynch & Co. Inc. | | | | | |
6.40%, 08/28/17 | | 14,700,000 | | 17,078,519 | |
6.88%, 04/25/18 | | 2,800,000 | | 3,324,717 | |
Morgan Stanley, 5.38%, 10/15/15 | | 4,000,000 | | 4,316,188 | |
Sberbank of Russia Via SB Capital SA, 4.95%, 02/07/17 (b) | | 200,000 | | 212,500 | |
SLM Corp. | | | | | |
5.14%, 06/15/16 | | 10,000,000 | | 10,362,730 | |
8.45%, 06/15/18 | | 1,500,000 | | 1,751,250 | |
Springleaf Finance Corp., 6.90%, 12/15/17 | | 7,000,000 | | 7,577,500 | |
| | | | 122,070,226 | |
HEALTH CARE - 1.7% | | | | | |
HCA Inc., 7.25%, 09/15/20 | | 1,150,000 | | 1,260,688 | |
HCA Inc. Extended Term Loan A-2, 6.90%, 05/02/16 (a) | | 3,850,000 | | 3,854,350 | |
Sanofi, 0.56%, 03/28/14 (a) | | 2,500,000 | | 2,503,538 | |
Teva Pharmaceutical Finance Co. BV, 1.17%, 11/08/13 (a) | | 9,100,000 | | 9,101,104 | |
| | | | 16,719,680 | |
INDUSTRIALS - 1.1% | | | | | |
Asciano Finance Ltd., 5.00%, 04/07/18 (b) | | 600,000 | | 645,279 | |
United Technologies Corp., 0.53%, 12/02/13 (a) | | 10,100,000 | | 10,102,835 | |
| | | | 10,748,114 | |
MATERIALS - 0.2% | | | | | |
Gerdau Holdings Inc., 7.00%, 01/20/20 (b) | | 1,000,000 | | 1,096,000 | |
Gold Fields Orogen Holding BVI Ltd., 4.88%, 10/07/20 (b) | | 200,000 | | 171,242 | |
GTL Trade Finance Inc., 7.25%, 10/20/17 (b) (c) | | 300,000 | | 335,250 | |
| | | | 1,602,492 | |
TELECOMMUNICATION SERVICES - 0.4% | | | | | |
Verizon Communications Inc. | | | | | |
2.50%, 09/15/16 | | 600,000 | | 622,577 | |
2.00%, 09/14/18 (a) | | 500,000 | | 527,895 | |
3.65%, 09/14/18 | | 1,600,000 | | 1,701,186 | |
6.40%, 09/15/33 | | 900,000 | | 1,018,230 | |
Vivendi SA, 2.40%, 04/10/15 (d) | | 400,000 | | 410,256 | |
| | | | 4,280,144 | |
UTILITIES - 0.0% | | | | | |
Centrais Eletricas Brasileiras SA, 6.88%, 07/30/19 (b) (c) | | 200,000 | | 218,500 | |
Total Corporate Bonds and Notes (cost $153,063,534) | | | | 160,462,165 | |
| | | | | |
GOVERNMENT AND AGENCY OBLIGATIONS - 64.6% | | | | | |
GOVERNMENT SECURITIES - 30.1% | | | | | |
Federal Home Loan Mortgage Corp. - 4.3% (e) | | | | | |
Federal Home Loan Mortgage Corp. | | | | | |
1.00%, 03/08/17 - 09/29/17 | | 19,200,000 | | 19,169,970 | |
5.50%, 08/23/17 | | 2,400,000 | | 2,798,364 | |
0.88%, 03/07/18 | | 300,000 | | 294,799 | |
1.75%, 05/30/19 | | 1,600,000 | | 1,597,742 | |
1.25%, 08/01/19 - 10/02/19 | | 18,400,000 | | 17,726,097 | |
2.38%, 01/13/22 | | 300,000 | | 293,977 | |
| | | | 41,880,949 | |
Federal National Mortgage Association - 3.9% (e) | | | | | |
Federal National Mortgage Association | | | | | |
1.25%, 01/30/17 (f) | | 7,400,000 | | 7,517,283 | |
5.00%, 02/13/17 - 05/11/17 | | 6,000,000 | | 6,833,676 | |
1.13%, 04/27/17 | | 800,000 | | 806,885 | |
5.38%, 06/12/17 | | 4,800,000 | | 5,548,334 | |
0.88%, 08/28/17 - 05/21/18 | | 16,800,000 | | 16,531,126 | |
1.88%, 09/18/18 | | 1,100,000 | | 1,117,514 | |
| | | | 38,354,818 | |
Municipals - 2.8% | | | | | |
American Municipal Power Inc., RB, 8.08%, 02/15/50 | | 2,200,000 | | 2,883,540 | |
Bay Area Toll Authority, RB - Series S1 | | | | | |
7.04%, 04/01/50 | | 2,000,000 | | 2,538,100 | |
6.91%, 10/01/50 | | 1,000,000 | | 1,253,900 | |
California Statewide Communities Development Authority, RB, 7.55%, 05/15/40 | | 1,100,000 | | 1,361,855 | |
Dallas Convention Center Hotel Development Corp., RB, 7.09%, 01/01/42 | | 2,800,000 | | 3,273,396 | |
Los Angeles County Public Works Financing Authority, RB, 7.62%, 08/01/40 | | 1,800,000 | | 2,178,774 | |
Metropolitan Transportation Authority, RB, 5.00%, 11/15/26 | | 1,500,000 | | 1,681,500 | |
Mississippi Development Bank, RB, 6.31%, 01/01/33 | | 300,000 | | 331,329 | |
New Jersey State Turnpike Authority, RB, 7.10%, 01/01/41 | | 2,000,000 | | 2,580,880 | |
New York State Dormitory Authority, RB, 5.00%, 03/15/29 | | 1,100,000 | | 1,205,303 | |
Ohio Higher Educational Facility Commission, RB, 5.00%, 01/01/38 | | 800,000 | | 814,968 | |
State of California, GO | | | | | |
7.50%, 04/01/34 | | 1,400,000 | | 1,836,506 | |
7.63%, 03/01/40 | | 1,800,000 | | 2,444,670 | |
7.60%, 11/01/40 | | 1,000,000 | | 1,368,800 | |
State of Iowa, RB, 6.75%, 06/01/34 | | 400,000 | | 446,972 | |
University of California, RB, 6.40%, 05/15/31 | | 1,100,000 | | 1,267,706 | |
| | | | 27,468,199 | |
See accompanying Notes to Financial Statements.
| | Shares/Par † | | Value | |
Sovereign - 1.4% | | | | | |
Banco Nacional de Desenvolvimento Economico e Social, 3.38%, 09/26/16 (d) | | 300,000 | | 303,000 | |
Italy Buoni Poliennali Del Tesoro, 2.50%, 03/01/15, EUR | | 2,000,000 | | 2,766,300 | |
Province of Ontario, Canada | | | | | |
3.15%, 06/02/22, CAD | | 1,300,000 | | 1,248,444 | |
2.45%, 06/29/22 | | 4,200,000 | | 3,979,324 | |
Province of Quebec, Canada | | | | | |
4.50%, 12/01/19, CAD | | 900,000 | | 957,393 | |
4.25%, 12/01/21, CAD | | 2,000,000 | | 2,080,257 | |
Spain Government Bond, 3.30%, 10/31/14, EUR | | 2,100,000 | | 2,919,288 | |
| | | | 14,254,006 | |
Treasury Inflation Index Securities - 7.6% | | | | | |
U.S. Treasury Inflation Indexed Note | | | | | |
0.13%, 04/15/17 (f) (g) | | 1,544,550 | | 1,596,799 | |
0.13%, 04/15/18 - 07/15/22 (g) | | 6,105,956 | | 6,047,143 | |
1.38%, 01/15/20 (g) | | 648,918 | | 713,962 | |
1.25%, 07/15/20 (g) | | 643,446 | | 706,484 | |
1.13%, 01/15/21 (g) | | 213,828 | | 230,834 | |
0.63%, 07/15/21 - 02/15/43 (g) | | 7,872,067 | | 8,063,827 | |
2.38%, 01/15/25 - 01/15/27 (g) | | 18,750,595 | | 22,508,553 | |
2.00%, 01/15/26 (g) | | 8,484,192 | | 9,803,883 | |
1.75%, 01/15/28 (g) | | 18,866,822 | | 21,179,479 | |
0.75%, 02/15/42 (g) | | 4,347,126 | | 3,747,018 | |
| | | | 74,597,982 | |
U.S. Treasury Securities - 10.1% | | | | | |
U.S. Treasury Note | | | | | |
0.75%, 12/31/17 | | 1,800,000 | | 1,777,640 | |
0.75%, 03/31/18 (f) | | 28,700,000 | | 28,215,688 | |
0.63%, 04/30/18 | | 12,200,000 | | 11,915,020 | |
1.38%, 06/30/18 | | 4,600,000 | | 4,632,701 | |
1.50%, 08/31/18 | | 26,600,000 | | 26,893,026 | |
1.25%, 10/31/18 | | 21,200,000 | | 21,128,789 | |
1.00%, 06/30/19 (f) | | 5,305,000 | | 5,144,609 | |
0.88%, 07/31/19 (f) | | 19,000 | | 18,256 | |
1.00%, 08/31/19 | | 200,000 | | 193,125 | |
| | | | 99,918,854 | |
U.S. GOVERNMENT AGENCY MORTGAGE-BACKED SECURITIES - 34.5% | | | | | |
Federal Home Loan Mortgage Corp. - 3.9% | | | | | |
Federal Home Loan Mortgage Corp. | | | | | |
4.50%, 03/01/28 - 12/01/41 | | 11,878,586 | | 12,689,667 | |
5.50%, 09/01/33 - 03/01/40 | | 5,908,222 | | 6,389,765 | |
4.00%, 11/01/41 | | 7,938,752 | | 8,336,739 | |
4.00%, 11/15/43, TBA (h) | | 2,000,000 | | 2,098,750 | |
REMIC, 0.89%, 05/15/37 (a) | | 1,643,549 | | 1,644,874 | |
REMIC, 5.00%, 08/15/38 | | 6,746,000 | | 7,351,690 | |
| | | | 38,511,485 | |
Federal National Mortgage Association - 30.6% | | | | | |
Federal National Mortgage Association | | | | | |
3.00%, 07/01/21 - 05/01/22 | | 4,889,038 | | 5,117,174 | |
3.89%, 07/01/21 | | 1,200,000 | | 1,279,513 | |
3.16%, 05/01/22 | | 792,367 | | 832,994 | |
2.31%, 08/01/22 | | 300,000 | | 286,636 | |
4.50%, 08/01/23 - 01/01/42 | | 17,836,649 | | 19,126,194 | |
3.50%, 10/01/25 - 02/01/26 | | 170,429 | | 180,021 | |
2.87%, 09/01/27 | | 800,000 | | 714,934 | |
3.00%, 12/15/27 - 11/15/28, TBA (h) | | 69,000,000 | | 71,487,187 | |
5.00%, 04/01/28 - 11/01/41 | | 8,217,204 | | 8,929,595 | |
3.50%, 11/15/28 - 11/15/43, TBA (h) | | 8,000,000 | | 8,414,687 | |
4.00%, 11/15/28 - 11/15/43, TBA (h) | | 55,000,000 | | 57,902,496 | |
4.00%, 10/01/30 - 10/01/41 | | 2,258,850 | | 2,389,790 | |
5.50%, 01/01/33 - 05/01/38 | | 7,574,091 | | 8,246,608 | |
6.00%, 05/01/37 - 05/01/41 | | 21,488,140 | | 23,485,014 | |
4.50%, 12/15/42, TBA (h) | | 16,100,000 | | 17,194,298 | |
5.00%, 12/15/42 - 11/15/43, TBA (h) | | 29,000,000 | | 31,527,971 | |
3.50%, 11/15/43, TBA (h) (j) | | 33,000,000 | | 33,835,312 | |
5.50%, 11/15/43, TBA (h) | | 9,000,000 | | 9,818,437 | |
| | | | 300,768,861 | |
Total Government and Agency Obligations (cost $639,752,231) | | | | 635,755,154 | |
| | | | | |
PREFERRED STOCKS - 0.4% | | | | | |
FINANCIALS - 0.4% | | | | | |
Wells Fargo & Co., Convertible Preferred, 7.50% (i) | | 3,200 | | 3,644,800 | |
Total Preferred Stocks (cost $3,557,200) | | | | 3,644,800 | |
| | | | | |
SHORT TERM INVESTMENTS - 30.3% | | | | | |
Repurchase Agreements - 23.3% | | | | | |
Repurchase Agreement with BCL, 0.05% (Collateralized by $15,667,245 U.S. Treasury Inflation Indexed Note, 0.50%, due at 04/15/15, value $15,985,290) acquired on 10/25/13, due 11/04/13 at $15,700,153 | | $ | 15,700,000 | | 15,700,000 | |
Repurchase Agreement with BCL, 0.05% (Collateralized by $15,885,801 U.S. Treasury Inflation Indexed Note, 2.00%, due at 01/15/14, value $15,895,332) acquired on 10/25/13, due 11/06/13 at $15,700,262 | | 15,700,000 | | 15,700,000 | |
Repurchase Agreement with BCL, 0.12% (Collateralized by $12,705,000 U.S. Treasury Note, 0.63%, due at 11/30/17, value $12,466,146) acquired on 10/31/13, due 11/01/13 at $12,300,041 | | 12,300,000 | | 12,300,000 | |
Repurchase Agreement with BNP, 0.13% (Collateralized by $47,919,541 Federal Home Loan Mortgage Corp., 3.00%, due at 11/01/43, value $46,980,318 and $14,858,029 Federal Home Loan Mortgage Corp., 3.00%, due at 11/01/43, value $14,566,811) acquired on 10/31/13, due 11/01/13 at $60,000,217 | | 60,000,000 | | 60,000,000 | |
Repurchase Agreement with CSI, 0.12% (Collateralized by $33,785,000 U.S. Treasury Note, 0.25%, due at 09/15/15, value $33,545,127) acquired on 10/31/13, due 11/01/13 at $33,000,110 | | 33,000,000 | | 33,000,000 | |
Repurchase Agreement with DUB, 0.12% (Collateralized by $6,681,630 U.S. Treasury Inflation Indexed Note, 2.00%, due at 01/15/14, value $6,685,639) acquired on 10/31/13, due 11/01/13 at $6,600,022 | | 6,600,000 | | 6,600,000 | |
Repurchase Agreement with GSC, 0.12% (Collateralized by $4,171,368 Federal National Mortgage Association, 2.50%, due at 12/01/27, value $4,183,882) acquired on 10/31/13, due 11/01/13 at $4,100,014 | | 4,100,000 | | 4,100,000 | |
| | | | | | |
See accompanying Notes to Financial Statements.
| | Shares/Par † | | Value | |
Repurchase Agreement with JPM, 0.08% (Collateralized by $8,764,466 U.S. Treasury Inflation Indexed Note, 0.13%, due at 04/15/17, value $9,038,794) acquired on 10/30/13, due 11/06/13 at $8,900,138 | | 8,900,000 | | 8,900,000 | |
Repurchase Agreement with JPM, 0.14% (Collateralized by $2,373,000 Federal National Mortgage Association, 6.63%, due at 11/15/30, value $3,187,888 and $791,000 Federal Home Loan Mortgage Corp., 2.88%, due at 02/09/15, value $817,815) acquired on 10/31/13, due 11/01/13 at $4,000,016 | | 4,000,000 | | 4,000,000 | |
Repurchase Agreement with MLP, 0.13% (Collateralized by $27,918,000 U.S. Treasury Bond, 3.13%, due at 02/15/42, value $25,212,746) acquired on 10/31/13, due 11/01/13 at $25,000,090 | | 25,000,000 | | 25,000,000 | |
Repurchase Agreement with RBS, 0.07% (Collateralized by $44,620,000 U.S. Treasury Note, 0.88%, due at 02/28/17, value $44,686,930) acquired on 10/28/13, due 11/14/13 at $44,001,454 | | 44,000,000 | | 44,000,000 | |
| | | | 229,300,000 | |
Securities Lending Collateral - 0.3% | | | | | |
Repurchase Agreement with DUB, 0.10% (Collateralized by $1,992,817 U.S. Treasury Bond Strip, due 08/15/20-11/15/42, value $1,230,750, $1,850,900 U.S. Treasury Note, 0.75-3.75%, due 05/31/14-01/15/20, value $2,029,930, $308,023 U.S. Treasury Bond, 2.75-8.75%, due 08/15/20-08/15/42, value $402,702, and $29,307 U.S. Treasury Inflation Indexed Note, 3.38%, due 04/15/32, value $54,471) acquired on 10/31/13, due 11/01/13 at $3,644,963 | | 3,644,953 | | 3,644,953 | |
Treasury Securities - 6.7% | | | | | |
Italy Buoni Ordinari del Tesoro BOT | | | | | |
1.02%, 02/28/14, EUR | | 12,000,000 | | 16,267,967 | |
1.12%, 03/14/14, EUR | | 8,200,000 | | 11,114,128 | |
1.47%, 09/12/14, EUR | | 3,200,000 | | 4,313,285 | |
1.08%, 10/14/14, EUR | | 900,000 | | 1,213,111 | |
Mexico Cetes, 0.26%, 02/06/14, MXN | | 1,540,000 | | 1,169,466 | |
Spain Letras del Tesoro | | | | | |
1.50%, 04/16/14, EUR | | 12,000,000 | | 16,247,274 | |
1.15%, 10/17/14, EUR | | 9,400,000 | | 12,674,436 | |
U.S. Treasury Bill | | | | | |
0.04%, 12/05/13 (f) | | 2,231,000 | | 2,230,953 | |
0.04%, 01/09/14 (f) | | 628,000 | | 627,964 | |
| | | | 65,858,584 | |
Total Short Term Investments (cost $297,890,625) | | | | 298,803,537 | |
Total Investments - 121.1% (cost $1,183,371,662) | | | | 1,192,114,317 | |
Total Forward Sales Commitments - (0.1%) (proceeds $1,071,406) | | | | (1,070,469 | ) |
Other Assets and Liabilities, Net - (21.0%) | | | | (206,739,002 | ) |
Total Net Assets - 100.0% | | | | $ | 984,304,846 | |
| | | | | |
FORWARD SALES COMMITMENTS - 0.1% | | | | | |
Government and Agency Obligations - 0.1% | | | | | |
GOVERNMENT AND AGENCY OBLIGATIONS - 0.1% | | | | | |
Federal National Mortgage Association - 0.1% | | | | | |
Federal National Mortgage Association, 4.50%, 11/15/43 , TBA (h) | | $ | 1,000,000 | | $ | 1,070,469 | |
Total Government and Agency Obligations - 0.1% (proceeds $1,071,406) | | | | $ | 1,070,469 | |
| | | | | | | |
(a) | | Variable rate security. Rate stated was in effect as of October 31, 2013. |
(b) | | Rule 144A, Section 4(2) of the Securities Act of 1933 or other security which is restricted to resale to institutional investors. The Sub-Adviser has deemed these securities to be liquid based on procedures approved by the Trust’s Board of Trustees. As of October 31, 2013, the value of Rule 144A and Section 4(2) liquid securities was $25,446,281. |
(c) | | All or portion of the security was on loan. |
(d) | | Rule 144A, Section 4(2) of the Securities Act of 1933 or other security which is restricted to resale to institutional investors. The Sub-Adviser has not deemed these securities to be liquid based on procedures approved by the Trust’s Board of Trustees. See Restricted Securities Note in these Schedules of Investments. |
(e) | | The securities in this category are direct debt of the agency and not collateralized by mortgages. |
(f) | | All or a portion of the securities is pledged or segregated as collateral. See Pledged or Segregated Collateral note in the Notes to the Financial Statements. |
(g) | | U.S. Treasury inflation indexed note, par amount is adjusted for inflation. |
(h) | | All or a portion of the investment was purchased on a delayed delivery basis. As of October 31, 2013, the total cost of investments purchased on a delayed delivery basis was $230,960,906. |
(i) | | Perpetual maturity security. |
(j) | | Security fair valued in good faith in accordance with the procedures approved by the Trust’s Board of Trustees. Good faith fair valued securities may be classified as Level 2 or Level 3 for Financial Accounting Standards Board (“FASB”) Accounting Standards Codification (“ASC”) Topic 820 “Fair Value Measurements and Disclosures” based on the applicable valuation inputs. See FASB ASC Topic 820 “Fair Value Measurements and Disclosures” in the Notes to the Financial Statements. |
See accompanying Notes to Financial Statements.
Restricted Securities - Restricted securities are often purchased in private placement transactions and cannot be sold without prior registration unless the sale is pursuant to an exemption under the Securities Act of 1933, as amended. The following table details restricted securities, including Rule 144A securities that have not been deemed liquid, held by the Fund at October 31, 2013.
| | Initial
Acquisition
Date | | Cost | | Ending
Value | | Percent of
Net Assets | |
Banco Nacional de Desenvolvimento Economico e Social, 3.38%, 09/26/16 | | 09/20/2013 | | $ | 299,343 | | $ | 303,000 | | — | % |
Banco Santander Brasil SA, 2.35%, 03/18/14 | | 12/16/2011 | | 7,625,072 | | 7,699,969 | | 0.8 | |
Credit Agricole SA, 1.69%, 01/21/14 | | 12/05/2011 | | 1,488,394 | | 1,504,305 | | 0.2 | |
Vivendi SA, 2.40%, 04/10/15 | | 04/04/2012 | | 399,988 | | 410,256 | | — | |
| | | | $ | 9,812,797 | | $ | 9,917,530 | | 1.0 | % |
Schedule of Written Options
| | Expiration
Date | | Exercise
Price | | Contracts | | Value | |
| | | | | | | | | |
Exchange-Traded Futures Options | | | | | | | | | |
10-Year U.S. Future Call Option | | 11/22/2013 | | 128.00 | | 20 | | $ | (6,250 | ) |
10-Year U.S. Future Put Option | | 11/22/2013 | | 124.00 | | 20 | | (937 | ) |
3-Year Eurodollar Midcurve Future Put Option | | 03/14/2014 | | 97.38 | | 82 | | (26,650 | ) |
| | | | | | 122 | | $ | (33,837 | ) |
| | | | | | | | | |
Index Options | | | | | | | | | |
CDX.NA.IG-20 Call Option, BOA | | 12/18/2013 | | 0.65 | | 16 | | $ | (2,354 | ) |
CDX.NA.IG-20 Put Option, BOA | | 12/18/2013 | | 1.00 | | 16 | | (178 | ) |
CDX.NA.IG-20 Put Option, MSS | | 12/18/2013 | | 1.10 | | 14 | | (73 | ) |
| | | | | | 46 | | $ | (2,605 | ) |
| | | | | | | | | |
Interest Rate Swaptions | | | | | | | | | |
Call Swaption, 3 month EURIBOR versus 0.40% fixed, BBP | | 03/14/2014 | | N/A | | 14 | | $ | (2,296 | ) |
Call Swaption, 3 month EURIBOR versus 0.40% fixed, BOA | | 03/12/2014 | | N/A | | 57 | | (9,423 | ) |
Call Swaption, 3 month EURIBOR versus 0.40% fixed, GSB | | 03/12/2014 | | N/A | | 14 | | (2,315 | ) |
Call Swaption, 3 month LIBOR versus 1.30% fixed, MSS | | 01/27/2014 | | N/A | | 73 | | (8,636 | ) |
Call Swaption, 3 month LIBOR versus 1.40% fixed, GSB | | 01/27/2014 | | N/A | | 687 | | (162,466 | ) |
Call Swaption, 3 month LIBOR versus 2.40% fixed, DUB | | 03/17/2014 | | N/A | | 27 | | (8,467 | ) |
Put Swaption, 3 month EURIBOR versus 0.40% fixed, BBP | | 03/14/2014 | | N/A | | 14 | | (816 | ) |
Put Swaption, 3 month EURIBOR versus 0.40% fixed, BOA | | 03/12/2014 | | N/A | | 57 | | (3,324 | ) |
Put Swaption, 3 month EURIBOR versus 0.40% fixed, GSB | | 03/12/2014 | | N/A | | 14 | | (816 | ) |
Put Swaption, 3 month LIBOR versus 1.75% fixed, MSS | | 11/27/2013 | | N/A | | 128 | | (3,507 | ) |
Put Swaption, 3 month LIBOR versus 1.80% fixed, MSS | | 01/27/2014 | | N/A | | 73 | | (21,571 | ) |
Put Swaption, 3 month LIBOR versus 2.00% fixed, GSB | | 01/27/2014 | | N/A | | 687 | | (88,023 | ) |
Put Swaption, 3 month LIBOR versus 2.00% fixed, MSS | | 03/31/2014 | | N/A | | 722 | | (83,885 | ) |
Put Swaption, 3 month LIBOR versus 2.90% fixed, DUB | | 03/17/2014 | | N/A | | 27 | | (42,819 | ) |
| | | | | | 2,594 | | $ | (438,364 | ) |
Summary of Written Options
| | Contracts | | Premiums | |
Options outstanding at October 31, 2012 | | 1,825 | | $ | 582,400 | |
Options written during the year | | 8,507,937 | | 2,559,491 | |
Options closed during the year | | (1,153 | ) | (208,275 | ) |
Options expired during the year | | (8,505,847 | ) | (1,894,666 | ) |
Options outstanding at October 31, 2013 | | 2,762 | | $ | 1,038,950 | |
See accompanying Notes to Financial Statements.
Schedule of Open Futures Contracts
| | Expiration | | Contracts
Long | | Unrealized
Appreciation /
(Depreciation) | |
90-Day Eurodollar Future | | June 2015 | | 847 | | $ | 941,075 | |
90-Day Eurodollar Future | | September 2015 | | 503 | | 232,416 | |
90-Day Eurodollar Future | | December 2015 | | 926 | | (61,602 | ) |
90-Day Eurodollar Future | | March 2016 | | 414 | | (13,366 | ) |
90-Day Eurodollar Future | | June 2016 | | 10 | | (267 | ) |
90-Day Eurodollar Future | | September 2016 | | 40 | | 83,040 | |
90-Day Eurodollar Future | | December 2016 | | 33 | | 67,932 | |
90-Day Eurodollar Future | | March 2017 | | 21 | | 43,138 | |
90-Day Eurodollar Future | | June 2017 | | 32 | | 63,168 | |
U.S. Treasury Note Future, 10-Year | | December 2013 | | 132 | | 372,993 | |
U.S. Treasury Note Future, 5-Year | | December 2013 | | 688 | | 1,801,617 | |
| | | | | | $ | 3,530,144 | |
Schedule of Open Forward Foreign Currency Contracts
Purchased/
Sold | | Settlement
Date | | CounterParty | | Notional
Amount | | Value | | Unrealized
Gain/(Loss) | |
BRL/USD | | 11/04/2013 | | CSI | | BRL | 11,882,890 | | $ | 5,304,388 | | $ | 186,423 | |
BRL/USD | | 12/03/2013 | | CSI | | BRL | 125,006 | | 55,412 | | (1,819 | ) |
CAD/USD | | 12/23/2013 | | CSI | | CAD | 1,287,000 | | 1,232,791 | | (22,502 | ) |
CAD/USD | | 12/23/2013 | | MSC | | CAD | 3,049,000 | | 2,920,574 | | (28,371 | ) |
CAD/USD | | 12/23/2013 | | CSI | | CAD | 1,186,000 | | 1,136,045 | | (15,806 | ) |
EUR/USD | | 12/03/2013 | | BCL | | EUR | 9,111,000 | | 12,371,316 | | (179,970 | ) |
EUR/USD | | 11/04/2013 | | GSC | | EUR | 26,860,000 | | 36,469,294 | | 119,146 | |
MXN/USD | | 12/17/2013 | | GSC | | MXN | 2,343,203 | | 178,972 | | 1,078 | |
USD/BRL | | 11/04/2013 | | MSC | | BRL | (11,178,959 | ) | (4,990,161 | ) | (94,731 | ) |
USD/BRL | | 11/04/2013 | | MSC | | BRL | (506,688 | ) | (226,180 | ) | 5,820 | |
USD/BRL | | 11/04/2013 | | CSI | | BRL | (72,237 | ) | (32,246 | ) | 754 | |
USD/BRL | | 11/04/2013 | | CSI | | BRL | (125,006 | ) | (55,801 | ) | 1,805 | |
USD/CAD | | 12/23/2013 | | DUB | | CAD | (10,486,000 | ) | (10,044,322 | ) | 167,640 | |
USD/EUR | | 03/14/2014 | | BNP | | EUR | (2,654,690 | ) | (3,605,191 | ) | (106,394 | ) |
USD/EUR | | 03/14/2014 | | BOA | | EUR | (6,573,600 | ) | (8,927,250 | ) | (263,639 | ) |
USD/EUR | | 03/14/2014 | | GSC | | EUR | (11,940,000 | ) | (16,215,066 | ) | (265,626 | ) |
USD/EUR | | 02/28/2014 | | GSC | | EUR | (11,952,000 | ) | (16,230,917 | ) | (231,157 | ) |
USD/EUR | | 11/04/2013 | | CSI | | EUR | (2,036,000 | ) | (2,764,389 | ) | (18,619 | ) |
USD/EUR | | 11/04/2013 | | CSI | | EUR | (3,166,000 | ) | (4,298,652 | ) | (28,953 | ) |
USD/EUR | | 11/04/2013 | | CSI | | EUR | (131,000 | ) | (177,866 | ) | 1,598 | |
USD/EUR | | 11/04/2013 | | MSC | | EUR | (2,218,000 | ) | (3,011,500 | ) | 21,747 | |
USD/EUR | | 11/04/2013 | | MSC | | EUR | (10,198,000 | ) | (13,846,384 | ) | 99,987 | |
USD/EUR | | 11/04/2013 | | BCL | | EUR | (9,111,000 | ) | (12,370,504 | ) | 179,898 | |
USD/EUR | | 12/03/2013 | | MSC | | EUR | (14,287,000 | ) | (19,399,516 | ) | 276,255 | |
USD/EUR | | 12/16/2013 | | BOA | | EUR | (12,300,000 | ) | (16,701,609 | ) | (1,176,549 | ) |
USD/EUR | | 06/02/2014 | | CSI | | EUR | (200,000 | ) | (271,660 | ) | (18,060 | ) |
USD/EUR | | 08/01/2014 | | BNP | | EUR | (100,000 | ) | (135,855 | ) | (9,295 | ) |
USD/EUR | | 11/01/2013 | | CSI | | EUR | (14,287,870 | ) | (19,399,424 | ) | (936,353 | ) |
USD/GBP | | 12/12/2013 | | CSI | | GBP | (354,000 | ) | (567,442 | ) | (11,825 | ) |
USD/JPY | | 11/18/2013 | | BOA | | JPY | (161,071,000 | ) | (1,638,178 | ) | 5,404 | |
USD/MXN | | 02/06/2014 | | BNP | | MXN | (15,244,137 | ) | (1,159,706 | ) | 20,089 | |
| | | | | | | | | $ | (96,401,027 | ) | $ | (2,322,025 | ) |
See accompanying Notes to Financial Statements.
Schedule of Interest Rate Swap Agreements
Counterparty | | Floating Rate Index | | Fund
Paying/Receiving
Floating Rate | | Fixed Rate | | Expiration
Date | | Notional
Amount(1) | | Unrealized
Appreciation /
(Depreciation) | |
Over the Counter Interest Rate Swap Agreements | | | | | | | | |
BBP | | Mexican Interbank Rate | | Paying | | 5.50 | % | 09/13/2017 | | MXN | 2,000,000 | | $ | 3,721 | |
BBP | | Mexican Interbank Rate | | Paying | | 5.50 | % | 09/13/2017 | | MXN | 4,000,000 | | 7,401 | |
BBP | | Mexican Interbank Rate | | Paying | | 5.50 | % | 09/13/2017 | | MXN | 2,000,000 | | 4,171 | |
BBP | | Mexican Interbank Rate | | Paying | | 5.50 | % | 09/13/2017 | | MXN | 2,000,000 | | 3,412 | |
BBP | | Mexican Interbank Rate | | Paying | | 5.50 | % | 09/13/2017 | | MXN | 10,000,000 | | 24,870 | |
BBP | | Mexican Interbank Rate | | Paying | | 5.50 | % | 09/13/2017 | | MXN | 41,000,000 | | 74,436 | |
BBP | | Mexican Interbank Rate | | Paying | | 5.00 | % | 09/13/2017 | | MXN | 500,000 | | 421 | |
BBP | | Mexican Interbank Rate | | Paying | | 5.50 | % | 09/13/2017 | | MXN | 9,000,000 | | 22,967 | |
BBP | | Mexican Interbank Rate | | Paying | | 5.75 | % | 06/05/2023 | | MXN | 600,000 | | (964 | ) |
BBP | | Mexican Interbank Rate | | Paying | | 6.00 | % | 06/05/2023 | | MXN | 1,400,000 | | (1,723 | ) |
BNP | | Mexican Interbank Rate | | Paying | | 5.75 | % | 06/05/2023 | | MXN | 600,000 | | (1,916 | ) |
BOA | | Brazil Interbank Deposit Rate | | Paying | | 8.86 | % | 01/02/2017 | | BRL | 1,200,000 | | (24,799 | ) |
BOA | | Mexican Interbank Rate | | Paying | | 5.50 | % | 09/13/2017 | | MXN | 7,000,000 | | 11,275 | |
BOA | | Mexican Interbank Rate | | Paying | | 5.50 | % | 09/02/2022 | | MXN | 1,400,000 | | (4,916 | ) |
DUB | | Brazil Interbank Deposit Rate | | Paying | | 9.13 | % | 01/02/2017 | | BRL | 600,000 | | (13,417 | ) |
DUB | | Mexican Interbank Rate | | Paying | | 5.75 | % | 06/05/2023 | | MXN | 700,000 | | (1,856 | ) |
GSB | | Brazil Interbank Deposit Rate | | Paying | | 9.10 | % | 01/02/2017 | | BRL | 600,000 | | (12,399 | ) |
GSB | | Mexican Interbank Rate | | Paying | | 5.50 | % | 06/11/2018 | | MXN | 1,600,000 | | 2,013 | |
GSB | | Mexican Interbank Rate | | Paying | | 5.50 | % | 06/11/2018 | | MXN | 7,400,000 | | 9,043 | |
GSB | | Mexican Interbank Rate | | Paying | | 5.75 | % | 06/05/2023 | | MXN | 700,000 | | (1,012 | ) |
MSC | | Mexican Interbank Rate | | Paying | | 5.50 | % | 09/13/2017 | | MXN | 5,000,000 | | 12,867 | |
MSC | | Mexican Interbank Rate | | Paying | | 5.50 | % | 09/13/2017 | | MXN | 3,000,000 | | 5,749 | |
MSS | | Brazil Interbank Deposit Rate | | Paying | | 8.64 | % | 01/02/2017 | | BRL | 600,000 | | (13,096 | ) |
MSS | | Mexican Interbank Rate | | Paying | | 5.50 | % | 09/02/2022 | | MXN | 3,100,000 | | (10,657 | ) |
| | | | | | | | | | | | | $ | 95,591 | |
| | | | | | | | | | | | | | |
Centrally Cleared Interest Rate Swap Agreements | | | | | | | | | | |
N/A | | 3-Month LIBOR | | Paying | | 1.50 | % | 03/18/2016 | | | 99,700,000 | | $ | (50,331 | ) |
N/A | | 3-Month LIBOR | | Paying | | 3.00 | % | 09/21/2017 | | | 33,200,000 | | 239,255 | |
N/A | | 3-Month LIBOR | | Receiving | | 2.75 | % | 06/19/2043 | | | 36,700,000 | | 3,868,197 | |
N/A | | 3-Month LIBOR | | Receiving | | 3.50 | % | 12/18/2043 | | | 18,300,000 | | (639,207 | ) |
N/A | | British Bankers’ Association Yen LIBOR | | Receiving | | 1.00 | % | 09/18/2023 | | JPY | 1,840,000,000 | | (600,082 | ) |
N/A | | Federal Funds Effective Rate | | Paying | | 1.00 | % | 10/15/2017 | | | 61,600,000 | | (355,151 | ) |
| | | | | | | | | | | | | $ | 2,462,681 | |
Schedule of Credit Default Swap Agreements
Counterparty | | Reference Obligation | | Implied
Credit
Spread (3) | | Fixed Rate(6) | | Expiration
Date | | Notional
Amount(1),(5) | | Value(4) | | Unrealized
Appreciation /
(Depreciation) | |
Over the Counter Credit Default Swap Agreements | | | | | | | | | |
Credit default swap agreements - sell protection (2) | | | | | | | | | |
BBP | | Berkshire Hathaway Inc., 1.90%, 01/31/2017 | | 0.09 | % | 1.00 | % | 12/20/2013 | | $ | (300,000 | ) | $ | 377 | | $ | (970 | ) |
DUB | | Berkshire Hathaway Inc., 1.90%, 01/31/2017 | | 0.39 | % | 1.00 | % | 09/20/2016 | | (400,000 | ) | 7,035 | | 1,226 | |
GSI | | Canadian Natural Resources, 6.25%, 03/15/2038 | | 0.18 | % | 1.00 | % | 09/20/2015 | | (100,000 | ) | 1,552 | | 2,640 | |
BOA | | Citigroup Inc., 6.13%, 05/15/2018 | | 0.52 | % | 1.00 | % | 09/20/2016 | | (800,000 | ) | 11,170 | | 2,478 | |
DUB | | Federated Republic of Brazil, 12.25%, 03/06/2030 | | 1.24 | % | 1.00 | % | 12/20/2016 | | (2,500,000 | ) | (18,865 | ) | 33,524 | |
BBP | | General Electric Capital Corp., 5.63%, 09/15/2017 | | 0.40 | % | 1.00 | % | 09/20/2016 | | (800,000 | ) | 13,828 | | 5,865 | |
DUB | | JPMorgan Chase & Co., 4.75%, 03/01/2015 | | 0.51 | % | 1.00 | % | 09/20/2016 | | (800,000 | ) | 11,170 | | 1,748 | |
BBP | | People’s Republic of China, 4.75%, 10/29/2013 | | 0.40 | % | 1.00 | % | 09/20/2016 | | (13,900,000 | ) | 241,417 | | 56,798 | |
BBP | | Republic of Indonesia, 7.25%, 04/20/2015 | | 1.46 | % | 1.00 | % | 09/20/2017 | | (2,000,000 | ) | (34,423 | ) | 35,426 | |
CSI | | Republic of Indonesia, 7.25%, 04/20/2015 | | 1.46 | % | 1.00 | % | 09/20/2017 | | (700,000 | ) | (12,048 | ) | 12,093 | |
DUB | | Republic of Indonesia, 7.25%, 04/20/2015 | | 1.13 | % | 1.00 | % | 09/20/2016 | | (1,200,000 | ) | (4,539 | ) | 40,722 | |
DUB | | Republic of Indonesia, 7.25%, 04/20/2015 | | 1.38 | % | 1.00 | % | 06/20/2017 | | (400,000 | ) | (5,406 | ) | 5,445 | |
MSC | | Republic of Indonesia, 7.25%, 04/20/2015 | | 1.38 | % | 1.00 | % | 06/20/2017 | | (1,700,000 | ) | (22,976 | ) | 23,850 | |
BOA | | Rio Tinto Finance USA Ltd., 6.50%, 07/15/2018 | | 0.32 | % | 1.00 | % | 09/20/2015 | | (200,000 | ) | 2,571 | | 5,721 | |
BOA | | Time Warner Cable Inc., 5.85%, 05/01/2017 | | 0.65 | % | 1.00 | % | 09/20/2015 | | (100,000 | ) | 748 | | 2,991 | |
| | | | | | | | | | | | | | | | | | |
See accompanying Notes to Financial Statements.
Counterparty | | Reference Obligation | | Implied
Credit
Spread (3) | | Fixed Rate(6) | | Expiration
Date | | Notional
Amount(1),(5) | | Value(4) | | Unrealized
Appreciation /
(Depreciation) | |
Over the Counter Credit Default Swap Agreements (continued) | | | | | | | | | |
Credit default swap agreements - sell protection (2) (continued) | | | | | | | | | |
BNP | | United Mexican States, 5.95%, 03/19/2019 | | 0.80 | % | 1.00 | % | 09/20/2017 | | $ | (100,000 | ) | $ | 774 | | $ | 2,997 | |
BOA | | United Mexican States, 7.50%, 04/08/2033 | | 0.47 | % | 1.00 | % | 09/20/2015 | | (300,000 | ) | 3,036 | | 1,296 | |
DUB | | United Mexican States, 5.95%, 03/19/2019 | | 0.65 | % | 1.00 | % | 12/20/2016 | | (1,500,000 | ) | 16,560 | | 47,520 | |
MSC | | United Mexican States, 5.95%, 03/19/2019 | | 0.75 | % | 1.00 | % | 06/20/2017 | | (1,500,000 | ) | 13,254 | | 33,424 | |
| | | | | | | | | | $ | (29,300,000 | ) | $ | 225,235 | | $ | 314,794 | |
| | | | | | | | | | | | | | | |
Centrally Cleared Credit Default Swap Agreements | | | | | | | | | |
Credit default swap agreements - sell protection (2) | | | | | | | | | |
N/A | | CDX.NA.IG-21 | | N/A | | 1.00 | % | 12/20/2018 | | $ | (1,900,000 | ) | $ | 25,361 | | $ | 7,242 | |
N/A | | iTraxx Europe Series 20 | | N/A | | 1.00 | % | 12/20/2018 | | (15,478,405 | ) | 126,443 | | 169,185 | |
| | | | | | | | | | $ | (17,378,405 | ) | $ | 151,804 | | $ | 176,427 | |
(1)Notional amount is stated in USD unless otherwise noted.
(2)If the Fund is a seller of protection and a credit event occurs, as defined under the terms of that particular swap agreement, the Fund will either (i) pay the buyer of protection an amount equal to the notional amount of the referenced obligation and take delivery of the referenced obligation or underlying securities comprising the referenced index or (ii) pay a net settlement amount in the form of cash or securities equal to the notional amount of the swap agreement less the recovery value of the reference obligation or underlying securities comprising the referenced index.
(3)Implied credit spreads, represented in absolute terms, utilized in determining the value of credit default swap agreements on corporate issues and sovereign issues serve as an indicator of the current status of the payment/performance risk and represent the likelihood or risk of default for the credit derivative. The implied credit spread of a particular referenced entity reflects the cost of buying/selling protection and may include upfront payments required to be made to enter into the agreement. Wider credit spreads represent a deterioration of the referenced entity’s credit soundness and a greater likelihood or risk of default or other credit event occurring as defined under the terms of the applicable agreement.
(4)The prices and resulting values for credit default swap agreements on credit indices serve as an indicator of the current status of the payment/performance risk and represent the likelihood or risk of default for the credit derivative. Increasing market values, in absolute terms when compared to the notional amount of the swap, represent a deterioration of the referenced entity’s credit soundness and a greater likelihood or risk of default or other credit event occurring as defined under the terms of the agreement.
(5)The maximum potential amount the Fund could be required to pay as a seller of credit protection or receive as a buyer of credit protection if a credit event occurs is limited to the total notional amount which is defined under the terms of each swap agreement.
(6)If the Fund is a seller of protection, the Fund receives the fixed rate.
See accompanying Notes to Financial Statements.
| | Shares/Par † | | Value | |
Curian/WMC International Equity Fund | | | | | |
COMMON STOCKS - 92.7% | | | | | |
AUSTRIA - 0.7% | | | | | |
Erste Group Bank AG | | 68,191 | | $ | 2,394,183 | |
BELGIUM - 3.7% | | | | | |
Anheuser-Busch InBev NV | | 114,456 | | 11,864,979 | |
Umicore SA (a) | | 39,641 | | 1,887,671 | |
| | | | 13,752,650 | |
BRAZIL - 0.2% | | | | | |
Mills Estruturas e Servicos de Engenharia SA | | 59,700 | | 828,797 | |
| | | | | |
CANADA - 3.3% | | | | | |
Canadian National Railway Co. | | 38,600 | | 4,240,761 | |
Suncor Energy Inc. | | 70,900 | | 2,576,513 | |
Tim Hortons Inc. | | 86,550 | | 5,166,520 | |
| | | | 11,983,794 | |
CHINA - 1.8% | | | | | |
ENN Energy Holdings Ltd. | | 372,000 | | 2,205,550 | |
Lenovo Group Ltd. (a) | | 4,174,000 | | 4,471,210 | |
| | | | 6,676,760 | |
FINLAND - 0.5% | | | | | |
Kone Oyj - Class B | | 20,462 | | 1,803,984 | |
| | | | | |
FRANCE - 18.2% | | | | | |
Accor SA | | 45,738 | | 2,044,311 | |
Air Liquide SA | | 48,373 | | 6,574,583 | |
AtoS | | 39,856 | | 3,397,357 | |
AXA SA | | 343,028 | | 8,546,726 | |
BNP Paribas SA | | 83,094 | | 6,130,130 | |
Bureau Veritas SA (a) | | 38,771 | | 1,169,563 | |
Cap Gemini SA | | 59,172 | | 3,880,397 | |
Essilor International SA | | 39,395 | | 4,221,797 | |
Peugeot SA (b) | | 163,266 | | 2,147,770 | |
Rexel SA | | 220,109 | | 5,513,858 | |
Safran SA | | 45,566 | | 2,905,209 | |
Sanofi | | 51,003 | | 5,438,124 | |
Schneider Electric SA | | 90,680 | | 7,630,547 | |
Societe Generale SA | | 65,133 | | 3,679,348 | |
Technip SA | | 31,540 | | 3,303,471 | |
Unibail-Rodamco SE | | 1,032 | | 269,631 | |
| | | | 66,852,822 | |
GERMANY - 3.1% | | | | | |
Brenntag AG | | 11,763 | | 1,990,417 | |
Continental AG | | 20,952 | | 3,831,443 | |
Lanxess AG | | 26,701 | | 1,875,267 | |
ProSiebenSat.1 Media AG | | 81,293 | | 3,871,989 | |
| | | | 11,569,116 | |
HONG KONG - 1.4% | | | | | |
AIA Group Ltd. | | 494,800 | | 2,512,512 | |
MGM China Holdings Ltd. | | 771,230 | | 2,659,230 | |
| | | | 5,171,742 | |
INDIA - 0.1% | | | | | |
ITC Ltd. - GDR | | 21,123 | | 114,041 | |
United Spirits Ltd. - GDR | | 18,158 | | 376,769 | |
| | | | 490,810 | |
IRELAND - 3.2% | | | | | |
Covidien Plc | | 33,000 | | 2,115,630 | |
CRH Plc | | 201,424 | | 4,911,928 | |
Experian Plc | | 227,336 | | 4,628,283 | |
| | | | 11,655,841 | |
ITALY - 5.8% | | | | | |
Assicurazioni Generali SpA | | 322,394 | | 7,537,278 | |
Banca Generali SpA | | 77,125 | | 2,013,379 | |
Fiat SpA (b) | | 238,974 | | 1,875,173 | |
Intesa Sanpaolo SpA | | 1,348,647 | | 3,345,836 | |
Snam SpA | | 1,012,819 | | 5,218,584 | |
UniCredit SpA | | 163,461 | | 1,227,040 | |
| | | | 21,217,290 | |
JAPAN - 20.9% | | | | | |
AEON Co. Ltd. | | 208,700 | | 2,848,009 | |
Aeon Mall Co. Ltd. | | 27,500 | | 781,027 | |
Aisin Seiki Co. Ltd. | | 106,100 | | 4,310,251 | |
Asahi Group Holdings Ltd. | | 155,100 | | 4,194,604 | |
Bank of Yokohama Ltd. | | 271,000 | | 1,494,368 | |
Daito Trust Construction Co. Ltd. | | 22,300 | | 2,276,914 | |
Daiwa House Industry Co. Ltd. | | 90,000 | | 1,803,041 | |
Dentsu Inc. | | 97,600 | | 3,687,543 | |
Eisai Co. Ltd. (a) | | 80,400 | | 3,158,276 | |
Honda Motor Co. Ltd. | | 38,920 | | 1,554,189 | |
Japan Tobacco Inc. | | 197,500 | | 7,146,278 | |
Mitsubishi Electric Corp. | | 365,200 | | 4,014,266 | |
Mitsubishi UFJ Financial Group Inc. | | 1,096,090 | | 6,980,194 | |
Mitsui Fudosan Co. Ltd. | | 78,000 | | 2,583,821 | |
Nomura Holdings Inc. | | 498,600 | | 3,683,175 | |
Nomura Research Institute Ltd. | | 63,700 | | 2,137,916 | |
Olympus Corp. (b) | | 62,500 | | 1,999,464 | |
Omron Corp. | | 36,200 | | 1,381,436 | |
Ono Pharmaceutical Co. Ltd. | | 47,800 | | 3,614,166 | |
ORIX Corp. | | 228,500 | | 3,957,868 | |
Rakuten Inc. (a) | | 365,500 | | 4,762,334 | |
T&D Holdings Inc. | | 202,920 | | 2,436,205 | |
THK Co. Ltd. (a) | | 34,500 | | 753,079 | |
Tokio Marine Holdings Inc. | | 162,800 | | 5,337,310 | |
| | | | 76,895,734 | |
MALAYSIA - 0.1% | | | | | |
AirAsia Bhd | | 377,500 | | 320,477 | |
| | | | | |
MEXICO - 0.3% | | | | | |
Fibra Uno Administracion SA de CV | | 412,900 | | 1,278,519 | |
| | | | | |
NETHERLANDS - 1.8% | | | | | |
ASML Holding NV - NYRS | | 15,960 | | 1,510,454 | |
NXP Semiconductors NV (b) | | 118,858 | | 5,006,299 | |
| | | | 6,516,753 | |
NORWAY - 0.4% | | | | | |
Algeta ASA (b) | | 39,250 | | 1,559,306 | |
| | | | | |
PANAMA - 0.4% | | | | | |
Copa Holdings SA - Class A | | 9,500 | | 1,420,630 | |
| | | | | |
PORTUGAL - 0.7% | | | | | |
Galp Energia SGPS SA | | 147,123 | | 2,491,305 | |
| | | | | |
RUSSIAN FEDERATION - 0.7% | | | | | |
QIWI plc - ADR | | 20,000 | | 809,600 | |
Sberbank of Russia - ADR | | 136,800 | | 1,744,526 | |
| | | | 2,554,126 | |
SPAIN - 1.3% | | | | | |
Banco Popular Espanol SA (b) | | 214,033 | | 1,214,080 | |
Telefonica SA (b) | | 200,449 | | 3,527,780 | |
| | | | 4,741,860 | |
| | | | | | |
See accompanying Notes to Financial Statements.
| | Shares/Par † | | Value | |
SWEDEN - 1.7% | | | | | |
Assa Abloy AB - Class B | | 128,433 | | 6,372,478 | |
| | | | | |
SWITZERLAND - 7.5% | | | | | |
Cie Financiere Richemont SA | | 26,527 | | 2,712,379 | |
Julius Baer Group Ltd. | | 169,638 | | 8,321,722 | |
Roche Holding AG | | 41,782 | | 11,554,203 | |
UBS AG | | 259,700 | | 5,022,876 | |
| | | | 27,611,180 | |
TAIWAN - 1.9% | | | | | |
Taiwan Semiconductor Manufacturing Co. Ltd. | | 1,940,000 | | 7,149,996 | |
| | | | | |
UNITED ARAB EMIRATES - 0.5% | | | | | |
Al Noor Hospitals Group Plc (b) | | 47,300 | | 644,652 | |
NMC Health Plc | | 186,025 | | 1,080,649 | |
| | | | 1,725,301 | |
UNITED KINGDOM - 12.5% | | | | | |
AstraZeneca Plc | | 124,610 | | 6,596,928 | |
BAE Systems Plc | | 603,016 | | 4,398,733 | |
Barclays Plc | | 490,181 | | 2,062,435 | |
BG Group Plc | | 261,364 | | 5,331,785 | |
BP Plc | | 229,588 | | 1,782,216 | |
Derwent London Plc | | 17,113 | | 686,931 | |
Diageo Plc | | 215,570 | | 6,871,880 | |
Direct Line Insurance Group Plc | | 501,373 | | 1,808,792 | |
Great Portland Estates Plc | | 74,595 | | 684,522 | |
Kingfisher Plc | | 624,885 | | 3,780,236 | |
National Grid Plc | | 195,738 | | 2,459,811 | |
Rolls-Royce Holdings Plc | | 391,904 | | 7,220,104 | |
Schroders Plc | | 55,541 | | 2,292,327 | |
| | | | 45,976,700 | |
Total Common Stocks (cost $285,093,344) | | | | 341,012,154 | |
| | | | | |
PREFERRED STOCKS - 1.4% | | | | | |
GERMANY - 1.4% | | | | | |
Volkswagen AG | | 20,019 | | 5,077,007 | |
Total Preferred Stocks (cost $4,615,012) | | | | 5,077,007 | |
| | | | | |
INVESTMENT COMPANIES - 1.3% | | | | | |
iShares MSCI EAFE ETF (a) | | 48,900 | | 3,221,532 | |
iShares MSCI Japan ETF (a) | | 146,400 | | 1,742,160 | |
Total Investment Companies (cost $4,460,682) | | | | 4,963,692 | |
| | | | | |
SHORT TERM INVESTMENTS - 2.9% | | | | | |
Securities Lending Collateral - 2.9% | | | | | |
Fidelity Institutional Money Market Portfolio, 0.08% (c) | | 4,000,000 | | 4,000,000 | |
Repurchase Agreement with DUB, 0.10% (Collateralized by $3,597,677 U.S. Treasury Bond Strip, due 08/15/20-11/15/42, value $2,221,900, $3,341,471 U.S. Treasury Note, 0.75-3.75%, due 05/31/14-01/15/20, value $3,664,677, $556,081 U.S. Treasury Bond, 2.75-8.75%, due 08/15/20-08/15/42, value $727,006, and $52,909 U.S. Treasury Inflation Indexed Note, 3.38%, due 04/15/32, value $98,338) acquired on 10/31/13, due 11/01/13 at $6,580,331 | | $ | 6,580,313 | | 6,580,313 | |
| | | | 10,580,313 | |
Total Short Term Investments (cost $10,580,313) | | | | 10,580,313 | |
Total Investments - 98.3% (cost $304,749,351) | | | | 361,633,166 | |
Other Assets and Liabilities, Net - 1.7% | | | | 6,106,190 | |
Total Net Assets - 100.0% | | | | $ | 367,739,356 | |
| | | | | | | |
(a) | | All or portion of the security was on loan. |
(b) | | Non-income producing security. |
(c) | | Yield changes daily to reflect current market conditions. Rate was the quoted yield as of October 31, 2013. |
See accompanying Notes to Financial Statements.
Currencies:
AUD - Australian Dollar
BRL - Brazilian Real
CAD - Canadian Dollar
EUR - European Currency Unit (Euro)
GBP - British Pound
JPY - Japanese Yen
MXN - Mexican Peso
RUB - Russian Ruble
USD - United States Dollar
ZAR - South African Rand
Abbreviations:
ABS - Asset Backed Securities
ADR - American Depository Receipt
BOT - Buono Ordinario del Tesoro
CDO - Collateralized Debt Obligation
CDX.NA.IG - Credit Derivatives Index - North American - Investment Grade
CLO - Collateralized Loan Obligation
ETF - Exchange Traded Fund
Euribor - Europe Interbank Offered Rate
Euro-Bund - debt instrument issued by the Federal Republic of Germany with a term of 8.5 to 10.5 years
GDR - Global Depository Receipt
GO - General Obligation
iTraxx - group of international credit derivative indexes monitored by the International Index Company
LIBOR - London Interbank Offered Rate
NYRS - New York Registry Shares
OJSC - Open Joint Stock Company
RB - Revenue Bond
REMIC - Real Estate Mortgage Investment Conduit
TBA - To Be Announced (Securities purchased on a delayed delivery basis)
Counterparty Abbreviations:
BBP - Barclays Bank Plc
BCL - Barclays Capital Inc.
BNP - BNP Paribas Securities
BNS — Bank of Novia Scotia
BOA - Banc of America Securities LLC/Bank of America NA
CSI - Credit Suisse Securities, LLC
DUB - Deutsche Bank Alex Brown Inc.
GSB - Goldman Sachs Bank USA
GSC - Goldman Sachs & Co.
GSI - Goldman Sachs International
JPM - J.P. Morgan Securities LLC
MLP - Merrill Lynch Professional Clearing Corp.
MSC - Morgan Stanley & Co., Incorporated
MSS - Morgan Stanley Capital Services Inc.
RBS - Royal Bank of Scotland
UBS - UBS Securities LLC
† For funds with fixed income securities, par amounts are listed in United States Dollars unless otherwise noted. Options are quoted in unrounded number of contracts.
See accompanying Notes to Financial Statements.
Curian Series Trust
Statements of Assets and Liabilities
October 31, 2013
| | Curian/PIMCO
Income Fund | | Curian/PIMCO
Total Return Fund | | Curian/WMC
International Equity Fund | |
Assets | | | | | | | |
Investments, at value (a) (b) | | $ | 600,069,198 | | $ | 959,169,364 | | $ | 355,052,853 | |
Repurchase agreements (a) | | 8,620,125 | | 232,944,953 | | 6,580,313 | |
Total investments, at value (a) | | 608,689,323 | | 1,192,114,317 | | 361,633,166 | |
Cash | | 602,745 | | 953,171 | | 15,186,788 | |
Foreign currency (c) | | 1,033,239 | | 258,652 | | 33,924 | |
Receivable for investments securities sold | | 29,077,764 | | 132,112,311 | | 3,831,848 | |
Receivable for fund shares sold | | 778,765 | | 1,763,579 | | 591,637 | |
Receivable from adviser | | 88,431 | | 182,018 | | 43,971 | |
Receivable for dividends and interest | | 6,211,985 | | 3,742,056 | | 953,195 | |
Receivable for variation margin on financial derivative instruments | | 79,714 | | 275,665 | | — | |
Receivable for deposits with brokers and counterparties | | 696,000 | | 1,742,000 | | — | |
Unrealized appreciation on forward foreign currency contracts | | 483,452 | | 1,087,644 | | — | |
Unrealized appreciation on OTC swap agreements | | 1,113,443 | | 498,110 | | — | |
OTC swap premiums paid | | 213,395 | | 242,825 | | — | |
Total assets | | 649,068,256 | | 1,334,972,348 | | 382,274,529 | |
Liabilities | | | | | | | |
Payable for reverse repurchase agreements | | 25,211,630 | | — | | — | |
Payable for advisory fees | | 75,080 | | 131,949 | | 45,357 | |
Payable for sub-advisory fees | | 125,130 | | 201,179 | | 131,480 | |
Payable for administrative fees | | 300,322 | | 527,796 | | 257,022 | |
Payable for investment securities purchased | | 38,082,049 | | 335,453,490 | | 3,440,028 | |
Payable for treasury roll transactions | | 14,269,702 | | — | | — | |
Payable for fund shares redeemed | | 1,240,260 | | 967,591 | | 57,170 | |
Payable for dividends | | 1,507,255 | | 927,654 | | — | |
Payable for chief compliance officer fees | | 2,765 | | 4,485 | | 1,375 | |
Payable for interest expense | | 1,004 | | — | | — | |
Payable for trustee fees | | 35,891 | | 61,103 | | 15,280 | |
Payable for other expenses | | 15,483 | | 24,261 | | 7,148 | |
Payable for variation margin on financial derivative instruments | | 68,951 | | 36,780 | | — | |
Payable for deposits from brokers and counterparties | | 538,000 | | 3,305,000 | | — | |
Investment in forward sales commitments, at value (d) | | 5,266,406 | | 1,070,469 | | — | |
Options written, at value (e) | | 1,070,264 | | 474,806 | | — | |
Unrealized depreciation on forward foreign currency contracts | | 699,336 | | 3,409,669 | | — | |
Unrealized depreciation on OTC swap agreements | | 2,565,104 | | 87,725 | | — | |
OTC swap premiums received | | 1,009,121 | | 338,592 | | — | |
Payable upon return of securities loaned | | 18,620,125 | | 3,644,953 | | 10,580,313 | |
Total liabilities | | 110,703,878 | | 350,667,502 | | 14,535,173 | |
Net assets | | $ | 538,364,378 | | $ | 984,304,846 | | $ | 367,739,356 | |
Net assets consist of: | | | | | | | |
Paid-in capital | | $ | 543,239,847 | | $ | 975,772,062 | | $ | 287,514,703 | |
Undistributed (excess of distributions over) net investment income | | (1,558,167 | ) | 1,750,109 | | 3,777,169 | |
Accumulated net realized gain (loss) | | (6,161,412 | ) | (6,585,449 | ) | 19,553,646 | |
Net unrealized appreciation on investments and foreign currency | | 2,844,110 | | 13,368,124 | | 56,893,838 | |
| | $ | 538,364,378 | | $ | 984,304,846 | | $ | 367,739,356 | |
Shares outstanding (no par value), unlimited shares authorized | | 52,143,733 | | 97,235,533 | | 28,085,172 | |
Net asset value per share, offering and redemption price per share | | $ | 10.32 | | $ | 10.12 | | $ | 13.09 | |
(a) Investments, at cost | | $ | 604,945,753 | | $ | 1,183,371,662 | | $ | 304,749,351 | |
(b) Including value of securities on loan | | 18,243,808 | | 3,568,698 | | 10,039,463 | |
(c) Foreign currency, at cost | | 1,034,713 | | 260,858 | | 33,304 | |
(d) Proceeds from forward sales commitments | | 5,228,906 | | 1,071,406 | | — | |
(e) Premiums from options written | | 959,261 | | 1,038,950 | | — | |
See accompanying Notes to Financial Statements.
Curian Series Trust
Statements of Operations
For the Year Ended October 31, 2013
| | Curian/PIMCO
Income Fund | | Curian/PIMCO
Total Return Fund | | Curian/WMC
International Equity Fund | |
Investment income | | | | | | | |
Dividends | | $ | 62,500 | | $ | 240,000 | | $ | 8,385,157 | |
Foreign taxes withheld | | (8,076 | ) | (4,557 | ) | (396,045 | ) |
Interest | | 24,636,279 | | 22,863,274 | | — | |
Securities lending | | 64,941 | | 21,587 | | 277,360 | |
Other income (a) | | 1,455 | | 1,206 | | 6,348 | |
Total investment income | | 24,757,099 | | 23,121,510 | | 8,272,820 | |
| | | | | | | |
Expenses | | | | | | | |
Advisory fees | | 1,069,198 | | 1,631,934 | | 448,146 | |
Sub-advisory fees | | 1,781,986 | | 2,445,094 | | 1,319,963 | |
Administrative fees | | 4,276,783 | | 6,527,723 | | 2,539,481 | |
Chief compliance officer fees | | 32,595 | | 48,447 | | 13,285 | |
Legal fees | | 49,204 | | 75,581 | | 20,749 | |
Trustee fees | | 49,422 | | 69,775 | | 19,226 | |
Interest expense | | 12,856 | | 5,387 | | — | |
Other expenses | | 5,677 | | 8,826 | | 9,152 | |
Total expenses | | 7,277,721 | | 10,812,767 | | 4,370,002 | |
Expense waived by Adviser | | (1,184,932 | ) | (2,101,426 | ) | (422,535 | ) |
Net expenses | | 6,092,789 | | 8,711,341 | | 3,947,467 | |
Net investment income | | 18,664,310 | | 14,410,169 | | 4,325,353 | |
| | | | | | | |
Realized and unrealized gain (loss) | | | | | | | |
Net realized gain (loss) on: | | | | | | | |
Investments | | (8,681,131 | ) | (5,906,785 | ) | 21,106,107 | |
Swap agreements | | 6,212,058 | | (33,706 | ) | — | |
Foreign currency related items | | (523,239 | ) | 5,406,973 | | (74,488 | ) |
Futures contracts | | (175,295 | ) | (485,755 | ) | — | |
Written option contracts | | 839,008 | | 1,646,275 | | — | |
Brokerage commissions recaptured | | — | | — | | 4,352 | |
Net change in unrealized appreciation (depreciation) on: | | | | | | | |
Investments | | (22,212,884 | ) | (22,794,168 | ) | 35,386,094 | |
OTC Swap agreements | | (5,158,794 | ) | (2,174,852 | ) | — | |
Foreign currency related items | | (340,333 | ) | (2,797,029 | ) | 17,247 | |
Futures contracts and centrally cleared swap agreements | | 443,664 | | 6,635,502 | | — | |
Written option contracts | | (2,302 | ) | 353,878 | | — | |
Net realized and unrealized gain (loss) | | (29,599,248 | ) | (20,149,667 | ) | 56,439,312 | |
Net increase (decrease) in net assets from operations | | $ | (10,934,938 | ) | $ | (5,739,498 | ) | $ | 60,764,665 | |
(a) Income from affiliated investments | | $ | 1,455 | | $ | 1,206 | | $ | 6,348 | |
See accompanying Notes to Financial Statements.
Curian Series Trust
Statements of Changes in Net Assets
For the Year Ended October 31, 2013
| | Curian/PIMCO
Income Fund | | Curian/PIMCO
Total Return Fund | | Curian/WMC
International Equity Fund | |
Operations | | | | | | | |
Net investment income | | $ | 18,664,310 | | $ | 14,410,169 | | $ | 4,325,353 | |
Net realized gain (loss) | | (2,328,599 | ) | 627,002 | | 21,035,971 | |
Net change in unrealized appreciation (depreciation) | | (27,270,649 | ) | (20,776,669 | ) | 35,403,341 | |
Net increase (decrease) in net assets from operations | | (10,934,938 | ) | (5,739,498 | ) | 60,764,665 | |
Distributions to shareholders | | | | | | | |
From net investment income | | (22,560,063 | ) | (17,559,007 | ) | (3,704,040 | ) |
From net realized gains | | (10,277,902 | ) | (29,908,755 | ) | (1,917,321 | ) |
Total distributions to shareholders | | (32,837,965 | ) | (47,467,762 | ) | (5,621,361 | ) |
Share transactions(1) | | | | | | | |
Proceeds from the sale of shares | | 413,033,813 | | 489,775,966 | | 134,516,055 | |
Cost of shares redeemed | | (449,936,895 | ) | (507,260,022 | ) | (76,117,677 | ) |
Change in net assets from share transactions | | (36,903,082 | ) | (17,484,056 | ) | 58,398,378 | |
Change in net assets | | (80,675,985 | ) | (70,691,316 | ) | 113,541,682 | |
Net assets beginning of year | | 619,040,363 | | 1,054,996,162 | | 254,197,674 | |
Net assets end of year | | $ | 538,364,378 | | $ | 984,304,846 | | $ | 367,739,356 | |
Undistributed (excess of distributions over) net investment income | | $ | (1,558,167 | ) | $ | 1,750,109 | | $ | 3,777,169 | |
(1) Share transactions | | | | | | | |
Shares sold | | 38,803,636 | | 47,799,030 | | 11,278,604 | |
Shares redeemed | | (43,509,091 | ) | (49,839,915 | ) | (6,449,984 | ) |
Change in shares | | (4,705,455 | ) | (2,040,885 | ) | 4,828,620 | |
Purchase and sales of investment securities (excluding short-term securities): | | | | | | | |
Purchase of securities | | $ | 965,642,587 | (a) | $ | 3,655,876,364 | (b) | $ | 365,540,813 | |
Proceeds from sales of securities | | 983,291,153 | (a) | 3,944,046,351 | (b) | 314,358,939 | |
| | | | | | | | | | |
(a) Amounts include $552,355,768 and $611,860,718 of purchases and sales, respectively, of U.S. Government Securities.
(b) Amounts include $3,517,436,313 and $3,643,272,224 of purchases and sales, respectively, of U.S. Government Securities.
See accompanying Notes to Financial Statements.
Curian Series Trust
Statements of Changes in Net Assets
For the Period Ended October 31, 2012
| | Curian/PIMCO
Income Fund (c) | | Curian/PIMCO Total Return
Fund (c) | | Curian/WMC International
Equity Fund (c) | |
Operations | | | | | | | |
Net investment income | | $ | 10,697,880 | | $ | 15,840,308 | | $ | 2,989,147 | |
Net realized gain | | 11,030,788 | | 29,262,941 | | 601,705 | |
Net change in unrealized appreciation | | 30,114,759 | | 34,144,793 | | 21,490,497 | |
Net increase in net assets from operations | | 51,843,427 | | 79,248,042 | | 25,081,349 | |
Distributions to shareholders | | | | | | | |
From net investment income | | (12,945,993 | ) | (17,507,998 | ) | — | |
Total distributions to shareholders | | (12,945,993 | ) | (17,507,998 | ) | — | |
Share transactions(1) | | | | | | | |
Proceeds from the sale of shares | | 671,322,613 | | 1,270,824,030 | | 295,109,756 | |
Cost of shares redeemed | | (91,224,984 | ) | (277,650,059 | ) | (66,090,617 | ) |
Change in net assets from share transactions | | 580,097,629 | | 993,173,971 | | 229,019,139 | |
Change in net assets | | 618,995,063 | | 1,054,914,015 | | 254,100,488 | |
Net assets beginning of period | | 45,300 | | 82,147 | | 97,186 | |
Net assets end of period | | $ | 619,040,363 | | $ | 1,054,996,162 | | $ | 254,197,674 | |
Undistributed (excess of distributions over) net investment income | | $ | (15,268 | ) | $ | (1,640,853 | ) | $ | 2,659,653 | |
(1) Share transactions | | | | | | | |
Shares sold | | 65,565,995 | | 126,100,931 | | 29,580,444 | |
Shares redeemed | | (8,721,337 | ) | (26,832,728 | ) | (6,333,611 | ) |
Change in shares | | 56,844,658 | | 99,268,203 | | 23,246,833 | |
Purchase and sales of investment securities (excluding short-term securities): | | | | | | | |
Purchase of securities | | $ | 1,022,377,633 | (a) | $ | 6,547,621,692 | (b) | $ | 415,917,819 | |
Proceeds from sales of securities | | 465,606,846 | (a) | 5,398,395,454 | (b) | 196,315,075 | |
| | | | | | | | | | |
(a) Amounts include $497,158,727 and $378,795,538 of purchases and sales, respectively, of U.S. Government Securities.
(b) Amounts include $5,840,305,014 and $5,112,331,262 of purchases and sales, respectively, of U.S. Government Securities.
(c) Period from November 2, 2011 (commencement of operations).
See accompanying Notes to Financial Statements.
Curian Series Trust
Financial Highlights
For a Share Outstanding
| | | | Increase (Decrease) from
Investment Operations | | Distributions from | | | | Supplemental Data | | Ratios | |
Period
Ended | | Net Asset
Value,
Beginning
of Period | | Net
Investment
Income
(Loss)(a) | | Net Realized
& Unrealized
Gains
(Losses) | | Total from
Investment
Operations | | Net
Investment
Income | | Net Realized
Gain on
Investment
Transactions | | Net Asset
Value,
End
of Period | | Total
Return(b) | | Net Assets,
End of
Period (in
thousands) | | Portfolio
Turnover(b) | | Net
Expenses to
Average Net
Assets(c) | | Total
Expenses to
Average Net
Assets(c) | | Net Investment
Income (Loss)
to Average Net
Assets(c) | |
Curian/PIMCO Income Fund | | | | | | | | | | | | | | | | | | | | | | | | | | | |
| | | | | | | | | | | | | | | | | | | | | | | | | | | |
10/31/2013 | | $ | 10.89 | | $ | 0.28 | | $ | (0.35 | ) | $ | (0.07 | ) | $ | (0.34 | ) | $ | (0.16 | ) | $ | 10.32 | | (0.66 | )% | $ | 538,364 | | 128 | % | 0.85 | % | 1.02 | % | 2.62 | % |
10/31/2012 * | | 10.00 | | 0.27 | | 0.92 | | 1.19 | | (0.30 | ) | — | | 10.89 | | 12.11 | | 619,040 | | 115 | | 0.85 | | 1.04 | | 2.56 | |
| | | | | | | | | | | | | | | | | | | | | | | | | | | |
Curian/PIMCO Total Return Fund | | | | | | | | | | | | | | | | | | | | | | | | | | | |
| | | | | | | | | | | | | | | | | | | | | | | | | | | |
10/31/2013 | | 10.63 | | 0.14 | | (0.18 | ) | (0.04 | ) | (0.17 | ) | (0.30 | ) | 10.12 | | (0.46 | ) | 984,305 | | 313 | | 0.80 | | 0.99 | | 1.32 | |
10/31/2012 * | | 10.00 | | 0.18 | | 0.63 | | 0.81 | | (0.18 | ) | — | | 10.63 | | 8.19 | | 1,054,996 | | 519 | | 0.80 | | 1.02 | | 1.73 | |
| | | | | | | | | | | | | | | | | | | | | | | | | | | |
Curian/WMC International Equity Fund | | | | | | | | | | | | | | | | | | | | | | | | | | | |
| | | | | | | | | | | | | | | | | | | | | | | | | | | |
10/31/2013 | | 10.93 | | 0.17 | | 2.23 | | 2.40 | | (0.16 | ) | (0.08 | ) | 13.09 | | 22.36 | | 367,739 | | 109 | | 1.32 | | 1.46 | | 1.45 | |
10/31/2012 * | | 10.00 | | 0.14 | | 0.79 | | 0.93 | | — | | — | | 10.93 | | 9.30 | | 254,198 | | 90 | | 1.32 | | 1.49 | | 1.35 | |
| | | | | | | | | | | | | | | | | | | | | | | | | | | | | | | | | | | |
* Commenced operations on November 2, 2011.
(a) Per share data calculated using average shares method.
(b) Not annualized for periods less than one year.
(c) Annualized for periods less than one year.
See accompanying Notes to Financial Statements.
Curian Series Trust
Notes to Financial Statements
October 31, 2013
NOTE 1. ORGANIZATION
The Curian Series Trust (“Trust”) is an open-end management investment company organized under the laws of the state of Massachusetts, by a Declaration of Trust, dated November 5, 2010. The Trust is registered with the U.S. Securities and Exchange Commission (“SEC”) under the Investment Company Act of 1940, as amended (“1940 Act”), and its shares are registered under the Securities Act of 1933, as amended (“1933 Act”). The Trust currently offers shares in three (3) separate funds (each a “Fund”, and collectively, “Funds”), each with its own investment objective: Curian/PIMCO Income Fund and Curian/PIMCO Total Return Fund, for which Pacific Investment Management Company LLC (“PIMCO”) serves as the Sub-Adviser, and Curian/WMC International Equity Fund, for which Wellington Management Company, LLP (“WMC”) serves as the Sub-Adviser. PIMCO and WMC are referred to herein as a “Sub-Adviser”. The Funds are diversified Funds for purposes of the 1940 Act.
Curian Capital, LLC (“Curian”, “Adviser” or “Administrator”) serves as the investment adviser and administrator of the Funds with the responsibility for the professional investment supervision and management of the Funds. Curian is a wholly owned subsidiary of Jackson National Life Insurance Company (“Jackson”), which is in turn wholly owned by Prudential plc, a publicly traded company incorporated in the United Kingdom. Prudential plc is not affiliated in any manner with Prudential Financial Inc., a company whose principal place of business is in the United States of America. At October 31, 2013, Curian owned 4,000 shares of each Fund.
Purchases and redemptions of shares of the Funds are initiated by Curian and shares may be purchased on behalf of clients in Curian’s managed account program. Each Fund offers one share class without a sales charge.
NOTE 2. SIGNIFICANT ACCOUNTING POLICIES
The following is a summary of significant accounting policies consistently followed by the Trust in the preparation of its financial statements in conformity with U.S. generally accepted accounting principles (“GAAP”):
Security Valuation - Curian has entered into a sub-administration and fund accounting services agreement on behalf of the Funds with Jackson Fund Services (“JFS” or “Sub-Administrator”), a division of Jackson National Asset Management, LLC (“JNAM”). JNAM is a subsidiary of Jackson and an affiliate of Curian. Under the Trust’s valuation policy and procedures, the Trust’s Board of Trustees (“Board”) has delegated the daily operational oversight of the securities valuation function to the Pricing Committee of JFS (“Pricing Committee”), which consists of certain officers of the Trust and JNAM management. The Pricing Committee is responsible for determining fair valuations for any security for which market quotations are not readily available. For those securities fair valued under procedures adopted by the Board, the Pricing Committee reviews and affirms the reasonableness of the fair valuation determinations after considering all relevant information that is reasonably available. The Pricing Committee’s fair valuation determinations are subject to review, at the latest, by the Board at its next regularly scheduled meeting covering the calendar quarter in which the fair valuation was determined.
The net asset value (“NAV”) of each Fund shall be determined as of the close of trading (generally, 4:00 PM Eastern Time) on each day the New York Stock Exchange (“NYSE”) is open for trading. Stocks traded on an exchange are generally valued at the official closing price of the exchange where the security is principally traded. If there is no official closing price for the security, the security may be valued at the last quoted sale price on the exchange where the security is principally traded or final bid price in the absence of a sale. Stocks not listed on a national or foreign stock exchange may be valued at the closing bid price on the over the counter (“OTC”) market. Investments in mutual funds are valued at the NAV per share determined as of the close of the NYSE on each valuation date. Short-term securities maturing within sixty (60) days are valued at amortized cost, unless it is determined that such practice does not approximate market value. Debt securities are generally valued by independent pricing services approved by the Board. If pricing services are unable to provide valuations, debt securities are valued at the most recent bid quotation or evaluated price, as applicable, obtained from each Fund’s Sub-Adviser, a broker/dealer or a widely used quotation system. Futures contracts traded on an exchange are valued at the settlement price. If the settlement price is not available, exchange traded futures are valued at the last sales price as of the close of business on the local exchange. Options traded on an exchange are valued at the last traded price as of the close of business on the local exchange. If the last trade is determined to not be representative of fair value, exchange traded options are valued at the last bid. Forward foreign currency contracts are generally valued at the foreign currency exchange rate as of the close of the NYSE. Centrally cleared swap agreements, listed on a multilateral or trade facility platform, such as a registered exchange, are valued by the respective exchange. The exchange determines a daily settlement price via pricing models which use as appropriate, its members’ actionable levels across complete term structures along with external third party prices for centrally cleared credit default swaps and underlying rates including overnight index swap rates and forward interest rates for centrally cleared interest rate swaps. OTC derivatives, including options and swap agreements, are generally valued by approved pricing services. If the pricing services are unable to provide valuations, OTC derivatives are valued at the most recent bid quotation or evaluated price, as applicable, obtained from a broker/dealer or by pricing models using observable inputs. Pricing services utilized to value debt and derivative securities may use various pricing techniques which take into account appropriate factors such as: yield; credit quality; coupon rate; maturity; type of issue; trading characteristics; call features; credit ratings; broker quotes; and other relevant data.
Market quotations may not be readily available for certain investments or it may be determined that a quotation of an investment does not represent market value. In such instances, the investment is valued as determined in good faith using procedures approved by the Board. Situations that may require an investment to be fair valued may include instances where a security is thinly traded, halted or restricted as to resale. In addition, investments may be fair valued based on the occurrence of a significant event. Significant events may be specific to a particular issuer, such as mergers, restructurings or defaults. Alternatively, significant events may affect an entire market, such as natural disasters, government actions and significant changes in the value of U.S. securities markets. Securities are fair valued based on observable and unobservable inputs, including the
Curian Series Trust
Notes to Financial Statements
October 31, 2013
Pricing Committee’s own assumptions in determining fair value of an investment. Under the procedures approved by the Board, the Pricing Committee may rely on pricing services or other sources, including the Funds’ Adviser and Sub-Advisers, to assist in determining the fair value of an investment. Factors considered to determine fair value may include the correlation with price movement of similar securities in the same or other markets; the type, cost and investment characteristics of the security; the business and financial condition of the issuer; and trading or other market data. The Sub-Administrator has retained an independent statistical fair value pricing service to assist in the fair valuation process for securities traded in foreign markets in order to adjust for possible changes in value that may occur between the close of the foreign exchange and the time at which the NAVs are determined.
If an investment is valued at a fair value for purposes of calculating a Fund’s NAV, the value may be different from the last quoted price for the investment depending on the source and method used to determine the value. Although there can be no assurance, in general, the fair value of the investment is the amount the owner of such investment might reasonably expect to receive in an orderly transaction between market participants upon its current sale.
Distributions to Shareholders - The amount and timing of distributions are determined in accordance with federal income tax regulations, which may differ from GAAP. Dividends from net investment income are declared and distributed monthly for Curian/PIMCO Income Fund and Curian/PIMCO Total Return Fund and declared and distributed at least annually, if any, for Curian/WMC International Equity Fund. Distributions from net realized capital gains, if any, will be distributed at least annually, to the extent they exceed available capital loss carry forwards.
Expenses - Expenses are recorded on an accrual basis. Expenses of the Trust that are directly attributable to a specific Fund are charged to that Fund. Other Trust level expenses are allocated to the Funds based on the average daily net assets of each Fund.
Security Transactions and Investment Income - Security transactions are recorded on the trade date for financial reporting purposes. Dividend income, net of applicable withholding taxes, is recorded on the ex-dividend date. Corporate actions involving foreign securities, including dividends, are recorded when the information becomes available. Income received in lieu of dividends for securities loaned are included in dividends in the Statements of Operations. Interest income, including level-yield amortization of discounts and premiums, is accrued daily. A Fund may place a debt obligation on non-accrual status and reduce related interest income by ceasing current accruals and writing off interest receivables when the collection of all or a portion of interest has become doubtful. A debt obligation is removed from non-accrual status when the issuer resumes interest payments or when collectability of interest is reasonably assured. Realized gains and losses are determined on the specific identification basis.
Foreign Taxes - The Funds may be subject to foreign taxes on income, gains on investments or foreign currency purchases and repatriation, a portion of which may be recoverable. The Funds will accrue such taxes and recoveries as applicable, based upon their current interpretation of tax rules and regulations that exist in the markets in which they invest.
Foreign Currency Translations - The accounting records of each Fund are maintained in U.S. dollars. Each business day, the market values of foreign securities, currency holdings and other assets and liabilities denominated in a foreign currency are translated into U.S. dollars based on current exchange rates. Purchases and sales of investment securities, income receipts and expense payments are translated into U.S. dollars based on the respective exchange rates prevailing on the dates of such transactions. The Funds do not isolate that portion of the results of operations resulting from changes in foreign exchange rates on investments from the fluctuations arising from changes in market prices of foreign securities. Such fluctuations are included in net realized and unrealized gain or loss on investments.
Net realized gains and losses on foreign currency related items are considered ordinary income for tax purposes and arise from sales of foreign currencies; currency gains or losses realized between the trade and settlement dates on securities transactions; the difference between the amounts of dividends, interest and foreign withholding taxes recorded and the U.S. dollar amounts actually received or paid; and the realized gains or losses resulting from portfolio and transaction hedges. Net unrealized gain or loss on foreign currency related items include gains and losses from changes in the value of assets and liabilities, other than investments in securities, resulting from changes in currency exchange rates.
Guarantees and Indemnifications - In the normal course of business, the Trust may enter into contracts that contain a variety of representations which provide general indemnifications for certain liabilities. Each Fund’s maximum exposure under these arrangements is unknown. However, since their commencement of operations, the Funds have not had claims or losses pursuant to these contracts and expect the risk of loss to be remote.
Under the Trust’s organizational documents, its officers and Trustees are indemnified against certain liabilities arising out of the performance of their duties to the Funds. In addition, certain of the Trust’s contracts with service providers contain general indemnification clauses. The Funds’ maximum exposure under these arrangements is unknown since the amount of any future claims that may be made against the Funds cannot be determined and the Funds have no historical basis for predicting the likelihood of any such claims.
Use of Estimates - The preparation of financial statements in conformity with GAAP requires management to make estimates and assumptions that affect the reported amounts of assets and liabilities and disclosure of contingent assets and liabilities at the date of the financial statements and the reported amounts of increases and decreases in net assets from operations during the reporting period. Actual results could differ from those estimates.
Curian Series Trust
Notes to Financial Statements
October 31, 2013
Recent Accounting Pronouncements - In December 2011, Financial Accounting Standards Board (“FASB”) released Accounting Standards Update (“ASU”) 2011-11 “Disclosures about Offsetting Assets and Liabilities”. ASU 2011-11 requires an entity to disclose information about offsetting and related arrangements to enable users of its financial statements to understand the effect of those arrangements on its financial position. ASU 2011-11 will enhance disclosures by requiring improved information about financial instruments and derivative instruments that meet the criteria for offsetting amounts in the balance sheet or are subject to a master netting arrangement. The information will enable users of an entity’s financial statements to evaluate the effect or potential effect of netting arrangements on an entity’s financial positions, including the effect or potential effect of rights of setoff associated with certain financial instruments and derivative instruments. In January 2013, FASB released ASU 2013-01 “Clarifying the Scope of Disclosures about Offsetting Assets and Liabilities”. ASU 2011-11 and ASU 2013-01 are effective for the annual periods beginning on or after January 1, 2013 and the interim periods within those annual periods. Management is currently evaluating the impact these ASU’s will have on the Funds’ financial statements.
NOTE 3. FASB ACCOUNTING STANDARDS CODIFICATION (“ASC”) TOPIC 820, “FAIR VALUE MEASUREMENTS AND DISCLOSURE”
This standard establishes a single authoritative definition of fair value, sets out a framework for measuring fair value and requires additional disclosures about fair value measurements. Various inputs are used in determining the value of a Fund’s investments under FASB ASC Topic 820 guidance. The inputs are summarized into three broad categories.
Level 1 includes valuations based on quoted prices of identical securities in active markets, including valuations for securities listed on a national or foreign stock exchange or investments in mutual funds, which are valued at their daily reported NAV.
Level 2 includes valuations determined from significant direct or indirect observable inputs. Direct observable inputs include broker quotes, closing prices of similar securities in active markets, closing prices for identical or similar securities in non-active markets or corporate action or reorganization entitlement values. Indirect significant observable inputs include factors such as interest rates, yield curves, prepayment speeds or credit ratings. Level 2 includes valuations for fixed income securities, OTC derivatives, centrally cleared swap agreements, broker quotes in active markets, securities subject to corporate actions, securities valued at amortized cost, international equity securities priced by an independent statistical fair value pricing service, swap agreements valued by pricing services, or ADRs and GDRs for which quoted prices in active markets are not available.
Level 3 includes valuations determined from significant unobservable inputs, including management’s own assumptions in determining the fair value of the investment. Inputs used to determine the fair value of Level 3 securities include security specific inputs such as: credit quality, credit rating spreads, issuer news, trading characteristics, call features or maturity; or industry specific inputs such as: trading activity of similar markets or securities, changes in the security’s underlying index or changes in comparable securities’ models. Level 3 valuations include securities that are priced based on single source broker quotes, where prices may be unavailable due to halted trading, restricted to resale due to market events, newly issued or investments for which reliable quotes are otherwise not available.
To assess the continuing appropriateness of security valuation, the Sub-Administrator regularly compares prior day prices with current day prices, transaction prices and alternative vendor prices. When the comparison results exceed pre-defined thresholds, the Sub-Administrator challenges the prices exceeding tolerance levels with the pricing service or broker. To verify Level 3 unobservable inputs, the Sub-Administrator uses a variety of techniques as appropriate to substantiate these valuation approaches including a regular review of key inputs and assumptions, transaction back-testing or disposition analysis and review of related market activity.
The inputs or methodology used for valuing securities are not necessarily an indication of the risk associated with investing in those securities.
The following table summarizes each Fund’s investments in securities and other financial instruments as of October 31, 2013 by valuation level.
| | Assets - Securities | |
| | Level 1 | | Level 2 | | Level 3 | | Total | |
Curian/PIMCO Income Fund | | | | | | | | | |
Non-U.S. Government Agency ABS | | $ | — | | $ | 42,012,693 | | $ | — | | $ | 42,012,693 | |
Corporate Bonds and Notes | | — | | 431,354,823 | | 962,919 | | 432,317,742 | |
Government and Agency Obligations | | — | | 72,869,374 | | — | | 72,869,374 | |
Common Stocks | | 3,715 | | — | | — | | 3,715 | |
Preferred Stocks | | — | | 1,981,250 | | — | | 1,981,250 | |
Purchased Options | | — | | 628,971 | | — | | 628,971 | |
Short Term Investments | | 10,000,000 | | 48,875,578 | | — | | 58,875,578 | |
Fund Total | | $ | 10,003,715 | | $ | 597,722,689 | | $ | 962,919 | | $ | 608,689,323 | |
Curian/PIMCO Total Return Fund | | | | | | | | | |
Non-U.S. Government Agency ABS | | $ | — | | $ | 93,448,661 | | $ | — | | $ | 93,448,661 | |
Corporate Bonds and Notes | | — | | 160,462,165 | | — | | 160,462,165 | |
Government and Agency Obligations | | — | | 635,755,154 | | — | | 635,755,154 | |
Preferred Stocks | | 3,644,800 | | — | | — | | 3,644,800 | |
Short Term Investments | | — | | 298,803,537 | | — | | 298,803,537 | |
Fund Total | | $ | 3,644,800 | | $ | 1,188,469,517 | | $ | — | | $ | 1,192,114,317 | |
Curian Series Trust
Notes to Financial Statements
October 31, 2013
| | Assets - Securities | |
| | Level 1 | | Level 2 | | Level 3 | | Total | |
Curian/WMC International Equity Fund | | | | | | | | | |
Common Stocks | | $ | 39,432,969 | | $ | 301,579,185 | | $ | — | | $ | 341,012,154 | |
Preferred Stocks | | — | | 5,077,007 | | — | | 5,077,007 | |
Investment Companies | | 4,963,692 | | — | | — | | 4,963,692 | |
Short Term Investments | | 4,000,000 | | 6,580,313 | | — | | 10,580,313 | |
Fund Total | | $ | 48,396,661 | | $ | 313,236,505 | | $ | — | | $ | 361,633,166 | |
| | Liabilities - Securities | |
| | Level 1 | | Level 2 | | Level 3 | | Total | |
Curian/PIMCO Income Fund | | | | | | | | | |
Government and Agency Obligations | | $ | — | | $ | (5,266,406 | ) | $ | — | | $ | (5,266,406 | ) |
Fund Total | | $ | — | | $ | (5,266,406 | ) | $ | — | | $ | (5,266,406 | ) |
Curian/PIMCO Total Return Fund | | | | | | | | | |
Government and Agency Obligations | | $ | — | | $ | (1,070,469 | ) | $ | — | | $ | (1,070,469 | ) |
Fund Total | | $ | — | | $ | (1,070,469 | ) | $ | — | | $ | (1,070,469 | ) |
| | Assets - Investments in Other Financial Instruments(1) | |
| | Level 1 | | Level 2 | | Level 3 | | Total | |
Curian/PIMCO Income Fund | | | | | | | | | |
Open Futures Contracts | | $ | 1,148,585 | | $ | — | | $ | — | | $ | 1,148,585 | |
Open Forward Foreign Currency Contracts | | — | | 483,452 | | — | | 483,452 | |
OTC Interest Rate Swap Agreements | | — | | 181,594 | | — | | 181,594 | |
Centrally Cleared Interest Rate Swap Agreements | | — | | 635 | | — | | 635 | |
OTC Credit Default Swap Agreements | | — | | 931,849 | | — | | 931,849 | |
Centrally Cleared Credit Default Swap Agreements | | — | | 186,886 | | — | | 186,886 | |
Fund Total | | $ | 1,148,585 | | $ | 1,784,416 | | $ | — | | $ | 2,933,001 | |
Curian/PIMCO Total Return Fund | | | | | | | | | |
Open Futures Contracts | | $ | 3,605,379 | | $ | — | | $ | — | | $ | 3,605,379 | |
Open Forward Foreign Currency Contracts | | — | | 1,087,644 | | — | | 1,087,644 | |
OTC Interest Rate Swap Agreements | | — | | 182,346 | | — | | 182,346 | |
Centrally Cleared Interest Rate Swap Agreements | | — | | 4,107,452 | | — | | 4,107,452 | |
OTC Credit Default Swap Agreements | | — | | 315,764 | | — | | 315,764 | |
Centrally Cleared Credit Default Swap Agreements | | — | | 176,427 | | — | | 176,427 | |
Fund Total | | $ | 3,605,379 | | $ | 5,869,633 | | $ | — | | $ | 9,475,012 | |
| | Liabilities - Investments in Other Financial Instruments(1) | |
| | Level 1 | | Level 2 | | Level 3 | | Total | |
Curian/PIMCO Income Fund | | | | | | | | | |
Written Options | | $ | — | | $ | (1,070,264 | ) | $ | — | | $ | (1,070,264 | ) |
Open Forward Foreign Currency Contracts | | — | | (699,336 | ) | — | | (699,336 | ) |
OTC Interest Rate Swap Agreements | | — | | (2,559,394 | ) | — | | (2,559,394 | ) |
Centrally Cleared Interest Rate Swap Agreements | | — | | (603,718 | ) | — | | (603,718 | ) |
OTC Credit Default Swap Agreements | | — | | (5,710 | ) | — | | (5,710 | ) |
Centrally Cleared Credit Default Swap Agreements | | — | | (16,390 | ) | — | | (16,390 | ) |
Fund Total | | $ | — | | $ | (4,954,812 | ) | $ | — | | $ | (4,954,812 | ) |
Curian/PIMCO Total Return Fund | | | | | | | | | |
Written Options | | $ | (33,837 | ) | $ | (440,969 | ) | $ | — | | $ | (474,806 | ) |
Open Futures Contracts | | (75,235 | ) | — | | — | | (75,235 | ) |
Open Forward Foreign Currency Contracts | | — | | (3,409,669 | ) | — | | (3,409,669 | ) |
OTC Interest Rate Swap Agreements | | — | | (86,755 | ) | — | | (86,755 | ) |
Centrally Cleared Interest Rate Swap Agreements | | — | | (1,644,771 | ) | — | | (1,644,771 | ) |
OTC Credit Default Swap Agreements | | — | | (970 | ) | — | | (970 | ) |
Fund Total | | $ | (109,072 | ) | $ | (5,583,134 | ) | $ | — | | $ | (5,692,206 | ) |
(1)Investments in other financial instruments are derivative instruments and include forward foreign currency contracts, futures contracts, written options and swap agreements. All derivatives, except for written options, are reflected at the unrealized appreciation/(depreciation) on the instrument. Written options are reflected at value.
The Funds recognize transfers between levels as of the beginning of the period. There were no significant transfers into or out of Level 1, 2 or 3 for the period. There were no significant Level 3 valuations for which significant unobservable valuation inputs were developed at October 31, 2013.
Significant changes in unobservable valuation inputs to a different amount might result in a significantly higher or lower fair value measurement than the one used in a security’s valuation.
NOTE 4. SECURITIES AND OTHER INVESTMENTS
Securities Lending and Securities Lending Collateral - A Fund may lend securities to certain brokers, dealers or other financial institutions in order to earn additional income. The borrowers and the Funds’ securities lending agent exchange negotiated lender fees and the Funds receive a fee equal to a percentage of the net negotiated lender fees and the net income generated by the securities lending collateral held during each
Curian Series Trust
Notes to Financial Statements
October 31, 2013
lending transaction. The securities lending agent is authorized to loan securities on behalf of the Funds to approved borrowers and is required to maintain collateral at least equal to the value of the securities loaned based on the previous day’s value of the securities loaned, marked-to-market daily. Any shortfalls are adjusted the next business day. In the event of bankruptcy or other default of the borrower, a Fund could experience delays in liquidating the loan collateral or recovering the loaned securities and incur expenses related to enforcing its rights. In addition, there could be a decline in the value of the collateral or in the value of the securities loaned while a Fund seeks to enforce its rights thereto and the Fund could experience subnormal levels of income or lack of access to income during that period. The Funds also bear the risk of any deficiency in the amount of collateral available for return to a borrower due to a loss in an approved investment. Each Fund is responsible for returning the full amount of collateral received for a particular loan when the borrower returns the applicable security. JPMorgan Chase Bank, N.A. (“JPM Chase” or “Custodian”) serves as custodian and securities lending agent to the Trust. The Funds invest cash collateral in money market funds and overnight repurchase agreements, collateralized fully by U.S. Treasuries, Government National Mortgage Association (“GNMA”) mortgage backed securities or U.S. government sponsored securities.
U.S. Government Agencies or Government Sponsored Enterprises - Certain Funds may invest in U.S. government agencies or government sponsored enterprises. U.S. Government securities are obligations of and, in certain cases, guaranteed by, the U.S. government, its agencies or instrumentalities. Some U.S. Government securities, such as Treasury bills, notes and bonds, and securities guaranteed by GNMA, are supported by the full faith and credit of the U.S. government; others, such as those of the Federal Home Loan Bank, are supported by the right of the issuer to borrow from the U.S. Department of the Treasury (“U.S. Treasury”); others, such as those of the Federal National Mortgage Association (“FNMA” or “Fannie Mae”), are supported by the discretionary authority of the U.S. government to purchase the agency’s obligations; and still others, such as those of the Student Loan Marketing Association, are supported only by the credit of the instrumentality. U.S. Government securities may include zero coupon securities, which do not distribute interest on a current basis and tend to be subject to greater risk than interest paying securities of similar maturities.
Government-related guarantors (i.e., guarantors that are not backed by the full faith and credit of the U.S. government) include FNMA and the Federal Home Loan Mortgage Corporation (“FHLMC” or “Freddie Mac”). FNMA purchases conventional (i.e., not insured or guaranteed by any government agency) residential mortgages from a list of approved seller/servicers which include state and federally chartered savings and loan associations, mutual savings banks, commercial banks and credit unions and mortgage bankers. Pass-through securities issued by FNMA are guaranteed as to timely payment of principal and interest by FNMA, but are not backed by the full faith and credit of the U.S. government. FHLMC issues Participation Certificates (“PCs”), which are pass-through securities, each representing an undivided interest in a pool of residential mortgages. FHLMC guarantees the timely payment of interest and ultimate collection of principal, but PCs are not backed by the full faith and credit of the U.S. government.
FNMA and FHMLC were placed into conservatorship by the Federal Housing Finance Agency (“FHFA”). As the conservator, FHFA succeeded to all rights, titles, powers and privileges of FNMA and FHLMC and of any stockholder, officer or director of FNMA and FHLMC with respect to FNMA and FHLMC and each enterprise’s assets. In connection with the conservatorship, the U.S. Treasury entered into a Senior Preferred Stock Purchase Agreement with FNMA and FHLMC. This agreement contains various covenants that severely limit each enterprise’s operations. In exchange for entering into these agreements, the U.S. Treasury received senior preferred stock in each enterprise and warrants to purchase each enterprise’s common stock. The U.S. Treasury created a new secured lending facility, which is available to FNMA and FHLMC as a liquidity backstop and created a temporary program to purchase mortgage-backed securities issued by FNMA and FHLMC. FNMA and FHLMC are continuing to operate as going concerns while in conservatorship and each remains liable for all of its obligations, including its guaranty obligations, associated with its mortgage-backed securities.
Unregistered Securities - A Fund may own certain investment securities, which are unregistered and thus restricted to resale. These securities may also be referred to as “private placements”. Unregistered securities may be “illiquid” because there is no readily available market for sale of the securities. Where future dispositions of the securities require registration under the 1933 Act, the Funds have the right to include those securities in such registration generally without cost to the Funds. The Funds have no right to require registration of unregistered securities.
Repurchase Agreements - Certain Funds may invest in repurchase agreements. In a repurchase agreement, a Fund takes possession of an underlying debt obligation (collateral) subject to an obligation of the seller to repurchase, and the Fund to resell, the obligation at an agreed upon price and date. Earnings on collateral and compensation to the seller are based on agreed upon rates between the seller and the Fund. Interest earned on repurchase agreements is recorded as interest income to the Fund. The underlying securities used as collateral for repurchase agreements may be held in safekeeping by the Fund’s Custodian or designated sub custodians under triparty repurchase agreements or delivered to the counterparty. When a repurchase agreement is entered into, the Fund typically receives securities with a value that approximates or exceeds the repurchase price, including any accrued interest earned on the repurchase agreement. The value of such securities will be marked to market daily, and cash or additional securities will be exchanged between the parties with a frequency and in amounts prescribed in the repurchase agreement.
Securities purchased under repurchase agreements are reflected as an asset on the Statements of Assets and Liabilities. The value of repurchase agreements and collateral pledged or received by a counterparty are disclosed in the Schedules of Investments. The Fund’s net exposure to the counterparty is determined by the amount of any excess or shortfall in collateral compared to the value of the repurchase agreement. In the event of a default by the counterparty, realization of the collateral proceeds could be delayed, during which time the value of such collateral may decline.
Curian Series Trust
Notes to Financial Statements
October 31, 2013
Reverse Repurchase Agreements - Certain Funds may enter into reverse repurchase agreements. In a reverse repurchase agreement, a Fund delivers to a counterparty a security in exchange for cash with a simultaneous agreement to repurchase the same or substantially the same security at an agreed upon price and date. The Fund receives principal and interest payments, if any, made on the security delivered to the counterparty during the term of the agreement. In periods of increased demand of the security, the Fund may receive a fee for use of the security by the counterparty, which may result in interest income to the Fund. Cash received in exchange for securities delivered plus accrued interest payments to be made by the Fund are reflected as a liability on the Statements of Assets and Liabilities. Interest payments made to the counterparty are recorded as a component of interest expense on the Statements of Operations. A reverse repurchase agreement involves the risk that the value of the security delivered by the Fund may decline below the repurchase price of the security. A Fund will segregate assets determined to be liquid at the Custodian or otherwise cover its obligations under reverse repurchase agreements.
The average daily balance and the weighted average interest rate for reverse repurchase agreements, for the year ended October 31, 2013, were as follows: Curian/PIMCO Income Fund, $10,553,278 and 0.08% for 365 days outstanding; and Curian/PIMCO Total Return Fund $5,290,388 and 0.10% for 114 days outstanding, respectively. At October 31, 2013, reverse repurchase agreements outstanding were as follows:
| | Counter-
party | | Payable for Reverse
Repurchase Agreement
Including Interest
Payable/Receivable | | Collateral Amount | | Interest Rate
(Income)/Expense | | Date of Agreement | | Maturity Date | |
Curian/PIMCO Income Fund | | BCL | | $ | 1,183,355 | | $ | 1,474,910 | | (4.50 | )% | 07/08/13 | | 07/08/15 | |
| | JPM | | 4,833,677 | | 4,914,842 | | 0.18 | | 10/10/13 | | 11/08/13 | |
| | RBS | | 187,011 | | 186,625 | | 0.10 | | 10/21/13 | | 11/12/13 | |
| | BNS | | 10,502,644 | | 10,375,778 | | 0.09 | | 10/22/13 | | 11/07/13 | |
| | GSC | | 6,166,582 | | 6,329,059 | | 0.17 | | 10/24/13 | | 11/13/13 | |
| | DUB | | 2,221,484 | | 2,191,656 | | 0.12 | | 10/27/13 | | 11/13/13 | |
| | | | | | | | | | | | | | | |
Forward Sales Commitments - A Fund may purchase or sell forward sales commitments. A forward sales commitment involves a Fund entering into a contract to purchase or sell securities for a fixed price at a future date beyond the customary settlement period. The purchase of a forward sales commitment involves the risk of loss if the value of the security to be purchased declines before the settlement date while the sale of a forward sales commitment involves the risk that the value of the securities to be sold may increase before the settlement date. A Fund may dispose of or renegotiate forward sales commitments after they are entered into, and may sell these securities before they are delivered, which may result in capital gain or loss.
Delayed-Delivery Securities - A Fund may purchase or sell securities on a delayed delivery basis, including “To Be Announced” (“TBA”) or “To Be Acquired” securities. These transactions involve a commitment by a Fund to purchase or sell securities for a predetermined price or yield, with payment and delivery taking place beyond the customary settlement period. In TBA transactions, a Fund commits to purchasing or selling securities for which all specific information is not yet known at the time of the trade, particularly the face amount and maturity date of the underlying securities. When delayed-delivery purchases are outstanding, the Fund is required to have sufficient cash and/or liquid securities to cover its commitments on these transactions. When purchasing a security on a delayed-delivery basis, the Fund assumes the rights of ownership of the security, including the risk of price and yield fluctuations, and considers such fluctuations when determining its NAV. A Fund may dispose of or renegotiate a delayed-delivery transaction after it is entered into, and may sell delayed-delivery securities before they are delivered, which may result in a capital gain or loss. When a Fund has sold a security on a delayed delivery basis, the Fund does not participate in future gains or losses with respect to the security. Securities purchased on a TBA basis are not settled until they are delivered to the Fund. In connection with TBA transactions, Funds may maintain a short position related to certain securities. In connection with these transactions, the Fund owns an equal amount of the securities or holds securities convertible (or exchangeable) into an equal amount of the securities, of the same issuer, as the position held short.
Mortgage-Backed Dollar and Treasury Roll Transactions - Certain Funds may sell mortgage-backed or treasury securities and simultaneously contract to repurchase securities at a future date at an agreed upon price. A Fund may only enter into covered rolls. A “covered roll” is a type of dollar roll for which a Fund maintains offsetting positions in cash, U.S. Government securities or other liquid assets which mature on or before the forward repurchase settlement date of the dollar roll transaction. During the period between the sale and repurchase, a Fund forgoes interest and principal paid on the mortgage-backed securities. A Fund is compensated by the interest earned on the cash proceeds of the initial sale and from negotiated fees paid by brokers offered as an inducement to the Fund to “roll over” its purchase commitments. A Fund may dispose of “covered roll” securities after they are entered into and close these positions before their maturity, which may result in a realized gain or loss.
In a mortgage-backed or treasury securities roll transaction, if the repurchased security is determined to be similar, but not substantially the same, the transaction is accounted for as a purchase and sale. Any gains, losses and any income or fees earned are recorded to realized gain or loss. If the repurchased security is determined to be substantially the same, the transaction is accounted for as a secured borrowing, rather than as a purchase and sales transaction. Any income or fees earned are recorded to investment income and financing costs associated with the transaction are recorded to interest expense.
Curian Series Trust
Notes to Financial Statements
October 31, 2013
Dollar roll transactions involve the risk that the market value of the securities sold by a Fund may decline below the repurchase price of those securities which the Fund is obligated to purchase or that the return earned by the Fund with the proceeds of a dollar roll may not exceed transaction costs.
NOTE 5. MASTER NETTING AGREEMENTS, CUSTOMER ACCOUNT AGREEMENTS AND COLLATERAL
Under various agreements, certain investment transactions require collateral to be exchanged by a Fund and a counterparty or segregated at the custodian. U.S. Treasury Bills and U.S. dollars are generally the preferred forms of collateral, although other forms of high quality or sovereign securities may be used. Securities held by a Fund that are used as collateral are identified as such within the Schedules of Investments. Collateral for OTC financial derivative transactions paid to or received from brokers and counterparties is included in receivable from/payable for deposits with/from brokers and counterparties in the Statements of Assets and Liabilities.
Master Netting Agreements (“Master Agreements”) - Certain Funds are subject to various Master Agreements, which govern the terms of certain transactions and mitigate the counterparty risk associated with relevant transactions by specifying credit protection mechanisms and providing standardization that improves legal certainty. Since different types of financial transactions have different mechanics and are sometimes traded out of different legal entities of a particular counterparty organization, each type of transaction may be covered by a different Master Agreement, resulting in the need for multiple agreements with a single counterparty. A Fund may net exposure and collateralize multiple transaction types governed by the same Master Agreement with the same counterparty and may close out and net its total exposure to a counterparty in the event of a default and/or termination event with respect to all the transactions governed under a single agreement with a counterparty. Each Master Agreement defines whether the Fund is contractually able to net settle daily payments. Additionally, certain circumstances, such as laws of a particular jurisdiction or settlement of amounts due in different currencies, may prohibit or restrict the right of offset as defined in the Master Agreements.
Master Agreements also help limit credit and counterparty risk by specifying collateral posting arrangements at pre-arranged exposure levels. Under the Master Agreements, collateral is routinely transferred if the total net exposure to certain transactions (net of existing collateral) governed under the relevant master agreement with a counterparty in a given account exceeds a specified threshold depending on the counterparty and the type of Master Agreement. A Fund’s overall exposure to counterparty risk can change substantially within a short period, as it is affected by each transaction subject to the relevant Master Agreement. To the extent amounts due to a Fund from its counterparties are not fully collateralized, contractually or otherwise, the Fund bears the risk of loss from counterparty non-performance. The Funds’ Sub-Advisers attempt to limit counterparty risk by only entering into Master Agreements with counterparties which are believed to have the financial resources to honor their obligations and by monitoring the financial stability of those counterparties. For swap agreements executed with a Derivatives Clearing Organization (“DCO”) in a multilateral or other trade facility platform (“centrally cleared swaps”), counterparty risk is reduced by shifting exposure from the counterparty to the DCO. Additionally, the DCO has broad powers to provide an orderly liquidation in the event of a default.
Master Repurchase Agreements and Global Master Repurchase Agreements (individually and collectively “Master Repo Agreements”) - Master Repo Agreements govern repurchase, reverse repurchase and treasury roll transactions between a Fund and select counterparties. The Master Repo Agreements maintain provisions for, among other things, initiation and confirmation, income payments and transfer, events of default, termination and maintenance of collateral. In the event of default, the total value exposure will be offset against collateral exchanged to date, which would result in a net receivable/(payable) that would be due from/to the counterparty.
Master Securities Forward Transaction Agreements (“Master Forward Agreements”) - Master Forward Agreements govern the considerations and factors surrounding the settlement of certain forward-settling transactions, such as delayed-delivery transactions, “To Be Announced” (“TBA”) securities and treasury roll transactions between a Fund and select counterparties. The Master Forward Agreements maintain provisions for, among other things, initiation and confirmation, payment and transfer, events of default, termination, and maintenance of collateral. Losses may arise due to changes in the value of the underlying securities prior to settlement date, if the counterparty does not perform under the contract’s terms, or if the issuer does not issue the securities due to political, economic or other factors. In the event of default, the unrealized gain or loss will be offset against collateral exchanged to date, which would result in a net receivable/(payable) that would be due from/to the counterparty. In the ordinary course of business, settlements of transactions, are not typically subject to net settlement, except for TBA pools.
International Swaps and Derivatives Association Inc. Master Agreements and Credit Support Annexes (“ISDA Master Agreements”) - ISDA Master Agreements govern OTC financial derivative transactions entered into by the Fund’s Sub-Adviser and select counterparties. The ISDA Master Agreements maintain provisions for general obligations, representations, agreements, events of default, termination and maintenance of collateral. Termination includes conditions that may entitle counterparties to elect to terminate early and cause settlement of all outstanding transactions under the applicable ISDA Master Agreement. Any election to early termination could be material to the financial statements. In the event of default, the total financial derivative value exposure will be offset against collateral exchanged to date, which would result in a net receivable/(payable) that would be due from/to the counterparty. The amount of collateral exchanged is based on provisions within the ISDA Master Agreements and is determined by the net exposure with the counterparty and is not identified for a specific OTC derivative instrument.
Customer Account Agreements - Customer Account Agreements and related addendums govern cleared derivative transactions such as futures, options on futures and centrally cleared derivatives. If a Fund transacts in centrally cleared derivatives, the Sub-Adviser is a party to agreements with (1) a Futures Commissions Merchant (“FCM”) in which the FCM acts as agent in the execution of the centrally cleared derivative with the DCO and (2) with an executing broker/swap dealer to agree to the terms of the swap and resolution process in the event the centrally cleared swap is not
Curian Series Trust
Notes to Financial Statements
October 31, 2013
accepted for clearing by the designated DCO. Cleared derivatives transactions require posting an amount of cash or cash equivalents equal to a certain percentage of the contract amount known as the “initial margin” as determined by each relevant clearing agency and is segregated at an FCM which is registered with the Commodity Futures Trading Commission (“CFTC”) or the applicable regulator. The Fund receives from or pays to the counterparty an amount of cash equal to the daily fluctuation in the value of the contracts. Such receipts or payments are known as the “variation margin”. Variation margin received may not be netted between futures and centrally cleared derivatives. In the event of default, counterparty risk is significantly reduced as creditors to the FCM do not have claim to a Fund’s assets in the segregated account. Additionally, portability of exposure in the event of default further reduces risk.
Pledged or Segregated Collateral - The following table summarizes cash and securities collateral pledged at October 31, 2013:
| | | | | | Forward | | | | | | | |
| | Futures
Contracts | | Foreign
Currency | | Swap Agreements | | Total
Pledged or | |
| | Pledged or
Segregated
Cash | | Pledged or
Segregated
Securities | | Contracts
Segregated
Securities | | Pledged or
Segregated
Cash | | Pledged or
Segregated
Securities | | Segregated
Cash and
Securities | |
Curian/PIMCO Income Fund | | $ | 515,000 | | $ | 297,877 | | $ | — | | $ | 181,000 | | $ | 4,458,801 | | $ | 5,452,678 | |
Curian/PIMCO Total Return Fund | | 841,000 | | 1,268,394 | | 290,994 | | 901,000 | | 7,648,688 | | 10,950,076 | |
| | | | | | | | | | | | | | | | | | | |
NOTE 6. FINANCIAL DERIVATIVE INSTRUMENTS
Options Transactions - An option is a contract that gives the purchaser of the option, in return for a premium paid, the right to buy a specified underlying instrument from the writer of the option (in the case of a call option), or to sell a specified underlying instrument to the writer of the option (in the case of a put option) at a designated price during the term of the option. When a Fund purchases an option, the premium paid by the Fund is recorded as an asset and is subsequently marked-to-market to reflect the current value of the option. Premiums paid for purchasing options which expire are treated as realized losses. Premiums paid for purchasing options which are exercised or closed are added to the cost basis of the underlying investment or offset against the proceeds of the underlying investment transaction to determine realized gain or loss. Purchasing call options tends to increase a Fund’s exposure to the underlying instrument. Purchasing put options tends to decrease a Fund’s exposure to the underlying instrument. The risks associated with purchasing options are limited to premiums paid and the failure of the counterparty to honor its obligation under the contract. When a Fund writes a call or put option, the premium received by the Fund is recorded as a liability and is subsequently marked to market to reflect the current value of the option. Premiums received from writing options which expire are treated as realized gains. Premiums received from writing options which are exercised or closed are added to the proceeds of the underlying investment transaction or reduce the cost basis of the underlying investment to determine the realized gain or loss. Writing call options tends to decrease a Fund’s exposure to the underlying instrument. Writing put options tends to increase a Fund’s exposure to the underlying instrument. The risk associated with writing an option that is exercised is that an unfavorable change in the price of the security underlying the option could result in a Fund buying the underlying security at a price higher than the current value or selling the underlying security at a price lower than the current market value. There is also the risk a Fund may not be able to enter into a closing transaction if the market is illiquid. Options written by a Fund do not give rise to counterparty credit risk, as they obligate the Fund, not the counterparty, to perform.
A Fund may also buy and sell (“write”) call and put options on futures and swaps agreements (“swaptions”). Options on futures held by the Funds are exchange traded. Swaptions are similar to options on securities except that instead of purchasing the right to buy or sell a security, the writer or purchaser of the swaption is granting or buying the right to enter into a previously agreed upon interest rate or credit default swap agreement at any time before the expiration of the option. Swaptions are illiquid investments.
Futures Contracts - A futures contract is a standardized contract obligating two parties to exchange a specified asset at an agreed upon price and date. Variation margin is recorded by the Fund until the contracts are terminated at which time realized gains and losses are recognized. Futures contracts involve to varying degrees, risk of loss in excess of the variation margin recorded by the Fund. The primary risks associated with the use of futures contracts are the imperfect correlation between the change in value of the securities held by a Fund or the change in the value of an underlying entity and the prices of the futures contracts and the possibility a Fund may not be able to enter into a closing transaction because of an illiquid market. With futures, counterparty risk to a Fund is reduced since futures contracts are exchange traded and the exchange’s clearinghouse, acting as counterparty to all exchange traded futures, guarantees the futures contracts against default.
Forward Foreign Currency Contracts - A forward foreign currency contract is an agreement between two parties to buy and sell a currency at a set price on a future date. The use of forward foreign currency contracts does not eliminate fluctuations in the underlying prices of a Fund’s investment securities, but it does establish a fixed rate of currency exchange that can be achieved in the future. The value of a forward foreign currency contract fluctuates with changes in foreign currency exchange rates. Forward foreign currency contracts are marked-to-market daily and the change in value is recorded by a Fund as an unrealized gain or loss and as a receivable or payable from forward foreign currency contracts. Upon settlement, or delivery or receipt of the currency, a realized gain or loss is recorded which is equal to the difference between the value of the contract at the time it was opened and the value at the time it was closed. Forward foreign currency contracts involve market risk in excess of the receivable or payable related to forward foreign currency contracts recorded by the Funds. Although contracts limit the risk of loss due to a decline in the value of the hedged currency, they also limit any potential gain that might result should the value of the currency increase. Additionally, a Fund could be exposed
Curian Series Trust
Notes to Financial Statements
October 31, 2013
to the risk of a previously hedged position becoming unhedged if the counterparty to a contract is unable to meet the terms of the contract or if the currency changes unfavorably to the value of the offsetting currency.
Swap Agreements - Swap agreements are bilaterally negotiated agreements between a Fund and a counterparty to exchange or swap investment cash flows, assets, foreign currencies or market-linked returns at specified, future intervals. Swap agreements are privately negotiated in the OTC market or may be executed and centrally cleared with a DCO. OTC swaps are typically illiquid investments.
Swap agreements are marked-to-market daily and change in value is recorded by a Fund as an unrealized gain or loss. For OTC swaps, premiums paid or received at the beginning of the measurement period are recorded as an asset or liability by the Fund and represent payments made or received upon entering into the OTC swap to compensate for differences between the stated terms of the OTC swap and prevailing market conditions relating to credit spreads, interest rates, currency exchange rates and other relevant factors as appropriate. These upfront payments are recorded as a realized gain or loss upon termination or maturity of the OTC swap. For centrally cleared swaps, daily changes in the valuation are recorded as a receivable or payable, as appropriate, and received from or paid to the DCO on a daily basis until the contracts are terminated at which time a realized gain or loss is recorded. The use of centrally cleared swaps may require a Fund to commit initial and variation margin that would otherwise not be required under an OTC swap. A liquidation payment received or made at the termination of the swap agreement is recorded as a realized gain or loss. Net periodic payments received or paid by a Fund are included as part of realized gain or loss.
Entering into swap agreements involves, to varying degrees, elements of interest, credit, market and documentation risk in excess of the unrealized gain or loss recorded by a Fund. Such risks include that there is no liquid market for OTC swaps, that the counterparty to the agreements may default on its obligation to perform or disagree as to the meaning of contractual terms in the agreement and that there may be unfavorable changes in interest rates or value of underlying securities. Centrally cleared swaps involve to varying degrees, risk of loss in excess of the variation margin recorded by the Fund.
Interest Rate Swap Agreements - Interest rate swap agreements involve the exchange by a Fund with another party of their respective commitments to pay or receive interest with respect to the notional amount of principal. Forms of interest rate swap agreements that the Funds have entered into include: fixed-for-floating rate swaps, under which a party agrees to pay a fixed rate in exchange for receiving a floating rate tied to a benchmark and floating-for-fixed rate swaps, under which a party agrees to pay a floating rate in exchange for receiving a fixed rate.
A Fund’s maximum risk of loss from counterparty credit risk for an interest rate swap agreement is the discounted net value of the cash flows to be received from the counterparty over the contract’s remaining life, to the extent this amount is positive.
Credit Default Swap Agreements - Credit default swap agreements involve one party making a stream of payments (referred to as the buyer of protection) to another party (the seller of protection) in exchange for the right to receive a specified return if a credit event occurs for the referenced entity, obligation or index. A credit event is defined under the terms of each swap agreement and may include, but is not limited to, underlying entity default, bankruptcy, restructuring, write-down, principal shortfall or interest shortfall. As a seller, a Fund adds leverage to its portfolio because, in addition to its total net assets, the Fund is subject to investment exposure on the notional amount of the credit default swap. If a Fund is a seller of protection and a credit event occurs, as defined under the terms of that particular credit default swap agreement, the Fund will either pay to the buyer of protection an amount equal to the notional amount of the credit default swap and take delivery of the referenced obligation, other deliverable obligations or underlying securities comprising the referenced index or pay a net settlement amount in the form of cash or securities equal to the notional amount of the credit default swap less the recovery value of the referenced obligation or underlying securities comprising the referenced index. If a Fund is a buyer of protection and a credit event occurs, as defined under the terms of that particular credit default swap agreement, the Fund will either receive from the seller of protection an amount equal to the notional amount of the credit default swap and deliver the referenced obligation, other deliverable obligations or underlying securities comprising the referenced index or receive a net settlement amount in the form of cash or securities equal to the notional amount of the credit default swap less the recovery value of the referenced obligation or underlying securities comprising the referenced index. Until a credit event occurs, recovery values are determined by market makers considering either industry standard recovery rates or entity specific factors and considerations. When a credit event occurs, the recovery value is determined by a facilitated auction, administered by ISDA, whereby a minimum number of allowable broker bids, together with a specified valuation method, are used to calculate the settlement value.
A Fund may use credit default swap agreements on corporate or sovereign issues to provide a measure of protection against defaults of an issuer (i.e., to reduce risk where a Fund owns or has exposure to the referenced obligation) or to take an active long or short position with respect to the likelihood of a particular issuer’s default. If a credit event occurs and cash settlement is not elected, a variety of other deliverable obligations may be delivered in lieu of the specific referenced obligation. The ability to deliver other obligations may result in a cheapest-to-deliver option (the buyer of protection’s right to choose the deliverable obligation with the lowest value following a credit event).
A Fund may use credit default swap agreements on credit indices to hedge a portfolio of credit default swap agreements or bonds, to protect investors owning bonds against default and to speculate on changes in credit quality. A credit index is a basket of credit instruments or exposures designed to represent a portion of the credit market. These indices consist of reference credits that are considered to be the liquid entities in the credit default swap market based on the index sector. Components of the indices may include, but are not limited to, investment grade securities, high yield securities, asset-backed securities and emerging market securities. These components can be determined based upon various credit
Curian Series Trust
Notes to Financial Statements
October 31, 2013
ratings within each sector. Credit indices are traded using credit default swaps with standardized terms including a fixed spread and standard maturity dates. An index credit default swap references all the issuers in the index, and if there is a credit event, the credit event is settled based on that issuer’s weight in the index. The composition of the indices changes periodically, usually every six months, and for most indices, each issuer has an equal weight in the index.
Either as a seller of protection or a buyer of protection of a credit default swap agreement, a Fund’s maximum risk of loss from counterparty risk is the fair value of the agreement. The maximum potential amount of future payments (undiscounted) that a Fund as a seller of protection could be required to make under a credit default swap agreement would be an amount equal to the notional amount of the agreement. Notional amounts of all credit default swap agreements outstanding as of October 31, 2013, for which the Fund is the seller of protection, are disclosed in the Schedules of Investments. These potential amounts would be partially offset by any recovery values of the respective referenced obligations, upfront payments received upon entering into the agreement or net amounts received from the settlement of buy protection credit default swap agreements entered into by the Fund for the same referenced entity or entities.
FASB ASC Topic 815, “Derivatives and Hedging” - This standard includes the requirement for enhanced qualitative disclosures about objectives and strategies for using derivative instruments and disclosures regarding credit related contingent features in derivative instruments; as well as quantitative disclosures in the semi-annual and annual financial statements about fair value, gains and losses and volume of activity for derivative instruments. Information about these instruments is disclosed in the context of each instrument’s primary underlying risk exposure which is categorized as credit, equity price, interest rate and foreign currency exchange rate risk.
The following includes: (1) Objectives and strategies for each Fund’s derivative investments during the year. (2) A summary table of the fair valuations of each Fund’s derivative instruments categorized by risk exposure, which references the location on the Statements of Assets and Liabilities and the realized and unrealized gain or loss on the Statements of Operations for each derivative instrument as of October 31, 2013. A table is not provided for Funds which held only one type of derivative during the year as the location on the Statements of Assets and Liabilities and the realized and unrealized gain loss on the Statements of Operations can be referenced directly on the Fund’s respective statements. (3) For Funds with significant derivative activity during the year, a table reflecting each Fund’s average monthly volume of derivative activities for the year ended October 31, 2013. The derivative instruments outstanding as of October 31, 2013, as disclosed in the Schedules of Investments and the amounts of realized and changes in unrealized gains and losses on derivative instruments during the year ended October 31, 2013, as disclosed in the Statements of Operations, also serve as indicators of the volume of derivative activity for the Funds.
Curian/PIMCO Income Fund Derivative Strategies - The Fund entered into option contracts to manage exposure to or hedge changes in interest rates, foreign currencies and inflation. The Fund entered into futures contracts to manage exposure to or hedge changes in interest rates, as a substitute for investment in physical securities and as an efficient means of adjusting overall exposure to certain markets as part of its investment strategy. The Fund entered into forward foreign currency contracts to minimize foreign currency exposure on investment securities denominated in foreign currencies. The Fund entered into interest rate swap agreements to manage duration, to manage interest rate and yield curve exposure and as a substitute for investment in physical securities. The Fund entered into credit default swap agreements to manage credit exposure and in combination with cash bonds exposure (1) to take advantage of spread variances between cash bonds and the credit default swap agreement or (2) to hedge the underlying exposure to the cash bonds.
Curian/PIMCO Income Fund - Derivative Instruments Categorized by Risk Exposure
| | Credit
Contracts | | Equity
Contracts | | Foreign Exchange
Contracts | | Interest Rate
Contracts | | Total | |
Fair values of derivative instruments on the Statement of Assets and Liabilities as of October 31, 2013: | | | | | | | | | | | |
Assets: | | | | | | | | | | | |
Investments - at value* | | $ | — | | $ | — | | $ | — | | $ | 628,971 | | $ | 628,971 | |
Variation margin on financial derivative instruments | | 8,387 | | — | | — | | 71,327 | | 79,714 | |
Forward foreign currency contracts | | — | | — | | 483,452 | | — | | 483,452 | |
Unrealized appreciation on OTC swap agreements | | 931,849 | | — | | — | | 181,594 | | 1,113,443 | |
OTC swap premiums paid | | 206,840 | | — | | — | | 6,555 | | 213,395 | |
| | $ | 1,147,076 | | $ | — | | $ | 483,452 | | $ | 888,447 | | $ | 2,518,975 | |
Liabilities: | | | | | | | | | | | |
Variation margin on financial derivative instruments | | $ | — | | $ | — | | $ | — | | $ | 68,951 | | $ | 68,951 | |
Options written, at value | | 13,826 | | — | | — | | 1,056,438 | | 1,070,264 | |
Forward foreign currency contracts | | — | | — | | 699,336 | | — | | 699,336 | |
Unrealized depreciation on OTC swap agreements | | 5,710 | | — | | — | | 2,559,394 | | 2,565,104 | |
OTC swap premiums received | | 874,007 | | — | | — | | 135,114 | | 1,009,121 | |
| | $ | 893,543 | | $ | — | | $ | 699,336 | | $ | 3,819,897 | | $ | 5,412,776 | |
The effect of derivative instruments on the Statement of Operations for the year ended October 31, 2013: | | | | | | | | | | | |
Net realized gain (loss) on: | | | | | | | | | | | |
Swap agreements | | $ | 7,945,952 | | $ | — | | $ | — | | $ | (1,733,894 | ) | $ | 6,212,058 | |
Foreign currency related items | | — | | — | | (366,366 | ) | — | | (366,366 | ) |
Futures contracts | | — | | — | | — | | (175,295 | ) | (175,295 | ) |
Written options contracts | | — | | — | | 35,720 | | 803,288 | | 839,008 | |
| | $ | 7,945,952 | | $ | — | | $ | 330,646 | | $ | (1,105,901 | ) | $ | 6,509,405 | |
Curian Series Trust
Notes to Financial Statements
October 31, 2013
Curian/PIMCO Income Fund - Derivative Instruments Categorized by Risk Exposure (continued)
| | Credit
Contracts | | Equity
Contracts | | Foreign Exchange
Contracts | | Interest Rate
Contracts | | Total | |
The effect of derivative instruments on the Statement of Operations for the year ended October 31, 2013 (continued): | | | | | | | | | | | |
Net change in unrealized appreciation (depreciation) on: | | | | | | | | | | | |
Investments* | | $ | — | | $ | — | | $ | — | | $ | 242,974 | | $ | 242,974 | |
OTC Swap agreements | | (2,000,971 | ) | — | | — | | (3,157,823 | ) | (5,158,794 | ) |
Foreign currency related items | | — | | — | | (342,896 | ) | — | | (342,896 | ) |
Futures contracts and centrally cleared swap agreements | | 72,697 | | — | | — | | 370,967 | | 443,664 | |
Written option contracts | | 82,726 | | — | | — | | (85,028 | ) | (2,302 | ) |
| | $ | (1,845,548 | ) | $ | — | | $ | (342,896 | ) | $ | (2,628,910 | ) | $ | (4,817,354 | ) |
Curian/PIMCO Income Fund - Average Derivative Volume
| | Cost of Options
Purchased and
Written | | Notional Value at
Purchase of
Futures Contracts | | Cost of Forward
Foreign Currency
Contracts | | Notional Amount
of Interest Rate
Swap Agreements | | Notional Amount
of Credit Default
Swap Agreements | |
Average monthly volume | | $ | 1,453,974 | | $ | 78,821,588 | | $ | 141,617,557 | | $ | 143,182,342 | | $ | 242,490,787 | |
| | | | | | | | | | | | | | | | |
Curian/PIMCO Total Return Fund - Derivative Strategies - The Fund entered into option contracts to manage exposure to or hedge changes in interest rates, foreign currencies and inflation. The Fund entered into futures contracts to manage exposure to or hedge changes in interest rates. The Fund entered into forward foreign currency contracts to minimize foreign currency exposure on investment securities denominated in foreign currencies. The Fund entered into interest rate swap agreements to manage duration, to manage interest rate and yield curve exposure and as a substitute for investment in physical securities. The Fund entered into credit default swap agreements to manage credit exposure.
Curian/PIMCO Total Return Fund - Derivative Instruments Categorized by Risk Exposure
| | Credit
Contracts | | Equity
Contracts | | Foreign Exchange
Contracts | | Interest Rate
Contracts | | Total | |
Fair values of derivative instruments on the Statement of Assets and Liabilities as of October 31, 2013: | | | | | | | | | | | |
Assets: | | | | | | | | | | | |
Variation margin on financial derivative instruments | | $ | 10,407 | | $ | — | | $ | — | | $ | 265,258 | | $ | 275,665 | |
Forward foreign currency contracts | | — | | — | | 1,087,644 | | — | | 1,087,644 | |
Unrealized appreciation on OTC swap agreements | | 315,763 | | — | | — | | 182,347 | | 498,110 | |
OTC swap premiums paid | | 239,776 | | — | | — | | 3,049 | | 242,825 | |
| | $ | 565,946 | | $ | — | | $ | 1,087,644 | | $ | 450,654 | | $ | 2,104,244 | |
Liabilities: | | | | | | | | | | | |
Variation margin on financial derivative instruments | | $ | — | | $ | — | | $ | — | | $ | 36,780 | | $ | 36,780 | |
Options written, at value | | 2,605 | | — | | — | | 472,201 | | 474,806 | |
Forward foreign currency contracts | | — | | — | | 3,409,669 | | — | | 3,409,669 | |
Unrealized depreciation on OTC swap agreements | | 970 | | — | | — | | 86,755 | | 87,725 | |
OTC swap premiums received | | 295,162 | | — | | — | | 43,430 | | 338,592 | |
| | $ | 298,737 | | $ | — | | $ | 3,409,669 | | $ | 639,166 | | $ | 4,347,572 | |
The effect of derivative instruments on the Statement of Operations for the year ended October 31, 2013: | | | | | | | | | | | |
Net realized gain (loss) on: | | | | | | | | | | | |
Swap agreements | | $ | 1,336,561 | | $ | — | | $ | — | | $ | (1,370,267 | ) | $ | (33,706 | ) |
Foreign currency related items | | — | | — | | 6,377,052 | | — | | 6,377,052 | |
Futures contracts | | — | | — | | — | | (485,755 | ) | (485,755 | ) |
Written options contracts | | — | | — | | 41,838 | | 1,604,437 | | 1,646,275 | |
| | $ | 1,336,561 | | $ | — | | $ | 6,418,890 | | $ | (251,585 | ) | $ | 7,503,866 | |
Net change in unrealized appreciation (depreciation) on: | | | | | | | | | | | |
OTC Swap agreements | | $ | (2,294,267 | ) | $ | — | | $ | — | | $ | 119,415 | | $ | (2,174,852 | ) |
Foreign currency related items | | — | | — | | (2,517,522 | ) | — | | (2,517,522 | ) |
Futures contracts and centrally cleared swap agreements | | 349,109 | | — | | — | | 6,286,393 | | 6,635,502 | |
Written option contracts | | 5,160 | | — | | — | | 348,718 | | 353,878 | |
| | $ | (1,939,998 | ) | $ | — | | $ | (2,517,522 | ) | $ | 6,754,526 | | $ | 2,297,006 | |
Curian/PIMCO Total Return Fund - Average Derivative Volume
| | Cost of Options
Purchased and
Written | | Notional Value at
Purchase of
Futures Contracts | | Cost of Forward
Foreign Currency
Contracts | | Notional Amount
of Interest Rate
Swap Agreements | | Notional Amount of
Credit Default Swap
Agreements | |
Average monthly volume | | $ | 739,103 | | $ | 400,921,701 | | $ | 190,429,307 | | $ | 167,496,545 | | $ | 82,174,031 | |
| | | | | | | | | | | | | | | | |
* Purchased options market value is reflected in investments, at value. Realized gain (loss) and change in unrealized appreciation (depreciation) on purchased options are reflected in realized gain (loss) on investments and change in unrealized appreciation (depreciation) on investments, respectively in the Statements of Operations.
Curian/WMC International Equity Fund Derivative Strategies - The Fund entered into forward foreign currency contracts to manage foreign currency risk.
Curian Series Trust
Notes to Financial Statements
October 31, 2013
NOTE 7. OTHER INVESTMENT RISKS
Foreign Securities Risk - Investing in securities of foreign companies and foreign governments generally involves special risks and considerations not typically associated with investing in U.S. companies and the U.S. government. These risks include the potential for revaluation of currencies, different accounting policies and future adverse political and economic developments. Moreover, securities of many foreign companies and foreign governments and their markets may be less liquid and their prices may be more volatile than those of securities of comparable U.S. companies and the U.S. government.
Currency Risk - Investing directly in foreign currencies or in securities that trade in, and receive revenues in, foreign currencies, or in financial derivatives that provide exposure to foreign currencies, involves the risk that those currencies will decline in value relative to the base currency of a Fund, or, in the case of hedging positions, that a Fund’s base currency will decline in value relative to the currency being hedged. Currency rates in foreign countries may fluctuate significantly over short periods of time for a number of reasons, including changes in interest rates, general economics of a country, actions (or inaction) of U.S. governments or banks, foreign governments, central banks or supranational entities such as the International Monetary Fund, the imposition of currency controls or other political developments in the U.S. or abroad.
Market, Credit and Counterparty Risk - In the normal course of business, the Funds trade financial instruments and enter into financial transactions where the risk of potential loss exists due to changes in the market (“market risk”) or failure of the other party to a transaction to perform (“credit risk”). Similar to credit risk, the Funds may be exposed to counterparty risk, or the risk that an institution or other entity with which the Funds have unsettled or open transactions will default. Financial assets, which potentially expose the Funds to credit risk, consist principally of investments and cash due from counterparties (“counterparty risk”). The extent of the Funds’ exposure to credit and counterparty risks in respect to these financial assets is incorporated within their carrying value as recorded in the Funds’ Statements of Assets and Liabilities. For certain derivative contracts, the potential loss could exceed the value of the financial assets recorded in the financial statements.
NOTE 8. INVESTMENT ADVISORY FEES AND TRANSACTIONS WITH AFFILIATES
Advisory, Sub-Advisory and Administration Fees - The Trust has an investment advisory agreement and an administration agreement with Curian. Pursuant to the investment advisory agreement, Curian receives an annual fee accrued daily and paid monthly, at an annual rate of 0.15% of the average daily net assets of Curian/PIMCO Income Fund, 0.15% of the average daily net assets of Curian/PIMCO Total Return Fund and 0.15% of the average daily net assets of Curian/WMC International Equity Fund. Pursuant to the administration agreement, Curian receives an annual fee accrued daily and paid monthly, at an annual rate of 0.60% of the average daily net assets of Curian/PIMCO Income Fund and Curian/PIMCO Total Return Fund and 0.85% of the average daily net assets of Curian/WMC International Equity Fund. Subject to the oversight of the Trust’s Board, Curian is responsible for managing the Funds’ business affairs and providing day-to-day administrative services to the Funds either directly or through others selected by it for the Funds. In return for the fees paid under the administration agreement, Curian provides or procures necessary administrative functions and services for the operation of the Funds. In addition, Curian, at its own expense, arranges for legal, audit, fund accounting, transfer agency, custody, printing and mailing, a portion of the Chief Compliance Officer costs, and all other services necessary for the operation of each Fund. Each Fund is responsible for trading expenses, including brokerage commissions, taxes, other non-operating expenses, errors and omission insurance, the fees and expenses of the independent Trustees and independent legal counsel to the independent Trustees, a portion of the costs associated with the Chief Compliance Officer, and certain nonrecurring or extraordinary expenses.
The Trust has an investment sub-advisory agreement with PIMCO for Curian/PIMCO Income Fund and Curian/PIMCO Total Return Fund and with WMC for Curian/WMC International Equity Fund. The Funds pay the following fees to the Sub-Advisers:
| | Assets | | Fees | |
Curian/PIMCO Income Fund | | All Assets | | 0.25 | % |
| | | | | |
Curian/PIMCO Total Return Fund | | Assets up to $3 billion(1) | | | |
| | All assets | | 0.25 | % |
| | When assets exceed $3 billion(1) | | | |
| | $0 to $1 billion | | 0.25 | % |
| | Amounts over $1 billion | | 0.225 | |
| | | | | |
Curian/WMC International Equity Fund | | $0 to $250 million | | 0.45 | % |
| | Amounts over $250 million | | 0.40 | |
(1) When aggregate net assets of Curian/PIMCO Total Return Fund and Curian/PIMCO Income Fund of the Curian Series Trust and JNL/PIMCO Real Return Fund and JNL/PIMCO Total Return Bond Fund of the JNL Series Trust equal or exceed $3 billion, the annual rates are applicable to all the amounts in the Curian/PIMCO Total Return Fund. The fee is based on the combined market value of the Curian/PIMCO Total Return Fund of Curian Series Trust and JNL/PIMCO Total Return Fund of JNL Series Trust, to derive an average fee to be applied to Curian/PIMCO Total Return Fund of the Curian Series Trust and JNL/PIMCO Total Return Bond Fund of the JNL Series Trust.
Fee Waiver and Expense Reimbursements - Curian agreed to waive its advisory fee and reduce the administration fee and/or reimburse other expenses to the extent necessary to reduce the annual expense ratios of the Funds, exclusive of brokerage costs, interest, taxes and dividend and extraordinary expenses, to 0.85% for Curian/PIMCO Income Fund, 0.80% for Curian/PIMCO Total Return Fund, and 1.32% for Curian/WMC International Equity Fund until February 28, 2014.
Curian Series Trust
Notes to Financial Statements
October 31, 2013
Curian is entitled to recoup previously waived/reimbursed fees and expenses for a period of up to three years following the fiscal year in which Curian waived its fee or reimbursed expenses. The amount of waived expenses for each Fund is recorded as expenses waived by Adviser in each Fund’s Statement of Operations. During the year ended October 31, 2013, Curian did not recover any previously reimbursed expenses. At October 31, 2013, the amount of potentially recoverable expenses was:
| | Year ended October 31, 2013 | | Period ended October 31, 2012 | |
| | Recoverable
Expense | | Expiration | | Recoverable
Expense | | Expiration | |
Curian/PIMCO Income Fund | | $ | 1,184,932 | | 10/31/16 | | $ | 784,871 | | 10/31/15 | |
Curian/PIMCO Total Return Fund | | 2,101,426 | | 10/31/16 | | 2,050,054 | | 10/31/15 | |
Curian/WMC International Equity Fund | | 422,535 | | 10/31/16 | | 370,606 | | 10/31/15 | |
| | | | | | | | | | | |
Other Service Providers - The Trust entered into a transfer agency agreement and shareholder services agreement with JNAM. Curian has entered into a sub-administration and fund accounting services agreement with JFS, and is responsible for the compensation of JFS for services provided pursuant to such agreement. Curian pays JNAM and JFS for such services through the fees earned pursuant to the administration agreement.
The Funds entered into an agreement with the Custodian in which the Custodian provides earnings credits for overnight cash balances held in the Funds’ custody accounts. The earnings credits reduce the Funds’ custody fees which are paid by Curian, which then reimburses the Funds for such earnings credits. The reimbursed earnings credits are included in other income in the Statements of Operations.
The Trust has a fund compliance services agreement with JFS. Pursuant to the fund compliance services agreement, JFS provides compliance oversight services to the Trust.
Distribution Agreement - The Trust entered into a distribution agreement with Curian Clearing LLC (“Distributor”), an affiliate of Curian. The Funds pay no expenses related to services provided under the distribution agreement. The Distributor does not have any distribution and servicing arrangements with third parties to sell shares of the Funds.
Directed Brokerage Commissions - A Sub-Adviser may allocate a portion of a Fund’s equity security transactions (subject to obtaining best execution of each transaction) through certain designated broker-dealers which will rebate a portion of the brokerage commissions to that Fund. Any amount credited to the Fund is reflected as brokerage commissions recaptured in the Statements of Operations.
Deferred Compensation Plan - The Funds adopted a Deferred Compensation Plan whereby independent Trustees may defer the receipt of all or a portion of their compensation. These deferred amounts, which remain as liabilities of the Funds, shall be treated as if invested and reinvested in shares of one or more affiliated funds at the discretion of the applicable Trustee. These amounts represent general, unsecured liabilities of the Funds and vary according to the total returns of the selected Funds. Liabilities related to deferred balances are included in payable for trustee fees in the Statements of Assets and Liabilities. Increases or decreases related to the changes in value of deferred balances are included in trustee fees set forth in the Statements of Operations.
NOTE 9. BORROWING ARRANGEMENTS
Effective June 7, 2013, the Trust entered into a Syndicated Credit Agreement (“SCA”) with a group of lenders. The Funds participate in the SCA with other funds managed by JNAM and Curian in a credit facility which is used solely to finance shareholder redemptions or for other temporary or emergency purposes. The Funds may borrow up to the lesser of the amount available under the facility or the limits set for borrowing by the Funds’ prospectuses and the 1940 Act. Interest on borrowings are payable at the greater of the Federal Funds Rate or the one month London Interbank Offer Rate (“LIBOR”), plus 1.00% on an annualized basis. The Funds pay an annual commitment fee of 0.075% for this facility and an annual administration fee to JPM Chase. No amounts were borrowed under the facility during the period. The fees are included in other expenses in the Funds’ Statements of Operations.
NOTE 10. FEDERAL INCOME TAX MATTERS
Each Fund is a separate taxpayer for federal income tax purposes. Each Fund intends to qualify as a Regulated Investment Company (“RIC”) and to distribute substantially all net investment income and net capital gains, if any, to its shareholders and otherwise comply with Subchapter M of the Internal Revenue Code of 1986, as amended, applicable to RICs. Therefore, no federal income tax provision is required.
Curian Series Trust
Notes to Financial Statements
October 31, 2013
The following information is presented on an income tax basis. Differences between amounts for financial statements and federal income tax purposes are primarily due to timing and character differences in recognizing certain gains and losses on investment transactions. Permanent differences between financial statement and federal income tax reporting are reclassified within the capital accounts based on their federal income tax treatment. Temporary differences do not require reclassification. Permanent differences may include but are not limited to the following: foreign currency reclassifications, market discount or paydown reclassifications, reclassifications on the sale of a passive foreign investment company (“PFIC”), accounting treatment of notional principal contracts and distribution adjustments. These reclassifications have no impact on net assets.
| | Net Increase (Decrease) | |
| | Undistributed
Net Investment
Income | | Accumulated Net
Realized Gain
(Loss) | | Paid-in Capital | |
Curian/PIMCO Income Fund | | $ | 2,352,854 | | $ | (2,352,854 | ) | $ | — | |
Curian/PIMCO Total Return Fund | | 6,539,800 | | (6,539,800 | ) | — | |
Curian/WMC International Equity Fund | | 496,203 | | (496,203 | ) | — | |
| | | | | | | | | | |
The Regulated Investment Company Modernization Act of 2010 (“Act”) was enacted on December 22, 2010. In general, the provisions of the Act are effective for the Funds’ year ended October 31, 2012 and going forward. Under the Act, a Fund is permitted to carry forward capital losses for an unlimited period. Post-enactment capital losses that are carried forward will retain their character as either short-term or long-term capital losses, and will not be considered exclusively short-term as under previous law.
At October 31, 2013, the following Funds had unused capital loss carryovers for U.S. federal income tax purposes, which may be used to offset future net realized capital gains and will be carried forward indefinitely and retain their character as follows:
| | Short Term
Capital
Losses | | Long Term
Capital Losses | |
Curian/PIMCO Total Return Fund | | $ | 52,030 | | $ | 2,704,708 | |
| | | | | | | |
As of October 31, 2013, the cost of investments and the components of net unrealized appreciation/(depreciation) for U.S. Federal income tax purposes were as follows:
| | Tax Cost of
Investments | | Gross
Unrealized
Appreciation | | Gross
Unrealized
Depreciation | | Net Unrealized
Appreciation/
Depreciation | |
Curian/PIMCO Income Fund | | $ | 609,985,550 | | $ | 11,324,994 | | $ | (12,621,221 | ) | $ | (1,296,227 | ) |
Curian/PIMCO Total Return Fund | | 1,183,504,992 | | 17,341,086 | | (8,731,761 | ) | 8,609,325 | |
Curian/WMC International Equity Fund | | 306,436,522 | | 56,757,501 | | (1,560,857 | ) | 55,196,644 | |
| | | | | | | | | | | | | |
As of October 31, 2013, the components of distributable taxable earning for U.S. Federal income tax purposes were as follows:
| | Unrealized
Gains
(Losses)** | | Undistributed
Net Ordinary
Income* | | Undistributed
Net Long-term
Capital Gain | | Distributions
Payable | | Capital Loss
Carry Forward | |
Curian/PIMCO Income Fund | | $ | (4,037,413 | ) | $ | 669,199 | | $ | — | | $ | (1,507,255 | ) | $ | — | |
Curian/PIMCO Total Return Fund | | 11,871,482 | | 345,694 | | — | | (927,654 | ) | (2,756,738 | ) |
Curian/WMC International Equity Fund | | 55,184,419 | | 13,186,234 | | 11,854,000 | | — | | — | |
| | | | | | | | | | | | | | | | |
* Undistributed net ordinary income consists of net taxable income derived from dividends, interest, and net short-term capital gains, if any.
** Unrealized gains (losses) are adjusted for open wash sale loss deferrals; accelerated recognition of unrealized gain/loss on futures, options and forward contracts; and accelerated recognition of unrealized gain on PFICs. Also adjusted for differences between book and tax realized and unrealized gain/loss on swap contracts.
The tax character of distributions paid during the Funds’ fiscal year ended October 31, 2013 was as follows:
| | Net Ordinary
Income* | | Long-term
Capital Gain** | | Return of
Capital | |
Curian/PIMCO Income Fund | | $ | 31,579,966 | | $ | 1,511,985 | | $ | — | |
Curian/PIMCO Total Return Fund | | 48,223,580 | | 182,550 | | — | |
Curian/WMC International Equity Fund | | 5,621,361 | | — | | — | |
| | | | | | | | | | |
* Net ordinary income consists of net taxable income derived from dividends, interest and net short-term capital gains, if any.
** The Funds designated as a long-term capital gain dividend, pursuant to the Internal Revenue code section 852(b)(3), the amount necessary to reduce earnings and profits of the Funds related to net capital gains to zero for the year ended October 31, 2013.
Curian Series Trust
Notes to Financial Statements
October 31, 2013
The tax character of distributions paid during the Funds’ fiscal period ended October 31, 2012 was as follows:
| | Net Ordinary
Income* | | Long-term
Capital Gain | | Return of
Capital | |
Curian/PIMCO Income Fund | | $ | 11,184,752 | | $ | — | | $ | — | |
Curian/PIMCO Total Return Fund | | 15,641,976 | | — | | — | |
| | | | | | | | | | |
* Net ordinary income consists of net taxable income derived from dividends, interest and net short-term capital gains, if any.
FASB ASC Topic 740 “Income Taxes” provides guidance for how uncertain tax positions should be recognized, measured, presented and disclosed in the financial statements. FASB ASC Topic 740 requires the evaluation of tax positions taken or expected to be taken in the course of preparing each Fund’s tax return to determine whether the tax positions are “more-likely-than-not” of being sustained by the applicable tax authority. Tax positions not deemed to meet the “more-likely-than-not” threshold would result in the Funds recording a tax expense in the current year. FASB ASC Topic 740 requires that management evaluate the tax positions taken in the 2011 and 2012 returns, which remain subject to examination by the Internal Revenue Service and certain other jurisdictions. Management completed an evaluation of the Funds’ tax positions and based on that evaluation, determined that no provision for federal income tax was required in the Funds’ financial statements during the year ended October 31, 2013.
NOTE 11. SUBSEQUENT EVENTS
Management has evaluated subsequent events for the Funds through the date the financial statements are issued, and has concluded there are no events that require adjustments to the financial statements or disclosure in the footnotes.
Report of Independent Registered Public Accounting Firm
The Board of Trustees and Shareholders
Curian Series Trust:
We have audited the accompanying statements of assets and liabilities of Curian/PIMCO Income Fund, Curian/PIMCO Total Return Fund, and Curian/WMC International Equity Fund (the “Funds” within Curian Series Trust), including the schedules of investments, as of October 31, 2013, and the related statements of operations for the year ended October 31, 2013, and the statements of changes in net assets and financial highlights for the year ended October 31, 2013 and the period November 2, 2011 (commencement of operations) to October 31, 2012. These financial statements and financial highlights are the responsibility of the Funds’ management. Our responsibility is to express an opinion on these financial statements and financial highlights based on our audits.
We conducted our audits in accordance with the standards of the Public Company Accounting Oversight Board (United States). Those standards require that we plan and perform the audit to obtain reasonable assurance about whether the financial statements and financial highlights are free of material misstatement. An audit includes examining, on a test basis, evidence supporting the amounts and disclosures in the financial statements. Our procedures included confirmation of securities owned as of October 31, 2013, by correspondence with the custodian and brokers or other appropriate auditing procedures. An audit also includes assessing the accounting principles used and significant estimates made by management, as well as evaluating the overall financial statement presentation. We believe that our audits provide a reasonable basis for our opinion.
In our opinion, the financial statements and financial highlights referred to above present fairly, in all material respects, the financial position of the Funds as of October 31, 2013, the results of their operations, changes in their net assets and the financial highlights for the periods indicated above, in conformity with U.S. generally accepted accounting principles.
/s/ KPMG LLP
Chicago, Illinois
December 20, 2013
Curian Series Trust
Additional Disclosures (Unaudited)
October 31, 2013
Disclosure of Fund Expenses. Shareholders incur ongoing costs, which include costs for portfolio management, administrative services and other operating expenses. Operating expenses such as these are deducted from each Fund’s gross income and directly reduce the final investment return. These expenses are expressed as a percentage of the Fund’s average net assets; this percentage is known as the Fund’s expense ratio. The examples below use the expense ratio and are intended to help the investor understand the ongoing costs (in dollars) of investing in a Fund and to compare these costs with the ongoing costs of investing in other mutual funds. The examples are based on an investment of $1,000 made at the beginning of the period shown and held for the entire period.
Expenses Using Actual Fund Return. This section provides information about the actual account values and actual expenses incurred by the Fund. Use the information in this section, together with the amount invested, to estimate the expenses paid over the period. Simply divide the account value by $1,000 (for example, an $8,600 account value divided by $1,000 = 8.6), then multiply the result by the number in the first section under the heading entitled “Expenses Paid During Period” to estimate the expenses paid during this period.
Expenses Using Hypothetical 5% Return. This section provides information that can be used to compare each Fund’s costs with those of other mutual funds. It assumes that the Fund’s expense ratio for the period is unchanged and assumes an annual 5% return before expenses, which is not the Fund’s actual return. This example is useful in making comparisons because the SEC requires all mutual funds to make the 5% calculation.
| | Expenses Using Actual Fund Return | | Expenses Using Hypothetical 5% Return | |
| | Beginning
Account
Value 5/01/13 | | Ending
Account
Value
10/31/13 | | Annualized
Expense
Ratios | | Expenses
Paid
During
Period | | Beginning
Account
Value 5/01/13 | | Ending
Account
Value
10/31/13 | | Annualized
Expense
Ratios | | Expenses
Paid
During
Period | |
| | | | | | | | | | | | | | | | | |
Curian/PIMCO Income Fund | | $ | 1,000.00 | | $ | 959.60 | | 0.85 | % | $ | 4.20 | | $ | 1,000.00 | | $ | 1,020.91 | | 0.85 | % | $ | 4.33 | |
| | | | | | | | | | | | | | | | | |
Curian/PIMCO Total Return Fund | | 1,000.00 | | 973.30 | | 0.80 | | 3.98 | | 1,000.00 | | 1,021.17 | | 0.80 | | 4.08 | |
| | | | | | | | | | | | | | | | | |
Curian/WMC International Equity Fund | | 1,000.00 | | 1,089.00 | | 1.32 | | 6.95 | | 1,000.00 | | 1,018.54 | | 1.32 | | 6.72 | |
| | | | | | | | | | | | | | | | | | | | | | | |
Expenses paid during the period are equal to the annualized net expense ratio, multiplied by the average account value over the period, then multiplied by 184/365 (to reflect the most recent 6-month period).
Quarterly Portfolio Holdings. The Funds filed a complete schedule of portfolio holdings with the U.S. Securities and Exchange Commission (“SEC”) for the first and third quarters of the fiscal year on Forms N-Q. The Funds’ Forms N-Q are available on the SEC’s website at www.sec.gov. The Forms N-Q may be reviewed and copied at the SEC’s Public Reference Room in Washington, DC, and information on the operation of the Public Reference Room may be obtained by calling 800-SEC-0330. It is also available upon request from the registrant by calling the Funds toll-free at 1-866-255-1935.
Proxy Voting Guidelines. The Board has adopted the proxy voting policy and procedures (“Policy”) of the Funds’ Adviser, pursuant to which the Board has delegated proxy voting responsibility to the Adviser, and pursuant to which the Adviser has delegated proxy voting responsibility to each of the Sub-Advisers. The Trust has approved each of the Sub-Adviser’s proxy voting policies and procedures (“Procedures”).
The Policy is designed to promote accountability of the company’s management to its shareholders and to align the interests of management with those shareholders. The Sub-Advisers generally review each matter on a case-by-case basis in order to make a determination of how to vote in a manner that best serves the interests of Fund shareholders. The Sub-Advisers may abstain from voting from time to time where it determines that the costs associated with voting a proxy outweigh the benefits derived from exercising the right to vote. For example, Curian shall permit a Sub-Adviser to abstain from voting a proxy for securities that have been loaned by the Fund and would have to be recalled in order to submit a proxy vote. In addition, the Sub-Advisers will monitor situations that may result in a conflict of interest in accordance with their policies and procedures. A description of the policies and procedures used by the Funds to vote proxies relating to the portfolio securities and information on how the Funds voted proxies relating to portfolio securities during the 12-month period ended June 30 are available (1) without charge, upon request by calling 1-877-874-4143 (Curian Client Services), (2) on Curian Capital’s website at www.curian.com, and (3) on the SEC’s website at www.sec.gov.
Other Federal Income Tax Information. The information reported below is for the year ended October 31, 2013. Foreign tax and qualified dividend information for the calendar year 2013 will be provided on each shareholder’s 2013 Form 1099-DIV.
For the year ended October 31, 2013, certain dividends paid by the Funds may be subject to a maximum tax rate of 15% as provided for by the Tax Relief, Unemployment Insurance Reauthorization, and Job Creation Act of 2010. Beginning in 2013, under the American Taxpayer Relief Act of 2012, that maximum rate may increase to 20% depending on the taxpayer’s gross income. In addition, dividends paid by the Funds may be subject to a 3.8% net investment income tax under the Health Care and Education Reconciliation Act of 2010. The Funds intend to designate the maximum amount allowable as taxed at a maximum rate of 15% and 20%.
For the year ended October 31, 2013, the following Funds hereby designate the following percentages, or the maximum amount allowable under the Internal Revenue Code (“Code”), as qualified dividends:
| | Qualified Dividend
Income | |
Curian/PIMCO Income Fund | | 0.20 | % |
Curian/PIMCO Total Return Fund | | 0.52 | |
Curian/WMC International Equity Fund | | 43.43 | |
For the year ended October 31, 2013, the following Funds hereby designate the following percentages, or the maximum amount allowable under the Code, as distributions eligible for the dividends received deduction for corporations:
| | Dividends Received
Deduction | |
Curian/PIMCO Income Fund | | 0.20 | % |
Curian/PIMCO Total Return Fund | | 0.52 | |
Curian/WMC International Equity Fund | | 0.75 | |
The Curian/WMC International Equity Fund intends to elect to pass through to shareholders the taxes paid to foreign countries. The pass-through of the foreign taxes paid will only affect those persons who are shareholders on the dividend record date in December 2013. Foreign source income and foreign tax per outstanding share on October 31, 2013 are as follows:
| | Foreign
Source Income | | Foreign Tax
Expense | |
Curian/WMC International Equity Fund | | $ | 0.16 | | $ | 0.01 | |
| | | | | | | |
TRUSTEES AND OFFICERS OF CURIAN SERIES TRUST (“TRUST”)
NAME, ADDRESS AND (AGE) | | POSITION(S) HELD
WITH TRUST
(LENGTH OF TIME SERVED) | | NUMBER OF PORTFOLIOS IN FUND
COMPLEX TO BE OVERSEEN BY
TRUSTEE OR OFFICER |
| | | | |
Interested Trustee | | | | |
| | | | |
Michael Bell (50)(1)
7601 Technology Drive
Denver, CO 80237 | | Trustee(2)
(11/2010 to present) President and Chief Executive Officer (11/2010 to present) | | 58 |
| | | | |
PRINCIPAL OCCUPATION(S) DURING PAST 5 YEARS: President and Chief Executive Officer of Curian Capital, LLC (12/2005 to present) |
| | | | |
OTHER DIRECTORSHIPS HELD BY TRUSTEE DURING PAST 5 YEARS: Trustee, Curian Variable Series Trust (10/2011 to present) |
| | | | |
Independent Trustees | | | | |
| | | | |
David W. Agostine (51) 7601 Technology Drive Denver, CO 80237 | | Chairman of the Board and Trustee(2) (11/2010 to present) | | 58 |
| | | | |
PRINCIPAL OCCUPATION(S) DURING PAST 5 YEARS: Principal, Market Metrics, LLC (01/2011 to present); President, Dividend Capital Investments, Inc. (2007 to 12/2010); Principal Executive Officer and President, DCI Group/BlackCreek Global Advisors (2007 to present) |
|
OTHER DIRECTORSHIPS HELD BY TRUSTEE DURING PAST 5 YEARS: Trustee, Curian Variable Series Trust (10/2011 to present); Trustee, Dividend Capital Investments, Inc. (2007 to present) |
| | | | |
Gregory P. Contillo (58) 7601 Technology Drive Denver, CO 80237 | | Trustee(2) (9/2011 to present) | | 58 |
| | | | |
PRINCIPAL OCCUPATION(S) DURING PAST 5 YEARS: President, Crystal River Partners (2005 to present); President of MKA Capital Group Advisors, LLC (2007 to 2008) |
|
OTHER DIRECTORSHIPS HELD BY TRUSTEE DURING PAST 5 YEARS: Trustee, Curian Variable Series Trust (10/2011 to present) |
| | | | |
Dylan E. Taylor (43) 7601 Technology Drive Denver, CO 80237 | | Trustee(2) (11/2010 to present) | | 58 |
| | | | |
PRINCIPAL OCCUPATION(S) DURING PAST 5 YEARS: Chief Executive Officer, USA, Colliers International (a commercial real estate advisory firm) (06/2009 to present); President, Grubb & Ellis Company (a commercial real estate advisory firm) (5/2008 to 6/2009); Executive Vice President, Grubb & Ellis Company (1/2008 to 6/2009); President — Corporate Services Group, Grubb & Ellis Company (10/2007 to 6/2009); Acting President — Global Client Services, Grubb & Ellis Company (1/2008 to 5/2008) |
|
OTHER DIRECTORSHIPS HELD BY TRUSTEE DURING PAST 5 YEARS: Trustee, Curian Variable Series Trust (10/2011 to present); |
NAME, ADDRESS AND (AGE) | | POSITION(S) HELD WITH TRUST (LENGTH OF TIME SERVED) | | NUMBER OF PORTFOLIOS IN FUND
COMPLEX TO BE OVERSEEN BY
TRUSTEE OR OFFICER |
| | | | |
Independent Trustees | | | | |
| | | | |
Mark S. Wehrle (56) 7601 Technology Drive Denver, CO 80237 | | Trustee(2) (07/2013 to present) | | 58 |
| | | | |
PRINCIPAL OCCUPATION(S) DURING PAST 5 YEARS: Broker, RE/MAX Professionals (04/2011 to present); Adjunct Professor of Accounting, University of Denver School of Accountancy (01/2011 to present); Partner, Deloitte & Touche LLP (09/1987 to 01/2011) |
|
OTHER DIRECTORSHIPS HELD BY TRUSTEE DURING PAST 5 YEARS: Trustee, Curian Variable Series Trust (07/2013 to present) |
| | | | |
Scot T. Wetzel (44) 7601 Technology Drive Denver, CO 80237 | | Trustee(2) (11/2010 to present) | | 58 |
| | | | |
PRINCIPAL OCCUPATION(S) DURING PAST 5 YEARS: Founder, Managing Director & Chief Executive Officer, Crestmoor Advisors, LLC (2010 to present); Chief Executive Officer, United Western Bancorp, Inc. (2005 to 2010) |
|
OTHER DIRECTORSHIPS HELD BY TRUSTEE DURING PAST 5 YEARS: Trustee, Curian Variable Series Trust (10/2011 to present); Inside Director of United Western Bancorp, Inc. (12/2005 to 4/2010) |
(1) Michael Bell is an “interested person” of the Trust due to his position with Curian Capital, LLC.
(2) The Chairman of the Board, interested and Independent Trustees are elected to serve for an indefinite term.
NAME, ADDRESS AND (AGE) | | POSITION(S) HELD WITH TRUST (LENGTH OF TIME SERVED) | | NUMBER OF PORTFOLIOS IN
FUND COMPLEX TO BE
OVERSEEN BY TRUSTEE OR
OFFICER |
| | | | |
Officers | | | | |
| | | | |
Emily Bennett (30) 1 Corporate Way Lansing, MI 48951 | | Assistant Secretary (5/2012 to present) | | Not Applicable |
| | | | |
PRINCIPAL OCCUPATION(S) DURING PAST 5 YEARS: Senior Attorney of Jackson National Asset Management, LLC (“JNAM”) (10/2013 to present); Attorney of JNAM (11/2011 to 10/2013); Assistant Secretary of other funds sponsored by Curian Capital, LLC that are in the same group of other investment companies advised by JNAM (5/2012 to present); Departmental Specialist, Michigan Public Health Institute (7/2010 to 10/2011); Legal Assistant, Guyselman & Ehnis-Clark (4/2009 to 7/2010) |
| | | | |
Angela Burke (31) 1 Corporate Way Lansing, MI 48951 | | Assistant Secretary (6/2013 to present) | | Not Applicable |
| | | | |
PRINCIPAL OCCUPATION(S) DURING PAST 5 YEARS: Attorney of JNAM (04/2013 to present); Assistant Secretary of other funds sponsored by Curian Capital, LLC that are in the same group of other investment companies advised by JNAM (6/2013 to present); Senior Analyst - Tax of JNAM (01/2011 to 04/2013); Senior Consultant of Deloitte Tax LLP (01/2008 to 01/2011) |
| | | | |
Karen J. Buiter, CPA (48) 1 Corporate Way Lansing, MI 48951 | | Assistant Treasurer (11/2010 to present) | | Not Applicable |
| | | | |
PRINCIPAL OCCUPATION(S) DURING PAST 5 YEARS: Vice President — Financial Reporting of JNAM (7/2011 to present); Assistant Vice President — Financial Reporting of JNAM (4/2008 to 6/2010); Assistant Treasurer of other investment companies advised by JNAM (12/2008 to present); Assistant Treasurer of other funds sponsored by Curian Capital, LLC that are in the same group of other investment companies advised by JNAM (11/2010 to present) |
| | | | |
Kelly L. Crosser (40) 1 Corporate Way Lansing, MI 48951 | | Assistant Secretary (11/2010 to present) | | Not Applicable |
| | | | |
PRINCIPAL OCCUPATION(S) DURING PAST 5 YEARS: Assistant Secretary of other Investment Companies advised by JNAM (9/2007 to present); Assistant Secretary of other funds sponsored by Curian Capital, LLC that are in the same group of other investment companies advised by JNAM (11/2010 to present); Senior Compliance Analyst of Jackson National Life Insurance Company (4/2007 to present) |
| | | | |
Lewis Dellarco, Jr. (55) 7601 Technology Drive Denver, CO 80237 | | Anti-Money Laundering Officer (11/2010 to present) | | Not Applicable |
| | | | |
PRINCIPAL OCCUPATION(S) DURING PAST 5 YEARS: Vice President and Chief Compliance Officer of Curian Capital, LLC (11/2002 to 6/2004) and (12/2008 to present, respectively); Vice President and Chief Compliance Officer of Curian Clearing LLC (6/2004 to present); Vice President and Chief Compliance Officer of Jackson Investment Management, LLC (12/2008 to 12/2012) |
NAME, ADDRESS AND (AGE) | | POSITION(S) HELD WITH TRUST (LENGTH OF TIME SERVED) | | NUMBER OF PORTFOLIOS IN
FUND COMPLEX TO BE
OVERSEEN BY TRUSTEE OR
OFFICER |
| | | | |
Officers | | | | |
| | | | |
Diana R. Gonzalez (35) 1 Corporate Way Lansing, MI 48951 | | Assistant Vice President (9/2012 to present) | | Not Applicable |
| | | | |
PRINCIPAL OCCUPATION(S) DURING PAST 5 YEARS: Associate General Counsel of JNAM (10/2013 to Present); Senior Attorney of JNAM (5/2012 to 10/2013); Assistant Vice President of other funds sponsored by Curian Capital, LLC that are in the same group of other investment companies advised by JNAM (9/2012 to present); Counsel of Sun Life Financial, Inc. (4/2008 to 5/2012) |
| | | | |
Daniel W. Koors, CPA (43) 1 Corporate Way Lansing, MI 48951 | | Treasurer and Chief Financial Officer (11/2010 to present) | | Not Applicable |
| | | | |
PRINCIPAL OCCUPATION(S) DURING PAST 5 YEARS: Senior Vice President of JNAM (1/2009 to present) and Chief Operating Officer of JNAM (5/2011 to present) Chief Financial Officer of JNAM (1/2007 to 4/2011); Vice President of other Investment Companies advised by JNAM (12/2006 to present), Treasurer and Chief Financial Officer of other Investment Companies advised by JNAM (12/2006 to 11/2011); Treasurer and Chief Financial Officer of other funds sponsored by Curian Capital, LLC that are in the same group of other investment companies advised by JNAM (11/2010 to present); Assistant Vice President — Fund Administration of Jackson National Life Insurance Company (8/2006 to 1/2009) |
| | | | |
Joseph O’Boyle (50) 1 Corporate Way Lansing, MI 48951 | | Chief Compliance Officer (5/2012 to present) | | Not Applicable |
| | | | |
PRINCIPAL OCCUPATION(S) DURING PAST 5 YEARS: Chief Compliance Officer — Curian Funds (4/2012 to present); Chief Compliance Officer, Guggenheim Funds (2011 — 2012); Chief Compliance Officer, Calamos Investments (2008 — 2011) |
| | | | |
Gerard A. M. Oprins, CPA (54) 1 Corporate Way Lansing, MI 48951 | | Vice President (3/2012 to present) | | Not Applicable |
| | | | |
PRINCIPAL OCCUPATION(S) DURING PAST 5 YEARS: Senior Vice President and Chief Financial Officer of JNAM (4/2011 to present); Vice President, Treasurer and Chief Financial Officer of other Investment Companies advised by JNAM (11/2011 to present); Vice President of other funds sponsored by Curian Capital, LLC that are in the same group of other investment companies advised by JNAM (3/2012 to present); Business Consultant (2009 to 3/2011); Partner, Ernst & Young LLP (1995 to 2009) |
| | | | |
Michael Piszczek, CPA (56) 1 Corporate Way Lansing, MI 48951 | | Vice President (11/2010 to present) | | Not Applicable |
| | | | |
PRINCIPAL OCCUPATION(S) DURING PAST 5 YEARS: Vice President — Tax of JNAM (7/2011 to present); Vice President of other Investment Companies advised by JNAM (11/2007 to present); Vice President of other funds sponsored by Curian Capital, LLC that are in the same group of other investment companies advised by JNAM (11/2010 to present); Assistant Vice President — Tax of JNAM (11/2007 to 6/2011) |
NAME, ADDRESS AND (AGE) | | POSITION(S) HELD WITH TRUST (LENGTH OF TIME SERVED) | | NUMBER OF PORTFOLIOS IN
FUND COMPLEX TO BE
OVERSEEN BY TRUSTEE OR
OFFICER |
| | | | |
Officers | | | | |
| | | | |
Susan S. Rhee (41) 1 Corporate Way Lansing, MI 48951 | | Vice President, Chief Legal Officer & Secretary (11/2010 to present) | | Not Applicable |
| | | | |
PRINCIPAL OCCUPATION(S) DURING PAST 5 YEARS: Senior Vice President and General Counsel of JNAM (1/2010 to present); Chief Legal Officer (7/2004 to 12/2009) and Secretary (11/2000 to present) of JNAM; Vice President, Counsel, and Secretary of other Investment Companies advised by JNAM (2/2004 to present); Vice President, Chief Legal Officer & Secretary of other funds sponsored by Curian Capital, LLC that are in the same group of other investment companies advised by JNAM (11/2010 to present); Assistant Vice President of Jackson National Life Insurance Company (8/2003 to 12/2009); Associate General Counsel of Jackson National Life Insurance Company (7/2001 to 12/2009) |
The Statement of Additional Information includes additional information about Fund Trustees and may be obtained at no charge by calling 1-877-847-4143 (Curian Care Center), by writing the Curian Care Center, 7601 Technology Way, Denver, Colorado 80237 or by visiting www.curianclearing.com.
The interested Trustee and the Officers of the Trust or the Adviser do not receive any compensation from the Trust for their services as Trustees or Officers. The following persons, who are Independent Trustees of the Trust and the Trust’s Chief Compliance Officer, received from the Trust the compensation amounts indicated for the services as such for the year ended October 31, 2013:
TRUSTEE/OFFICER | | AGGREGATE COMPENSATION
FROM THE TRUST(1) | | PENSION OR RETIREMENT
BENEFITS ACCRUED AS PART
OF TRUST EXPENSES | | ESTIMATED ANNUAL
BENEFITS UPON
RETIREMENT | | TOTAL COMPENSATION
FROM THE TRUST AND
FUND COMPLEX (1) | |
David W. Agostine | | $ | 46,071 | | $ | 0 | | $ | 0 | | $ | 118,000 | |
Gregory P. Contillo | | $ | 43,001 | | $ | 0 | | $ | 0 | | $ | 110,000 | |
Dylan E. Taylor | | $ | 41,516 | | $ | 0 | | $ | 0 | | $ | 105,500 | |
Mark S. Wehrle(2) | | $ | 8,215 | | $ | 0 | | $ | 0 | | $ | 26,500 | (3) |
Scot T. Wetzel | | $ | 43,001 | | $ | 0 | | $ | 0 | | $ | 110,000 | (4) |
Joseph O’Boyle(5) | | $ | 100,000 | | $ | 0 | | $ | 0 | | $ | 293,939 | |
(1) The fees paid to the independent Trustees are paid for combined service on the Boards of the Trust and Curian Variable Series Trust (the “Fund Complex”). The fees are allocated to the Funds and affiliated investment companies on a pro-rata basis based on net assets. The total fees paid to all the independent Trustees from the Trust and Fund Complex are $470,000.
(2) Mr. Wehrle was elected a Trustee of the Trust on July 1, 2013.
(3) Amount includes $5,300 deferred by Mr. Wehrle.
(4) Amount includes $110,000 deferred by Mr. Wetzel.
(5) This portion of Mr. O’Boyle’s compensation is paid by the Funds for his duties as the Chief Compliance Officer of the Fund Complex. The expense is allocated to the Funds and affiliated investment companies on a pro-rata basis based on net assets.
CURIAN SERIES TRUST
APPROVAL OF CURIAN SERIES TRUST’S (“TRUST”)
INVESTMENT ADVISORY AND SUB-ADVISORY AGREEMENTS
The Board of Trustees of the Trust (“Board”) oversees the management of each series of the Trust (each, a “Fund”) and, as required by law, determines whether to approve and, after the initial term, continue the Funds’ advisory and sub-advisory agreement(s).
At a meeting held on June 5, 2013, the Board, including all of the Independent Trustees, considered information relating to the Funds’ investment advisory and management agreement (“Advisory Agreement”) with Curian Capital, LLC (“Curian” or “Adviser”), and information relating to the investment sub-advisory agreements (each, a “Sub-Advisory Agreement,” and together, the “Sub-Advisory Agreements”) (“Agreements” refers to the Advisory Agreement and the Sub-Advisory Agreements) among Curian, the Trust and each Fund’s investment sub-adviser: Pacific Investment Management Company LLC and Wellington Management Company, LLP (each, a “Sub-Adviser” and collectively, “Sub-Advisers”). In advance of the meeting, independent legal counsel for the Independent Trustees requested that certain information be provided to the Board relating to the Agreements. Prior to the meeting, independent legal counsel discussed the materials with the Independent Trustees and independent legal counsel requested updated information on behalf of the Independent Trustees. The Board received this information and met to consider the information. The Board also discussed this information at a telephonic meeting held on May 15, 2013. At the conclusion of the Board’s discussion, the Board approved the continuation of the Agreements.
For each Fund, Curian and each Sub-Adviser provided information related to the following factors: (1) the nature, quality and extent of the services each provides, (2) the historical performance results for each Fund, (3) the cost of the services of the Adviser and Sub-Advisers and comparative expense information, (4) whether economies are being realized as the Funds grow and whether the fee structure is designed to provide economies of scale for the Funds’ investors, (5) the profits that Curian and each Sub-Adviser derive from its relationship with the Fund, and (6) other “fall-out” benefits that could be realized by Curian or the Sub-Adviser (i.e., ancillary benefits derived by Curian, a Sub-Adviser or any of their affiliates from the relationship with the Funds). In its deliberations, the Board, in exercising its business judgment, did not identify any single factor that alone was responsible for the Board’s decision to approve the Agreements.
Before approving the Agreements, the Independent Trustees met in executive session with their independent legal counsel to consider the materials provided by Curian and each Sub-Adviser, as well as the terms of the Agreements. Based on its evaluation of those materials, the Board, including the interested and Independent Trustees, concluded that the Advisory Agreement is in the best interests of the shareholders of each Fund and that each Sub-Advisory Agreement is in the best interests of the shareholders of the applicable Fund. In reaching its conclusions, the Board considered numerous matters, including the following:
Nature, Quality and Extent of Services
The Board examined the nature, quality and extent of the services provided by Curian and the Sub-Advisers.
For each Fund, the Board considered the services provided by Curian, including, but not limited to, the oversight of the Sub-Advisers pursuant to the Advisory Agreement, the ability to hire and remove Sub-Advisers pursuant to the Trust’s “Manager of Managers” exemptive order, as well as the provision of recordkeeping and compliance services to the Funds. The Board also took into account that Curian monitors the performance of the various organizations that provide services to the Funds, including the Funds’ distributor, transfer agent and custodian. With respect to Curian’s oversight of the Sub-Advisers, the Board noted that Curian is responsible for screening and recommending new sub-advisers when appropriate, as well as monitoring and reporting to the Board on the performance and operations of the existing Sub-Advisers. The Board also considered the investment sub-advisory services provided by each Sub-Adviser. The Board noted Curian’s evaluation of the Sub-Advisers, as well as Curian’s recommendations, based on its review of the Sub-Advisers, to approve the Sub-Advisory Agreements.
The Board reviewed the qualifications, backgrounds and responsibilities of Curian’s senior management that are responsible for oversight of the Funds and each Sub-Adviser, and also reviewed the qualifications and backgrounds of the Sub-Advisers’ portfolio managers who are responsible for the day-to-day management of each Fund. The Board reviewed information pertaining to Curian’s and each Sub-Adviser’s organizational structure, senior management, financial condition, investment operations and other relevant information. The Board considered compliance reports about Curian and each Sub-Adviser from the Trust’s Chief Compliance Officer (“CCO”).
Based on the foregoing, the Board concluded that (i) each Fund is likely to continue to benefit from the nature, extent and quality of the services to be provided by Curian under the Advisory Agreement and (ii) each Fund is likely to continue to benefit from the nature, extent and quality of the services to be provided by its Sub-Adviser under the Sub-Advisory Agreement.
Investment Performance of the Funds
The Board considered the investment performance of each Fund. For each Fund, the Board reviewed performance history as compared to the Fund’s benchmark index and as compared to the average performance returns for other funds similar in size, character and/or investment strategy (the “peer group”), as provided by an independent data service.
Curian/PIMCO Income Fund. The Board considered the performance record of the Fund. The Board noted that the Fund had outperformed its benchmark and its peer group average for each of the periods considered. The Board concluded from its review that it would be in the best interests of the Fund and its shareholders to approve the Agreements.
Curian/PIMCO Total Return Fund. The Board considered the performance record of the Fund. The Board noted that the Fund had outperformed its benchmark for each of the periods considered. The Board also noted that for the year-to-date and one-year periods, the Fund had outperformed its peer group average, although the Fund had underperformed its peer group since inception. The Board concluded from its review that it would be in the best interests of the Fund and its shareholder to approve the Agreements.
Curian/WMC International Equity Fund. The Board considered the performance record of the Fund. The Board noted that the Fund had outperformed its benchmark for each of the periods considered. The Board concluded from its review that it would be in the best interests of the Fund and its shareholders to approve the Agreements.
Costs of Services
The Board reviewed the fees paid to Curian and each Fund’s Sub-Adviser. For each Fund, the Board reviewed fee and expense information as compared to that of funds managed by other advisers, as well as fees charged by each sub-adviser to similar clients, if any. The Board also noted that Curian does not manage any institutional accounts with which the Funds’ fees could be compared. Using information provided by an independent data service, the Board evaluated each Fund’s advisory fees compared to the average advisory fees for other funds in its peer group. The Board also considered each Fund’s sub-advisory fee and compared that to the average sub-advisory fee of the peer group.
Further detail considered by the Board regarding the advisory and sub-advisory fees of each Fund is set forth below:
Curian/PIMCO Income Fund. The Board noted that the Fund’s advisory fee is lower than the peer group average and that the Fund’s sub-advisory fee is the same as the peer group average. The Board also noted that the Fund’s total expense ratio is higher than the peer group average. The Board considered the effect of other expenses on the Fund’s total expense ratio. In light of all the information provided, the Board concluded that it would be in the best interests of the Fund and its shareholders to approve the Agreements.
Curian/PIMCO Total Return Fund. The Board noted that the Fund’s advisory fee is lower than the peer group average, although the Fund’s sub-advisory fee is higher than the peer group average. The Board also noted that the Fund’s total expense ratio is higher than the peer group average. The Board considered the effect of other expenses on the Fund’s total expense ratio. In light of all the information provided, the Board concluded that it would be in the best interests of the Fund and its shareholders to approve the Agreements.
Curian/WMC International Equity Fund. The Board noted that the Fund’s advisory and sub-advisory fees are lower than the peer group average. The Board noted that of the two other funds in the peer group that had sub-advisory fees, the Fund’s sub-advisory fee is the lowest. The Board also noted that the Fund’s total expense ratio is the same as the peer group average. The Board concluded that it would be in the best interests of the Fund and its shareholders to approve the Agreements.
Economies of Scale
The Board considered economies of scale and noted that the Sub-Advisory Agreements for the Curian/PIMCO Total Return Fund and the Curian/WMC International Equity Fund include breakpoints. The Board also considered Curian’s assertion that the Adviser’s contractual fee waiver typically reduces each Fund’s advisory fee to zero and that, therefore, a breakpoint would likely have no effect on the expenses paid by the Funds.
Profitability
The Board considered information concerning the costs incurred and profits realized by Curian and each Sub-Adviser. The Board determined that the profits realized by Curian and each Sub-Adviser were not unreasonable.
Other Benefits to Curian and the Sub-Advisers
In evaluating the benefits that accrue to Curian through its relationship with the Funds, the Board noted that Curian and certain of its affiliates serve the Funds in various capacities, including as adviser, administrator, transfer agent and distributor, and receive compensation from the Funds in connection with providing services to the Funds. The Board noted that each service provided to the Funds by Curian or one of its affiliates is pursuant to a written agreement, which the Board evaluates periodically as required by law. The Board also noted that certain Sub-Advisers pay for portions of meetings organized by the Funds’ distributor to educate wholesalers about the Fund(s) that each of those Sub-Advisers manage. The Board considered Curian’s assertion that those meetings do not yield a profit to the Funds’ distributor, Sub-Advisers are not required to participate in the meetings and recommendations to hire or fire Sub-Advisers are not influenced by a Sub-Adviser’s willingness to participate in the meetings. The Board reviewed the monetary values of these transactions. Lastly, certain affiliates of Curian may receive benefits under the federal income tax laws with respect to tax deductions and credits.
In evaluating the benefits that may accrue to the Sub-Advisers through their relationship with the Fund(s), the Board noted that each Sub-Adviser may receive indirect benefits in the form of soft dollar arrangements for portfolio securities trades placed with the Funds’ assets and may also develop additional investment advisory business with Curian, the Funds, or other clients of the Sub-adviser as a result of its relationship with the Fund(s).

Curian Capital, LLC
7601 Technology Way
Denver, CO 80237
www.curian.com | www.curianclearing.com
IIS7476 11/13
Item 2. Code of Ethics.
As of the end of the period covered by this report, the registrant had adopted a code of ethics, as defined in Item 2 of Form N-CSR, applicable to its principal executive officer, principal financial officer, principal accounting officer or controller, or persons performing similar functions. There were no substantive amendments or any waivers to this code of ethics during the period covered by this report. A copy of this code of ethics is filed as exhibit 12(a)(1) to this Form N-CSR.
Item 3. Audit Committee Financial Expert.
The registrant has named David W. Agostine, Gregory P. Contillo, Dylan E. Taylor, Scot T. Wetzel, and Mark S. Wehrle as audit committee financial experts serving on its Audit Committee. The Audit Committee replaced the former “Committee of Independent Trustees” on February 5, 2013. Each of these individuals is “independent,” meaning that he is not an “interested person” of the registrant, as that term is defined in Section 2(a)(19) of the Investment Company Act of 1940, as amended, and is considered “independent” for purposes of this Item.
An “audit committee financial expert” is not an “expert” for any purpose, including for purposes of Section 11 of the Securities Act of 1933, as amended, as a result of being designated as an “audit committee financial expert.” Further, the designation of a person as an “audit committee financial expert” does not mean that the person has any greater duties, obligations, or liability than those imposed on the person without the “audit committee financial expert” designation. Similarly, the designation of a person as an “audit committee financial expert” does not affect the duties, obligations, or liability of any other member of the Audit Committee or Board of Trustees.
Item 4. Principal Accountant Fees and Services.
(a)-(d)
The administrator of the registrant is responsible for payment of all expenses associated with the annual audit and other required services of the independent registered accounting firm, and all expenses associated with the preparation and filing of the tax returns.
KPMG LLP (“KPMG”) was appointed by the Board of Trustees as the independent registered public accounting firm of the registrant for the fiscal years ended October 31, 2012 and October 31, 2013. The following table sets forth aggregate fees billed by KPMG for the respective period for professional services rendered to the registrant.
Fees for Services Rendered to the Registrant by the Principal Accountant
Fiscal Year | | Audit Fees | | Audit-Related Fees | | Tax Fees | | All Other Fees | |
2012 | | $ | 62,100 | | $ | 0 | | $ | 15,000 | | $ | 0 | |
2013 | | $ | 64,825 | | $ | 0 | | $ | 11,903 | | $ | 0 | |
Fees for Services Rendered to the Adviser Entities by the Principal Accountant
The following table sets forth the amount of fees that were billed by KPMG for the respective period to any entity controlling, controlled by, or under common control with the investment adviser that provided ongoing services to the registrant (“Adviser Entities”) that were directly related to the registrant’s operations and financial reporting.
Fiscal Year | | Audit-Related Fees | | Tax Fees | | All Other Fees | |
2012 | | $ | 109,084 | | $ | 0 | | $ | 0 | |
2013 | | $ | 113,804 | | $ | 0 | | $ | 0 | |
The above Audit-Related Fees are the aggregate fees billed to Adviser Entities for the performance of an internal audit control review of the sub-administrator to the registrant pursuant to Statement on Standards for Attestation Engagements No. 16.
(e)(1) The Audit Committee is authorized to pre-approve non-audit services provided by the registrant’s auditors, if they find it appropriate in light of their fiduciary duties and in the exercise of their good faith business judgment and compatible with the auditors’ independence. The Chairman of the Audit Committee is authorized to approve audit and non-audit services for newly established Funds of the registrant on the same terms as the full Audit Committee previously had approved for the then existing Funds.
(e)(2) 0%
(f) Not applicable.
(g) The aggregate fees billed for all non-audit fees to the registrant and Adviser Entities for the period ended October 31, 2012, was $220,184 and for the period ended October 31, 2013 was $222,707.
(h) For the fiscal years ended October 31, 2012 and October 31, 2013, the Audit Committee of the registrant’s Board of Trustees considered the provision of non-audit services that were rendered to the Adviser Entities that were not pre-approved pursuant to paragraph (c)(7)(ii) of Rule 2-01 of Regulation S-X, and concluded that such services were compatible with maintaining KPMG’s independence.
Item 5. Audit Committee of Listed Registrants.
Not applicable.
Item 6. Investments.
(a) Included as a part of the report to shareholders filed under Item 1.
(b) Not applicable.
Item 7. Disclosure of Proxy Voting Policies and Procedures for Closed-End Management Investment Companies.
Not applicable.
Item 8. Portfolio Managers of Closed-End Management Investment Companies.
Not applicable.
Item 9. Purchases of Equity Securities by Closed-End Management Investment Company and Affiliated Purchasers.
Not applicable.
Item 10. Submission of Matters to a Vote of Security Holders.
No material changes have been made.
Item 11. Controls and Procedures.
(a) The registrant maintains disclosure controls and procedures that are designed to ensure that information required to be disclosed in the registrant’s filings under the Securities Exchange Act of 1934, as amended, and the Investment Company Act of 1940, as amended, is recorded, processed, summarized, and reported within the periods specified in the rules and forms of the U.S. Securities and Exchange Commission. Such information is accumulated and communicated to the registrant’s management, including its principal executive officer and principal financial officer, as appropriate, to allow timely decisions regarding required disclosure. The registrant’s management, including the principal executive officer and the principal financial officer, recognizes that any set of controls and procedures, no matter how well designed and operated, can provide only reasonable assurance of achieving the desired control objectives.
Within ninety (90) days prior to the filing date of this report on Form N-CSR, the registrant had carried out an evaluation, under the supervision and with the participation of the registrant’s management, including the registrant’s principal executive officer and the registrant’s principal financial officer, of the effectiveness of the design and operation of the registrant’s disclosure controls and procedures. Based on such evaluation, the registrant’s principal executive officer and principal financial officer concluded that the registrant’s disclosure controls and procedures are effective.
(b) There have been no significant changes in the registrant’s internal controls over financial reporting during the registrant’s second fiscal quarter of the period covered by this report that have materially affected, or are reasonably likely to materially affect, the registrant’s internal controls over financial reporting. There have been no significant changes in the registrant’s internal controls or in other factors that could significantly affect the internal controls subsequent to the date of their evaluation in connection with the preparation of this report on Form N-CSR.
Item 12. Exhibits.
(a) | | (1) Code of Ethics pursuant to Section 406 of the Sarbanes-Oxley Act of 2002 (as defined in Item 2(b) of Form N-CSR) is attached hereto. |
| | (2) The certifications required by Rule 30a-2(a) under the Investment Company Act of 1940, as amended, are attached hereto. |
| | (3) Not applicable. |
| | |
(b) | | The certification required by Rule 30a-2(b) under the Investment Company Act of 1940, as amended, is attached hereto. |
SIGNATURES
Pursuant to the requirements of the Securities Exchange Act of 1934, as amended, and the Investment Company Act of 1940, as amended, the registrant has duly caused this report to be signed on its behalf by the undersigned, thereunto duly authorized.
Curian Series Trust |
| |
| |
By: | /s/ Daniel W. Koors | |
| Daniel W. Koors | |
| Principal Financial Officer | |
| |
Date: | December 30, 2013 |
Pursuant to the requirements of the Securities Exchange Act of 1934, as amended, and the Investment Company Act of 1940, as amended, this report has been signed below by the following persons on behalf of the registrant and in the capacities and on the dates indicated.
By: | /s/ Michael A. Bell | |
| Michael A. Bell | |
| Principal Executive Officer | |
| | |
Date: | December 30, 2013 | |
| | |
| | |
By: | /s/ Daniel W. Koors | |
| Daniel W. Koors | |
| Principal Financial Officer | |
| | |
Date: | December 30, 2013 | |
EXHIBIT LIST
Exhibit 12(a)(1) | | Registrant’s Code of Ethics pursuant to Section 406 of the Sarbanes-Oxley Act of 2002. |
| | |
Exhibit 12(a)(2) | | Certification of the Principal Executive Officer required by Rule 30a-2(a) under the Investment Company Act of 1940, as amended. |
| | |
| | Certification of the Principal Financial Officer required by Rule 30a-2(a) under the Investment Company Act of 1940, as amended. |
| | |
Exhibit 12(b) | | Certification required by Rule 30a-2(b) under the Investment Company Act of 1940, as amended. |