As filed with the Securities and Exchange Commission on November 2, 2023
UNITED STATES
SECURITIES AND EXCHANGE COMMISSION
Washington, D.C. 20549
FORM N-CSR
CERTIFIED SHAREHOLDER REPORT OF
REGISTERED MANAGEMENT INVESTMENT COMPANIES
Investment Company Act file number: 811-23761
NEUBERGER BERMAN ETF TRUST
(Exact Name of Registrant as specified in charter)
c/o Neuberger Berman Investment Advisers LLC
1290 Avenue of the Americas
New York, New York 10104-0002
(Address of Principal Executive Offices – Zip Code)
Joseph V. Amato
Chief Executive Officer and President
Neuberger Berman ETF Trust
c/o Neuberger Berman Investment Advisers LLC
1290 Avenue of the Americas
New York, New York 10104-0002
Lori L. Schneider, Esq.
K&L Gates LLP
1601 K Street, N.W.
Washington, D.C. 20006-1600
(Names and Addresses of agents for service)
Registrant’s telephone number, including area code: (212) 476-8800
Date of fiscal year end: August 31
Date of reporting period: August 31, 2023
Form N-CSR is to be used by management investment companies to file reports with the Commission not later than 10 days after the transmission to stockholders of any report that is required to be transmitted to stockholders under Rule 30e-1 under the Investment Company Act of 1940, as amended (“Act”) (17 CFR 270.30e-1). The Commission may use the information provided on Form N-CSR in its regulatory, disclosure review, inspection, and policymaking roles.
A registrant is required to disclose the information specified by Form N-CSR, and the Commission will make this information public. A registrant is not required to respond to the collection of information contained in Form N-CSR unless the Form displays a currently valid Office of Management and Budget (“OMB”) control number. Please direct comments concerning the accuracy of the information collection burden estimate and any suggestions for reducing the burden to Secretary, Securities and Exchange Commission, 100 F Street, NE, Washington, DC 20549-1090. The OMB has reviewed this collection of information under the clearance requirements of 44 U.S.C. § 3507.
Item 1. Report to Shareholders.
| (a) | Following is a copy of the annual report transmitted to shareholders pursuant to Rule 30e-1 under the Act. |

Neuberger Berman
ETF Trust
ETF Trust
Carbon Transition & Infrastructure ETF |
Commodity Strategy ETF |
Disrupters ETF |
Next Generation Connected Consumer ETF |

Annual Report
August 31, 2023

Contents
1 | |
2 | |
5 | |
9 | |
12 | |
17 | |
19 | |
20 | |
21 | |
22 | |
28 | |
30 | |
31 | |
33 | |
37 | |
53 | |
53 | |
53 | |
53 | |
56 | |
58 | |
59 | |
69 | |
69 | |
69 | |
70 |
The "Neuberger Berman" name and logo and "Neuberger Berman Investment Advisers LLC" name are registered service marks of Neuberger Berman Group LLC. The individual Fund names in this piece are either service marks or registered service marks of Neuberger Berman Group LLC or Neuberger Berman Investment Advisers LLC, an affiliate of Neuberger Berman BD LLC, distributor, member FINRA. ©2023 Neuberger Berman BD LLC, distributor. All rights reserved.
President’s Letter
Dear Shareholder,
We are pleased to present the annual shareholder report for the actively managed Neuberger Berman Exchange Traded Funds for the fiscal year ended August 31, 2023 (the reporting period).
The overall equity market was volatile at times but generated strong results during the reporting period. The market overcame a number of headwinds, including persistent inflation and aggressive central bank rate hikes; concerns that the economy may fall into a recession; issues in the regional banking industry; and several geopolitical events. However, despite some periodic setbacks the market moved higher overall. This was partially driven by a resilient economy, corporate earnings that often surpassed expectations, and hopes that the U.S. Federal Reserve Board would end its tightening cycle and orchestrate a soft landing for the economy.
In July 2023, the International Monetary Fund released its World Economic Outlook Update and projected global gross domestic product growth to decline from 3.5% in 2022 to 3.0% in 2023. According to the IMF, "The global recovery from the COVID-19 pandemic and Russia’s invasion of Ukraine is slowing amid widening divergences among economic sectors and regions…While the forecast for 2023 is modestly higher than predicted in the April 2023 World Economic Outlook, it remains weak by historical standards." The U.S. economy has been resilient, in part due to strength in the labor market. In contrast, some portions of the economy have showed signs of strain, including the manufacturing sector.
As we look ahead, we continue to see risks of an economic slowdown. As the tailwinds that supported the overall economy continue to fade, we believe the lagged impact of tighter monetary policy is set to intensify. Consequently, we anticipate U.S. growth to downshift and reconnect with the recessionary track it was on and lead to increasing volatility in the equity market.
In today’s uncertain market environment, we reaffirm our emphasis on investing in companies that we believe have higher earnings quality and defensive sectors in equities—and maintain our conviction in the power of the U.S. equity market to reliably convert risk into return over the long term.
Sincerely,

Joseph V. Amato
President and CEO
Neuberger Berman ETF Trust
President and CEO
Neuberger Berman ETF Trust
1
Carbon Transition & Infrastructure ETF Commentary (Unaudited)
Neuberger Berman Carbon Transition & Infrastructure ETF (the Fund) generated a 0.70% total return on a net asset value (NAV) basis for the fiscal year ended August 31, 2023 (the reporting period), versus the 13.95% total return of its benchmark, the MSCI All Country World Index (Net) (the Index), for the same period. (Fund performance on a market price basis is provided in the table immediately following this letter.)
The Fund seeks to maximize long-term returns by investing in companies we view as innovative with commercial impact in carbon transition and infrastructure. During the reporting period, the Index posted a double-digit return, while global clean-energy related businesses, as measured by the S&P Global Clean Energy Index, returned -26.84%. In this environment, the Fund generated a small positive gain. While there were many factors impacting the Fund’s performance during the reporting period, we believe our thematic portfolio remains well positioned for the longer-term.
At the sector level, trends were mixed during the reporting period. Materials and chemicals contributed favorably to the Fund and remain key areas of opportunity to us within the context of a long-term, globally diversified thematic portfolio. While Utilities and clean energy were unfavorably impacted by higher interest rates, our overweight in these carbon transition sectors versus the Index remains a key component of our mandate. Within the context of our long-term thematic strategy, we believe Utilities and the renewable producer’s industries remain opportunity rich and poised to benefit from carbon transition given powerful long-term electrification and clean energy tailwinds. Since the broad Information Technology sector is not a significant component of portfolio strategy and allocation by design, the portfolio’s end-of-reporting period 9.1% allocation to the sector was less than half that of the Index. Within the sector, where the Fund maintained a relative overweight to solar semiconductors and semiconductor equipment, positioning detracted from performance. We believe solar energy remains a significant area of long-term opportunity for the Fund.
Given our team’s experience investing in the carbon transition and infrastructure mega-theme, our team believes the overall carbon transition opportunity remains underappreciated. As the Fund continues to seek exposure to what we believe are fundamentally strong companies positioned to deliver attractive relative performance over the long term, we believe our competitive advantage is expressed via a disciplined process emphasizing both earnings quality and the appropriate balance of growth-oriented equities with lower beta1, defensive holdings.
Sincerely,
Timothy Creedon, Hari Ramanan, Ronald B. Silvestri, Jared Mann and James Tyre
Portfolio Managers
Portfolio Managers
1 Beta is a measure of the systematic risk of a portfolio. It is the covariance of the portfolio and a market index divided by the variance of the market index. Beta measures the historical sensitivity of a portfolio’s returns to movements in the market index. The beta of the market index will always be one. A portfolio with a beta above the market index (i.e. ˃1) means that the portfolio has greater volatility than the market index. If the beta of the portfolio is 1.2, a market increase in return of 1% implies a 1.2% increase in the portfolio’s return. If the beta of the portfolio is 0.8, a market decrease in return of 1% implies a 0.8% decrease in the portfolio’s return.
Information about principal risks of investing in the Fund is set forth in the prospectus and statement of additional information.
The portfolio composition, industries and holdings of the Fund are subject to change without notice.
The opinions expressed are those of the Fund’s portfolio managers. The opinions are as of the date of this report and are subject to change without notice.
2
Carbon Transition & Infrastructure ETF (Unaudited)
TICKER SYMBOL | |
Carbon Transition & Infrastructure ETF | NBCT |
SECTOR ALLOCATION | |
(as a % of Total Investments*) | |
Energy | 7.5 % |
Industrials | 33.5 |
Information Technology | 9.1 |
Materials | 13.3 |
Utilities | 31.1 |
Short-Term Investments | 5.5 |
Total | 100.0 % |
* | Derivatives (other than options purchased), if any, are excluded from this chart. |
PERFORMANCE HIGHLIGHTS1 | |||
Inception Date2 | Average Annual Total Return Ended 08/31/2023 | ||
1 Year | Life of Fund | ||
At NAV3 | |||
Carbon Transition & Infrastructure ETF | 04/06/2022 | 0.70% | -2.23% |
At Market Price4 | |||
Carbon Transition & Infrastructure ETF | 04/06/2022 | 0.56% | -2.01% |
Index | |||
MSCI All Country World Index (Net)5 | 13.95% | 0.14% | |
The performance data quoted represent past performance and do not indicate future results. The Fund has a limited performance history that should not be relied on. Past performance, particularly for brief periods of time, are not indicative of future returns. Current performance may be lower or higher than the performance data quoted. For current performance data, including current to the most recent month-end, please visit www.nb.com/ETF.
The results shown in the table reflect the reinvestment of income dividends and other distributions, if any. The results do not reflect the effect of taxes a shareholder would pay on Fund distributions or on the redemption of Fund shares.
The investment return and principal value of an investment will fluctuate and shares, when sold or redeemed, may be worth more or less than their original cost.
The Market Price is the official closing price as of the closing time of the NYSE Arca (typically 4 p.m., Eastern time). Net Asset Value ("NAV") is determined at the close of each business day and represents the dollar value of one share of the Fund. It is calculated by taking the total assets of the Fund, subtracting total liabilities, and dividing by the total number of shares outstanding. The NAV is not necessarily the same as the Fund's intraday trading value. Fund investors should not expect to buy or sell shares at NAV.
Returns would have been lower if Neuberger Berman Investment Advisers LLC ("NBIA") had not waived a portion of its management fee during the period shown. Please see Note B in the Notes to Financial Statements for specific information regarding the Fund’s management fee waiver arrangement.
As stated in the Fund’s most recent prospectus, the estimated total annual operating expense ratio for fiscal year 2022 was 0.65% (before the fee waiver). The estimated expense ratio was 0.55% after the fee waiver. The expense ratios for the annual period ended August 31, 2023, can be found in the Financial Highlights section of this report.
3
Carbon Transition & Infrastructure ETF (Unaudited)
COMPARISON OF A $10,000 INVESTMENT
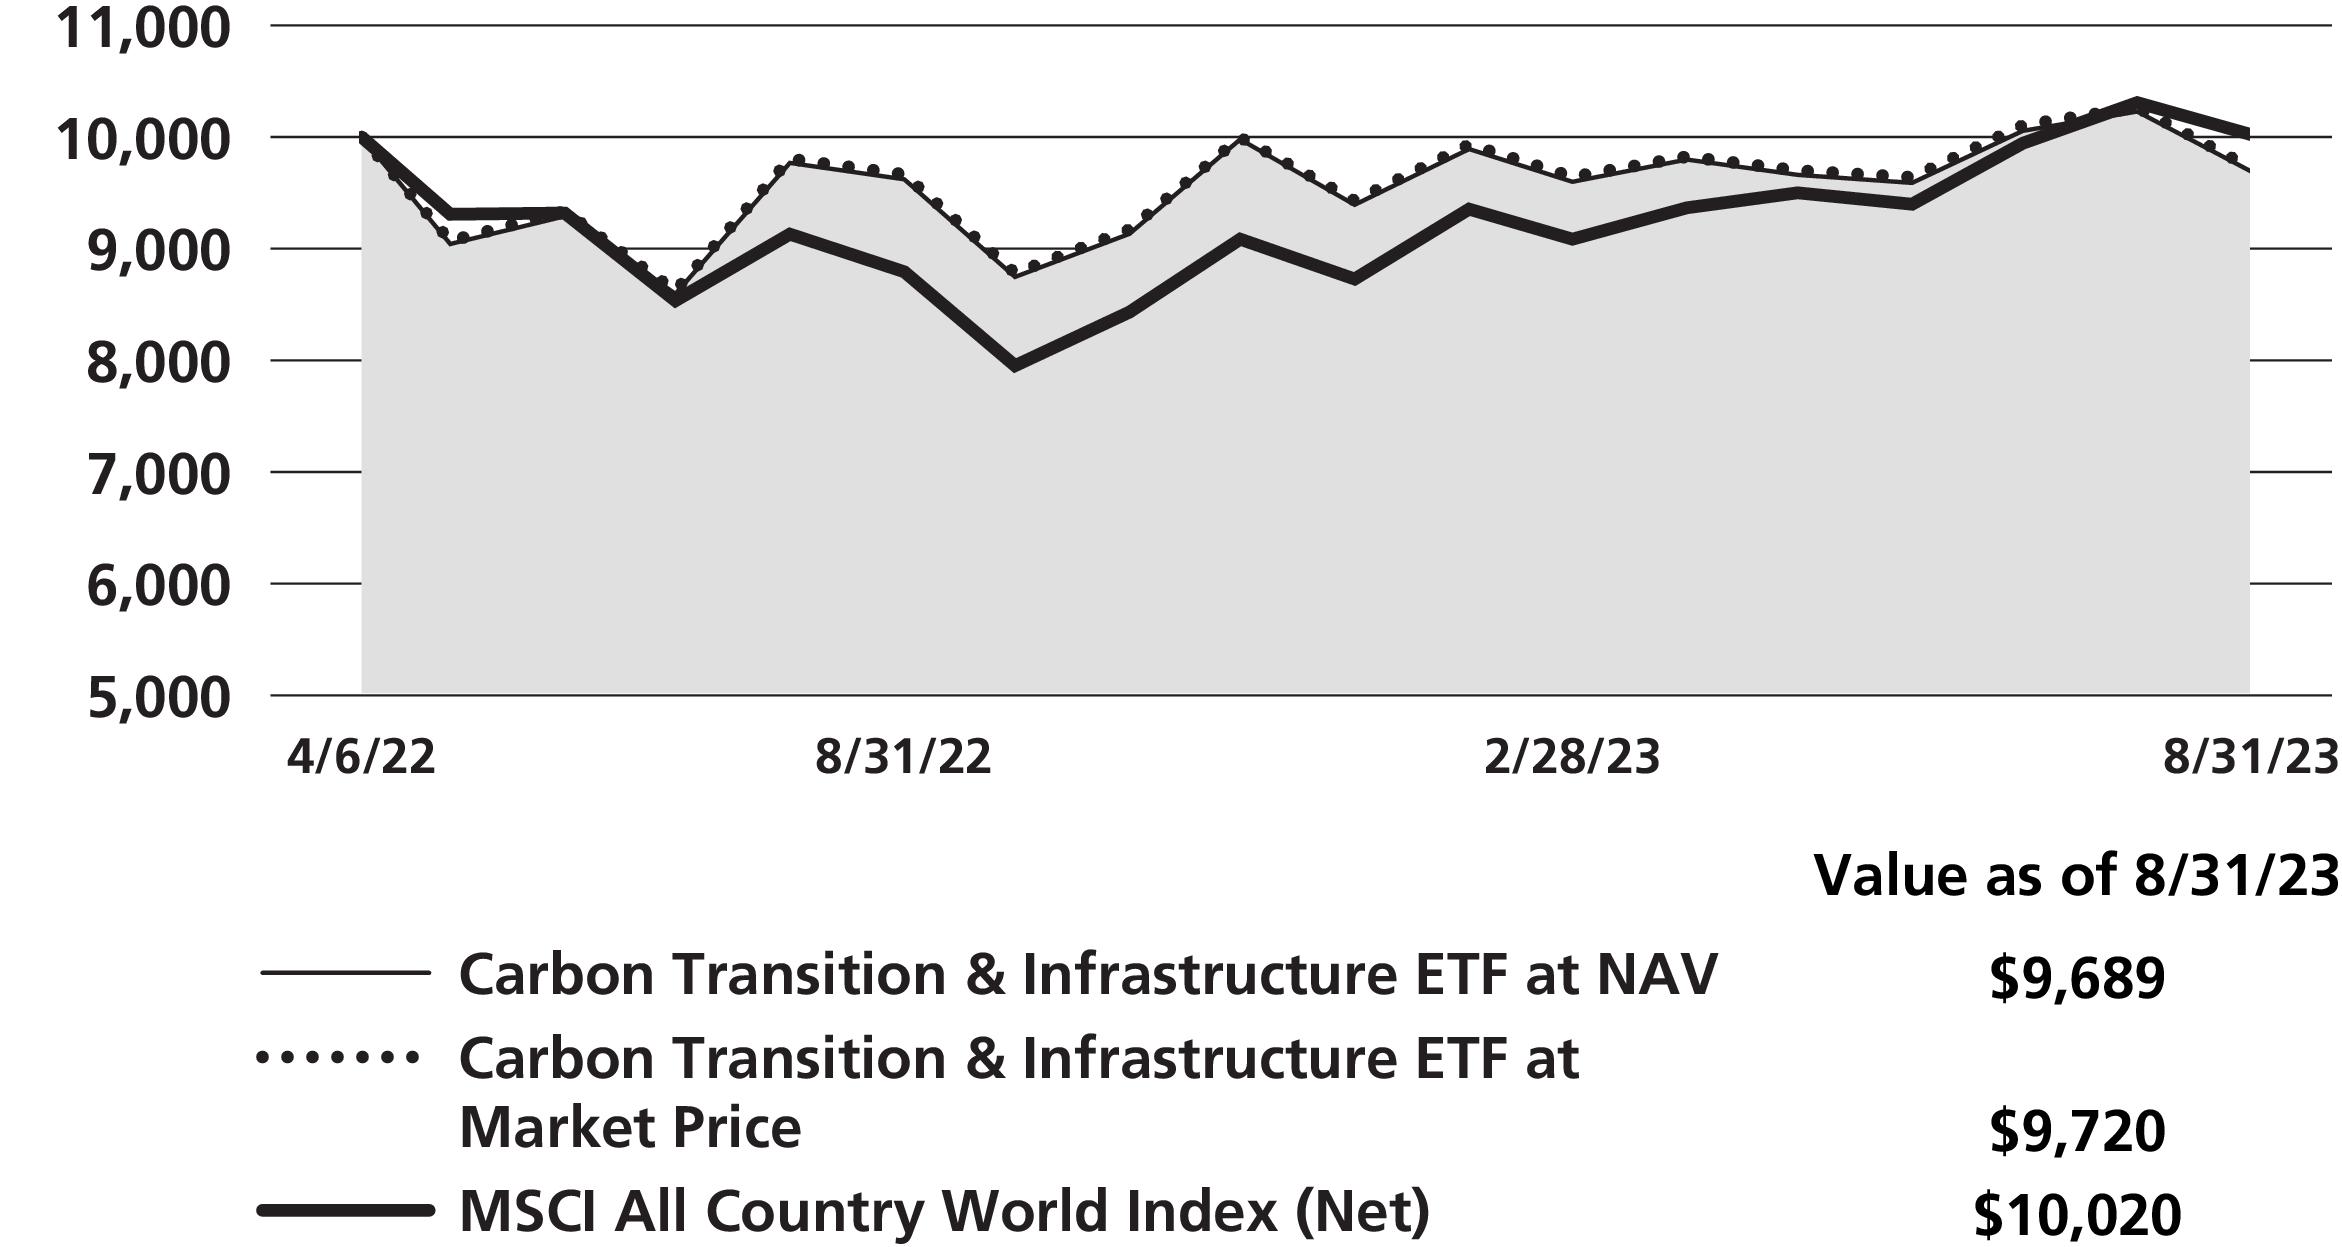
This graph shows the change in value of a hypothetical $10,000 investment in the Fund since the Fund’s inception. The graph is based on the Fund’s shares both at net asset value (NAV) and at market price. The Fund may trade at market prices above or below NAV per share (see Performance Highlights chart on previous page). The result is compared with a broad-based market index. Market indices have not been reduced to reflect any of the fees and costs of investing. The results shown in the graph reflect the reinvestment of income dividends and other distributions, if any. The results do not reflect the effect of taxes a shareholder would pay on Fund distributions or on the sale of Fund shares. Results represent past performance and do not indicate future results.
4
Commodity Strategy ETF* Commentary (Unaudited)
Neuberger Berman Commodity Strategy ETF (the Fund) generated a 0.25% total return on a net asset value (NAV) basis for the fiscal year ended August 31, 2023 (the reporting period), outperforming the -8.67% total return of its benchmark, the Bloomberg Commodity Index (the Index), for the same period. (Fund performance on a market price basis is provided in the table immediately following this letter.)
The overall U.S. equity market generated strong results during the reporting period. Investor sentiment was buoyed by the resilient economy, corporate earnings that often exceeded expectations, moderating inflation, and hopes that the U.S. Federal Reserve Board (Fed) was nearing the end of its rate hike cycle. However, commodities as a whole were weak given economic concerns and monetary policy tightening. Within the commodity market, soft commodities, precious metals, and livestock generated positive absolute returns, whereas energy and industrial metals declined, and agriculture was flat.
The Fund generated a small positive absolute return and significantly outperformed the Index. We seek to gain exposure to the commodity markets by investing, directly or indirectly, in futures contracts on individual commodities and other commodity-linked derivative instruments. The Fund’s tactical positioning detracted from performance during the reporting period.
Looking at the commodity sectors in which the Fund invests, relative to the Index, the Fund’s positioning in energy was additive for returns, driven predominately by an underweight in natural gas. This helped the Fund avoid a significant portion of natural gas’ roughly 75% decline during the reporting period. The Fund's positioning in soft commodities was beneficial, driven by an out-of-benchmark position in cocoa and an underweight in coffee versus the Index, which offset losses from an overweight in cotton. The Fund was negatively impacted by its overweight in the industrial metals sector. While we benefited from an overweight in lead, some of these gains were offset by our positioning in aluminum. The Fund’s precious metals exposure was a slight detractor, mainly due to an out-of-benchmark position in palladium. Within agricultural commodities, our overweight to corn was a headwind, which offset gains from an underweight in wheat. Within the livestock space, the Fund’s losses from an overweight in lean hogs offset gains from an out-of-benchmark position in feeder cattle.
Looking forward, our outlook for commodities is positive. On the macro and demand side, we believe the Fed's monetary tightening is likely nearing its end, alleviating headwinds for commodities. If the central bank halts rate hikes or changes guidance, we believe commodities, which were significantly impacted by uncertainty around a potential recession, can reap the benefits. From a supply perspective, we see limited downside risks and the potential for outperformance. Following OPEC+** production cuts in April 2023, the group met again in the beginning of June to announce further cuts. Meanwhile, unlike the past decade, shale patch producers are focused on capital discipline and return of capital rather than capital expenditures (capex). In our view, this helps limit downside risks. In the metals space, inventories remain tight, and we believe a potential for upside will depend on Chinese policy. If investors start pricing in a no-recession scenario, the focus could turn to the physical realities of commodity markets. Low inventories and inadequate multi-year capex deployment are resulting in insufficient supply, while government mandates for greener practices are boosting high demand. In summary, there is a growing consensus among economists that the long-awaited recession in developed markets may not occur or, if it does, it may be very shallow. In our view, this shift in consensus could be highly beneficial for commodity markets, especially as a hedge against what can happen in stocks and bonds.
Sincerely,
Hakan Kaya, David Yi Wan and Michael Foster
Portfolio Managers
Portfolio Managers
* Effective after the close of business on October 21, 2022, Neuberger Berman Commodity Strategy Fund was reorganized into an exchange-traded fund. Please refer to Note A of the Notes to Consolidated Financial Statements for additional, important information. For more information, call us at 800-877-9700, or visit www.nb.com/ETF.
5
** OPEC + refers to an alliance between the Organization of the Petroleum Exporting Countries (OPEC) and other oil-producing countries, including Russia, Kazakhstan, Azerbaijan, and others.
Information about principal risks of investing in the Fund is set forth in the prospectus and statement of additional information.
The portfolio composition, industries and holdings of the Fund are subject to change without notice.
The opinions expressed are those of the Fund’s portfolio managers. The opinions are as of the date of this report and are subject to change without notice.
6
Commodity Strategy ETF (Unaudited)
TICKER SYMBOL | |
Commodity Strategy ETF | NBCM |
PORTFOLIO BY INVESTMENT TYPE | |
(as a % of Total Net Assets) | |
Asset-Backed Securities | 17.6 % |
Corporate Bonds | 52.5 |
U.S. Government Agency Securities | 1.3 |
U.S. Treasury Obligations | 5.4 |
Short-Term Investments | 14.5 |
Other Assets Less Liabilities | 8.7 * |
Total | 100.0 % |
* | Includes the impact of the Fund’s open positions in derivatives (other than options purchased), if any. |
PORTFOLIO BY TYPE OF COMMODITY FUTURE | |
(as a % of Total Notional Value) | |
Commodity Futures: | |
Agriculture | 18.2 % |
Energy | 32.8 |
Industrial Metals | 16.2 |
Livestock | 7.8 |
Precious Metals | 18.6 |
Softs | 6.4 |
Total | 100.0 % |
PERFORMANCE HIGHLIGHTS1 | |||||
Inception Date2 | Average Annual Total Return Ended 08/31/2023 | ||||
1 Year | 5 Years | 10 Years | Life of Fund | ||
At NAV3 | |||||
Commodity Strategy ETF | 08/27/2012 | 0.25% | 8.28% | 0.51% | -0.27% |
At Market Price4 | |||||
Commodity Strategy ETF | 08/27/2012 | 0.42% | 8.32% | 0.53% | -0.26% |
Index | |||||
Bloomberg Commodity Index5 | -8.67% | 6.68% | -0.93% | -1.81% | |
The performance data quoted represent past performance and do not indicate future results. Current performance may be lower or higher than the performance data quoted. For current performance data, including current to the most recent month-end, please visit www.nb.com/ETF.
The results shown in the table reflect the reinvestment of income dividends and other distributions, if any. The results do not reflect the effect of taxes a shareholder would pay on Fund distributions or on the redemption of Fund shares.
The investment return and principal value of an investment will fluctuate and shares, when sold or redeemed, may be worth more or less than their original cost.
The Market Price is the official closing price as of the closing time of the NYSE Arca (typically 4 p.m., Eastern time). Net Asset Value ("NAV") is determined at the close of each business day and represents the dollar value of one share of the Fund. It is calculated by taking the total assets of the Fund, subtracting total liabilities, and dividing by the total number of shares outstanding. The NAV is not necessarily the same as the Fund's intraday trading value. Fund investors should not expect to buy or sell shares at NAV.
Returns would have been lower if Neuberger Berman Investment Advisers LLC ("NBIA") had not reimbursed certain expenses and/or waived a portion of the investment management fees during certain of the periods shown. Please see Note B in the Notes to Consolidated Financial Statements for specific information regarding the Fund’s expense reimbursement and/or fee waiver arrangements.
As stated in the Fund’s most recent prospectus, the estimated total annual operating expense ratio for fiscal year 2022 was 0.79% (before expense reimbursements and/or fee waivers, if any). The estimated expense ratio was 0.65% after expense reimbursements and/or fee waivers. The expense ratios for the annual period ended August 31, 2023, can be found in the Financial Highlights section of this report.
7
Commodity Strategy ETF (Unaudited)
COMPARISON OF A $10,000 INVESTMENT

This graph shows the change in value of a hypothetical $10,000 investment in the Fund since the Fund’s inception. The graph is based on the Fund’s shares both at net asset value (NAV) and at market price. The Fund may trade at market prices above or below NAV per share (see Performance Highlights chart on previous page). The result is compared with a broad-based market index. Market indices have not been reduced to reflect any of the fees and costs of investing. The results shown in the graph reflect the reinvestment of income dividends and other distributions, if any. The results do not reflect the effect of taxes a shareholder would pay on Fund distributions or on the sale of Fund shares. Results represent past performance and do not indicate future results.
8
Disrupters ETF Commentary (Unaudited)
Neuberger Berman Disrupters ETF (the Fund) generated a 19.77% total return on a net asset value (NAV) basis for the fiscal year ended August 31, 2023 (the reporting period), underperforming the 21.94% total return of its benchmark, the Russell 1000® Growth Index (the Index), for the same period. (Fund performance on a market price basis is provided in the table immediately following this letter.)
The overall U.S. equity market generated strong results during the reporting period. Investor sentiment was buoyed by the resilient economy, corporate earnings that often exceeded expectations, moderating inflation, and hopes that the U.S. Federal Reserve Board (Fed) was nearing the end of its rate hike cycle. These factors offset concerns that interest rates may be "higher for longer," fears that Fed monetary tightening could push the economy into a recession, and numerous geopolitical issues.
The Fund’s underperformance was driven by security selection and sector allocation. Looking at stock selection, within the Communication Services sector, our Interactive Media & Services stocks detracted the most from returns. Within Health Care, our Health Care Equipment & Supplies stocks were a drag on performance. Individual stocks that detracted from performance included ZoomInfo Technologies, Inc., Tesla, Inc. and Axonics, Inc., the latter of which was sold during the reporting period. On the upside, the Industrials sector was the largest contributor to relative results, driven by our Ground Transportation position. Within the Information Technology sector, our Software holdings added the most value. Individual stocks that added the most value included NVIDIA Corp., Eli Lilly & Company, and ASML Holding.
In terms of sector allocation, an overweight to Health Care and an underweight to Communication Services versus the Index were the largest detractors from relative returns. Conversely, lack of exposure to the Consumer Staples and Real Estate sectors were the largest contributors to results.
We maintain a cautious outlook at this point, realizing that the great debate vis-à-vis recession risk is not apt to abate any time soon. The scrutiny of the risk has clearly shifted to the ramifications of the $800 billion increase to the budget deficit this year, and the fact that the Fed in March 2023 prioritized avoiding any semblance of a systemic crisis during the demise of Silicon Valley Bank by increasing its balance sheet by $400 billion over a three-week period. Indeed, the summer sell-off in government bonds, with the 10-year U.S. Treasury rate breaking through the 4% level yet again, has created fears the recession risk only got delayed. An enduring "wild card" is the unemployment rate, currently at 3.8% at the end of the reporting period, a level historically inherently inflationary, and likely incompatible with the Fed’s inflation target of 2%. Perhaps the resolution will come from whether the U.S. consumer can finesse the current transition to having drained its household excess savings, while facing both significantly higher energy costs and, for 44 million Americans, an October 2023 return to student loan payments after a three-year hiatus.
As we have written before, current economic uncertainty underpins our commitment to investments that we believe have high free cash flow, demonstrated capital allocation discipline and organic growth. To that end, we consciously avoid any significant exposure to companies without a viable path, and within a short time horizon, to generation of that free cash flow. Our Fund consists entirely of companies that we believe combine a competitive advantage, market share gains and high-quality management teams.
Sincerely,
Richard Bradt and Jason Tauber
Portfolio Managers
Portfolio Managers
Information about principal risks of investing in the Fund is set forth in the prospectus and statement of additional information.
The portfolio composition, industries and holdings of the Fund are subject to change without notice.
The opinions expressed are those of the Fund’s portfolio managers. The opinions are as of the date of this report and are subject to change without notice.
9
Disrupters ETF (Unaudited)
TICKER SYMBOL | |
Disrupters ETF | NBDS |
SECTOR ALLOCATION | |
(as a % of Total Investments*) | |
Communication Services | 4.1 % |
Consumer Discretionary | 9.9 |
Financials | 4.4 |
Health Care | 22.3 |
Industrials | 10.8 |
Information Technology | 46.7 |
Short-Term Investments | 1.8 |
Total | 100.0 % |
* | Derivatives (other than options purchased), if any, are excluded from this chart. |
PERFORMANCE HIGHLIGHTS1 | |||
Inception Date2 | Average Annual Total Return Ended 08/31/2023 | ||
1 Year | Life of Fund | ||
At NAV3 | |||
Disrupters ETF | 04/06/2022 | 19.77% | -2.23% |
At Market Price4 | |||
Disrupters ETF | 04/06/2022 | 19.73% | -2.14% |
Index | |||
Russell 1000® Growth Index5 | 21.94% | 3.65% | |
The performance data quoted represent past performance and do not indicate future results. The Fund has a limited performance history that should not be relied on. Past performance, particularly for brief periods of time, are not indicative of future returns. Current performance may be lower or higher than the performance data quoted. For current performance data, including current to the most recent month-end, please visit www.nb.com/ETF.
The results shown in the table reflect the reinvestment of income dividends and other distributions, if any. The results do not reflect the effect of taxes a shareholder would pay on Fund distributions or on the redemption of Fund shares.
The investment return and principal value of an investment will fluctuate and shares, when sold or redeemed, may be worth more or less than their original cost.
The Market Price is the official closing price as of the closing time of the NYSE Arca (typically 4 p.m., Eastern time). Net Asset Value ("NAV") is determined at the close of each business day and represents the dollar value of one share of the Fund. It is calculated by taking the total assets of the Fund, subtracting total liabilities, and dividing by the total number of shares outstanding. The NAV is not necessarily the same as the Fund's intraday trading value. Fund investors should not expect to buy or sell shares at NAV.
Returns would have been lower if Neuberger Berman Investment Advisers LLC ("NBIA") had not waived a portion of its management fee during the period shown. Please see Note B in the Notes to Financial Statements for specific information regarding the Fund’s management fee waiver arrangement.
As stated in the Fund’s most recent prospectus, the estimated total annual operating expense ratio for fiscal year 2022 was 0.65% (before the fee waiver). The estimated expense ratio was 0.55% after the fee waiver. The expense ratios for the annual period ended August 31, 2023, can be found in the Financial Highlights section of this report.
10
Disrupters ETF (Unaudited)
COMPARISON OF A $10,000 INVESTMENT

This graph shows the change in value of a hypothetical $10,000 investment in the Fund since the Fund’s inception. The graph is based on the Fund’s shares both at net asset value (NAV) and at market price. The Fund may trade at market prices above or below NAV per share (see Performance Highlights chart on previous page). The result is compared with a broad-based market index. Market indices have not been reduced to reflect any of the fees and costs of investing. The results shown in the graph reflect the reinvestment of income dividends and other distributions, if any. The results do not reflect the effect of taxes a shareholder would pay on Fund distributions or on the sale of Fund shares. Results represent past performance and do not indicate future results.
11
Next Generation Connected Consumer ETF Commentary (Unaudited)
Neuberger Berman Next Generation Connected Consumer ETF (the Fund) generated a 13.08% total return on a net asset value (NAV) basis for the fiscal year ended August 31, 2023 (the reporting period), underperforming the 13.95% total return of its benchmark, the MSCI All Country World Index (Net) (the Index), for the same period. (Fund performance on a market price basis is provided in the table immediately following this letter.)
The global equity market generated strong results during the reporting period. Investor sentiment was buoyed by the resilient economy, corporate earnings that often exceeded expectations, and moderating inflation. These factors helped to offset concerns that interest rates may be "higher for longer," fears that central bank monetary tightening could push the global economy into a recession, and numerous geopolitical issues. All told, the Index returned 13.95% for the reporting period.
The Fund utilizes data science to identify what we believe to be broad shifts in consumer behavior and those issuers best positioned to capitalize on these trends. Furthermore, these capabilities are critical to recognizing nascent generational consumption patterns with the potential to emerge as megatrends. With an emphasis on seeking long-term capital appreciation, the Fund employs these insights to inform both sector allocation and stock selection.
In comparison to the Index, a lower allocation to Information Technology versus the Index negatively impacted relative returns, while overweights to Consumer Discretionary and Consumer Staples were also headwinds for returns. Conversely, a lack of exposure to Utilities and Real Estate benefited returns, as they both lagged the Index. Given the connected consumer theme, the strategy inherently favors sectors that carry thematic relevance, such as Consumer Discretionary, Consumer Staples and Communication Services.
Stock selection, in our view, contributed meaningfully to Fund performance during the reporting period. Notably, holdings in the Consumer Discretionary sector contributed the most to performance, driven by our Hotels, Restaurants & Leisure stocks. Additionally, our position in the Health Care Equipment & Supplies industry within the Health Care sector added value. On the downside, holdings in the Communication Services sector detracted the most from relative performance, driven by our Interactive Media & Services holdings. The Financials sector was also a headwind for results, driven by our positions in the Insurance industry.
Millennials and Gen Z are poised to dramatically reshape the economy, initiating a significant shift in financial dynamics over the coming decades, as these groups redefine global demographics and transition into new stages of life. These generations display unique behaviors, primarily because they are the first to be fully immersed in the digital era. Moreover, their highly connected lifestyles produce data trails that we believe allow for a systematic approach to turn this data into enduring investment insights. We concentrate on data that unveils the attitudes and actions of these emerging consumers, which, in our opinion, provides a preliminary glimpse into forthcoming spending trends before they become widely recognized. We believe that this investment opportunity and our strategy to harness it positions us for attractive long-term returns.
We believe identifying investment prospects that coincide with long-term themes, have solid business models, and possess underestimated earnings potential will help maximize long-term returns. We believe our emphasis on this extended thematic opportunity will position the Fund to capitalize on the most dominant megatrends.
Sincerely,
Timothy Creedon, Hari Ramanan, Kai Cui, Kevin McCarthy, and John San Marco
Portfolio Managers
Portfolio Managers
Information about principal risks of investing in the Fund is set forth in the prospectus and statement of additional information.
The portfolio composition, industries and holdings of the Fund are subject to change without notice.
The opinions expressed are those of the Fund’s portfolio managers. The opinions are as of the date of this report and are subject to change without notice.
12
Next Generation Connected Consumer ETF (Unaudited)
TICKER SYMBOL | |
Next Generation Connected Consumer ETF | NBCC |
SECTOR ALLOCATION | |
(as a % of Total Investments*) | |
Communication Services | 14.2 % |
Consumer Discretionary | 49.4 |
Consumer Staples | 17.0 |
Financials | 6.3 |
Health Care | 6.0 |
Information Technology | 3.5 |
Short-Term Investments | 3.6 |
Total | 100.0 % |
* | Derivatives (other than options purchased), if any, are excluded from this chart. |
PERFORMANCE HIGHLIGHTS1 | |||
Inception Date2 | Average Annual Total Return Ended 08/31/2023 | ||
1 Year | Life of Fund | ||
At NAV3 | |||
Next Generation Connected Consumer ETF | 04/06/2022 | 13.08% | -7.65% |
At Market Price4 | |||
Next Generation Connected Consumer ETF | 04/06/2022 | 12.97% | -7.30% |
Index | |||
MSCI All Country World Index (Net)5 | 13.95% | 0.14% | |
The performance data quoted represent past performance and do not indicate future results. The Fund has a limited performance history that should not be relied on. Past performance, particularly for brief periods of time, are not indicative of future returns. Current performance may be lower or higher than the performance data quoted. For current performance data, including current to the most recent month-end, please visit www.nb.com/ETF.
The results shown in the table reflect the reinvestment of income dividends and other distributions, if any. The results do not reflect the effect of taxes a shareholder would pay on Fund distributions or on the redemption of Fund shares.
The investment return and principal value of an investment will fluctuate and shares, when sold or redeemed, may be worth more or less than their original cost.
The Market Price is the official closing price as of the closing time of the NYSE Arca (typically 4 p.m., Eastern time). Net Asset Value ("NAV") is determined at the close of each business day and represents the dollar value of one share of the Fund. It is calculated by taking the total assets of the Fund, subtracting total liabilities, and dividing by the total number of shares outstanding. The NAV is not necessarily the same as the Fund's intraday trading value. Fund investors should not expect to buy or sell shares at NAV.
Returns would have been lower if Neuberger Berman Investment Advisers LLC ("NBIA") had not waived a portion of its management fee during the period shown. Please see Note B in the Notes to Financial Statements for specific information regarding the Fund’s management fee waiver arrangement.
As stated in the Fund’s most recent prospectus, the estimated total annual operating expense ratio for fiscal year 2022 was 0.65% (before the fee waiver). The estimated expense ratio was 0.55% after the fee waiver. The expense ratios for the annual period ended August 31, 2023, can be found in the Financial Highlights section of this report.
13
Next Generation Connected Consumer ETF (Unaudited)
COMPARISON OF A $10,000 INVESTMENT
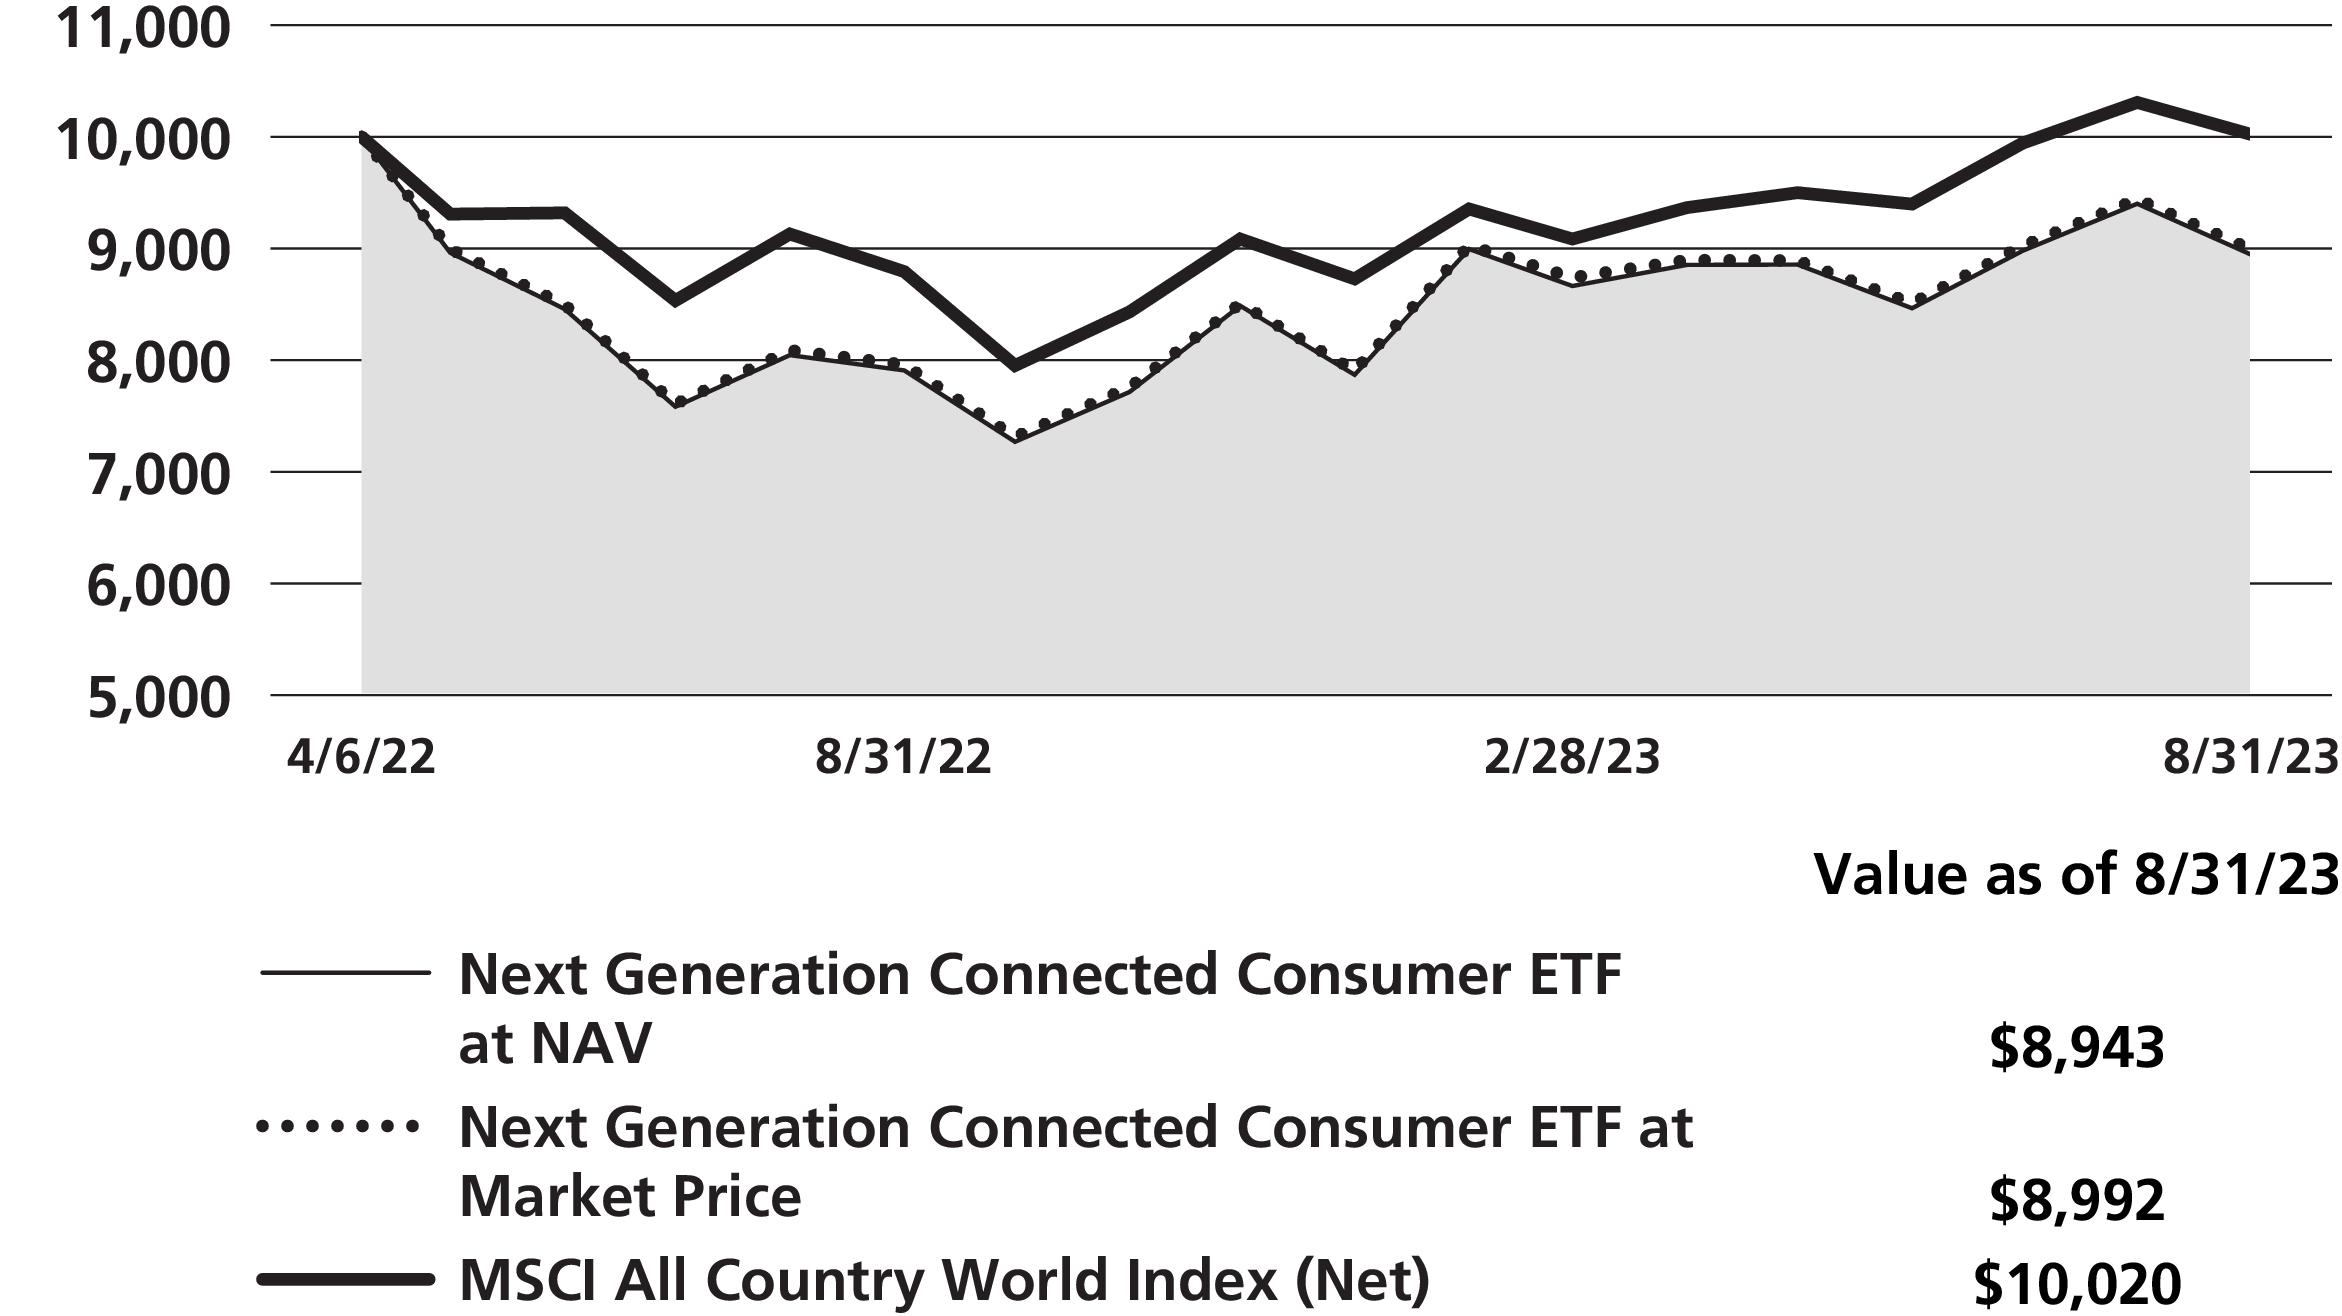
This graph shows the change in value of a hypothetical $10,000 investment in the Fund since the Fund’s inception. The graph is based on the Fund’s shares both at net asset value (NAV) and at market price. The Fund may trade at market prices above or below NAV per share (see Performance Highlights chart on previous page). The result is compared with a broad-based market index. Market indices have not been reduced to reflect any of the fees and costs of investing. The results shown in the graph reflect the reinvestment of income dividends and other distributions, if any. The results do not reflect the effect of taxes a shareholder would pay on Fund distributions or on the sale of Fund shares. Results represent past performance and do not indicate future results.
14
Endnotes (Unaudited)
1 | Unlike mutual funds, ETF shares are purchased and sold in secondary market transactions at negotiated market prices rather than at NAV and as such ETFs may trade at a premium or discount to their NAV. As a result, shareholders of the Fund may pay more than NAV when purchasing shares and receive less than NAV when selling Fund shares. ETF shares may only be redeemed at NAV by authorized participants in large creation units. There can be no guarantee that an active trading market for shares will develop or be maintained or that the Fund’s shares will continue to be listed. The trading of shares may incur brokerage commissions. The Fund has a limited number of Authorized Participants. To the extent they exit the business or are otherwise unable to proceed in creation and redemption transactions with the Fund and no other Authorized Participant is able to step forward to create or redeem, shares of the Fund may be more likely to trade at a premium or discount to NAV and possible face trading halts or delisting. Unexpected episodes of illiquidity, including due to market factors, instrument or issuer-specific factors and/or unanticipated outflows, could have a significant negative impact on the Fund’s NAV, liquidity, and brokerage costs. To the extent the Fund’s investments trade in markets that are closed when the Fund is open, premiums or discounts to NAV may develop in share prices. |
2 | Represents the first listing date of the ETF on the NYSE Arca for Carbon Transition & Infrastructure ETF, Disrupters ETF and Next Generation Connected Consumer ETF and represents the inception date of the Predecessor Fund (as defined in the next sentence) for Commodity Strategy ETF. Prior to the close of business on October 21, 2022, the ETF operated as Neuberger Berman Commodity Strategy Fund, an open-end mutual fund (the "Predecessor Fund"). The ETF has the same investment objective, strategy, restrictions and portfolio managers as the Predecessor Fund. Prior to the ETF's listing on October 24, 2022, the Institutional Class share NAVs of the Predecessor Fund are used to represent both the NAV and market price return history of the ETF. Please refer to Note A of the Notes to Consolidated Financial Statements for additional, important information. |
3 | Returns based on the net asset value ("NAV") of the Fund. |
4 | Returns based on the market price of shares on the NYSE Arca. |
5 | Please see "Glossary of Indices" on page 16 for a description of indices. Please note that individuals cannot invest directly in any index. The indices described in this report do not take into account any fees, expenses or tax consequences of investing in the individual securities that they track. Data about the performance of an index are prepared or obtained by Neuberger Berman Investment Advisers LLC ("NBIA") and reflect the reinvestment of income dividends and other distributions, if any. The Fund may invest in securities not included in a described index and generally does not invest in all securities included in a described index. |
For more complete information on any of the Neuberger Berman ETFs, call us at (877) 628-2583, or visit our website at www.nb.com/ETF.
15
Glossary of Indices (Unaudited)
Bloomberg Commodity Index: | The index is a rolling index composed of exchange-traded futures contracts on physical commodities. The index relies primarily on liquidity data of futures contracts, along with U.S. dollar-adjusted production data, in determining the relative quantities of included commodities. The index is designed to be a highly liquid and diversified benchmark for commodities investments. The version of the index that is calculated on a total return basis reflects the returns on a fully collateralized investment in the underlying commodity futures contracts, combined with the returns on cash collateral invested in U.S. Treasury Bills. |
MSCI All Country World Index (Net): | The index is a free float-adjusted, market capitalization-weighted index that is designed to measure the equity market performance of developed and emerging markets. The index consists of 47 country indexes comprising 23 developed and 24 emerging market country indexes. The developed market country indexes included are: Australia, Austria, Belgium, Canada, Denmark, Finland, France, Germany, Hong Kong, Ireland, Israel, Italy, Japan, the Netherlands, New Zealand, Norway, Portugal, Singapore, Spain, Sweden, Switzerland, the United Kingdom and the United States. The emerging market country indexes included are: Brazil, Chile, China, Colombia, the Czech Republic, Egypt, Greece, Hungary, India, Indonesia, Korea, Kuwait, Malaysia, Mexico, Peru, the Philippines, Poland, Qatar, Saudi Arabia, South Africa, Taiwan, Thailand, Turkey, and the UAE. China A shares are included starting from June 1, 2018 and are partially represented at 20% of their free float-adjusted market capitalization as of November 2019. Effective after the close on March 9, 2022, MSCI reclassified MSCI Russia Indexes from Emerging Markets to Standalone Markets status. At that time, all Russian securities were removed from this index at a final price of 0.00001, including both locally traded Russian equity constituents and Russian ADRs/GDRs constituents. Net total return indexes reinvest dividends after the deduction of withholding taxes, using (for international indexes) a tax rate applicable to non-resident institutional investors who do not benefit from double taxation treaties. |
Russell 1000® Index: | The index is a float-adjusted, market capitalization-weighted index that measures the performance of the large-cap segment of the U.S. equity market. It includes approximately 1,000 of the largest securities in the Russell 3000® Index (which measures the performance of the 3,000 largest U.S. public companies based on total market capitalization). The index is rebalanced annually in June. |
Russell 1000® Growth Index: | The index is a float-adjusted, market capitalization-weighted index that measures the performance of the large-cap growth segment of the U.S. equity market. It includes those Russell 1000 Index companies with higher price-to-book ratios and higher forecasted growth rates. The index is rebalanced annually in June. |
16
Information About Your Fund’s Expenses (Unaudited)
As a Fund shareholder, you incur two types of costs: (1) transaction costs, including brokerage commissions on purchases and sales of your Fund shares; and (2) ongoing costs, including management fees, distribution and/or service (12b-1) fees (if applicable), and other Fund expenses. This example is intended to help you understand your ongoing costs (in U.S. dollars) of investing in a Fund and compare these costs with the ongoing costs of investing in other funds.
This table is designed to provide information regarding costs related to your investments. The following examples are based on an investment of $1,000 made at the beginning of the six month period ended August 31, 2023 and held for the entire period. The table illustrates each Fund’s costs in two ways:
Actual Expenses and Performance: | The first section of the table provides information about actual account values and actual expenses in dollars, based on the Fund’s actual performance during the period indicated. You may use the information in this line, together with the amount you invested, to estimate the expenses you paid over the period. Simply divide your account value by $1,000 (for example, an $8,600 account value divided by $1,000 = 8.6), then multiply the result by the number in the first section of the table under the heading entitled "Expenses Paid During the Period" to estimate the expenses you paid over the period. |
Hypothetical Example for Comparison Purposes: | The second section of the table provides information about hypothetical account values and hypothetical expenses based on the Fund’s actual expense ratio and an assumed rate of return at 5% per year before expenses. This return is not the Fund’s actual return. The hypothetical account values and expenses may not be used to estimate the actual ending account balance or expenses you paid for the period. You may use this information to compare the ongoing costs of investing in a Fund versus other funds. To do so, compare the expenses shown in this 5% hypothetical example with the 5% hypothetical examples that appear in the shareholder reports of other funds. |
Please note that the expenses in the table are meant to highlight your ongoing costs only and do not include any transaction costs, such as brokerage commissions on purchases and sales of your Fund shares. Therefore, the information under the heading "Hypothetical (5% annual return before expenses)" is useful in comparing ongoing costs only, and will not help you determine the relative total costs of owning different funds. In addition, if these transaction costs were included, your costs would have been higher.
17
Expense Example (Unaudited)
Neuberger Berman ETF Trust
ACTUAL | HYPOTHETICAL (5% ANNUAL RETURN BEFORE EXPENSES) | |||||||
Beginning Account Value 3/1/23 | Ending Account Value 8/31/23 | Expenses Paid During the Period (1) 3/1/23 – 8/31/23 | Expense Ratio | Beginning Account Value 3/1/23 | Ending Account Value 8/31/23 | Expenses Paid During the Period(2) 3/1/23 – 8/31/23 | Expense Ratio | |
Carbon Transition & Infrastructure ETF | $1,000.00 | $1,009.40 | $2.79 | 0.55% | $1,000.00 | $1,022.43 | $2.80 | 0.55% |
Commodity Strategy ETF | $1,000.00 | $1,025.00 | $3.27(3) | 0.64% | $1,000.00 | $1,021.98 | $3.26(3) | 0.64% |
Disrupters ETF | $1,000.00 | $1,177.00 | $3.02 | 0.55% | $1,000.00 | $1,022.43 | $2.80 | 0.55% |
Next Generation Connected Consumer ETF | $1,000.00 | $1,032.20 | $2.82 | 0.55% | $1,000.00 | $1,022.43 | $2.80 | 0.55% |
(1) | Expenses are equal to the annualized expense ratio, multiplied by the average account value over the period, multiplied by 184/365 (to reflect the one-half year period shown). |
(2) | Hypothetical expenses are equal to the annualized expense ratio multiplied by the average account value over the period (assuming a 5% annual return), multiplied by 184/365 (to reflect the one-half year period shown). |
(3) | Included the expenses of the Fund's subsidiary (See Note A of the Notes to Consolidated Financial Statements). |
18
Legend August 31, 2023 (Unaudited)
Neuberger Berman ETF Trust
Benchmarks: | |
LIBOR | = London Interbank Offered Rate |
SOFR | = Secured Overnight Financing Rate |
Counterparties: | |
SSB | = State Street Bank and Trust Company |
Other Abbreviations: | |
Management or NBIA | = Neuberger Berman Investment Advisers LLC |
Currency Abbreviations: | |
USD | = United States Dollar |
19
Schedule of Investments Carbon Transition & Infrastructure ETF^
August 31, 2023
August 31, 2023
Number of Shares | Value | |
Common Stocks 95.2% | ||
Building Products 1.8% | ||
7,854 | Johnson Controls International PLC | $463,857 |
Chemicals 10.5% | ||
1,598 | Air Products & Chemicals, Inc. | 472,193 |
3,610 | Linde PLC | 1,397,214 |
2,772 | Sika AG | 785,769 |
2,655,176 | ||
Commercial Services & Supplies 2.0% | ||
3,780 | Waste Connections, Inc. | 518,211 |
Construction & Engineering 2.9% | ||
3,490 | Quanta Services, Inc. | 732,446 |
Construction Materials 2.9% | ||
12,910 | CRH PLC | 742,979 |
Electric Utilities 17.2% | ||
4,158 | Acciona SA | 594,476 |
7,937 | Constellation Energy Corp. | 826,718 |
3,259 | Duke Energy Corp. | 289,399 |
8,063 | Exelon Corp. | 323,488 |
10,156 | FirstEnergy Corp. | 366,327 |
54,305 | Iberdrola SA | 645,387 |
15,593 | NextEra Energy, Inc. | 1,041,612 |
4,242 | Orsted AS(a) | 273,106 |
4,360,513 | ||
Electrical Equipment 21.9% | ||
28,182 | ABB Ltd. | 1,074,831 |
1,390 | Accelleron Industries AG | 37,608 |
5,082 | Eaton Corp. PLC | 1,170,740 |
1,134 | Generac Holdings, Inc.* | 134,730 |
2,772 | Hubbell, Inc. | 903,811 |
30,072 | Nordex SE* | 360,162 |
12,769 | Plug Power, Inc.*(b) | 108,026 |
4,620 | Schneider Electric SE | 794,438 |
16,968 | Sunrun, Inc.* | 265,210 |
30,196 | Vestas Wind Systems AS* | 698,456 |
5,548,012 | ||
Electronic Equipment, Instruments & Components 2.6% | ||
9,870 | Itron, Inc.* | 675,207 |
Independent Power and Renewable Electricity Producers 7.8% | ||
15,078 | Atlantica Sustainable Infrastructure PLC | 338,501 |
11,171 | NextEra Energy Partners LP | 557,210 |
Number of Shares | Value | |
Independent Power and Renewable Electricity Producers – cont'd | ||
6,594 | Ormat Technologies, Inc. | $500,748 |
41,755 | Sunnova Energy International, Inc.*(b) | 580,812 |
1,977,271 | ||
Machinery 1.1% | ||
1,512 | Chart Industries, Inc.* | 273,037 |
Multi-Utilities 6.3% | ||
17,052 | CenterPoint Energy, Inc. | 475,580 |
6,132 | Dominion Energy, Inc. | 297,647 |
31,177 | National Grid PLC | 391,080 |
6,294 | Sempra | 441,965 |
1,606,272 | ||
Oil, Gas & Consumable Fuels 7.6% | ||
5,586 | Cheniere Energy, Inc. | 911,635 |
4,830 | DT Midstream, Inc. | 252,561 |
21,910 | Williams Cos., Inc. | 756,552 |
1,920,748 | ||
Professional Services 4.1% | ||
11,214 | Arcadis NV | 525,794 |
3,780 | Jacobs Solutions, Inc. | 509,620 |
1,035,414 | ||
Semiconductors & Semiconductor Equipment 6.5% | ||
18,310 | Canadian Solar, Inc.*(b) | 512,863 |
3,282 | Enphase Energy, Inc.* | 415,272 |
3,810 | First Solar, Inc.* | 720,547 |
1,648,682 | ||
Total Common Stocks (Cost $25,015,360) | 24,157,825 | |
Short-Term Investments 5.6% | ||
Investment Companies 5.6% | ||
318,543 | State Street Institutional U.S. Government Money Market Fund Premier Class, 5.28%(c) | 318,543 |
1,088,609 | State Street Navigator Securities Lending Government Money Market Portfolio, 5.34%(c)(d) | 1,088,609 |
Total Short-Term Investments (Cost $1,407,152) | 1,407,152 | |
Total Investments 100.8% (Cost $26,422,512) | 25,564,977 | |
Liabilities Less Other Assets (0.8)% | (194,887 ) | |
Net Assets 100.0% | $25,370,090 | |
* | Non-income producing security. |
See Notes to Financial Statements
20
Schedule of Investments Carbon Transition & Infrastructure ETF^ (cont’d)
(a) | Security exempt from registration pursuant to Regulation S under the Securities Act of 1933, as amended. Regulation S applies to securities offerings that are made outside of the United States and do not involve directed selling efforts in the United States and as such may have restrictions on resale. Total value of all such securities at August 31, 2023 amounted to $273,106, which represents 1.1% of net assets of the Fund. |
(b) | All or a portion of this security is on loan at August 31, 2023. Total value of all such securities at August 31, 2023 amounted to $1,189,650, collateralized by cash collateral of $1,088,609 and non-cash (U.S. Treasury Securities) collateral of $136,642 for the Fund (see Note A of the Notes to Financial Statements). |
(c) | Represents 7-day effective yield as of August 31, 2023. |
(d) | Represents investment of cash collateral received from securities lending. |
POSITIONS BY COUNTRY | ||
Country | Investments at Value | Percentage of Net Assets |
United States | $17,176,813 | 67.7 % |
Switzerland | 1,898,208 | 7.5 % |
Spain | 1,578,364 | 6.2 % |
Denmark | 971,562 | 3.8 % |
Ireland | 742,979 | 2.9 % |
Netherlands | 525,794 | 2.1 % |
Canada | 512,863 | 2.0 % |
United Kingdom | 391,080 | 1.6 % |
Germany | 360,162 | 1.4 % |
Short-Term Investments and Other Liabilities—Net | 1,212,265 | 4.8 % |
$25,370,090 | 100.0 % | |
The following is a summary, categorized by Level (see Note A of the Notes to Financial Statements), of inputs used to value the Fund’s investments as of August 31, 2023:
Asset Valuation Inputs | Level 1 | Level 2 | Level 3 | Total |
Investments: | ||||
Common Stocks# | $24,157,825 | $— | $— | $24,157,825 |
Short-Term Investments | — | 1,407,152 | — | 1,407,152 |
Total Investments | $24,157,825 | $1,407,152 | $— | $25,564,977 |
# | The Schedule of Investments provides information on the industry or sector categorization as well as a Positions by Country summary. |
^
A balance indicated with a "—", reflects either a zero balance or an amount that rounds to less than 1.
See Notes to Financial Statements
21
Consolidated Schedule of Investments Commodity Strategy ETF^
August 31, 2023
August 31, 2023
Principal Amount | Value | |
U.S. Treasury Obligations 5.4% | ||
$15,000,000 | U.S. Treasury Bills, 5.33%, due 11/24/2023 (Cost $14,813,467) | $14,814,057 (a) |
U.S. Government Agency Securities 1.3% | ||
3,560,000 | Federal Home Loan Bank, 5.55%, due 4/5/2024 (Cost $3,558,495) | 3,553,188 |
Asset-Backed Securities 17.6% | ||
Ally Auto Receivables Trust | ||
428,608 | Series 2022-1, Class A2, 2.67%, due 4/15/2025 | 427,172 |
1,600,000 | Series 2023-1, Class A2, 5.76%, due 11/15/2026 | 1,599,410 |
1,795,000 | Bank of America Auto Trust, Series 2023-1A, Class A2, 5.83%, due 5/15/2026 | 1,795,254 (b) |
914,052 | BMW Vehicle Lease Trust, Series 2023-1, Class A2, 5.27%, due 2/25/2025 | 911,555 |
1,354,000 | BMW Vehicle Owner Trust, Series 2023-A, Class A2A, 5.72%, due 4/27/2026 | 1,353,991 |
Capital One Prime Auto Receivables Trust | ||
1,417,246 | Series 2022-1, Class A2, 2.71%, due 6/16/2025 | 1,406,037 |
1,762,076 | Series 2023-1, Class A2, 5.20%, due 5/15/2026 | 1,755,254 |
1,926,000 | Citizens Auto Receivables Trust, Series 2023-1, Class A2A, 6.13%, due 7/15/2026 | 1,928,395 (b) |
454,000 | Dell Equipment Finance Trust, Series 2023-1, Class A2, 5.65%, due 9/22/2028 | 453,070 (b) |
410,000 | DLLAA LLC, Series 2023-1A, Class A2, 5.93%, due 7/20/2026 | 410,334 (b) |
340,000 | DLLAD LLC, Series 2023-1A, Class A2, 5.19%, due 4/20/2026 | 337,827 (b) |
11,771 | DLLST LLC, Series 2022-1A, Class A2, 2.79%, due 1/22/2024 | 11,751 (b) |
1,887,000 | Fifth Third Auto Trust, Series 2023-1, Class A2A, 5.80%, due 11/16/2026 | 1,887,241 |
152,974 | Ford Credit Auto Lease Trust, Series 2022-A, Class A2A, 2.78%, due 10/15/2024 | 152,780 |
Ford Credit Auto Owner Trust | ||
1,043,892 | Series 2022-B, Class A2A, 3.44%, due 2/15/2025 | 1,038,909 |
858,000 | Series 2023-A, Class A2A, 5.14%, due 3/15/2026 | 854,679 |
492,000 | GECU Auto Receivables Trust, Series 2023-1A, Class A2, 5.95%, due 3/15/2027 | 491,371 (b) |
GM Financial Automobile Leasing Trust | ||
322,040 | Series 2022-2, Class A2, 2.93%, due 10/21/2024 | 320,626 |
1,491,541 | Series 2023-1, Class A2A, 5.27%, due 6/20/2025 | 1,487,123 |
509,000 | Series 2023-3, Class A2A, 5.58%, due 1/20/2026 | 508,693 |
GM Financial Consumer Automobile Receivables Trust | ||
31,275 | Series 2022-1, Class A2, 0.76%, due 2/18/2025 | 31,209 |
261,291 | Series 2022-2, Class A2, 2.52%, due 5/16/2025 | 259,607 |
1,147,140 | Series 2022-3, Class A2A, 3.50%, due 9/16/2025 | 1,138,270 |
368,000 | Series 2023-2, Class A2A, 5.10%, due 5/18/2026 | 366,113 |
1,542,000 | Series 2023-3, Class A2A, 5.74%, due 9/16/2026 | 1,542,472 |
56,381 | Harley-Davidson Motorcycle Trust, Series 2022-A, Class A2A, 2.45%, due 5/15/2025 | 56,252 |
2,870,000 | Honda Auto Receivables Owner Trust, Series 2023-2, Class A2, 5.41%, due 4/15/2026 | 2,868,709 |
HPEFS Equipment Trust | ||
752,000 | Series 2022-1A, Class B, 1.79%, due 5/21/2029 | 723,043 (b) |
85,259 | Series 2022-1A, Class A2, 1.02%, due 5/21/2029 | 85,040 (b) |
Hyundai Auto Lease Securitization Trust | ||
122,285 | Series 2022-B, Class A2A, 2.75%, due 10/15/2024 | 121,867 (b) |
616,722 | Series 2023-A, Class A2A, 5.20%, due 4/15/2025 | 614,798 (b) |
Hyundai Auto Receivables Trust | ||
432,545 | Series 2022-A, Class A2A, 1.81%, due 2/18/2025 | 430,285 |
1,448,000 | Series 2023-A, Class A2A, 5.19%, due 12/15/2025 | 1,442,123 |
1,195,000 | Series 2023-B, Class A2A, 5.77%, due 5/15/2026 | 1,194,768 |
Kubota Credit Owner Trust | ||
521,265 | Series 2022-1A, Class A2, 2.34%, due 4/15/2025 | 515,025 (b) |
502,000 | Series 2023-1A, Class A2, 5.40%, due 2/17/2026 | 499,909 (b) |
See Notes to Consolidated Financial Statements
22
Consolidated Schedule of Investments Commodity Strategy ETF^ (cont’d)
Principal Amount | Value | |
Asset-Backed Securities – cont'd | ||
$1,005,471 | Mercedes-Benz Auto Receivables Trust, Series 2022-1, Class A2, 5.26%, due 10/15/2025 | $1,003,564 |
547,384 | MMAF Equipment Finance LLC, Series 2022-A, Class A2, 2.77%, due 2/13/2025 | 540,982 (b) |
Nissan Auto Lease Trust | ||
244,126 | Series 2022-A, Class A2A, 3.45%, due 8/15/2024 | 243,689 |
1,559,000 | Series 2023-B, Class A2A, 5.74%, due 8/15/2025 | 1,558,296 |
Nissan Auto Receivables Owner Trust | ||
630,448 | Series 2022-B, Class A2, 4.50%, due 8/15/2025 | 627,174 |
2,661,000 | Series 2023-A, Class A2A, 5.34%, due 2/17/2026 | 2,651,421 |
Santander Retail Auto Lease Trust | ||
153,866 | Series 2022-A, Class A2, 0.97%, due 3/20/2025 | 153,156 (b) |
294,358 | Series 2022-B, Class A2, 2.84%, due 5/20/2025 | 292,080 (b) |
Toyota Auto Receivables Owner Trust | ||
86,635 | Series 2022-A, Class A2, 0.74%, due 10/15/2024 | 86,450 |
221,773 | Series 2022-B, Class A2A, 2.35%, due 1/15/2025 | 220,414 |
723,891 | Series 2023-A, Class A2, 5.05%, due 1/15/2026 | 721,075 |
2,716,000 | Series 2023-C, Class A2A, 5.60%, due 8/17/2026 | 2,711,402 |
51,270 | Toyota Lease Owner Trust, Series 2022-A, Class A2, 1.73%, due 7/22/2024 | 51,165 (b) |
1,138,000 | Verizon Master Trust, Series 2022-7, Class A1B, (30 day USD SOFR Average + 0.85%), 6.06%, due 11/22/2027 | 1,141,139 (c) |
62,665 | Verizon Owner Trust, Series 2020-B, Class A, 0.47%, due 2/20/2025 | 62,483 |
World Omni Auto Receivables Trust | ||
224,899 | Series 2022-A, Class A2, 1.15%, due 4/15/2025 | 224,134 |
397,903 | Series 2022-B, Class A2A, 2.77%, due 10/15/2025 | 394,587 |
323,862 | Series 2022-D, Class A2A, 5.51%, due 3/16/2026 | 323,316 |
1,547,863 | Series 2023-A, Class A2A, 5.18%, due 7/15/2026 | 1,542,277 |
2,505,000 | Series 2023-C, Class A2A, 5.57%, due 12/15/2026 | 2,502,827 |
397,092 | World Omni Automobile Lease Securitization Trust, Series 2022-A, Class A2, 2.63%, due 10/15/2024 | 395,379 |
Total Asset-Backed Securities (Cost $48,576,012) | 48,467,972 | |
Corporate Bonds 52.5% | ||
Auto Manufacturers 5.0% | ||
General Motors Financial Co., Inc. | ||
1,645,000 | 1.05%, due 3/8/2024 | 1,603,545 |
1,400,000 | 1.20%, due 10/15/2024 | 1,327,305 |
1,644,000 | Mercedes-Benz Finance North America LLC, (Secured Overnight Financing Rate + 0.93%), 6.17%, due 3/30/2025 | 1,655,380 (b)(c) |
Toyota Motor Credit Corp. | ||
2,875,000 | (Secured Overnight Financing Rate Index + 0.65%), 5.91%, due 12/29/2023 | 2,878,450 (c) |
2,405,000 | (Secured Overnight Financing Rate + 0.62%), 5.86%, due 3/22/2024 | 2,407,699 (c) |
3,800,000 | Volkswagen Group of America Finance LLC, (Secured Overnight Financing Rate + 0.95%), 6.15%, due 6/7/2024 | 3,809,915 (b)(c) |
13,682,294 | ||
Banks 17.1% | ||
5,715,000 | Bank of America Corp., (Secured Overnight Financing Rate + 1.10%), 6.42%, due 4/25/2025 | 5,738,374 (c) |
1,425,000 | Citibank NA, 3.65%, due 1/23/2024 | 1,413,987 |
Citigroup, Inc. | ||
1,445,000 | (Secured Overnight Financing Rate + 1.37%), 6.71%, due 5/24/2025 | 1,451,496 (c) |
3,195,000 | (Secured Overnight Financing Rate + 1.53%), 6.75%, due 3/17/2026 | 3,222,218 (c) |
6,187,000 | Goldman Sachs Group, Inc., (3 mo. USD Term SOFR + 1.86%), 7.27%, due 11/29/2023 | 6,207,857 (c) |
6,005,000 | JPMorgan Chase & Co., (Secured Overnight Financing Rate + 0.58%), 5.82%, due 6/23/2025 | 5,988,366 (c) |
See Notes to Consolidated Financial Statements
23
Consolidated Schedule of Investments Commodity Strategy ETF^ (cont’d)
Principal Amount | Value | |
Banks – cont'd | ||
Morgan Stanley | ||
$215,000 | (Secured Overnight Financing Rate + 0.47%), 5.80%, due 11/10/2023 | $215,017 (c) |
5,484,000 | (Secured Overnight Financing Rate + 0.63%), 5.95%, due 1/24/2025 | 5,474,414 (c) |
4,670,000 | Royal Bank of Canada, (Secured Overnight Financing Rate Index + 0.44%), 5.75%, due 1/21/2025 | 4,649,869 (c) |
2,460,000 | Truist Bank, (Secured Overnight Financing Rate + 0.20%), 5.50%, due 1/17/2024 | 2,448,207 (c) |
1,015,000 | Truist Financial Corp., (Secured Overnight Financing Rate + 0.40%), 5.60%, due 6/9/2025 | 989,615 (c) |
3,500,000 | U.S. Bancorp, 2.40%, due 7/30/2024 | 3,397,162 |
5,875,000 | Wells Fargo & Co., 3.75%, due 1/24/2024 | 5,828,123 |
47,024,705 | ||
Biotechnology 1.2% | ||
3,285,000 | Amgen, Inc., 3.63%, due 5/22/2024 | 3,236,553 |
Diversified Financial Services 3.8% | ||
American Express Co. | ||
995,000 | (Secured Overnight Financing Rate Index + 0.23%), 5.57%, due 11/3/2023 | 994,601 (c) |
5,104,000 | (Secured Overnight Financing Rate + 0.93%), 6.26%, due 3/4/2025 | 5,127,257 (c) |
Capital One Financial Corp. | ||
3,130,000 | (Secured Overnight Financing Rate + 0.69%), 5.89%, due 12/6/2024 | 3,096,290 (c) |
1,175,000 | (Secured Overnight Financing Rate + 1.35%), 6.69%, due 5/9/2025 | 1,172,251 (c) |
10,390,399 | ||
Electric 3.1% | ||
930,000 | Florida Power & Light Co., (Secured Overnight Financing Rate Index + 0.38%), 5.67%, due 1/12/2024 | 930,010 (c) |
985,000 | Mississippi Power Co., Series A, (Secured Overnight Financing Rate + 0.30%), 5.55%, due 6/28/2024 | 980,271 (c) |
2,220,000 | National Rural Utilities Cooperative Finance Corp., Series D, (Secured Overnight Financing Rate + 0.33%), 5.63%, due 10/18/2024 | 2,212,726 (c) |
4,500,000 | NextEra Energy Capital Holdings, Inc., (Secured Overnight Financing Rate Index + 0.40%), 5.74%, due 11/3/2023 | 4,501,539 (c) |
8,624,546 | ||
Healthcare - Products 1.9% | ||
Baxter International, Inc. | ||
2,500,000 | (Secured Overnight Financing Rate Index + 0.26%), 5.59%, due 12/1/2023 | 2,496,623 (c) |
2,825,000 | (Secured Overnight Financing Rate Index + 0.44%), 5.78%, due 11/29/2024 | 2,805,221 (c) |
5,301,844 | ||
Insurance 1.1% | ||
3,091,000 | Protective Life Global Funding, (Secured Overnight Financing Rate + 0.98%), 6.23%, due 3/28/2025 | 3,102,624 (b)(c) |
Machinery - Construction & Mining 1.1% | ||
3,112,000 | Caterpillar Financial Services Corp., (Secured Overnight Financing Rate + 0.27%), 5.48%, due 9/13/2024 | 3,109,483 (c) |
Machinery - Diversified 1.9% | ||
John Deere Capital Corp. | ||
1,522,000 | (Secured Overnight Financing Rate + 0.20%), 5.47%, due 10/11/2024 | 1,519,726 (c) |
3,798,000 | (Secured Overnight Financing Rate + 0.56%), 5.74%, due 3/7/2025 | 3,807,959 (c) |
5,327,685 | ||
Miscellaneous Manufacturer 1.6% | ||
4,470,000 | Siemens Financieringsmaatschappij NV, (Secured Overnight Financing Rate + 0.43%), 5.63%, due 3/11/2024 | 4,475,314 (b)(c) |
See Notes to Consolidated Financial Statements
24
Consolidated Schedule of Investments Commodity Strategy ETF^ (cont’d)
Principal Amount | Value | ||
Oil & Gas 1.8% | |||
$4,970,000 | Shell International Finance BV, (3 mo. USD Term SOFR + 0.66%), 6.03%, due 11/13/2023 | $4,975,246 (c) | |
Pharmaceuticals 1.3% | |||
3,575,000 | AbbVie, Inc., 3.85%, due 6/15/2024 | 3,523,387 | |
Pipelines 4.8% | |||
4,398,000 | Enbridge, Inc., (Secured Overnight Financing Rate Index + 0.63%), 5.97%, due 2/16/2024 | 4,401,242 (c) | |
5,950,000 | Enterprise Products Operating LLC, 3.90%, due 2/15/2024 | 5,898,075 | |
2,969,000 | Kinder Morgan, Inc., 5.63%, due 11/15/2023 | 2,966,333 (b) | |
13,265,650 | |||
Real Estate Investment Trusts 1.2% | |||
3,380,000 | Simon Property Group LP, 3.75%, due 2/1/2024 | 3,348,781 | |
Retail 0.5% | |||
1,315,000 | Starbucks Corp., (Secured Overnight Financing Rate Index + 0.42%), 5.76%, due 2/14/2024 | 1,315,026 (c) | |
Semiconductors 1.7% | |||
4,592,000 | Analog Devices, Inc., (Secured Overnight Financing Rate + 0.25%), 5.51%, due 10/1/2024 | 4,589,527 (c) | |
Software 1.3% | |||
3,495,000 | Oracle Corp., 3.40%, due 7/8/2024 | 3,428,649 | |
Telecommunications 2.1% | |||
5,762,000 | AT&T, Inc., 0.90%, due 3/25/2024 | 5,603,779 | |
Total Corporate Bonds (Cost $144,326,941) | 144,325,492 | ||
Number of Shares | |||
Short-Term Investments 14.5% | |||
Investment Companies 14.5% | |||
39,743,178 | State Street Institutional U.S. Government Money Market Fund Premier Class, 5.28%(d) (Cost $39,743,178) | 39,743,178 | |
Total Investments 91.3% (Cost $251,018,093) | 250,903,887 | ||
Other Assets Less Liabilities 8.7% | 23,822,971 (e) | ||
Net Assets 100.0% | $274,726,858 | ||
(a) | Rate shown was the discount rate at the date of purchase. |
(b) | Securities were purchased under Rule 144A of the Securities Act of 1933, as amended, or are otherwise restricted and, unless registered under the Securities Act of 1933 or exempted from registration, may only be sold to qualified institutional investors or may have other restrictions on resale. At August 31, 2023, these securities amounted to $25,034,633, which represents 9.1% of net assets of the Fund. |
(c) | Variable or floating rate security. The interest rate shown was the current rate as of August 31, 2023 and changes periodically. |
(d) | Represents 7-day effective yield as of August 31, 2023. |
(e) | Includes the impact of the Fund's open positions in derivatives at August 31, 2023. |
See Notes to Consolidated Financial Statements
25
Consolidated Schedule of Investments Commodity Strategy ETF^ (cont’d)
Derivative Instruments
Futures contracts ("futures")
At August 31, 2023, open positions in futures for the Fund were as follows:
Long Futures: |
Expiration Date | Number of Contracts | Open Contracts | Notional Amount | Value and Unrealized Appreciation/ (Depreciation) |
9/2023 | 165 | Lead | $9,293,213 | $686,937 |
9/2023 | 68 | Nickel | 8,206,104 | (1,830,851) |
9/2023 | 167 | Primary Aluminum | 9,075,406 | (1,942,722) |
9/2023 | 222 | Zinc | 13,439,325 | (2,159,611) |
10/2023 | 214 | Brent Crude Oil | 18,453,220 | 2,353,685 |
10/2023 | 154 | Cattle Feeder | 11,138,820 | 169,634 |
10/2023 | 112 | Lead | 6,232,520 | 269,626 |
10/2023 | 165 | Platinum | 8,038,800 | (357,623) |
11/2023 | 392 | Natural Gas | 14,155,120 | (9,211) |
11/2023 | 190 | RBOB Gasoline | 19,178,334 | 2,320,582 |
11/2023 | 64 | Soybean Meal | 4,380,000 | 50,128 |
11/2023 | 219 | WTI Crude | 18,014,940 | 2,535,288 |
12/2023 | 46 | Coffee'c' | 2,665,125 | (319,052) |
12/2023 | 573 | Corn | 13,701,862 | (2,974,915) |
12/2023 | 127 | Cotton No.2 | 5,576,570 | 277,969 |
12/2023 | 173 | Gold 100 Oz. | 34,010,070 | 30,907 |
12/2023 | 57 | Nickel | 6,960,042 | (243,800) |
12/2023 | 7 | Palladium | 853,090 | (4,078) |
12/2023 | 178 | Primary Aluminum | 9,866,763 | (767,711) |
12/2023 | 90 | Silver | 11,165,400 | 645,405 |
12/2023 | 356 | Soybean Meal | 14,382,400 | 1,241,053 |
12/2023 | 279 | Soybean Oil | 10,459,152 | 946,674 |
12/2023 | 171 | Wheat | 5,147,100 | (1,343,535) |
12/2023 | 134 | Wheat | 4,872,575 | (410,645) |
12/2023 | 188 | Zinc | 11,437,450 | (819,975) |
1/2024 | 36 | Cattle Feeder | 4,620,600 | 167,007 |
1/2024 | 119 | Low Sulphur Gasoil | 9,707,425 | 1,468,593 |
1/2024 | 130 | New York Harbor ULSD | 15,521,688 | 2,359,844 |
2/2024 | 221 | Lean Hogs | 6,957,080 | (124,268) |
2/2024 | 227 | Sugar 11 | 6,465,323 | 608,479 |
3/2024 | 103 | Cocoa | 3,757,440 | 597,861 |
3/2024 | 179 | Copper | 17,201,900 | 304,422 |
3/2024 | 117 | Primary Aluminum | 6,592,950 | (59,288) |
3/2024 | 164 | Zinc | 10,013,225 | (103,914) |
Total Long Positions | $351,541,032 | $3,562,895 | ||
See Notes to Consolidated Financial Statements
26
Consolidated Schedule of Investments Commodity Strategy ETF^ (cont’d)
Short Futures: |
Expiration Date | Number of Contracts | Open Contracts | Notional Amount | Value and Unrealized Appreciation/ (Depreciation) |
9/2023 | 165 | Lead | $(9,293,213) | $(508,177) |
9/2023 | 68 | Nickel | (8,206,104) | 294,520 |
9/2023 | 167 | Primary Aluminum | (9,075,406) | 954,722 |
9/2023 | 222 | Zinc | (13,439,325) | 1,068,667 |
12/2023 | 178 | Primary Aluminum | (9,866,763) | 102,258 |
12/2023 | 188 | Zinc | (11,437,450) | 83,490 |
3/2024 | 1 | Primary Aluminum | (56,350) | (948) |
3/2024 | 1 | Zinc | (61,056) | (1,106) |
Total Short Positions | $(61,435,667) | $1,993,426 | ||
Total Futures | $5,556,321 | |||
At August 31, 2023, the Fund had $17,028,603 deposited in a segregated account to cover margin requirements on open futures.
For the period ended August 31, 2023, the average notional value for the months where the Fund had futures outstanding was $342,536,801 for long positions and $(69,748,142) for short positions.
The following is a summary, categorized by Level (see Note A of the Consolidated Financial Statements), of inputs used to value the Fund’s investments as of August 31, 2023:
Asset Valuation Inputs | Level 1 | Level 2 | Level 3 | Total |
Investments: | ||||
U.S. Treasury Obligations | $— | $14,814,057 | $— | $14,814,057 |
U.S. Government Agency Securities | — | 3,553,188 | — | 3,553,188 |
Asset-Backed Securities | — | 48,467,972 | — | 48,467,972 |
Corporate Bonds# | — | 144,325,492 | — | 144,325,492 |
Short-Term Investments | — | 39,743,178 | — | 39,743,178 |
Total Investments | $— | $250,903,887 | $— | $250,903,887 |
# | The Consolidated Schedule of Investments provides information on the industry or sector categorization. |
The following is a summary, categorized by Level (see Note A of the Consolidated Financial Statements), of inputs used to value the Fund’s derivatives as of August 31, 2023:
Other Financial Instruments | Level 1 | Level 2 | Level 3 | Total |
Futures | ||||
Assets | $19,537,751 | $— | $— | $19,537,751 |
Liabilities | (13,981,430 ) | — | — | (13,981,430 ) |
Total | $5,556,321 | $— | $— | $5,556,321 |
^
A balance indicated with a "—", reflects either a zero balance or an amount that rounds to less than 1.
See Notes to Consolidated Financial Statements
27
Schedule of Investments Disrupters ETF^
August 31, 2023
August 31, 2023
Number of Shares | Value | |
Common Stocks 98.0% | ||
Aerospace & Defense 3.4% | ||
423 | TransDigm Group, Inc.* | $382,329 |
Automobile Components 1.5% | ||
4,700 | Mobileye Global, Inc. Class A* | 166,897 |
Automobiles 1.7% | ||
715 | Tesla, Inc.* | 184,527 |
Biotechnology 0.1% | ||
249 | Arrowhead Pharmaceuticals, Inc.* | 6,683 |
Broadline Retail 4.2% | ||
3,370 | Amazon.com, Inc.* | 465,094 |
Capital Markets 4.4% | ||
5,665 | Tradeweb Markets, Inc. Class A | 489,626 |
Electronic Equipment, Instruments & Components 6.1% | ||
2,774 | Keysight Technologies, Inc.* | 369,774 |
1,128 | Zebra Technologies Corp. Class A* | 310,212 |
679,986 | ||
Ground Transportation 4.4% | ||
10,423 | Uber Technologies, Inc.* | 492,278 |
Health Care Equipment & Supplies 15.0% | ||
3,424 | Dexcom, Inc.* | 345,755 |
4,240 | Edwards Lifesciences Corp.* | 324,233 |
731 | IDEXX Laboratories, Inc.* | 373,841 |
1,134 | Intuitive Surgical, Inc.* | 354,579 |
1,248 | Shockwave Medical, Inc.* | 275,047 |
1,673,455 | ||
Hotels, Restaurants & Leisure 2.5% | ||
2,148 | Airbnb, Inc. Class A* | 282,569 |
Interactive Media & Services 4.1% | ||
3,329 | Alphabet, Inc. Class C* | 457,238 |
Number of Shares | Value | |
IT Services 2.1% | ||
597 | MongoDB, Inc.* | $227,636 |
Life Sciences Tools & Services 3.3% | ||
1,394 | Danaher Corp. | 369,410 |
Pharmaceuticals 3.9% | ||
783 | Eli Lilly & Co. | 433,939 |
Professional Services 2.9% | ||
1,093 | Paycom Software, Inc. | 322,260 |
Semiconductors & Semiconductor Equipment 21.6% | ||
4,269 | Advanced Micro Devices, Inc.* | 451,319 |
2,600 | Analog Devices, Inc. | 472,628 |
657 | ASML Holding NV | 433,968 |
2,133 | NVIDIA Corp. | 1,052,742 |
2,410,657 | ||
Software 16.8% | ||
684 | Adobe, Inc.* | 382,588 |
993 | Intuit, Inc. | 538,017 |
1,325 | Palo Alto Networks, Inc.* | 322,372 |
3,192 | Procore Technologies, Inc.* | 215,620 |
704 | ServiceNow, Inc.* | 414,536 |
1,873,133 | ||
Total Common Stocks (Cost $9,472,768) | 10,917,717 | |
Short-Term Investments 1.8% | ||
Investment Companies 1.8% | ||
202,072 | State Street Institutional U.S. Government Money Market Fund Premier Class, 5.28%(a) (Cost $202,072) | 202,072 |
Total Investments 99.8% (Cost $9,674,840) | 11,119,789 | |
Other Assets Less Liabilities 0.2% | 26,425 | |
Net Assets 100.0% | $11,146,214 | |
* | Non-income producing security. |
(a) | Represents 7-day effective yield as of August 31, 2023. |
The following is a summary, categorized by Level (see Note A of the Notes to Financial Statements), of inputs used to value the Fund’s investments as of August 31, 2023:
Asset Valuation Inputs | Level 1 | Level 2 | Level 3 | Total |
Investments: | ||||
Common Stocks# | $10,917,717 | $— | $— | $10,917,717 |
Short-Term Investments | — | 202,072 | — | 202,072 |
Total Investments | $10,917,717 | $202,072 | $— | $11,119,789 |
# | The Schedule of Investments provides information on the industry or sector categorization. |
See Notes to Financial Statements
28
Schedule of Investments Disrupters ETF^ (cont’d)
^
A balance indicated with a "—", reflects either a zero balance or an amount that rounds to less than 1.
See Notes to Financial Statements
29
Schedule of Investments Next Generation Connected Consumer ETF^
August 31, 2023
August 31, 2023
Number of Shares | Value | |
Common Stocks 93.7% | ||
Beverages 7.6% | ||
70,688 | Becle SAB de CV | $190,790 |
6,542 | Keurig Dr Pepper, Inc. | 220,138 |
410,928 | ||
Consumer Staples Distribution & Retail 6.4% | ||
1,529 | Dollar Tree, Inc.* | 187,088 |
968 | Walmart, Inc. | 157,407 |
344,495 | ||
Diversified Consumer Services 2.6% | ||
8,030 | Coursera, Inc.* | 139,642 |
Entertainment 4.4% | ||
755 | Spotify Technology SA* | 116,247 |
1,423 | Walt Disney Co.* | 119,077 |
235,324 | ||
Financial Services 1.7% | ||
4,257 | Toast, Inc. Class A* | 94,378 |
Food Products 3.0% | ||
4,491 | Simply Good Foods Co.* | 162,035 |
Health Care Equipment & Supplies 3.4% | ||
969 | EssilorLuxottica SA | 182,723 |
Hotels, Restaurants & Leisure 21.2% | ||
4,485 | Basic-Fit NV*(a) | 136,951 |
44 | Chipotle Mexican Grill, Inc.* | 84,772 |
5,946 | Cie des Alpes | 83,947 |
3,842 | DraftKings, Inc. Class A* | 113,915 |
14,071 | eDreams ODIGEO SA* | 100,702 |
1,988 | Las Vegas Sands Corp. | 109,062 |
639 | Marriott International, Inc. Class A | 130,043 |
593 | McDonald's Corp. | 166,722 |
25,554 | Soho House & Co., Inc.* | 173,767 |
1,052 | Travel & Leisure Co. | 42,291 |
1,142,172 | ||
Insurance 4.5% | ||
1,178 | Allstate Corp. | 127,000 |
39,000 | ZhongAn Online P&C Insurance Co. Ltd. Class H*(a) | 115,871 |
242,871 | ||
Interactive Media & Services 7.0% | ||
1,037 | Alphabet, Inc. Class C* | 142,432 |
3,885 | Match Group, Inc.* | 182,090 |
5,090 | Snap, Inc. Class A* | 52,681 |
377,203 | ||
IT Services 2.3% | ||
1,278 | Wix.com Ltd.* | 126,228 |
Number of Shares | Value | |
Leisure Products 0.6% | ||
5,264 | Peloton Interactive, Inc. Class A* | $33,584 |
Pharmaceuticals 2.6% | ||
731 | Zoetis, Inc. | 139,263 |
Software 1.1% | ||
6,660 | Zuora, Inc. Class A* | 60,672 |
Specialty Retail 13.4% | ||
3,561 | Aritzia, Inc.* | 65,359 |
383 | Home Depot, Inc. | 126,505 |
2,920 | Overstock.com, Inc.* | 76,241 |
1,591 | TJX Cos., Inc. | 147,136 |
58,000 | Topsports International Holdings Ltd.(a) | 47,185 |
345 | Ulta Beauty, Inc.* | 143,185 |
9,906 | Warby Parker, Inc. Class A* | 118,971 |
724,582 | ||
Textiles, Apparel & Luxury Goods 9.0% | ||
438 | Crocs, Inc.* | 42,635 |
108 | Kering SA | 57,876 |
15,000 | Li Ning Co. Ltd. | 70,865 |
2,584 | Moncler SpA | 175,515 |
1,361 | NIKE, Inc. Class B | 138,427 |
485,318 | ||
Wireless Telecommunication Services 2.9% | ||
1,132 | T-Mobile U.S., Inc.* | 154,235 |
Total Common Stocks (Cost $5,246,930) | 5,055,653 | |
Number of Units | ||
Master Limited Partnerships and Limited Partnerships 2.6% | ||
Hotels, Restaurants & Leisure 2.6% | ||
3,493 | Cedar Fair LP (Cost $149,435) | 139,895 |
See Notes to Financial Statements
30
Schedule of Investments Next Generation Connected Consumer ETF^ (cont’d)
Number of Shares | Value | |
Short-Term Investments 3.6% | ||
Investment Companies 3.6% | ||
196,409 | State Street Institutional U.S. Government Money Market Fund Premier Class, 5.28%(b) (Cost $196,409) | $196,409 |
Total Investments 99.9% (Cost $5,592,774) | 5,391,957 | |
Other Assets Less Liabilities 0.1% | 3,674 | |
Net Assets 100.0% | $5,395,631 | |
* | Non-income producing security. |
(a) | Security exempt from registration pursuant to Regulation S under the Securities Act of 1933, as amended. Regulation S applies to securities offerings that are made outside of the United States and do not involve directed selling efforts in the United States and as such may have restrictions on resale. Total value of all such securities at August 31, 2023 amounted to $300,007, which represents 5.6% of net assets of the Fund. |
(b) | Represents 7-day effective yield as of August 31, 2023. |
POSITIONS BY COUNTRY | ||
Country | Investments at Value | Percentage of Net Assets |
United States | $3,667,769 | 68.0 % |
France | 324,546 | 6.0 % |
China | 233,921 | 4.3 % |
Mexico | 190,790 | 3.5 % |
Italy | 175,515 | 3.3 % |
United Kingdom | 173,767 | 3.2 % |
Netherlands | 136,951 | 2.5 % |
Israel | 126,228 | 2.4 % |
Spain | 100,702 | 1.9 % |
Canada | 65,359 | 1.2 % |
Short-Term Investments and Other Assets—Net | 200,083 | 3.7 % |
$5,395,631 | 100.0 % | |
The following is a summary, categorized by Level (see Note A of the Notes to Financial Statements), of inputs used to value the Fund’s investments as of August 31, 2023:
Asset Valuation Inputs | Level 1 | Level 2 | Level 3 | Total |
Investments: | ||||
Common Stocks# | $5,055,653 | $— | $— | $5,055,653 |
Master Limited Partnerships and Limited Partnerships# | 139,895 | — | — | 139,895 |
Short-Term Investments | — | 196,409 | — | 196,409 |
Total Investments | $5,195,548 | $196,409 | $— | $5,391,957 |
# | The Schedule of Investments provides information on the industry or sector categorization as well as a Positions by Country summary. |
See Notes to Financial Statements
31
Schedule of Investments Next Generation Connected Consumer ETF^ (cont’d)
^
A balance indicated with a "—", reflects either a zero balance or an amount that rounds to less than 1.
See Notes to Financial Statements
32
Statements of Assets and Liabilities
Neuberger Berman ETF Trust
Carbon Transition & Infrastructure ETF | Commodity Strategy ETF** | Disrupters ETF | Next Generation Connected Consumer ETF | |
August 31, 2023 | August 31, 2023 | August 31, 2023 | August 31, 2023 | |
Assets | ||||
Investments in securities, at value*† (Note A)— see Schedule of Investments: | ||||
Unaffiliated issuers(a) | $25,564,977 | $250,903,887 | $11,119,789 | $5,391,957 |
Foreign currency(b) | 853,356 | — | — | — |
Cash collateral segregated for futures contracts (Note A) | — | 17,028,603 | — | — |
Dividends and interest receivable | 50,922 | 1,495,852 | 2,606 | 6,038 |
Receivable for securities sold | 222,274 | — | 235,903 | — |
Receivable for accumulated variation margin on futures contracts (Note A) | — | 5,556,321 | — | — |
Receivable from Management—net (Note B) | — | 7,313 | — | — |
Receivable for Fund shares sold | — | — | 581,755 | — |
Receivable for securities lending income (Note A) | 381 | — | — | 174 |
Prepaid expenses and other assets | — | 13,081 | — | — |
Total Assets | 26,691,910 | 275,005,057 | 11,940,053 | 5,398,169 |
Liabilities | ||||
Payable to investment manager—net (Note B) | 11,935 | 150,282 | 4,826 | 2,538 |
Payable for securities purchased | 221,276 | — | 789,013 | — |
Payable to trustees | — | 7,985 | — | — |
Payable for audit fees | — | 66,450 | — | — |
Payable for custodian and accounting fees | — | 19,397 | — | — |
Payable for legal fees | — | 17,410 | — | — |
Payable for shareholder servicing fees | — | 4,540 | — | — |
Payable for cash collateral on loaned securities (Note A) | 1,088,609 | — | — | — |
Other accrued expenses and payables | — | 12,135 | — | — |
Total Liabilities | 1,321,820 | 278,199 | 793,839 | 2,538 |
Net Assets | $25,370,090 | $274,726,858 | $11,146,214 | $5,395,631 |
Net Assets consist of: | ||||
Paid-in capital | $26,074,150 | $359,402,274 | $10,494,707 | $5,919,241 |
Total distributable earnings/(losses) | (704,060 ) | (84,675,416 ) | 651,507 | (523,610 ) |
Net Assets | $25,370,090 | $274,726,858 | $11,146,214 | $5,395,631 |
Shares Outstanding ($0.001 par value; unlimited shares authorized) | 1,050,001 | 12,113,076 | 479,000 | 250,001 |
Net Asset Value, offering and redemption price per share | $24.16 | $22.68 | $23.27 | $21.58 |
†Securities on loan, at value: | ||||
Unaffiliated issuers | $1,189,650 | $— | $— | $— |
*Cost of Investments: | ||||
(a) Unaffiliated issuers | $26,422,512 | $251,018,093 | $9,674,840 | $5,592,774 |
(b) Total cost of foreign currency | $876,065 | $— | $— | $— |
** | Consolidated financial statement, see Note A of the Notes to Financial Statements for additional information. |
See Notes to Financial Statements
33
Statements of Operations
Neuberger Berman ETF Trust
Carbon Transition & Infrastructure ETF | Commodity Strategy ETF**(a) | Disrupters ETF | Next Generation Connected Consumer ETF | |
For the Fiscal Year Ended August 31, 2023 | For the Fiscal Year Ended August 31, 2023 | For the Fiscal Year Ended August 31, 2023 | For the Fiscal Year Ended August 31, 2023 | |
Investment Income: | ||||
Income (Note A): | ||||
Dividend income—unaffiliated issuers | $367,328 | $— | $20,461 | $43,452 |
Interest and other income—unaffiliated issuers | 17,577 | 11,209,033 | 8,825 | 10,734 |
Income from securities loaned—net | 2,395 | — | — | 5,983 |
Foreign taxes withheld | (16,983 ) | — | (601 ) | (1,864 ) |
Total income | $370,317 | $11,209,033 | $28,685 | $58,305 |
Expenses: | ||||
Investment management fees (Note B) | 107,706 | 1,251,519 | 57,942 | 33,247 |
Administration fees (Note B) | — | 248,492 | — | — |
Distribution Fees (Note B) | — | 8,451 | — | — |
Transfer agent fees | — | 17,726 | — | — |
Audit fees | — | 66,450 | — | — |
Subsidiary administration fees | — | 50,000 | — | — |
Custodian and accounting fees | — | 85,725 | — | — |
Insurance | — | 4,026 | — | — |
Legal fees | — | 42,789 | — | — |
Registration and filing fees | — | 62,735 | — | — |
Shareholder reports | — | 26,700 | — | — |
Stock exchange listing fees | — | 8,334 | — | — |
Trustees' fees and expenses | — | 43,412 | — | — |
Interest | — | 3,111 | — | 72 |
Miscellaneous and other fees | — | 22,441 | — | — |
Total expenses | 107,706 | 1,941,911 | 57,942 | 33,319 |
Expenses reimbursed by Management (Note B) | — | (283,948 ) | — | — |
Investment management fees waived (Note B) | (16,570 ) | — | (8,914 ) | (5,115 ) |
Total net expenses | 91,136 | 1,657,963 | 49,028 | 28,204 |
Net investment income/(loss) | $279,181 | $9,551,070 | $(20,343 ) | $30,101 |
Realized and Unrealized Gain/(Loss) on Investments (Note A): | ||||
Net realized gain/(loss) on: | ||||
Transactions in investment securities of unaffiliated issuers | (57,145 ) | 32,541 | (726,013 ) | (210,276 ) |
Redemption in-kind | — | — | 818,047 | — |
Settlement of foreign currency transactions | 11,583 | — | — | 937 |
Expiration or closing of futures contracts | — | (25,522,103 ) | — | — |
Change in net unrealized appreciation/(depreciation) in value of: | ||||
Investment securities of unaffiliated issuers | (655,218 ) | 1,081,736 | 2,298,294 | 803,371 |
Foreign currency translations | (22,253 ) | — | — | 30 |
Futures contracts | — | 13,763,710 | — | — |
Net gain/(loss) on investments | (723,033 ) | (10,644,116 ) | 2,390,328 | 594,062 |
Net increase/(decrease) in net assets resulting from operations | $(443,852 ) | $(1,093,046 ) | $2,369,985 | $624,163 |
** | Consolidated financial statement, see Note A of the Notes to Financial Statements for additional information. |
(a) | After the close of business on October 21, 2022, Neuberger Berman Commodity Strategy Fund (the "Predecessor Fund") was reorganized into Neuberger Berman Commodity Strategy ETF. The amounts disclosed include those of the Predecessor Fund. Refer to Note A in the Notes to Financial Statements for additional information on the reorganization. |
See Notes to Financial Statements
34
Statements of Changes in Net Assets
Neuberger Berman ETF Trust
Carbon Transition & Infrastructure ETF | Commodity Strategy ETF* | ||||
Fiscal Year Ended | Period from April 6, 2022 (Commencement of Operations) to | Fiscal Year Ended | Period Ended From | Fiscal Year Ended | |
August 31, 2023 | August 31, 2022 | August 31, 2023(a) | November 1, 2021 to August 31, 2022** | October 31, 2021 | |
Increase/(Decrease) in Net Assets: | |||||
From Operations (Note A): | |||||
Net investment income/(loss) | $279,181 | $32,394 | $9,551,070 | $291,272 | $(605,753 ) |
Net realized gain/(loss) on investments | (45,562 ) | (44,325 ) | (25,489,562 ) | 34,251,472 | 56,535,991 |
Change in net unrealized appreciation/(depreciation) of investments | (677,471 ) | (202,354 ) | 14,845,446 | (14,553,756 ) | 2,323,541 |
Net increase/(decrease) in net assets resulting from operations | (443,852 ) | (214,285 ) | (1,093,046 ) | 19,988,988 | 58,253,779 |
Distributions to Shareholders From (Note A): | |||||
Distributable earnings | (45,923 ) | — | (27,372,087 )(b) | (55,270,948 )(b) | (641,535 )(b) |
From Fund Share Transactions (Note D): | |||||
Proceeds from shares sold | 20,414,857 | 5,659,293 | 148,355,781 (c) | 148,609,920 (c) | 50,480,283 (c) |
Proceeds from reinvestment of dividends and distributions | — | — | 25,498,601 (c) | 54,964,779 (c) | 635,330 (c) |
Payments for shares redeemed | — | — | (111,647,457 )(c) | (101,415,962 )(c) | (42,429,665 )(c) |
Net increase/(decrease) from Fund share transactions | 20,414,857 | 5,659,293 | 62,206,925 | 102,158,737 | 8,685,948 |
Net Increase/(Decrease) in Net Assets | 19,925,082 | 5,445,008 | 33,741,792 | 66,876,777 | 66,298,192 |
Net Assets: | |||||
Beginning of year | 5,445,008 | — | 240,985,066 | 174,108,289 | 107,810,097 |
End of year | $25,370,090 | $5,445,008 | $274,726,858 | $240,985,066 | $174,108,289 |
* | Consolidated financial statement, see Note A of the Notes to Financial Statements for additional information. |
** | The Fund changed its fiscal year end from October 31 to August 31. See Note G of the Notes to Financial Statements. |
(a) | After the close of business on October 21, 2022, Neuberger Berman Commodity Strategy Fund (the "Predecessor Fund") was reorganized into Neuberger Berman Commodity Strategy ETF. The amounts disclosed include those of the Predecessor Fund. Refer to Note A in the Notes to Financial Statements for additional information on the reorganization. |
(b) | Included in these amounts are the distributions to shareholders from Institutional Class shares, Class A shares and Class C shares of the Predecessor Fund: |
For the Year Ended August 31, 2023 | Period From November 1, 2021 to August 31, 2022 | For the Year Ended October 31, 2021 | |
Commodity Strategy ETF | |||
Institutional Class | $(22,093,157 ) | $(46,096,951 ) | $(575,526 ) |
Class A | (3,456,451 ) | (9,160,442 ) | (66,009 ) |
Class C | (54,635 ) | (13,555 ) | - |
(c) | The dollar amounts disclosed are the total from fund share transaction of the Institutional Class shares, Class A shares and Class C shares of the Predecessor Fund. See Note D of the Notes to Financial Statements for additional information. |
See Notes to Financial Statements
35
Statements of Changes in Net Assets (cont’d)
Neuberger Berman ETF Trust
Disrupters ETF | Next Generation Connected Consumer ETF | |||
Fiscal Year Ended | Period from April 6, 2022 (Commencement of Operations) to | Fiscal Year Ended | Period from April 6, 2022 (Commencement of Operations) to | |
August 31, 2023 | August 31, 2022 | August 31, 2023 | August 31, 2022 | |
Increase/(Decrease) in Net Assets: | ||||
From Operations (Note A): | ||||
Net investment income/(loss) | $(20,343 ) | $(3,432 ) | $30,101 | $4,152 |
Net realized gain/(loss) on investments | 92,034 | (194,541 ) | (209,339 ) | (142,934 ) |
Change in net unrealized appreciation/(depreciation) of investments | 2,298,294 | (853,345 ) | 803,401 | (1,004,213 ) |
Net increase/(decrease) in net assets resulting from operations | 2,369,985 | (1,051,318 ) | 624,163 | (1,142,995 ) |
Distributions to Shareholders From (Note A): | ||||
Distributable earnings | — | — | (5,300 ) | — |
From Fund Share Transactions (Note D): | ||||
Proceeds from shares sold | 12,477,577 | 6,472,125 | — | 5,919,763 |
Payments for shares redeemed | (9,122,155 ) | — | — | — |
Net increase/(decrease) from Fund share transactions | 3,355,422 | 6,472,125 | — | 5,919,763 |
Net Increase/(Decrease) in Net Assets | 5,725,407 | 5,420,807 | 618,863 | 4,776,768 |
Net Assets: | ||||
Beginning of year | 5,420,807 | — | 4,776,768 | — |
End of year | $11,146,214 | $5,420,807 | $5,395,631 | $4,776,768 |
See Notes to Financial Statements
36
Notes to Financial Statements ETF Trustß
Note A—Summary of Significant Accounting Policies:
1
General: Neuberger Berman ETF Trust (the "Trust") is a Delaware statutory trust organized pursuant to an Amended and Restated Trust Instrument dated December 8, 2021. The Trust is registered as an open-end management investment company under the Investment Company Act of 1940, as amended (the "1940 Act"), and its shares are registered under the Securities Act of 1933, as amended.Neuberger Berman Carbon Transition & Infrastructure ETF ("Carbon Transition & Infrastructure ETF"), Neuberger Berman Commodity Strategy ETF ("Commodity Strategy ETF"), Neuberger Berman Disrupters ETF ("Disrupters ETF"), and Neuberger Berman Next Generation Connected Consumer ETF ("Next Generation Connected Consumer ETF") (each individually a "Fund," and collectively, the "Funds") are separate operating series of the Trust, each of which (except Disrupters ETF) is diversified. Each Fund offers and issues shares of beneficial interest ("Shares"). Shares of a Fund represent an equal proportionate interest in the Fund. Each Fund (except Commodity Strategy ETF) had no operations until April 6, 2022, other than matters relating to its organization and its registration of shares under the 1933 Act. As further described in Note A-2, Commodity Strategy ETF commenced operations as an ETF on October 24, 2022 following its reorganization from a mutual fund to an ETF effective after the close of business on October 21, 2022. The Trust’s Board of Trustees (the "Board") may establish additional series of shares without the approval of shareholders.
A balance indicated with a "—", reflects either a zero balance or a balance that rounds to less than 1.
The assets of each Fund belong only to that Fund, and the liabilities of each Fund are borne solely by that Fund and no other series of the Trust.
Each Fund is an investment company and accordingly follows the investment company accounting and reporting guidance of the Financial Accounting Standards Board ("FASB") Accounting Standards Codification ("ASC") Topic 946 "Financial Services—Investment Companies."
The preparation of financial statements in accordance with U.S. generally accepted accounting principles ("GAAP") requires Management to make estimates and assumptions at the date of the financial statements. Actual results could differ from those estimates.
Commodity Strategy ETF invests in commodity-related instruments through Neuberger Berman Cayman Commodity Fund I Ltd. (the "CS Subsidiary"), which is organized under the laws of the Cayman Islands. Commodity Strategy ETF is and expects to remain the sole shareholder of the CS Subsidiary. The CS Subsidiary is governed by its own Board of Directors.
As of August 31, 2023, the value of Commodity Strategy's ETF investment in the CS Subsidiary was as follows:
Investment in CS Subsidiary | Percentage of Net Assets | |
$54,397,482 | 19.8 % |
2
Reorganization: On June 23, 2022, the Neuberger Berman Alternative Fund's Board of Trustees approved the reorganization of Neuberger Berman Commodity Strategy Fund (the "Predecessor Fund") to a newly organized series of Neuberger Berman ETF Trust. The reorganization occurred after the close of business on October 21, 2022, and was effected through the reorganization of the Predecessor Fund into the Commodity Strategy ETF and conducted pursuant to an Agreement and Plan of Reorganization (the "Reorganization"). Commodity Strategy ETF was organized solely in connection with the reorganization for the purpose of acquiring the assets and liabilities of the Predecessor Fund and continuing the operations of the Predecessor Fund as an ETF. The Commodity Strategy ETF had no investment operations or performance
ß
Notes to Consolidated Financial Statements for Commodity Strategy ETF
37
history prior to the Reorganization Date. Commodity Strategy ETF is the surviving legal entity, but has adopted the performance, cost basis of securities received and financial history of the Predecessor Fund, which is included in these financial statements.
The Reorganization was structured to be a tax-free reorganization under the U.S. Internal Revenue Code. After the Reorganization, shareholders of the Fund held shares of the Commodity Strategy ETF instead of the Predecessor Fund. The Commodity Strategy ETF has the same investment objective, investment strategy, investment restrictions and portfolio managers as the Predecessor Fund.
The Commodity Strategy ETF opened for trading on NYSE Arca, Inc. on October 24, 2022. In connection with the Reorganization, shareholders of the Predecessor Fund received shares of the Commodity Strategy ETF equal in value to the number of shares of the Predecessor Fund they owned, including a cash payment in lieu of fractional shares of the Predecessor Fund.
3
Consolidation: The accompanying financial statements of Commodity Strategy ETF present the consolidated accounts of Commodity Strategy ETF and the CS Subsidiary. All intercompany accounts and transactions have been eliminated in consolidation.
4
Portfolio valuation: In accordance with ASC 820 "Fair Value Measurement" ("ASC 820"), all investments held by each of the Funds are carried at the value that Management believes a Fund would receive upon selling an investment in an orderly transaction to an independent buyer in the principal or most advantageous market for the investment under current market conditions. Various inputs, including the volume and level of activity for the asset or liability in the market, are considered in valuing the Funds' investments, some of which are discussed below. At times, Management may need to apply significant judgment to value investments in accordance with ASC 820.
ASC 820 established a three-tier hierarchy of inputs to create a classification of value measurements for disclosure purposes. The three-tier hierarchy of inputs is summarized in the three broad Levels listed below.
•
Level 1 – unadjusted quoted prices in active markets for identical investments
•
Level 2 – other observable inputs (including quoted prices for similar investments, interest rates, prepayment speeds, credit risk, amortized cost, etc.)
•
Level 3 – unobservable inputs (including a Fund's own assumptions in determining the fair value of investments)
The inputs or methodology used for valuing an investment are not necessarily an indication of the risk associated with investing in those securities.
The value of the Funds’ investments in equity securities and master limited partnerships and limited partnerships, for which market quotations are available, is generally determined by Management by obtaining valuations from independent pricing services based on the latest sale price quoted on a principal exchange or market for that security (Level 1 inputs). Securities traded primarily on the NASDAQ Stock Market are normally valued at the NASDAQ Official Closing Price ("NOCP") provided by NASDAQ each business day. The NOCP is the most recently reported price as of 4:00:02 p.m., Eastern Time, unless that price is outside the range of the "inside" bid and asked prices (i.e., the bid and asked prices that dealers quote to each other when trading for their own accounts); in that case, NASDAQ will adjust the price to equal the inside bid or asked price, whichever is closer. Because of delays in reporting trades, the NOCP may not be based on the price of the last trade to occur before the market closes. If there is no sale of a security on a particular day, the independent pricing services may value the security based on market quotations.
The value of the Funds’ investments in debt securities is determined by Management primarily by obtaining valuations from independent pricing services based on bid quotations, or if quotations are not available, by methods which include various considerations based on security type (generally Level 2 inputs). In addition to the consideration of yields or prices of securities of comparable quality, coupon, maturity and type, indications as to values from dealers, and general market conditions, the following is a description of other
38
Level 2 inputs and related valuation techniques used by independent pricing services to value certain types of debt securities held by the Fund:
Corporate Bonds. Inputs used to value corporate debt securities generally include relevant credit information, observed market movements, sector news, U.S. Treasury yield curve or relevant benchmark curve, and other market information, which may include benchmark yield curves, reported trades, broker-dealer quotes, issuer spreads, comparable securities, and reference data, such as market research publications, when available ("Other Market Information").
U.S. Treasury Obligations. Inputs used to value U.S. Treasury securities generally include quotes from several inter-dealer brokers and Other Market Information.
U.S. Government Agency Securities. Inputs used to value U.S. Government Agency securities generally include obtaining benchmark quotes and Other Market Information.
Asset-Backed Securities. Inputs used to value asset-backed securities generally include models that consider several factors, which may include the following: prepayment speeds, cash flows, spread adjustments and Other Market Information.
The value of futures contracts is determined by Management by obtaining valuations from independent pricing services at the settlement price at the market close (Level 1 inputs).
Management has developed a process to periodically review information provided by independent pricing services for all types of securities.
Investments in non-exchange traded investment companies are valued using the respective fund’s daily calculated net asset value ("NAV") per share (Level 2 inputs), when available.
If a valuation is not available from an independent pricing service, or if Management has reason to believe that the valuation received does not represent the amount a Fund might reasonably expect to receive on a current sale in an orderly transaction, Management seeks to obtain quotations from brokers or dealers (generally considered Level 2 or Level 3 inputs depending on the number of quotes available). If such quotations are not available, the security is valued using methods Management has approved in the good-faith belief that the resulting valuation will reflect the fair value of the security. Pursuant to Rule 2a-5 under the 1940 Act, the Board designated Management as the Funds' valuation designee. As the Funds' valuation designee, Management is responsible for determining fair value in good faith for all Fund investments. Inputs and assumptions considered in determining fair value of a security based on Level 2 or Level 3 inputs may include, but are not limited to, the type of security; the initial cost of the security; the existence of any contractual restrictions on the security’s disposition; the price and extent of public trading in similar securities of the issuer or of comparable companies; quotations or evaluated prices from broker-dealers or pricing services; information obtained from the issuer and analysts; an analysis of the company’s or issuer’s financial statements; an evaluation of the inputs that influence the issuer and the market(s) in which the security is purchased and sold.
The value of the Funds’ investments in foreign securities is generally determined using the same valuation methods and inputs as other Fund investments, as discussed above. Foreign security prices expressed in local currency values are normally translated from the local currency into U.S. dollars using the exchange rates as of 4:00 p.m., Eastern Time on days the New York Stock Exchange ("NYSE") is open for business. Management has approved the use of ICE Data Services ("ICE") to assist in determining the fair value of foreign equity securities when changes in the value of a certain index suggest that the closing prices on the foreign exchanges may no longer represent the amount that a Fund could expect to receive for those securities or when foreign markets are closed and U.S. markets are open. In each of these events, ICE will provide adjusted prices for certain foreign equity securities using a statistical analysis of historical correlations of multiple factors (Level 2 inputs). Management has also approved the use of ICE to evaluate the prices of foreign debt securities as of the time at which a Fund’s share price is calculated. ICE utilizes benchmark spread and yield curves and evaluates available market activity from the local close to the time as of which a Fund’s share price is calculated (Level 2 inputs) to assist in determining prices for certain foreign debt securities. In the case of both foreign equity and foreign debt securities, in the absence of
39
precise information about the market values of these foreign securities as of the time at which a Fund’s share price is calculated, Management has determined on the basis of available data that prices adjusted or evaluated in this way are likely to be closer to the prices a Fund could realize on a current sale than the prices of those securities established at the close of the foreign markets in which the securities primarily trade.
Fair value prices are necessarily estimates, and there is no assurance that such a price will be at or close to the price at which the security is next quoted or traded.
5
Foreign currency translations: The accounting records of the Funds and the CS Subsidiary are maintained in U.S. dollars. Foreign currency amounts are normally translated into U.S. dollars using the exchange rate as of 4:00 p.m. Eastern Time, on days the NYSE is open for business, to determine the value of investments, other assets and liabilities. Purchase and sale prices of securities, and income and expenses, are translated into U.S. dollars at the prevailing rate of exchange on the respective dates of such transactions. Net unrealized foreign currency gain/(loss), if any, arises from changes in the value of assets and liabilities, other than investments in securities, as a result of changes in exchange rates and is stated separately in the Statements of Operations.
6
Securities transactions and investment income: Securities transactions are recorded on trade date for financial reporting purposes. Dividend income is recorded on the ex-dividend date or, for certain foreign dividends, as soon as a Fund becomes aware of the dividends. Non-cash dividends included in dividend income, if any, are recorded at the fair market value of the securities received. Interest income, including accretion of discount (adjusted for original issue discount, where applicable), and amortization of premium, where applicable, is recorded on the accrual basis. Realized gains and losses from securities transactions and foreign currency transactions, if any, are recorded on the basis of identified cost and stated separately in the Statements of Operations.
7
Income tax information: Each Fund is treated as a separate entity for U.S. federal income tax purposes. It is the policy of each of Carbon Transition & Infrastructure ETF, Disrupters ETF and Next Generation Connected Consumer ETF to qualify for, and the policy of Commodity Strategy ETF to continue to qualify for, treatment as a regulated investment company ("RIC") by complying with the requirements of the U.S. Internal Revenue Code applicable to RICs and to distribute substantially all of its net investment income and net realized capital gains to its shareholders. To the extent a Fund distributes substantially all of its net investment income and net realized capital gains to shareholders, no federal income or excise tax provision is required.
ASC 740 "Income Taxes" sets forth a minimum threshold for financial statement recognition of a tax position taken, or expected to be taken, in a tax return. The Funds recognize interest and penalties, if any, related to unrecognized tax positions as an income tax expense in the Statements of Operations. The Funds are subject to examination by U.S. federal and state tax authorities for returns filed for the tax years for which the applicable statutes of limitations have not yet expired. Management has analyzed each Fund's tax positions taken or expected to be taken on federal and state income tax returns for all open tax years (the current and the prior three tax years) and has concluded that no provision for income tax is required in the Funds' financial statements.
The CS Subsidiary is a controlled foreign corporation under the U.S. Internal Revenue Code. As a U.S. shareholder of a controlled foreign corporation, Commodity Strategy ETF will include in its taxable income its share of the CS Subsidiary’s current earnings and profits (including net realized gains). Any deficit generated by the CS Subsidiary will be disregarded for purposes of computing Commodity Strategy ETF's taxable income in the current period and also disregarded for all future periods.
40
For federal income tax purposes, the estimated cost and unrealized appreciation/(depreciation) in value of investments held at August 31, 2023 were as follows:
Cost | Gross Unrealized Appreciation | Gross Unrealized Depreciation | Net Unrealized Appreciation/ (Depreciation) | |
Carbon Transition & Infrastructure ETF | $26,410,565 | $2,072,152 | $2,917,729 | $(845,577 ) |
Commodity Strategy ETF | 344,842,295 | 19,924,086 | 108,306,173 | (88,382,087 ) |
Disrupters ETF | 9,674,840 | 1,667,949 | 223,000 | 1,444,949 |
Next Generation Connected Consumer ETF | 5,629,503 | 469,089 | 706,635 | (237,546 ) |
Income distributions and capital gain distributions are determined in accordance with income tax regulations, which may differ from GAAP. These differences are primarily due to differing treatments of income and gains on various investment securities held by each Fund, timing differences and differing characterization of distributions made by each Fund. The Funds may also utilize earnings and profits distributed to shareholders on redemption of their shares as a part of the dividends-paid deduction for income tax purposes.
Any permanent differences resulting from different book and tax treatment are reclassified at year-end and have no impact on net income, NAV or NAV per share of the Funds. For the year ended August 31, 2023, the Funds recorded permanent reclassifications related to one or more of the following: net operating losses written off, non-deductible partnership expense, wholly owned subsidiary income & gain (loss), and gains (losses) & tax adjustments on securities redeemed in kind. For the year ended August 31, 2023, the Funds recorded the following permanent reclassifications:
Paid-in Capital | Total Distributable Earnings/(Losses) | |
Carbon Transition & Infrastructure ETF | $— | $— |
Commodity Strategy ETF | (24,068,674 ) | 24,068,674 |
Disrupters ETF | 670,592 | (670,592 ) |
Next Generation Connected Consumer ETF | (522 ) | 522 |
The tax character of distributions paid during the year ended August 31, 2023, and during the period ended August 31, 2022, was as follows:
Distributions Paid From: | ||||||||
Ordinary Income | Long-Term Capital Gain | Return of Capital | Total | |||||
2023 | 2022 | 2023 | 2022 | 2023 | 2022 | 2023 | 2022 | |
Carbon Transition & Infrastructure ETF | $45,923 | $— | $— | $— | $— | $— | $45,923 | $— |
Commodity Strategy ETF(a)(b) | 27,372,087 | 55,270,948 (c) | — | — | — | — | 27,372,087 | 55,270,948 (c) |
Disrupters ETF | — | — | — | — | — | — | — | — |
Next Generation Connected Consumer ETF | 5,300 | — | — | — | — | — | 5,300 | — |
(a) | Ordinary Income of $641,535 for the year ended October 31, 2021. |
(b) | On June 23, 2022, the Neuberger Berman Alternative Funds' Board of Trustees approved a change in fiscal year end from October 31 to August 31 for the Predecessor Fund. This change was effective beginning with the prior fiscal period, November 1, 2021. |
(c) | Period from November 1, 2021 to August 31, 2022. |
41
As of August 31, 2023, the components of distributable earnings (accumulated losses) on a U.S. federal income tax basis were as follows:
Undistributed Ordinary Income | Undistributed Long-Term Capital Gain | Unrealized Appreciation/ (Depreciation) | Loss Carryforwards and Deferrals | Other Temporary Differences | Total | |
Carbon Transition & Infrastructure ETF | $258,231 | $— | $(867,878 ) | $(94,413 ) | $— | $(704,060 ) |
Commodity Strategy ETF | 6,408,930 | — | (88,382,087 ) | (2,702,050 ) | (209 ) | (84,675,416 ) |
Disrupters ETF | — | — | 1,444,949 | (793,442 ) | — | 651,507 |
Next Generation Connected Consumer ETF | 24,043 | — | (237,542 ) | (310,111 ) | — | (523,610 ) |
The temporary differences between book basis and tax basis distributable earnings are primarily related to one or more of the following: losses disallowed and/or recognized on wash sales, amortization of organizational expenses, amortization of bond premium, wholly owned subsidiary inclusions and tax adjustments related to partnerships and other investments.
To the extent each Fund’s net realized capital gains, if any, can be offset by capital loss carryforwards, it is the policy of each Fund not to distribute such gains. Capital loss carryforward rules allow for RICs to carry forward capital losses indefinitely and to retain the character of capital loss carryforwards as short-term or long-term. As determined at August 31, 2023, the following Funds had unused capital loss carryforwards available for federal income tax purposes to offset future net realized capital gains, if any, as follows:
Capital Loss Carryforwards | ||
Long-Term | Short-Term | |
Carbon Transition & Infrastructure ETF | $— | $94,413 |
Commodity Strategy ETF | 142,194 | 2,559,856 |
Disrupters ETF | 99,953 | 677,860 |
Next Generation Connected Consumer ETF | 195,408 | 114,703 |
Under current tax regulations, capital losses realized on investment transactions after October 31 may be deferred and treated as occurring on the first day of the following fiscal year. Under the current tax rules, the Funds may also defer any realized late-year ordinary losses as occurring on the first day of the following fiscal year. Late-year ordinary losses represent ordinary losses realized on investment transactions after December 31 and specified losses (ordinary losses from the sale, exchange, or other disposition of property, net foreign currency losses and net PFIC mark to market losses) realized on investment transactions after October 31. For the year ended August 31, 2023, the Funds elected to defer the following late-year ordinary losses and post October capital losses:
Late-Year Ordinary Loss Deferral | Post October Capital Loss Deferral | |
Disrupters ETF | $(15,629 ) | $— |
8
Foreign taxes: Foreign taxes withheld, if any, represent amounts withheld by foreign tax authorities, net of refunds recoverable.
9
Distributions to shareholders: Each Fund may earn income, net of expenses, daily on its investments. Distributions from net investment income and net realized capital gains, if any, are generally distributed once a year (usually in December) and are recorded on the ex-date.
10
Investments in foreign securities: Investing in foreign securities may involve sovereign and other risks, in addition to the credit and market risks normally associated with domestic securities. These additional risks include the possibility of adverse political and economic developments (including political instability, nationalization, expropriation, or confiscatory taxation) and the potentially adverse effects of unavailability of public information regarding issuers, less governmental supervision and regulation of financial markets,
42
reduced liquidity of certain financial markets, and the lack of uniform accounting, auditing, and financial reporting standards or the application of standards that are different or less stringent than those applied in the United States. Foreign securities also may experience greater price volatility, higher rates of inflation, and delays in settlement.
11
Investment company securities and other exchange-traded funds: The Funds may invest in shares of other registered investment companies, including other exchange-traded funds ("ETFs"), within the limitations prescribed by the 1940 Act, in reliance on rules adopted by the SEC, particularly Rule 12d1-4 or any other applicable exemptive relief. Rule 12d1-4 permits investments in other registered investment companies in excess of the limitations of the 1940 Act if a Fund complies with the conditions of the Rule. Shareholders of a Fund will indirectly bear their proportionate share of any management fees and other expenses paid by such other investment companies, in addition to the management fees and expenses of the Fund.
12
When-issued/delayed delivery securities: Commodity Strategy ETF may purchase securities with delivery or payment to occur at a later date beyond the normal settlement period. At the time a Fund enters into a commitment to purchase a security, the transaction is recorded and the value of the security is reflected in the NAV. The price of such security and the date when the security will be delivered and paid for are fixed at the time the transaction is negotiated. The value of the security may vary with market fluctuations. No interest accrues to a Fund until payment takes place. When-issued and delayed delivery transactions can have a leverage-like effect on a Fund, which can increase fluctuations in the Fund’s NAV. Certain risks may arise upon entering into when-issued or delayed delivery securities transactions from the potential inability of counterparties to meet the terms of their contracts or if the issuer does not issue the securities due to political, economic, or other factors. Additionally, losses may arise due to changes in the value of the underlying securities.
Commodity Strategy ETF may also enter into a TBA agreement and "roll over" such agreement prior to the settlement date by selling the obligation to purchase the pools set forth in the agreement and entering into a new TBA agreement for future delivery of pools of mortgage-backed securities. TBA mortgage-backed securities may increase prepayment risks because the underlying mortgages may be less favorable than anticipated by a Fund.
13
Derivative instruments: Commodity Strategy ETF's use of derivatives during the year ended August 31, 2023, is described below. Please see the Consolidated Schedule of Investments for the Fund's open positions in derivatives at August 31, 2023. The disclosure requirements of ASC 815 "Derivatives and Hedging" ("ASC 815") distinguish between derivatives that qualify for hedge accounting and those that do not. Because investment companies value their derivatives at fair value and recognize changes in fair value through the Statements of Operations, they do not qualify for hedge accounting. Accordingly, even though a Fund’s investments in derivatives may represent economic hedges, they are considered non-hedge transactions for purposes of this disclosure.
Rule 18f-4 under the 1940 Act regulates the use of derivatives for certain funds registered under the 1940 Act ("Rule 18f-4"). Unless a Fund qualifies as a "limited derivatives user'' as defined in Rule 18f-4, the Fund is subject to a comprehensive derivatives risk management program, is required to comply with certain value-at-risk based leverage limits and is required to provide additional disclosure both publicly and to the SEC regarding its derivatives positions. If a Fund qualifies as a limited derivatives user, Rule 18f-4 requires the Fund to have policies and procedures to manage its aggregate derivatives risk.
Futures contracts: During the year ended August 31, 2023, Commodity Strategy ETF used commodity futures contracts (through investments in the CS Subsidiary) to provide investment exposure to individual commodities, as well as to manage and/or adjust the risk profile of the Fund.
At the time a Fund or CS Subsidiary enters into a futures contract, it is required to deposit with the futures commission merchant a specified amount of cash or liquid securities, known as "initial margin," which is a percentage of the value of the futures contract being traded that is set by the exchange upon which the futures contract is traded. Each day, the futures contract is valued at the official settlement price of the board of trade or U.S. commodity exchange on which such futures contract is traded. Subsequent payments, known as "variation margin," to and from the broker are made on a daily basis, or as needed, as
43
the market price of the futures contract fluctuates. Daily variation margin adjustments, arising from this "mark to market," are recorded by the Fund or CS Subsidiary as unrealized gains or losses.
Although some futures by their terms call for actual delivery or acquisition of the underlying securities or currency, in most cases the contracts are closed out prior to delivery by offsetting purchases or sales of matching futures. When the contracts are closed or expire, a Fund or CS Subsidiary recognizes a gain or loss. Risks of entering into futures contracts include the possibility there may be an illiquid market, possibly at a time of rapidly declining prices, and/or a change in the value of the contract may not correlate with changes in the value of the underlying securities. Futures executed on regulated futures exchanges have minimal counterparty risk to a Fund or CS Subsidiary because the exchange’s clearinghouse assumes the position of the counterparty in each transaction. Thus, a Fund or CS Subsidiary is exposed to risk only in connection with the clearinghouse and not in connection with the original counterparty to the transaction.
For U.S. federal income tax purposes, the futures transactions undertaken by a Fund or CS Subsidiary may cause the Fund or CS Subsidiary to recognize gains or losses from marking contracts to market even though its positions have not been sold or terminated, may affect the character of the gains or losses recognized as long-term or short-term, and may affect the timing of some capital gains and losses realized by the Fund or CS Subsidiary. Also, a Fund’s or CS Subsidiary's losses on transactions involving futures contracts may be deferred rather than being taken into account currently in calculating such Fund’s or CS Subsidiary's taxable income.
At August 31, 2023, the Fund had the following derivatives (which did not qualify as hedging instruments under ASC 815), grouped by primary risk exposure:
Asset Derivatives | Liability Derivatives | |||
Fund | Statements of Assets and Liabilities Location | Value | Statements of Assets and Liabilities Location | Value |
Commodity Strategy ETF | ||||
Futures | ||||
Commodity risk | Receivable/Payable for accumulated variation margin on futures contracts | $19,537,751 | Receivable/Payable for accumulated variation margin on futures contracts | $(13,981,430 ) |
The impact of the use of these derivative instruments on the Statements of Operations during the year ended August 31, 2023, was as follows:
Fund | Net Realized Gain/ (Loss) on Derivatives(a) | Change in Net Unrealized Appreciation/ (Depreciation) on Derivatives(b) | |
Commodity Strategy ETF | |||
Futures | |||
Commodity risk | $(25,522,103 ) | 13,763,710 |
(a) | Net realized gain/(loss) on derivatives is located in the Statements of Operations each under the caption, "Net realized gain/(loss) on:" |
Futures | Expiration or closing of futures contracts |
(b) | Change in net unrealized appreciation/(depreciation) is located in the Statements of Operations each under the caption, "Change in net unrealized appreciation/(depreciation) in value of:" |
Futures | Futures contracts |
14
Securities lending: Each Fund, using State Street Bank and Trust Company ("State Street") as its lending agent, may loan securities to qualified brokers and dealers in exchange for negotiated lender’s fees. These
44
fees, if any, would be disclosed within the Statements of Operations under the caption "Income from securities loaned-net" and are net of expenses retained by State Street as compensation for its services as lending agent.
The initial collateral received by a Fund at the beginning of each transaction shall have a value equal to at least 102% of the prior day’s market value of the loaned securities (105% in the case of international securities). Collateral in the form of cash and/or securities issued or guaranteed by the U.S. government or its agencies, equivalent to at least 100% of the market value of securities, is maintained at all times. Thereafter, the value of the collateral is monitored on a daily basis, and collateral is moved daily between a counterparty and a Fund until the close of the transaction. Cash collateral is generally invested in a money market fund registered under the 1940 Act that is managed by an affiliate of State Street and is included on the Statements of Assets and Liabilities under the caption "Investments in securities at value—Unaffiliated issuers". The total value of securities received as collateral for securities on loan is included in a footnote following the applicable Schedule of Investments, but is not included within the Statements of Assets and Liabilities because the receiving Fund does not have the right to sell or repledge the securities received as collateral. The risks associated with lending portfolio securities include, but are not limited to, possible delays in receiving additional collateral or in the recovery of the loaned securities. Any increase or decrease in the fair value of the securities loaned and any interest earned or dividends paid or owed on those securities during the term of the loan would accrue to that Fund.
As of August 31, 2023, the Fund listed below had outstanding loans of securities to certain approved brokers with a value as follows:
Value of Securities Loaned | |
Carbon Transition & Infrastructure ETF | $1,189,650 |
As of August 31, 2023, the Fund listed below had outstanding loans of securities to certain approved brokers for which the Fund received collateral as follows:
Remaining Contractual Maturity of the Agreements | |||||
Overnight and Continuous | Less Than 30 Days | Between 30 & 90 days | Greater Than 90 Days | Total | |
Securities Lending Transactions(a) | |||||
Common Stocks | |||||
Carbon Transition & Infrastructure ETF | $1,225,251 | $— | $— | $— | $1,225,251 |
(a) | Amounts represent the payable for loaned securities collateral received. |
15
Offsetting Assets and Liabilities: The Funds are required to disclose both gross and net information for assets and liabilities related to over-the-counter derivatives, and securities lending and securities borrowing transactions that are eligible for offset or subject to an enforceable master netting or similar agreement. Carbon Transition & Infrastructure ETF held one or more of these investments at August 31, 2023. The Funds’ securities lending assets at fair value are reported gross in the Statements of Assets and Liabilities. The following tables present securities lending assets by counterparty and net of the related collateral received by a Fund as of August 31, 2023.
Description | Gross Amounts of Assets Presented in the Statements of Assets and Liabilities | Gross Amounts of Liabilities Presented in the Statements of Assets and Liabilities |
Carbon Transition & Infrastructure ETF | ||
Securities lending | $1,189,650 | $— |
45
Gross Amounts Not Offset in the Statements of Assets and Liabilities: | ||||||||
Assets | Liabilities | |||||||
Counterparty | Gross Amounts Presented in the Statements of Assets and Liabilities | Liabilities Available for Offset | Collateral Received(a) | Net Amount(b) | Gross Amounts Presented in the Statements of Assets and Liabilities | Assets Available for Offset | Collateral Pledged(a) | Net Amount(b) |
Carbon Transition & Infrastructure ETF | ||||||||
SSB | $1,189,650 | $— | $(1,189,650 ) | $— | $— | $— | $— | $— |
Total | $1,189,650 | $— | $(1,189,650 ) | $— | $— | $— | $— | $— |
(a) | Collateral received (or pledged) is limited to an amount not to exceed 100% of the net amount of assets (or liabilities) in the tables presented above, for each respective counterparty. |
(b) | A net amount greater than zero represents amounts subject to loss as of August 31, 2023, in the event of a counterparty failure. A net amount less than zero represents amounts under-collateralized to each counterparty as of August 31, 2023. |
16
Indemnifications: Like many other companies, the Trust’s organizational documents provide that its officers ("Officers") and trustees ("Trustees") are indemnified against certain liabilities arising out of the performance of their duties to the Trust. In addition, both in some of its principal service contracts and in the normal course of its business, the Trust enters into contracts that provide indemnifications to other parties for certain types of losses or liabilities. The Trust’s maximum exposure under these arrangements is unknown as this could involve future claims against the Trust or a Fund.
Note B—Investment Management Fees, Administration Fees, Distribution Arrangements, and Other Transactions with Affiliates:
Carbon Transition & Infrastructure ETF, Disrupters ETF and Next Generation Connected Consumer ETF:
Each Fund retains NBIA as investment manager under a Management Agreement. Under the Management Agreement, Management is responsible for choosing a Fund’s investments and handling its day-to-day business. In addition, Management provides to each Fund certain Fund services and administrative services as specified in the Management Agreement.
Commodity Strategy ETF:
The Fund retains NBIA as investment manager under a Management Agreement. Under the Management Agreement, Management is responsible for choosing the Fund’s investments and handling its day-to-day business and certain Fund services.
For such investment management services, the Funds pay NBIA an investment management fee as a percentage of average daily net assets(a) according to the following table: | |||||||
First $250 million | Next $250 million | Next $250 million | Next $250 million | Next $500 million | Next $2.5 billion | Thereafter | |
Carbon Transition & Infrastructure ETF(b) | 0.65 % | 0.65 % | 0.65 % | 0.65 % | 0.65 % | 0.65 % | 0.65 % |
Commodity Strategy ETF and CS Subsidiary | 0.50 % | 0.475 % | 0.45 % | 0.425 % | 0.40 % | 0.375 % | 0.35 % |
Disrupters ETF(b) | 0.65 % | 0.65 % | 0.65 % | 0.65 % | 0.65 % | 0.65 % | 0.65 % |
Next Generation Connected Consumer ETF(b) | 0.65 % | 0.65 % | 0.65 % | 0.65 % | 0.65 % | 0.65 % | 0.65 % |
(a) | Less the net assets of the CS Subsidiary for Commodity Strategy ETF. |
46
(b) | NBIA has contractually agreed to waive its management fee by 0.10% of Carbon Transition & Infrastructure ETF, Disrupters ETF and Next Generation Connected Consumer's ETF's average net assets. This undertaking lasts until April 8, 2024 and may not be terminated during its term without the consent of the Board. Management fees contractually waived are not subject to recovery by NBIA. |
Management fees waived for the year ended August 31, 2023 were as follows:
Fund | Percentage of Average Daily Net Assets | Effective Date(s) | Management Fees Waived for the Year Ended August 31, 2023 |
Carbon Transition & Infrastructure ETF | 0.10 % | 4/6/2022 | $16,570 |
Disrupters ETF | 0.10 % | 4/6/2022 | $8,914 |
Next Generation Connected Consumer ETF | 0.10 % | 4/6/2022 | $5,115 |
Accordingly, for the year ended August 31, 2023, the investment management fee pursuant to the Management Agreement was equivalent to an annual effective rate of the Fund's average daily net assets, as follows:
Effective Rate | ||
Carbon Transition & Infrastructure ETF | 0.55 % | |
Commodity Strategy ETF(a) | 0.50 % | |
CS Subsidiary | 0.50 % | |
Disrupters ETF | 0.55 % | |
Next Generation Connected Consumer ETF | 0.55 % | |
(a) | Less the net assets of the CS Subsidiary. |
Carbon Transition & Infrastructure ETF, Disrupters ETF and Next Generation Connected Consumer ETF:
NBIA has contractually agreed to pay all operating expenses of each Fund, except (i) interest and taxes (including, but not limited to, income, excise, transaction, transfer and withholding taxes); (ii) brokerage expenses, including commissions, and other transaction costs; (iii) acquired fund fees and expenses; (iv) dividend and interest expenses relating to short sales; (v) expenses incurred in connection with any distribution plan adopted by the Trust in compliance with Rule 12b-1 under the 1940 Act, including distribution fees; (vi) the compensation payable to NBIA under this Agreement; (vii) securities lending expenses; (viii) litigation expenses and tax reclaim expenses; (ix) indemnification expenses; and (x) any expenses determined to be extraordinary expenses by the Board. During the year ended August 31, 2023, each Fund did not pay for any expenses other than the investment management fee. With the Funds' consent, Management may subcontract to third parties some of its responsibilities to the Funds under the Management Agreement and may compensate each such third party that provides such services. Certain expenses that are outside of the investment management fee, as described above, may be applicable to multiple funds within the complex of related investment companies and such allocations are handled as follows: Expenses directly attributable to a Fund are charged to that Fund. Expenses borne by the complex of related investment companies, which includes open-end and closed-end investment companies for which NBIA serves as investment manager, that are not directly attributable to a particular investment company (e.g., a Fund) are allocated among that Fund and the other investment companies or series thereof in the complex on the basis of relative net assets, except where a more appropriate allocation of expenses to each of the investment companies or series thereof in the complex can otherwise be made fairly.
Commodity Strategy ETF:
NBIA has contractually agreed to waive fees and/or reimburse certain expenses of Commodity Strategy ETF so that the total annual operating expenses of those classes do not exceed the expense limitations as detailed in the following table. These undertakings exclude interest, brokerage
47
commissions, acquired fund fees and expenses, taxes including any expenses relating to tax reclaims, extraordinary expenses, and dividend and interest expenses relating to short sales, if any (commitment fees relating to borrowings are treated as interest for purposes of this exclusion) ("annual operating expenses"); consequently, net expenses may exceed the contractual expense limitations. The expenses of the CS Subsidiary are included in the total expenses used to calculate the reimbursement, which the Fund has agreed to share with the CS Subsidiary. For the year ended August 31, 2023, the expenses of the CS Subsidiary amounted to $339,061. Prior to the Reorganization, the Predecessor Fund incurred fees and engaged in transactions with affiliates. Expenses, other than management fees, which include balances of both the Predecessor Fund and Commodity Strategy ETF, as shown in the Consolidated Statement of Operations were expenses incurred by the Predecessor Fund.
At August 31, 2023, Commodity Strategy ETF's contingent liabilities to NBIA under the agreement were as follows:
Expenses Reimbursed in Year Ended August 31, | |||||
2021(a) | 2022(b) | 2023 | |||
Subject to Repayment until August 31, | |||||
Class | Contractual Expense Limitation(c) | Expiration | 2024 | 2025 | 2026 |
Commodity Strategy ETF | 0.64 %(d) | 8/31/26 | $300,249 | $290,598 | $269,368 |
(a) | Year ended October 31. |
(b) | Period from November 1, 2021 to August 31, 2022. |
(c) | Expense limitation per annum of the Fund's average daily net assets. |
(d) | Expenses waived or reimbursed prior to the close of business on October 21, 2022 are of the Predecessor Fund which had contractual expense limitations of 0.73% for its Institutional Class. |
Commodity Strategy ETF has agreed that it will repay NBIA for fees and expenses waived or reimbursed provided that repayment does not cause that the Fund's annual operating expenses to exceed its contractual expense limitation in place at the time the fees and expenses were waived or reimbursed, or the expense limitation in place at the time the Fund repays NBIA, whichever is lower. Any such repayment must be made within three years after the year in which NBIA incurred the expense.
During the year ended August 31, 2023, there was no repayment to NBIA under this agreement.
NBIA retains State Street as its sub-administrator under a Sub-Administration Agreement. NBIA pays State Street a fee for all services received under the Sub-Administration Agreement.
Commodity Strategy ETF retains NBIA as its administrator under an Administration Agreement. The administration fee was assessed at the class level prior to October 24, 2022 and each share class of the Predecessor Fund, as applicable, paid NBIA an annual administration fee equal to the following: 0.26% for each of Class A and Class C; and 0.15% for Institutional Class, each as a percentage of its average daily net assets. Effective October 24, 2022, after the Reorganization, Commodity Strategy ETF pays NBIA a fee at the annual rate of 0.09% of the Fund's average daily net assets.
Neuberger Berman BD LLC (the "Distributor") serves as the distributor in connection with the continuous offering of each Fund’s shares. Each Fund (except Commodity Strategy ETF) also has a distribution agreement that allows the Fund to pay distribution fees to the Distributor and other firms that provide distribution services ("Service Providers"). Under their distribution plans (each a Plan, collectively, the "Plans") if a Service Provider provides distribution services, a Fund would pay distribution fees to the Distributor at an annual rate not to exceed 0.25%
48
of average daily net assets, pursuant to Rule 12b-1 under the 1940 Act. The Distributor would, in turn, pay the Service Provider out of its fees. The Board currently has determined not to implement any 12b-1 fees pursuant to the Plan. 12b-1 fees may only be imposed after approval by the Board.
Note C—Securities Transactions:
During the year ended August 31, 2023, there were purchase and sale transactions of long-term securities and in-kind capital share transactions as follows:
Transactions of Long-Term Securities | In-kind Capital Share Transactions | |||
Purchases | Sales | Purchases | Sales | |
Carbon Transition & Infrastructure ETF | $1,657,726 | $1,944,755 | $19,944,386 | $— |
Commodity Strategy ETF(a) | 94,474,904 | 118,961,005 | — | — |
Disrupters ETF | 2,797,347 | 2,715,980 | 12,167,525 | 8,948,012 |
Next Generation Connected Consumer ETF | 2,200,277 | 2,125,168 | — | — |
(a) | Includes purchases of U.S. Government and Agency Obligations of $3,557,330. |
During the year ended August 31, 2023, no brokerage commissions on securities transactions were paid to affiliated brokers.
Note D—Fund Share Transactions:
The Funds issue or redeem capital shares in aggregation of a specified number of shares (each, a "Creation Unit") to certain institutional investors (typically market makers or other broker-dealers) on a continuous basis through the Distributor. Currently, the number of shares that constitutes a Creation Unit is 25,000 shares. Creation Unit transactions are typically conducted in exchange for the deposit or delivery of a designated portfolio of in-kind securities, cash or a combination thereof, consistent with a Fund's investment objective, policies and disclosure.
Share activity for the year ended August 31, 2023, was as follows:
Fund | Shares Sold | Shares Issued on Reinvestment of Dividends and Distributions | Shares Redeemed | Total |
Carbon Transition & Infrastructure ETF | 825,000 | — | — | 825,000 |
Commodity Strategy ETF(1) | 6,529,664 | 1,043,373 | (3,544,404 ) | 4,028,633 |
Disrupters ETF | 650,000 | — | (450,000 ) | 200,000 |
Next Generation Connected Consumer ETF | — | — | — | — |
(1) | After the close of business on October 21, 2022, the Predecessor Fund was reorganized into Commodity Strategy ETF. The share activities disclosed include those of the Predecessor Fund's Institutional Class. Prior to the close of business on October 21, 2022, the Predecessor Fund had 118,431 and 38,648 of Class A and Class C shares sold, 743,233 and 10,917 of Class A and Class C shares issued on reinvestment of dividends and distributions and 6,356,379 and 102,880 of Class A and Class C shares redeemed, respectively. |
49
Share activity for the period ended August 31, 2022, was as follows:
Fund | Shares Sold | Shares Issued on Reinvestment of Dividends and Distributions | Shares Redeemed | Total |
Carbon Transition & Infrastructure ETF(1) | 225,001 | — | — | 225,001 |
Commodity Strategy ETF(2) | 7,340,785 (3) | 3,976,440 (4) | (5,447,728 )(5) | 5,869,497 |
Disrupters ETF(1) | 279,000 | — | — | 279,000 |
Next Generation Connected Consumer ETF(1) | 250,001 | — | — | 250,001 |
(1) | Period from April 6, 2022 (Commencement of Operations) to August 31, 2022. |
(2) | Share activity is for the Predecessor Fund, for the period from November 1, 2021 to August 31, 2022. |
(3) | Includes shares of Institutional Class 5,117,728, Class A 2,169,512 and Class C 53,545, respectively. |
(4) | Includes shares of Institutional Class 2,084,342, Class A 1,890,117 and Class C 1,981, respectively. |
(5) | Includes shares of Institutional Class (3,382,268), Class A (2,057,845) and Class C (7,615), respectively. |
Share activity for the year ended October 31, 2021, was as follows:
Fund | Shares Sold | Shares Issued on Reinvestment of Dividends and Distributions | Shares Redeemed | Total |
Commodity Strategy ETF(1) | 7,478,561 (2) | 111,062 (3) | (6,472,093 )(4) | 1,117,530 |
(1) | Share activity is for the Predecessor Fund, for the year ended October 31, 2021. |
(2) | Includes shares of Institutional Class 1,470,242, Class A 956,126 and Class C 5,403, respectively. |
(3) | Includes shares of Institutional Class 22,415 and Class A 11,703, respectively. |
(4) | Includes shares of Institutional Class (1,197,351), Class A (1,163,240) and Class C (1,445), respectively |
The dollar amounts disclosed in the Statements of Changes and referenced in footnote (c) are the total from fund share transactions of the Institutional Class shares, Class A shares and Class C shares of the Predecessor Fund:
For the Year Ended August 31, 2023 | Period From November 1, 2021 to August 31, 2022 | |||||||
Proceeds from Shares Sold | Proceeds from Reinvestment of Dividends and Distributions | Payments for Shares Redeemed | Total | Proceeds from Shares Sold | Proceeds from Reinvestment of Dividends and Distributions | Payments for Shares Redeemed | Total | |
Commodity Strategy ETF | ||||||||
Institutional Class | $33,206,336 | $22,014,427 | $(38,364,412 ) | $16,856,351 | $135,750,562 | $45,825,965 | $(89,597,836 ) | $91,978,691 |
Class A | 616,747 | 3,433,738 | (31,758,741 ) | (27,708,256 ) | 12,529,181 | 9,129,267 | (11,773,110 ) | 9,885,338 |
Class C | 212,134 | 50,436 | (511,669 ) | (249,099 ) | 330,177 | 9,547 | (45,016 ) | 294,708 |
50
For the Year Ended October 31, 2021 | ||||
Proceeds from Shares Sold | Proceeds from Reinvestment of Dividends and Distributions | Payments for Shares Redeemed | Total | |
Commodity Strategy ETF | ||||
Institutional Class | $44,013,444 | $569,330 | $(34,656,618 ) | $9,926,156 |
Class A | 6,431,839 | 66,000 | (7,764,625 ) | (1,266,786 ) |
Class C | 35,000 | — | (8,422 ) | 26,578 |
Note E—Line of Credit:
At August 31, 2023, each Fund was a participant in a syndicated committed, unsecured $700,000,000 line of credit (the "Credit Facility"), to be used only for temporary or emergency purposes. Series of other investment companies managed by NBIA also participate in this line of credit on substantially the same terms. Interest is charged on borrowings under the Credit Facility at the highest of (a) a federal funds effective rate plus 1.00% per annum, (b) a daily simple Secured Overnight Financing Rate ("SOFR") plus 1.10% per annum, and (c) an overnight bank funding rate plus 1.00% per annum. The Credit Facility has an annual commitment fee of 0.15% per annum of the available line of credit, which is paid quarterly. Each Fund that is a participant has agreed to pay its pro rata share of the annual commitment fee, based on the ratio of its individual net assets to the net assets of all participants at the time the fee is due, and interest charged on any borrowing made by such Fund and other costs incurred by such Fund. Because several funds participate in the Credit Facility, there is no assurance that an individual fund will have access to all or any part of the $700,000,000 at any particular time. There were no loans outstanding under the Credit Facility at August 31, 2023. During the year ended August 31, 2023, none of the Funds utilized the Credit Facility.
Note F—Investments in Affiliates:
At August 31, 2023, affiliated persons (as defined in the 1940 Act) owned outstanding shares of the following Funds:
Affiliated Person(s) Percentage Ownership of Outstanding Shares | |
Carbon Transition & Infrastructure ETF | 19.05% |
Commodity Strategy ETF | 0.00% |
Disrupters ETF | 42.59% |
Next Generation Connected Consumer ETF | 80.00% |
Note G—Change in Fiscal Year End:
On June 23, 2022, the Neuberger Berman Alternative Funds' Board of Trustees approved a change in fiscal year end from October 31 to August 31 for the Predecessor Fund. This change was effective beginning with the prior fiscal period, November 1, 2021.
51
Note H—Recent Accounting Pronouncements:
In June 2022, FASB issued Accounting Standards Update No. 2022-03, "Fair Value Measurement of Equity Securities Subject to Contractual Sale Restrictions" ("ASU 2022-03"). ASU 2022-03 clarifies the guidance in ASC 820, related to the measurement of the fair value of an equity security subject to contractual sale restrictions, where it eliminates the ability to apply a discount to the fair value of these securities, and introduces disclosure requirements related to such equity securities. The guidance is effective for fiscal years, and interim periods within those fiscal years, beginning after December 15, 2023, and allows for early adoption. Management is currently evaluating the impact of applying this update.
In December 2022, the FASB issued Accounting Standards Update No. 2022-06, "Reference Rate Reform (Topic 848)" ("ASU 2022-06"), which is an update to Accounting Standards Update No. 2021-01, "Reference Rate Reform (Topic 848)" ("ASU 2021-01") and defers the sunset date for applying the reference rate reform relief in Topic 848. ASU 2021-01 is an update of ASU 2020-04, which is in response to concerns about structural risks of interbank offered rates, and particularly the risk of cessation of LIBOR. Regulators have undertaken reference rate reform initiatives to identify alternative reference rates that are more observable or transaction based and less susceptible to manipulation. ASU 2020-04 provides optional guidance for a limited period of time to ease the potential burden in accounting for (or recognizing the effects of) reference rate reform on financial reporting. ASU 2020-04 is elective and applies to all entities, subject to meeting certain criteria, that have contracts, hedging relationships, and other transactions that reference LIBOR or another reference rate expected to be discontinued because of reference rate reform. The ASU 2021-01 update clarifies that certain optional expedients and exceptions in Topic 848 for contract modifications and hedge accounting apply to derivatives that are affected by the discounting transition. The amendments in this update are effective immediately through December 31, 2024, for all entities. Management is currently evaluating the implications, if any, of the additional requirements and its impact on the Funds' financial statements.
52
Financial Highlights
The following tables include selected data for a share outstanding throughout each period and other performance information derived from the Financial Statements. Amounts that do not round to $0.01 or $(0.01) per share are presented as $0.00 or $(0.00), respectively. Ratios that do not round to 0.01% or (0.01)% are presented as 0.00% or (0.00)%, respectively. A "—" indicates that the line item was not applicable in the corresponding period.
Net Asset Value, Beginning of Period | Net Investment Income/ (Loss)a | Net Gains or Losses on Securities (both realized and unrealized) | Total Income (Loss) From Investment Operations | Dividends from Net Investment Income | Distributions from Net Realized Capital Gains | Total Distributions | |
Carbon Transition & Infrastructure ETF | |||||||
8/31/2023 | $24.20 | $0.41 | $(0.25 ) | $0.16 | $(0.20 ) | $— | $(0.20 ) |
Period from 4/6/2022e to 8/31/2022 | $25.15 | $0.14 | $(1.09 ) | $(0.95 ) | $— | $— | $— |
Commodity Strategy ETFh,i | |||||||
8/31/2023 | $25.91 | $0.86 | $(1.02 ) | $(0.16 ) | $(3.07 ) | $— | $(3.07 ) |
Period from 11/1/2021 to 8/31/2022j,k | $34.57 | $0.04 | $2.65 | $2.69 | $(11.35 ) | $— | $(11.35 ) |
10/31/2021 | $22.52 | $(0.09 ) | $12.27 | $12.18 | $(0.13 ) | $— | $(0.13 ) |
10/31/2020 | $26.60 | $0.18 | $(3.82 ) | $(3.64 ) | $(0.44 ) | $— | $(0.44 ) |
10/31/2019 | $27.44 | $0.53 | $(0.71 ) | $(0.18 ) | $(0.66 ) | $(0.00 ) | $(0.66 ) |
10/31/2018 | $28.19 | $0.35 | $(0.04 ) | $0.31 | $(1.06 ) | $— | $(1.06 ) |
Disrupters ETF | |||||||
8/31/2023 | $19.43 | $(0.05 ) | $3.89 | $3.84 | $— | $— | $— |
Period from 4/6/2022e to 8/31/2022 | $24.02 | $(0.01 ) | $(4.58 ) | $(4.59 ) | $— | $— | $— |
Next Generation Connected Consumer ETF | |||||||
8/31/2023 | $19.11 | $0.12 | $2.37 | $2.49 | $(0.02 ) | $— | $(0.02 ) |
Period from 4/6/2022e to 8/31/2022 | $24.16 | $0.02 | $(5.07 ) | $(5.05 ) | $— | $— | $— |
See Notes to Financial Highlights
53
Net Asset Value, End of Period | Total Returnb | Net Assets, End of Year (in millions) | Ratio of Gross Expenses to Average Net Assetsc | Ratio of Net Expenses to Average Net Assets | Ratio of Net Investment Income/ (Loss) to Average Net Assets | Portfolio Turnover Rate |
$24.16 | 0.70 % | $25.4 | 0.65 % | 0.55 % | 1.68 % | 10 %d |
$24.20 | (3.79 )%f | $5.4 | 0.65 %g | 0.55 %g | 1.54 %g | 5 %d,f |
$22.68 | 0.25 % | $274.7 | 0.77 % | 0.66 % | 3.84 % | 61 % |
$25.91 | 13.67 %f | $209.5 | 0.92 %g | 0.73 %g | 0.22 %g | 57 %f |
$34.57 | 54.44 %l | $147.4 | 0.99 % | 0.74 % | (0.36 )% | 56 % |
$22.52 | (13.98 )% | $89.4 | 0.99 % | 0.74 % | 0.74 % | 109 % |
$26.60 | (0.41 )% | $145.3 | 0.96 % | 0.74 % | 1.99 % | 88 % |
$27.44 | 1.19 % | $100.3 | 0.98 % | 0.74 % | 1.31 % | 107 % |
$23.27 | 19.77 % | $11.1 | 0.65 % | 0.55 % | (0.23 )% | 31 %d |
$19.43 | (19.10 )%f | $5.4 | 0.65 %g | 0.55 %g | (0.17 )%g | 9 %d,f |
$21.58 | 13.08 % | $5.4 | 0.65 % | 0.55 % | 0.59 % | 44 % |
$19.11 | (20.92 )%f | $4.8 | 0.65 %g | 0.55 %g | 0.23 %g | 28 %d,f |
54
Notes to Financial Highlights
a | Calculated based on the average number of shares outstanding during each fiscal period. |
b | Total return based on per share NAV reflects the effects of changes in NAV on the performance of each Fund during the each fiscal period. Returns assume income dividends and other distributions, if any, were reinvested. Results represent past performance and do not indicate future results. Current returns may be lower or higher than the performance data quoted. Investment returns and principal will fluctuate and shares, when redeemed, may be worth more or less than original cost. Each of Carbon Transition & Infrastructure ETF, Disrupters ETF and Next Generation Connected Consumer ETF, has a limited performance history that should not be relied on. Past performance, particularly for brief periods of time, are not indicative of future returns. Total return would have been lower if Management had not reimbursed and/or waived certain expenses and/or waived a portion of the investment management fee (for certain periods). Total return would have been higher if Management had not recouped previously reimbursed and/or waived expenses. |
c | Represents the annualized ratios of net expenses to average daily net assets if Management had not reimbursed certain expenses and/or waived a portion of the investment management fee. |
d | Portfolio turnover rate excludes securities received or delivered in-kind. The portfolio turnover rate of Carbon Transition & Infrastructure ETF and Disrupters ETF including securities received or delivered in-kind was 12% and 132%, respectively, for the year ended August 31, 2023. The portfolio turnover rate of Carbon Transition & Infrastructure ETF, Disrupters ETF and Next Generation Connected Consumer ETF including securities received or delivered in-kind was 8%, 9% and 31%, respectively, for the period ended August 31, 2022. |
e | The date investment operations commenced. |
f | Not annualized. |
g | Annualized. |
h | Financial highlights prior to the close of business on October 21, 2022 are of the Predecessor Fund. |
i | Consolidated financial highlights. See Note A in the Notes to Consolidated Financial Statements. |
j | After the close of business on October 14, 2022, the Predecessor Fund's Institutional Class underwent a reverse stock split. The per share data presented here has been retroactively adjusted to reflect this split. See Note A of the Notes to Consolidated Financial Statements. |
k | The Predecessor Fund changed its fiscal year end from October 31 to August 31. This period represents the ten-month period from November 1, 2021 to August 31, 2022. See Note G of the Notes to Consolidated Financial Statements for more information. |
l | The class action proceeds received in 2021 had no impact on the Fund's total returns for the year ended October 31, 2021. |
55
Report of Independent Registered Public Accounting Firm
To the Board of Trustees of
Neuberger Berman ETF Trust and the Shareholders of:
Neuberger Berman Carbon Transition & Infrastructure ETF
Neuberger Berman Commodity Strategy ETF
Neuberger Berman Disrupters ETF
Neuberger Berman Next Generation Connected Consumer ETF
Neuberger Berman ETF Trust and the Shareholders of:
Neuberger Berman Carbon Transition & Infrastructure ETF
Neuberger Berman Commodity Strategy ETF
Neuberger Berman Disrupters ETF
Neuberger Berman Next Generation Connected Consumer ETF
Opinion on the Financial Statements
We have audited the accompanying consolidated statement of assets and liabilities of Neuberger Berman Commodity Strategy ETF (one of the series constituting the Neuberger Berman ETF Trust (the "Trust")), including the consolidated schedule of investments, as of August 31, 2023, and the related consolidated statements of operations and changes in net assets, and the consolidated financial highlights for each of the periods indicated in the table below and the related notes (collectively referred to as the "consolidated financial statements"). We have audited the accompanying statements of assets and liabilities of Neuberger Berman Carbon Transition & Infrastructure ETF, Neuberger Berman Disrupters ETF, and Neuberger Berman Next Generation Connected Consumer ETF (collectively, together with Neuberger Berman Commodity Strategy ETF, referred to as the "Funds") (three of the series constituting the Trust), including the schedules of investments, as of August 31, 2023, and the related statements of operations and changes in net assets, and the financial highlights for each of the periods indicated in the table below and the related notes (collectively, together with the consolidated financial statements, referred to as the "financial statements"). In our opinion, the financial statements present fairly, in all material respects, the financial position, or the consolidated financial position, of each of the Funds (four of the series constituting Neuberger Berman ETF Trust) at August 31, 2023, and the results, or the consolidated results, of their operations, changes in net assets and financial highlights for each of the periods indicated in the table below, in conformity with U.S. generally accepted accounting principles.
Individual fund constituting Neuberger Berman ETF Trust | Statement of operations | Statements of changes in net assets | Financial highlights |
Neuberger Berman Carbon Transition & Infrastructure ETF Neuberger Berman Disrupters ETF Neuberger Berman Next Generation Connected Consumer ETF | For the year ended August 31, 2023 | For the year ended August 31, 2023 and the period from April 6, 2022 (commencement of operations) to August 31, 2022 | For the year ended August 31, 2023 and the period from April 6, 2022 (commencement of operations) to August 31, 2022 |
Neuberger Berman Commodity Strategy ETF | For the year ended August 31, 2023 | For the year ended August 31, 2023, the period from November 1, 2021 to August 31, 2022 and the year ended October 31, 2021 | For the year ended August 31, 2023, the period from November 1, 2021 to August 31, 2022 and each of the four years in the period ended October 31, 2021 |
Basis for Opinion
These financial statements are the responsibility of the Trust’s management. Our responsibility is to express an opinion on each of the Funds’ financial statements based on our audits. We are a public accounting firm registered with the Public Company Accounting Oversight Board (United States) ("PCAOB") and are required to be independent with respect to the Trust in accordance with the U.S. federal securities laws and the applicable rules and regulations of the Securities and Exchange Commission and the PCAOB.
56
We conducted our audits in accordance with the standards of the PCAOB. Those standards require that we plan and perform the audit to obtain reasonable assurance about whether the financial statements are free of material misstatement, whether due to error or fraud. The Trust is not required to have, nor were we engaged to perform, an audit of the Trust’s internal control over financial reporting. As part of our audits, we are required to obtain an understanding of internal control over financial reporting but not for the purpose of expressing an opinion on the effectiveness of the Trust’s internal control over financial reporting. Accordingly, we express no such opinion.
Our audits included performing procedures to assess the risks of material misstatement of the financial statements, whether due to error or fraud, and performing procedures that respond to those risks. Such procedures included examining, on a test basis, evidence regarding the amounts and disclosures in the financial statements. Our procedures included confirmation of securities owned as of August 31, 2023, by correspondence with the custodian, brokers and others; when replies were not received from brokers and others, we performed other auditing procedures. Our audits also included evaluating the accounting principles used and significant estimates made by management, as well as evaluating the overall presentation of the financial statements. We believe that our audits provide a reasonable basis for our opinion.

We have served as the auditor of one or more Neuberger Berman investment companies since 1954.
Boston, Massachusetts
October 24, 2023
October 24, 2023
57
Directory
Investment Manager
Neuberger Berman Investment Advisers LLC*
1290 Avenue of the Americas
New York, NY 10104-0002
1290 Avenue of the Americas
New York, NY 10104-0002
Distributor
Neuberger Berman BD LLC
1290 Avenue of the Americas
New York, NY 10104-0002
1290 Avenue of the Americas
New York, NY 10104-0002
Custodian and Transfer Agent
State Street Bank and Trust Company
One Congress Street, Suite 1
Boston, MA 02114-2016
One Congress Street, Suite 1
Boston, MA 02114-2016
* Investment Manager and Administrator to Commodity Strategy ETF
For Shareholders, address correspondence to:
Neuberger Berman Funds
John Adams Building
1776 Heritage Drive
North Quincy, MA 02171
John Adams Building
1776 Heritage Drive
North Quincy, MA 02171
Legal Counsel
K&L Gates LLP
1601 K Street, NW
Washington, DC 20006-1600
1601 K Street, NW
Washington, DC 20006-1600
Independent Registered Public Accounting Firm
Ernst & Young LLP
200 Clarendon Street
Boston, MA 02116
200 Clarendon Street
Boston, MA 02116
58
Trustees and Officers
The following tables set forth information concerning the Trustees and Officers of the Funds. All persons named as Trustees and Officers also serve in similar capacities for other funds administered or managed by NBIA. The Funds’ Statement of Additional Information includes additional information about the Trustees as of the time of the Funds’ most recent public offering and is available upon request, without charge, by calling (800) 877-9700.
Information about the Board of Trustees
Name, (Year of Birth), and Address(1) | Position(s) and Length of Time Served(2) | Principal Occupation(s)(3) | Number of Funds in Fund Complex Overseen by Fund Trustee | Other Directorships Held Outside Fund Complex by Fund Trustee(3) |
Independent Fund Trustees | ||||
Michael J. Cosgrove (1949) | Trustee since 2021 | President, Carragh Consulting USA, since 2014; formerly, Executive, General Electric Company, 1970 to 2014, including President, Mutual Funds and Global Investment Programs, GE Asset Management, 2011 to 2014, President and Chief Executive Officer, Mutual Funds and Intermediary Business, GE Asset Management, 2007 to 2011, President, Institutional Sales and Marketing, GE Asset Management, 1998 to 2007, and Chief Financial Officer, GE Asset Management, and Deputy Treasurer, GE Company, 1988 to 1993. | 49 | Member of Advisory Board, Burke Neurological Institute, since 2021; Parish Councilor, St. Pius X, since 2021; formerly, Director, America Press, Inc. (not-for-profit Jesuit publisher), 2015 to 2021; formerly, Director, Fordham University, 2001 to 2018; formerly, Director, The Gabelli Go Anywhere Trust, June 2015 to June 2016; formerly, Director, Skin Cancer Foundation (not-for-profit), 2006 to 2015; formerly, Director, GE Investments Funds, Inc., 1997 to 2014; formerly, Trustee, GE Institutional Funds, 1997 to 2014; formerly, Director, GE Asset Management, 1988 to 2014; formerly, Director, Elfun Trusts, 1988 to 2014; formerly, Trustee, GE Pension & Benefit Plans, 1988 to 2014; formerly, Member of Board of Governors, Investment Company Institute. |
59
Name, (Year of Birth), and Address(1) | Position(s) and Length of Time Served(2) | Principal Occupation(s)(3) | Number of Funds in Fund Complex Overseen by Fund Trustee | Other Directorships Held Outside Fund Complex by Fund Trustee(3) |
Marc Gary (1952) | Trustee since 2021 | Executive Vice Chancellor Emeritus, The Jewish Theological Seminary, since 2020; formerly, Executive Vice Chancellor and Chief Operating Officer, The Jewish Theological Seminary, 2012 to 2020; formerly, Executive Vice President and General Counsel, Fidelity Investments, 2007 to 2012; formerly, Executive Vice President and General Counsel, BellSouth Corporation, 2004 to 2007; formerly, Vice President and Associate General Counsel, BellSouth Corporation, 2000 to 2004; formerly, Associate, Partner, and National Litigation Practice Co-Chair, Mayer, Brown LLP, 1981 to 2000; formerly, Associate Independent Counsel, Office of Independent Counsel, 1990 to 1992. | 49 | Chair and Director, USCJ Supporting Foundation, since 2019; Director, UJA Federation of Greater New York, since 2019; Trustee, The Jewish Theological Seminary, since 2015; Director, Lawyers Committee for Civil Rights Under Law (not-for-profit), since 2005; formerly, Director, Legility, Inc. (privately held for-profit company), 2012 to 2021; formerly, Director, Equal Justice Works (not-for-profit), 2005 to 2014; formerly, Director, Corporate Counsel Institute, Georgetown University Law Center, 2007 to 2012; formerly, Director, Greater Boston Legal Services (not-for-profit), 2007 to 2012. |
60
Name, (Year of Birth), and Address(1) | Position(s) and Length of Time Served(2) | Principal Occupation(s)(3) | Number of Funds in Fund Complex Overseen by Fund Trustee | Other Directorships Held Outside Fund Complex by Fund Trustee(3) |
Martha C. Goss (1949) | Trustee since 2021 | Formerly, President, Woodhill Enterprises Inc./Chase Hollow Associates LLC (personal investment vehicle), 2006 to 2020; formerly, Consultant, Resources Global Professionals (temporary staffing), 2002 to 2006; formerly, Chief Financial Officer, Booz-Allen & Hamilton, Inc., 1995 to 1999; formerly, Enterprise Risk Officer, Prudential Insurance, 1994 to 1995; formerly, President, Prudential Asset Management Company, 1992 to 1994; formerly, President, Prudential Power Funding (investments in electric and gas utilities and alternative energy projects), 1989 to 1992; formerly, Treasurer, Prudential Insurance Company, 1983 to 1989. | 49 | Director, American Water (water utility), since 2003; Director, Allianz Life of New York (insurance), since 2005; formerly, Director, Berger Group Holdings, Inc. (engineering consulting firm), 2013 to 2018; formerly, Director, Financial Women’s Association of New York (not-for-profit association), 1987 to 1996, and 2003 to 2019; Trustee Emerita, Brown University, since 1998; Director, Museum of American Finance (not-for-profit), since 2013; formerly, Non-Executive Chair and Director, Channel Reinsurance (financial guaranty reinsurance), 2006 to 2010; formerly, Director, Ocwen Financial Corporation (mortgage servicing), 2005 to 2010; formerly, Director, Claire’s Stores, Inc. (retailer), 2005 to 2007; formerly, Director, Parsons Brinckerhoff Inc. (engineering consulting firm), 2007 to 2010; formerly, Director, Bank Leumi (commercial bank), 2005 to 2007; formerly, Advisory Board Member, Attensity (software developer), 2005 to 2007; formerly, Director, Foster Wheeler Manufacturing, 1994 to 2004; formerly Director, Dexter Corp. (Manufacturer of Non-Wovens, Plastics, and Medical Supplies), 1992 to 2001. |
61
Name, (Year of Birth), and Address(1) | Position(s) and Length of Time Served(2) | Principal Occupation(s)(3) | Number of Funds in Fund Complex Overseen by Fund Trustee | Other Directorships Held Outside Fund Complex by Fund Trustee(3) |
Ami Kaplan (1960) | Trustee since 2023 | Formerly, Partner, Deloitte LLP, 1982 to 2023, including Vice Chair, 2017 to 2020; formerly, President and Board Chair, Women's Forum of New York, 2014 to 2016. | 49 | None. |
Michael M. Knetter (1960) | Trustee since 2021 | President and Chief Executive Officer, University of Wisconsin Foundation, since 2010; formerly, Dean, School of Business, University of Wisconsin - Madison; formerly, Professor of International Economics and Associate Dean, Amos Tuck School of Business - Dartmouth College, 1998 to 2002. | 49 | Director, 1WS Credit Income Fund, since 2018; Board Member, American Family Insurance (a mutual company, not publicly traded), since March 2009; formerly, Trustee, Northwestern Mutual Series Fund, Inc., 2007 to 2011; formerly, Director, Wausau Paper, 2005 to 2011; formerly, Director, Great Wolf Resorts, 2004 to 2009. |
Deborah C. McLean (1954) | Trustee since 2021 | Member, Circle Financial Group (private wealth management membership practice), since 2011; Managing Director, Golden Seeds LLC (an angel investing group), since 2009; Adjunct Professor (Corporate Finance), Columbia University School of International and Public Affairs, since 2008; formerly, Visiting Assistant Professor, Fairfield University, Dolan School of Business, Fall 2007; formerly, Adjunct Associate Professor of Finance, Richmond, The American International University in London, 1999 to 2007. | 49 | Board Member, The Maritime Aquarium at Norwalk, since 2020; Board Member, Norwalk Community College Foundation, since 2014; Dean’s Advisory Council, Radcliffe Institute for Advanced Study, since 2014; formerly, Director and Treasurer, At Home in Darien (not-for-profit), 2012 to 2014; formerly, Director, National Executive Service Corps (not-for-profit), 2012 to 2013; formerly, Trustee, Richmond, The American International University in London, 1999 to 2013. |
62
Name, (Year of Birth), and Address(1) | Position(s) and Length of Time Served(2) | Principal Occupation(s)(3) | Number of Funds in Fund Complex Overseen by Fund Trustee | Other Directorships Held Outside Fund Complex by Fund Trustee(3) |
George W. Morriss (1947) | Trustee since 2021 | Formerly, Adjunct Professor, Columbia University School of International and Public Affairs, 2012 to 2018; formerly, Executive Vice President and Chief Financial Officer, People’s United Bank, Connecticut (a financial services company), 1991 to 2001. | 49 | Director, 1WS Credit Income Fund; Chair, Audit Committee, since 2018; Director and Chair, Thrivent Church Loan and Income Fund, since 2018; formerly, Trustee, Steben Alternative Investment Funds, Steben Select Multi-Strategy Fund, and Steben Select Multi-Strategy Master Fund, 2013 to 2017; formerly, Treasurer, National Association of Corporate Directors, Connecticut Chapter, 2011 to 2015; formerly, Manager, Larch Lane Multi-Strategy Fund complex (which consisted of three funds), 2006 to 2011; formerly, Member, NASDAQ Issuers’ Affairs Committee, 1995 to 2003. |
Tom D. Seip (1950) | Trustee since 2021; Chairman of the Board since 2021; formerly Lead Independent Trustee from 2006 to 2008 | Formerly, Managing Member, Ridgefield Farm LLC (a private investment vehicle), 2004 to 2016; formerly, President and CEO, Westaff, Inc. (temporary staffing), May 2001 to January 2002; formerly, Senior Executive, The Charles Schwab Corporation, 1983 to 1998, including Chief Executive Officer, Charles Schwab Investment Management, Inc.; Trustee, Schwab Family of Funds and Schwab Investments, 1997 to 1998; and Executive Vice President-Retail Brokerage, Charles Schwab & Co., Inc., 1994 to 1997. | 49 | Trustee, University of Maryland, Shore Regional Health System, since 2020; formerly, Director, H&R Block, Inc. (tax services company), 2001 to 2018; formerly, Director, Talbot Hospice Inc., 2013 to 2016; formerly, Chairman, Governance and Nominating Committee, H&R Block, Inc., 2011 to 2015; formerly, Chairman, Compensation Committee, H&R Block, Inc., 2006 to 2010; formerly, Director, Forward Management, Inc. (asset management company), 1999 to 2006. |
Franklyn E. Smith (1961) | Trustee since 2023 | Formerly, Partner, PricewaterhouseCoopers LLP, 1989 to 2021. | 49 | None. |
63
Name, (Year of Birth), and Address(1) | Position(s) and Length of Time Served(2) | Principal Occupation(s)(3) | Number of Funds in Fund Complex Overseen by Fund Trustee | Other Directorships Held Outside Fund Complex by Fund Trustee(3) |
James G. Stavridis (1955) | Trustee since 2021 | Vice Chairman Global Affairs, The Carlyle Group, since 2018; Commentator, NBC News, since 2015; formerly, Dean, Fletcher School of Law and Diplomacy, Tufts University, 2013 to 2018; formerly, Admiral, United States Navy, 1976 to 2013, including Supreme Allied Commander, NATO and Commander, European Command, 2009 to 2013, and Commander, United States Southern Command, 2006 to 2009. | 49 | Director, Fortinet (cybersecurity), since 2021; Director, Ankura, since 2020; Director, Vigor Shipyard, since 2019; Director, Rockefeller Foundation, since 2018; Director, American Water (water utility), since 2018; Director, NFP Corp. (insurance broker and consultant), since 2017; Director, Onassis Foundation, since 2014; Director, Michael Baker International (construction) since 2014; Director, Vertical Knowledge, LLC, since 2013; formerly, Director, U.S. Naval Institute, 2014 to 2019; formerly, Director, Navy Federal Credit Union, 2000 to 2002; formerly, Director, BMC Software Federal, LLC, 2014 to 2019. |
64
Name, (Year of Birth), and Address(1) | Position(s) and Length of Time Served(2) | Principal Occupation(s)(3) | Number of Funds in Fund Complex Overseen by Fund Trustee | Other Directorships Held Outside Fund Complex by Fund Trustee(3) |
Fund Trustees who are "Interested Persons" | ||||
Joseph V. Amato* (1962) | Chief Executive Officer and President since 2021 and Trustee since 2021 | President and Director, Neuberger Berman Group LLC, since 2009; President and Chief Executive Officer, Neuberger Berman BD LLC and Neuberger Berman Holdings LLC (including its predecessor, Neuberger Berman Inc.), since 2007; Chief Investment Officer (Equities) and President (Equities), NBIA (formerly, Neuberger Berman Fixed Income LLC and including predecessor entities), since 2007, and Board Member of NBIA since 2006; formerly, Global Head of Asset Management of Lehman Brothers Holdings Inc.’s ("LBHI") Investment Management Division, 2006 to 2009; formerly, member of LBHI’s Investment Management Division’s Executive Management Committee, 2006 to 2009; formerly, Managing Director, Lehman Brothers Inc. ("LBI"), 2006 to 2008; formerly, Chief Recruiting and Development Officer, LBI, 2005 to 2006; formerly, Global Head of LBI’s Equity Sales and a Member of its Equities Division Executive Committee, 2003 to 2005; President and Chief Executive Officer, twelve registered investment companies for which NBIA acts as investment manager and/or administrator. | 49 | Member of Board of Advisors, McDonough School of Business, Georgetown University, since 2001; Member of New York City Board of Advisors, Teach for America, since 2005; Trustee, Montclair Kimberley Academy (private school), since 2007; Member of Board of Regents, Georgetown University, since 2013. |
(1)
The business address of each listed person is 1290 Avenue of the Americas, New York, NY 10104.
(2)
Pursuant to the Trust’s Amended and Restated Trust Instrument ("Trust Instrument"), subject to any limitations on the term of service imposed by the By-Laws or any retirement policy adopted by the Fund Trustees, each Fund Trustee shall hold office for life or until his or her successor is elected or the Trust
65
terminates; except that (a) any Fund Trustee may resign by delivering a written resignation; (b) any Fund Trustee may be removed with or without cause at any time by a written instrument signed by at least two-thirds of the other Fund Trustees; (c) any Fund Trustee who requests to be retired, or who has become unable to serve, may be retired by a written instrument signed by a majority of the other Fund Trustees; and (d) any Fund Trustee may be removed at any shareholder meeting by a vote of at least two-thirds of the outstanding shares.
(3)
Except as otherwise indicated, each individual has held the positions shown during at least the last five years.
*
Indicates a Fund Trustee who is an "interested person" within the meaning of the 1940 Act. Mr. Amato is an interested person of the Trust by virtue of the fact that he is an officer of NBIA and/or its affiliates.
66
Information about the Officers of the Trust
Name, (Year of Birth), and Address(1) | Position(s) and Length of Time Served(2) | Principal Occupation(s)(3) |
Claudia A. Brandon (1956) | Executive Vice President since 2021 and Secretary since 2021 | Senior Vice President, Neuberger Berman, since 2007 and Employee since 1999; Senior Vice President, NBIA, since 2008 and Assistant Secretary since 2004; formerly, Vice President, Neuberger Berman, 2002 to 2006; formerly, Vice President, Mutual Fund Board Relations, NBIA, 2000 to 2008; formerly, Vice President, NBIA, 1986 to 1999 and Employee, 1984 to 1999; Executive Vice President and Secretary, thirty-three registered investment companies for which NBIA acts as investment manager and/or administrator. |
Agnes Diaz (1971) | Vice President since 2021 | Senior Vice President, Neuberger Berman, since 2012; Senior Vice President, NBIA, since 2012 and Employee since 1996; formerly, Vice President, Neuberger Berman, 2007 to 2012; Vice President, twelve registered investment companies for which NBIA acts as investment manager and/or administrator. |
Anthony DiBernardo (1979) | Assistant Treasurer since 2021 | Senior Vice President, Neuberger Berman, since 2014; Senior Vice President, NBIA, since 2014, and Employee since 2003; formerly, Vice President, Neuberger Berman, 2009 to 2014; Assistant Treasurer, twelve registered investment companies for which NBIA acts as investment manager and/or administrator. |
Savonne L. Ferguson (1973) | Chief Compliance Officer since 2021 | Senior Vice President, Chief Compliance Officer, Mutual Funds and Associate General Counsel, NBIA, since November 2018; formerly, Vice President, T. Rowe Price Group, Inc., 2018; Vice President and Senior Legal Counsel, T. Rowe Price Associates, Inc., 2014 to 2018; Vice President and Director of Regulatory Fund Administration, PNC Capital Advisors, LLC, 2009 to 2014; Secretary, PNC Funds and PNC Advantage Funds, 2010 to 2014; Chief Compliance Officer, thirty-three registered investment companies for which NBIA acts as investment manager and/or administrator. |
Corey A. Issing (1978) | Chief Legal Officer since 2021 (only for purposes of sections 307 and 406 of the Sarbanes-Oxley Act of 2002) | General Counsel, Mutual Funds since 2016 and Managing Director, NBIA, since 2017; formerly, Associate General Counsel, 2015 to 2016; Counsel, 2007 to 2015; Senior Vice President, 2013 to 2016; Vice President, 2009 to 2013; Chief Legal Officer (only for purposes of sections 307 and 406 of the Sarbanes-Oxley Act of 2002), thirty-three registered investment companies for which NBIA acts as investment manager and/or administrator. |
Sheila R. James (1965) | Assistant Secretary since 2021 | Senior Vice President, Neuberger Berman, since 2023 and Employee since 1999; Senior Vice President, NBIA, since 2023; formerly, Vice President, Neuberger Berman, 2008 to 2023; Assistant Vice President, Neuberger Berman, 2007; Employee, NBIA, 1991 to 1999; Assistant Secretary, thirty-three registered investment companies for which NBIA acts as investment manager and/or administrator. |
67
Name, (Year of Birth), and Address(1) | Position(s) and Length of Time Served(2) | Principal Occupation(s)(3) |
Brian Kerrane (1969) | Chief Operating Officer since 2021 and Vice President since 2021 | Managing Director, Neuberger Berman, since 2013; Chief Operating Officer, Mutual Funds and Managing Director, NBIA, since 2015; formerly, Senior Vice President, Neuberger Berman, 2006 to 2014; Vice President, NBIA, 2008 to 2015 and Employee since 1991; Chief Operating Officer, twelve registered investment companies for which NBIA acts as investment manager and/or administrator; Vice President, thirty-three registered investment companies for which NBIA acts as investment manager and/or administrator. |
Anthony Maltese (1959) | Vice President since 2021 | Senior Vice President, Neuberger Berman, since 2014 and Employee since 2000; Senior Vice President, NBIA, since 2014; Vice President, twelve registered investment companies for which NBIA acts as investment manager and/or administrator. |
Josephine Marone (1963) | Assistant Secretary since 2021 | Senior Paralegal, Neuberger Berman, since 2007 and Employee since 2007; Assistant Secretary, thirty-three registered investment companies for which NBIA acts as investment manager and/or administrator. |
Owen F. McEntee, Jr. (1961) | Vice President since 2021 | Vice President, Neuberger Berman, since 2006; Vice President, NBIA, since 2006 and Employee since 1992; Vice President, twelve registered investment companies for which NBIA acts as investment manager and/or administrator. |
John M. McGovern (1970) | Treasurer and Principal Financial and Accounting Officer since 2021 | Managing Director, Neuberger Berman, since 2022; Senior Vice President, Neuberger Berman, 2007 to 2021; Senior Vice President, NBIA, since 2007 and Employee since 1993; formerly, Vice President, Neuberger Berman, 2004 to 2006; formerly, Assistant Treasurer, 2002 to 2005; Treasurer and Principal Financial and Accounting Officer, twelve registered investment companies for which NBIA acts as investment manager and/or administrator. |
Frank Rosato (1971) | Assistant Treasurer since 2021 | Vice President, Neuberger Berman, since 2006; Vice President, NBIA, since 2006 and Employee since 1995; Assistant Treasurer, twelve registered investment companies for which NBIA acts as investment manager and/or administrator. |
Daniel Tracer (1987) | Anti-Money Laundering Compliance Officer since 2023 | Senior Vice President and Head of Financial Regulation, Neuberger Berman, since February 2023; Assistant United States Attorney, Southern District of New York, 2016 to 2023; Trial Attorney, Department of Justice Antitrust Division, 2012 to 2015; Senior Anti-Money Laundering Compliance Officer, five registered investment companies for which NBIA acts as investment manager and/or administrator. |
(1)
The business address of each listed person is 1290 Avenue of the Americas, New York, NY 10104.
(2) Pursuant to the By-Laws of the Trust, each officer elected by the Fund Trustees shall hold office until his or her successor shall have been elected and qualified or until his or her earlier death, inability to serve, or resignation. Officers serve at the pleasure of the Fund Trustees and may be removed at any time with or without cause.
(3)
Except as otherwise indicated, each individual has held the positions shown during at least the last five years.
68
Proxy Voting Policies and Procedures
A description of the policies and procedures that the Trust uses to determine how to vote proxies relating to portfolio securities is available, without charge, by calling 877-628-2583 (toll-free) and on the SEC’s website at www.sec.gov. Information regarding how the Trust voted proxies relating to portfolio securities during the most recent 12-month period ended June 30 is also available upon request, without charge, by calling 877-628-2583 (toll-free), on the SEC’s website at www.sec.gov, and on Neuberger Berman’s website at www.nb.com.
Quarterly Portfolio Schedule
The Trust files a complete schedule of portfolio holdings for each Fund with the SEC for the first and third quarters of each fiscal year as an exhibit to its report on Form N-PORT. The Trust’s Form N-PORT is available on the SEC’s website at www.sec.gov. The portfolio holdings information on Form N-PORT is available upon request, without charge, by calling 877-628-2583 (toll-free).
Liquidity Risk Management Program
Consistent with Rule 22e-4 under the Investment Company Act of 1940 (the "Liquidity Rule"), as amended, the Funds have established a liquidity risk management program (the "Program"). The Program seeks to assess and manage the Funds’ liquidity risk, which is defined as the risk that a Fund is unable to meet investor redemption requests without significantly diluting the remaining investors' interests in a Fund. The Board has approved the designation of NBIA Funds' Liquidity Committee, comprised of NBIA employees, as the program administrator (the "Program Administrator"). The Program Administrator is responsible for implementing and monitoring the Program and utilizes NBIA personnel to assess and review, on an ongoing basis, the Funds' liquidity risk.
The Program includes a number of elements that support the management and assessment of liquidity risk, including an annual assessment of the Funds' liquidity risk factors and the periodic classification (or re-classification, as necessary) of the Funds’ investments into buckets (highly liquid, moderately liquid, less liquid and illiquid) that reflect the Program Administrator's assessment of the investments' liquidity under current market conditions, which for the relevant period included, among other factors, market volatility as a result of geopolitical tensions (e.g., Russia’s invasion of Ukraine) and rising inflation. The Program Administrator also utilizes information about the Funds’ investment strategy, the characteristics of the Funds’ shareholder base and historical redemption activity.
The Program Administrator provided the Board with a written report that addressed the operation of the Program and assessed its adequacy and effectiveness of implementation from April 1, 2022 through March 31, 2023. During the period covered by this report, the Program Administrator reported that the Program effectively assisted the Program Administrator in monitoring whether a Fund maintained a level of liquidity appropriate for its shareholder base and historical redemption activity.
69
Notice to Shareholders
For the fiscal period ended August 31, 2023, each Fund makes the following designation, or up to the maximum amount of such dividends allowable pursuant to the Internal Revenue Code, as Qualified Dividend Income. Complete information regarding each Fund’s Qualified Dividend Income distributions during the calendar year 2023 will be reported in conjunction with Form 1099-DIV.
Fund | Qualified Dividend Income |
Carbon Transition & Infrastructure ETF | $278,218 |
Next Generation Connected Consumer ETF | 26,797 |
70
Neuberger Berman Investment Advisers LLC
1290 Avenue of the Americas
New York, NY 10104-0002
877.628.2583
www.nb.com/ETF
New York, NY 10104-0002
877.628.2583
www.nb.com/ETF
Statistics and projections in this report are derived from sources deemed to be reliable but cannot be regarded as a representation of future results of the Funds. This report is prepared for the general information of shareholders and is not an offer of shares of the Funds. Shares are sold only through the currently effective prospectus which you can obtain by calling 877.628.2583. An investor should consider carefully a Fund’s investment objectives, risks and fees and expenses, which are described in its prospectus, before investing.

X0207 10/23

| (b) | Not applicable to the Registrant. |
Item 2. Code of Ethics.
The Board of Trustees (“Board”) of Neuberger Berman ETF Trust (“Registrant”) has adopted a code of ethics that applies to the Registrant’s principal executive officer, principal financial officer, principal accounting officer or controller, or persons performing similar functions (“Code of Ethics”). During the period covered by this Form N-CSR, there were no substantive amendments to the Code of Ethics and there were no waivers from the Code of Ethics granted to the Registrant’s principal executive officer, principal financial officer, principal accounting officer or controller, or persons performing similar functions.
A copy of the Code of Ethics is incorporated by reference to Neuberger Berman Real Estate Securities Income Fund Inc.’s Form N-CSR, Investment Company Act file number 811-21421 (filed June 26, 2023). The Code of Ethics is also available, without charge, by calling 1-800-877-9700 (toll-free).
Item 3. Audit Committee Financial Expert.
The Board has determined that the Registrant has three audit committee financial experts serving on its audit committee. The Registrant’s audit committee financial experts are Michael J. Cosgrove, Martha C. Goss and Deborah C. McLean. Mr. Cosgrove, Ms. Goss and Ms. McLean are independent trustees as defined by Form N-CSR.
Item 4. Principal Accountant Fees and Services.
Ernst & Young, LLP (“E&Y”) serves as independent registered public accounting firm to each series of the Registrant.
(a) Audit Fees
The aggregate fees billed for professional services rendered by E&Y for the audit of the annual financial statements or services that are normally provided by E&Y in connection with statutory and regulatory filings or engagements were $77,000 and $111,400 for the fiscal period or year ended 2022 and 2023, respectively.
(b) Audit-Related Fees
The aggregate fees billed to the Registrant for assurance and related services by E&Y that are reasonably related to the performance of the audit of the Registrant’s financial statements and are not reported above in Audit Fees were $0 and $0 for the fiscal period or year ended 2022 and 2023, respectively. The Audit Committee approved 0% and 0% of these services provided by E&Y for the fiscal period or year ended 2022 and 2023, respectively, pursuant to the waiver provisions of Rule 2-01(c)(7)(i)(C) of Regulation S-X.
The fees billed to other entities in the investment company complex for assurance and related services by E&Y that are reasonably related to the performance of the audit that the Audit Committee was required to approve because the engagement related directly to the operations and financial reporting of the Registrant were $0 and $0 for the fiscal period or year ended 2022 and 2023, respectively. The Audit Committee approved 0% and 0% of these services provided by E&Y for the fiscal period or year ended 2022 and 2023, respectively, pursuant to the waiver provisions of Rule 2-01(c)(7)(i)(C) of Regulation S-X.
(c) Tax Fees
The aggregate fees billed to the Registrant for professional services rendered by E&Y for tax compliance, tax advice, and tax planning were $51,900 and $73,050 for the fiscal period or year ended 2022 and 2023, respectively. The nature of the services provided includes preparation of the Federal and State tax extensions and tax returns, review of annual excise tax calculations, and preparation of form 8613, in addition to assistance with the identification of Passive Foreign Investment Companies, assistance with determination of various foreign withholding taxes, and assistance with Internal Revenue Code and tax regulation requirements for fund investments. The Audit Committee approved 0% and 0% of these services provided by E&Y for the fiscal period or year ended 2022 and 2023, respectively, pursuant to the waiver provisions of Rule 2-01(c)(7)(i)(C) of Regulation S-X.
The fees billed to other entities in the investment company complex for professional services rendered by E&Y for tax compliance, tax advice, and tax planning that the Audit Committee was required to approve because the engagement related directly to the operations and financial reporting of the Registrant were $0 and $0 for the fiscal period or year ended 2022 and 2023, respectively. The Audit Committee approved 0% and 0% of these services provided by E&Y for the fiscal period or year ended 2022 and 2023, respectively, pursuant to the waiver provisions of Rule 2-01(c)(7)(i)(C) of Regulation S-X.
(d) All Other Fees
The aggregate fees billed to the Registrant for products and services provided by E&Y, other than services reported in Audit Fees, Audit-Related Fees, and Tax Fees were $0 and $0 for the fiscal period or year ended 2022 and 2023, respectively. The Audit Committee approved 0% and 0% of these services provided by E&Y for the fiscal period or year ended 2022 and 2023, respectively, pursuant to the waiver provisions of Rule 2-01(c)(7)(i)(C) of Regulation S-X.
The fees billed to other entities in the investment company complex for products and services provided by E&Y, other than services reported in Audit Fees, Audit-Related Fees, and Tax Fees that the Audit Committee was required to approve because the engagement related directly to the operations and financial reporting of the Registrant were $0 and $0 for the fiscal period or year ended 2022 and 2023, respectively. The Audit Committee approved 0% and 0% of these services provided by E&Y for the fiscal period or year ended 2022 and 2023, respectively, pursuant to the waiver provisions of Rule 2-01(c)(7)(i)(C) of Regulation S-X.
(e) Audit Committee’s Pre-Approval Policies and Procedures
(1) The Audit Committee’s pre-approval policies and procedures for the Registrant to engage an accountant to render audit and non-audit services delegate to each member of the Committee the power to pre-approve services between meetings of the Committee.
(2) None of the services described in paragraphs (b) through (d) above were approved by the Audit Committee pursuant to paragraph (c)(7)(i)(C) of Rule 2-01 of Regulation S-X.
(f) Hours Attributed to Other Persons
Not applicable.
(g) Non-Audit Fees
Non-audit fees billed by E&Y for services rendered to the Registrant were $51,900 and $73,050 for the fiscal period or year ended 2022 and 2023, respectively.
Non-audit fees billed by E&Y for services rendered to the Registrant’s investment adviser and any entity controlling, controlled by, or under common control with the adviser that provides ongoing services to the Registrant were $0 and $0 for the fiscal period or year ended 2022 and 2023, respectively.
(h) The Audit Committee of the Board considered whether the provision of non-audit services rendered to the Registrant’s investment adviser and any entity controlling, controlled by, or under common control with the adviser that provides ongoing services to the Registrant that were not pre-approved by the Audit Committee because the engagement did not relate directly to the operations and financial reporting of the Registrant is compatible with maintaining E&Y’s independence.
(i) Not applicable.
(j) Not applicable.
Item 5. Audit Committee of Listed Registrants.
Not applicable to the Registrant.
Item 6. Investments.
| (a) | The complete schedule of investments for each series is disclosed in the Registrant’s annual report, which is included in Item 1 of this Form N-CSR. |
| (b) | Not applicable to the Registrant. |
Item 7. Disclosure of Proxy Voting Policies and Procedures for Closed-End Management Investment Companies.
Not applicable to the Registrant.
Item 8. Portfolio Managers of Closed-End Management Investment Companies.
Not applicable to the Registrant.
Item 9. Purchases of Equity Securities by Closed-End Management Investment Company and Affiliated Purchasers.
Not applicable to the Registrant.
Item 10. Submission of Matters to a Vote of Security Holders.
There were no changes to the procedures by which shareholders may recommend nominees to the Board.
Item 11. Controls and Procedures.
| (a) | Based on an evaluation of the disclosure controls and procedures (as defined in Rule 30a-3(c) under the Act) as of a date within 90 days of the filing date of this report, the Chief Executive Officer and President and the Treasurer and Principal Financial and Accounting Officer of the Registrant have concluded that such disclosure controls and procedures are effectively designed to ensure that information required to be disclosed by the Registrant on Form N-CSR is accumulated and communicated to the Registrant’s management to allow timely decisions regarding required disclosure. |
| (b) | There were no significant changes in the Registrant’s internal controls over financial reporting (as defined in Rule 30a-3(d) under the Act) that occurred during the period covered by this report that have materially affected, or are reasonably likely to materially affect, the Registrant’s internal control over financial reporting. |
Item 12. Disclosure of Securities Lending Activities for Closed-End Management Investment Companies.
Not applicable to the Registrant.
Item 13. Exhibits.
| (a)(1) |
| (a)(2) |
| (a)(3) | Not applicable to the Registrant. |
| (a)(4) | Not applicable to the Registrant. |
| (b) |
The certification furnished pursuant to Rule 30a-2(b) under the Act and Section 906 of the Sarbanes-Oxley Act will not be deemed “filed” for purposes of Section 18 of the Securities Exchange Act of 1934, as amended (“Exchange Act”), or otherwise subject to the liability of that section. Such certification will not be deemed to be incorporated by reference into any filing under the Securities Act of 1933, as amended, or the Exchange Act, except to the extent that the Registrant specifically incorporates it by reference.
SIGNATURES
Pursuant to the requirements of the Securities Exchange Act of 1934 and the Investment Company Act of 1940, the Registrant has duly caused this report to be signed on its behalf by the undersigned, thereunto duly authorized.
Neuberger Berman ETF Trust
| By: | /s/ Joseph V. Amato | |
| Joseph V. Amato | ||
| Chief Executive Officer and President |
Pursuant to the requirements of the Securities Exchange Act of 1934 and the Investment Company Act of 1940, this report has been signed below by the following persons on behalf of the Registrant and in the capacities and on the dates indicated.
| By: | /s/ Joseph V. Amato | |
| Joseph V. Amato | ||
| Chief Executive Officer and President |
Date: November 2, 2023
| By: | /s/ John M. McGovern | |
| John M. McGovern | ||
| Treasurer and Principal Financial and Accounting Officer | ||
Date: November 2, 2023