As filed with the Securities and Exchange Commission on August 9, 2013
UNITED STATES
SECURITIES AND EXCHANGE COMMISSION
Washington, D.C. 20549
FORM N-CSR
CERTIFIED SHAREHOLDER REPORT OF REGISTERED
MANAGEMENT INVESTMENT COMPANIES
Investment Company Act file number: 811-22499
The Cushing Renaissance Fund
(Exact name of registrant as specified in charter)
8117 Preston Road, Suite 440, Dallas, TX 75225
(Address of principal executive offices) (Zip code)
Jerry V. Swank
8117 Preston Road, Suite 440, Dallas, TX 75225
(Name and address of agent for service)
214-692-6334
Registrant’s telephone number, including area code
Date of fiscal year end: November 30
Date of reporting period: May 31, 2013
Item 1. Reports to Stockholders.

Semi-Annual Report
May 31, 2013
THE CUSHING® RENAISSANCE FUND

| | |

| | Investment Adviser Cushing® MLP Asset Management, LP 8117 Preston Road Suite 440 Dallas, TX 75225 (214) 692-6334 (888) 777-2346 www.cushingcef.com www.swankcapital.com |
Table of Contents
The Cushing® Renaissance Fund
Shareholder Letter
Dear Fellow Shareholder,
The Cushing® Renaissance Fund (Fund) generated positive returns for shareholders in the six month fiscal period ended May 31, 2013. The Fund’s shares traded at a 5.7% discount to net asset value (NAV) as of the end of the period.
The broader domestic equity market, as measured by the performance of the S&P 500 Index, remained volatile, yet the overall trend of the first half of the Fund’s fiscal year was positive for stocks. The market got off to a quick start in 2013 following a last-minute deal to avoid the so-called “fiscal cliff.” The market also digested a Cypress bailout, the U.S. government “sequester” and other macro concerns. Unfortunately, the bond market did not fare so well during the period. Bonds suffered from a reallocation into equities as rates remained close to historic lows, compounded by the perceived impending end of Fed bond purchases.
Economic indicators in the first half of the year suggested that employment was improving, despite GDP growth still under 3.0%. Indicators for the sectors we monitor were inconsistent: oil was basically unchanged, natural gas was meaningfully higher, natural gas liquids (NGLs) were weaker, refining margins were lower, and petrochemical margins were mixed depending on product.
Fund Performance
For the six month period ended May 31, 2013, the Fund delivered a Net Asset Value Total Return (equal to the change in net asset value per share plus the reinvested cash distribution paid during the period) of 16.43%, versus total returns of 6.87% and 16.43% for the S&P North American Natural Resources Sector Index (Total Return) and the S&P 500 Index (Total Return), respectively. The Fund’s Share Price Total Return (equal to the change in net share price per share plus the reinvested cash distributions paid during the period) was 11.46% for the fiscal year to date 2013 and differs from the Net Asset Value Total Return due to fluctations in the share price to NAV. The largest individual contributors to the Fund’s performance for the period were Delek Logistics Partners, LP (NYSE: DKL), Cheniere Energy Partners, LP (NYSE Amex: CQP) and Marathon Petroleum Corp. (NYSE: MPC). The largest detractors from the Fund’s performance were Linn Energy, LLC (NASDAQ: LINE), Golar LNG Ltd. (NASDAQ: GLNG), and Cameron International Corp. (NYSE: CAM). The Fund’s top performers benefited from secular strength in MLPs or improving U.S. gulf coast refining economics while the underperformers were hit by various factors, including lower rates for liquefied natural gas (LNG) transport or production growth concerns.
Although not a predictor of future performance, the Fund’s first two quarterly distributions have remained stable at $0.41 per share.
Outlook
During the first half of the Fund’s fiscal year, improving U.S. housing, favorable unemployment data and lower inflation were more than enough for the U.S. equity markets to offset the headwinds provided by Eurozone economic weakness and continued slowdown in the emerging markets. Most recently, we have seen some weakness in the U.S. markets caused by the increased speculation of the end of quantitative easing by the Federal Reserve.
1
Clearly, the U.S. equity markets and economy have decoupled from the rest of the world. To some extent, this can be attributed to the recovery in U.S. housing coupled with the domestic boom in the energy sector. Early signs of the resurgence in the U.S. energy, industrial and manufacturing sectors aided by lower energy costs were clearly evident during the period. While we believe domestic fiscal policies and economic concerns in emerging markets will still be the focus for the remainder of the Fund’s fiscal year, we remain positive about the prospects for the sectors underlying the Fund’s strategy. Now that we are seeing signs of empirical validation of the “Renaissance” in the U.S. energy, industrial and manufacturing sectors, we anticipate new opportunities to expand the scope of the Fund’s investments to implement its strategy. This Renaissance is now attracting attention from across the globe and we have already started to see capacity expansion plans being charted by foreign companies on U.S. soil. As an example, Apollo Tyres, Ltd., one of India’s leading tire makers, recently announced that they are in the process of acquiring NYSE-listed tire maker Cooper Tire & Rubber Company (NYSE: CTB), which shows that the scope of the Renaissance theme is increasing and extending beyond the natural beneficiaries of low natural gas prices. We believe this is just the beginning of margin expansion stories as the recent success of these Renaissance beneficiary industries incentivizes companies to review their production footprints in North America for new investment or to de-bottleneck existing networks to benefit from the region’s advantaged cost of energy.
Notably, the Renaissance theme is taking place during a period of subdued global growth. We believe companies investing in capacity or de-bottlenecking today will be positioned for the next leg of enhanced profitability fueled by demand growth as the global macro environment improves cyclically. In the meantime, many beneficiaries of the Renaissance theme are already generating enough free cash flow to fund growth capital and increase cash returns to shareholders through buybacks, regular dividends, and special dividends. We believe these factors make the Fund’s investment strategy attractive to both growth and income focused investors.
In closing, we at Swank Capital, LLC and Cushing® MLP Asset Management truly appreciate your support and we look forward to helping you achieve your investment goals during the remainder of the Fund’s fiscal year.
Sincerely,

Jerry V. Swank
Chairman and Chief Executive Officer
The information in this report is not a complete analysis of every aspect of any market, sector, industry, security or the Fund itself. Statements of fact are from sources considered reliable, but the Fund makes no representation or warranty as to their completeness or accuracy. Discussions of specific investments are for illustration only and are not intended as recommendations of individual investments. Please refer to the Schedule of Investments for a complete list of Fund holdings.
Past performance does not guarantee future results. Investment return, net asset value and common share market price will fluctuate so that you may have a gain or loss when you sell shares. Since the Fund is a closed-end management investment company, shares of the Fund may trade at a discount or premium from net asset value. This characteristic is separate and distinct from the risk that net asset value could decrease as a result of investment activities and may be a greater risk to investors expecting to sell their shares after a short time. The Fund cannot predict whether shares will trade at, above or below net asset value. The Fund should not be viewed as a vehicle for trading purposes. It is designed primarily for risk-tolerant long-term investors.
The S&P North American Natural Resources Sector Index measures the performance of U.S. traded natural resources related stocks. The S&P 500 Index is an unmanaged index of common stocks that is frequently used as a general measure of stock market performance. Neither of these indices includes fees or expenses. It is not possible to invest directly in an index.
2
The Cushing® Renaissance Fund
Allocation of Portfolio Assets(1) (Unaudited)
May 31, 2013
(Expressed as a Percentage of Total Investments)
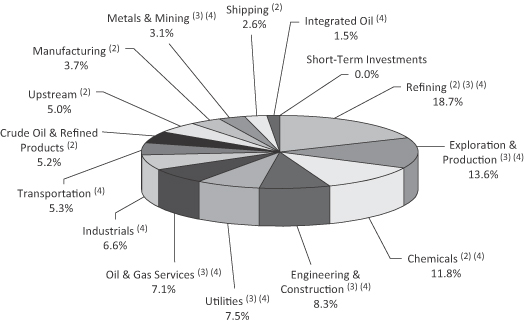
| (1) | Fund holdings and sector allocations are subject to change and there is no assurance that the Fund will continue to hold any particular security |
| (2) | Master Limited Partnerships and Related Companies |
3
The Cushing® Renaissance Fund
Key Financial Data (Supplemental Unaudited Information)
The Information presented below regarding Distributable Cash Flow is supplemental non-GAAP financial information, which we believe is meaningful to understanding our operating performance. Supplemental non-GAAP measures should be read in conjunction with our full financial statements.
| | | | | | | | |
| | | Period from
December 1, 2012
through May 31,
2013 | | | Period from
September 25, 2012
through
November 30,
2012 | |
FINANCIAL DATA | | | | | | | | |
Total income from investments | | | | | | | | |
Distributions received from MLPs | | $ | 1,911,921 | | | $ | 444,806 | |
Dividends from common stock, net of foreign taxes withheld | | | 1,031,999 | | | | 407,243 | |
Interest income & other | | | 1,230,884 | | | | 98,905 | |
| | | | | | | | |
Total income from investments | | $ | 4,174,804 | | | $ | 950,954 | |
Advisory fee and operating expenses | | | | | | | | |
Advisory fees, less expenses waived by Adviser | | $ | 879,377 | | | $ | 242,764 | |
Operating expenses(a) | | | 303,263 | | | | 236,794 | |
Leverage costs | | | 100,879 | | | | 0 | |
Other | | | 1,908 | | | | 250 | |
| | | | | | | | |
Total advisory fees and operating expenses | | $ | 1,285,427 | | | $ | 479,808 | |
Distributable Cash Flow (DCF)(b) | | $ | 2,889,377 | | | $ | 471,146 | |
Distributions paid on common stock | | $ | 3,995,764 | | | $ | 0 | |
Distributions paid on common stock per share | | $ | 0.66 | | | $ | 0.00 | |
Distribution Coverage Ratio | | | | | | | | |
Before advisory fee and operating expenses | | | 1.0 x | | | | 0.0 x | |
After advisory fee and operating expenses | | | 0.7 x | | | | 0.0 x | |
OTHER FUND DATA (end of period) | | | | | | | | |
Total Assets, end of period | | | 190,030,361 | | | | 149,337,184 | |
Unrealized appreciation (depreciation) | | | 16,223,087 | | | | (255,691 | ) |
Short-term borrowings | | | 24,200,000 | | | | 0 | |
Short-term borrowings as a percent of total assets | | | 13 | % | | | 0 | % |
Net Assets, end of period | | | 162,922,749 | | | | 143,850,293 | |
Net Asset Value per common share | | $ | 26.91 | | | $ | 23.76 | |
Market Value per share | | $ | 25.38 | | | $ | 23.41 | |
Market Capitalization | | $ | 153,655,291 | | | $ | 141,728,541 | |
Shares Outstanding | | | 6,054,188 | | | | 6,054,188 | |
| (a) | Excludes expenses related to capital raising. |
| (b) | “Net Investment Income” on the Statement of Operations is adjusted as follows to reconcile to Distributable Cash Flow: increased by the return of capital on MLP distributions and offering expenses. |
4
The Cushing® Renaissance Fund
Schedule of Investments (Unaudited) | May 31, 2013 |
| | | | | | | | |
| COMMON STOCK — 55.5%(1) | | Shares | | | Fair Value | |
| | | | | | | | |
Chemicals — 7.8%(1) | | | | | | | | |
United States — 4.4%(1) | | | | | | | | |
The Dow Chemical Company(3) | | | 75,000 | | | $ | 2,584,500 | |
E.I. du Pont de Nemours and Company(3) | | | 40,000 | | | | 2,231,600 | |
Westlake Chemical Corp. | | | 25,000 | | | | 2,335,000 | |
Netherlands — 3.4%(1) | | | | | | | | |
LyondellBasell Industries NV(3) | | | 84,000 | | | | 5,598,600 | |
| | | | | | | | |
| | | | | | | 12,749,700 | |
| | | | | | | | |
Engineering & Construction — 5.6%(1) | | | | | | | | |
Netherlands — 1.9%(1) | | | | | | | | |
Chicago Bridge & Iron Co. | | | 49,000 | | | | 3,101,700 | |
United States — 3.7%(1) | | | | | | | | |
Chart Industries Inc.(2) | | | 15,000 | | | | 1,459,200 | |
Jacobs Energy Group Inc.(2) | | | 40,000 | | | | 2,280,400 | |
KBR, Inc. | | | 63,000 | | | | 2,274,300 | |
| | | | | | | | |
| | | | | | | 9,115,600 | |
| | | | | | | | |
Exploration & Production — 2.7%(1) | | | | | | | | |
United States — 2.7%(1) | | | | | | | | |
Concho Res Inc.(2) | | | 21,000 | | | | 1,756,860 | |
Occidental Petroleum Corporation | | | 20,000 | | | | 1,841,400 | |
Rosetta Resources Inc.(2) | | | 16,226 | | | | 760,350 | |
| | | | | | | | |
| | | | | | | 4,358,610 | |
| | | | | | | | |
Industrials — 7.1%(1) | | | | | | | | |
United States — 7.1%(1) | | | | | | | | |
Flowserve Corporation | | | 5,000 | | | | 840,650 | |
Fluor Corporation | | | 45,100 | | | | 2,850,771 | |
MRC Global Inc.(2) | | | 65,000 | | | | 1,845,350 | |
Trinity Industrials Inc. | | | 80,000 | | | | 3,274,400 | |
United Rentals Inc.(2) | | | 48,000 | | | | 2,728,320 | |
| | | | | | | | |
| | | | | | | 11,539,491 | |
| | | | | | | | |
Integrated Oil — 1.6%(1) | | | | | | | | |
Netherlands — 1.6%(1) | | | | | | | | |
Royal Dutch Shell PLC | | | 39,500 | | | | 2,621,615 | |
| | | | | | | | |
Manufacturing — 4.0%(1) | | | | | | | | |
United States — 4.0%(1) | | | | | | | | |
American Railcar Inds Inc. | | | 20,000 | | | | 680,000 | |
Cummins Inc. | | | 5,000 | | | | 598,150 | |
Dresser-Ran Group Inc.(2) | | | 35,000 | | | | 2,121,000 | |
FMC Technologies Inc.(2) | | | 10,000 | | | | 556,600 | |
GreenBrier Cos Inc.(2) | | | 110,000 | | | | 2,579,500 | |
| | | | | | | | |
| | | | | | | 6,535,250 | |
| | | | | | | | |
Metals & Mining — 0.5%(1) | | | | | | | | |
United States — 0.5%(1) | | | | | | | | |
Nucor Corporation | | | 20,000 | | | | 890,200 | |
| | | | | | | | |
Oil and Gas Services — 5.0%(1) | | | | | | | | |
Bermuda — 1.7%(1) | | | | | | | | |
Seadrill Ltd. | | | 70,000 | | | | 2,837,100 | |
United States — 3.3%(1) | | | | | | | | |
Cameron International Corporation(2) | | | 40,000 | | | | 2,434,800 | |
Hornbeck Offshore SVCS Inc.(2) | | | 55,000 | | | | 2,861,100 | |
| | | | | | | | |
| | | | | | | 8,133,000 | |
| | | | | | | | |
See Accompanying Notes to the Financial Statements.
5
The Cushing® Renaissance Fund
Schedule of Investments (Unaudited) | May 31, 2013 — (Continued) |
| | | | | | | | |
| COMMON STOCK — (Continued) | | Shares | | | Fair Value | |
| | | | | | | | |
Refining — 10.8%(1) | | | | | | | | |
United States — 10.8%(1) | | | | | | | | |
HollyFrontier Corporation(3) | | | 118,000 | | | $ | 5,841,000 | |
Marathon Petroleum Corporation(3) | | | 48,100 | | | | 3,968,250 | |
Phillips 66(3) | | | 59,500 | | | | 3,960,915 | |
Tesoro Corporation | | | 40,000 | | | | 2,466,000 | |
Western Refining Inc. | | | 40,000 | | | | 1,334,800 | |
| | | | | | | | |
| | | | | | | 17,570,965 | |
| | | | | | | | |
Transportation — 5.7%(1) | | | | | | | | |
Bermuda — 1.1%(1) | | | | | | | | |
Golar LNG Ltd. | | | 50,000 | | | | 1,700,000 | |
Canada — 0.3%(1) | | | | | | | | |
Canadian Pac, LTD | | | 4,200 | | | | 554,358 | |
United States — 4.3%(1) | | | | | | | | |
Genesee & Wyoming Inc.(2) | | | 7,500 | | | | 667,875 | |
Kansas City Southern | | | 16,000 | | | | 1,771,200 | |
Kirby Corp.(2) | | | 35,000 | | | | 2,732,800 | |
Swift Trasportation Co. | | | 110,000 | | | | 1,852,400 | |
| | | | | | | | |
| | | | | | | 9,278,633 | |
| | | | | | | | |
Utilities — 4.7%(1) | | | | | | | | |
United States — 4.7%(1) | | | | | | | | |
Northwest Natural Gas Co. | | | 35,000 | | | | 1,495,550 | |
PG&E Corp. | | | 30,000 | | | | 1,347,300 | |
PPL Corp. | | | 100,000 | | | | 2,970,000 | |
The Southern Company(2) | | | 40,500 | | | | 1,777,950 | |
| | | | | | | | |
| | | | | | | 7,590,800 | |
| | | | | | | | |
Total Common Stock (Cost $82,352,091) | | | | | | $ | 90,383,864 | |
| | | | | | | | |
MASTER LIMITED PARTNERSHIPS AND
RELATED COMPANIES — 26.4%(1) | | | | | | |
Chemicals — 4.7%(1) | | | | | | | | |
United States — 4.7%(1) | | | | | | | | |
Petrologistics, L.P. | | | 250,000 | | | $ | 3,375,000 | |
Rentech Nitrogen Partners, L.P.(3) | | | 134,100 | | | | 4,331,430 | |
| | | | | | | | |
| | | | | | | 7,706,430 | |
| | | | | | | | |
Crude Oil/ Refined Products Pipelines and Storage — 5.5%(1) | |
United States — 5.5%(1) | | | | | | | | |
Cheniere Energy Partners, L.P.(3) | | | 230,000 | | | | 7,127,700 | |
Tesoro Logistics Partners, L.P.(3) | | | 30,100 | | | | 1,867,404 | |
| | | | | | | | |
| | | | | | | 8,995,104 | |
| | | | | | | | |
Refining — 8.1%(1) | | | | | | | | |
United States — 8.1%(1) | | | | | | | | |
Calumet Specialty Products Partners, L.P.(3) | | | 185,100 | | | | 6,321,165 | |
Delek Logistics Partners, L.P.(3) | | | 199,000 | | | | 6,827,690 | |
| | | | | | | | |
| | | | | | | 13,148,855 | |
| | | | | | | | |
Upstream — 5.3%(1) | | | | | | | | |
United States — 5.3%(1) | | | | | | | | |
Legacy Reserves, L.P. | | | 93,000 | | | | 2,464,500 | |
Linn Energy, LLC | | | 72,000 | | | | 2,368,800 | |
QR Energy, L.P. | | | 225,000 | | | | 3,802,500 | |
| | | | | | | | |
| | | | | | | 8,635,800 | |
| | | | | | | | |
See Accompanying Notes to the Financial Statements.
6
The Cushing® Renaissance Fund
Schedule of Investments (Unaudited) | May 31, 2013 — (Continued) |
| | | | | | | | |
MASTER LIMITED PARTNERSHIPS AND
RELATED COMPANIES — (Continued) | | Shares | | | Fair Value | |
| | | | | | | | |
Shipping — 2.8%(1) | | | | | | | | |
Marshall Islands — 2.8%(1) | | | | | | | | |
Capital Product Partners, L.P. | | | 270,000 | | | $ | 2,478,600 | |
Knot Offshore Partners, L.P.(2) | | | 85,970 | | | | 2,006,540 | |
| | | | | | | | |
| | | | | | | 4,485,140 | |
| | | | | | | | |
Total Master Limited Partnerships and Related Companies (Cost $35,084,103) | | | | | | $ | 42,971,329 | |
| | | | | | | | |
| SENIOR NOTES — 25.0%(1) | | Principal
Amount | | | | |
Engineering & Construction — 3.3%(1) | | | | | | | | |
United States — 3.3%(1) | | | | | | | | |
Zachry Holdings Inc., 7.500%, due 02/01/2020(4) | | $ | 5,000,000 | | | $ | 5,312,500 | |
| | | | | | | | |
Exploration and Production — 11.8%(1) | | | | | | | | |
United States — 11.8%(1) | | | | | | | | |
Barrett Bill Corp., 7.000%, due 10/15/2022 | | | 4,750,000 | | | | 5,011,250 | |
Comstock Res Inc., 7.750%, due 04/01/2019 | | | 5,000,000 | | | | 5,312,500 | |
Denbury Res Inc., 4.625%, due 07/15/2023 | | | 3,000,000 | | | | 2,906,250 | |
Penn Va Corp., 8.500%, due 05/01/2020(4) | | | 5,000,000 | | | | 5,012,500 | |
Resolute Energy Corp., 8.500%, due 05/01/2020 | | | 1,000,000 | | | | 1,075,000 | |
| | | | | | | | |
| | | | | | | 19,317,500 | |
| | | | | | | | |
Metals & Mining — 2.8%(1) | | | | | | | | |
United States — 2.8%(1) | | | | | | | | |
Cliffs Natural Resources Inc., 6.250%, due 10/01/2040 | | | 5,000,000 | | | | 4,534,770 | |
| | | | | | | | |
Oil & Gas Services — 2.7%(1) | | | | | | | | |
United States — 2.7%(1) | | | | | | | | |
Key Energy SVCS Inc., 6.750%, due 03/01/2021 | | | 4,000,000 | | | | 4,070,000 | |
Northern Oil & Gas Inc., 8.000%, due 06/01/2020 | | | 250,000 | | | | 261,250 | |
| | | | | | | | |
| | | | | | | 4,331,250 | |
| | | | | | | | |
Refining — 1.1%(1) | | | | | | | | |
United States — 1.1%(1) | | | | | | | | |
Western Refining Inc., 6.250%, due 04/01/2021(4) | | | 1,750,000 | | | | 1,815,625 | |
| | | | | | | | |
Utilities — 3.3%(1) | | | | | | | | |
United States — 3.3%(1) | | | | | | | | |
Dolphin Subsidiary II Inc., 7.250%, due 10/15/2021 | | | 5,000,000 | | | | 5,425,000 | |
| | | | | | | | |
Total Senior Notes (Cost $40,461,432) | | | | | | $ | 40,736,645 | |
| | | | | | | | |
SHORT-TERM INVESTMENTS —
INVESTMENT COMPANIES — 0.0%(1) | | Shares | | | | |
United States — 0.0%(1) | | | | | | | | |
AIM Short-Term Treasury Portfolio Fund — Institutional Class, 0.02%(5) | | | 1,280 | | | $ | 1,280 | |
Fidelity Government Portfolio Fund — Institutional Class, 0.01%(5) | | | 1,280 | | | | 1,280 | |
Fidelity Money Market Protfolio — Institutional Class, 0.12%(5) | | | 1,280 | | | | 1,280 | |
First American Government Obligations Fund — Class Z, 0.02%(5) | | | 1,280 | | | | 1,280 | |
Invesco STIC Prime Portfolio, 0.09%(5) | | | 1,280 | | | | 1,280 | |
| | | | | | | | |
Total Short-Term Investments (Cost $6,400) | | | | | | $ | 6,400 | |
| | | | | | | | |
TOTAL INVESTMENTS — 106.9%(1) (Cost $157,904,026) | | | | | | $ | 174,098,238 | |
Liabilities in Excess of Other Assets — (6.9)%(1) | | | | | | | (11,175,489 | ) |
| | | | | | | | |
NET ASSETS APPLICABLE TO COMMON STOCKHOLDERS — 100.0%(1) | | | | | | $ | 162,922,749 | |
| | | | | | | | |
See Accompanying Notes to the Financial Statements.
7
The Cushing® Renaissance Fund
Schedule of Investments (Unaudited) | May 31, 2013 — (Continued) |
| | | | | | | | |
| SCHEDULE OF WRITTEN CALL OPTIONS | | Contracts | | | Fair Value | |
| | | | | | | | |
Options — (0.0)%(1) | | | | | | | | |
United States — (0.0)%(1) | | | | | | | | |
Cameron International Corporation Call Option
Expiration: June 2013, Exercise Price: $67.50 | | | (250 | ) | | $ | (3,750 | ) |
The Dow Chemical Company Call Option
Expiration: June 2013, Exercise Price: $36.00 | | | (300 | ) | | | (8,100 | ) |
E.I. du Pont de Nemours and Company Call Option
Expiration: June 2013, Exercise Price: $57.50 | | | (200 | ) | | | (7,400 | ) |
Westlake Chemical Corp. Call Option
Expiration: June 2013, Exercise Price: $100.00 | | | (100 | ) | | | (10,500 | ) |
| | | | | | | | |
TOTAL WRITTEN CALL OPTIONS — (0.0)%(1) (PREMIUMS $58,625) | | | | | | $ | (29,750 | ) |
| | | | | | | | |
| (1) | Calculated as a percentage of net assets applicable to common stockholders. |
| (2) | No distribution or dividend was made during the period ended May 31, 2013. As such, it is classified as a non-income producing security as of May 31, 2013. |
| (3) | All or a portion of these securities are held as collateral pursuant to the loan agreements. |
| (4) | Restricted security under Rule 144A under the Securities Act of 1933, as amended. |
| (5) | Rate reported is the current yield as of May 31, 2013. |
See Accompanying Notes to the Financial Statements.
8
The Cushing® Renaissance Fund
Statement of Assets & Liabilities (Unaudited)
May 31, 2013
| | | | |
Assets | | | | |
Investments, at fair value (cost $157,904,026) | | $ | 174,098,238 | |
Cash | | | 11,444,325 | |
Receivable for investments sold | | | 3,660,086 | |
Dividends receivable | | | 283,879 | |
Interest receivable | | | 529,881 | |
Prepaid expenses | | | 13,952 | |
| | | | |
Total assets | | | 190,030,361 | |
| | | | |
Liabilities | | | | |
Written call options, at fair value (premiums $58,625) | | | 29,750 | |
Payable to Adviser, net of waiver | | | 165,606 | |
Payable for investments purchased | | | 2,551,246 | |
Short-term borrowings | | | 24,200,000 | |
Payable to Trustees | | | 5,666 | |
Accrued interest expense | | | 1,720 | |
Accrued expenses and other liabilities | | | 153,624 | |
| | | | |
Total liabilities | | | 27,107,612 | |
| | | | |
Net assets applicable to common stockholders | | $ | 162,922,749 | |
| | | | |
Net Assets Applicable to Common Stockholders Consisting of Capital stock, $0.001 par value; 6,054,188 shares issued and outstanding (unlimited shares authorized) | | $ | 6,054 | |
Additional paid-in capital | | | 141,238,373 | |
Undistributed net investment income | | | 102,035 | |
Accumulated realized gain | | | 5,353,200 | |
Net unrealized gain on investments | | | 16,223,087 | |
| | | | |
Net assets applicable to common stockholders | | $ | 162,922,749 | |
| | | | |
Net Asset Value per common share outstanding (net assets applicable to common shares divided by common shares outstanding) | | $ | 26.91 | |
| | | | |
See Accompanying Notes to the Financial Statements.
9
The Cushing® Renaissance Fund
Statement of Operations (Unaudited)
Period From December 1, 2012 through May 31, 2013
| | | | |
Investment Income | | | | |
Distributions received from master limited partnerships | | $ | 1,911,921 | |
Less: return of capital on distributions | | | (1,832,416 | ) |
| | | | |
Distribution income from master limited partnerships | | | 79,505 | |
Dividends from common stock, net of foreign taxes withheld of $81,796 | | | 1,031,999 | |
Interest income | | | 1,230,884 | |
| | | | |
Total Investment Income | | | 2,342,388 | |
| | | | |
Expenses | | | | |
Advisory fees | | | 1,099,221 | |
Stock loan fees | | | 91,116 | |
Administrator fees | | | 63,499 | |
Professional fees | | | 41,124 | |
Trustees’ fees | | | 30,860 | |
Insurance expense | | | 30,587 | |
Transfer agent fees | | | 20,116 | |
Reports to stockholders | | | 15,023 | |
Registration fees | | | 7,013 | |
Custodian fees and expenses | | | 3,925 | |
Other expenses | | | 1,908 | |
| | | | |
Total Expenses before Interest Expense | | | 1,404,392 | |
| | | | |
Interest expense | | | 100,879 | |
| | | | |
Total Expenses | | | 1,505,271 | |
Less: expense waived by Adviser | | | (219,844 | ) |
| | | | |
Net Expenses | | | 1,285,427 | |
| | | | |
Net Investment Income | | | 1,056,961 | |
| | | | |
Realized and Unrealized Gain (Loss) on Investments | | | | |
Net realized gain on investments | | | 5,301,921 | |
Net realized gain on options | | | 230,560 | |
| | | | |
Net realized gain on investments | | | 5,532,481 | |
Net change in unrealized appreciation of investments | | | 16,449,903 | |
Net change in unrealized appreciation of written call options | | | 28,875 | |
| | | | |
Net change in unrealized appreciation of investments | | | 16,478,778 | |
| | | | |
Net Realized and Unrealized Gain on Investments | | | 22,011,259 | |
| | | | |
Increase in Net Assets Applicable to Common Stockholders
Resulting from Operations | | $ | 23,068,220 | |
| | | | |
See Accompanying Notes to the Financial Statements.
10
The Cushing® Renaissance Fund
Statements of Changes in Net Assets
| | | | | | | | |
| | | Period From
December 1, 2012
through
May 31, 2013 | | | Period From
September 25, 2012(1)
through
November 30, 2012 | |
| | | (Unaudited) | | | | |
Operations | | | | | | | | |
Net investment income | | $ | 1,056,961 | | | $ | 48,580 | |
Net realized gain (loss) on investments | | | 5,532,481 | | | | (183,846 | ) |
Net change in unrealized appreciation (depreciation) of investments | | | 16,478,778 | | | | (255,691 | ) |
| | | | | | | | |
Net increase (decrease) in net assets applicable to common stockholders resulting from operations | | | 23,068,220 | | | | (390,957 | ) |
| | | | | | | | |
Dividends and Distributions to Common Stockholders | | | | | | | | |
Net investment income | | | (998,941 | ) | | | — | |
Return of capital | | | (2,996,823 | ) | | | — | |
| | | | | | | | |
Total dividends and distributions to common stockholders | | | (3,995,764 | ) | | | — | |
| | | | | | | | |
Capital Share Transactions | | | | | | | | |
Proceeds from initial public offering of 0 and 6,050,000 common shares, respectively | | | — | | | | 151,250,000 | |
Underwriting discounts and offering expenses associated with the issuance of common shares | | | — | | | | (7,108,750 | ) |
| | | | | | | | |
Net increase in net assets applicable to common stockholders from capital share transactions | | | — | | | | 144,141,250 | |
| | | | | | | | |
Total increase in net assets applicable to common stockholders | | | 19,072,456 | | | | 143,750,293 | |
Net Assets | | | | | | | | |
Beginning of period | | | 143,850,293 | | | | 100,000 | |
| | | | | | | | |
End of period | | $ | 162,922,749 | | | $ | 143,850,293 | |
| | | | | | | | |
Undistributed net investment income at the end of the period | | $ | 102,035 | | | $ | 44,015 | |
| | | | | | | | |
| (1) | Commencement of operations. |
See Accompanying Notes to the Financial Statements.
11
The Cushing® Renaissance Fund
Statement of Cash Flows (Unaudited)
May 31, 2013
| | | | |
| | | Period From
December 1, 2012
through
May 31, 2013 | |
OPERATING ACTIVITIES | | | | |
Increase in Net Assets Applicable to Common Stockholders Resulting from Operations | | $ | 23,068,220 | |
Adjustments to reconcile decrease in the net assets applicable to common stockholders to net cash used in operating activities | | | | |
Net change in unrealized appreciation of investments | | | (16,478,778 | ) |
Purchases of investments | | | (171,769,292 | ) |
Proceeds from sales of investments | | | 109,102,447 | |
Proceeds from investments sold short | | | 24,047,511 | |
Purchases to cover investments sold short | | | (25,147,661 | ) |
Proceeds from option transactions, net | | | 14,713,455 | |
Return of capital on distributions | | | 1,832,416 | |
Net realized gains on sales of investments | | | (5,532,481 | ) |
Net sales of short-term investments | | | 43,838,665 | |
Net accretion/amortization of senior notes’ premiums/discounts | | | 21,301 | |
Changes in operating assets and liabilities | | | | |
Receivable for investments sold | | | (3,660,086 | ) |
Interest receivable | | | (240,663 | ) |
Distributions and dividends receivable | | | 67,652 | |
Prepaid and other assets | | | (12,962 | ) |
Payable to Adviser, net of waiver | | | 52,584 | |
Payable for investments purchased | | | (2,639,025 | ) |
Accrued interest expense | | | 1,720 | |
Accrued expenses and other liabilities | | | (24,934 | ) |
| | | | |
Net cash used in operating activities | | | (8,759,911 | ) |
| | | | |
FINANCING ACTIVITIES | | | | |
Proceeds from borrowing facility | | | 38,500,000 | |
Repayment of borrowing facility | | | (14,300,000 | ) |
Common Stock Issuance and other direct costs | | | 6,054 | |
Additional paid-in capital from Common Stock Issuance | | | (6,054 | ) |
Dividends paid to common stockholders | | | (3,995,764 | ) |
| | | | |
Net cash provided by financing activities | | | 20,204,236 | |
| | | | |
Increase in Cash and Cash Equivalents | | | 11,444,325 | |
Cash and Cash Equivalents: | | | | |
Beginning of fiscal year | | | — | |
| | | | |
End of fiscal year | | $ | 11,444,325 | |
| | | | |
Supplemental Disclosure of Cash Flow and Non-Cash Information | | | | |
Interest Paid | | $ | 125,767 | |
See Accompanying Notes to the Financial Statements.
12
The Cushing® Renaissance Fund
Financial Highlights
| | | | | | | | |
| | | Period From
December 1, 2012
through
May 31, 2013 | | | Period From
September 25, 2012(1)
through
November 30, 2012 | |
| | | (Unaudited) | | | | |
Per Common Share Data(2) | | | | | | | | |
Net Asset Value, beginning of period | | $ | 23.76 | | | $ | — | |
Public offering price | | | — | | | | 25.00 | |
Underwriting discounts and offering costs on issuance of common shares | | | — | | | | (1.17 | ) |
Income from Investment Operations: | | | | | | | | |
Net investment income | | | 0.67 | | | | 0.01 | |
Net realized and unrealized gain (loss) on investments | | | 3.14 | | | | (0.08 | ) |
| | | | | | | | |
Total increase (decrease) from investment operations | | | 3.81 | | | | (0.07 | ) |
| | | | | | | | |
Less Distributions to Common Stockholders: | | | | | | | | |
Net investment income | | | (0.17 | ) | | | — | |
Return of capital | | | (0.49 | ) | | | — | |
| | | | | | | | |
Total distributions to common stockholders | | | (0.66 | ) | | | — | |
| | | | | | | | |
Net Asset Value, end of period | | $ | 26.91 | | | $ | 23.76 | |
| | | | | | | | |
Per common share fair value, end of period | | $ | 25.38 | | | $ | 23.41 | |
| | | | | | | | |
Total Investment Return Based on Fair Value(4) | | | 11.46 | %(3) | | | (6.36 | )%(3) |
| | | | | | | | |
Supplemental Data and Ratios | | | | | | | | |
Net assets applicable to common stockholders, end of period (000’s) | | $ | 162,923 | | | $ | 143,850 | |
Ratio of expenses to average net assets before waiver(5) | | | 1.94 | % | | | 2.32 | |
Ratio of expenses to average net assets after waiver(5) | | | 1.66 | % | | | 2.06 | |
Ratio of net investment income to average net assets before waiver(5) | | | 1.08 | % | | | (0.05 | )% |
Ratio of net investment income to average net assets after waiver(5) | | | 1.36 | % | | | 0.21 | % |
Portfolio turnover rate | | | 67.96 | %(6) | | | 9.23 | %(6) |
| (1) | Commencement of operations. |
| (2) | Information presented relates to a share of common stock outstanding for the entire period. |
| (3) | Not annualized. Total investment return is calculated assuming a purchase of common stock at the initial public offering price and a sale at the closing price on the last day of the period reported. The calculation also assumes reinvestment of dividends at actual prices pursuant to the Fund’s dividend reinvestment plan. Total investment return does not reflect brokerage commissions. |
| (4) | Not annualized. The calculation also assumes reinvestment of dividends at actual prices pursuant to the Fund’s dividend reinvestment plan. Total investment return does not reflect brokerage commissions. |
| (5) | Annualized for periods less than one full year. |
See Accompanying Notes to the Financial Statements.
13
The Cushing® Renaissance Fund
Notes to Financial Statements (Unaudited)
May 31, 2013
1. Organization
The Cushing® Renaissance Fund (the “Fund”) was formed as a Delaware statutory trust on November 16, 2010, and is registered as a non-diversified, closed-end management investment company under the Investment Company Act of 1940, as amended. The Fund is managed by Cushing® MLP Asset Management, LP (“Adviser”). The Fund’s investment objective is to seek a high total return with an emphasis on current income. The Fund commenced operations on September 25, 2012. The Fund’s shares are listed on the New York Stock Exchange under the symbol “SZC.”
2. Significant Accounting Policies
A. Use of Estimates
The preparation of financial statements in conformity with accounting principles generally accepted in the United States of America requires management to make estimates and assumptions that affect the reported amount of assets and liabilities, recognition of distribution income and disclosure of contingent assets and liabilities at the date of the financial statements. Actual results could differ from those estimates.
B. Investment Valuation
The Fund uses the following valuation methods to determine fair value as either fair value for investments for which market quotations are available, or if not available, the fair value, as determined in good faith pursuant to such policies and procedures as may be approved by the Fund’s Board of Trustees (“Board of Trustees”) from time to time. The valuation of the portfolio securities of the Fund currently includes the following processes:
(i) The fair value of each security listed or traded on any recognized securities exchange or automated quotation system will be the last reported sale price at the relevant valuation date on the composite tape or on the principal exchange on which such security is traded. If no sale is reported on that date, the Adviser utilizes, when available, pricing quotations from principal market markers. Such quotations may be obtained from third-party pricing services or directly from investment brokers and dealers in the secondary market. Generally, the Fund’s loan and bond positions are not traded on exchanges and consequently are valued based on market prices received from third-party services or broker-dealer sources.
(ii) Listed options on debt securities are valued at the average of the bid price and the ask price. Unlisted options on debt or equity securities are valued based upon their composite bid prices if held long, or their composite ask prices if held short. Futures are valued at the last sale price on the commodities exchange on which they trade.
(iii) The Fund’s non-marketable investments will generally be valued in such manner as the Adviser determines in good faith to reflect their fair values under procedures established by, and under the general supervision and responsibility of, the Board of Trustees. The pricing of all assets that are fair valued in this manner will be subsequently reported to and ratified by the Board of Trustees.
The Fund may engage in short sale transactions. For financial statement purposes, an amount equal to the settlement amount, if any, is included in the Statement of Assets and Liabilities as a liability. The amount of the liability is subsequently marked-to-market to reflect the current value of the short positions. Subsequent fluctuations in market prices of securities sold short may require purchasing the
14
securities at prices which may differ from the market value reflected on the Statement of Assets and Liabilities. When the Fund sells a security short, it must borrow the security sold short and deliver it to the broker-dealer through which it made the short sale. A gain, limited to the price at which the Fund sold the security short, or a loss, unlimited in size, will be recognized under the termination of a short sale. The Fund is also subject to the risk that it may be unable to reacquire a security to terminate a short position except at a price substantially in excess of the last quoted price. The Fund is liable for any dividends paid on securities sold short and such amounts would be reflected as dividend expense in the Statement of Operations. The Fund’s obligation to replace the borrowed security will be secured by collateral deposited with the broker-dealer. The Fund also will be required to segregate similar collateral to the extent, if any, necessary so that the value of both collateral amounts in the aggregate is at all times equal to at least 100% of the current market value of the securities sold short. The Fund did not hold any securities sold short at May 31, 2013.
C. Security Transactions, Investment Income and Expenses
Security transactions are accounted for on the date the securities are purchased or sold (trade date). Realized gains and losses are reported on a specific identified cost basis. Interest income is recognized on the accrual basis, including amortization of premiums and accretion of discounts. Distributions are recorded on the ex-dividend date. Distributions received from the Fund’s investments in master limited partnerships (“MLPs”) generally are comprised of ordinary income, capital gains and return of capital. The Fund records investment income on the ex-date of the distributions. For financial statement purposes, the Fund uses return of capital and income estimates to allocate the dividend income received. Such estimates are based on historical information available from each MLP and other industry sources. These estimates may subsequently be revised based on information received from the MLPs after their tax reporting periods are concluded, as the actual character of these distributions is not known until after the fiscal year end of the Fund.
The Fund estimates the allocation of investment income and return of capital for the distributions received from MLPs within the Statement of Operations. For the period ended May 31, 2013, the Fund has estimated approximately 5% of the distributions from MLPs to be from investment income with the remaining balance to be return of capital.
Expenses are recorded on the accrual basis.
D. Dividends and Distributions to Stockholders
Dividends and distributions to common stockholders will be recorded on the ex-dividend date. The character of dividends and distributions to common stockholders made during the year may differ from their ultimate characterization for federal income tax purposes. For the period ended May 31, 2013, the Fund’s dividends and distributions were expected to be comprised of 75% return of capital and 25% of ordinary income. The tax character of distributions paid for the period ended May 31, 2013 will be determined in early 2014.
E. Federal Income Taxation
The Fund intends to qualify each year for special tax treatment afforded to, a regulated investment company (“RIC”) under Subchapter M of the Internal Revenue Code of 1986, as amended (“IRC”). In order to qualify as a RIC, the Fund must, among other things, satisfy income, asset diversification and distribution requirements. As long as it so qualifies, the Fund will not be subject to U.S. federal income tax to the extent that it distributes annually its investment company taxable income (which includes ordinary income and the excess of net short-term capital gain over net long-term capital loss) and its “net capital gain” (i.e., the excess of net long-term capital gain over net short-term capital loss). The Fund intends to distribute at least annually substantially all of such income and gain. If the Fund retains any investment company taxable income or net capital gain, it will be subject to U.S. federal income
15
tax on the retained amount at regular corporate tax rates. In addition, if the Fund fails to qualify as a RIC for any taxable year, it will be subject to U.S. federal income tax on all of its income and gains at regular corporate tax rates.
The Fund recognizes in the financial statements the impact of a tax position, if that position is more-likely-than-not to be sustained on examination by the taxing authorities, based on the technical merits of the position. Tax benefits resulting from such a position are measured as the amount that has a greater than fifty percent likelihood on a cumulative basis to be sustained on examination.
F. Cash and Cash Equivalents
The Fund considers all highly liquid investments purchased with initial maturity equal to or less than three months to be cash equivalents.
G. Indemnifications
Under the Fund’s organizational documents, its officers and trustees are indemnified against certain liabilities arising out of the performance of their duties to the Fund. In addition, in the normal course of business, the Fund may enter into contracts that provide general indemnification to other parties. The Fund’s maximum exposure under such indemnification arrangements is unknown, as this would involve future claims that may be made against the Fund that have not yet occurred, and may not occur.
H. Derivative Financial Instruments
The Fund provides disclosure regarding derivatives and hedging activity to allow investors to understand how and why the Fund uses derivatives, how derivatives are accounted for, and how derivative instruments affect the Fund’s results of operations and financial position.
The Fund occasionally purchases and sells (“writes”) put and call equity options as a source of potential protection against a broad market decline. A purchaser of a put option has the right, but not the obligation, to sell the underlying instrument at an agreed upon price (“strike price”) to the option seller. A purchaser of a call option has the right, but not the obligation, to purchase the underlying instrument at the strike price from the option seller. Options are settled for cash.
Purchased Options — Premiums paid by the Fund for purchased options are included in the Statement of Assets and Liabilities as an investment. The option is adjusted daily to reflect the fair value of the option and any change in fair value is recorded as unrealized appreciation or depreciation of investments. If the option is allowed to expire, the Fund will lose the entire premium paid and record a realized loss for the premium amount. Premiums paid for purchased options which are exercised or closed are added to the amounts paid or offset against the proceeds on the underlying investment transaction to determine the realized gain/loss or cost basis of the security.
Written Options — Premiums received by the Fund for written options are included in the Statement of Assets and Liabilities. The amount of the liability is adjusted daily to reflect the fair value of the written option and any change in fair value is recorded as unrealized appreciation or depreciation of investments. Premiums received from written options that expire are treated as realized gains. The Fund records a realized gain or loss on written options based on whether the cost of the closing transaction exceeds the premium received. If a call option is exercised by the option buyer, the premium received by the Fund is added to the proceeds from the sale of the underlying security to the option buyer and compared to the cost of the closing transaction to determine whether there has been a realized gain or loss. If a put option is exercised by an option buyer, the premium received by the option seller reduces the cost basis of the purchased security.
Written uncovered call options subject the Fund to unlimited risk of loss. Written covered call options limit the upside potential of a security above the strike price. Put options written subject the Fund to risk of loss if the value of the security declines below the exercise price minus the put premium.
16
The Fund is not subject to credit risk on written options as the counterparty has already performed its obligation by paying the premium at the inception of the contract.
The Fund has adopted the disclosure provisions of FASB Accounting Standard Codification 815, Derivatives and Hedging (“ASC 815”). ASC 815 requires enhanced disclosures about the Fund’s use of and accounting for derivative instruments and the effect of derivative instruments on the Fund’s results of operations and financial position. Tabular disclosure regarding derivative fair value and gain/loss by contract type (e.g., interest rate contracts, foreign exchange contracts, credit contracts, etc.) is required and derivatives accounted for as hedging instruments under ASC 815 must be disclosed separately from those that do not qualify for hedge accounting. Even though the Fund may use derivatives in an attempt to achieve an economic hedge, the Fund’s derivatives are not accounted for as hedging instruments under ASC 815 because investment companies account for their derivatives at fair value and record any changes in fair value in current period earnings.
There were no transactions in purchased options during the period ended May 31, 2013.
Transactions in written options contracts for the period ended May 31, 2013, are as follows:
| | | | | | | | |
| | | Contracts | | | Premiums | |
Outstanding at December 1, 2012 | | | — | | | $ | — | |
Options written | | | 12,030 | | | | 535,049 | |
Options covered | | | (2,425 | ) | | | (94,391 | ) |
Options expired | | | (5,930 | ) | | | (230,560 | ) |
Options exercised | | | (2,825 | ) | | | (151,473 | ) |
| | | | | | | | |
Outstanding at May 31, 2013 | | | 850 | | | $ | 58,625 | |
| | | | | | | | |
The average monthly fair value of written options during the period ended May 31, 2013 was $2,005.
The effect of derivative instruments on the Statement of Assets and Liabilities for the period ended May 31, 2013:
| | | | | | | | | | | | |
| | | Assets | | | Liabilities | |
Derivatives | | Description | | Fair Value | | | Description | | Fair Value | |
Equity Contracts: | | | | | | | | | | | | |
Purchased Call Options | | N/A | | $ | — | | | Written call options
at fair value | | $ | 29,750 | |
| | | | | | | | | | | | |
The effect of derivative instruments on the Statement of Operations for the period ended May 31, 2013:
| | | | | | | | | | | | |
Amount of Realized Gain or (Loss) on Derivatives Recognized in Income | |
Derivatives not accounted for as hedging
instruments under ASC 815 | | Purchased
Options | | | Written
Options | | | Total | |
Equity Contracts | | $ | — | * | | $ | 230,560 | * | | $ | 230,560 | |
| | | | | | | | | | | | |
| * | Included in Net realized gain on investments on the Statement of Operations. |
| | | | | | | | | | | | |
Amount of Unrealized Appreciation (Depreciation) on Derivatives Recognized in Income | |
Derivatives not accounted for as hedging
instruments under ASC 815 | | Purchased
Options | | | Written
Options | | | Total | |
Equity Contracts | | $ | — | | | $ | 28,875 | | | $ | 28,875 | |
| | | | | | | | | | | | |
I. Recent Accounting Pronouncements
In December 2011, the FASB issued ASU 2011-11 “Balance Sheet (Topic 210) Disclosures about Offsetting Assets and Liabilities”. ASU 2011-11 requires new disclosures for recognized financial instruments and derivative instruments that are either offset on the balance sheet in accordance with the
17
offsetting guidance in ASC 210-20-45 or ASC 815-10-45 or are subject to an enforceable master netting arrangement or similar arrangement. ASU 2011-11 is effective for periods beginning on or after January 1, 2013 and must be applied retrospectively. Management is currently evaluating the impact of these amendments on the financial statements.
3. Concentrations of Risk
The Fund’s investment objective is to seek a high total return with an emphasis on current income. The Fund will seek to achieve its investment objective by investing, under normal market conditions, at least 80% of its Managed Assets (as defined below) in (i) companies across the energy supply chain spectrum, including upstream, midstream and downstream energy companies, as well as oil and gas services and logistics companies (collectively, “Energy Companies”), and (ii) energy-intensive chemical, metal and industrial and manufacturing companies and engineering and construction companies that the Adviser expects to benefit from lower energy and feedstock costs (collectively, “Industrial Companies” and, together with Energy Companies, “Renaissance Companies”); up to 25% of its Managed Assets in securities of energy MLPs; up to 25% of its Managed Assets in unregistered or otherwise restricted securities, including securities issued by private companies; and up to 30% of its Managed Assets in debt securities, preferred stock and convertible securities, provided that such securities are (a) rated, at the time of investment, at least (i) B3 by Moody’s Investors Service, Inc. (“Moody’s”), (ii) B- by Standard & Poor’s (“S&P”) or Fitch Ratings (“Fitch”), or (iii) of a comparable rating by another Nationally Recognized Statistical Rating Organization (“NRSRO”) or (b) with respect to up to 10% of its Managed Assets, lower rated or unrated at the time of investment. These investments may include securities such as partnership interests, limited liability company interests or units, trust units, common stock, preferred stock, convertible securities, warrants and depositary receipts and debt securities. The Fund will not invest directly in commodities.
“Managed Assets” means the total assets of the Fund, minus all accrued expenses incurred in the normal course of operations other than liabilities or obligations attributable to investment leverage, including, without limitation, investment leverage obtained through (i) indebtedness of any type (including, without limitation, borrowing through a credit facility or the issuance of debt securities), (ii) the issuance of shares of preferred stock or other similar preference securities and/or (iii) the reinvestment of collateral received for securities loaned in accordance with the Fund’s investment objective and policies.
4. Agreements and Related Party Transactions
The Fund has entered into an Investment Management Agreement with the Adviser (the “Agreement”). Under the terms of the Agreement, the Fund has agreed to pay the Adviser a fee payable at the end of each calendar month, at an annual rate equal to 1.25% of the average weekly value of the Fund’s managed assets during such month. The Adviser has agreed to waive 0.25% of the management fee for the first twelve (12) months of operations. The Adviser earned $1,099,221 in advisory fees for the period ended May 31, 2013. The Adviser waived $219,844 for the period ended May 31, 2013.
The Fund has engaged U.S. Bancorp Fund Services, LLC to serve as the Fund’s administrator. The Fund pays the administrator a monthly fee computed at an annual rate of 0.09% of the first $100,000,000 of the Fund’s average daily net assets, 0.07% on the next $200,000,000 of average daily net assets and 0.04% on the balance of the Fund’s average daily net assets, with a minimum annual fee of $70,000.
U.S. Bancorp Fund Services, LLC serves as the Fund’s transfer agent, dividend paying agent, and agent for the automatic dividend reinvestment plan.
18
U.S. Bank, N.A. serves as the Fund’s custodian. The Fund pays the custodian a monthly fee computed at an annual rate of 0.004% of the Fund’s average daily market value, with a minimum annual fee of $4,800.
5. Income Taxes
It is the Fund’s intention to qualify as a RIC under Subchapter M of the IRC and distribute all of its taxable income. Accordingly, no provision for federal income taxes is required in the financial statements.
The amount and character of income and capital gain distributions to be paid, if any, are determined in accordance with federal income tax regulations, which may differ from U.S. generally accepted accounting principles. These differences are primarily due to differences in the timing of recognition of gains or losses on investments. Permanent book and tax basis differences resulted in the reclassifications of $4,565 from undistributed net investment income and $4,565 to accumulated net realized loss.
The following information is provided on a tax basis as of November 30, 2012:
| | | | |
Cost of investments | | $ | 148,937,190 | |
| | | | |
Gross unrealized appreciation | | $ | 2,572,396 | |
Gross unrealized depreciation | | | (2,814,141 | ) |
| | | | |
Net unrealized appreciation (depreciation) | | $ | (241,745 | ) |
| | | | |
Undistributed Operating Income | | | 29,930 | |
Other accumulated gains (losses) | | $ | (179,142 | ) |
| | | | |
Total accumulated earnings (losses) | | $ | (390,957 | ) |
| | | | |
The capital loss carryforward is available to offset future taxable income. The Fund has the following capital loss amounts:
| | | | | | | | |
| | |
Fiscal Year Ended Capital loss | | Amount | | | Characteristic | |
November 30, 2012 | | $ | 179,281 | | | | Short Term | |
The Fund recognizes the tax benefits of uncertain tax positions only where the position is “more likely than not” to be sustained assuming examination by tax authorities. Management has analyzed the Fund’s tax positions, and has concluded that no liability for unrecognized tax benefits should be recorded related to uncertain tax positions taken on U.S. tax returns and state tax returns filed since inception of the Fund. No income tax returns are currently under examination. The period from inception through May 31, 2013 remains subject to examination by the tax authorities in the United States. Due to the nature of the Fund’s investments, the Fund may be required to file income tax returns in several states. The Fund is not aware of any tax positions for which it is reasonably possible that the total amounts of unrecognized tax benefits will change materially in the next 12 months.
6. Fair Value Measurements
Various inputs that are used in determining the fair value of the Fund’s investments are summarized in the three broad levels listed below:
| | • | | Level 1 — quoted prices in active markets for identical securities |
| | • | | Level 2 — other significant observable inputs (including quoted prices for similar securities, interest rates, prepayment speeds, credit risk, etc.) |
| | • | | Level 3 — significant unobservable inputs (including the Fund’s own assumptions in determining the fair value of investments) |
The inputs or methodology used for valuing securities are not necessarily an indication of the risk associated with investing in those securities.
19
These inputs are summarized in the three broad levels listed below.
| | | | | | | | | | | | | | | | |
| | | | | | Fair Value Measurements at Reporting Date Using | |
Description | | Fair Value at
May 31,
2013 | | | Quoted Prices in
Active Markets for
Identical Assets
(Level 1) | | | Significant Other
Observable
Inputs
(Level 2) | | | Significant
Unobservable
Inputs
(Level 3) | |
Assets | | | | | | | | | | | | | | | | |
Equity Securities | | | | | | | | | | | | | | | | |
Common Stock(a) | | $ | 90,383,864 | | | $ | 90,383,864 | | | $ | — | | | $ | — | |
Master Limited Partnerships and Related Companies(a) | | | 42,971,329 | | | | 42,971,329 | | | | — | | | | — | |
| | | | | | | | | | | | | | | | |
Total Equity Securities | | | 133,355,193 | | | | 133,355,193 | | | | — | | | | — | |
| | | | | | | | | | | | | | | | |
Notes | | | | | | | | | | | | | | | | |
Senior Notes(a) | | | 40,736,645 | | | | — | | | | 40,736,645 | | | | — | |
| | | | | | | | | | | | | | | | |
Total Notes | | | 40,736,645 | | | | — | | | | 40,736,645 | | | | — | |
| | | | | | | | | | | | | | | | |
Other | | | | | | | | | | | | | | | | |
Short-Term Investments | | | 6,400 | | | | 6,400 | | | | — | | | | — | |
| | | | | | | | | | | | | | | | |
Total Other | | | 6,400 | | | | 6,400 | | | | — | | | | — | |
| | | | | | | | | | | | | | | | |
Total | | $ | 174,098,238 | | | $ | 133,361,593 | | | $ | 40,736,645 | | | $ | — | |
| | | | | | | | | | | | | | | | |
Liabilities | | | | | | | | | | | | | | | | |
Options | | $ | 29,750 | | | $ | 29,750 | | | $ | — | | | $ | — | |
| | | | | | | | | | | | | | | | |
| (a) | All other industry classifications are identified in the Schedule of Investments. The Fund did not hold Level 3 investments at any time during the period ended May 31, 2013. |
There were no transfers between any levels during the period ended May 31, 2013.
7. Investment Transactions
For the period ended May 31, 2013, the Fund purchased (at cost) and sold securities (proceeds) in the amount of $171,769,292 and $109,102,447 (excluding short-term securities), respectively and made purchases to cover investments sold short and received proceeds from investments sold in the amount of $25,147,661 and $24,047,511, respectively. The Fund sold covered options (proceeds) in the amount of $16,133,059. The Fund sold written options (proceeds) and covered written options (at cost) in the amount of $535,049 and $1,954,653, respectively.
8. Common Stock
The Fund has unlimited shares of capital stock authorized and 6,054,188 shares outstanding at May 31, 2013. Transactions in common stock for the period ended May 31, 2013 were as follows:
| | | | |
Shares at September 25, 2012 | | | 4,188 | |
Shares sold through initial offering | | | 5,400,000 | |
Shares sold through additional offerings | | | 650,000 | |
| | | | |
Shares at November 30, 2012 | | | 6,054,188 | |
| | | | |
Shares at May 31, 2013 | | | 6,054,188 | |
| | | | |
9. Borrowing Facilities
The Fund maintains a margin account arrangement with Bank of America — Merril Lynch. The interest rate charged on margin borrowing is tied to the cost of funds for Bank of America — Merril Lynch (which approximates LIBOR plus 0.65%). Proceeds from the margin account arrangement are used to execute the Fund’s investment objective.
20
The average principal balance and interest rate for during which the credit facilities were utilized during the period ended May 31, 2013 was approximately $23,223,529 and 0.85%, respectively. At May 31, 2013, the principal balance outstanding was $24,200,000 and accrued interest expense was $1,720.
10. Subsequent Events
On June 21, 2013, the Fund paid a distribution in the amount of $0.41 per common share, for a total of $2,482,217. Of this total, the dividend reinvestment amounted to $21,051.
21
The Cushing® Renaissance Fund
Additional Information (Unaudited)
May 31, 2013
Investment Policies and Parameters
Previously, the Fund had stated an intention to generally invest in 20-40 issuers. The Board of Trustees has approved eliminating that policy. While the Fund initially expects to invest in a greater number of issuers, the Fund may in the future invest in fewer issuers. The Fund is a non-diversified, closed-end management investment company under the 1940 Act. Accordingly, the Fund may invest a greater portion of its assets in a more limited number of issuers than a diversified fund. An investment in the Fund may present greater risk to an investor than an investment in a diversified portfolio because changes in the financial condition or market assessment of a single issuer may cause greater fluctuations in the value of the Fund’s shares.
The Commodity Futures Trading Commission (“CFTC”) amended Rule 4.5, which permits investment advisers to registered investment companies to claim an exclusion from the definition of commodity pool operator with respect to a fund provided certain requirements are met. In order to permit the Adviser to continue to claim this exclusion with respect to the Fund under the amended rule, the Fund limits its transactions in futures, options of futures and swaps (excluding transactions entered into for “bona fide hedging purposes,” as defined under CFTC regulations) such that either: (i) the aggregate initial margin and premiums required to establish its futures, options on futures and swaps do not exceed 5% of the liquidation value of the Fund’s portfolio, after taking into account unrealized profits and losses on such positions; or (ii) the aggregate net notional value of its futures, options on futures and swaps does not exceed 100% of the liquidation value of the Fund’s portfolio, after taking into account unrealized profits and losses on such positions. The Fund and the Adviser do not believe that complying with the amended rule will limit the Fund’s ability to use futures, options and swaps to the extent that it has used them in the past.
Trustee and Executive Officer Compensation
The Fund does not currently compensate any of its trustees who are interested persons or any of its officers. For the period ended May 31, 2013, the aggregate compensation paid by the Fund to the independent trustees was $34,071. The Fund did not pay any special compensation to any of its trustees or officers. The Fund continuously monitors standard industry practices and this policy is subject to change.
Cautionary Note Regarding Forward-Looking Statements
This report contains “forward-looking statements” as defined under the U.S. federal securities laws. Generally, the words “believe,” “expect,” “intend,” “estimate,” “anticipate,” “project,” “will” and similar expressions identify forward-looking statements, which generally are not historical in nature. Forward-looking statements are subject to certain risks and uncertainties that could cause actual results to materially differ from the Fund’s historical experience and its present expectations or projections indicated in any forward-looking statements. These risks include, but are not limited to, changes in economic and political conditions; regulatory and legal changes; energy industry risk; leverage risk; valuation risk; interest rate risk; tax risk; and other risks discussed in the Fund’s filings with the SEC. You should not place undue reliance on forward-looking statements, which speak only as of the date they are made. The Fund undertakes no obligation to update or revise any forward-looking statements made herein. There is no assurance that the Fund’s investment objective will be attained.
22
Form N-Q
The Fund will file its complete schedule of portfolio holdings for the first and third quarters of each fiscal year with the SEC on Form N-Q. The Fund’s Form N-Q and statement of additional information are available without charge by visiting the SEC’s website at www.sec.gov. In addition, you may review and copy the Fund’s Form N-Q at the SEC’s Public Reference Room in Washington D.C. You may obtain information on the operation of the Public Reference Room by calling (800) SEC-0330.
Portfolio Turnover
The portfolio turnover rate for the period ended May 31, 2013 was 67.96%. Portfolio turnover may vary greatly from period to period. The Fund does not consider portfolio turnover rate a limiting factor in the Adviser’s execution of investment decisions, and the Fund may utilize investment and trading strategies that may involve high portfolio turnover. A higher portfolio turnover rate results in correspondingly greater brokerage commissions and other transactional expenses that are borne by the Fund.
Certifications
The Fund’s Chief Executive Officer has submitted to the New York Stock Exchange the annual CEO certification as required by Section 303A.12(a) of the NYSE Listed Fund Manual.
The Fund has filed with the SEC the certification of its Chief Executive Officer and Chief Financial Officer required by Section 302 of the Sarbanes-Oxley Act.
Dividend Reinvestment Plan
How the Plan Works
Unless the registered owner of common shares elects to receive cash by contacting the Plan Agent, all dividends declared for your common shares of the Fund will be automatically reinvested by U.S. Bancorp Fund Services, LLC (the “Plan Agent”), agent for shareholders in administering the Fund’s Dividend Reinvestment Plan (the “Plan”), in additional common shares of the Fund. The Plan Agent will open an account for each common shareholder under the Plan in the same name in which such common shareholder’s common shares are registered. Whenever the Fund declares a dividend or other distribution (for purposes of this section, together, a “dividend”) payable in cash, non-participants in the Plan will receive cash and participants in the Plan will receive the equivalent in common shares. The common shares will be acquired by the Plan Agent for the participants’ accounts, depending upon the circumstances described below, either (i) through receipt of additional unissued but authorized common shares from the Fund (“newly-issued common shares”) or (ii) by purchase of outstanding common shares on the open market (“open-market purchases”) on the New York Stock Exchange or elsewhere.
If, on the payment date for any dividend, the market price per common share plus per share fees (which include any brokerage commissions the Plan Agent is required to pay) is greater than the net asset value per common share, the Plan Agent will invest the dividend amount in newly-issued common shares, including fractions, on behalf of the participants. The number of newly-issued common shares to be credited to each participant’s account will be determined by dividing the dollar amount of the dividend by the net asset value per common share on the payment date; provided that, if the net asset value per common share is less than 95% of the market price per common share on the payment date, the dollar amount of the dividend will be divided by 95% of the market price per common share on the payment date. If, on the payment date for any dividend, the net asset value per common share is greater
23
than the market value per common share plus per share fees, the Plan Agent will invest the dividend amount in common shares acquired on behalf of the participants in open-market purchases.
Participation in the Plan
If a registered owner of common shares elects not to participate in the Plan, you will receive all dividends in cash paid by check mailed directly to you (or, if the shares are held in street or other nominee name, then to such nominee) by the Plan Agent, as dividend disbursing agent. You may elect not to participate in the Plan and to receive all dividends in cash by sending written or telephonic instructions to the Plan Agent, as dividend paying agent. Participation in the Plan is completely voluntary and may be terminated or resumed at any time without penalty by contacting the Plan Agent before the dividend record date; otherwise such termination or resumption will be effective with respect to any subsequently declared dividend or other distribution. Some brokers may automatically elect to receive cash on your behalf and may reinvest that cash in additional common shares of the Fund for you.
Plan Fees
There will be no per share fees with respect to common shares issued directly by the Fund. However, each participant will pay a pro rata share of brokerage commissions incurred in connection with open-market purchases. There is no direct service charge to participants in the Plan; however, the Fund reserves the right to amend the Plan to include a service charge payable by the participants.
Tax Implications
The automatic reinvestment of dividends will not relieve participants of any federal, state or local income tax that may be payable (or required to be withheld) on such dividends. Accordingly, any taxable dividend received by a participant that is reinvested in additional common shares will be subject to federal (and possibly state and local) income tax even though such participant will not receive a corresponding amount of cash with which to pay such taxes.
Contact Information
For more information about the plan you may contact the Plan Agent in writing at PO Box 708, Milwaukee, WI 53201-0701, by calling the Plan Agent at 1-800-662-7232.
Privacy Policy
In order to conduct its business, the Fund collects and maintains certain nonpublic personal information about its stockholders of record with respect to their transactions in shares of the Fund’s securities. This information includes the stockholder’s address, tax identification or Social Security number, share balances, and dividend elections. We do not collect or maintain personal information about stockholders whose share balances of our securities are held in “street name” by a financial institution such as a bank or broker.
We do not disclose any nonpublic personal information about you, the Fund’s other stockholders or the Fund’s former stockholders to third parties unless necessary to process a transaction, service an account, or as otherwise permitted by law.
To protect your personal information internally, we restrict access to nonpublic personal information about the Fund’s stockholders to those employees who need to know that information to provide services to our stockholders. We also maintain certain other safeguards to protect your nonpublic personal information.
24
Other Information For Shareholders
Notice is hereby given in accordance with Section 23(c) of the Investment Company Act of 1940, as amended, that the Fund from time to time may purchase its common shares of beneficial interest in the open market.
This report is sent to shareholders of The Cushing® Renaissance Fund for their information. It is not a prospectus, circular or representation intended for use in the purchase or sale of shares of the Fund or of any securities mentioned in this report.
The Fund does not make available copies of its Statement of Additional Information because the Fund’s shares are not continuously offered, which means that the Statement of Additional Information has not been updated after completion of the Fund’s initial public offering and the information contained in such Statement of Additional Information may have become outdated.
The Fund makes available performance and certain other on its website at www.cushingcef.com. Investors and others are advised to periodically check the website for updated performance information and the release of other material information about the Fund. This reference to Fund’s website is intended to allow investors public access to information regarding the Fund and does not, and is not intended to, incorporate the Fund’s website in this report.
25
The Cushing® Renaissance Fund
Board Approval of Investment Management Agreement (Unaudited)
May 31, 2013
On May 23, 2013, the Board of Trustees of the Fund (members of which are referred to collectively as the “Trustees”) met in person to discuss, among other things, the approval of the Investment Management Agreement (the “Agreement”) between the Fund and Cushing MLP Asset Management, LP (the “Adviser”).
Activities and Composition of the Board
The Board of Trustees is comprised of four Trustees, three of whom are not “interested persons,” as such term is defined in the Investment Company Act of 1940, as amended (the “1940 Act”), of the Fund (the “Independent Trustees”). The Board of Trustees is responsible for the oversight of the operations of the Fund and performs the various duties imposed by the 1940 Act on the trustees of investment companies. The Independent Trustees have retained independent legal counsel to assist them in connection with their duties. Prior to its consideration of the Agreement, the Board of Trustees received and reviewed information provided by the Adviser, including, among other things, comparative information about the fees and expenses and performance of certain other closed-end funds. The Board of Trustees also received and reviewed information responsive to requests from independent counsel to assist it in its consideration of the Agreement. Before the Board of Trustees voted on the approval of the Agreement, the Independent Trustees met with independent legal counsel during executive session and discussed the Agreement and related information.
Consideration of Nature, Extent and Quality of the Services
The Board of Trustees received and considered information regarding the nature, extent and quality of services provided to the Fund under the Agreement. The Board of Trustees reviewed certain background materials supplied by the Adviser in its presentation, including the Adviser’s Form ADV.
The Board of Trustees reviewed and considered the Adviser’s investment advisory personnel, its history as an asset manager and its performance and the amount of assets currently under management by the Adviser. The Board of Trustees also reviewed the research and decision-making processes utilized by the Adviser, including the methods adopted to seek to achieve compliance with the investment objectives, polices and restrictions of the Fund.
The Board of Trustees considered the background and experience of the Adviser’s management in connection with the Fund, including reviewing the qualifications, backgrounds and responsibilities of the management team primarily responsible for the day-to-day portfolio management of the Fund and the extent of the resources devoted to research and analysis of the Fund’s actual and potential investments.
The Board of Trustees also reviewed, among other things, the Adviser’s insider trading policies and procedures and its Code of Ethics. The Board of Trustees, including all of the Independent Trustees, concluded that the nature, extent and quality of services to be rendered by the Adviser under the Agreement were adequate.
26
Consideration of Advisory Fees and the Cost of the Services
The Board of Trustees reviewed and considered the contractual annual advisory fee to be paid by the Fund to the Adviser in light of the extent, nature and quality of the advisory services to be provided by the Adviser to the Fund.
The Board of Trustees considered the information they received comparing the Fund’s contractual annual advisory fee and overall expenses with (a) a peer group of competitor closed-end funds designated by the Adviser that manage publicly traded portfolios investing primarily in MLPs, noting that there is no accurate peer group for the Fund given its unique investment program; (b) other products managed by the Adviser; and (c) fees traditionally charged for these types of investment vehicles when they are structured as private investment vehicles. Given the small universe of managers and funds fitting within the criteria for the peer group, the Adviser did not believe that it would be beneficial to engage the services of an independent third-party to prepare the peer group analysis, and the Independent Trustees concurred with this approach.
Based on such information, the Board of Trustees concluded that the investment advisory fee and total expense ratio for the Fund were each the lowest in the peer group.
Consideration of Investment Performance
The Board of Trustees regularly reviews the performance of the Fund throughout the year. The Board of Trustees reviewed performance information comparing the performance of the Fund, net of fees, against its peer group. The Board of Trustees noted that the Fund had been in operation for less than one year, and on a net asset value basis, had outperformed its main competitor and had slightly underperformed the S&P 500 during the analysis period. The Board of Trustees concluded that the Fund had a performance history that was less than one year.
Other Considerations
The Board of Trustees received and considered a historical, current and projected profitability analysis prepared by the Adviser based on the fees payable under the Agreement. The Board of Trustees considered the profits realized and anticipated to be realized by the Adviser in connection with the operation of the Fund and concluded that the profit, if any, anticipated to be realized by the Adviser in connection with the operation of the Fund is not unreasonable to the Fund.
The Board of Trustees considered whether economies of scale in the provision of services to the Fund had been or would be passed along to the shareholders under the Agreement. The Board of Trustees reviewed and considered any other incidental benefits derived or to be derived by the Adviser from its relationship with the Fund, including soft dollar arrangements or other so called “fall-out benefits.” The Board of Trustees concluded there were no material economics of scale or other incidental benefits accruing to the Adviser in connection with its relationship with the Fund.
27
Conclusion
In approving the Agreement and the fees charged under the Agreement, the Board of Trustees concluded that no single factor reviewed by the Board of Trustees was identified by the Board of Trustees to be determinative as the principal factor in whether to approve the Agreement. The summary set out above describes the most important factors, but not all of the matters, considered by the Board of Trustees in coming to its decision regarding the Agreement. On the basis of such information as the Board of Trustees considered necessary to the exercise of its reasonable business judgment and its evaluation of all of the factors described above, and after much discussion, the Board of Trustees concluded that each factor they considered, in the context of all of the other factors they considered, favored approval of the Agreement. It was noted that it was the judgment of the Board of Trustees that approval of the Agreement was in the best interests of the Fund and its shareholders, and a majority of the Trustees and, voting separately, a majority of the Independent Trustees, approved the Agreement.
28
The Cushing® Renaissance Fund
TRUSTEES
Brian R. Bruce
Ronald P. Trout
Edward N. McMillan
Jerry V. Swank
EXECUTIVE OFFICERS
Jerry V. Swank
Chief Executive Officer
Daniel L. Spears
President
John H. Alban
Chief Financial Officer and Treasurer
Barry Y. Greenberg
Chief Compliance Officer and Secretary
Judd B. Cryer
Vice President
INVESTMENT ADVISER
Cushing® MLP Asset Management, LP
8117 Preston Road, Suite 440
Dallas, TX 75225
ADMINISTRATOR
U.S. Bancorp Fund Services, LLC
615 East Michigan Street, 3rd Floor
Milwaukee, WI 53202
CUSTODIAN
U.S. Bank, N.A.
1555 N. River Center Drive, Suite 302
Milwaukee, WI 53212
TRANSFER AGENT
U.S. Bancorp Fund Services, LLC
615 East Michigan Street, 3rd Floor
Milwaukee, WI 53202
LEGAL COUNSEL
Skadden, Arps, Slate, Meagher & Flom LLP
Four Times Square
New York, NY 10036
INDEPENDENT REGISTERED PUBLIC ACCOUNTING FIRM
Ernst & Young LLP
2323 Victory Avenue, Suite 2000
Dallas, TX 75219
NOT FDIC INSURED | NOT BANK GUARANTEED | MAY LOSE VALUE
THE CUSHING® RENAISSANCE FUND
| | |
| | Investment Adviser Cushing® MLP Asset Management, LP 8117 Preston Road Suite 440 Dallas, TX 75225 (214) 692-6334 www.cushingcef.com www.swankcapital.com |
Item 2. Code of Ethics.
Not applicable for semi-annual reports.
Item 3. Audit Committee Financial Expert.
Not applicable for semi-annual reports.
Item 4. Principal Accountant Fees and Services.
Not applicable for semi-annual reports.
Item 5. Audit Committee of Listed Registrants.
Not applicable to registrants who are not listed issuers (as defined in Rule 10A-3 under the Securities Exchange Act of 1934).
Item 6. Investments.
| (a) | Schedule of Investments is included as part of the report to shareholders filed under Item 1 of this Form. |
Item 7. Disclosure of Proxy Voting Policies and Procedures for Closed-End Management Investment Companies.
Not applicable for semi-annual reports.
Item 8. Portfolio Managers of Closed-End Management Investment Companies.
Not applicable for semi-annual reports.
Item 9. Purchases of Equity Securities by Closed-End Management Investment Company and Affiliated Purchasers.
| | | | | | | | | | | | | | | | |
Period | | (a)
Total Number
of Shares (or
Units)
Purchased | | | (b)
Average Price Paid
per Share (or Unit) | | | (c)
Total Number of
Shares (or Units)
Purchased as Part
of Publicly
Announced Plans
or Programs | | | (d)
Maximum Number
(or Approximate
Dollar Value) of
Shares (or Units)
that May Yet Be
Purchased Under
the Plans or
Programs | |
Month #1 12/01/2012-12/31/2012 | | | 0 | | | | 0 | | | | 0 | | | | 0 | |
Month #2 01/01/2013-01/31/2013 | | | 0 | | | | 0 | | | | 0 | | | | 0 | |
Month #3 02/01/2013-02/28/2013 | | | 0 | | | | 0 | | | | 0 | | | | 0 | |
Month #4 03/01/2013-03/31/2013 | | | 0 | | | | 0 | | | | 0 | | | | 0 | |
Month #5 04/01/2013-04/30/2013 | | | 0 | | | | 0 | | | | 0 | | | | 0 | |
Month #6 05/01/2013-05/31/2013 | | | 0 | | | | 0 | | | | 0 | | | | 0 | |
| | | | | | | | | | | | | | | | |
Total | | | 0 | | | | 0 | | | | 0 | | | | 0 | |
| | | | | | | | | | | | | | | | |
| * | Footnote the date each plan or program was announced, the dollar amount (or share or unit amount) approved, the expiration date (if any) of each plan or program, each plan or program that expired during the covered period, each plan or program registrant plans to terminate or let expire. |
Item 10. Submission of Matters to a Vote of Security Holders.
Not Applicable.
Item 11. Controls and Procedures.
| (a) | The Registrant’s President and Treasurer/Chief Financial Officer have reviewed the Registrant’s disclosure controls and procedures (as defined in Rule 30a-3(c) under the Investment Company Act of 1940 (the “Act”)) as of a date within 90 days of the filing of this report, as required by Rule 30a-3(b) under the Act and Rules 13a-15(b) or 15d-15(b) under the Securities Exchange Act of 1934. Based on their review, such officers have concluded that the disclosure controls and procedures are effective in ensuring that information required to be disclosed in this report is appropriately recorded, processed, summarized and reported and made known to them by others within the Registrant and by the Registrant’s service provider. |
| (b) | There were no changes in the Registrant’s internal control over financial reporting (as defined in Rule 30a-3(d) under the Act) that occurred during the second fiscal quarter of the period covered by this report that has materially affected, or is reasonably likely to materially affect, the Registrant’s internal control over financial reporting. |
Item 12. Exhibits.
| (a) | (1) Any code of ethics or amendment thereto, that is the subject of the disclosure required by Item 2, to the extent that the registrant intends to satisfy Item 2 requirements through filing an exhibit. Not Applicable. |
(2) A separate certification for each principal executive and principal financial officer pursuant to Section 302 of the Sarbanes-Oxley Act of 2002. Filed herewith.
(3) Any written solicitation to purchase securities under Rule 23c-1 under the Act sent or given during the period covered by the report by or on behalf of the registrant to 10 or more persons. Not applicable.
| (b) | Certifications pursuant to Section 906 of the Sarbanes-Oxley Act of 2002. Furnished herewith. |
SIGNATURES
Pursuant to the requirements of the Securities Exchange Act of 1934 and the Investment Company Act of 1940, the registrant has duly caused this report to be signed on its behalf by the undersigned, thereunto duly authorized.
| | | | |
| | | (Registrant) | | The Cushing Renaissance Fund |
| | |
| | By (Signature and Title) | | /s/ Daniel L. Spears |
| | | | Daniel L. Spears, President |
| |
| | Date August 6, 2013 |
Pursuant to the requirements of the Securities Exchange Act of 1934 and the Investment Company Act of 1940, this report has been signed below by the following persons on behalf of the registrant and in the capacities and on the dates indicated.
| | | | |
| | | By (Signature and Title) | | /s/ Daniel L. Spears |
| | | | Daniel L. Spears, President |
| |
| | Date August 6, 2013 |
| | |
| | By (Signature and Title) | | /s/ John H. Alban |
| | | | John H. Alban, Treasurer & Chief Financial Officer |
| |
| | Date August 6, 2013 |