As filed with the Securities and Exchange Commission on February 7, 2014
UNITED STATES
SECURITIES AND EXCHANGE COMMISSION
Washington, D.C. 20549
FORM N-CSR
CERTIFIED SHAREHOLDER REPORT OF REGISTERED
MANAGEMENT INVESTMENT COMPANIES
Investment Company Act file number: 811-22499
The Cushing Renaissance Fund
(Exact name of registrant as specified in charter)
8117 Preston Road, Suite 440, Dallas, TX 75225
(Address of principal executive offices) (Zip code)
Jerry V. Swank
8117 Preston Road, Suite 440, Dallas, TX 75225
(Name and address of agent for service)
214-692-6334
Registrant’s telephone number, including area code
Date of fiscal year end: November 30
Date of reporting period: November 30, 2013
Item 1. Reports to Stockholders.
1

Annual Report
November 30, 2013
THE CUSHING® RENAISSANCE FUND

| | |

| | Investment Adviser Cushing® MLP Asset Management, LP 8117 Preston Road Suite 440 Dallas, TX 75225 (214) 692-6334 (888) 777-2346 www.cushingcef.com www.swankcapital.com |
Table of Contents
The Cushing® Renaissance Fund
Shareholder Letter
Dear Fellow Shareholders,
The Cushing® Renaissance Fund (the “Fund”) generated positive returns for shareholders in the fiscal year ended November 30, 2013. The Fund’s shares traded at an 11.5% discount to net asset value (NAV) as of the end of the period.
Equity markets in general had a strong year, as illustrated by the S&P 500 Index’s approximate 30% return in the Fund’s fiscal year ended November 30, 2013. The market seems to be taking in stride the Fed’s announced intention to “taper” its asset purchase programs; the concern is that this may translate to higher interest rates, which is potentially harmful for stock prices. However, the counterbalance to higher interest rates is the fact that the macroeconomic backdrop has continued to improve, albeit slowly, as evidenced by rising leading indicators, expectations for 5-10% earnings growth through 2015 (based on Bloomberg S&P 500 earnings estimates), and a shrinking unemployment rate.
Indicators for the sectors we monitor were more consistent at year end than they were at mid-year, and generally higher, with oil up slightly versus at our mid-year update but about 12% off its summer peak; natural gas was higher at the end of the period thanks to the onset of winter; natural gas liquids (NGLs) tracked higher with natural gas; refining margins staged a fourth quarter comeback; and petrochemical margins were higher despite the recent strength in gas-based feedstock cost as ethylene and propylene prices kept pace.
Although not a predictor of future performance, the Fund’s last four quarterly distributions have remained stable at $0.41 per share, or a 6.8% annual yield based on the November 30th closing price.
Fund Performance
For the fiscal year ended November 30, 2013, the Fund delivered a Net Asset Value Total Return (equal to the change in net asset value per share plus the reinvested cash distribution paid during the period) of 15.6%, versus a total return of 30.3% for the S&P 500 Index (Total Return).
The Fund’s Share Price Total Return (equal to the change in net share price per share plus the reinvested cash distribution paid during the period) was 10.47%, for the fiscal year ended November 30, 2013 and differs from the Net Asset Value Total Return due to fluctuations in the discount of share price to NAV.
The largest individual contributors to the Fund’s performance for the period were LyondellBasell Industries NV (NYSE: LYB), Cheniere Energy Partners LP (AMEX: CQP), and Delek Logistics Partners LP (NYSE: DKL). LYB benefited from favorable ethane cracking margins and a 50% dividend increase during the year. CQP and DKL benefited from a strong year for the MLP asset class while CQP additionally benefited from positive October 2013 disclosure of guidance for 2014 and 2015. The largest detractors from the Fund’s performance were Rentech Nitrogen Partners LP (NYSE: RNF), Marathon Petroleum Corp (NYSE: MPC) call options, and Linn Energy LLC (NASDAQ: LINE). RNF fell as natural gas, a big feedstock cost, rallied over $1 per million British Thermal Units early in the year. Our loss on MPC options arose from the Fund’s strategy of periodic covered call writing: we sold call options on MPC common stock, the stock then rose and we offset our option position; then, the loss on the call option was offset by the rise in the price for MPC common shares. Lastly, LINE units fell as a result of investor concern regarding an inquiry by the U.S. Securities and Exchange Commission into some of its accounting policies as well as concern over the company’s ability to close on its planned acquisition of Berry Petroleum.
Outlook
We believe the domestic energy, industrial and manufacturing Renaissance has manifested itself first through margin or volume growth driven by natural gas-based feedstock cost for U.S. petrochemical companies that is a fraction of their global competitors whose feedstock is priced off crude oil or the
1
increase in crude-by-rail volumes benefiting railroads who move oil from newer basins. In fact, we believe the margin benefits for some of these subsectors began as early as 2011. However, as we look at the natural progression of the Renaissance theme, we believe a large, long-term opportunity still exists as new found profitability is just beginning to drive capital expenditures to expand production capacity, logistics/transportation capabilities, and export capabilities. Finally, we believe economic recovery, especially in Europe and emerging markets, can augment growth through gross domestic product (GDP)-linked volume expansion; to date, the Renaissance theme has taken hold despite a tepid economic recovery and elevated unemployment. We believe the end result for the companies benefiting from this opportunity can be higher multiples driven fundamentally by bigger margins, cleaner balance sheets, higher dividends or share buybacks, and strong-for-longer profitability.
Some of the investment themes we see going into 2014 are:
| | • | | Massive project backlog growth in the engineering & construction space driven by gas monetization in the form of new petrochemical and liquefied natural gas (LNG) investment |
| | • | | Rising refining volatility/seasonality could benefit companies with large logistics opportunities |
| | • | | Railroad and truck companies may continue to see growth from non-traditional products, including crude oil, chemicals, and frac sand |
| | • | | Shift from “resource identification” to “resource development” in energy production favors scale and proven operators |
We believe the equity markets may ultimately move higher in 2014, though this may be a second-half event as uncertainty around Fed tapering may inject more volatility into markets in the first half. We also believe the domestic unemployment rate could continue its slow march lower and global GDP growth may accelerate with recovery in Europe and emerging markets.
The U.S, energy, industrial, and manufacturing Renaissance is a secular growth opportunity, the benefits of which, we believe, are just starting to be felt. We believe the Fund’s exposure to this growth, along with the opportunity to receive current income, can offer attractive benefits for both growth- and income-focused investors.
In closing, we at Swank Capital, LLC and Cushing® MLP Asset Management truly appreciate your support and we look forward to helping you achieve your investment goals during the Fund’s next fiscal year.
Sincerely,
| | |
 | |  |
| |
| Jerry V. Swank | | Daniel L. Spears |
| Chairman and Chief Executive Officer | | President |
The information in this report is not a complete analysis of every aspect of any market, sector, industry, security or the Fund itself. Statements of fact are from sources considered reliable, but the Fund makes no representation or warranty as to their completeness or accuracy. Discussions of specific investments are for illustration only and are not intended as recommendations of individual investments. Please refer to the Schedule of Investments for a complete list of Fund holdings.
Past performance does not guarantee future results. Investment return, net asset value and common share market price will fluctuate so that you may have a gain or loss when you sell shares. Since the Fund is a closed-end management investment company, shares of the Fund may trade at a discount or premium from net asset value. This characteristic is separate and distinct from the risk that net asset value could decrease as a result of investment activities and may be a greater risk to investors expecting to sell their shares after a short time. The Fund cannot predict whether shares will trade at, above or below net asset value. The Fund should not be viewed as a vehicle for trading purposes. It is designed primarily for risk-tolerant long-term investors.
The S&P 500 Index is an unmanaged index of common stocks that is frequently used as a general measure of stock market performance. The index does not include fees or expenses. It is not possible to invest directly in an index
2
The Cushing® Renaissance Fund
Allocation of Portfolio Assets (Unaudited)
November 30, 2013
(Expressed as a Percentage of Total Investments)
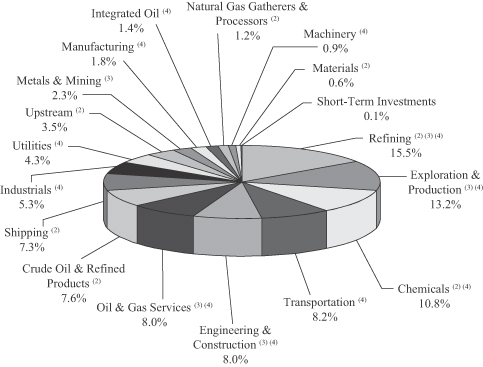
| (1) | Fund holdings and sector allocations are subject to change and there is no assurance that the Fund will continue to hold any particular security. |
| (2) | Master Limited Partnerships and Related Companies |
3
The Cushing® Renaissance Fund
Key Financial Data (Supplemental Unaudited Information)
The Information presented below regarding Distributable Cash Flow is supplemental non-GAAP financial information, which we believe is meaningful to understanding our operating performance. Supplemental non-GAAP measures should be read in conjunction with our full financial statements.
| | | | | | | | |
| | | Fiscal Year Ended
11/30/13 | | | Period from
September 25, 2012
through
November 30,
2012 | |
FINANCIAL DATA | | | | | | | | |
Total income from investments | | | | | | | | |
Distributions received from MLPs | | $ | 3,543,855 | | | $ | 444,806 | |
Dividends from common stock, net of foreign taxes withheld | | | 2,108,438 | | | | 407,243 | |
Interest income | | | 2,611,738 | | | | 98,905 | |
| | | | | | | | |
Total income from investments | | $ | 8,264,031 | | | $ | 950,954 | |
Advisory fee and operating expenses | | | | | | | | |
Advisory fees, less expenses waived by Adviser | | $ | 1,951,299 | | | $ | 242,764 | |
Operating expenses(a) | | | 533,110 | | | | 236,794 | |
Leverage costs | | | 251,755 | | | | 0 | |
Other | | | 4,944 | | | | 250 | |
| | | | | | | | |
Total advisory fees and operating expenses | | $ | 2,741,108 | | | $ | 479,808 | |
Distributable Cash Flow (DCF)(b) | | $ | 5,522,923 | | | $ | 471,146 | |
Distributions paid on common stock | | $ | 8,960,199 | | | $ | 0 | |
Distributions paid on common stock per share | | $ | 1.48 | | | $ | 0.00 | |
Distribution Coverage Ratio | | | | | | | | |
Before advisory fee and operating expenses | | | 0.9 x | | | | 0.0 x | |
After advisory fee and operating expenses | | | 0.6 x | | | | 0.0 x | |
OTHER FUND DATA (end of period) | | | | | | | | |
Total Assets, end of period | | | 191,388,953 | | | | 149,337,184 | |
Unrealized appreciation (depreciation) | | | 23,272,117 | | | | (255,691 | ) |
Short-term borrowings | | | 24,659,062 | | | | 0 | |
Short-term borrowings as a percent of total assets | | | 13 | % | | | 0 | % |
Net Assets, end of period | | | 166,240,231 | | | | 143,850,293 | |
Net Asset Value per common share | | $ | 27.46 | | | $ | 23.76 | |
Market Value per share | | $ | 24.30 | | | $ | 23.41 | |
Market Capitalization | | $ | 147,116,768 | | | $ | 141,728,541 | |
Shares Outstanding | | | 6,054,188 | | | | 6,054,188 | |
| (a) | Excludes expenses related to capital raising |
| (b) | “Net Investment Income” on the Statement of Operations is adjusted as follows to reconcile to Distributable Cash Flow: increased by the return of capital on MLP distributions and offering expenses. |
4
The Cushing® Renaissance Fund
Schedule of Investments | November 30, 2013 |
| | | | | | | | |
| COMMON STOCK — 59.9%(1) | | Shares | | | Fair Value | |
Chemicals — 10.5%(1) | | | | | | | | |
Netherlands — 4.3%(1) | | | | | | | | |
LyondellBasell Industries NV(2) | | | 92,538 | | | $ | 7,142,083 | |
United States — 6.2%(1) | | | | | | | | |
Axiall Corp | | | 35,000 | | | | 1,585,500 | |
The Dow Chemical Company(2) | | | 75,000 | | | | 2,929,500 | |
E.I. du Pont de Nemours and Company(2) | | | 40,000 | | | | 2,455,200 | |
Westlake Chemical Corp. | | | 30,000 | | | | 3,377,400 | |
| | | | | | | | |
| | | | | | | 17,489,683 | |
| | | | | | | | |
Engineering & Construction — 6.1%(1) | | | | | | | | |
Netherlands — 2.3%(1) | | | | | | | | |
Chicago Bridge & Iron Co.(2) | | | 49,000 | | | | 3,757,320 | |
United States — 3.8%(1) | | | | | | | | |
Chart Industries Inc.(3) | | | 18,000 | | | | 1,751,400 | |
Jacobs Energy Group Inc.(3) | | | 25,000 | | | | 1,494,250 | |
KBR, Inc. | | | 43,000 | | | | 1,454,690 | |
Quanta Services, Inc.(3) | | | 55,000 | | | | 1,628,550 | |
| | | | | | | | |
| | | | | | | 10,086,210 | |
| | | | | | | | |
Exploration & Production — 2.9%(1) | | | | | | | | |
United States — 2.9%(1) | | | | | | | | |
Cabot Oil & Gas Corporation | | | 35,000 | | | | 1,205,750 | |
EOG Resources, Inc. | | | 4,700 | | | | 775,500 | |
Occidental Petroleum Corporation | | | 20,000 | | | | 1,899,200 | |
Rosetta Resources Inc.(3) | | | 20,000 | | | | 1,011,400 | |
| | | | | | | | |
| | | | | | | 4,891,850 | |
| | | | | | | | |
Industrials — 6.1%(1) | | | | | | | | |
United States — 6.1%(1) | | | | | | | | |
Flowserve Corporation | | | 15,000 | | | | 1,070,700 | |
Fluor Corporation | | | 35,100 | | | | 2,731,131 | |
MRC Global Inc.(3) | | | 65,000 | | | | 1,988,350 | |
Trinity Industrials, Inc. | | | 30,000 | | | | 1,557,300 | |
United Rentals, Inc.(3) | | | 40,000 | | | | 2,749,200 | |
| | | | | | | | |
| | | | | | | 10,096,681 | |
| | | | | | | | |
Integrated Oil — 1.6%(1) | | | | | | | | |
Netherlands — 1.6%(1) | | | | | | | | |
Royal Dutch Shell PLC | | | 39,500 | | | | 2,634,650 | |
| | | | | | | | |
| | | | | | | | |
| | | | | | | | |
Machinery — 1.1%(1) | | | | | | | | |
United States — 1.1%(1) | | | | | | | | |
ITT Corporation | | | 10,000 | | | | 408,200 | |
Wabtec Corporation | | | 20,000 | | | | 1,380,000 | |
| | | | | | | | |
| | | | | | | 1,788,200 | |
| | | | | | | | |
Manufacturing — 2.1%(1) | | | | | | | | |
United States — 2.1%(1) | | | | | | | | |
Dresser-Rand Group Inc.(3) | | | 25,000 | | | | 1,411,000 | |
FMC Technologies Inc.(3) | | | 10,000 | | | | 481,000 | |
GreenBrier Companies Inc.(3) | | | 50,000 | | | | 1,562,500 | |
| | | | | | | | |
| | | | | | | 3,454,500 | |
| | | | | | | | |
Oil and Gas Services — 5.2%(1) | | | | | | | | |
Bermuda — 1.8%(1) | | | | | | | | |
Seadrill Limited | | | 70,000 | | | | 2,989,700 | |
Marshall Islands — 1.1%(1) | | | | | | | | |
Seadrill Partners LLC | | | 59,800 | | | | 1,888,484 | |
See Accompanying Notes to the Financial Statements.
5
The Cushing® Renaissance Fund
Schedule of Investments | November 30, 2013 — (Continued) |
| | | | | | | | |
| COMMON STOCK — (Continued) | | Shares | | | Fair Value | |
Oil and Gas Services — (Continued) | | | | | | | | |
Netherlands — 0.1%(1) | | | | | | | | |
Franks Intl(3) | | | 5,000 | | | $ | 119,650 | |
United States — 2.2%(1) | | | | | | | | |
Cameron International Corporation(3) | | | 30,000 | | | | 1,661,700 | |
Hornbeck Offshore SVCS Inc.(3) | | | 40,000 | | | | 2,025,200 | |
| | | | | | | | |
| | | | | | | 8,684,734 | |
| | | | | | | | |
Refining — 9.9%(1) | | | | | | | | |
United States — 9.9%(1) | | | | | | | | |
HollyFrontier Corporation(2) | | | 38,000 | | | | 1,823,240 | |
Marathon Petroleum Corporation(2) | | | 48,100 | | | | 3,979,794 | |
Phillips 66(2) | | | 71,500 | | | | 4,977,115 | |
Tesoro Corporation | | | 50,000 | | | | 2,931,500 | |
Western Refining Inc. | | | 70,000 | | | | 2,734,900 | |
| | | | | | | | |
| | | | | | | 16,446,549 | |
| | | | | | | | |
Transportation — 9.4%(1) | | | | | | | | |
Bermuda — 1.1%(1) | | | | | | | | |
Golar LNG Ltd. | | | 50,000 | | | | 1,816,500 | |
Canada — 0.6%(1) | | | | | | | | |
Canadian Pacific Royalty Limited | | | 7,200 | | | | 1,107,936 | |
Marshall Islands — 2.5%(1) | | | | | | | | |
Ardmore Shipping Corporation(3) | | | 170,854 | | | | 2,185,223 | |
Navigator Holdings Limited(3) | | | 91,000 | | | | 1,924,650 | |
United States — 5.2%(1) | | | | | | | | |
Genesee & Wyoming Inc.(3) | | | 19,500 | | | | 1,875,900 | |
Kansas City Southern | | | 16,000 | | | | 1,936,320 | |
Kirby Corp.(3) | | | 34,000 | | | | 3,211,300 | |
Quality Distribution Inc.(3) | | | 20,000 | | | | 244,600 | |
Swift Trasportation Co.(3) | | | 60,000 | | | | 1,389,000 | |
| | | | | | | | |
| | | | | | | 15,691,429 | |
| | | | | | | | |
Utilities — 5.0%(1) | | | | | | | | |
United States — 5.0%(1) | | | | | | | | |
Duke Energy Corporation | | | 22,000 | | | | 1,539,120 | |
PG&E Corp. | | | 30,000 | | | | 1,211,100 | |
PPL Corp.(2) | | | 100,000 | | | | 3,071,000 | |
The Southern Company | | | 60,500 | | | | 2,458,115 | |
| | | | | | | | |
| | | | | | | 8,279,335 | |
| | | | | | | | |
Total Common Stock (Cost $83,443,672) | | | | | | $ | 99,543,821 | |
| | | | | | | | |
MASTER LIMITED PARTNERSHIPS AND
RELATED COMPANIES — 30.5%(1) | | | | | | |
Chemicals — 1.8%(1) | | | | | | | | |
United States — 1.8%(1) | | | | | | | | |
Petrologistics, L.P. | | | 250,000 | | | $ | 3,017,500 | |
| | | | | | | | |
| | | | | | | | |
| | | | | | | | |
Crude Oil/ Refined Products Pipelines and Storage — 8.7%(1) | | | | | | | | |
United States — 8.7%(1) | | | | | | | | |
Cheniere Energy Partners, L.P.(2) | | | 230,000 | | | | 6,835,600 | |
Phillips 66 Partners, L.P.(2)(3) | | | 124,870 | | | | 4,113,218 | |
Tesoro Logistics Partners, L.P.(2) | | | 30,100 | | | | 1,542,625 | |
World Point Terminals, L.P. | | | 101,000 | | | | 1,955,360 | |
| | | | | | | | |
| | | | | | | 14,446,803 | |
| | | | | | | | |
Materials — 0.7%(1) | | | | | | | | |
United States — 0.7%(1) | | | | | | | | |
OCI Partners, L.P.(3) | | | 45,000 | | | | 1,116,900 | |
| | | | | | | | |
See Accompanying Notes to the Financial Statements.
6
The Cushing® Renaissance Fund
Schedule of Investments | November 30, 2013 — (Continued) |
| | | | | | | | |
MASTER LIMITED PARTNERSHIPS AND
RELATED COMPANIES — (Continued) | | Shares | | | Fair Value | |
Natural Gas Gatherers & Processors — 1.4%(1) | | | | | | | | |
United States — 1.4%(1) | | | | | | | | |
QEP Midstream Partners, L.P.(3) | | | 103,700 | | | $ | 2,347,768 | |
| | | | | | | | |
| | | | | | | | |
| | | | | | | | |
Refining — 5.6%(1) | | | | | | | | |
United States — 5.6%(1) | | | | | | | | |
Calumet Specialty Products Partners, L.P.(2) | | | 135,100 | | | | 3,862,509 | |
Delek Logistics Partners, L.P.(2) | | | 179,000 | | | | 5,402,220 | |
| | | | | | | | |
| | | | | | | 9,264,729 | |
| | | | | | | | |
Shipping — 8.3%(1) | | | | | | | | |
Marshall Islands — 8.3%(1) | | | | | | | | |
Capital Product Partners, L.P.(2) | | | 426,000 | | | | 3,816,960 | |
Knot Offshore Partners, L.P. | | | 85,970 | | | | 2,411,458 | |
Navios Maritime Partners, L.P. | | | 150,000 | | | | 2,521,500 | |
Teekay LNG Partners, L.P. | | | 60,000 | | | | 2,466,000 | |
Teekay Offshore Partners, L.P.(2) | | | 80,000 | | | | 2,625,600 | |
| | | | | | | | |
| | | | | | | 13,841,518 | |
| | | | | | | | |
Upstream — 4.0%(1) | | | | | | | | |
United States — 4.0%(1) | | | | | | | | |
Legacy Reserves, L.P. | | | 93,000 | | | | 2,510,070 | |
Memorial Production Partners, L.P. | | | 50,000 | | | | 997,500 | |
QR Energy, L.P. | | | 195,000 | | | | 3,196,050 | |
| | | | | | | | |
| | | | | | | 6,703,620 | |
| | | | | | | | |
Total Master Limited Partnerships and Related Companies (Cost $43,719,122) | | | | | | $ | 50,738,838 | |
| | | | | | | | |
| SENIOR NOTES — 24.1%(1) | | Principal
Amount | | | | |
Engineering & Construction — 3.1%(1) | | | | | | | | |
United States — 3.1%(1) | | | | | | | | |
Zachry Holdings Inc., 7.500%, due 02/01/2020(2)(4) | | $ | 5,000,000 | | | $ | 5,237,500 | |
| | | | | | | | |
| | | | | | | | |
| | | | | | | | |
Exploration and Production — 12.2%(1) | | | | | | | | |
United States — 12.2%(1) | | | | | | | | |
Barrett Bill Corp., 7.000%, due 10/15/2022 | | | 4,750,000 | | | | 4,880,625 | |
Comstock Res Inc., 7.750%, due 04/01/2019 | | | 5,000,000 | | | | 5,275,000 | |
Denbury Res Inc., 4.625%, due 07/15/2023 | | | 4,000,000 | | | | 3,630,000 | |
Penn Va Corp., 8.500%, due 05/01/2020 | | | 5,000,000 | | | | 5,406,250 | |
Resolute Energy Corp., 8.500%, due 05/01/2020 | | | 1,000,000 | | | | 1,055,000 | |
| | | | | | | | |
| | | | | | | 20,246,875 | |
| | | | | | | | |
Metals & Mining — 2.6%(1) | | | | | | | | |
United States — 2.6%(1) | | | | | | | | |
Cliffs Natural Resources Inc., 6.250%, due 10/01/2040 | | | 5,000,000 | | | | 4,381,555 | |
| | | | | | | | |
| | | | | | | | |
| | | | | | | | |
Oil & Gas Services — 3.9%(1) | | | | | | | | |
United States — 3.9%(1) | | | | | | | | |
Key Energy SVCS Inc., 6.750%, due 03/01/2021 | | | 4,000,000 | | | | 4,110,000 | |
Northern Oil & Gas Inc., 8.000%, due 06/01/2020 | | | 2,250,000 | | | | 2,368,125 | |
| | | | | | | | |
| | | | | | | 6,478,125 | |
| | | | | | | | |
Refining — 2.3%(1) | | | | | | | | |
United States — 2.3%(1) | | | | | | | | |
Western Refining Inc., 6.250%, due 04/01/2021 | | | 3,750,000 | | | | 3,768,750 | |
| | | | | | | | |
Total Senior Notes (Cost $39,960,553) | | | | | | $ | 40,112,805 | |
| | | | | | | | |
See Accompanying Notes to the Financial Statements.
7
The Cushing® Renaissance Fund
Schedule of Investments | November 30, 2013 — (Continued) |
| | | | | | | | |
SHORT-TERM INVESTMENTS —
INVESTMENT COMPANIES — 0.1%(1) | | Shares | | | Fair Value | |
United States — 0.1%(1) | | | | | | | | |
AIM Short-Term Treasury Portfolio Fund — Institutional Class, 0.02%(5) | | | 32,325 | | | $ | 32,325 | |
Fidelity Government Portfolio Fund — Institutional Class, 0.01%(5) | | | 32,325 | | | | 32,325 | |
Fidelity Money Market Protfolio — Institutional Class, 0.05%(5) | | | 32,325 | | | | 32,325 | |
First American Government Obligations Fund — Class Z, 0.01%(5) | | | 32,325 | | | | 32,325 | |
Invesco STIC Prime Portfolio, 0.06%(5) | | | 32,325 | | | | 32,325 | |
| | | | | | | | |
Total Short-Term Investments (Cost $161,625) | | | | | | $ | 161,625 | |
| | | | | | | | |
TOTAL INVESTMENTS — 114.6%(1) (Cost $167,284,972) | | | | | | $ | 190,557,089 | |
Liabilities in Excess of Other Assets — (14.6)%(1) | | | | | | | (24,316,858 | ) |
| | | | | | | | |
NET ASSETS APPLICABLE TO COMMON STOCKHOLDERS — 100.0%(1) | | | | | | $ | 166,240,231 | |
| | | | | | | | |
| (1) | Calculated as a percentage of net assets applicable to common stockholders. |
| (2) | All or a portion of these securities are held as collateral pursuant to the loan agreements. |
| (3) | No distribution or dividend was made during the fiscal year ended November 30, 2013. As such, it is classified as a non-income producing security as of November 30, 2013. |
| (4) | Restricted security under Rule 144A under the Securities Act of 1933, as amended. |
| (5) | Rate reported is the current yield as of November 30, 2013. |
See Accompanying Notes to the Financial Statements.
8
The Cushing® Renaissance Fund
Statement of Assets & Liabilities
November 30, 2013
| | | | |
Assets | | | | |
Investments, at fair value (cost $167,284,972) | | $ | 190,557,089 | |
Dividends receivable | | | 238,182 | |
Interest receivable | | | 593,141 | |
Prepaid expenses | | | 541 | |
| | | | |
Total assets | | | 191,388,953 | |
| | | | |
Liabilities | | | | |
Payable to Adviser, net of waiver | | | 215,738 | |
Short-term borrowings | | | 24,659,062 | |
Payable to Trustees | | | 9,000 | |
Accrued expenses and other liabilities | | | 264,922 | |
| | | | |
Total liabilities | | | 25,148,722 | |
| | | | |
Net assets applicable to common stockholders | | $ | 166,240,231 | |
| | | | |
Net Assets Applicable to Common Stockholders Consisting of Capital stock, $0.001 par value; 6,054,188 shares issued and outstanding (unlimited shares authorized) | | $ | 6,054 | |
Additional paid-in capital | | | 144,234,784 | |
Accumulated net investment loss | | | (2,220,854 | ) |
Accumulated realized gain | | | 948,130 | |
Net unrealized appreciation on investments | | | 23,272,117 | |
| | | | |
Net assets applicable to common stockholders | | $ | 166,240,231 | |
| | | | |
Net Asset Value per common share outstanding (net assets applicable to common shares divided by common shares outstanding) | | $ | 27.46 | |
| | | | |
See Accompanying Notes to the Financial Statements.
9
The Cushing® Renaissance Fund
Statement of Operations
Fiscal Year Ended November 30, 2013
| | | | |
Investment Income | | | | |
Distributions received from master limited partnerships | | $ | 3,543,855 | |
Less: return of capital on distributions | | | (3,383,041 | ) |
| | | | |
Distribution income from master limited partnerships | | | 160,814 | |
Dividends from common stock, net of taxes withheld of $100,224 | | | 2,108,438 | |
Interest income | | | 2,611,738 | |
| | | | |
Total Investment Income | | | 4,880,990 | |
| | | | |
Expenses | | | | |
Advisory fees | | | 2,322,669 | |
Administrator fees | | | 165,720 | |
Stock loan fees | | | 91,116 | |
Professional fees | | | 81,537 | |
Trustees’ fees | | | 60,078 | |
Insurance expense | | | 52,685 | |
Reports to stockholders | | | 30,840 | |
Registration fees | | | 21,150 | |
Transfer agent fees | | | 19,948 | |
Custodian fees and expenses | | | 10,036 | |
Other expenses | | | 4,944 | |
| | | | |
Total Expenses before Interest and Dividend Expense | | | 2,860,723 | |
| | | | |
Interest expense | | | 251,755 | |
| | | | |
Total Expenses | | | 3,112,478 | |
Less: expense waived by Adviser | | | (371,370 | ) |
| | | | |
Net Expenses | | | 2,741,108 | |
| | | | |
Net Investment Income | | | 2,139,882 | |
| | | | |
Realized and Unrealized Gain (Loss) on Investments | | | | |
Net realized gain on investments | | | 5,280,725 | |
Net realized gain on written options | | | 401,722 | |
| | | | |
Net realized gain on investments | | | 5,682,447 | |
Net change in unrealized appreciation of investments | | | 23,527,808 | |
| | | | |
Net Realized and Unrealized Gain on Investments | | | 29,210,255 | |
| | | | |
Increase in Net Assets Applicable to Common Stockholders Resulting from Operations | | $ | 31,350,137 | |
| | | | |
See Accompanying Notes to the Financial Statements.
10
The Cushing® Renaissance Fund
Statements of Changes in Net Assets
| | | | | | | | |
| | | Fiscal
Year Ended
November 30, 2013 | | | Period From
September 25, 2012(1)
through
November 30, 2012 | |
Operations | | | | | | | | |
Net investment income | | $ | 2,139,882 | | | $ | 48,580 | |
Net realized gain (loss) on investments | | | 5,682,447 | | | | (183,846 | ) |
Net change in unrealized appreciation (depreciation) of investments | | | 23,527,808 | | | | (255,691 | ) |
| | | | | | | | |
Net increase (decrease) in net assets applicable to common stockholders resulting from operations | | | 31,350,137 | | | | (390,957 | ) |
| | | | | | | | |
Dividends and Distributions to Common Stockholders | | | | | | | | |
Net investment income | | | (2,133,267 | ) | | | — | |
Net realized gain | | | (6,826,932 | ) | | | — | |
Return of capital | | | — | | | | — | |
| | | | | | | | |
Total dividends and distributions to common stockholders | | | (8,960,199 | ) | | | — | |
| | | | | | | | |
Capital Share Transactions | | | | | | | | |
Proceeds from initial public offering of 0 and 6,050,000 common shares, respectively | | | — | | | | 151,250,000 | |
Underwriting discounts and offering expenses associated with the issuance of common shares | | | — | | | | (7,108,750 | ) |
| | | | | | | | |
Net increase in net assets applicable to common stockholders from capital share transactions | | | — | | | | 144,141,250 | |
| | | | | | | | |
Total increase in net assets applicable to common stockholders | | | 22,389,938 | | | | 143,750,293 | |
Net Assets | | | | | | | | |
Beginning of fiscal period | | | 143,850,293 | | | | 100,000 | |
| | | | | | | | |
End of fiscal period | | $ | 166,240,231 | | | $ | 143,850,293 | |
| | | | | | | | |
Accumulated net investment income (loss) at the end of the fiscal period | | $ | (2,220,854 | ) | | $ | 44,015 | |
| | | | | | | | |
| (1) | Commencement of operations. |
See Accompanying Notes to the Financial Statements.
11
The Cushing® Renaissance Fund
Statement of Cash Flows
November 30, 2013
| | | | |
| | | Fiscal
Year Ended
November 30, 2013 | |
OPERATING ACTIVITIES | | | | |
Increase in Net Assets Applicable to Common Stockholders Resulting from Operations | | $ | 31,350,137 | |
Adjustments to reconcile decrease in the net assets applicable to common stockholders to net cash used in operating activities | | | | |
Net change in unrealized appreciation of investments | | | (23,527,808 | ) |
Purchases of investments | | | (233,243,973 | ) |
Proceeds from sales of investments | | | 149,009,031 | |
Proceeds from investments sold short | | | 24,047,511 | |
Purchases to cover investments sold short | | | (25,147,661 | ) |
Proceeds from option transactions, net | | | 25,576,044 | |
Return of capital on distributions | | | 3,383,041 | |
Net realized gains on sales of investments | | | (5,682,447 | ) |
Net sales of short-term investments | | | 43,683,440 | |
Net accretion/amortization of senior notes’ premiums/discounts | | | 41,794 | |
Changes in operating assets and liabilities | | | | |
Interest receivable | | | (303,923 | ) |
Distributions and dividends receivable | | | 113,349 | |
Prepaid expenses | | | 449 | |
Payable to Adviser, net of waiver | | | 102,716 | |
Payable for investments purchased | | | (5,190,271 | ) |
Accrued expenses and other liabilities | | | 89,708 | |
| | | | |
Net cash used by operating activities | | | (15,698,863 | ) |
| | | | |
FINANCING ACTIVITIES | | | | |
Proceeds from borrowing facility | | | 88,070,000 | |
Repayment of borrowing facility | | | (63,410,938 | ) |
Dividends paid to common stockholders | | | (8,960,199 | ) |
| | | | |
Net cash provided by financing activities | | | 15,698,863 | |
| | | | |
Increase in Cash and Cash Equivalents | | | — | |
Cash and Cash Equivalents: | | | | |
Beginning of fiscal year | | | — | |
| | | | |
End of fiscal year | | $ | — | |
| | | | |
Supplemental Disclosure of Cash Flow and Non-Cash Information | | | | |
Interest Paid | | $ | 252,296 | |
See Accompanying Notes to the Financial Statements.
12
The Cushing® Renaissance Fund
Financial Highlights
| | | | | | | | |
| | | Fiscal
Year Ended
November 30, 2013 | | | Period From
September 25, 2012(1)
through
November 30, 2012 | |
Per Common Share Data(2) | | | | | | | | |
Net Asset Value, beginning of period | | $ | 23.76 | | | $ | — | |
Public offering price | | | — | | | | 25.00 | |
Underwriting discounts and offering costs on issuance of common shares | | | — | | | | (1.17 | ) |
Income from Investment Operations: | | | | | | | | |
Net investment income | | | 0.72 | | | | 0.01 | |
Net realized and unrealized gain (loss) on investments | | | 4.46 | | | | (0.08 | ) |
| | | | | | | | |
Total increase (decrease) from investment operations | | | 5.18 | | | | (0.07 | ) |
| | | | | | | | |
Less Distributions to Common Stockholders: | | | | | | | | |
Net investment income | | | (0.35 | ) | | | — | |
Net realized gain | | | (1.13 | ) | | | — | |
Return of capital | | | — | | | | — | |
| | | | | | | | |
Total distributions to common stockholders | | | (1.48 | ) | | | — | |
| | | | | | | | |
Net Asset Value, end of period | | $ | 27.46 | | | $ | 23.76 | |
| | | | | | | | |
Per common share fair value, end of period | | $ | 24.30 | | | $ | 23.41 | |
| | | | | | | | |
Total Investment Return Based on Fair Value(4) | | | 10.47 | % | | | (6.36 | )%(3) |
| | | | | | | | |
Supplemental Data and Ratios | | | | | | | | |
Net assets applicable to common stockholders, end of period (000’s) | | $ | 166,240 | | | $ | 143,850 | |
Ratio of expenses to average net assets after waiver(5)(6) | | | 1.75 | % | | | 2.06 | % |
Ratio of net investment income to average net assets before waiver(5) | | | 1.13 | % | | | (0.05 | )% |
Ratio of net investment income to average net assets after waiver(5) | | | 1.37 | % | | | 0.21 | % |
Portfolio turnover rate | | | 87.61 | % | | | 9.23 | %(7) |
| (1) | Commencement of operations. |
| (2) | Information presented relates to a share of common stock outstanding for the entire period. |
| (3) | Not annualized. Total investment return is calculated assuming a purchase of common stock at the initial public offering price and a sale at the closing price on the last day of the period reported. The calculation also assumes reinvestment of dividends at actual prices pursuant to the Fund’s dividend reinvestment plan. Total investment return does not reflect brokerage commissions. |
| (4) | Not annualized. The calculation also assumes reinvestment of dividends at actual prices pursuant to the Fund’s dividend reinvestment plan. Total investment return does not reflect brokerage commissions. |
| (5) | Annualized for periods less than one full year. |
| (6) | The ratio of expenses to average net assets before waiver was 1.99% and 2.32% for the fiscal year ended November 30, 2013, and the fiscal period from September 25, 2012 through November 30, 2012, respectively. |
See Accompanying Notes to the Financial Statements.
13
The Cushing® Renaissance Fund
Notes to Financial Statements
November 30, 2013
1. Organization
The Cushing® Renaissance Fund (the “Fund”) was formed as a Delaware statutory trust on November 16, 2010, and is registered as a non-diversified, closed-end management investment company under the Investment Company Act of 1940, as amended. The Fund is managed by Cushing® MLP Asset Management, LP (“Adviser”). The Fund’s investment objective is to seek a high total return with an emphasis on current income. The Fund commenced operations on September 25, 2012. The Fund’s shares are listed on the New York Stock Exchange under the symbol “SZC.”
2. Significant Accounting Policies
A. Use of Estimates
The preparation of financial statements in conformity with U.S. generally accepted accounting principles requires management to make estimates and assumptions that affect the reported amount of assets and liabilities, recognition of distribution income and disclosure of contingent assets and liabilities at the date of the financial statements. Actual results could differ from those estimates.
B. Investment Valuation
The Fund uses the following valuation methods to determine fair value as either fair value for investments for which market quotations are available, or if not available, the fair value, as determined in good faith pursuant to such policies and procedures as may be approved by the Fund’s Board of Trustees (“Board of Trustees”) from time to time. The valuation of the portfolio securities of the Fund currently includes the following processes:
(i) The fair value of each security listed or traded on any recognized securities exchange or automated quotation system will be the last reported sale price at the relevant valuation date on the composite tape or on the principal exchange on which such security is traded. If no sale is reported on that date, the Adviser utilizes, when available, pricing quotations from principal market makers. Such quotations may be obtained from third-party pricing services or directly from investment brokers and dealers in the secondary market. Generally, the Fund’s loan and bond positions are not traded on exchanges and consequently are valued based on market prices received from third-party services or broker-dealer sources.
(ii) Listed options on debt securities are valued at the average of the bid price and the ask price. Unlisted options on debt or equity securities are valued based upon their composite bid prices if held long, or their composite ask prices if held short. Futures are valued at the last sale price on the commodities exchange on which they trade.
(iii) The Fund’s non-marketable investments will generally be valued in such manner as the Adviser determines in good faith to reflect their fair values under procedures established by, and under the general supervision and responsibility of, the Board of Trustees. The pricing of all assets that are fair valued in this manner will be subsequently reported to and ratified by the Board of Trustees.
The Fund may engage in short sale transactions. For financial statement purposes, an amount equal to the settlement amount, if any, is included in the Statement of Assets and Liabilities as a liability. The amount of the liability is subsequently marked-to-market to reflect the current value of the short positions. Subsequent fluctuations in market prices of securities sold short may require purchasing the
14
securities at prices which may differ from the market value reflected on the Statement of Assets and Liabilities. When the Fund sells a security short, it must borrow the security sold short and deliver it to the broker-dealer through which it made the short sale. A gain, limited to the price at which the Fund sold the security short, or a loss, unlimited in size, will be recognized under the termination of a short sale. The Fund is also subject to the risk that it may be unable to reacquire a security to terminate a short position except at a price substantially in excess of the last quoted price. The Fund is liable for any dividends paid on securities sold short and such amounts would be reflected as dividend expense in the Statement of Operations. The Fund’s obligation to replace the borrowed security will be secured by collateral deposited with the broker-dealer. The Fund also will be required to segregate similar collateral to the extent, if any, necessary so that the value of both collateral amounts in the aggregate is at all times equal to at least 100% of the current market value of the securities sold short. The Fund did not hold any securities sold short at November 30, 2013.
C. Security Transactions, Investment Income and Expenses
Security transactions are accounted for on the date the securities are purchased or sold (trade date). Realized gains and losses are reported on a specific identified cost basis. Interest income is recognized on the accrual basis, including amortization of premiums and accretion of discounts. Distributions are recorded on the ex-dividend date. Distributions received from the Fund’s investments in master limited partnerships (“MLPs”) generally are comprised of ordinary income, capital gains and return of capital. The Fund records investment income on the ex-date of the distributions. For financial statement purposes, the Fund uses return of capital and income estimates to allocate the dividend income received. Such estimates are based on historical information available from each MLP and other industry sources. These estimates may subsequently be revised based on information received from the MLPs after their tax reporting periods are concluded, as the actual character of these distributions is not known until after the fiscal year end of the Fund.
The Fund estimates the allocation of investment income and return of capital for the distributions received from MLPs within the Statement of Operations. For the fiscal year ended November 30, 2013, the Fund has estimated approximately 5% of the distributions from MLPs to be from investment income with the remaining balance to be return of capital.
Expenses are recorded on the accrual basis.
D. Distributions to Stockholders
Distributions to common stockholders will be recorded on the ex-dividend date. The character of distributions to common stockholders made during the period may differ from their ultimate characterization for federal income tax purposes. For the fiscal year ended November 30, 2013, the Fund’s distributions were expected to be comprised of 76%, or $6,826,932, short-term gains and 24%, or $2,133,267, ordinary income. For Federal income tax purposes, distributions of short-term capital gains are treated as ordinary income distributions. In addition, on an annual basis, the Fund may distribute additional capital gains in the last calendar quarter, if necessary, to meet minimum distribution requirements and thus avoid being subject to excise taxes. The tax character of distributions paid for the fiscal year ended November 30, 2013 will be determined in early 2014.
E. Federal Income Taxation
The Fund intends to qualify each year for special tax treatment afforded to, a regulated investment company (“RIC”) under Subchapter M of the Internal Revenue Code of 1986, as amended (“IRC”). In order to qualify as a RIC, the Fund must, among other things, satisfy income, asset diversification and distribution requirements. As long as it so qualifies, the Fund will not be subject to U.S. federal income tax to the extent that it distributes annually its investment company taxable income (which includes ordinary income and the excess of net short-term capital gain over net long-term capital loss) and its
15
“net capital gain” (i.e., the excess of net long-term capital gain over net short-term capital loss). The Fund intends to distribute at least annually substantially all of such income and gain. If the Fund retains any investment company taxable income or net capital gain, it will be subject to U.S. federal income tax on the retained amount at regular corporate tax rates. In addition, if the Fund fails to qualify as a RIC for any taxable year, it will be subject to U.S. federal income tax on all of its income and gains at regular corporate tax rates.
The Fund recognizes in the financial statements the impact of a tax position, if that position is more-likely-than-not to be sustained on examination by the taxing authorities, based on the technical merits of the position. Tax benefits resulting from such a position are measured as the amount that has a greater than fifty percent likelihood on a cumulative basis to be sustained on examination.
F. Cash and Cash Equivalents
The Fund considers all highly liquid investments purchased with initial maturity equal to or less than three months to be cash equivalents.
G. Cash Flow Information
The Fund makes distributions from investments, which include the amount received as cash distributions from MLPs, common stock dividends and interest payments. These activities are reported in the Statement of Changes in Net Assets, and additional information on cash receipts and payments is presented in the Statement of Cash Flows.
H. Indemnifications
Under the Fund’s organizational documents, its officers and trustees are indemnified against certain liabilities arising out of the performance of their duties to the Fund. In addition, in the normal course of business, the Fund may enter into contracts that provide general indemnification to other parties. The Fund’s maximum exposure under such indemnification arrangements is unknown, as this would involve future claims that may be made against the Fund that have not yet occurred, and may not occur.
I. Derivative Financial Instruments
The Fund provides disclosure regarding derivatives and hedging activity to allow investors to understand how and why the Fund uses derivatives, how derivatives are accounted for, and how derivative instruments affect the Fund’s results of operations and financial position.
The Fund occasionally purchases and sells (“writes”) put and call equity options as a source of potential protection against a broad market decline. A purchaser of a put option has the right, but not the obligation, to sell the underlying instrument at an agreed upon price (“strike price”) to the option seller. A purchaser of a call option has the right, but not the obligation, to purchase the underlying instrument at the strike price from the option seller. Options are settled for cash.
Purchased Options — Premiums paid by the Fund for purchased options are included in the Statement of Assets and Liabilities as an investment. The option is adjusted daily to reflect the fair value of the option and any change in fair value is recorded as unrealized appreciation or depreciation of investments. If the option is allowed to expire, the Fund will lose the entire premium paid and record a realized loss for the premium amount. Premiums paid for purchased options which are exercised or closed are added to the amounts paid or offset against the proceeds on the underlying investment transaction to determine the realized gain/loss or cost basis of the security.
Written Options — Premiums received by the Fund for written options are included in the Statement of Assets and Liabilities. The amount of the liability is adjusted daily to reflect the fair value of the written option and any change in fair value is recorded as unrealized appreciation or depreciation of investments. Premiums received from written options that expire are treated as realized gains. The
16
Fund records a realized gain or loss on written options based on whether the cost of the closing transaction exceeds the premium received. If a call option is exercised by the option buyer, the premium received by the Fund is added to the proceeds from the sale of the underlying security to the option buyer and compared to the cost of the closing transaction to determine whether there has been a realized gain or loss. If a put option is exercised by an option buyer, the premium received by the option seller reduces the cost basis of the purchased security.
Written uncovered call options subject the Fund to unlimited risk of loss. Written covered call options limit the upside potential of a security above the strike price. Put options written subject the Fund to risk of loss if the value of the security declines below the exercise price minus the put premium.
The Fund is not subject to credit risk on written options as the counterparty has already performed its obligation by paying the premium at the inception of the contract.
The Fund has adopted the disclosure provisions of Financial Accounting Standards Board (“FASB”) Accounting Standard Codification 815, Derivatives and Hedging (“ASC 815”). ASC 815 requires enhanced disclosures about the Fund’s use of and accounting for derivative instruments and the effect of derivative instruments on the Fund’s results of operations and financial position. Tabular disclosure regarding derivative fair value and gain/loss by contract type (e.g., interest rate contracts, foreign exchange contracts, credit contracts, etc.) is required and derivatives accounted for as hedging instruments under ASC 815 must be disclosed separately from those that do not qualify for hedge accounting. Even though the Fund may use derivatives in an attempt to achieve an economic hedge, the Fund’s derivatives are not accounted for as hedging instruments under ASC 815 because investment companies account for their derivatives at fair value and record any changes in fair value in current period earnings.
There were no transactions in purchased options during the fiscal year ended November 30, 2013.
Transactions in written options contracts for the fiscal year ended November 30, 2013, are as follows:
| | | | | | | | |
| | | Contracts | | | Premiums | |
Outstanding at December 1, 2012 | | | — | | | $ | — | |
Options written | | | 16,830 | | | | 878,584 | |
Options covered | | | (2,625 | ) | | | (111,477 | ) |
Options expired | | | (8,630 | ) | | | (401,722 | ) |
Options exercised | | | (5,575 | ) | | | (365,385 | ) |
| | | | | | | | |
Outstanding at November 30, 2013 | | | — | | | $ | — | |
| | | | | | | | |
The average monthly fair value of written options during the fiscal year ended November 30, 2013 was $158,225.
The effect of derivative instruments on the Statement of Operations for the fiscal year ended November 30, 2013:
| | | | | | | | | | | | |
Amount of Realized Gain or (Loss) on Derivatives Recognized in Income | |
Derivatives not accounted for as hedging
instruments under ASC 815 | | Purchased
Options | | | Written
Options | | | Total | |
Equity Contracts | | $ | — | * | | $ | 401,722 | * | | $ | 401,722 | |
| | | | | | | | | | | | |
| * | Included in Net realized gain on investments on the Statement of Operations. |
| | | | | | | | | | | | |
Amount of Unrealized Appreciation (Depreciation) on Derivatives Recognized in Income | |
Derivatives not accounted for as hedging
instruments under ASC 815 | | Purchased
Options | | | Written
Options | | | Total | |
Equity Contracts | | $ | — | | | $ | — | | | $ | — | |
| | | | | | | | | | | | |
17
J. Recent Accounting Pronouncements
In December 2011, the FASB issued Accounting Standards Update (“ASU”) 2011-11 “Balance Sheet (Topic 210) Disclosures about Offsetting Assets and Liabilities”. ASU 2011-11 requires new disclosures for recognized financial instruments and derivative instruments that are either offset on the balance sheet in accordance with the offsetting guidance in ASC 210-20-45 or ASC 815-10-45 or are subject to an enforceable master netting arrangement or similar arrangement. ASU 2011-11 is effective for periods beginning on or after January 1, 2013 and must be applied retrospectively.
In January 2013, the Financial Accounting Standards Board issued Accounting Standards Update No. 2013-01 “Clarifying the Scope of Disclosures about Offsetting Assets and Liabilities” (“ASU 2013-01”) which amended Accounting Standards Codification Subtopic 210-20, Balance Sheet Offsetting. ASU 2013-01 clarified the scope of ASU No. 2011-11 “Disclosures about Offsetting Assets and Liabilities” (“ASU 2011-11”). ASU 2013-01 clarifies the scope of ASU 2011-11 as applying to derivatives accounted for in accordance with Topic 815, Derivatives and Hedging, including bifurcated embedded derivatives, repurchase agreements and reverse repurchase agreements, and securities borrowing and securities lending transactions that are offset either in accordance with other requirements of U.S. GAAP or subject to an enforceable master netting arrangement or similar agreement. The guidance in ASU 2013-01 and ASU 2011-11 is effective for interim and annual periods beginning on or after January 1, 2013. Adoption of ASU 2011-11 will have no effect on the Fund’s net assets. Management has evaluated ASU 2013-01 and ASU 2011-11 and determined that there is no impact to the Fund’s financial statements.
3. Concentrations of Risk
The Fund’s investment objective is to seek a high total return with an emphasis on current income. The Fund will seek to achieve its investment objective by investing, under normal market conditions, at least 80% of its Managed Assets (as defined below) in (i) companies across the energy supply chain spectrum, including upstream, midstream and downstream energy companies, as well as oil and gas services and logistics companies (collectively, “Energy Companies”), and (ii) energy-intensive chemical, metal and industrial and manufacturing companies and engineering and construction companies that the Adviser expects to benefit from lower energy and feedstock costs (collectively, “Industrial Companies” and, together with Energy Companies, “Renaissance Companies”); up to 25% of its Managed Assets in securities of energy MLPs; up to 25% of its Managed Assets in unregistered or otherwise restricted securities, including securities issued by private companies; and up to 30% of its Managed Assets in debt securities, preferred stock and convertible securities, provided that such securities are (a) rated, at the time of investment, at least (i) B3 by Moody’s Investors Service, Inc. (“Moody’s”), (ii) B- by Standard & Poor’s (“S&P”) or Fitch Ratings (“Fitch”), or (iii) of a comparable rating by another Nationally Recognized Statistical Rating Organization (“NRSRO”) or (b) with respect to up to 10% of its Managed Assets, lower rated or unrated at the time of investment. These investments may include securities such as partnership interests, limited liability company interests or units, trust units, common stock, preferred stock, convertible securities, warrants and depositary receipts and debt securities. The Fund will not invest directly in commodities.
“Managed Assets” means the total assets of the Fund, minus all accrued expenses incurred in the normal course of operations other than liabilities or obligations attributable to investment leverage, including, without limitation, investment leverage obtained through (i) indebtedness of any type (including, without limitation, borrowing through a credit facility or the issuance of debt securities), (ii) the issuance of shares of preferred stock or other similar preference securities and/or (iii) the reinvestment of collateral received for securities loaned in accordance with the Fund’s investment objective and policies.
18
4. Agreements and Related Party Transactions
The Fund has entered into an Investment Management Agreement with the Adviser (the “Agreement”). Under the terms of the Agreement, the Fund has agreed to pay the Adviser a fee payable at the end of each calendar month, at an annual rate equal to 1.25% of the average weekly value of the Fund’s managed assets during such month. The Adviser has agreed to waive 0.25% of the management fee for the first twelve (12) months of operations. The Adviser earned $2,322,669 in advisory fees for the fiscal year ended November 30, 2013. The Adviser waived $371,370 for the fiscal year ended November 30, 2013.
The Fund has engaged U.S. Bancorp Fund Services, LLC to serve as the Fund’s administrator. The Fund pays the administrator a monthly fee computed at an annual rate of 0.09% of the first $100,000,000 of the Fund’s average daily net assets, 0.07% on the next $200,000,000 of average daily net assets and 0.04% on the balance of the Fund’s average daily net assets, with a minimum annual fee of $70,000.
U.S. Bancorp Fund Services, LLC serves as the Fund’s transfer agent, dividend paying agent, and agent for the automatic dividend reinvestment plan.
U.S. Bank, N.A. serves as the Fund’s custodian. The Fund pays the custodian a monthly fee computed at an annual rate of 0.004% of the Fund’s average daily market value, with a minimum annual fee of $4,800.
5. Income Taxes
It is the Fund’s intention to continue to qualify as a RIC under Subchapter M of the IRC and distribute all of its taxable income. Accordingly, no provision for federal income taxes is required in the financial statements.
The amount and character of income and capital gain distributions to be paid, if any, are determined in accordance with federal income tax regulations, which may differ from U.S. generally accepted accounting principles. These differences are primarily due to differences in the timing of recognition of gains or losses on investments. Permanent book and tax basis differences resulted in the reclassifications of $2,271,484 from accumulated net investment income, $2,271,896 to accumulated net realized gain and $(412) to additional paid-in capital.
The following information is provided on a tax basis as of November 30, 2013:
| | | | |
Cost of investments | | $ | 167,417,622 | |
| | | | |
Gross unrealized appreciation | | $ | 26,526,514 | |
Gross unrealized depreciation | | | (3,387,047 | ) |
| | | | |
Net unrealized appreciation | | | 23,139,467 | |
Undistributed ordinary income | | | 193,069 | |
Undistributed long-term gains | | | 189,713 | |
Other accumulated losses | | | (1,522,856 | ) |
| | | | |
Total accumulated earnings | | $ | 21,999,393 | |
| | | | |
During the fiscal year ended November 30, 2013, the Fund utilized $146,020 of capital loss carryforwards from the prior fiscal year. As of November 30, 2013, the Fund had no capital loss carryforwards.
The Fund recognizes the tax benefits of uncertain tax positions only where the position is “more likely than not” to be sustained assuming examination by tax authorities. Management has analyzed the Fund’s tax positions, and has concluded that no liability for unrecognized tax benefits should be recorded related to uncertain tax positions taken on U.S. tax returns and state tax returns filed since inception of the Fund. No income tax returns are currently under examination. The period from
19
inception through November 30, 2013 remains subject to examination by the tax authorities in the United States. Due to the nature of the Fund’s investments, the Fund may be required to file income tax
returns in several states. The Fund is not aware of any tax positions for which it is reasonably possible that the total amounts of unrecognized tax benefits will change materially in the next 12 months.
6. Fair Value Measurements
Various inputs that are used in determining the fair value of the Fund’s investments are summarized in the three broad levels listed below:
| | • | | Level 1 — quoted prices in active markets for identical securities |
| | • | | Level 2 — other significant observable inputs (including quoted prices for similar securities, interest rates, prepayment speeds, credit risk, etc.) |
| | • | | Level 3 — significant unobservable inputs (including the Fund’s own assumptions in determining the fair value of investments) |
The inputs or methodology used for valuing securities are not necessarily an indication of the risk associated with investing in those securities.
These inputs are summarized in the three broad levels listed below.
| | | | | | | | | | | | | | | | |
| | | | | | Fair Value Measurements at Reporting Date Using | |
Description | | Fair Value at
November 30,
2013 | | | Quoted Prices in
Active Markets for
Identical Assets
(Level 1) | | | Significant Other
Observable
Inputs
(Level 2) | | | Significant
Unobservable
Inputs
(Level 3) | |
Assets | | | | | | | | | | | | | | | | |
Equity Securities | | | | | | | | | | | | | | | | |
Common Stock(a) | | $ | 99,543,821 | | | $ | 99,543,821 | | | $ | — | | | $ | — | |
Master Limited Partnerships and Related Companies(a) | | | 50,738,838 | | | | 50,738,838 | | | | — | | | | — | |
| | | | | | | | | | | | | | | | |
Total Equity Securities | | | 150,282,659 | | | | 150,282,659 | | | | — | | | | — | |
| | | | | | | | | | | | | | | | |
Notes | | | | | | | | | | | | | | | | |
Senior Notes(a) | | | 40,112,805 | | | | — | | | | 40,112,805 | | | | — | |
| | | | | | | | | | | | | | | | |
Total Notes | | | 40,112,805 | | | | — | | | | 40,112,805 | | | | — | |
| | | | | | | | | | | | | | | | |
Other | | | | | | | | | | | | | | | | |
Short-Term Investments | | | 161,625 | | | | 161,625 | | | | — | | | | — | |
| | | | | | | | | | | | | | | | |
Total Other | | | 161,625 | | | | 161,625 | | | | — | | | | — | |
| | | | | | | | | | | | | | | | |
Total | | $ | 190,557,089 | | | $ | 150,444,284 | | | $ | 40,112,805 | | | $ | — | |
| | | | | | | | | | | | | | | | |
| (a) | All other industry classifications are identified in the Schedule of Investments. The Fund did not hold Level 3 investments at any time during the fiscal year ended November 30, 2013. |
Transfers into and out of each level are measured at fair value at the end of the fiscal year. There were no transfers between any levels during the fiscal year ended November 30, 2013.
7. Investment Transactions
For the fiscal year ended November 30, 2013, the Fund purchased (at cost) and sold securities (proceeds) in the amount of $233,243,973 and $149,009,031 (excluding short-term securities), respectively and made purchases to cover investments sold short and received proceeds from investments sold in the amount of $25,147,661 and $24,047,511, respectively. The Fund sold covered options (proceeds) in the amount of $26,670,125. The Fund sold written options (proceeds) and covered written options (at cost) in the amount of $878,585 and $1,972,666, respectively.
20
8. Common Stock
The Fund has unlimited shares of capital stock authorized and 6,054,188 shares outstanding at November 30, 2013. Transactions in common stock for the period ended November 30, 2013 were as follows:
| | | | |
Shares at September 25, 2012 | | | 4,188 | |
Shares sold through initial offering | | | 5,400,000 | |
Shares sold through additional offerings | | | 650,000 | |
| | | | |
Shares at November 30, 2012 | | | 6,054,188 | |
| | | | |
Shares at November 30, 2013 | | | 6,054,188 | |
| | | | |
9. Borrowing Facilities
The Fund maintains a margin account arrangement with Bank of America — Merril Lynch. The interest rate charged on margin borrowing is tied to the cost of funds for Bank of America — Merril Lynch (which approximates LIBOR plus 0.65%). Proceeds from the margin account arrangement are used to execute the Fund’s investment objective.
The average principal balance and interest rate for during which the credit facilities were utilized during the fiscal year ended November 30, 2013 was approximately $29,160,000 and 0.84%, respectively. At November 30, 2013, the principal balance outstanding was $24,659,062 and prepaid interest expense was $541.
10. Subsequent Events
On December 20, 2013, the Fund paid a distribution in the amount of $0.41 per common share, for a total of $2,482,217. Of this total, the dividend reinvestment amounted to $31,250.
21
The Cushing® Renaissance Fund
Report of Independent Registered Public Accounting Firm
The Board of Trustees and Shareholders of
The Cushing Renaissance Fund:
We have audited the accompanying statement of assets and liabilities of The Cushing Renaissance Fund (the Fund), including the schedule of investments, as of November 30, 2013, the related statements of operations and cash flows for the year then ended, and the statement of changes in net assets and the financial highlights for each of the periods indicated therein. These financial statements and financial highlights are the responsibility of the Fund’s management. Our responsibility is to express an opinion on these financial statements and financial highlights based on our audits.
We conducted our audits in accordance with the standards of the Public Company Accounting Oversight Board (United States). Those standards require that we plan and perform the audit to obtain reasonable assurance about whether the financial statements and financial highlights are free of material misstatement. We were not engaged to perform an audit of the Fund’s internal control over financial reporting. Our audit included consideration of internal control over financial reporting as a basis for designing audit procedures that are appropriate in the circumstances, but not for the purpose of expressing an opinion on the effectiveness of the Fund’s internal control over financial reporting. Accordingly, we express no such opinion. An audit also includes examining, on a test basis, evidence supporting the amounts and disclosures in the financial statements and financial highlights, assessing the accounting principles used and significant estimates made by management, and evaluating the overall financial statement presentation. Our procedures included confirmation of securities owned as of November 30, 2013, by correspondence with the custodian and brokers or by other appropriate auditing procedures where replies from brokers were not received. We believe that our audits provide a reasonable basis for our opinion.
In our opinion, the financial statements and financial highlights referred to above present fairly, in all material respects, the financial position of The Cushing Renaissance Fund at November 30, 2013, the results of its operations and its cash flows for the year then ended, and the changes in its net assets and the financial highlights for each of the periods indicated therein, in conformity with U.S. generally accepted accounting principles.

Dallas, Texas
January 29, 2014
22
The Cushing® Renaissance Fund
Trustees and Executive Officers (Unaudited)
November 30, 2012
Set forth below is information with respect to each of the Trustees and executive officers of the Trust, including their principal occupations during the past five years. The business address of the Fund, its Trustees and executive officers is 8117 Preston Road, Suite 440, Dallas, Texas 75225.
| | | | | | | | | | |
Name and Year of Birth | | Position(s) Held
with the Trust | | Term of
Office and
Length of
Time
Served(1) | | Principal
Occupations
During Past
Five Years | | Number of
Portfolios
in Fund
Complex(2)
Overseen
by Trustee | | Other Directorships Held by Trustee During the
Past Five Years |
Independent Trustees | | | | | | | | |
| Brian R. Bruce (1955) | | Trustee and Chairman of the Audit Committee | | Trustee since 2012 | | Chief Executive Officer, Hillcrest Asset Management, LLC (2008 to present) (registered investment adviser). Previously, Director of Southern Methodist University’s Encap Investment and LCM Group Alternative Asset Management Center (2006 to 2011). Chief Investment Officer of Panagora Asset Management, Inc. (1999 to 2007) (investment management company). | | 7 | | CM Advisers Family of Funds (2 series) (2003 to present) and Dreman Contrarian Funds (2 series) (2007 to present). |
| | | | | |
| Edward N. McMillan (1947) | | Trustee and Lead Independent Trustee | | Trustee since 2012 | | Retired. Private Investor with over 35 years of experience in asset management, investment banking and general business matters. | | 7 | | None. |
| | | | | |
| Ronald P. Trout (1939) | | Trustee and Chairman of the Nominating and Corporate Governance Committee | | Trustee since 2012 | | Retired. Previously, founding partner and Senior Vice President of Hourglass Capital Management, Inc. (1989 to 2002) (investment management company). | | 7 | | Dorchester Minerals LP (2008 – present) (acquisition, ownership and administration of natural gas and crude oil royalty, net profits and leasehold interests in the U.S.) |
| | | | |
Interested Trustees | | | | | | | | |
| Jerry V. Swank (1951)(3) | | Trustee, Chairman of the Board, Chief Executive Officer and President | | Trustee since 2012 | | Managing Partner of the Adviser and founder Swank Capital, LLC of (2000 – present). | | 7 | | E-T Energy Ltd. (2008 – present). (developing, operating, producing and selling recoverable bitumen); Central Energy Partners, LP (storage and transportation of refined petroleum products and petrochemicals). |
| (1) | After a Trustee’s initial term, each Trustee is expected to serve a three-year term concurrent with the class of Trustees for which he serves. Mr. Trout is expected to stand for re-election in 2013, Mr. Bruce in 2014, and Messrs. McMillan and Swank in 2015. |
| (2) | The “Fund Complex” includes each series of the Trust and each other registered investment company for which the Adviser serves as investment adviser. As of November 30, 2013, there were seven funds in the Fund Complex. |
| (3) | Mr. Swank is an “interested person” of the Fund, as defined under the 1940 Act, by virtue of his position as Managing Partner of the Adviser. |
23
Executive Officers
The following provides information regarding the executive officers of the Fund who are not Trustees. Officers serve at the pleasure of the Board of Trustees and until his or her successor is appointed and qualified or until his or her earlier resignation or removal.
| | | | | | |
Name and Year of Birth | | Position(s) Held
with the Trust | | Term of
Office and
Length of
Time
Served(1) | | Principal
Occupations
During Past
Five Years |
| Daniel L. Spears (1972) | | Executive Vice President | | Officer since 2012 | | Partner and portfolio manager of the Adviser (2006 – present). Previously, investment banker at Banc of America Securities, LLC (1998 – 2006). |
| | | |
John H. Alban
(1963) | | Chief Financial Officer and Treasurer | | Officer since 2012 | | Chief Operating Officer (“COO”) and Chief Financial Officer of the Adviser (2010 – present). Previously, Chief Administrative Officer of NGP Energy Capital Management (2007 –2009); COO of Spinnerhawk Capital Management, L.P. (2005 – 2007). |
| | | |
| Barry Y. Greenberg (1963) | | Chief Compliance Officer and Secretary | | Officer since 2012 | | General Counsel and Chief Compliance Officer of the Adviser (2010 –present); Partner at Akin Gump Strauss Hauer & Feld LLP (2005 – 2010); Vice President, Legal, Compliance and Administration at American Beacon Advisors (1995 –2005); Attorney and Branch Chief at the U.S. Securities and Exchange Commission (1988 –1995). |
| | | |
Judd B. Cryer
(1973) | | Vice President | | Officer since 2012 | | Managing Director and Senior Research Analyst of the Adviser (2005 – present). Previously, a consulting engineer at Utility Engineering Corp. (1999 – 2003) and a project manager with Koch John Zink Company (1996 – 1998). |
24
The Cushing® Renaissance Fund
Additional Information (Unaudited)
November 30, 2013
Investment Policies and Parameters
Previously, the Fund had stated an intention to generally invest in 20-40 issuers. The Board of Trustees has approved eliminating that policy. While the Fund initially expects to invest in a greater number of issuers, the Fund may in the future invest in fewer issuers. The Fund is a non-diversified, closed-end management investment company under the 1940 Act. Accordingly, the Fund may invest a greater portion of its assets in a more limited number of issuers than a diversified fund. An investment in the Fund may present greater risk to an investor than an investment in a diversified portfolio because changes in the financial condition or market assessment of a single issuer may cause greater fluctuations in the value of the Fund’s shares.
The Commodity Futures Trading Commission (“CFTC”) amended Rule 4.5, which permits investment advisers to registered investment companies to claim an exclusion from the definition of commodity pool operator with respect to a fund provided certain requirements are met. In order to permit the Adviser to continue to claim this exclusion with respect to the Fund under the amended rule, the Fund limits its transactions in futures, options of futures and swaps (excluding transactions entered into for “bona fide hedging purposes,” as defined under CFTC regulations) such that either: (i) the aggregate initial margin and premiums required to establish its futures, options on futures and swaps do not exceed 5% of the liquidation value of the Fund’s portfolio, after taking into account unrealized profits and losses on such positions; or (ii) the aggregate net notional value of its futures, options on futures and swaps does not exceed 100% of the liquidation value of the Fund’s portfolio, after taking into account unrealized profits and losses on such positions. The Fund and the Adviser do not believe that complying with the amended rule will limit the Fund’s ability to use futures, options and swaps to the extent that it has used them in the past.
Trustee and Executive Officer Compensation
The Fund does not currently compensate any of its trustees who are interested persons or any of its officers. For the fiscal year ended November 30, 2013, the aggregate compensation paid by the Fund to the independent trustees was $59,955. The Fund did not pay any special compensation to any of its trustees or officers. The Fund continuously monitors standard industry practices and this policy is subject to change.
Cautionary Note Regarding Forward-Looking Statements
This report contains “forward-looking statements” as defined under the U.S. federal securities laws. Generally, the words “believe,” “expect,” “intend,” “estimate,” “anticipate,” “project,” “will” and similar expressions identify forward-looking statements, which generally are not historical in nature. Forward-looking statements are subject to certain risks and uncertainties that could cause actual results to materially differ from the Fund’s historical experience and its present expectations or projections indicated in any forward-looking statements. These risks include, but are not limited to, changes in economic and political conditions; regulatory and legal changes; energy industry risk; leverage risk; valuation risk; interest rate risk; tax risk; and other risks discussed in the Fund’s filings with the SEC. You should not place undue reliance on forward-looking statements, which speak only as of the date they are made. The Fund undertakes no obligation to update or revise any forward-looking statements made herein. There is no assurance that the Fund’s investment objective will be attained.
25
Form N-Q
The Fund will file its complete schedule of portfolio holdings for the first and third quarters of each fiscal year with the SEC on Form N-Q. The Fund’s Form N-Q and statement of additional information are available without charge by visiting the SEC’s website at www.sec.gov. In addition, you may review and copy the Fund’s Form N-Q at the SEC’s Public Reference Room in Washington D.C. You may obtain information on the operation of the Public Reference Room by calling (800) SEC-0330.
Portfolio Turnover
The portfolio turnover rate for the fiscal year ended November 30, 2013 was 87.61%. Portfolio turnover may vary greatly from period to period. The Fund does not consider portfolio turnover rate a limiting factor in the Adviser’s execution of investment decisions, and the Fund may utilize investment and trading strategies that may involve high portfolio turnover. A higher portfolio turnover rate results in correspondingly greater brokerage commissions and other transactional expenses that are borne by the Fund.
Certifications
The Fund’s Chief Executive Officer has submitted to the New York Stock Exchange the annual CEO certification as required by Section 303A.12(a) of the NYSE Listed Fund Manual.
The Fund has filed with the SEC the certification of its Chief Executive Officer and Chief Financial Officer required by Section 302 of the Sarbanes-Oxley Act.
Tax Information
The Fund designates 50% of its ordinary income distribution for the year ended November 30, 2013 as qualified dividend income and 45% of the dividends paid from net ordinary income qualify for the dividends received deduction available to corporate stockholders.
Dividend Reinvestment Plan
How the Plan Works
Unless the registered owner of common shares elects to receive cash by contacting the Plan Agent, all dividends declared for your common shares of the Fund will be automatically reinvested by U.S. Bancorp Fund Services, LLC (the “Plan Agent”), agent for stockholders in administering the Fund’s Dividend Reinvestment Plan (the “Plan”), in additional common shares of the Fund. The Plan Agent will open an account for each common stockholder under the Plan in the same name in which such common stockholder’s common shares are registered. Whenever the Fund declares a dividend or other distribution (for purposes of this section, together, a “dividend”) payable in cash, non-participants in the Plan will receive cash and participants in the Plan will receive the equivalent in common shares. The common shares will be acquired by the Plan Agent for the participants’ accounts, depending upon the circumstances described below, either (i) through receipt of additional unissued but authorized common shares from the Fund (“newly-issued common shares”) or (ii) by purchase of outstanding common shares on the open market (“open-market purchases”) on the New York Stock Exchange or elsewhere.
If, on the payment date for any dividend, the market price per common share plus per share fees (which include any brokerage commissions the Plan Agent is required to pay) is greater than the net asset value per common share, the Plan Agent will invest the dividend amount in newly-issued common shares, including fractions, on behalf of the participants. The number of newly-issued common shares
26
to be credited to each participant’s account will be determined by dividing the dollar amount of the dividend by the net asset value per common share on the payment date; provided that, if the net asset value per common share is less than 95% of the market price per common share on the payment date, the dollar amount of the dividend will be divided by 95% of the market price per common share on the payment date. If, on the payment date for any dividend, the net asset value per common share is greater than the market value per common share plus per share fees, the Plan Agent will invest the dividend amount in common shares acquired on behalf of the participants in open-market purchases.
Participation in the Plan
If a registered owner of common shares elects not to participate in the Plan, you will receive all dividends in cash paid by check mailed directly to you (or, if the shares are held in street or other nominee name, then to such nominee) by the Plan Agent, as dividend disbursing agent. You may elect not to participate in the Plan and to receive all dividends in cash by sending written or telephonic instructions to the Plan Agent, as dividend paying agent. Participation in the Plan is completely voluntary and may be terminated or resumed at any time without penalty by contacting the Plan Agent before the dividend record date; otherwise such termination or resumption will be effective with respect to any subsequently declared dividend or other distribution. Some brokers may automatically elect to receive cash on your behalf and may reinvest that cash in additional common shares of the Fund for you.
Plan Fees
There will be no per share fees with respect to common shares issued directly by the Fund. However, each participant will pay a pro rata share of brokerage commissions incurred in connection with open-market purchases. There is no direct service charge to participants in the Plan; however, the Fund reserves the right to amend the Plan to include a service charge payable by the participants.
Tax Implications
The automatic reinvestment of dividends will not relieve participants of any federal, state or local income tax that may be payable (or required to be withheld) on such dividends. Accordingly, any taxable dividend received by a participant that is reinvested in additional common shares will be subject to federal (and possibly state and local) income tax even though such participant will not receive a corresponding amount of cash with which to pay such taxes.
Contact Information
For more information about the plan you may contact the Plan Agent in writing at PO Box 708, Milwaukee, WI 53201-0701, by calling the Plan Agent at 1-800-662-7232.
Privacy Policy
In order to conduct its business, the Fund collects and maintains certain nonpublic personal information about its stockholders of record with respect to their transactions in shares of the Fund’s securities. This information includes the stockholder’s address, tax identification or Social Security number, share balances, and dividend elections. We do not collect or maintain personal information about stockholders whose share balances of our securities are held in “street name” by a financial institution such as a bank or broker.
We do not disclose any nonpublic personal information about you, the Fund’s other stockholders or the Fund’s former stockholders to third parties unless necessary to process a transaction, service an account, or as otherwise permitted by law.
To protect your personal information internally, we restrict access to nonpublic personal information about the Fund’s stockholders to those employees who need to know that information to provide services to our stockholders. We also maintain certain other safeguards to protect your nonpublic personal information.
27
Other Information For Stockholders
Notice is hereby given in accordance with Section 23(c) of the Investment Company Act of 1940, as amended, that the Fund from time to time may purchase its common shares of beneficial interest in the open market.
This report is sent to stockholders of The Cushing® Renaissance Fund for their information. It is not a prospectus, circular or representation intended for use in the purchase or sale of shares of the Fund or of any securities mentioned in this report.
The Fund does not make available copies of its Statement of Additional Information because the Fund’s shares are not continuously offered, which means that the Statement of Additional Information has not been updated after completion of the Fund’s initial public offering and the information contained in such Statement of Additional Information may have become outdated.
The Fund makes available performance and certain other on its website at www.cushingcef.com. Investors and others are advised to periodically check the website for updated performance information and the release of other material information about the Fund. This reference to Fund’s website is intended to allow investors public access to information regarding the Fund and does not, and is not intended to, incorporate the Fund’s website in this report.
28
The Cushing® Renaissance Fund
TRUSTEES
Brian R. Bruce
Ronald P. Trout
Edward N. McMillan
Jerry V. Swank
EXECUTIVE OFFICERS
Jerry V. Swank
Chief Executive Officer
Daniel L. Spears
President
John H. Alban
Chief Financial Officer and Treasurer
Barry Y. Greenberg
Chief Compliance Officer and Secretary
Judd B. Cryer
Vice President
INVESTMENT ADVISER
Cushing® MLP Asset Management, LP
8117 Preston Road, Suite 440
Dallas, TX 75225
ADMINISTRATOR
U.S. Bancorp Fund Services, LLC
615 East Michigan Street, 3rd Floor
Milwaukee, WI 53202
CUSTODIAN
U.S. Bank, N.A.
1555 N. River Center Drive, Suite 302
Milwaukee, WI 53212
TRANSFER AGENT
U.S. Bancorp Fund Services, LLC
615 East Michigan Street, 3rd Floor
Milwaukee, WI 53202
LEGAL COUNSEL
Skadden, Arps, Slate, Meagher & Flom LLP
Four Times Square
New York, NY 10036
INDEPENDENT REGISTERED PUBLIC ACCOUNTING FIRM
Ernst & Young LLP
2323 Victory Avenue, Suite 2000
Dallas, TX 75219
NOT FDIC INSURED | NOT BANK GUARANTEED | MAY LOSE VALUE
THE CUSHING® RENAISSANCE FUND
| | |
| | Investment Adviser Cushing® MLP Asset Management, LP 8117 Preston Road Suite 440 Dallas, TX 75225 (214) 692-6334 (888) 777-2346 www.cushingcef.com www.swankcapital.com |
Item 2. Code of Ethics.
The registrant has adopted a code of ethics that applies to the registrant’s principal executive officer and principal financial officer. The registrant has made amendments to its code of ethics during the period covered by this report. The registrant has not granted any waivers from any provisions of the code of ethics during the period covered by this report.
A copy of the registrant’s Code of Ethics is filed herewith.
Item 3. Audit Committee Financial Expert.
The registrant’s board of Trustees has determined that there is at least one audit committee financial expert serving on its audit committee. Mr. Brian Bruce is the “audit committee financial expert” and is considered to be “independent” as each term is defined in Item 3 of Form N-CSR.
Item 4. Principal Accountant Fees and Services.
The registrant has engaged its principal accountant to perform audit services, audit-related services, tax services and other services during the past two fiscal years. “Audit services” refer to performing an audit of the registrant’s annual financial statements or services that are normally provided by the accountant in connection with statutory and regulatory filings or engagements for those fiscal years. “Audit-related services” refer to the assurance and related services by the principal accountant that are reasonably related to the performance of the audit. “Tax services” refer to professional services rendered by the principal accountant for tax compliance, tax advice, and tax planning. There were no “Other services” provided by the principal accountant. The following table details the aggregate fees billed or expected to be billed for each of the last two fiscal years for audit fees, audit-related fees, tax fees and other fees by the principal accountant.
| | | | | | | | |
| | | FYE 11/30/2013 | | | FYE 11/30/2012 | |
Audit Fees | | | 71,568 | | | | 91,500 | |
Audit-Related Fees | | | None | | | | None | |
Tax Fees | | | 17,850 | | | | 17,000 | |
All Other Fees | | | None | | | | None | |
The audit committee has adopted pre-approval policies and procedures that require the audit committee to pre-approve all audit and non-audit services of the registrant, including services provided to any entity affiliated with the registrant.
The percentage of fees billed by Ernst & Young LLP applicable to non-audit services pursuant to waiver of pre-approval requirement were as follows:
| | | | | | | | |
| | | FYE 11/30/2013 | | | FYE 11/30/2012 | |
Audit-Related Fees | | | 0 | % | | | 0 | % |
Tax Fees | | | 0 | % | | | 0 | % |
All Other Fees | | | 0 | % | | | 0 | % |
2
All of the principal accountant’s hours spent on auditing the registrant’s financial statements were attributed to work performed by full-time permanent employees of the principal accountant. The following table indicates the non-audit fees billed or expected to be billed by the registrant’s accountant for services to the registrant and to the registrant’s investment adviser (and any other controlling entity, etc.—not sub-adviser) for the last two years. The audit committee of the board of Trustees has considered whether the provision of non-audit services that were rendered to the registrant’s investment adviser is compatible with maintaining the principal accountant’s independence and has concluded that the provision of such non-audit services by the accountant has not compromised the accountant’s independence.
| | | | | | | | |
Non-Audit Related Fees | | FYE 11/30/2013 | | | FYE 11/30/2012 | |
Registrant | | | None | | | | None | |
Registrant’s Investment Adviser | | | None | | | | None | |
Item 5. Audit Committee of Listed Registrants.
The Registrant has a separately-designated standing audit committee established in accordance with Section 3(a)(58)(A) of the Securities Exchange Act of 1934, and is comprised of Mr. Brian R. Bruce, Mr. Edward N. McMillan and Mr. Ron P. Trout.
Item 6. Investments.
| (a) | Schedule of Investments is included as part of the report to shareholders filed under Item 1 of this Form. |
Item 7. Disclosure of Proxy Voting Policies and Procedures for Closed-End Management Investment Companies.
Cushing MLP Asset Management, LP (the “Investment Adviser”) serves as the investment adviser and general partner, respectively, of certain investment vehicles (the “Affiliate Funds” and, together with the registrant, each a “Client” and collectively, the “Clients”). Through these relationships the Investment Adviser is delegated the right to vote, on behalf of the Clients, proxies received from companies, the securities of which are owned by the Clients.
Purpose
The Investment Adviser follows this proxy voting policy (the “Policy”) to ensure that proxies the Investment Adviser votes on behalf of each Client are voted to further the best interest of that Client. The Policy establishes a mechanism to address any conflicts of interests between the Investment Adviser and the Client. Further, the Policy establishes how Clients may obtain information on how the proxies have been voted.
3
Determination of Vote
The Investment Adviser determines how to vote after studying the proxy materials and any other materials that may be necessary or beneficial to voting. The Investment Adviser votes in a manner that the Investment Adviser believes reasonably furthers the best interests of the Client and is consistent with the investment philosophy as set out in the relevant investment management documents.
The major proxy-related issues generally fall within five categories: corporate governance, takeover defenses, compensation plans, capital structure, and social responsibility. The Investment Adviser will cast votes for these matters on a case-by-case basis. The Investment Adviser will generally vote in favor of matters which follow an agreeable corporate strategic direction, support an ownership structure that enhances shareholder value without diluting management’s accountability to shareholders and/or present compensation plans that are commensurate with enhanced manager performance and market practices.
Resolution of any Conflicts of Interest
If a proxy vote creates a material conflict between the interests of the Investment Adviser and a Client, the Investment Adviser will resolve the conflict before voting the proxies. The Investment Adviser will either disclose the conflict to the Client and obtain a consent or take other steps designed to ensure that a decision to vote the proxy was based on the Investment Adviser’s determination of the Client’s best interest and was not the product of the conflict.
Records
The Investment Adviser maintains records of (i) all proxy statements and materials the Investment Adviser receives on behalf of Clients; (ii) all proxy votes that are made on behalf of the Clients; (iii) all documents that were material to a proxy vote; (iv) all written requests from Clients regarding voting history; and (v) all responses (written and oral) to Clients’ requests. Such records are available to the Clients (and owners of a Client that is an investment vehicle) upon request.
Item 8. Portfolio Managers of Closed-End Management Investment Companies.
Jerry V. Swank, Saket Kumar and Matthew A. Lemme (the “portfolio managers”) are primarily responsible for the day-to-day management of the registrant’s portfolio.
(a)(1) The following table provides biographical information about the registrant’s portfolio managers as of the date of this filing:
| | | | |
Name | | Positions(s) Held With Registrant and Length of Time Served | | Principal Occupation During Past Five Years |
Jerry V. Swank | | Trustee, Chairman of the Board, Chief Executive Officer and President since 2007. | | Managing Partner of the Investment Adviser since 2003. |
| | |
Saket Kumar | | None | | Managing Director and Senior Research Analyst of the Investment Adviser since 2012. |
| | |
Matthew A. Lemme | | Vice President. | | Managing Director and Senior Research Analyst of the Investment Adviser since 2012. |
4
(a)(2) The following table provides information about the other accounts managed on a day-to-day basis by the portfolio managers as of November 30, 2013:
| | | | | | | | | | | | | | | | |
Name of Portfolio Manager | | Number of
Accounts | | | Total Assets of
Accounts | | | Number of Accounts
Subject to a
Performance Fee | | | Total Assets of
Accounts
Subject to a
Performance
Fee | |
Jerry V. Swank | | | | | | | | | | | | | | | | |
Registered investment companies | | | 7 | | | $ | 1,968,065,567 | | | | 0 | | | $ | 0 | |
Other pooled investment vehicles | | | 9 | | | $ | 509,737,314 | | | | 5 | | | $ | 475,634,370 | |
Other accounts | | | 6 | | | $ | 628,326,654 | | | | 1 | | | $ | 28,446,046 | |
| | | | |
Saket Kumar | | | | | | | | | | | | | | | | |
Registered investment companies | | | 2 | | | $ | 191,987,393 | | | | 0 | | | $ | 0 | |
Other pooled investment vehicles | | | 1 | | | $ | 29,581,173 | | | | 1 | | | $ | 29,581,173 | |
Other accounts | | | 0 | | | | 0 | | | | 0 | | | | 0 | |
| | | | |
Matthew A. Lemme | | | | | | | | | | | | | | | | |
Registered investment companies | | | 2 | | | $ | 191,987,393 | | | | 0 | | | $ | 0 | |
Other pooled investment vehicles | | | 1 | | | $ | 29,581,173 | | | | 1 | | | $ | 29,581,173 | |
Other accounts | | | 1 | | | $ | 381,630,227 | | | | 0 | | | $ | 381,630,227 | |
5
(iv) Conflicts of Interest with the Investment Adviser
Conflicts of interest may arise because the Investment Adviser and its affiliates generally will be carrying on substantial investment activities for other Clients, including, but not limited to, the Affiliated Funds, in which The Cushing Renaissance Fund (the “Fund”) will have no interest. The Investment Adviser or its affiliates may have financial incentives to favor certain of such accounts over the Fund. Any of the proprietary accounts of the Investment Adviser and its affiliates and other customer accounts may compete with the Fund for specific trades. The Investment Adviser or its affiliates may buy or sell securities for the Fund which differ from securities bought or sold for other accounts and customers, even though the investment objectives and policies of the other accounts may be similar to the Fund’s. Situations may occur where the Fund could be disadvantaged as a result of the investment activities conducted by the Investment Adviser and its affiliates for other accounts resulting in, among other things, legal or internal restrictions on the combined size of positions that may be taken for the Fund and the other accounts, limits on the size of the Fund’s position, or difficulty in liquidating an investment for the Fund and the other accounts where the market cannot absorb the sale of the combined position. Notwithstanding these potential conflicts of interest, the Investment Adviser, the Fund’s Board of Trustees and its officers have a fiduciary obligation to act in the Fund’s best interest.
The Fund’s investment opportunities may be limited by potential affiliations of the Investment Adviser or its affiliates with MLPs and other natural resource companies. Additionally, to the extent that the Investment Adviser sources and structures private investments in MLPs and other natural resource companies, certain employees of the Investment Adviser may become aware of actions planned by MLPs and other natural resource companies, such as acquisitions, that may not be announced to the public. It is possible that the Fund could be precluded from investing in an MLP or other natural resource company as a result of such an occurrence.
The Investment Adviser manages several private managed accounts. Some of these Affiliated Funds have investment objectives that are similar to or overlap with the Fund’s investment objectives. Further, the Investment Adviser may at some time in the future manage other investment funds with the same or similar investment objective as the Fund.
Investment decisions for the Fund are made independently from those of other Clients; however, from time to time, the same investment decision may be made for more than one fund or account.
When two or more Clients advised by the Investment Adviser or its affiliates seek to purchase or sell the same publicly traded securities, the securities actually purchased or sold will be allocated among the Clients on a good faith equitable basis by the Investment Adviser in its discretion in accordance with the Clients’ various investment objectives and procedures adopted by the Investment Adviser and approved by the Fund’s Board of Trustees. In some cases, this system may adversely affect the price or size of the position obtained by the Fund.
6
The Fund’s investment opportunities may be limited by the availability of investment opportunities in the MLPs and other natural resource companies that the Investment Adviser evaluates for the Affiliated Funds. To the extent a potential investment is appropriate for the Fund and one or more of the Affiliated Funds, the Investment Adviser will fairly allocate that investment to the Fund or an Affiliated Fund, or both, depending on its allocation procedures and applicable law related to combined or joint transactions. Under such circumstances, there may be an attractive limited investment opportunity otherwise suitable for the Fund in which the Fund cannot invest because of the particular allocation method being used for that investment.
Under the Investment Company Act of 1940 (the “1940 Act”), the Fund and its Affiliated Funds may be precluded from co-investing in private placements of securities. Except as permitted by law or positions of the staff of the Securities and Exchange Commission, the Investment Adviser will not co-invest its other Clients’ assets in private transactions in which the Fund invests. To the extent the Fund is precluded from co-investing in such transactions, the Investment Adviser will allocate private investment opportunities among its Clients, including but not limited to the Fund and the Affiliated Funds, based on allocation policies that take into account several suitability factors, including the size of the investment opportunity, the amount each Client has available for investment and the Client’s investment objectives. These allocation policies may result in the allocation of investment opportunities to an Affiliated Fund rather than to the Fund.
(a)(3) As of November 30, 2013:
Compensation
Messrs. Swank, Kumar and Lemme are compensated by the Investment Adviser. Mr. Swank is a principal of the Investment Adviser and is compensated through partnership distributions that are based primarily on the profits and losses of the Investment Adviser. The partnership distributions are affected by the amount of assets the Investment Adviser manages and the appreciation of those assets, particularly over the long-term, but are not determined with specific reference to any particular performance benchmark or time period. Some of the other accounts managed by Messrs. Swank, Kumar and Lemme, including the Affiliated Funds, have investment strategies that are similar to the Fund’s investment strategy. However, the Investment Adviser manages potential material conflicts of interest by allocating investment opportunities in accordance with its allocation policies and procedures.
(a)(4) As of November 30, 2013:
Securities Beneficially Owned in the Registrant by Portfolio Managers
The following table provides information about the dollar range of equity securities in the registrant beneficially owned by the portfolio manager:
| | | | |
| Portfolio Manager | | Aggregate Dollar Range
of Beneficial Ownership
in the Registrant | |
Jerry V. Swank | | | More than $100,000 | (1) |
Saket Kumar | | | None | |
Matthew A. Lemme | | $ | 10,001-50,000 | |
| (1) | Includes securities owned by the Investment Adviser. By virtue of his control of the Investment Adviser, Mr. Swank may be deemed to beneficially own the securities held by the Investment Adviser. |
7
Item 9. Purchases of Equity Securities by Closed-End Management Investment Company and Affiliated Purchasers.
| | | | | | | | | | | | | | | | |
Period | | (a)
Total Number of
Shares (or Units)
Purchased | | | (b)
Average Price Paid
per Share (or Unit) | | | (c)
Total Number of
Shares (or Units)
Purchased as Part
of Publicly
Announced Plans
or Programs | | | (d)
Maximum Number
(or Approximate
Dollar Value) of
Shares (or Units)
that May Yet Be
Purchased Under
the Plans or
Programs | |
Month #1 06/01/2013-06/30/2013 | | | 0 | | | | 0 | | | | 0 | | | | 0 | |
Month #2 07/01/2013-07/31/2013 | | | 0 | | | | 0 | | | | 0 | | | | 0 | |
Month #3 08/01/2013-08/31/2013 | | | 0 | | | | 0 | | | | 0 | | | | 0 | |
Month #4 09/01/2013-09/30/2013 | | | 0 | | | | 0 | | | | 0 | | | | 0 | |
Month #5 10/01/2013-10/31/2013 | | | 0 | | | | 0 | | | | 0 | | | | 0 | |
Month #6 11/01/2013-11/30/2013 | | | 0 | | | | 0 | | | | 0 | | | | 0 | |
| | | | | | | | | | | | | | | | |
Total | | | 0 | | | | 0 | | | | 0 | | | | 0 | |
| | | | | | | | | | | | | | | | |
| * | Footnote the date each plan or program was announced, the dollar amount (or share or unit amount) approved, the expiration date (if any) of each plan or program, each plan or program that expired during the covered period, each plan or program registrant plans to terminate or let expire. |
Item 10. Submission of Matters to a Vote of Security Holders.
Not Applicable.
Item 11. Controls and Procedures.
| (a) | The Registrant’s President and Treasurer & Chief Financial Officer have reviewed the Registrant’s disclosure controls and procedures (as defined in Rule 30a-3(c) under the Investment Company Act of 1940 (the “Act”)) as of a date within 90 days of the filing of this report, as required by Rule 30a-3(b) under the Act and Rules 13a-15(b) or 15d-15(b) under the Securities Exchange Act of 1934. Based on their review, such officers have concluded that the disclosure controls and procedures are effective in ensuring that information required to be disclosed in this report is appropriately recorded, processed, summarized and reported and made known to them by others within the Registrant and by the Registrant’s service provider. |
8
| (b) | There were no changes in the Registrant’s internal control over financial reporting (as defined in Rule 30a-3(d) under the Act) that occurred during the second fiscal quarter of the period covered by this report that has materially affected, or is reasonably likely to materially affect, the Registrant’s internal control over financial reporting. |
Item 12. Exhibits.
| (a) | (1) Any code of ethics or amendment thereto, that is the subject of the disclosure required by Item 2, to the extent that the registrant intends to satisfy Item 2 requirements through filing an exhibit. Filed herewith. |
(2) A separate certification for each principal executive and principal financial officer pursuant to Section 302 of the Sarbanes-Oxley Act of 2002. Filed herewith.
(3) Any written solicitation to purchase securities under Rule 23c-1 under the Act sent or given during the period covered by the report by or on behalf of the registrant to 10 or more persons. None.
| (b) | Certifications pursuant to Section 906 of the Sarbanes-Oxley Act of 2002. Furnished herewith. |
9
SIGNATURES
Pursuant to the requirements of the Securities Exchange Act of 1934 and the Investment Company Act of 1940, the registrant has duly caused this report to be signed on its behalf by the undersigned, thereunto duly authorized.
| | | | | | |
(Registrant) | | The Cushing Renaissance Fund |
| | | | | | |
| | |
By | | (Signature and Title) | | /s/ Daniel L. Spears |
| | | | Daniel L. Spears, President | | |
Pursuant to the requirements of the Securities Exchange Act of 1934 and the Investment Company Act of 1940, this report has been signed below by the following persons on behalf of the registrant and in the capacities and on the dates indicated.
| | | | | | |
By | | (Signature and Title) | | /s/ Daniel L. Spears |
| | | | Daniel L. Spears, President | | |
| | | | | | |
| | |
By | | (Signature and Title) | | /s/ John H. Alban |
| | | | John H. Alban, Treasurer & Chief Financial Officer | | |
10