As filed with the U.S. Securities and Exchange Commission on August 9, 2018
UNITED STATES
SECURITIES AND EXCHANGE COMMISSION
Washington, D.C. 20549
FORM N-CSR
CERTIFIED SHAREHOLDER REPORT OF REGISTERED
MANAGEMENT INVESTMENT COMPANIES
Investment Company Act file number 811-22499
The Cushing Renaissance Fund
(Exact name of registrant as specified in charter)
8117 Preston Road, Suite 440, Dallas, TX 75225
(Address of principal executive offices) (Zip code)
Jerry V. Swank
8117 Preston Road, Suite 440, Dallas, TX 75225
(Name and address of agent for service)
214-692-6334
Registrant’s telephone number, including area code
Date of fiscal year end: November 30
Date of reporting period: May 31, 2018
Item 1. Reports to Stockholders.

Semi-Annual Report
May 31, 2018
THE CUSHING® RENAISSANCE FUND

| | |

| | Investment Adviser Cushing® Asset Management, LP 8117 Preston Road Suite 440 Dallas, TX 75225 (214) 692-6334 (888) 777-2346 www.cushingcef.com www.cushingasset.com |
Table of Contents
The Cushing® Renaissance Fund
Shareholder Letter
Dear Fellow Shareholder,
The Cushing® Renaissance Fund (the “Fund”) generated a positive return for shareholders for the first half of fiscal year 2018, which ended May 31, 2018 (the “period”). For the period, the Fund delivered a Net Asset Value Total Return (equal to the change in net asset value (“NAV”) per share plus reinvested cash distributions paid during the period) of 3.61%. This compares to total returns of 3.16% for the S&P 500® Index (“S&P 500”) and 10.31% for the S&P North American Natural Resources Sector Index for the period. The Fund’s Share Price Total Return (equal to the change in market price per share plus reinvested cash distributions paid during the period) was -0.45% for the period and differs from the NAV Total Return due to fluctuations in the discount of share price to NAV. The Fund’s shares traded at a 9.40% discount to NAV as of the end of the period, compared to a 5.71% discount at the end of the last fiscal year.
Market Review
The period was good for commodity-exposed stocks; the energy sector portion of the S&P 500 was up by 10.4% during the period, while the metals and mining sector portion of the S&P 500 was up by nearly 13%. The relatively rapid recovery of crude oil prices during the period as well as a stable market for base metals drove performance of stocks within these sectors, which comprise the vast majority of the S&P North American Natural Resources Sector Index. The energy sector performance also helps explain the performance of the Fund’s portfolio, which had large investments in energy during the period.
The Fund’s performance can vary dramatically with the performance of the S&P 500; while the Fund is diversified into industrial, transportation, chemical, and utility stocks, as well as energy stocks, these still represent only a few of the eleven sectors in the S&P 500.
The broader equity market, as measured by the performance of the S&P 500, had a tempered start to the period following a 23%+ return for the S&P 500 during the Fund’s last fiscal year. The synchronized global growth witnessed in 2017 started to fray in the period as monetary policy makers became more hawkish to combat inflationary fears. In the United States, the Federal Reserve saw a change of leadership, increased interest rates, and signaled its pace of tightening may be faster than initially communicated. The result was a dampening of valuations and, therefore, prices of financial assets. However, it is important to note that the increasingly hawkish outlook was being driven by very positive data: earnings growth accelerated in the 2018 calendar first quarter, wage growth picked up, and the unemployment rate was the lowest in over 15 years.
Fund Performance
The largest contributors to the Fund’s positive performance for the period, at the industry level, were companies in the Midstream, Refining, and Exploration and Production (“E&P”) sectors. The top contributing individual investments for the period were Valero Energy Corporation (NYSE: VLO), DCP Midstream LP. (NYSE: DCP), and Energy Transfer Partners LP (NYSE: ETP). Valero benefited from strong margins for refining crude oil into products like gasoline and diesel, and discounts for heavy crude oil, of which it is a significant buyer, that widened significantly. Energy Transfer Partners and DCP both benefited from a rebound in domestic crude oil and natural gas production as their primary businesses depend on transporting or processing hydrocarbons.
1
The biggest detractors from performance were investments in the Fund’s bond portfolio as well as in the Chemicals and Materials sectors. The price of yield-oriented investments fell during the period due to rising interest rates. Individually, the Fund’s worst performing holdings during the period were bonds of Sanchez Energy Corporation, Golar LNG Partners LP (NYSE: GMLP), and DowDuPont Inc. (NYSE: DWDP). Sanchez missed financial and operating expectations for first calendar quarter earnings, so its shares and credit both suffered. Golar announced the end of a joint venture with Schlumberger, Ltd., a move which was taken negatively by the market. DowDuPont, as a bellwether of the chemicals space, struggled along with other large manufacturers, in the face of a rising dollar and higher feedstock costs.
The largest sector exposures at the end of the period were Midstream, Utilities, and E&P companies. We increased the Fund’s exposure to crude oil-sensitive sectors during the period to take advantage of the disconnect between improving crude oil fundamentals and poor valuations for both pipeline companies and crude oil producers. In order to fund this shift, we reduced exposure to the Chemicals sector and used proceeds from the Fund’s rights offering, which was completed during the period.
During the period, we sold positions in Andeavor (NYSE: ANDV); Cheniere Energy Partners LP (NYSE: CQP), Huntsman Corporation (NYSE: HUN), MPLX LP (NYSE: MPLX), and Univar Inc (NYSE: UNVR). We added several new positions, mostly with the proceeds of the rights offering completed during the period, including, DCP Midstream Partners LP (NYSE: DCP), Dominion Energy Inc (NYSE: D), Enterprise Product Partners LP (NYSE: EPD), Pembina Pipeline Corp (ADR: PBA), PPL Corp (NYSE: PPL), Vermillion Energy Inc (ADR: VET), Viper Energy Partners LP (NASDAQ: VNOM), and Duke Energy Corp (NYSE: DUK).
Leverage
The Fund employs leverage for additional income and total return potential. We seek to maintain a leverage ratio of between 120% and 135% during normal market conditions. At the end of the period, the Fund had a leverage ratio of about 126%, up from 119% at the end of the last fiscal year. As the prices of the Fund’s investments increase or decline, there is a risk that the impact to the Fund’s NAV and total return will be negatively impacted by leverage, but the Fund’s use of leverage is intended to have a positive impact over the longer term.
Outlook
Crude oil prices ended the period at the highest level since late 2014 while domestic production hit a record at the end of the period – nearly 11 million barrels per day, an increase of over 1 million barrels per day since this time last year.1 Despite the increase in domestic production, global crude oil inventories actually shrank over the 12 months prior to the end of the fiscal period as demand was strong and several large global producing nations witnessed meaningful production declines. The OPEC pact with several large non-OPEC producing nations to curtail production, which was originally agreed to over a year ago, appears to be finally bearing fruit, balancing the crude oil market and stabilizing prices at higher levels.
As of the end of the period, natural gas fundamentals were mixed and prices reflected that with a lackluster performance in the first half of the fiscal year. More specifically, inventories ended the crucial winter heating season at low levels, which is typically bullish for prices. However, production grew and was poised to grow even more by the end of the period. The demand outlook improves in 2019
| 1 | Source: Energy Information Administration’s Petroleum Supply Weekly |
2
with the addition of more export capability, but we believe the net impact will be somewhat neutral as supply continues to ramp.
That both domestic crude oil and natural gas production hit record levels in the first half of 2018 despite prices being lower than they were five years ago is, we believe, a testament to the quality of the rock in the U.S., the technical expertise of domestic producers, and the ability of management teams to wring out costs to bring economics in line with current reality. The resilience in crude oil and gas production illustrates an underlying premise of the Fund’s strategy, namely that abundant energy supplies will drive positive change and secular growth throughout the value chain. The Energy & Industrial Renaissance is alive and well: while the last four years were a virtual roller coaster ride for crude oil prices, we saw few liquefied natural gas export facilities or chemical plants or manufacturing operations get pushed to the back of the project queue because of it. If anything, the pace of industrial activity and construction accelerated during this time. We believe the Fund’s ability to shift exposures to these types of businesses when crude oil prices tumble helps mitigates downside risk while its ability to invest in crude oil producers and pipeline companies gives it leverage to recovery periods like the one we witnessed in the first half of the fiscal year. Active management and a detailed understanding of the fundamentals are imperative to do this successfully.
Thank you for entrusting us with your money. We truly appreciate your support, and we look forward to helping you achieve your investment goals in the coming year.
Sincerely,
| | |
 | | |
| Jerry V. Swank | | |
| Chairman, Chief Executive Officer and President | | |
The information provided herein represents the opinion of the Fund’s portfolio managers and is not intended to be a forecast of future events, a guarantee of future results, nor investment advice. The opinions expressed are as of the date of this report and are subject to change.
The information in this report is not a complete analysis of every aspect of any market, sector, industry, security or the Fund itself. Statements of fact are from sources considered reliable, but the Fund makes no representation or warranty as to their completeness or accuracy. Discussions of specific investments are for illustration only and are not intended as recommendations of individual investments. Please refer to the Schedule of Investments for a complete list of Fund holdings.
Past performance does not guarantee future results. Investment return, net asset value and common share market price will fluctuate so that you may have a gain or loss when you sell shares. Since the Fund is a closed-end management investment company, shares of the Fund may trade at a discount or premium from net asset value. This characteristic is separate and distinct from the risk that net asset value could decrease as a result of investment activities and may be a greater risk to investors expecting to sell their shares after a short time. The Fund cannot predict whether shares will trade at, above or below net asset value. The Fund should not be viewed as a vehicle for trading purposes. It is designed primarily for risk-tolerant long-term investors.
An investment in the Fund involves risks. Leverage creates risks which may adversely affect returns, including the likelihood of greater volatility of net asset value and market price of the Fund’s common shares. The Fund is nondiversified, meaning it may concentrate its assets in fewer individual holdings than a diversified fund. Therefore, the Fund is more exposed to individual stock volatility than a 3 diversified fund. The Fund will invest in energy companies, including Master Limited Partnerships (MLPs), which concentrate investments in the natural resources sector. Energy companies are subject to certain risks, including, but not limited to the following: fluctuations in the prices of commodities; the highly cyclical nature of the natural resources sector may adversely affect the earnings or operating cash flows of the companies in which the Fund will invest; a significant decrease in the production of energy commodities could reduce the revenue, operating income, operating cash flows of MLPs and other natural resources sector companies and, therefore, their ability to make distributions or pay dividends and a sustained decline in demand for energy commodities could adversely affect the revenues and cash flows of energy companies. Holders of MLP units are subject to certain risks inherent in
3
the structure of MLPs, including tax risks; the limited ability to elect or remove management or the general partner or managing member; limited voting rights and conflicts of interest between the general partner or managing member and its affiliates, on the one hand, and the limited partners or members, on the other hand. Damage to facilities and infrastructure of MLPs may significantly affect the value of an investment and may incur environmental costs and liabilities due to the nature of their business. Investors in MLP funds incur management fees from underlying MLP investments. Small- and mid-cap stocks are often more volatile and less liquid than large-cap stocks. Smaller companies generally face higher risks due to their limited product lines, markets, and financial resources. Funds that invest in bonds are subject to interest-rate risk and can lose principal value when interest rates rise. Bonds are also subject to credit risk, in which the bond issuer may fail to pay interest and principal in a timely manner. High yield securities have speculative characteristics and present a greater risk of loss than higher quality debt securities. These securities can also be subject to greater price volatility. An investment in the Fund will involve tax risks, including, but not limited to: The portion, if any, of a distribution received by the Fund as the holder of an MLP equity security that is offset by the MLP’s tax deductions or losses generally will be treated as a return of capital to the extent of the Fund’s tax basis in the MLP equity security, which will cause income or gain to be higher, or losses to be lower, upon the sale of the MLP security by the Fund. Changes in tax laws, regulations or interpretations of those laws or regulations in the future could adversely affect the Fund or the energy companies in which the Fund will invest.
The Fund incurs operating expenses, including advisory fees, as well as leverage costs. Investment returns for the Fund are shown net of fees and expenses.
Fund holdings and sector allocations are subject to change at any time and are not recommendations to buy or sell any security. Please refer to the Schedule of Investments for a complete list of Fund holdings.
The S&P 500 Index is an unmanaged index of common stocks that is frequently used as a general measure of stock market performance. The S&P North American Natural Resources Sector Index measures the performance of U.S. traded natural resources related stocks. Neither of these indices includes fees or expenses. It is not possible to invest directly in an index.
4
The Cushing® Renaissance Fund
Allocation of Portfolio Assets (Unaudited)
May 31, 2018
(Expressed as a Percentage of Total Investments)
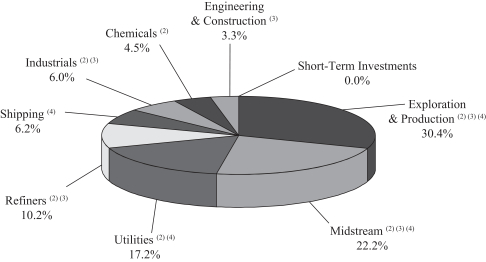
| (1) | Fund holdings and sector allocations are subject to change and there is no assurance that the Fund will continue to hold any particular security. |
| (4) | Master Limited Partnerships and Related Companies |
5
The Cushing® Renaissance Fund
Key Financial Data (Supplemental Unaudited Information)
The Information presented below regarding Distributable Cash Flow is supplemental non-GAAP financial information, which we believe is meaningful to understanding our operating performance. Supplemental non-GAAP measures should be read in conjunction with our full financial statements.
| | | | | | | | | | | | | | | | | | | | | | | | |
| | | Period from
December 1, 2017
through
May 31, 2018 | | | Fiscal Year
Ended
11/30/17 | | | Fiscal Year
Ended
11/30/16 | | | Fiscal Year
Ended
11/30/15 | | | Fiscal Year
Ended
11/30/14 | | | Fiscal Year
Ended
11/30/13 | |
FINANCIAL DATA | | | | | | | | | | | | | | | | | | | | | | | | |
Total income from investments | | | | | | | | | | | | | | | | | | | | | | | | |
Distributions and dividends received, net of foreign taxes withheld | | $ | 3,635,731 | | | $ | 6,231,019 | | | $ | 5,845,564 | | | $ | 6,280,188 | | | $ | 6,537,721 | | | $ | 5,652,293 | |
Interest income & other | | $ | 1,390,588 | | | $ | 2,261,759 | | | $ | 2,334,255 | | | $ | 2,556,657 | | | $ | 2,838,317 | | | $ | 2,611,738 | |
| | | | | | | | | | | | | | | | | | | | | | | | |
Total income from investments | | $ | 5,026,319 | | | $ | 8,492,778 | | | $ | 8,179,819 | | | $ | 8,836,845 | | | $ | 9,376,038 | | | $ | 8,264,031 | |
Advisory fee and operating expenses | | | | | | | | | | | | | | | | | | | | | | | | |
Advisory fees, less expenses waived by Adviser | | $ | 1,009,564 | | | $ | 1,762,997 | | | $ | 1,467,185 | | | $ | 1,979,660 | | | $ | 2,678,764 | | | $ | 1,951,299 | |
Operating expenses (a) | | | 249,521 | | | | 548,402 | | | | 475,852 | | | | 533,904 | | | | 545,286 | | | | 533,110 | |
Leverage costs | | | 430,230 | | | | 550,659 | | | | 158,972 | | | | 181,532 | | | | 267,870 | | | | 251,755 | |
Other | | | 0 | | | | 0 | | | | 1,254 | | | | 5,119 | | | | 1,207 | | | | 4,944 | |
| | | | | | | | | | | | | | | | | | | | | | | | |
Total advisory fees and operating expenses | | $ | 1,689,315 | | | $ | 2,862,058 | | | $ | 2,103,263 | | | $ | 2,700,215 | | | $ | 3,493,127 | | | $ | 2,741,108 | |
Distributable Cash Flow (DCF) (b) | | $ | 3,337,004 | | | $ | 5,630,720 | | | $ | 6,076,556 | | | $ | 6,136,630 | | | $ | 5,882,911 | | | $ | 5,522,923 | |
Distributions paid on common stock | | $ | 5,334,816 | | | $ | 9,745,773 | | | $ | 9,928,869 | | | $ | 9,928,869 | | | $ | 9,928,869 | | | $ | 8,960,199 | |
Distributions paid on common stock per share | | $ | 0.82 | | | $ | 1.64 | | | $ | 1.64 | | | $ | 1.64 | | | $ | 1.64 | | | $ | 1.48 | |
Distribution Coverage Ratio | | | | | | | | | | | | | | | | | | | | | | | | |
Before advisory fee and operating expenses | | | 0.9x | | | | 0.9x | | | | 0.8x | | | | 0.9x | | | | 0.9x | | | | 0.9x | |
After advisory fee and operating expenses | | | 0.6x | | | | 0.6x | | | | 0.6x | | | | 0.6x | | | | 0.6x | | | | 0.6x | |
OTHER FUND DATA (end of period) | | | | | | | | | | | | | | | | | | | | | | | | |
Total Assets, end of period | | | 198,001,497 | | | | 140,122,224 | | | | 129,985,987 | | | | 126,197,190 | | | | 180,609,847 | | | | 191,388,953 | |
Unrealized appreciation (depreciation) | | | 13,354,734 | | | | 11,685,233 | | | | 8,701,560 | | | | (3,758,216 | ) | | | 18,534,134 | | | | 23,272,117 | |
Short-term borrowings | | | 40,956,007 | | | | 22,956,007 | | | | 10,456,007 | | | | 7,321,000 | | | | 24,171,751 | | | | 24,659,062 | |
Short-term borrowings as a percent of total assets | | | 21 | % | | | 16 | % | | | 8 | % | | | 6 | % | | | 13 | % | | | 13 | % |
Net Assets, end of period | | | 154,365,630 | | | | 116,907,654 | | | | 117,569,394 | | | | 118,568,412 | | | | 156,094,420 | | | | 166,240,231 | |
Net Asset Value per common share | | $ | 19.78 | | | $ | 19.97 | | | $ | 19.42 | | | $ | 19.58 | | | $ | 25.78 | | | $ | 27.46 | |
Market Value per share | | $ | 17.92 | | | $ | 18.83 | | | $ | 17.49 | | | $ | 15.75 | | | $ | 23.51 | | | $ | 24.30 | |
Market Capitalization | | $ | 139,868,163 | | | $ | 110,228,127 | | | $ | 105,887,748 | | | $ | 95,353,461 | | | $ | 142,333,960 | | | $ | 147,116,768 | |
Shares Outstanding | | | 7,805,143 | | | | 5,853,857 | | | | 6,054,188 | | | | 6,054,188 | | | | 6,054,188 | | | | 6,054,188 | |
| (a) | Excludes expenses related to capital raising. |
| (b) | “Net Investment Income” on the Statement of Operations is adjusted as follows to reconcile to Distributable Cash Flow: increased by the return of capital on MLP distributions. |
6
The Cushing® Renaissance Fund
Schedule of Investments (Unaudited) | May 31, 2018 |
| | | | | | | | |
| Common Stock — 60.0% | | Shares | | | Fair Value | |
Chemicals — 5.6% | | | | | | | | |
Netherlands — 2.9% | | | | | | | | |
LyondellBasell Industries NV(1) | | | 40,000 | | | $ | 4,484,800 | |
United States — 2.7% | | | | | | | | |
DowDuPont, Inc. | | | 65,000 | | | | 4,167,150 | |
| | | | | | | | |
| | | | | | | 8,651,950 | |
| | | | | | | | |
| | |
Exploration & Production — 15.1% | | | | | | | | |
Canada — 4.2% | | | | | | | | |
Suncor Energy, Inc.(1) | | | 45,000 | | | | 1,790,100 | |
Vermilion Energy, Inc.(1) | | | 136,000 | | | | 4,769,520 | |
Netherlands — 4.0% | | | | | | | | |
Royal Dutch Shell Plc(1) | | | 88,250 | | | | 6,140,435 | |
United Kingdom — 5.0% | | | | | | | | |
BP Plc(1) | | | 167,500 | | | | 7,674,850 | |
United States — 1.9% | | | | | | | | |
Cabot Oil & Gas Corporation(1) | | | 125,000 | | | | 2,856,250 | |
| | | | | | | | |
| | | | | | | 23,231,155 | |
| | | | | | | | |
| | |
Industrials — 5.2% | | | | | | | | |
Ireland — 2.6% | | | | | | | | |
Eaton Corp Plc(1) | | | 52,000 | | | | 3,982,160 | |
United States — 2.6% | | | | | | | | |
Emerson Electric Company | | | 57,000 | | | | 4,037,880 | |
| | | | | | | | |
| | | | | | | 8,020,040 | |
| | | | | | | | |
| | |
Midstream — 6.8% | | | | | | | | |
Canada — 1.6% | | | | | | | | |
Pembina Pipeline Corporation(1) | | | 70,000 | | | | 2,433,900 | |
United States — 5.2% | | | | | | | | |
Targa Resources Corporation(1) | | | 164,625 | | | | 8,005,714 | |
| | | | | | | | |
| | | | | | | 10,439,614 | |
| | | | | | | | |
| | |
Refiners — 9.6% | | | | | | | | |
United States — 9.6% | | | | | | | | |
CVR Energy, Inc. | | | 145,000 | | | | 5,470,850 | |
Phillips 66(1) | | | 44,000 | | | | 5,125,560 | |
Valero Energy Corporation(1) | | | 35,000 | | | | 4,242,000 | |
| | | | | | | | |
| | | | | | | 14,838,410 | |
| | | | | | | | |
| | |
Utilities — 17.7% | | | | | | | | |
United States — 17.7% | | | | | | | | |
Dominion Energy, Inc.(1) | | | 123,500 | | | | 7,927,465 | |
Duke Energy Corporation(1) | | | 55,000 | | | | 4,243,800 | |
FirstEnergy Corporation(1) | | | 102,500 | | | | 3,528,050 | |
NRG Yield, Inc.(1) | | | 364,500 | | | | 6,378,750 | |
PPL Corporation(1) | | | 194,000 | | | | 5,300,080 | |
| | | | | | | | |
| | | | | | | 27,378,145 | |
| | | | | | | | |
Total Common Stocks (Cost $81,327,894) | | | | | | $ | 92,559,314 | |
| | | | | | | | |
Master Limited Partnerships and
Related Companies — 32.9% | | | | | | |
Exploration & Production — 2.1% | | | | | | | | |
United States — 2.1% | | | | | | | | |
Mid-Con Energy Partners, L.P.(2) | | | 465,116 | | | $ | 883,720 | |
Viper Energy Partners, L.P. | | | 75,000 | | | | 2,443,500 | |
| | | | | | | | |
| | | | | | | 3,327,220 | |
| | | | | | | | |
See Accompanying Notes to the Financial Statements.
7
The Cushing® Renaissance Fund
Schedule of Investments (Unaudited) | May 31, 2018 — (Continued) |
| | | | | | | | |
Master Limited Partnerships and
Related Companies — (Continued) | | Shares | | | Fair Value | |
Midstream — 19.2% | | | | | | | | |
United States — 19.2% | | | | | | | | |
DCP Midstream, L.P.(1) | | | 207,000 | | | $ | 8,675,370 | |
Energy Transfer Partners, L.P.(1) | | | 300,000 | | | | 5,697,000 | |
Enterprise Products Partners, L.P.(1) | | | 210,000 | | | | 6,069,000 | |
Sunoco, L.P.(1) | | | 180,000 | | | | 4,788,000 | |
Western Gas Partners, L.P.(1) | | | 85,000 | | | | 4,391,950 | |
| | | | | | | | |
| | | | | | | 29,621,320 | |
| | | | | | | | |
| | |
Shipping — 7.8% | | | | | | | | |
Republic of the Marshall Islands — 7.8% | | | | | | | | |
GasLog Partners, L.P.(1) | | | 245,000 | | | | 5,990,250 | |
Golar LNG Partners, L.P.(1) | | | 360,000 | | | | 6,037,200 | |
| | | | | | | | |
| | | | | | | 12,027,450 | |
| | | | | | | | |
| | |
Utilities — 3.8% | | | | | | | | |
United States — 3.8% | | | | | | | | |
NextEra Energy Partners, L.P. | | | 130,000 | | | | 5,844,800 | |
| | | | | | | | |
Total Master Limited Partnerships and Related Companies (Cost $46,380,044) | | | | | | $ | 50,820,790 | |
| | | | | | | | |
| Fixed Income — 32.4% | | Principal Amount | | | | |
Engineering & Construction — 4.1% | | | | | | | | |
United States — 4.1% | | | | | | | | |
Zachry Holdings, Inc., 7.500%, due 02/01/2020(1)(3) | | | 6,250,000 | | | $ | 6,273,438 | |
| | | | | | | | |
| | |
Exploration & Production — 20.9% | | | | | | | | |
Canada — 3.1% | | | | | | | | |
MEG Energy Corporation, 6.375%, due 01/30/2023(1)(3) | | | 2,725,000 | | | | 2,472,937 | |
MEG Energy Corporation, 7.000%, due 03/31/2024(1)(3) | | | 2,500,000 | | | | 2,268,750 | |
United States — 17.8% | | | | | | | | |
Bill Barrett Corporation, 7.000%, due 10/15/2022(1) | | | 5,250,000 | | | | 5,314,050 | |
Denbury Resources, Inc., 4.625%, due 07/15/2023(1) | | | 4,000,000 | | | | 3,360,000 | |
HighPoint Operating Corporation, 8.750%, due 06/15/2025(1) | | | 1,288,000 | | | | 1,384,600 | |
Murphy Oil Corporation, 5.875%, due 12/01/2042(1) | | | 5,000,000 | | | | 4,591,250 | |
QEP Resources, Inc., 5.625%, due 03/01/2026(1) | | | 4,000,000 | | | | 3,835,000 | |
Sanchez Energy Corporation, 6.125%, due 01/15/2023(1) | | | 5,000,000 | | | | 3,312,500 | |
Southwestern Energy Company, 7.750%, due 10/01/2027(1) | | | 5,500,000 | | | | 5,775,000 | |
| | | | | | | | |
| | | | | | | 32,314,087 | |
| | | | | | | | |
| | |
Industrials — 2.4% | | | | | | | | |
United States — 2.4% | | | | | | | | |
Cleaver-Brooks, Inc., 7.875%, due 03/01/2023(1)(3) | | | 3,500,000 | | | | 3,618,125 | |
| | | | | | | | |
| | |
Midstream — 1.9% | | | | | | | | |
United States — 1.9% | | | | | | | | |
DCP Midstream, L.P., 7.375%, due 06/15/2023(1) | | | 3,000,000 | | | | 2,904,375 | |
| | | | | | | | |
| | |
Refiners — 3.1% | | | | | | | | |
United States — 3.1% | | | | | | | | |
PBF Holding Company, LLC / PBF Finance Corporation, 7.000%, due 11/15/2023(1) | | | 4,655,000 | | | | 4,847,019 | |
| | | | | | | | |
Total Fixed Income (Cost $52,293,550) | | | | | | $ | 49,957,044 | |
| | | | | | | | |
See Accompanying Notes to the Financial Statements.
8
The Cushing® Renaissance Fund
Schedule of Investments (Unaudited) | May 31, 2018 — (Continued) |
| | | | | | | | |
| Short-Term Investments — Investment Companies — 0.0% | | Shares | | | Fair Value | |
United States — 0.0% | | | | | | | | |
Fidelity Government Portfolio Fund — Institutional Class, 1.64%(1)(4) | | | 9,986 | | | $ | 9,986 | |
First American Prime Obligations Fund — Class Z, 1.60%(1)(4) | | | 9,985 | | | | 9,985 | |
Invesco Short-Term Government & Agency Portfolio — Institutional Class, 1.64%(1)(4) | | | 9,986 | | | | 9,986 | |
Morgan Stanley Institutional Liquidity Funds — Government Portfolio — Institutional Class, 1.66%(1)(4) | | | 9,986 | | | | 9,986 | |
| | | | | | | | |
Total Short-Term Investments — Investment Companies (Cost $39,943) | | | | | | $ | 39,943 | |
| | | | | | | | |
Total Investments — 125.3% (Cost $180,041,431) | | | | | | $ | 193,377,091 | |
Written Options(5) — 0.0% (Premiums received $40,436) | | | | | | | (21,350 | ) |
Liabilities in Excess of Other Assets — (25.3%) | | | | | | | (38,990,111 | ) |
| | | | | | | | |
Net Assets Applicable to Common Stockholders — 100.0% | | | | | | $ | 154,365,630 | |
| | | | | | | | |
| (1) | All or a portion of these securities are held as collateral pursuant to the loan agreements. |
| (2) | Restricted security. Fair valued by the Adviser using the Fund’s valuation procedures and subsequently ratified by the Board of Trustees. The position was acquired on October 7, 2016 at $1,000,000 and the fair value accounted for 0.57% of the Fund’s net assets as of May 31, 2018. |
| (3) | Securities purchased pursuant to Rule 144A of the Securities Act of 1933, as amended, and may be sold only to dealers in that program or other “qualified institutional buyers.” These securities have been deemed to be liquid by the Fund’s adviser under the supervision of the Board of Directors. As of May 31, 2018, the value of these investments was $14,633,250 or 9.48% of total net assets. |
| (4) | Rate reported is the current yield as of May 31, 2018. |
| | | | | | | | | | | | | | | | | | | | | | | | | | | | | | |
| (5) | | Description | | Exercise
Price | | | Expiration
Date | | | Currency | | | Number of
Contracts | | | Premiums
Received | | | Fair
Value | | | Unrealized
Appreciation
(Depreciation) | |
| | Suncor Energy, Inc., Call Option | | $ | 42.00 | | | | 6/15/2018 | | | | USD | | | | 200 | | | $ | 13,592 | | | $ | 2,600 | | | $ | 10,992 | |
| | Valero Energy Corporation, Call Option | | $ | 125.00 | | | | 6/15/2015 | | | | USD | | | | 150 | | | $ | 26,844 | | | $ | 18,750 | | | $ | 8,094 | |
| | | | | | | | | | | | | | | | | | | | | | | | | | | | | | |
| | | | | | | | | | | | | | | | | | | | $ | 40,436 | | | $ | 21,350 | | | $ | 19,086 | |
| | | | | | | | | | | | | | | | | | | | | | | | | | | | | | |
See Accompanying Notes to the Financial Statements.
9
The Cushing® Renaissance Fund
Statement of Assets & Liabilities (Unaudited)
May 31, 2018
| | | | |
Assets | | | | |
Investments, at fair value (cost $180,041,431) | | $ | 193,377,091 | |
Interest receivable | | | 1,008,865 | |
Receivable for investments sold | | | 2,826,410 | |
Distributions and dividends receivable | | | 663,681 | |
Prepaid expenses | | | 92,026 | |
Other assets | | | 33,424 | |
| | | | |
Total assets | | | 198,001,497 | |
| | | | |
Liabilities | | | | |
Written options, at fair value (premiums $40,436) | | | 21,350 | |
Payable to Adviser | | | 212,332 | |
Distributions and dividends payable | | | 7,287 | |
Payable for investments purchased | | | 2,302,281 | |
Short-term borrowings | | | 40,956,007 | |
Accrued interest expense | | | 3,414 | |
Accrued expenses and other liabilities | | | 133,196 | |
| | | | |
Total liabilities | | | 43,635,867 | |
| | | | |
Net assets applicable to common stockholders | | $ | 154,365,630 | |
| | | | |
Components of Net Assets | | | | |
Capital stock, $0.001 par value; 7,805,143 shares issued and outstanding (unlimited shares authorized) | | $ | 7,805 | |
Additional paid-in capital | | | 138,079,215 | |
Distributions in excess of net investment income | | | (1,029,940 | ) |
Accumulated realized gain | | | 3,953,816 | |
Net unrealized appreciation on investments | | | 13,335,648 | |
Net unrealized appreciation on options | | | 19,086 | |
| | | | |
Net assets applicable to common stockholders | | $ | 154,365,630 | |
| | | | |
Net asset value per common share outstanding (net assets applicable to common shares divided by common shares outstanding) | | $ | 19.78 | |
| | | | |
See Accompanying Notes to the Financial Statements.
10
The Cushing® Renaissance Fund
Statement of Operations (Unaudited)
Period from December 1, 2017 through May 31, 2018
| | | | |
Investment Income | | | | |
Distributions and dividends received, net of foreign taxes withheld of $48,459 | | $ | 3,635,731 | |
Less: return of capital on distributions | | | (2,168,448 | ) |
| | | | |
Distribution and dividend income | | | 1,467,283 | |
Interest income | | | 1,385,113 | |
Other income | | | 5,475 | |
| | | | |
Total Investment Income | | | 2,857,871 | |
| | | | |
Expenses | | | | |
Adviser fees | | | 1,009,564 | |
Professional fees | | | 72,790 | |
Administrator fees | | | 63,827 | |
Trustees’ fees | | | 31,740 | |
Reports to stockholders | | | 27,914 | |
Registration fees | | | 21,920 | |
Insurance expense | | | 17,490 | |
Transfer agent fees | | | 8,960 | |
Custodian fees and expenses | | | 3,354 | |
Fund accounting fees | | | 1,526 | |
| | | | |
Total Expenses before Interest Expense | | | 1,259,085 | |
| | | | |
Interest expense | | | 430,230 | |
| | | | |
Net Expenses | | | 1,689,315 | |
| | | | |
Net Investment Income | | | 1,168,556 | |
| | | | |
Realized and Unrealized Gain (Loss) on Investments | | | | |
Net realized gain on investments | | | 11,995,367 | |
Net realized gain on options | | | 200,770 | |
| | | | |
Net realized gain on investments | | | 12,196,137 | |
Net change in unrealized appreciation of investments | | | 1,650,415 | |
Net change in unrealized appreciation of options | | | 19,086 | |
| | | | |
Net change in unrealized appreciation of investments | | | 1,669,501 | |
| | | | |
Net Realized and Unrealized Gain on Investments | | | 13,865,638 | |
| | | | |
Net Increase in Net Assets Applicable to Common Stockholders Resulting from Operations | | $ | 15,034,194 | |
| | | | |
See Accompanying Notes to the Financial Statements.
11
The Cushing® Renaissance Fund
Statements of Changes in Net Assets
| | | | | | | | |
| | | Period From
December 1, 2017
through
May 31, 2018 | | | Fiscal
Year Ended
November 30,
2017 | |
| | | (Unaudited) | | | | |
Operations | | | | | | | | |
Net investment income | | $ | 1,168,556 | | | $ | 2,347,617 | |
Net realized gain on investments | | | 12,196,137 | | | | 7,472,498 | |
Net change in unrealized appreciation of investments | | | 1,669,501 | | | | 2,983,673 | |
| | | | | | | | |
Net increase in net assets applicable to common stockholders resulting from operations | | | 15,034,194 | | | | 12,803,788 | |
| | | | | | | | |
Distributions and Dividends to Common Stockholders | | | | | | | | |
Net investment income | | | (1,333,704 | ) | | | (2,530,809 | ) |
Return of capital | | | (4,001,112 | ) | | | (7,214,964 | ) |
| | | | | | | | |
Total distributions and dividends to common stockholders | | | (5,334,816 | ) | | | (9,745,773 | ) |
| | | | | | | | |
Capital Share Transactions | | | | | | | | |
Proceeds from issuance of 1,951,286 and 0 common shares in connection with exercising a rights offering, respectively | | | 27,758,598 | | | | — | |
Common shares purchased under the share repurchase plan 0 and (200,331)(1), respectively | | | — | | | | (3,719,755 | ) |
| | | | | | | | |
Total increase (decrease) in net assets applicable to common stockholders | | | 37,457,976 | | | | (661,740 | ) |
Net Assets | | | | | | | | |
Beginning of period | | | 116,907,654 | | | | 117,569,394 | |
| | | | | | | | |
End of period | | $ | 154,365,630 | | | $ | 116,907,654 | |
| | | | | | | | |
Distributions in excess of net investment income at the end of the period | | $ | (1,029,940 | ) | | $ | (1,469,411 | ) |
| | | | | | | | |
| (1) | The weighted average discount per share between cost of repurchase and the net asset value applicable to such shares at date of repurchase was 7.25%. |
See Accompanying Notes to the Financial Statements.
12
The Cushing® Renaissance Fund
Statement of Cash Flows (Unaudited)
Period From December 1, 2017 through May 31, 2018
| | | | |
Operating Activities | | | | |
Net Increase in Net Assets Applicable to Common Stockholders Resulting from Operations | | $ | 15,034,194 | |
Adjustments to reconcile net increase in the net assets applicable to common stockholders to net cash used in operating activities | | | | |
Net change in unrealized appreciation of investments | | | (1,669,513 | ) |
Purchases of investments | | | (114,557,783 | ) |
Proceeds from sales of investments | | | 61,123,222 | |
Proceeds from option transactions, net | | | 10,252,765 | |
Return of capital on distributions and dividends | | | 2,168,448 | |
Net realized gain on sales of investments | | | (12,196,133 | ) |
Purchases of short-term investments, net | | | (8,101 | ) |
Net accretion/amortization of senior notes’ premiums/discounts | | | (25,813 | ) |
Changes in operating assets and liabilities | | | | |
Receivable for investments sold | | | (2,294,847 | ) |
Distributions and dividends receivable | | | (231,240 | ) |
Interest receivable | | | (430,177 | ) |
Prepaid expenses | | | 11,249 | |
Payable to Adviser | | | 71,087 | |
Distributions and dividends payable | | | 7,287 | |
Payable for investments purchased | | | 2,302,281 | |
Accrued interest expense | | | 1,902 | |
Accrued expenses and other liabilities | | | 17,390 | |
| | | | |
Net cash used in operating activities | | | (40,423,782 | ) |
| | | | |
Financing Activities | | | | |
Proceeds from borrowing facility | | | 36,100,000 | |
Repayment of borrowing facility | | | (18,100,000 | ) |
Proceeds from rights offering | | | 27,758,598 | |
Distributions and dividends paid to common stockholders | | | (5,334,816 | ) |
| | | | |
Net cash provided by in financing activities | | | 40,423,782 | |
| | | | |
Increase in Cash and Cash Equivalents | | | — | |
| |
Cash and Cash Equivalents: | | | | |
Beginning of period | | | — | |
| | | | |
End of period | | $ | — | |
| | | | |
Supplemental Disclosure of Cash Flow and Non-Cash Information | | | | |
Interest Paid | | $ | 426,816 | |
See Accompanying Notes to the Financial Statements.
13
The Cushing® Renaissance Fund
Financial Highlights
| | | | | | | | | | | | | | | | | | | | | | | | |
| | | Period From
December 1,
2017
through
May 31, 2018 | | | Fiscal
Year Ended
November 30,
2017 | | | Fiscal
Year Ended
November 30,
2016 | | | Fiscal
Year Ended
November 30,
2015 | | | Fiscal
Year Ended
November 30,
2014 | | | Fiscal
Year Ended
November 30,
2013 | |
| | | (Unaudited) | | | | | | | | | | | | | | | | |
Per Common Share Data(1) | | | | | | | | | | | | | | | | | | | | | | | | |
Net Asset Value, beginning of period | | $ | 19.97 | | | $ | 19.42 | | | $ | 19.58 | | | $ | 25.78 | | | $ | 27.46 | | | $ | 23.76 | |
Income from Investment Operations: | | | | | | | | | | | | | | | | | | | | | | | | |
Net investment income (loss) | | | 0.19 | | | | (0.11 | ) | | | (0.01 | ) | | | 0.58 | | | | 0.53 | | | | 0.72 | |
Net realized and unrealized gain (loss) on investments | | | 0.44 | | | | 2.30 | | | | 1.49 | | | | (5.14 | ) | | | (0.57 | ) | | | 4.46 | |
| | | | | | | | | | | | | | | | | | | | | | | | |
Total increase (decrease) from investment operations | | | 0.63 | | | | 2.19 | | | | 1.48 | | | | (4.56 | ) | | | (0.04 | ) | | | 5.18 | |
| | | | | | | | | | | | | | | | | | | | | | | | |
Less Distributions to Common Stockholders: | | | | | | | | | | | | | | | | | | | | | | | | |
Net investment income (loss) | | | (0.20 | ) | | | (0.43 | ) | | | (0.54 | ) | | | (0.51 | ) | | | (0.38 | ) | | | (0.35 | ) |
Net realized gain | | | — | | | | — | | | | — | | | | — | | | | (0.41 | ) | | | (1.13 | ) |
Return of capital | | | (0.62 | ) | | | (1.21 | ) | | | (1.10 | ) | | | (1.13 | ) | | | (0.85 | ) | | | — | |
| | | | | | | | | | | | | | | | | | | | | | | | |
Total distributions to common stockholders | | | (0.82 | ) | | | (1.64 | ) | | | (1.64 | ) | | | (1.64 | ) | | | (1.64 | ) | | | (1.48 | ) |
| | | | | | | | | | | | | | | | | | | | | | | | |
Net Asset Value, end of period | | $ | 19.78 | | | $ | 19.97 | | | $ | 19.42 | | | $ | 19.58 | | | $ | 25.78 | | | $ | 27.46 | |
| | | | | | | | | | | | | | | | | | | | | | | | |
Per common share fair value, end of period | | $ | 17.92 | | | $ | 18.83 | | | $ | 17.49 | | | $ | 15.75 | | | $ | 23.51 | | | $ | 24.30 | |
| | | | | | | | | | | | | | | | | | | | | | | | |
Total Investment Return Based on Fair Value(2) | | | (0.45 | )% | | | 17.70 | % | | | 24.19 | % | | | (27.15 | )% | | | 2.85 | % | | | 10.47 | % |
| | | | | | | | | | | | | | | | | | | | | | | | |
See Accompanying Notes to the Financial Statements.
14
The Cushing® Renaissance Fund
Financial Highlights — (Continued)
| | | | | | | | | | | | | | | | | | | | | | | | |
| | | Period From
December 1,
2017
through
May 31, 2018 | | | Fiscal
Year Ended
November 30,
2017 | | | Fiscal
Year Ended
November 30,
2016 | | | Fiscal
Year Ended
November 30,
2015 | | | Fiscal
Year Ended
November 30,
2014 | | | Fiscal
Year Ended
November 30,
2013 | |
| | | (Unaudited) | | | | | | | | | | | | | | | | |
Supplemental Data and Ratios | | | | | | | | | | | | | | | | | | | | | | | | |
Net assets applicable to common stockholders, end of period (000’s) | | $ | 154,366 | | | $ | 116,908 | | | $ | 117,569 | | | $ | 118,568 | | | $ | 156,094 | | | $ | 166,240 | |
Ratio of expenses to average net assets after waiver(3) | | | 2.59 | % | | | 2.49 | % | | | 1.99 | % | | | 1.95 | % | | | 1.95 | % | | | 1.75 | % |
Ratio of net investment income to average net assets before waiver(3) | | | 1.79 | % | | | 2.04 | % | | | 3.43 | % | | | 2.53 | % | | | 1.81 | % | | | 1.13 | % |
Ratio of net investment income to average net assets after waiver(3) | | | 1.79 | % | | | 2.04 | % | | | 3.43 | % | | | 2.53 | % | | | 1.81 | % | | | 1.37 | % |
Portfolio turnover rate | | | 38.38 | %(4) | | | 96.21 | % | | | 226.71 | % | | | 101.17 | % | | | 26.08 | % | | | 87.61 | % |
Total borrowings outstanding (in thousands) | | $ | 40,956 | | | $ | 22,956 | | | $ | 10,456 | | | $ | 7,321 | | | $ | 24,172 | | | $ | 24,659 | |
Asset coverage, per $1,000 of indebtedness(5) | | $ | 4,769 | | | $ | 6,093 | | | $ | 12,244 | | | $ | 17,196 | | | $ | 7,458 | | | $ | 7,742 | |
| (1) | Information presented relates to a share of common stock outstanding for the entire period. |
| (2) | Not annualized. Total investment return is calculated assuming a purchase of common stock at the initial public offering price and a sale at the closing price on the last day of the fiscal year reported. The calculation also assumes reinvestment of dividends at actual prices pursuant to the Fund’s dividend reinvestment plan. Total investment return does not reflect brokerage commissions. |
| (3) | The ratio of expenses to average net assets before waiver was 2.59, 2.49%, 1.99%, 1.95%, 1.96%, and 1.99% for the period ended May 31, 2018, and the fiscal years ended November 30, 2017, 2016, 2015, 2014, and 2013, respectively. |
| (5) | Calculated by subtracting the Fund’s total liabilities (not including borrowings) from the Fund’s total assets and dividing by the total borrowings. |
See Accompanying Notes to the Financial Statements.
15
The Cushing® Renaissance Fund
Notes to Financial Statements (Unaudited)
May 31, 2018
1. Organization
The Cushing® Renaissance Fund (the “Fund”) was formed as a Delaware statutory trust on November 16, 2010, and is registered as a non-diversified, closed-end management investment company under the Investment Company Act of 1940, as amended. The Fund is managed by Cushing® Asset Management, LP (“Adviser”). The Fund’s investment objective is to seek a high total return with an emphasis on current income. The Fund commenced operations on September 25, 2012. The Fund’s shares are listed on the New York Stock Exchange under the symbol “SZC.”
2. Significant Accounting Policies
A. Use of Estimates
The following is a summary of significant accounting policies, consistently followed by the Fund in preparation of the financial statements. The Fund is considered an investment company and accordingly, follows the investment company accounting and reporting guidance of the Financial Accounting Standards Board Accounting Standard Codification Topic 946, Financial Services - Investment Companies, which is part of U.S. Generally Accepted Accounting Principles (“U.S. GAAP”).
The preparation of financial statements in conformity with U.S. GAAP requires management to make estimates and assumptions that affect the reported amount of assets and liabilities, recognition of distribution income and disclosure of contingent assets and liabilities at the date of the financial statements. Actual results could differ from those estimates.
B. Investment Valuation
The Fund uses the following valuation methods to determine fair value as either fair value for investments for which market quotations are available, or if not available, the fair value, as determined in good faith pursuant to such policies and procedures as may be approved by the Fund’s Board of Trustees (“Board of Trustees”) from time to time. The valuation of the portfolio securities of the Fund currently includes the following processes:
(i) The market value of each security listed or traded on any recognized securities exchange or automated quotation system will be the last reported sale price at the relevant valuation date on the composite tape or on the principal exchange on which such security is traded except those listed on the NASDAQ Global Market®, NASDAQ Global Select Market® and the NASDAQ Capital Market® exchanges (collectively, “NASDAQ”). Securities traded on NASDAQ will be valued at the NASDAQ official closing price. If no sale is reported on that date, the closing price from the prior day may be used.
(ii) Listed options on debt securities are valued at the last sale price, or if there are no trades for the day, the mean of the bid price and the ask price. Unlisted options on debt or equity securities are valued based upon their composite bid prices if held long, or their composite ask prices if held short. Futures are valued at the settlement price. Premiums for the sale of options written by the Fund will be included in the assets of the Fund, and the market value of such options will be included as a liability.
(iii) The Fund’s non-marketable investments will generally be valued in such manner as the Adviser determines in good faith to reflect their fair values under procedures established by, and under the general supervision and responsibility of, the Board of Trustees. The pricing of all
16
assets that are fair valued in this manner will be subsequently reported to and ratified by the Board of Trustees.
The Fund may engage in short sale transactions. For financial statement purposes, an amount equal to the settlement amount, if any, is included in the Statement of Assets and Liabilities as a liability. The amount of the liability is subsequently marked-to-market to reflect the fair value of the short positions. Subsequent fluctuations in market prices of securities sold short may require purchasing the securities at prices which may differ from the fair value reflected on the Statement of Assets and Liabilities. When the Fund sells a security short, it must borrow the security sold short and deliver it to the broker-dealer through which it made the short sale. A gain, limited to the price at which the Fund sold the security short, or a loss, unlimited in size, will be recognized under the termination of a short sale. The Fund is also subject to the risk that it may be unable to reacquire a security to terminate a short position except at a price substantially in excess of the last quoted price. The Fund is liable for any distributions and dividends (collectively referred to as “Distributions”) paid on securities sold short and such amounts, if any, would be reflected as Distribution expense in the Statement of Operations. The Fund’s obligation to replace the borrowed security will be secured by collateral deposited with the broker-dealer. The Fund also will be required to segregate similar collateral to the extent, if any, necessary so that the value of both collateral amounts in the aggregate is at all times equal to at least 100% of the current fair value of the securities sold short. The Fund did not hold any securities sold short as of May 31, 2018.
C. Security Transactions, Investment Income and Expenses
Security transactions are accounted for on the date the securities are purchased or sold (trade date). Realized gains and losses are reported on a specific identified cost basis. Interest income is recognized on an accrual basis, including amortization of premiums and accretion of discounts. Distributions are recorded on the ex-dividend date. Distributions received from the Fund’s investments in master limited partnerships (“MLPs”) generally are comprised of ordinary income, capital gains and return of capital. The Fund records investment income on the ex-date of the Distributions. For financial statement purposes, the Fund uses return of capital and income estimates to allocate the Distribution income received. Such estimates are based on historical information available from each MLP and other industry sources. These estimates may subsequently be revised based on information received from the MLPs after their tax reporting periods are concluded, as the actual character of these Distributions is not known until after the fiscal year end of the Fund.
The Fund estimates the allocation of investment income and return of capital for the Distributions received from its portfolio investments within the Statement of Operations. For the period ended May 31, 2018, the Fund has estimated approximately 60% of the Distributions from its portfolio investments to be return of capital.
Expenses are recorded on an accrual basis.
D. Distributions to Stockholders
Distributions to common stockholders are recorded on the ex-dividend date. The character of Distributions to common stockholders made during the period may differ from their ultimate characterization for federal income tax purposes. For the period ended May 31, 2018, the Fund’s Distributions were expected to be 75% return of capital. For Federal income tax purposes, Distributions of short-term capital gains are treated as ordinary income distributions. In addition, on an annual basis, the Fund may distribute additional capital gains in the last calendar quarter, if necessary, to meet minimum distribution requirements and thus avoid being subject to excise taxes. The final character of Distributions paid for the period ended May 31, 2018 will be determined in early 2019.
17
E. Federal Income Taxation
The Fund intends to qualify each year for special tax treatment afforded to a regulated investment company (“RIC”) under Subchapter M of the Internal Revenue Code of 1986, as amended (“IRC”). In order to qualify as a RIC, the Fund must, among other things, satisfy income, asset diversification and distribution requirements. As long as it so qualifies, the Fund will not be subject to U.S. federal income tax to the extent that it distributes annually its investment company taxable income (which includes ordinary income and the excess of net short-term capital gain over net long-term capital loss) and its “net capital gain” (i.e., the excess of net long-term capital gain over net short-term capital loss). The Fund intends to distribute at least annually substantially all of such income and gain. If the Fund retains any investment company taxable income or net capital gain, it will be subject to U.S. federal income tax on the retained amount at regular corporate tax rates. In addition, if the Fund fails to qualify as a RIC for any taxable year, it will be subject to U.S. federal income tax on all of its income and gains at regular corporate tax rates.
The Fund recognizes in the financial statements the impact of a tax position, if that position is more-likely-than-not to be sustained on examination by the taxing authorities, based on the technical merits of the position. Tax benefits resulting from such a position are measured as the amount that has a greater than fifty percent likelihood on a cumulative basis to be sustained on examination.
F. Cash and Cash Equivalents
The Fund considers all highly liquid investments purchased with initial maturity equal to or less than three months to be cash equivalents.
G. Cash Flow Information
The Fund makes Distributions from investments, which include the amount received as cash distributions from MLPs, common stock dividends and interest payments. These activities are reported in the Statement of Changes in Net Assets, and additional information on cash receipts and payments is presented in the Statement of Cash Flows.
H. Indemnification
Under the Fund’s organizational documents, its officers and trustees are indemnified against certain liabilities arising out of the performance of their duties to the Fund. In addition, in the normal course of business, the Fund may enter into contracts that provide general indemnification to other parties. The Fund’s maximum exposure under such indemnification arrangements is unknown, as this would involve future claims that may be made against the Fund that have not yet occurred, and may not occur. However, the Fund has not had prior claims or losses pursuant to these contracts and expects the risk of loss to be remote.
I. Derivative Financial Instruments
The Fund provides disclosure regarding derivatives and hedging activity to allow investors to understand how and why the Fund uses derivatives, how derivatives are accounted for, and how derivative instruments affect the Fund’s results of operations and financial position.
The Fund occasionally purchases and sells (“writes”) put and call equity options as a source of potential protection against a broad market decline. A purchaser of a put option has the right, but not the obligation, to sell the underlying instrument at an agreed upon price (“strike price”) to the option seller. A purchaser of a call option has the right, but not the obligation, to purchase the underlying instrument at the strike price from the option seller. Options are settled for cash.
Purchased Options — Premiums paid by the Fund for purchased options are included in the Statement of Assets and Liabilities as an investment. The option is adjusted daily to reflect the fair value of the option and any change in fair value is recorded as unrealized appreciation or depreciation of investments. If the option is allowed to expire, the Fund will lose the entire premium paid and record a
18
realized loss for the premium amount. Premiums paid for purchased options which are exercised or closed are added to the amounts paid or offset against the proceeds on the underlying investment transaction to determine the realized gain/loss or cost basis of the security.
Written Options — Premiums received by the Fund for written options are included in the Statement of Assets and Liabilities. The amount of the liability is adjusted daily to reflect the fair value of the written option and any change in fair value is recorded as unrealized appreciation or depreciation of investments. Premiums received from written options that expire are treated as realized gains. The Fund records a realized gain or loss on written options based on whether the cost of the closing transaction exceeds the premium received. If a call option is exercised by the option buyer, the premium received by the Fund is added to the proceeds from the sale of the underlying security to the option buyer and compared to the cost of the closing transaction to determine whether there has been a realized gain or loss. If a put option is exercised by an option buyer, the premium received by the option seller reduces the cost basis of the purchased security.
Written uncovered call options subject the Fund to unlimited risk of loss. Written covered call options limit the upside potential of a security above the strike price. Put options written subject the Fund to risk of loss if the value of the security declines below the exercise price minus the put premium.
The Fund is not subject to credit risk on written options as the counterparty has already performed its obligation by paying the premium at the inception of the contract.
The Fund has adopted the disclosure provisions of Financial Accounting Standards Board (“FASB”) Accounting Standard Codification 815, Derivatives and Hedging (“ASC 815”). ASC 815 requires enhanced disclosures about the Fund’s use of and accounting for derivative instruments and the effect of derivative instruments on the Fund’s results of operations and financial position. Tabular disclosure regarding derivative fair value and gain/loss by contract type (e.g., interest rate contracts, foreign exchange contracts, credit contracts, etc.) is required and derivatives accounted for as hedging instruments under ASC 815 must be disclosed separately from those that do not qualify for hedge accounting. Even though the Fund may use derivatives in an attempt to achieve an economic hedge, the Fund’s derivatives are not accounted for as hedging instruments under ASC 815 because investment companies account for their derivatives at fair value and record any changes in fair value in current period earnings.
There were no transactions in purchased options during the period ended May 31, 2018.
The average monthly fair value of written options during the period ended May 31, 2018 was $35,355.
The effect of derivative instruments on the Statement of Operations for the period ended May 31, 2018:
| | | | | | | | | | | | |
Amount of Realized Gain or (Loss) on Derivatives Recognized in Income | |
Derivatives not accounted for as hedging instruments under ASC 815 | | Purchased
Options | | | Written
Options | | | Total | |
Equity Contracts | | $ | — | | | $ | 200,770 | | | $ | 200,770 | |
| | | | | | | | | | | | |
|
Amount of Unrealized Appreciation (Depreciation) on Derivatives Recognized in Income | |
Derivatives not accounted for as hedging instruments under ASC 815 | | Purchased
Options | | | Written
Options | | | Total | |
Equity Contracts | | $ | — | | | $ | 19,086 | | | $ | 19,086 | |
| | | | | | | | | | | | |
| | | | | | | | |
Liability Derivatives | |
Risk Exposure Category | | Statement of Assets & Liabilities
Location | | | Fair Value | |
Equity Contracts | | | Written options, at fair value | | | $ | 21,350 | |
| | | | | | | | |
19
3. Concentrations of Risk
The Fund, under normal market conditions, invests at least 80% of its assets (net assets plus any borrowings for investment purposes) in a portfolio of (i) companies across the energy supply chain spectrum, including upstream, midstream and downstream energy companies, as well as oil and gas services companies, (ii) energy-intensive chemical, metal and industrial and manufacturing companies and engineering and construction companies that the Adviser expects to benefit from growing energy production and lower feedstock costs relative to global costs and, (iii) transportation and logistics companies providing solutions to the U.S. manufacturing industry. Therefore, the Fund may be subject to more risks than if they were more broadly diversified over numerous industries and sectors of the economy. General changes in market sentiment towards companies in the sectors in which they invest may adversely affect the Fund, and the performance of such sectors may lag behind the broader market as a whole.
The Fund is also subject to MLP structure risk. Holders of MLP units are subject to certain risks inherent in the structure of MLPs, including (i) tax risks, (ii) the limited ability to elect or remove management or the general partner or managing member, (iii) limited voting rights, except with respect to extraordinary transactions, and (iv) conflicts of interest between the general partner or managing member and its affiliates, on the one hand, and the limited partners or members, on the other hand, including those arising from incentive distribution payments or corporate opportunities.
4. Agreements and Related Party Transactions
The Fund has entered into an Investment Management Agreement with the Adviser (the “Agreement”). Under the terms of the Agreement, the Fund has agreed to pay the Adviser a fee payable at the end of each calendar month, at an annual rate equal to 1.25% of the average weekly value of the Fund’s Managed Assets during such month. The Adviser earned $1,009,564 in advisory fees for the period ended May 31, 2018.
The Fund has engaged U.S. Bancorp Fund Services, LLC to serve as the Fund’s administrator. The Fund pays the administrator a monthly fee computed at an annual rate of 0.09% of the first $100,000,000 of the Fund’s average daily net assets, 0.07% on the next $200,000,000 of average daily net assets and 0.04% on the balance of the Fund’s average daily net assets, with a minimum annual fee of $70,000.
U.S. Bancorp Fund Services, LLC serves as the Fund’s transfer agent, dividend paying agent, and agent for the automatic dividend reinvestment plan.
U.S. Bank, N.A. serves as the Fund’s custodian. The Fund pays the custodian a monthly fee computed at an annual rate of 0.004% of the Fund’s average daily market value, with a minimum annual fee of $4,800.
Fees paid to trustees for their services to the Fund are reflected as Trustees’ fees on the Statement of Operations.
5. Income Taxes
It is the Fund’s intention to continue to qualify as a RIC under Subchapter M of the IRC and distribute all of its taxable income. Accordingly, no provision for federal income taxes is required in its financial statements.
The amount and character of income and capital gain distributions to be paid, if any, are determined in accordance with federal income tax regulations, which may differ from U.S. generally accepted accounting principles. These differences are primarily due to differences in the timing of recognition of gains or losses on investments. Permanent book and tax basis differences resulted in the reclassifications of -$421,427 from accumulated net investment income, $325,658 to accumulated net realized loss and $95,769 to additional paid-in capital.
20
The following information is provided on a tax basis as of November 30, 2017:
| | | | |
Cost of investments | | $ | 125,799,866 | |
| | | | |
Gross unrealized appreciation | | $ | 19,264,733 | |
Gross unrealized depreciation | | | (7,917,833 | ) |
| | | | |
Net unrealized appreciation | | | 11,346,900 | |
Undistributed ordinary income | | | — | |
Undistributed long-term gains | | | — | |
Other accumulated losses | | | (8,768,780 | ) |
| | | | |
Total accumulated gains | | $ | 2,578,120 | |
| | | | |
As of November 30, 2017, for federal income tax purposes, capital loss carryforwards of $8,463,718 were available as shown in the table below, to the extent provided by the regulations to offset future realized gains of the Fund through the years indicated.
| | | | |
Capital Loss Available Through | | Short-Term Capital
Loss Amount | | Long-Term Capital
Loss Amount |
| Unlimited | | $8,463,718 | | $— |
The Fund recognizes the tax benefits of uncertain tax positions only where the position is “more likely than not” to be sustained assuming examination by tax authorities. Management has analyzed the Fund’s tax positions, and has concluded that no liability for unrecognized tax benefits should be recorded related to uncertain tax positions taken on U.S. tax returns and state tax returns filed since inception of the Fund. No income tax returns are currently under examination. All tax years beginning with November 30, 2014 remain subject to examination by the tax authorities in the United States. Due to the nature of the Fund’s investments, the Fund may be required to file income tax returns in several states. The Fund is not aware of any tax positions for which it is reasonably possible that the total amounts of unrecognized tax benefits will change materially in the next 12 months.
6. Fair Value Measurements
Various inputs that are used in determining the fair value of the Fund’s investments are summarized in the three broad levels listed below:
| | • | | Level 1 — quoted prices in active markets for identical securities |
| | • | | Level 2 — other significant observable inputs (including quoted prices for similar securities, interest rates, prepayment speeds, credit risk, etc.) |
| | • | | Level 3 — significant unobservable inputs (including the Fund’s own assumptions in determining the fair value of investments) |
The inputs or methodology used for valuing securities are not necessarily an indication of the risk associated with investing in those securities.
21
These inputs are summarized in the three broad levels listed below.
| | | | | | | | | | | | | | | | |
| | | | | | Fair Value Measurements at Reporting Date Using | |
Description | | Fair Value as of
May 31, 2018 | | | Quoted Prices in
Active Markets for
Identical Assets
(Level 1) | | | Significant Other
Observable
Inputs
(Level 2) | | | Significant
Unobservable
Inputs
(Level 3) | |
Assets | | | | | | | | | | | | | | | | |
Equity Securities | | | | | | | | | | | | | | | | |
Common Stock(a) | | $ | 92,559,314 | | | $ | 92,559,314 | | | $ | — | | | $ | — | |
Master Limited Partnerships and Related Companies(a) | | | 50,820,790 | | | | 49,937,070 | | | | 883,720 | | | | — | |
| | | | | | | | | | | | | | | | |
Total Equity Securities | | | 143,380,104 | | | | 142,496,384 | | | | 883,720 | | | | — | |
| | | | | | | | | | | | | | | | |
Notes | | | | | | | | | | | | | | | | |
Senior Notes(a) | | | 49,957,044 | | | | — | | | | 49,957,044 | | | | — | |
| | | | | | | | | | | | | | | | |
Other | | | | | | | | | | | | | | | | |
Short-Term Investments — Investment Companies(a) | | | 39,943 | | | | 39,943 | | | | — | | | | — | |
| | | | | | | | | | | | | | | | |
Total Assets | | $ | 193,377,091 | | | $ | 142,536,327 | | | $ | 50,840,764 | | | $ | — | |
| | | | | | | | | | | | | | | | |
| | | | |
Liabilities | | | | | | | | | | | | | | | | |
Written Options | | $ | 21,350 | | | $ | 21,350 | | | $ | — | | | $ | — | |
| | | | | | | | | | | | | | | | |
Total Liabilities | | $ | 21,350 | | | $ | 21,350 | | | $ | — | | | $ | — | |
| | | | | | | | | | | | | | | | |
| (a) | All other industry classifications are identified in the Schedule of Investments. The Fund did not hold Level 3 investments at any time during the period ended May 31, 2018. |
Transfers into and out of each level are measured at fair value as of the end of the fiscal year. There were no transfers between any levels during the period ended May 31, 2018.
7. Investment Transactions
For the period ended May 31, 2018, the Fund purchased (at cost) and sold securities (proceeds) in the amount of $114,557,783 and $61,123,222 (excluding short-term securities), respectively. The Fund sold written options (proceeds) and covered written options (at cost) in the amount of $9,870,815 and $381,950, respectively.
8. Common Stock
The Fund had unlimited shares of capital stock authorized and 7,805,143 shares outstanding as of May 31, 2018. Transactions in common stock for the fiscal years ended November 30, 2016 and November 30, 2017 were as follows:
| | | | |
Shares at November 30, 2016 | | | 6,054,188 | |
| | | | |
Repurchase of common shares | | | (200,331 | ) |
Shares at November 30, 2017 | | | 5,853,857 | |
| | | | |
Rights offering of common shares | | | 1,951,286 | |
Shares at May 31, 2018 | | | 7,805,143 | |
| | | | |
Beginning January 25, 2017 the Board of Trustees adopted procedures in connection with the purchases by the Fund of its own common shares of beneficial interest in open market transactions (“Share Repurchases”). The purposes of Share Repurchases is for the Fund to potentially take advantage of opportunities to purchase its outstanding common shares at significant discounts to net asset value,
22
while taking into consideration such factors as potential impact of Share Repurchases on the Fund’s expense ratio, trading volume, and asset coverage ratios. Between January 25, 2017 and November 30, 2017 the Fund repurchased a total of 200,331 shares for an average price of $18.57.
9. Borrowing Facilities
The Fund maintains a margin account arrangement with ScotiabankTM. The interest rate charged on margin borrowing is tied to the cost of funds for ScotiabankTM (which is LIBOR plus 1.00%). Proceeds from the margin account arrangement are used to execute the Fund’s investment objective.
The average principal balance and interest rate for during which the credit facilities were utilized during the period ended May 31, 2018 was approximately $30,922,216 and 2.72%, respectively. At May 31, 2018, the principal balance outstanding was $40,956,007 and accrued interest expense was $3,414.
10. Subsequent Events
Subsequent to May 31, 2018, the Fund declared distributions to common stockholders in the amount of $0.1367 per share, payable on June 29, 2018 and July 31, 2018, to stockholders of record on June 15, 2018 and July 16, 2018, respectively.
23
The Cushing® Renaissance Fund
Additional Information (Unaudited)
May 31, 2018
Investment Policies and Parameters
Previously, the Fund had stated an intention to generally invest in 20-40 issuers. The Fund’s Board of Trustees (the “Board”) has approved eliminating that policy. While the Fund initially expects to invest in a greater number of issuers, the Fund may in the future invest in fewer issuers. The Fund is a non-diversified, closed-end management investment company under the 1940 Act. Accordingly, the Fund may invest a greater portion of its assets in a more limited number of issuers than a diversified fund. An investment in the Fund may present greater risk to an investor than an investment in a diversified portfolio because changes in the financial condition or market assessment of a single issuer may cause greater fluctuations in the value of the Fund’s shares.
Effective as of November 21, 2013, the Board approved a revision of the Fund’s principal investment policies to clarify that, in addition to investments in companies across the entire supply chain spectrum, energy-intensive industrial and manufacturing companies and master limited partnerships, the Fund may invest in transportation and logistics companies providing solutions to the U.S. manufacturing industry.
The Commodity Futures Trading Commission (“CFTC”) amended Rule 4.5, which permits investment advisers to registered investment companies to claim an exclusion from the definition of commodity pool operator with respect to a fund provided certain requirements are met. In order to permit the Adviser to continue to claim this exclusion with respect to the Fund under the amended rule, the Fund limits its transactions in futures, options of futures and swaps (excluding transactions entered into for “bona fide hedging purposes,” as defined under CFTC regulations) such that either: (i) the aggregate initial margin and premiums required to establish its futures, options on futures and swaps do not exceed 5% of the liquidation value of the Fund’s portfolio, after taking into account unrealized profits and losses on such positions; or (ii) the aggregate net notional value of its futures, options on futures and swaps does not exceed 100% of the liquidation value of the Fund’s portfolio, after taking into account unrealized profits and losses on such positions. The Fund and the Adviser do not believe that complying with the amended rule will limit the Fund’s ability to use futures, options and swaps to the extent that it has used them in the past.
Trustee and Executive Officer Compensation
The Fund does not currently compensate any of its trustees who are interested persons or any of its officers. For the period ended
May 31, 2018, the aggregate compensation paid by the Fund to the independent trustees was $45,586. The Fund did not pay any special compensation to any of its trustees or officers. The Fund continuously monitors standard industry practices and this policy is subject to change.
Cautionary Note Regarding Forward-Looking Statements
This report contains “forward-looking statements” as defined under the U.S. federal securities laws. Generally, the words “believe,” “expect,” “intend,” “estimate,” “anticipate,” “project,” “will” and similar expressions identify forward-looking statements, which generally are not historical in nature. Forward-looking statements are subject to certain risks and uncertainties that could cause actual results to materially differ from the Fund’s historical experience and its present expectations or projections
24
indicated in any forward-looking statements. These risks include, but are not limited to, changes in economic and political conditions; regulatory and legal changes; energy industry risk; leverage risk; valuation risk; interest rate risk; tax risk; and other risks discussed in the Fund’s filings with the SEC. You should not place undue reliance on forward-looking statements, which speak only as of the date they are made. The Fund undertakes no obligation to update or revise any forward-looking statements made herein. There is no assurance that the Fund’s investment objective will be attained.
Proxy Voting Policies
A description of the policies and procedures that the Fund uses to determine how to vote proxies relating to portfolio securities owned by the Fund and information regarding how the Fund voted proxies relating to the portfolio of securities during the 12-month period ended June 30 are available to shareholders without charge, upon request by calling the Fund toll-free at (800)236-4424 and on the Fund’s website at www.cushingcef.com. Information regarding how the Fund voted proxies are also available to stockholders without charge on the SEC’s website at www.sec.gov.
Form N-Q
The Fund will file its complete schedule of portfolio holdings for the first and third quarters of each fiscal year with the SEC on Form N-Q. The Fund’s Form N-Q and statement of additional information are available without charge by visiting the SEC’s website at www.sec.gov. In addition, you may review and copy the Fund’s Form N-Q at the SEC’s Public Reference Room in Washington D.C. You may obtain information on the operation of the Public Reference Room by calling (800) SEC-0330.
Portfolio Turnover
The portfolio turnover rate for the period ended May 31, 2018 was 38.38%. Portfolio turnover may vary greatly from period to period. The Fund does not consider portfolio turnover rate a limiting factor in the Adviser’s execution of investment decisions, and the Fund may utilize investment and trading strategies that may involve high portfolio turnover. A higher portfolio turnover rate results in correspondingly greater brokerage commissions and other transactional expenses that are borne by the Fund.
Certifications
The Fund’s Chief Executive Officer has submitted to the New York Stock Exchange the annual CEO certification as required by Section 303A.12(a) of the NYSE Listed Fund Manual.
The Fund has filed with the SEC the certification of its Chief Executive Officer and Chief Financial Officer required by Section 302 of the Sarbanes-Oxley Act.
Tax Information
The Fund designated 100% of its ordinary income distribution for the year ended November 30, 2017 as qualified dividend income and 63% of the dividends paid from net ordinary income qualify for the dividends received deduction available to corporate stockholders.
Distribution and Dividend Reinvestment Plan
How the Plan Works
Unless the registered owner of common shares elects to receive cash by contacting the Plan Agent, all distributions and dividends (collectively referred to in this section as “dividends”) declared for your common shares of the Fund will be automatically reinvested by U.S. Bancorp Fund Services, LLC (the
25
“Plan Agent”), agent for stockholders in administering the Fund’s Dividend Reinvestment Plan (the “Plan”), in additional common shares of the Fund. The Plan Agent will open an account for each common stockholder under the Plan in the same name in which such common stockholder’s common shares are registered. Whenever the Fund declares a dividend payable in cash, non-participants in the Plan will receive cash and participants in the Plan will receive the equivalent in common shares. The common shares will be acquired by the Plan Agent for the participants’ accounts, depending upon the circumstances described below, either (i) through receipt of additional unissued but authorized common shares from the Fund (“newly-issued common shares”) or (ii) by purchase of outstanding common shares on the open market (“open-market purchases”) on the New York Stock Exchange or elsewhere.
If, on the payment date for any dividend, the market price per common share plus per share fees (which include any brokerage commissions the Plan Agent is required to pay) is greater than the net asset value per common share, the Plan Agent will invest the dividend amount in newly-issued common shares, including fractions, on behalf of the participants. The number of newly-issued common shares to be credited to each participant’s account will be determined by dividing the dollar amount of the dividend by the net asset value per common share on the payment date; provided that, if the net asset value per common share is less than 95% of the market price per common share on the payment date, the dollar amount of the dividend will be divided by 95% of the market price per common share on the payment date. If, on the payment date for any dividend, the net asset value per common share is greater than the market value per common share plus per share fees, the Plan Agent will invest the dividend amount in common shares acquired on behalf of the participants in open-market purchases.
Participation in the Plan
If a registered owner of common shares elects not to participate in the Plan, you will receive all dividends in cash paid by check mailed directly to you (or, if the shares are held in street or other nominee name, then to such nominee) by the Plan Agent, as dividend disbursing agent. You may elect not to participate in the Plan and to receive all dividends in cash by sending written or telephonic instructions to the Plan Agent, as dividend paying agent. Participation in the Plan is completely voluntary and may be terminated or resumed at any time without penalty by contacting the Plan Agent before the dividend record date; otherwise such termination or resumption will be effective with respect to any subsequently declared dividend or other distribution. Some brokers may automatically elect to receive cash on your behalf and may reinvest that cash in additional common shares of the Fund for you.
Plan Fees
There will be no per share fees with respect to common shares issued directly by the Fund. However, each participant will pay a pro rata share of brokerage commissions incurred in connection with open-market purchases. There is no direct service charge to participants in the Plan; however, the Fund reserves the right to amend the Plan to include a service charge payable by the participants.
Tax Implications
The automatic reinvestment of dividends will not relieve participants of any federal, state or local income tax that may be payable (or required to be withheld) on such dividends. Accordingly, any taxable dividend received by a participant that is reinvested in additional common shares will be subject to federal (and possibly state and local) income tax even though such participant will not receive a corresponding amount of cash with which to pay such taxes.
Contact Information
For more information about the plan you may contact the Plan Agent in writing at PO Box 708, Milwaukee, WI 53201-0701, by calling the Plan Agent at 1-800-662-7232.
26
Privacy Policy
In order to conduct its business, the Fund collects and maintains certain nonpublic personal information about its stockholders of record with respect to their transactions in shares of the Fund’s securities. This information includes the stockholder’s address, tax identification or Social Security number, share balances, and dividend elections. We do not collect or maintain personal information about stockholders whose share balances of our securities are held in “street name” by a financial institution such as a bank or broker.
We do not disclose any nonpublic personal information about you, the Fund’s other stockholders or the Fund’s former stockholders to third parties unless necessary to process a transaction, service an account, or as otherwise permitted by law.
To protect your personal information internally, we restrict access to nonpublic personal information about the Fund’s stockholders to those employees who need to know that information to provide services to our stockholders. We also maintain certain other safeguards to protect your nonpublic personal information.
Other Information For Stockholders
Notice is hereby given in accordance with Section 23(c) of the Investment Company Act of 1940, as amended, that the Fund from time to time may purchase its common shares of beneficial interest in the open market.
This report is sent to stockholders of The Cushing® Renaissance Fund for their information. It is not a prospectus, circular or representation intended for use in the purchase or sale of shares of the Fund or of any securities mentioned in this report.
The Fund does not make available copies of its Statement of Additional Information because the Fund’s shares are not continuously offered, which means that the Statement of Additional Information has not been updated after completion of the Fund’s initial public offering and the information contained in such Statement of Additional Information may have become outdated.
The Fund makes available performance and certain other on its website at www.cushingcef.com. Investors and others are advised to periodically check the website for updated performance information and the release of other material information about the Fund. This reference to the Fund’s website is intended to allow investors public access to information regarding the Fund and does not, and is not intended to, incorporate the Fund’s website in this report.
Stockholder Proxy Voting Results
The annual meeting of stockholders for the Fund was held on May 31, 2018. The matters considered at the meeting by the fund with the actual vote tabulations relating to such matters are as follows:
To elect Ms. Brenda A. Cline and Mr. Jerry V. Swank as Class II Trustees to hold office for a three-year term expiring the 2021 annual meeting, or until their successors are elected and duly qualified.
| | | | | | | | |
| | | Affirmative | | | Withheld | |
Brenda A. Cline | | | 6,869,569 | | | | 98,478 | |
Jerry V. Swank | | | 6,879,153 | | | | 88,894 | |
27
The Cushing® Renaissance Fund
Board Approval of Investment Management Agreement (Unaudited)
May 31, 2018
On May 31, 2018, the Board of Trustees of the Fund (members of which are referred to collectively as the “Trustees”) met in person to discuss, among other things, the approval of the Investment Management Agreement (the “Agreement”) between the Fund and Cushing Asset Management, LP (the “Adviser”).
Activities and Composition of the Board
The Board of Trustees is comprised of four Trustees, three of whom are not “interested persons,” as such term is defined in the Investment Company Act of 1940, as amended (the “1940 Act”), of the Fund (the “Independent Trustees”). The Trustees are responsible for oversight of the operations of the Fund and performs the various duties imposed by the 1940 Act on the trustees of investment companies. The Independent Trustees have retained independent legal counsel to assist them in connection with their duties. Prior to its consideration of the Agreement, the Trustees received and reviewed information provided by the Adviser. The Trustees also received and reviewed information responsive to requests from independent counsel to assist it in its consideration of the Agreement. Before the Trustees voted on the approval of the Agreement, the Independent Trustees met with independent legal counsel during executive session and discussed the Agreement and related information.
Consideration of Nature, Extent and Quality of the Services
The Trustees received and considered information regarding the nature, extent and quality of services provided to the Fund under the Agreement, including the Adviser’s Form ADV and other background materials supplied by the Adviser.
The Trustees reviewed and considered the Adviser’s investment advisory personnel, its history, and the amount of assets currently under management by the Adviser. The Trustees also reviewed the research and decision-making processes utilized by the Adviser, including the methods adopted to seek to achieve compliance with the investment objectives, policies and restrictions of the Fund.
The Trustees considered the background and experience of the Adviser’s management in connection with the Fund, including reviewing the qualifications, backgrounds and responsibilities of the management team members primarily responsible for the day-to-day portfolio management of the Fund and the extent of the resources devoted to research and analysis of the Fund’s actual and potential investments.
The Trustees also reviewed the Adviser’s conflict of interest policies, insider trading policies and procedures, and the Adviser’s Code of Ethics. The Trustees, including all of the Independent Trustees, concluded that the nature, extent and quality of services to be rendered by the Adviser under the Agreement were adequate.
Consideration of Advisory Fees and the Cost of the Services
The Trustees reviewed and considered the contractual annual advisory fee paid by the Fund to the Adviser in light of the extent, nature and quality of the advisory services to be provided by the Adviser to the Fund.
28
The Trustees considered the information they received comparing the Fund’s contractual annual advisory fee and overall expenses, to the extent available, with a peer group and universe of competitor closed-end funds determined by FUSE Research Network LLC (“FUSE”). The Trustees discussed the limited number of funds contained in many of the peer groups and universes and the general methodology used by FUSE in preparing its report.
Based on such information, the Trustees noted that the Fund’s peer group and the universe were very small, each consisting of only three funds, and that the Fund’s total net expense ratio of 2.01% and contractual advisory fee of 1.25% were the highest with respect to both its peer group and universe.
Consideration of Investment Performance
The Trustees regularly review the performance of the Fund throughout the year. The Trustees reviewed performance information provided by FUSE comparing the performance of the Fund against its universe over several time horizons, and using different performance metrics, including but not limited to the comparative performance of the Fund in terms of net asset value (“NAV”) and market price. The Trustees noted that the Fund’s performance among the three funds in the universe based on NAV was the highest for all periods and based on market price was the lowest for the three-month and one-year periods, and the highest for all longer periods.
Consideration of Comparable Accounts
The Trustees reviewed the other accounts and investment vehicles managed by the Adviser and discussed the similarities and differences between these accounts and the Fund.
The Trustees determined that, bearing in mind the limitations of comparing different types of managed accounts and the different levels of service typically associated with such accounts, the fee structures applicable to the Adviser’s other clients employing a comparable strategy to the Fund was not indicative of any unreasonableness with respect to the advisory fees proposed to be payable by the Fund.
Consideration of Profitability
The Trustees received and considered a profitability analysis prepared by the Adviser, using a template developed in consultation with counsel to the Independent Trustees, that set forth the fees payable by the Fund under the Agreement and the expenses incurred by the Adviser in connection with the operation of the Fund. The Trustees used this analysis to evaluate the fairness of the profits realized and anticipated to be realized by the Adviser with respect to the Fund.
It was noted that the management fee was calculated on the basis of the Fund’s managed assets, including the proceeds from leverage, rather than on unlevered assets. The Trustees determined that the Fund was profitable to the Adviser, and that the profit to the Adviser was not unreasonable.
Consideration of Economies of Scale
The Trustees considered whether economies of scale in the provision of services to the Fund had been or would be passed along to the shareholders under the Agreement. The Trustees determined there were no material economies of scale accruing to the Adviser in connection with its relationship with the Fund.
Consideration of Other Benefits
The Trustees reviewed and considered any other incidental benefits derived or to be derived by the Adviser from its relationship with the Fund, including but not limited to soft dollar arrangements. The
29
Trustees determined there were no material incidental benefits accruing to the Adviser in connection with its relationship with the Fund.
Conclusion
In approving the Agreement and the fees charged under the Agreement, the Trustees concluded that no single factor reviewed by the Trustees was identified by the Trustees to be determinative as the principal factor in whether to approve the Agreement. The summary set out above describes the most important factors, but not all matters, considered by the Trustees in coming to its decision regarding the Agreement. On the basis of such information as the Trustees considered necessary to the exercise of its reasonable business judgment and its evaluation of all of the factors described above, and after much discussion, the Trustees concluded that each factor they considered, in the context of all of the other factors they considered, favored approval of the Agreement. It was noted that it was the judgment of the Trustees that approval of the Agreement was consistent with the best interests of the Fund and its shareholders. A majority of the Trustees and, voting separately, a majority of the Independent Trustees, approved the Agreement.
30
The Cushing® Renaissance Fund
TRUSTEES
Brian R. Bruce
Brenda A. Cline
Ronald P. Trout
Jerry V. Swank
EXECUTIVE OFFICERS
Jerry V. Swank
Chief Executive Officer and President
John H. Alban
Chief Financial Officer and Treasurer
Barry Y. Greenberg
Chief Compliance Officer and Secretary
INVESTMENT ADVISER
Cushing® Asset Management, LP
8117 Preston Road, Suite 440
Dallas, TX 75225
ADMINISTRATOR
U.S. Bancorp Fund Services, LLC
615 East Michigan Street, 3rd Floor
Milwaukee, WI 53202
CUSTODIAN
U.S. Bank, N.A.
1555 N. River Center Drive, Suite 302
Milwaukee, WI 53212
TRANSFER AGENT
U.S. Bancorp Fund Services, LLC
615 East Michigan Street, 3rd Floor
Milwaukee, WI 53202
LEGAL COUNSEL
Skadden, Arps, Slate, Meagher & Flom LLP
Four Times Square
New York, NY 10036
INDEPENDENT
REGISTERED PUBLIC
ACCOUNTING FIRM
Ernst & Young LLP
2323 Victory Avenue, Suite 2000
Dallas, TX 75219
NOT FDIC INSURED | NOT BANK GUARANTEED | MAY LOSE VALUE
THE CUSHING® RENAISSANCE FUND
| | |

| | Investment Adviser Cushing® Asset Management, LP 8117 Preston Road Suite 440 Dallas, TX 75225 (214) 692-6334 (888) 777-2346 www.cushingcef.com www.cushingasset.com |
Item 2. Code of Ethics.
Not applicable for semi-annual reports.
Item 3. Audit Committee Financial Expert.
Not applicable for semi-annual reports.
Item 4. Principal Accountant Fees and Services.
Not applicable for semi-annual reports.
Item 5. Audit Committee of Listed Registrants.
Not applicable to registrants who are not listed issuers (as defined in Rule 10A-3 under the Securities Exchange Act of 1934).
Item 6. Investments.
| (a) | Schedule of Investments is included as part of the report to shareholders filed under Item 1 of this Form. |
Item 7. Disclosure of Proxy Voting Policies and Procedures for Closed-End Management Investment Companies.
Not applicable for semi-annual reports.
Item 8. Portfolio Managers of Closed-End Management Investment Companies.
Not applicable for semi-annual reports.
Item 9. Purchases of Equity Securities by Closed-End Management Investment Company and Affiliated Purchasers.
| | | | | | | | |
Period | | (a)
Total Number of
Shares (or Units) Purchased | | (b)
Average Price Paid
per Share (or Unit) | | (c)
Total Number of
Shares (or Units)
Purchased as Part
of Publicly
Announced Plans
or Programs | | (d)
Maximum Number
(or Approximate
Dollar Value) of
Shares (or Units)
that May Yet Be Purchased
Under
the Plans or
Programs |
Month #1 12/01/2017-12/31/2017 | | 0 | | 0 | | 0 | | 0 |
1
| | | | | | | | |
Month #2 01/01/2018-01/31/2018 | | 0 | | 0 | | 0 | | 0 |
Month #3 02/01/2018-02/28/2018 | | 0 | | 0 | | 0 | | 0 |
Month #4 03/01/2018-03/31/2018 | | 0 | | 0 | | 0 | | 0 |
Month #5 04/01/2018-04/30/2018 | | 0 | | 0 | | 0 | | 0 |
Month #6 05/01/2018-05/31/2018 | | 0 | | 0 | | 0 | | 0 |
Total | | 0 | | 0 | | 0 | | 0 |
Item 10. Submission of Matters to a Vote of Security Holders.
Not Applicable.
Item 11. Controls and Procedures.
| (a) | The Registrant’s President/Principal Executive Officer and Treasurer/Principal Financial Officer have reviewed the Registrant’s disclosure controls and procedures (as defined in Rule 30a-3(c) under the Investment Company Act of 1940 (the “Act”)) as of a date within 90 days of the filing of this report, as required by Rule 30a-3(b) under the Act and Rules 13a-15(b) or 15d-15(b) under the Securities Exchange Act of 1934. Based on their review, such officers have concluded that the disclosure controls and procedures are effective in ensuring that information required to be disclosed in this report is appropriately recorded, processed, summarized and reported and made known to them by others within the Registrant and by the Registrant’s service provider. |
| (b) | There were no changes in the Registrant’s internal control over financial reporting (as defined in Rule 30a-3(d) under the Act) that occurred during the second fiscal quarter of the period covered by this report that have materially affected, or are reasonably likely to materially affect, the Registrant’s internal control over financial reporting. |
Item 12. Disclosure of Securities Lending Activities for Closed-End Management Investment Companies
The registrant did not engage in securities lending activities during the fiscal period reported on this Form N-CSR.
Item 13. Exhibits.
| (a) | (1) Any code of ethics or amendment thereto, that is the subject of the disclosure required by Item 2, to the extent that the registrant intends to satisfy Item 2 requirements through filing an exhibit. Not Applicable. |
(2) A separate certification for each principal executive officer and principal financial officer pursuant to Section 302 of the Sarbanes-Oxley Act of 2002. Filed herewith.
(3) Any written solicitation to purchase securities under Rule 23c-1 under the Act sent or given during the period covered by the report by or on behalf of the registrant to 10 or more persons. Not Applicable.
| (b) | Certifications pursuant to Section 906 of the Sarbanes-Oxley Act of 2002. Furnished herewith. |
2
SIGNATURES
Pursuant to the requirements of the Securities Exchange Act of 1934 and the Investment Company Act of 1940, the registrant has duly caused this report to be signed on its behalf by the undersigned, thereunto duly authorized.
| | | | | | |
| | (Registrant) | | The Cushing Renaissance Fund | | |
| | | | | | |
| | | |
| | By (Signature and Title) | | /s/ Jerry V. Swank | | |
| | | | Jerry V. Swank, President & Chief Executive Officer | | |
Pursuant to the requirements of the Securities Exchange Act of 1934 and the Investment Company Act of 1940, this report has been signed below by the following persons on behalf of the registrant and in the capacities and on the dates indicated.
| | | | | | |
| | By (Signature and Title) | | /s/ Jerry V. Swank | | |
| | | | Jerry V. Swank, President & Chief Executive Officer | | |
| | | | | | |
| | | |
| | By (Signature and Title) | | /s/ John H. Alban | | |
| | | | John H. Alban, Treasurer & Chief Financial Officer | | |
3