Exhibit 99.1
THE TARA PROPERTY
Map-staked Claims
| Claim Name | Area | Claim Number |
| TARA PROPERTY | 1,141.7 Acres (462.22 hectares) | 776842 |
Location:
Omineca Mining Division
N.T.S.: 93 F/5 B.C.: 093F 034
53E 26' 40" N., 125E 31' 02" W.
U.T.M.: 5,924,630 N., 332,810 E.
Owner:
Iqbal Boga
2025 Gravely Street, Vancouver, British Columbia, Canada, V5L 3B6
In trust for:
Press Ventures Inc.
1733 1st Avenue Northwest, Calgary, Alberta, Canada, T2N 0B2
A Technical Report Written for:
Press Ventures Inc..
1733 1st Avenue Northwest, Calgary, Alberta, Canada, T2N 0B2
A Technical Report written by the Qualified Person:
John Ostler; M.Sc., P.Geo., Consulting Geologist
October 14, 2010
as amended
March 26, 2011
As of the Effective Date:
March 26, 2011
i
CONTENTS
| Page | |
CONCORDANCE WITH 43-101F1 . . . . . . . . . . . . . . . . . . . . . . . . . . . . . . . . . . . . . . | v |
SUMMARY . . . . . . . . . . . . . . . . . . . . . . . . . . . . . . . . . . . . . . . . . . . . . . . . . . . . . . . . . . | vi |
1.0 INTRODUCTION . . . . . . . . . . . . . . . . . . . . . . . . . . . . . . . . . . . . . . . . . . . . . . . . . . 1.1 Introduction . . . . . . . . . . . . . . . . . . . . . . . . . . . . . . . . . . . . . . . . . . . . . . . . . . . . . . . 1.2 Reliance on Other Experts . . . . . . . . . . . . . . . . . . . . . . . . . . . . . . . . . . . . . . . . . . . 1.3 Property Description and Location . . . . . . . . . . . . . . . . . . . . . . . . . . . . . . . . . . . . 1.4 Accessibility, Climate, Local Resources, Infrastructure, and Physiography . . . . . . . . . . . . . . . . . . . . . . . . . . . . . . . . . . . . . . . . . . . . . . . . . . | 1 1 1 1 6 |
2.0 HISTORY. . . . . . . . . . . . . . . . . . . . . . . . . . . . . . . . . . . . . . . . . . . . . . . . . . . . . . . . . 2.1 Chronology of Ownership and Exploration of Claims in the Tara Property-area from 1960 to Present. . . . . . . . . . . . . . . . . . . . . . . . . . 2.2 Historical Mineral Resource and Mineral Reserve Estimates, and Production from the Tara Property-area . . . . . . . . . . . . . . . . . . . . . . . . . . . | 9 9 28 |
3.0 GEOLOGICAL SETTING . . . . . . . . . . . . . . . . . . . . . . . . . . . . . . . . . . . . . . . . . . . 3.1 Regional Geology . . . . . . . . . . . . . . . . . . . . . . . . . . . . . . . . . . . . . . . . . . . . . . . . . . . 3.2 Regional Geophysics . . . . . . . . . . . . . . . . . . . . . . . . . . . . . . . . . . . . . . . . . . . . . . . . 3.3 Property Geology. . . . . . . . . . . . . . . . . . . . . . . . . . . . . . . . . . . . . . . . . . . . . . . . . . . | 34 34 39 39 |
4.0 MINERALIZATION AND DEPOSIT TYPE SOUGHT ON THE TARA PROPERTY. . . . . . . . . . . . . . . . . . . . . . . . . . . . . . . . . . . . . . . . . 4.1 Deposit Type Sought: Polymetallic Veins . . . . . . . . . . . . . . . . . . . . . . . . . . . . . . . 4.2 Polymetallic Vein Systems on the Nechako Plateau near the Tara Property. . . 4.3 Mineralization on the Tara Property. . . . . . . . . . . . . . . . . . . . . . . . . . . . . . . . . . . | 43 43 46 47 |
5.0 EXPLORATION AND DRILLING . . . . . . . . . . . . . . . . . . . . . . . . . . . . . . . . . . . . | 48 |
6.0 SAMPLING . . . . . . . . . . . . . . . . . . . . . . . . . . . . . . . . . . . . . . . . . . . . . . . . . . . . . . . | 48 |
7.0 DATA VERIFICATION . . . . . . . . . . . . . . . . . . . . . . . . . . . . . . . . . . . . . . . . . . . . . | 51 |
8.0 ADJACENT PROPERTIES . . . . . . . . . . . . . . . . . . . . . . . . . . . . . . . . . . . . . . . . . . | 52 |
9.0 MINERAL PROCESSING, RESOURCES, AND RESERVES. . . . . . . . . . . . . . | 53 |
10.0 OTHER RELEVANT DATA AND INFORMATION . . . . . . . . . . . . . . . . . . . . | 53 |
11.0 REPORTING REQUIREMENTS FOR DEVELOPMENT AND PRODUCTION PROPERTIES . . . . . . . . . . . . . . . . . . . . . . . . . . . . . . . . . . . . . . | 53 |
12.0 CONCLUSIONS AND RECOMMENDATIONS. . . . . . . . . . . . . . . . . . . . . . . . 12.1 Interpretation and Conclusions . . . . . . . . . . . . . . . . . . . . . . . . . . . . . . . . . . . . . . 12.2 Recommendations . . . . . . . . . . . . . . . . . . . . . . . . . . . . . . . . . . . . . . . . . . . . . . . . . | 53 53 54 |
13.0 REFERENCES . . . . . . . . . . . . . . . . . . . . . . . . . . . . . . . . . . . . . . . . . . . . . . . . . . . | 58 |
ii
CONTENTS
Continued
| FIGURES | Page |
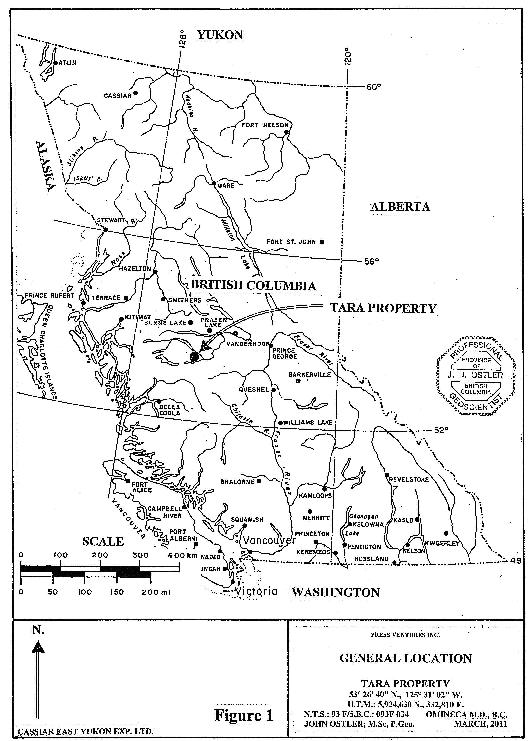
1. General Location . . . . . . . . . . . . . . . . . . . . . . . . . . . . . . . . . . . . . . . . . . . . . . . . . . . | 2 |
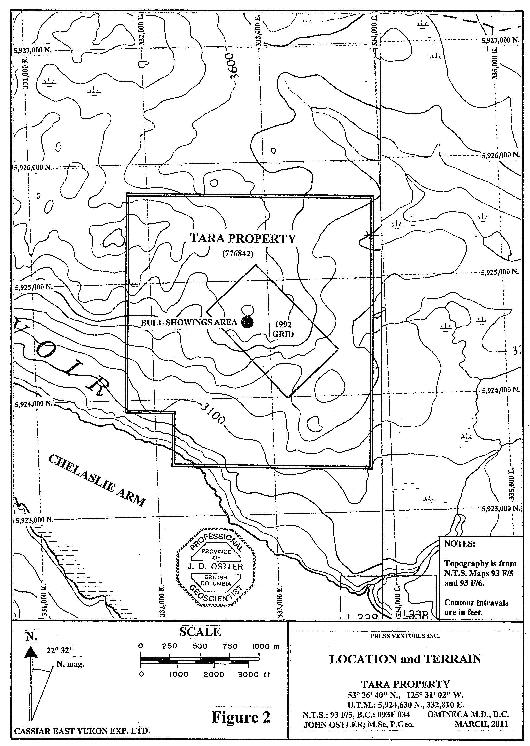
2. Location and Terrain . . . . . . . . . . . . . . . . . . . . . . . . . . . . . . . . . . . . . . . . . . . . . . . | 3 |
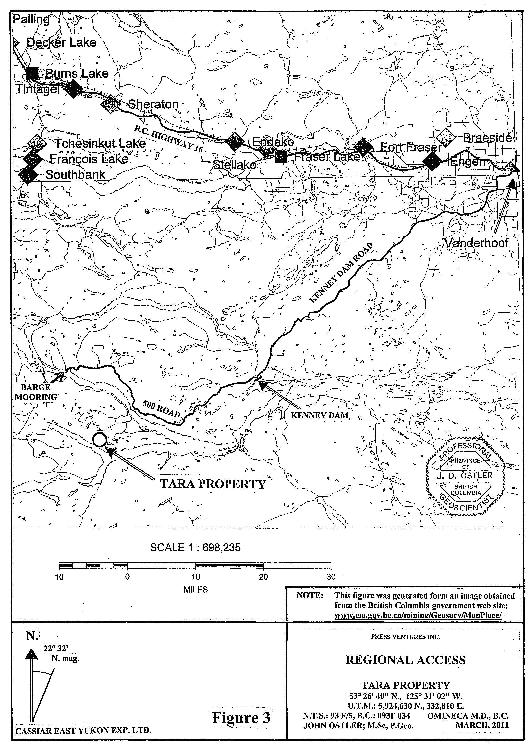
3. Regional Access . . . . . . . . . . . . . . . . . . . . . . . . . . . . . . . . . . . . . . . . . . . . . . . . . . . . | 7 |
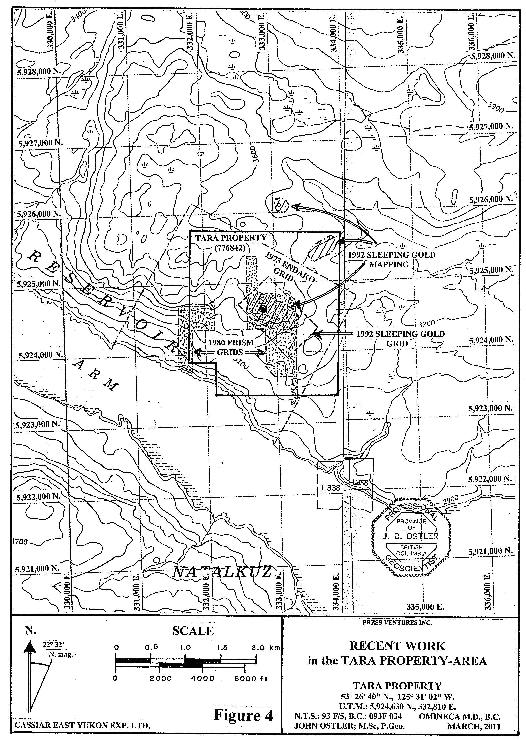
4. Recent Work in the Tara Property-area . . . . . . . . . . . . . . . . . . . . . . . . . . . . . . . . | 10 |
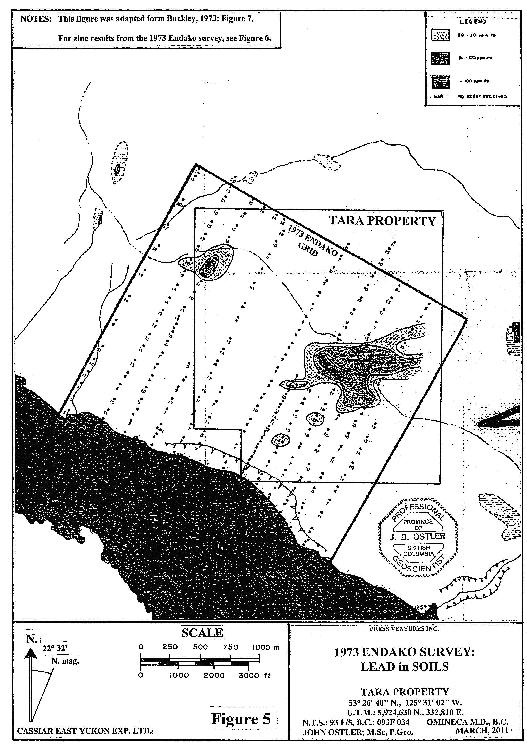
5. 1973 Endako Survey: Lead in Soils . . . . . . . . . . . . . . . . . . . . . . . . . . . . . . . . . . . . | 11 |
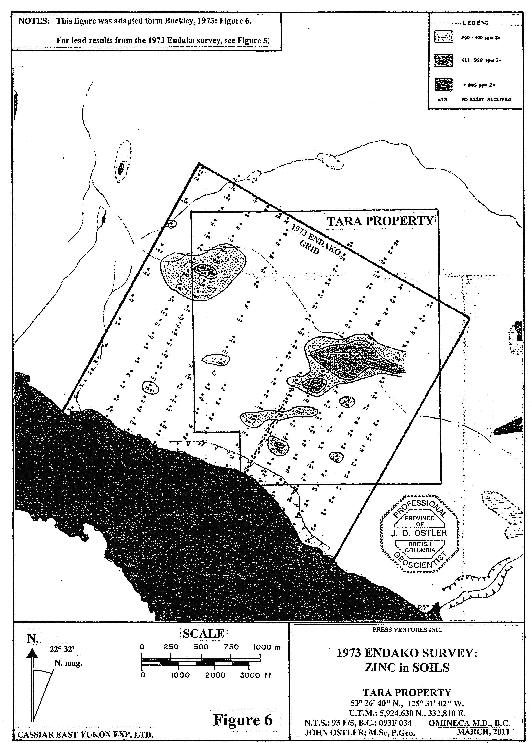
6. 1973 Endako Survey: Zinc in Soils . . . . . . . . . . . . . . . . . . . . . . . . . . . . . . . . . . . . | 12 |
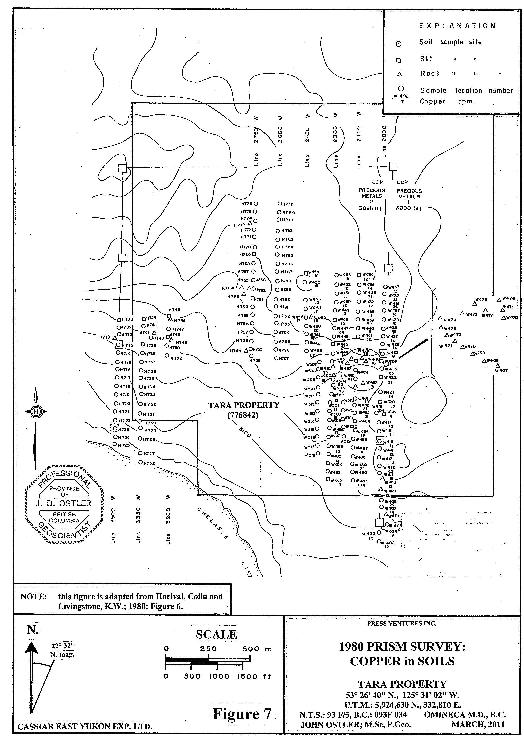
7. 1980 Prism Survey: Copper in Soils . . . . . . . . . . . . . . . . . . . . . . . . . . . . . . . . . . . | 14 |
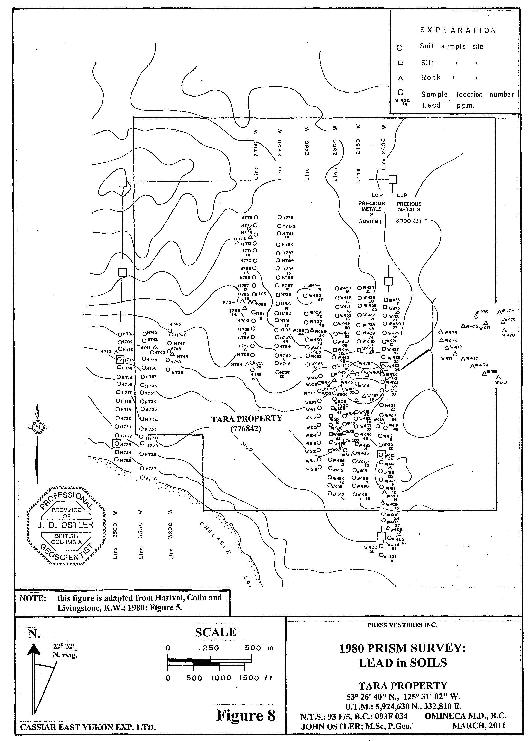
8. 1980 Prism Survey: Lead in Soils . . . . . . . . . . . . . . . . . . . . . . . . . . . . . . . . . . . . . . | 15 |
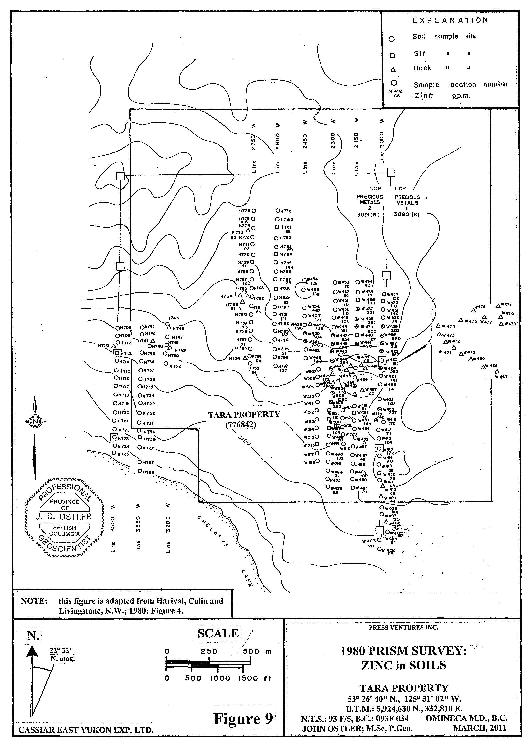
9. 1980 Prism Survey: Zinc in Soils . . . . . . . . . . . . . . . . . . . . . . . . . . . . . . . . . . . . . . | 16 |
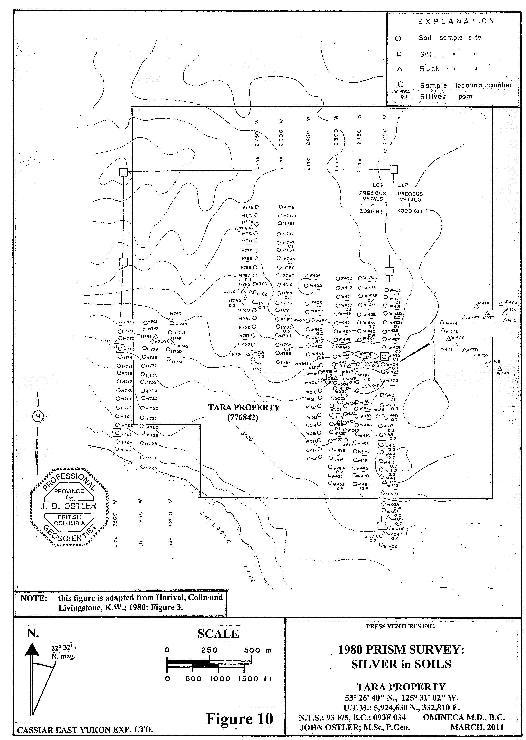
10. 1980 Prism Survey: Silver in Soils . . . . . . . . . . . . . . . . . . . . . . . . . . . . . . . . . . . . . | 17 |
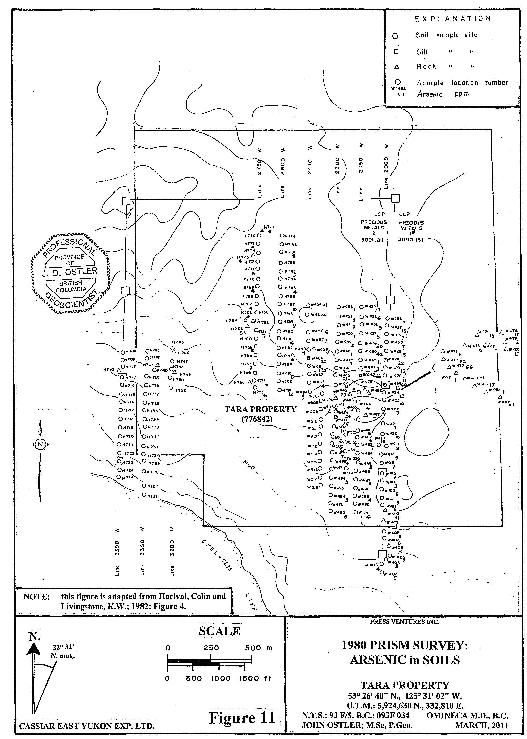
11. 1980 Prism Survey: Arsenic in Soils . . . . . . . . . . . . . . . . . . . . . . . . . . . . . . . . . . . | 18 |
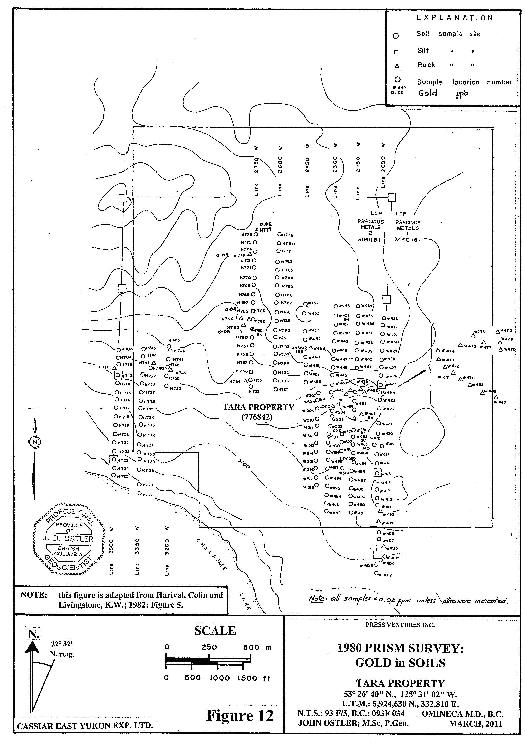
12. 1980 Prism Survey: Gold in Soils . . . . . . . . . . . . . . . . . . . . . . . . . . . . . . . . . . . . . | 19 |
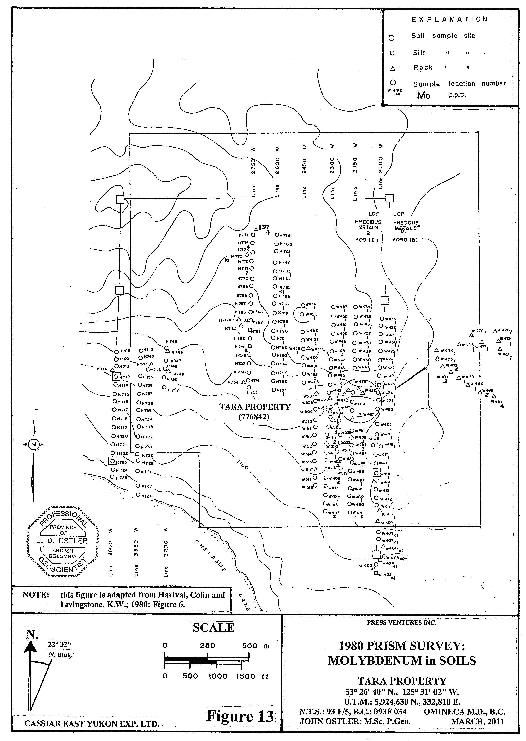
13. 1980 Prism Survey: Molybdenum in Soils . . . . . . . . . . . . . . . . . . . . . . . . . . . . . . | 20 |
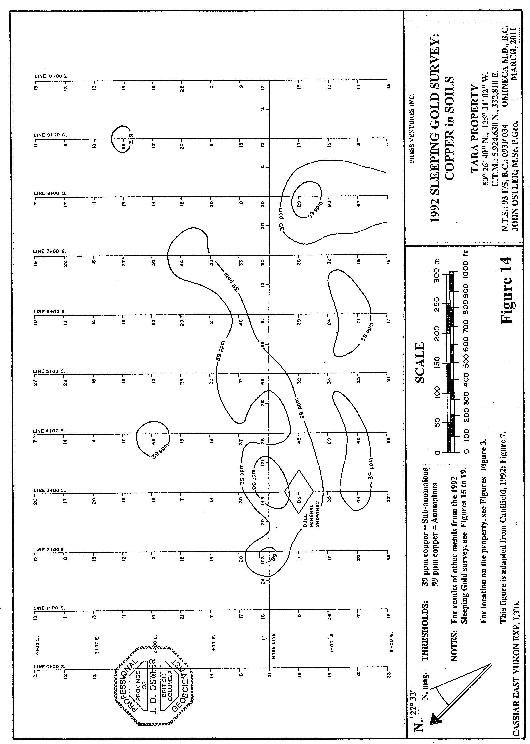
14. 1992 Sleeping Gold Survey: Copper in Soils . . . . . . . . . . . . . . . . . . . . . . . . . . . . | 22 |
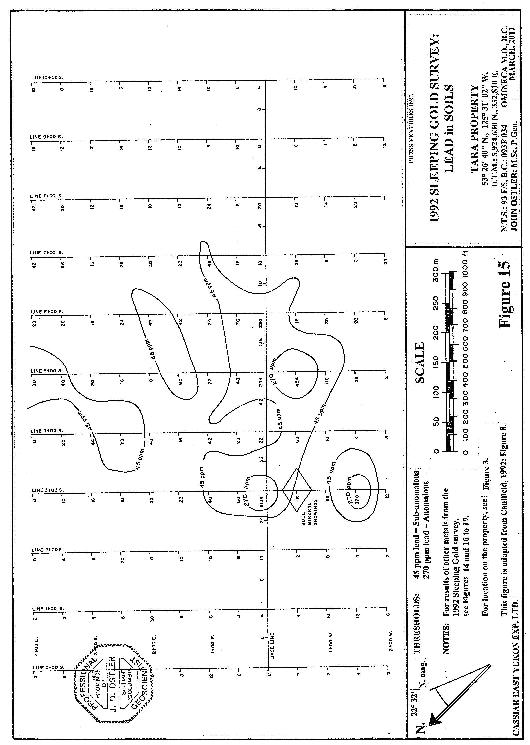
15. 1992 Sleeping Gold Survey: Lead in Soils . . . . . . . . . . . . . . . . . . . . . . . . . . . . . . | 23 |
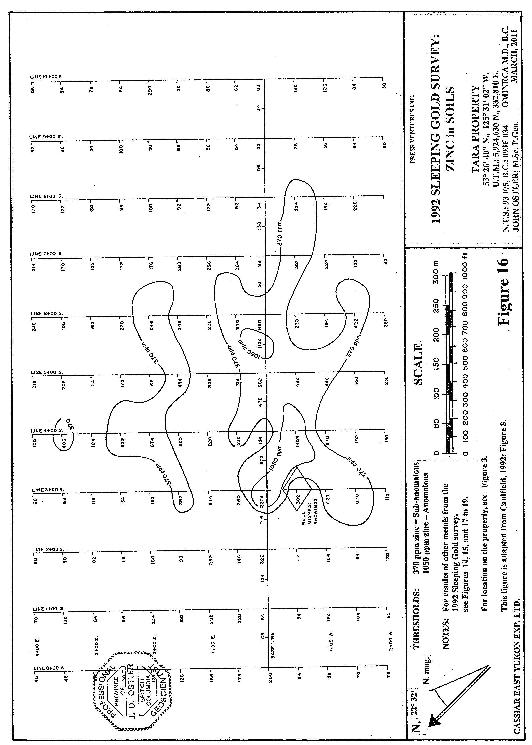
16. 1992 Sleeping Gold Survey: Zinc in Soils . . . . . . . . . . . . . . . . . . . . . . . . . . . . . . . | 24 |
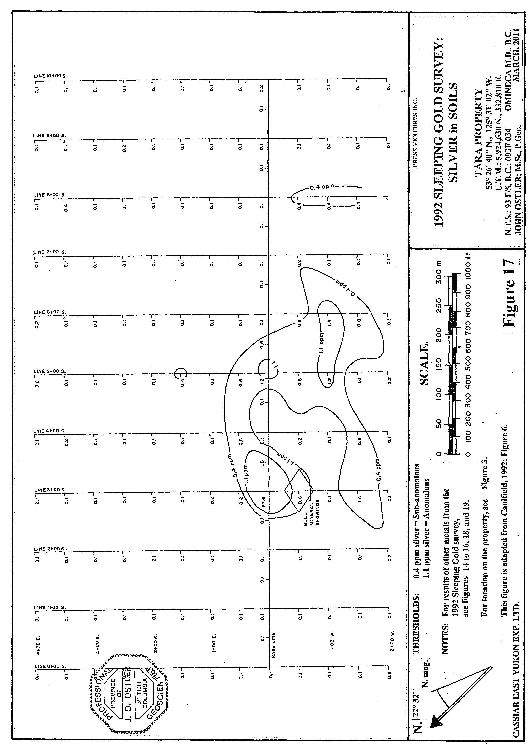
17. 1992 Sleeping Gold Survey: Silver in Soils . . . . . . . . . . . . . . . . . . . . . . . . . . . . . . | 25 |
18. 1992 Sleeping Gold Survey: Gold in Soils . . . . . . . . . . . . . . . . . . . . . . . . . . . . . . | 26 |
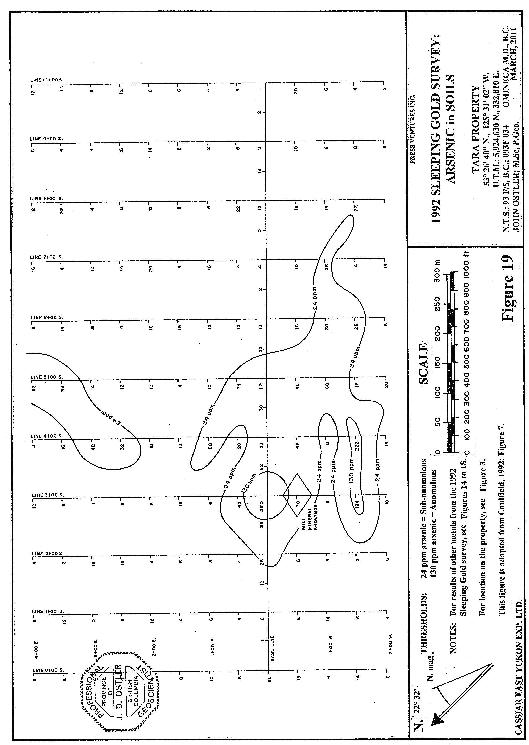
19. 1992 Sleeping Gold Survey: Arsenic in Soils . . . . . . . . . . . . . . . . . . . . . . . . . . . . | 27 |
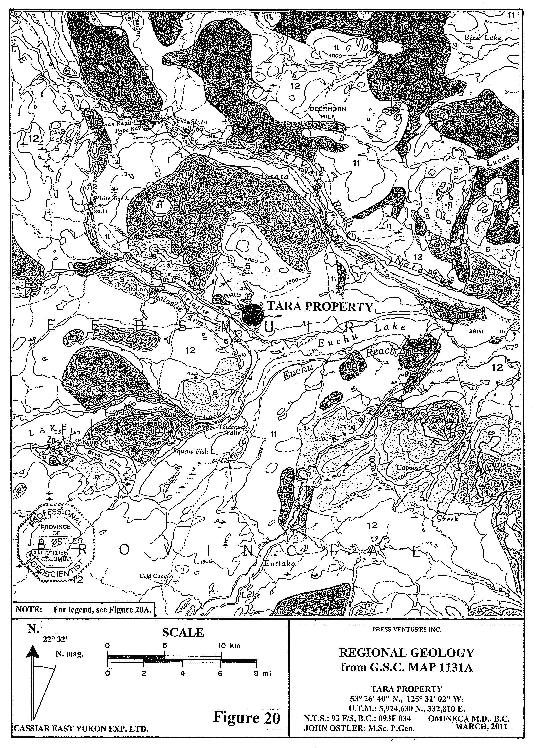
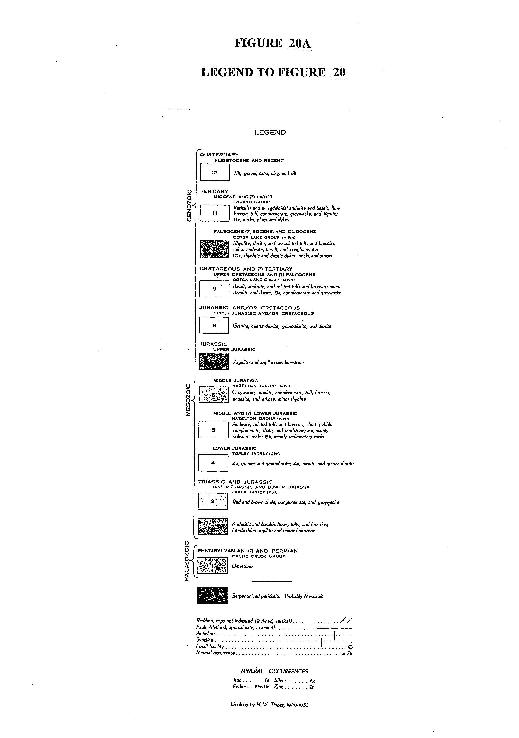
20. Regional Geology from G.S.C. Map 1131A . . . . . . . . . . . . . . . . . . . . . . . . . . . . . | 29 |
20A. Legend to Figure 20 . . . . . . . . . . . . . . . . . . . . . . . . . . . . . . . . . . . . . . . . . . . . . . . | 30 |
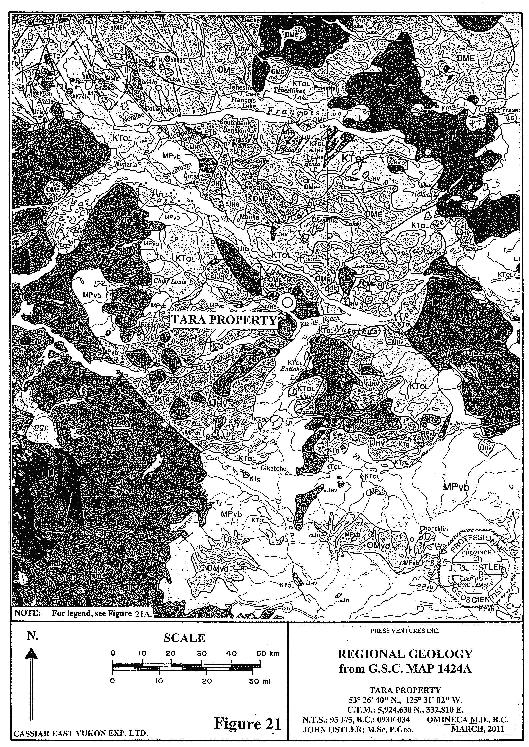
21. Regional Geology from G.S.C. Map 1424A . . . . . . . . . . . . . . . . . . . . . . . . . . . . . | 31 |
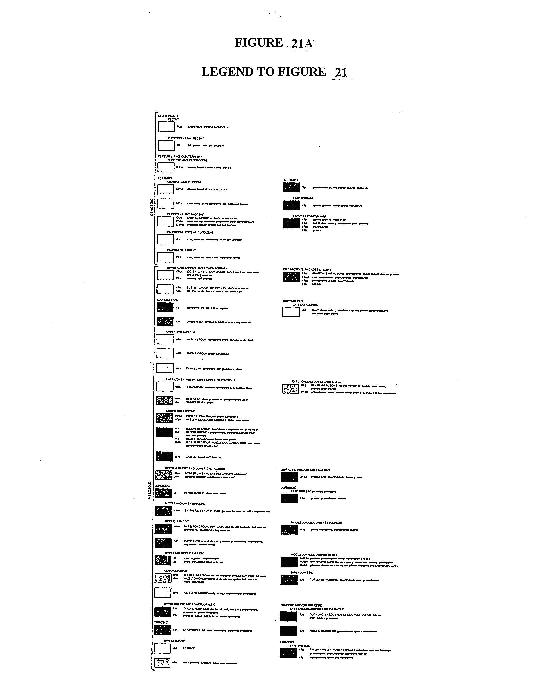
21A. Legend to Figure 21 . . . . . . . . . . . . . . . . . . . . . . . . . . . . . . . . . . . . . . . . . . . . . . . | 32-33 |
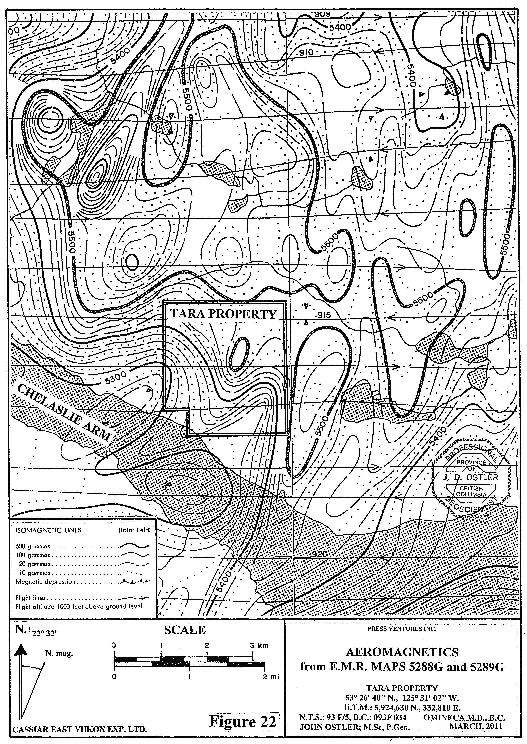
22. Aeromagnetism from E.M.R. Maps 5288G and 5289G . . . . . . . . . . . . . . . . . . . . | 38 |
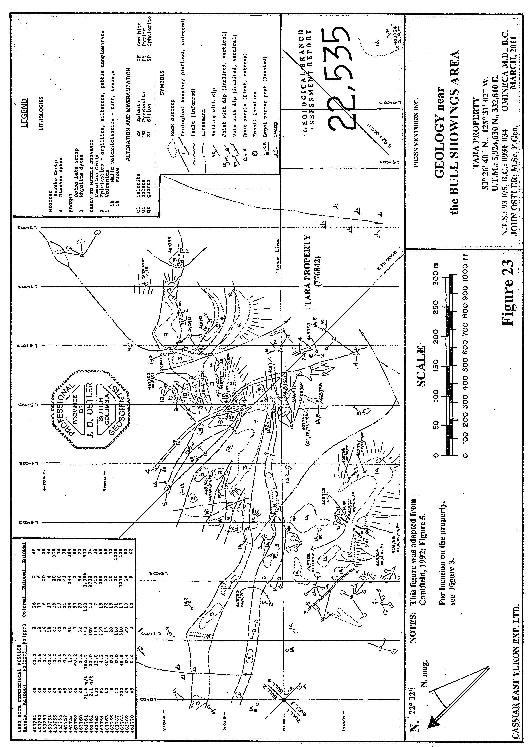
23. Geology near the Bull Showings-area . . . . . . . . . . . . . . . . . . . . . . . . . . . . . . . . . . | 40 |
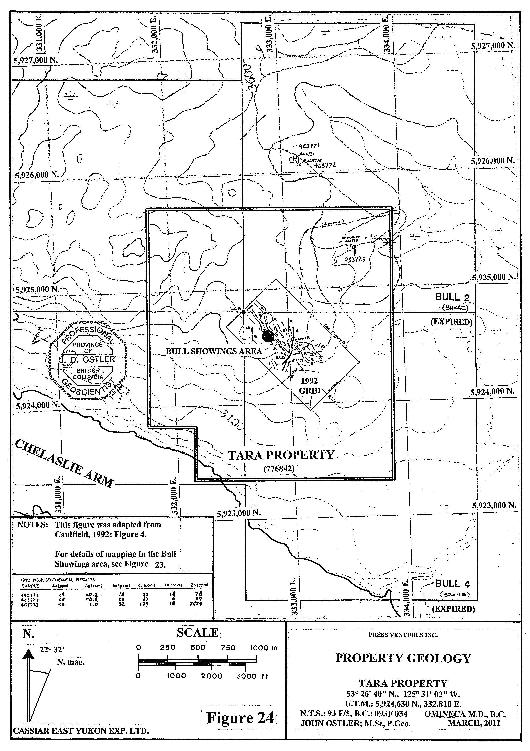
24. Property Geology . . . . . . . . . . . . . . . . . . . . . . . . . . . . . . . . . . . . . . . . . . . . . . . . . . | 41 |
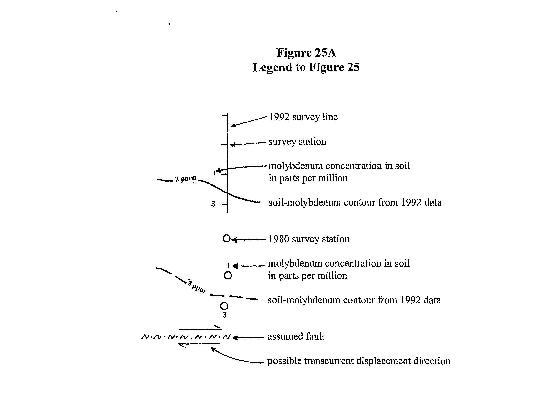
25. Interpretation of Molybdenum in Soils . . . . . . . . . . . . . . . . . . . . . . . . . . . . . . . . | 49 |
25A. Legend to Figure 25 . . . . . . . . . . . . . . . . . . . . . . . . . . . . . . . . . . . . . . . . . . . . . . . | 50 |
iii
CONTENTS
Continued
| TABLES | Page |
1. Map-staked Claim . . . . . . . . . . . . . . . . . . . . . . . . . . . . . . . . . . . . . . . . . . . . . . . . . . | 4 |
2. Annual Cost of Assessment Work and Filing Fees in Canadian Dollars and Units . . . . . . . . . . . . . . . . . . . . . . . . . . . . . . . . . . . . . . . . | 4 |
3. Annual Cost of Assessment Work and Filing Fees in American Dollars and Units . . . . . . . . . . . . . . . . . . . . . . . . . . . . . . . . . . . . . . . . | 5 |
4. Locations of Significant Areas in the Tara Property-area . . . . . . . . . . . . . . . . . . | 5 |
5. 1992 Sleeping Gold Survey: Anomalous Levels for Soil Geochemistry . . . . . . . . . . . . . . . . . . . . . . . . . . . . . . . . | 21 |
6. Table of Geological Events and Lithological Units in the Chelaslie Arm Area . . . . . . . . . . . . . . . . . . . . . . . . . . . . . . . . . . . . . . . . . . . . | 37 |
7. 1992 Sleeping Gold Survey: Rock Sampling Results . . . . . . . . . . . . . . . . . . . . . . . | 47 |
8. Estimated Cost of the Recommended First-phase Exploration Program . . . . . | 56 |
9. Estimated Cost of the Recommended Second-phase Exploration Program . . . . | 57 |
| APPENDIX | |
Certificate of the Qualified Person . . . . . . . . . . . . . . . . . . . . . . . . . . . . . . . . . . . . . . . | After text |
iv
CONCORDANCE WITH 43-101F
| 43-101F | This Report |
| Items 1 to 3: Title Page, Contents, and Summary | the same |
Item 4: Introduction ( a ) to ( c ): client, purpose, sources, citation ( d ) scope of the personal inspection | Section 1.0 Introduction |
| Item 5: Reliance On Other Experts | Section 1.2 Reliance on Other Experts |
| Item 6: Property Description and Location | Section 1.3 Property Description and Location |
Item 7: Accessibility, Climate, Local Resources, Infrastructure, and Physiography | Section 1.4 Accessibility, Climate, Local Resources, Infrastructure, and Physiography |
Item 8: History ( a ) prior ownership and changes ( b ) type, amount, and results of previous work ( c ) historical mineral resource and reserve estimates ( d ) production from the property | Section 2.1 Chronology of Ownership and Exploration of Claims in the Tara Property-area from 1960 to Present Section 2.2 Historical Resource and Reserve Estimates, and Production from the Tara Property-area (Section 2.2: Not Applicable) |
Item 9: Geological Setting: a concise description of regional, local and property geology | Section 3.1 Regional Geology Section 3.2 Regional Geophysics Section 3.3 Property Geology |
Item 10: Deposit Types | Section 4.1 Deposit Type Sought: Polymetallic Veins Section 4.2 Polymetallic Vein Systems on the Nechako Plateau near the Tara Property |
| Item 11: Mineralization: description of mineralized zones | Section 4.2 Mineralization on the Tara Property |
Item 12: Exploration nature and extent of work conducted by the “issuer” ( a ) procedures, parameters, and results of survey ( b ) interpretation of exploration information ( c ) identification of work done by the “issuer” and a list of contractors | Section 5.1 Summary of Exploration Conducted by Press Ventures Inc. Section 5.2 Procedures and Parameters of the Current Exploration Program Section 5.3 Results and Interpretation of the Current Exploration Program Section 5.4 Exploration Managers and Contractors (Sections 5.1 to 5.4: Not Applicable) |
| Item 13: Drilling | Section 5.5 Drilling (Not Applicable) |
Item 14: Sampling Method and Approach Item 15: Sample Preparation, Analysis, and Security | Section 6.1 Sampling Method and Approach Section 6.2 Sampling Preparation, Analysis, and Security (Sections 6.1 and 6.2: Not Applicable) |
| Item 16: Data Verification | Section 7.0 Data Verification |
Item 17: Adjacent Properties Item 18: Mineral Processing and Metallurgical Testing Item 19: Mineral Resource and Mineral Reserve Estimates Item 20: Other Relevant Data and Information Item 25: Development and Production Properties: requirements | Section 8.0 Adjacent Properties Section 9.1 Mineral Processing and Metallurgical Testing Section 9.2 Mineral Resource and Reserve Estimates Section 10.0 Other Relevant Data and Information Section 11.0 Reporting Requirements for Development and Production Properties (Sections 8.0 to 11.0: Not Applicable) |
Item 21: Interpretation and Conclusions Item 22: Recommendations | Section 12.1 Interpretation and Conclusions Section 12.2 Recommendations |
Item 23: References Item 24: Date and Signature Page Item 26: Illustrations | Section 13.0 References after references Figures 1 to 25 throughout the text |
v
THE TARA PROPERTY
SUMMARY
The Tara property comprises 1 map-staked claim covering 1,141.7 acres (462.216 hectares) in the Omineca Mining Division, Coast Land District, Range 4. It is on N.T.S. map sheet 93 F/5 near its northeastern corner and on B.C. map sheet 093F 034. The centre of the property-area is at 53E 26' 40" north latitude and at 125E 31' 2" west longitude (U.T.M.: 5,924,630 N., 332,810 E.). The current expiry date of this claim is May 20, 2011.
The registered owner of the mineral claim comprising the Tara property is Iqbal Boga, who reportedly is holding it in trust for Press Ventures Inc.
The land beneath the maximum high water level of Nechako Reservoir near the southern boundary of the claim is a “no-staking reserve” to facilitate reservoir management. This “no-staking reserve” does not significantly affect the mineral potential of the property. There is no private land or aboriginal homeland on or adjacent to the TARA PROPERTY (776842) claim. There is no plant or equipment, inventory, mine or mill structure of any value on this claim.
The property is subject no royalties, back-in rights, payments, or agreements and encumbrances. Also, it is subject to no environmental liabilities from previous exploration or mining activities.
It is anticipated that an environmental bond of $US 5,100 ($CDN 5,000) will be required by the British Columbia government to permit the second phase of the recommended exploration program. A bond application has not been made yet.
The Tara property is located on gentle slopes of the ridge on the northern side of Chelaslie Arm of Nechako Reservoir. This area is part of Nechako Plateau of central British Columbia. Elevations on the property range from 4,010 ft (1,222.2 m) at the hill-crest near the western boundary of the TARA PROPERTY (776842) claim to about 2,790 ft (850.4 m) at the property’s southern boundary. Terrain on the property varies from gently sloping in the northern part to steep in the south. Rock outcrop increases from sparse near the property’s northern boundary to moderately common on the slopes north of the reservoir. The claim is covered with forest, dominated by pine, spruce and fir. Most of the timber in the property-area is of insufficient size and quality for mining timber. Much of the area on and around the property has been clear cut.
Adequate fresh water for mining purposes could be pumped up from Nechako Reservoir or drawn by gravity from the small lakes located 2 mi (3 km) north of the property. The property-area is remote from any electric power grid; power for a mining operation must be generated on site. Nechako Plateau experiences cold moderately dry and cool moderately wet summers. Snow stays on the property-area from late October to May in a normal year.
Nechako Reservoir area can be accessed form the British Columbian highway system from either Vanderhoof or Burns Lake. Both communities are on B.C. Highway 16 between Prince George and Prince Rupert. Access is most efficient from Vanderhoof.
Access from Vanderhoof to the northern side of Intata Reach on the reservoir is via Kenney Dam Road to its termination at the dam itself, and thence via the 500 road to a barge crossing west of Intata Hill (Figure 3). Both the Kenney Dam and 500 roads are good 2-wheel drive gravel roads. Trucks on the 500 road use radio frequency 159.750. The barge that is based at the landing near Intata Hill is owned by Ambroid Equipment Limited of Fraser Lake, British Columbia.
Geological mapping has been conducted only in the central part of the property. Exposed there is a sequence of Jurassic-age, Hazelton Group, rhyolitic and andesitic volcanic rocks accompanied by a minor quantity of epiclastic volcanogenic sedimentary beds. These rocks have been intruded by Eocene-age Ootsa Lake Group, rhyolitic dykes, and subsequently by Miocene-age diabase dykes.
Three reconnaissance exploration campaigns have been conducted in the Tara property-area in: 1973, 1981, and 1992. No current exploration has been conducted by Press Ventures Inc., “the issuer”.
vi
The exploration targets currently sought on the Tara property are epigenetic polymetallic vein systems. The Bull showings area, located near the center of the property-area hosts epigenetic quartz vein stockwork and breccia systems that are exposed on surface and in several small prospect trenches. The largest exposed system reportedly exceeds 13.2 ft (4 m) in width and is exposed for a length of 66 ft (20 m). A float sample of mineralization assumed to have been from the stockwork contains 0.62 oz/ton (21.4 gm/mt) gold, 5.44 oz/ton (186.5 gm/mt) silver, and 3.3% lead. Samples from some small exploration cuts into the stockwork yield an average of 0.02 oz/ton (0.63 gm/mt) gold and 0.65 oz/ton (22.4 gm/mt) silver. The system was considered by the most recent examiner to be open to the west along strike and soil data indicated that it could extend for at least 328 ft (100 m) to the east. Soil survey results also indicated to him that at least one other mineralized system may have been located in the survey area.
Upon contouring elevated soil-molybdenum concentrations from the 1992 data, the author recognized that the epigenetic vein and stockwork systems are located within an extensive sub-vertical, nearly orthogonal fracture set that have surface traces oriented almost north-south and east west. Soil-molybdenum concentrations along the presumed surface traces of these fractures range up to 10 ppm, which is typical of concentrations resulting from molybdenum transport up siliceous fracture fillings from a source at depth. The epigenetic veins and stockwork systems exposed on surface on the Tara property may be an expression of the upper part of a molybdenum-bearing hydrothermal system. Several such hydrothermal systems hosting porphyry-molybdenum deposits have been explored in the region around the Tara property. The best-known is at the Endako molybdenum mine, located at Smithers, British Columbia.
The extent of and depth potential of the polymetallic vein system examined in the Bull showings and their relation to a larger mineralized hydrothermal system remains untested. Also, the areas hosting part of the eastern, and all of the western 1973 soil anomalies remain unexplored.
A two-phase exploration program is recommended. The first phase comprises geological mapping and prospecting. If reasonable encouragement is generated by the results of the first-phase program, it should be followed by a second-phase program of soil survey and possibly hand-trenching. The estimated costs of the two recommended phases of exploration are as follow:
| Program | Estimated Cost inc. H.S.T. + Contingency $US $CDN |
1st Phase: geological mapping and prospecting | $ 25,894 $ 25,388 |
2nd Phase: soil survey and possibly hand trenching | $109,608 $ 107,237 |
| Total Estimated Cost: | $135,502 $ 132,625 |
NOTE: An exchange rate of $US1.02 : $CDN1.00 as quoted by http://stockwatch.com/ on March 22, 2011 is used to generate costs in American dollars.
vii
THE TARA PROPERTY
1.0 INTRODUCTION
1.1 Introduction
The writer, John Ostler; M.Sc., P.Geo., was commissioned by Press Ventures Inc. through Cassiar East Yukon Expediting Ltd. to write this report entitled “The Tara Property” with the effective date of March 26, 2011.
This report was written to produce a current Technical Report regarding the Tara property, Press Ventures Inc.’s major asset, in order to provide some of the documentation necessary to support an initial public offering of the company’s shares.
This report is based upon published records of the results of previous exploration in the Tara property-area, and of regional geological mapping conducted by geologists of the British Columbia Geological Survey and of the Geological Survey of Canada. Citations of that work are in standard format (section 13.0, this report). No current (2008 to 2011) exploration program has been conducted on the Tara property.
The writer has not conducted a Current Personal Inspection of the Tara property. At the writing of this report, the Tara property was snowbound.
1.2 Reliance Upon Other Experts
The writer has relied upon information provided by the government of British Columbia in matters of land tenure, security of title, and regulations that may affect one’s ability to develop the Tara property.
1.3 Property Description and Location
The Tara property comprises 1 map-staked claim covering 1,141.7 acres (462.216 hectares) in the Omineca Mining Division, Coast Land District, Range 4. It is on N.T.S. map sheet 93 F/5 near its northeastern corner and on B.C. map sheet 093F 034 (Figures 1 and 2). The centre of the property-area is at 53E 26' 40" north latitude and at 125E 31' 2" west longitude (U.T.M.: 5,924,630 N., 332,810 E.).
1
2
3
The mineral claim comprising the Tara property is owned by Iqbal Boga (Table 1), reportedly in trust for Press Ventures Inc.Map-staked mineral claims in British Columbia are endowed with metallic and some industrial mineral rights but no surface rights. Surface rights can be obtained during production permitting. The tenure of the claim comprising the Tara property (Figure 2) is as follow:
Table 1
Map-staked Claim
| Claim Name | Record Number | Area: acres (hectares) | Record Date | Expiry Date | Owner |
| TARA PROPERTY | 776842 | 1,141.7 (462.22) | May 20, 2010 | May 20, 2011 | Iqbal Boga |
Currently in British Columbia, a mineral claim holder must do and record a minimum of $CDN4 worth of assessment work or pay $CDN4 cash in lieu of work per year for each hectare within a claim to maintain that claim in good standing for the first three years of its tenure. From the 4th year onward, a minimum of $CDN8 worth of assessment work or cash in lieu of work per hectare must be submitted per hectare to keep a mineral claim in good standing each year. Up to 10 years worth of assessment work can be recorded to the credit of a mineral claim at one time. A filing fee of $CDN0.40 per hectare per year is levied when assessment work or cash in lieu of work is filed.
Currently, the claim comprising the Tara-property is in good standing until May 20, 2011. Extending the expiry date of the claim for one year would cost as follows:
Table 2
Annual Cost of Assessment Work and Filing Fees in Canadian Dollars and Units
Year | Property Area in hectares Requiring Work for 1 Year Expiry Extension | Work @ $CDN 4/ha | Work @ $CDN 8/ha | Filing Fees @ $CDN 0.40/ha | Total Annual Cost in $CDN |
| 2011 to 2013 | 462.22 | $ 1,848.88 | $ 184.89 | $ 2,033.77 | |
2014 and subsequent years | 462.22 | $ 3,697.76 | $ 184.89 | $ 3,882.65 |
4
Table 3
Annual Cost of Assessment Work and Filing Fees in American Dollars and Units
Year | Property Area in acres Requiring Work for 1 Year Expiry Extension | Work $US 1.6464 /acre | Work @ $US 3.2930 /acre | Filing Fees @ $US 0.165 /acre | Total Annual Cost in $US |
| 2011 to 2013 | 1,141.7 | $ 1,885.86 | $ 188.61 | $ 2,068.07 | |
2014 and subsequent years | 1,141.7 | $ 3,771.72 | $ 188.61 | $ 3,960.33 |
| NOTE: | An exchange rate of $US1.02 : $CDN1.00 as quoted by http://stockwatch.com/ on March 22, 2011 is used to generate costs in American dollars and units. |
This is a map-staked claim that is located on the computer-generated provincial mineral tenure grid ( www.mtonline.bc.ca ). No posts or lines exist on the ground; thus, there is no uncertainty regarding the area covered by the claim. Also, there are no natural features and improvements relative to, and affect the location of the outside property boundaries. However, there are conditions that may have a minor affect on the design of future exploration and development programs on the property. The land beneath the maximum high water level of Nechako Reservoir near the southern boundary of the claim is a “no-staking reserve” to facilitate reservoir management. This “no-staking reserve” does not significantly affect the mineral potential of the property. There is no aboriginal homeland on or adjacent to the TARA PROPERTY (776842) claim.
According to information provided by the government of British Columbia through the Tantalus Gator system and the Integrated Land Resource Registry, available at www.mtonline.bc.ca and at www.ILRR.ca , no parts of the Tara property cover private land. There is no plant or equipment, inventory, mine or mill structure of any value on this claim. The locations of significant areas on the property are as follow (Figure 2):
Table 4
Locations of Significant Areas in the Tara Property-area
| Entity | Claim | U.T.M. Co-ordinates | Longitude and Latitude | Elevation (ft) (m) |
Property center and the Bull showings-area | TARA PROPERTY 776842 | 5,924,630 N., 332,810 E. | 53E 26' 40" N., 125E 31' 02" W. | 3,625 1,104.9 |
5
At the effective date of this Technical Report, being March 26, 2011, the writer knows of no royalties, back-in rights, payments, or agreements and encumbrances to which the Tara property is subject. The Tara property is subject to no environmental liabilities from previous exploration or mining activities.
Permits from the British Columbia government and an environmental bond will be required to conduct the second phase of the recommended exploration program. It is anticipated that the cost of that bond will be $US 5,100 ($CDN 5,000). A bond application has not been made yet.
1.4 Accessibility, Climate, Local Resources, Infrastructure, and Physiography
The Tara property is located on gentle slopes of a ridge on the northern side of Chelaslie Arm of Nechako Reservoir. This area is part of Nechako Plateau of central British Columbia (Figures 1and 2). Elevations on the Tara property range from 4,010 ft (1,222.2 m) at the hill-crest near the western boundary of the TARA PROPERTY (776842) claim to about 2,790 ft (850.4 m) at the property’s southern boundary (Figure 2). Terrain on the property varies from gently sloping in the northern part to steep in the south. Rock outcrop increases from sparse near the property’s northern boundary to moderately common on the slopes north of the reservoir.
The area around the Tara property is covered with forest, dominated by pine, spruce and fir. Most of the timber in the property-area is of insufficient size and quality for mining timber. Much of the area on and around the property has been clear cut.
Nechako Reservoir area can be accessed form the British Columbian highway system from either Vanderhoof or Burns Lake. Both communities are on B.C. Highway 16 between Prince George and Prince Rupert (Figures 1 and 3). Access is most efficient from Vanderhoof.
Access from Vanderhoof to the northern side of Intata Reach on the reservoir is via Kenney Dam Road to its termination at the dam itself, and thence via the 500 road to a barge crossing west of Intata Hill (Figure 3). Both the Kenney Dam and 500 roads are good 2-wheel drive gravel roads. Trucks on the 500 road use radio frequency 159.750. The barge that is based at the landing near Intata Hill is owned by Ambroid Equipment Limited of Fraser Lake, British Columbia.
6
7
The logging roads on the peninsula between Intata Reach and Chelaslie Arm are controlled by Chislada Forest Products of Fraser Lake, British Columbia. Chislada does contract logging for West Fraser Mills. Chislada’s roads approach the northern, western, and eastern margins of the Tara property. The current condition of those roads is unknown to the writer.
The nearest supply and service centers to the property are Burns Lake, Vanderhoof, and Fraser Lake, located on highway 16. Vanderhoof is about 100 mi (161 km) northeast of the property area. These communities have adequate resources to service a surface exploration program.
The City of Prince George, located about 45 mi (74 km) east of Vanderhoof, has services necessary to support a mining operation. The city has a regional airport with scheduled jet service to other parts of North America. Also, it is located at the junction between major north-south and east-west rail routes. Canadian National’s main line westward to the port of Prince Rupert runs generally parallel with B.C. Highway 16 from Prince George to Prince Rupert, located 442 mi (724 km) to the west (Figure 1). Prince Rupert is Canada’s second largest Pacific coast port.
Helicopters for emergency service are available at Burns Lake, located on B.C. Highway 16 about 58 mi (95 km) by air north-northwest of the property area, and at Prince George located about 115 mi (188 km) east-northeast of the property.
The closest weather station to the property-area is at Prince George, British Columbia (Figure 1). Climatic statistics for that station are quoted from Environment Canada as follow:
Average temperature: January, High 21.3EF. ( -5.9EC.) | July, High 72.1EF (22.3EC.) |
Low 8.4EF. (-13.1EC.) Low 47.7EF ( 8.7EC.)
| Average annual precipitation: | 25.4 inches (644 mm) of which 16.3 inches (413.9 mm) falls as rain and 9.1 inches (230.1 cm) falls as snow |
Precipitation in the Prince George area peaks twice per year, in June and October. By August and
March, precipitation decreases to a minimum.
| Wettest month, Spring: | June, with 2.54 inches (64.4 mm) precipitation |
| Driest month, Summer: | August, with 1.93 inches (49.1 mm) precipitation |
| Wettest month, Autumn: | October, with 3.12 inches (79.2 mm) precipitation |
| Driest month, Winter: | March, with 1.13 inches (28.6 mm) precipitation |
8
Average Snow depth in inches (cm):
| Jan. | Feb. | Mar. | Apr. | May | June | July | Aug. | Sept. | Oct. | Nov. | Dec. |
| 28.3 | 28.7 | 22.4 | 6.2 | 0 | 0 | 0 | 0 | 0 | 0 | 5.9 | 16.1 |
| (72) | (73) | (57) | (16) | (0) | (0) | (0) | (0) | (0) | (0) | (15) | (41) |
| Note: | This data were obtained from the National Climate Archive (Climate Data On Line, Canadian Climate Normals) at www.climate.weatheroffice.ec.gc.ca/climate |
The climate in the property-area is slightly colder and wetter than it is at Prince George. Snow stays on the property-area from late October to May in a normal year.
The current exploration target-area on the Tara property is the area around the Bull polymetallic vein system which is on crown (public) land with no special restrictions on development thereon. Upon development permitting, one normally is able to secure surface rights necessary to conduct a permitted mining operation. The writer knows of no legal impediment to Press Ventures Inc. being able to secure such surface rights.
Adequate fresh water for mining purposes could be pumped up from Nechako Reservoir or drawn by gravity from the small lakes located 2 mi (3 km) north of the property. The property is remote from any electrical grid. Consequently, electricity for a mining operation would have to be generated on site.
Both the mining business and the pool of those who serve it are international and mobile. The area around Prince George, British Columbia has sufficient amenities to attract the people needed to operate a new local mine. There is adequate, reasonably flat area appropriate for erecting a mill and developing a tailings pond on the property.
2.0 HISTORY
2.1 Chronology of Ownership and Exploration of Claims in the Tara Property-area from 1960 to Present
| 1960s | Several major mining companies conducted regional geochemical surveys across Nechako Plateau in search of porphyry copper deposits. |
| 1973 | The MR claim group was staked by M. Lubbers of Telkwa, British Columbia and optioned to Endako Mines, a division of Canex Placer Limited. Endako conducted a reconnaissance soil survey comprising 13 lines run northeastward from the northeastern shore of Chelaslie Reach over the area now partly covered by the Tara property. Lines were spaced 1,000 ft (305 m) apart. Soil samples were collected at 500-foot (152-metre) intervals in the southern part of the grid and at 400-foot (122-metre) intervals in its northern part. A total of 196 samples were taken and analyzed for: copper, lead, zinc, silver, and molybdenum. The samples were not analyzed for gold. During the early 1970s, soil-gold determinations were quite expensive, and generally considered not very reliable. Two co-incident soil-lead and zinc anomalies were discovered (Buckley, 1973) (Figures 4 to 6). |
9
10
11
12
1974 to
| 1980 | The MR claim group lapsed. |
| 1991 | During Spring, 1980, JMT Services Corp. staked the Precious Metals claim group to cover the soil anomalies discovered during the 1973 program. From July to September, 1980 JMT with support from Prism Resources Ltd. Conducted rock-chip and soil surveys near the eastern 1973 anomaly. North-south lines spaced at 492-foot (150-metre) intervals were run mostly through the area of the 1973 eastern anomaly. Samples were taken at 152-foot (50-metre intervals) along the lines (Figure 4). A total of 191 soils and 27 rock and silt samples were taken. Samples were analyzed for copper, lead, zinc and silver. The results of the 1980 work in the eastern anomaly area were summarized by Colin Harivel and K.W. Livingstone (1981) as follow: |
Results for zinc outline a broad anomaly about 700 m (2,296 ft) by 600 m (1,968 ft). In largest dimensions … Values (concentrations) range from 34 ppm to 2,760 ppm with an estimated average of 250 ppm and estimated background of 150 ppm (Figure 9).
Lead values (concentrations) outline an anomalous area which more or less mimics the zinc anomaly. Values (concentrations) range from a low of 5 ppm to 1,950 ppm with an estimated background of 30 ppm (Figure 8).
Within the anomalous area values (concentrations) for silver are sporadically anomalous but no defined zone is apparent. Values (concentrations) over the property range from less than the limit of detection to a high of 10.5 ppm. Background values are 0.2 ppm (Figure 10).
Copper values (concentrations) are low and show no clear pattern (Figure 7).
Harivel, Colin and Livingstone, K.W.; 1981: pp. 2-3.
1982 In February, 1982, JMT had the sample pulps from the 1980 program re-analyzed for gold, arsenic and molybdenum. Colin Harivel and K.W. Livingstone (1982) reported the results of that re-analysis as follows:. |
A zone defined by the limit of above-background As in soils in coincident with much of the zinc anomaly shown in an earlier assessment report (Buckley, 1973) (Figure 6), whereas the few anomalous Au results lie away to the northwest from the zone of higher As results. Mo is generally very low and shows weak increase to 2-3 ppm downslope from the core of the coincident Pb-Zn anomaly (Figure 13).
Harivel, Colin and Livingstone, K.W.; 1982: p. 5.
1982 to
1991 The MR claims were allowed to lapse. |
13
14
15
16
17
18
19
20
1991 Bruno Kasper re-staked the area as the Bull claims in June, 1991. Kasper optioned the claims to Sleeping Gold Ltd. |
| 1992 | Equity Engineering Ltd. Conducted a program of geological mapping, prospecting, and rock and soil geochemical surveys for Sleeping Gold Ltd. (Caulfield, 1992). The grid comprised 10 northeast-southwest trending lines spaced 328 ft (100 m) apart were turned off a 0.6 mi (1 km) –long northwest-southeasterly trending base line. Soil samples were taken at 152-foot (50-m) intervals along each line. A total of 152 soil samples (Figures 4, 14 to 19, 23 to 25), and 23 rocks were analyzed. D.A. Caulfield (1992) described the Sleeping Gold soil survey as follows: |
The soil sampling program on the Bull 1-4 claims was designed to confirm and better define the lead-zinc-arsenic anomalies outlined by soil sampling campaigns by Placer (1973) and Prism (1980) … A total of 152 soil samples were collected from the (1992) soil grid and log probability plots for gold, silver, arsenic, copper, lead and zinc were constructed from them. These distribution diagrams were then used to calculate background, anomalous and strongly anomalous levels… (as followJ
Table 5
| 1993 | Sleeping Gold Survey: |
Anomalous Levels for Soil Geochemistry
| ELEMENT | BACKGROUND | POSSIBLY ANOMALOUS | ANOMALOUS |
| gold (ppb) | <5 | <5 | 95 |
| silver (ppm) | <0.2 | 0.4 | 1.1 |
| copper (ppm) | 18 | 39 | 99 |
| lead (ppm) | 16 | 45 | 270 |
| zinc (ppm) | 155 | 370 | 1050 |
| arsenic (ppm) | 12 | 24 | 130 |
The bulk of the anomalous soil geochemistry is contained in an area bounded by 3+00S-6+00s and 2+00W-4+00E (Figures 14 to 19). As best can be discerned, this is the same area outlined by the previous surveys. Part of this anomaly likely marks the eastern strike extension of the quartz vein system found at 3+00S, 1+00W. Sample station 3+50S, B/L, which lies along strike to the east, returned elevated silver (1.6 ppm), copper (121 ppm), lead (136 ppm), and zinc (572 ppm) values (concentrations), which are comparable to those of the soil sample taken directly over the main showing. Unfortunately, the western strike extension of the quartz vein zone was not covered by the survey.
The most anomalous soil sample was taken at 3+00S, B/L, 50 metres (152 feet) north of the quartz vein system described above. It contained all the maximum metal values (concentrations) (encountered) … , and lies on the western end of another east-west anomaly which extends to 5+00S, 4+00E. The source of this anomaly may be a similar, but as yet undiscovered, quartz vein system, considering the geochemical signature and orientation of the anomaly. Alternatively, the two anomalies may mark a single quartz vein system which has been displaced by faulting between 3+00S and 3+50S on the baseline.
21
22
23
24
25

26
27
Anomalous precious and base metal values (concentrations) were returned from sampling on lines 5+00S and 6+00S near to the baseline. Sampling of the conspicuous gossanous outcrops in this area indicate that these outcrops are not the source of the anomalies and that another, perhaps less obvious, source remains to be found.
A large portion of the Bull property outside of the grid is underlain by glacial till. Some of the till is locally derived, but most contains rounded cobbles of mixed lithology. This till, will mask underlying geochemical trends in places, making interpretation difficult. It gives anomalous areas a “thumb print” pattern of high values (where till is thin or absent) and very low values (where till is impervious or too thick to indicate underlying anomalies). The low lying till covered areas on lines 8+00S and 9+00S, would not likely be satisfactory for indicating soil anomalies.
Caulfield, D.A.; 1992: pp. 9-11.
1992 to
| 2006 | The Bull claims lapsed. |
| 2006 | The TARA (528336) claim was map-staked by Joseph Lawrence of Cache Creek, British Columbia and subsequently sold to Ichbal Boga, who held it in trust for Goldron Ventures Inc. |
2007 to
| 2010 | The TARA (528336) claim lapsed. |
| 2010 | Iqbal Boga map-staked the current TARA PROPERTY (776842) claim on May 20, 2010. Reportedly, he is holding it in trust for Press Ventures Inc. |
2.2 Historical Mineral Resource and Mineral Reserve Estimates, and Production from the Tara Property-area
No historical estimates of mineral resources or reserves related to the Tara property, or historical production from the Tara property-area are known to the writer.
28
29
30
31
32

33
3.0 GEOLOGICAL SETTING
3.1 Regional Geology
Rocks northeast of the Chelaslie Arm area have received very little attention from government mappers. H.W. Tipper (1963) mapped the area at a scale of 1:253,440 to produce Map 1131A by the Geological Survey of Canada (Figure 20). That mapping was included in Geological Survey of Canada Map 1424A a regional compilation of mapping throughout N.T.S. Map Sheet 93 (Tipper et al., 1979) (Figure 21). All more recent government geological publications are re-statements of W.H. Tipper’s work.
Late Palaeozoic-age marine sediments and Triassic-age volcanic strata formed the rocks now exposed beneath the Stikine Arch in northwestern British Columbia. This sedimentation occurred in some unknown location in the palaeo-North Pacific basin. These Palaeozoic-age rocks were deformed and partly eroded during development of the Stikine Arch by the Inklinian Orogeny. Deformation occurred form about 200 to 189 million years ago during the Early Jurassic Period. J.R.W. Douglas (1970) described the progress of the Inklinian Orogeny as follows:
A period of regional uplift, granitic intrusion, and locally, regional metamorphism, termed the Inklinian Orogeny occurred in the Pinchi, Omineca, and northern Coast Genticlines in latest Triassic and earliest Jurassic time. Lower Jurassic strata, commonly Sinemurian, occur along the eastern flank of the northern Coast Genticline and around Stikine Arch, resting unconformably on beds of Middle and Upper Triassic age ...
Several oval, biotite-hornblende granodiorite plutons in Stikine Arch and in the Pinchi and Omineca Genticlines intrude Upper Triassic and older rocks that have undergone little or no metamorphism. They were rapidly unroofed and contributed debris to the Lower Jurassic conglomerates ...
Douglas, J.R.W. ed.; 1970: p. 440.
The Stikine-Arch plutons mentioned by Douglas (previous) ranged in age from 187 to 200 million years; they were coeval with the Inklinian Orogeny.
The Tara property area is in the Nechako Trough which formed southeast of the Stikine Arch. The trough hosted the outpouring of marine volcanic flows, pyroclastics, and sediments which became the rocks of the Early Jurassic-age Hazelton Group. These andesitic volcanic rocks are the oldest rocks in the Tara property-area. Fossils from Hazelton Group sedimentary strata dated from 200 to 167 million years ago, indicating that deposition of Hazelton-Group rocks progressed throughout and after the Inklinian Orogeny.
Hazelton Group sedimentation was terminated by the onset of the Nassian Orogeny which lasted from about 167 to 163 million years ago. J.R.W Douglas described the Nassian Orogeny as follows:
34
The Nassian Orogeny during mid-Jurassic (Bathonian) time resulted in granitic intrusion on Vancouver Island and regional uplift of the western Cordillera. Uplift of the Atlin Horst and Skeena (later re-named Stikine) Arch segmented the Whitehorse and Nechako Troughs into Tantalus and Bowser Basins and Tyaughton Trough ... In the Skeena Arch the Hazelton and older rocks were folded along northeasterly trends and were probably intruded by granitic plutons prior to deposition of the Bowser Group in the earliest Upper Jurassic. This is suggested by intrusion of the Hazelton Group by the early, more easterly phases of the Coast Plutonic Complex ...
Douglas, J.R.W. ed.; 1970: p. 442.
A major mountain-building period, the Columbian Orogeny, occurred from about 142 to 88 million years ago, the Late Jurassic to Late Cretaceous Period. Troughs, the rocks of which are now located in eastern and central British Columbia, were deepened and filled with sediment. The Coast Mountains were created by uplift and the emplacement of the Coast Intrusive Complex, and deformation occurred throughout the terranes accreted to the western margin of proto-North America.
Throughout the region around Chelaslie Arm and the Tara property, granitic bodies intruded Hazelton Group rocks. Tipper (1963) mapped these as Unit 8 on Map 1131A (Figure 20).
The last major orogeny that occurred in the area now covered by British Columbia was the Laramide Orogeny. It occurred from about 75 to 30 million years ago, spanning Late Cretaceous to Oligocene time. J.R.W. Douglas (1970) described that event as follows:
In the Tertiary almost all of western Canada was land. The mountain belts formed during the Columbian Orogeny were rejuvenated and new mountain belts were produced by the Laramide Orogeny, the early phase of which began in the late Upper Cretaceous and the late phase ended probably in the early Oligocene ... The structures of the Columbian and older orogens were slightly modified and some movement took place on some previously formed faults. Scattered discordant bodies ... were intruded in the western cordillera. They include small stocks and sills related to the Columbian Zwischenbirge (associated with the Ootsa Lake Group) ...
Douglas, J.R.W. ed.; 1970: pp. 465-467.
This orogeny was represented in the region around Chelaslie Arm and the Tara property by fracturing and deposition of the Ootsa Lake Group volcanic and sedimentary rocks. Intruding and probably contemporaneous with these rocks is the system of veins and breccias that host the mineralization of the Bull showings area in the central part of the Tara property.
Eocene-age tensional fracturing opened conduits that enabled Endako Group flood basaltic and andesitic strata to be deposited on the early Tertiary-age erosional surface. Some of the conduits remain as dykes of mafic porphyritic rock.
35
The Late Tertiary Period was a time of regional erosion of the Nechako Plateau. Most of the major river and lake systems were developed at that time. Remnants of Endako Group flows were became caps, isolated atop mesas left by the regional erosion. Pleistocene glaciation rounded off hills and filled in valleys. Recent isostatic rebound has resulted in the down-cutting of many of the creek beds.
Stratigraphy around the Tara property-area was summarized by D.A. Caulfield (1992) as follows:
The oldest rocks identified in the area were assigned to the Upper Triassic and Lower Jurassic Takla Group by Tipper (1963). These consist largely of basalt and andesite with lesser interflow sediments (Unit 2 of Figure 20) ... of the Hazelton Group (Tipper et al., 1959).
Tipper’s (1963) Units 5 and 6 (Figure 20) comprise andesites, chert pebble conglomerate, marine clastic sediments and minor rhyolite which he assigned to the Middle and Upper Jurassic Hazelton Group. Tipper (pers. comm., 1991) feels that re-mapping may show the chert pebble conglomerates to be Cretaceous in age. Fossil evidence (Tipper, 1963) shows the Unit 6 sediments to be Bajocian (early Middle Jurassic). The Hazelton Group rocks (Units 2, 5, and 6) are broadly folded about a northwesterly-trending axis at least eighty kilometers (49 mi) long, centred on the Fawnie Range.
The Quanchus Intrusions, Late Cretaceous batholiths of granitic to granodioritic composition (Unit 8), cut Hazelton Group rocks south of the Bull (currently the Tara) property. These batholiths are generally coarse-grained equigranular and light coloured. Potassium argon dating indicates an age of 64.3 +/- 2.4 Ma for the Capoose Batholith, twenty kilometers (12.2 mi) southeast of the Bull (currently the Tara) claims ...
Flat-lying to moderately dipping, subaerial volcanics of the Ootsa Lake Group unconformity overlie older Mesozoic rocks, including the Cretaceous batholiths. Potassium-argon dating of the Ootsa Lake rocks at the Wolf prospect gave an age of 48 +/- 2 million years (mid-Eocene). Tipper (1963) divided the Ootsa Lake into two broad lithological units composed predominantly of andesites (Unit 10) (Figure 20). Each unit also contains minor clastic sediments, such as basal conglomerate, tuffaceous shales and sandstones.
Eocene plateau basalts and andesites of the Endako Group (Unit 11) unconformably overlie all other units.
Caulfield, D.A.; 1992: pp. 4-5.
36
A table of geological events and lithological units in the Chelaslie Arm area is as follows:
Table 6
Table of Geological Events and Lithological Units
in the Chelaslie Arm Area
Time | Formation or Event |
Recent 0.01-0 m.y. | Valley rejuvenation, down cutting of stream gullies through till, development of soil profiles |
Pleistocene 1.6-0.01 my. | Glacial erosion and deposition: removal of Tertiary-age regolith, deposition of till and related sediments at lower elevations, smoothing of the Tertiary-age land surfacce |
Eocene to Pliocene 57.1-1.6 m.y. | Erosion, incision of the land surface |
Eocene 54-35 m.y. | Regional tension: development of normal faults. Endako Group deposition: outpouring of subaerial flood basalt onto erosional surface. Andesitic dykes represent feeders to flood basalt flows |
Paleocene to Eocene 54 (more or less) m.y. | Erosion |
Late Cretaceous to Paleocene 75-54 m.y. | Laramide Orogeny: Folding and faulting Ootsa Lake Group deposition: intrusion of intermediate to felsic volcanic rocks and associated sediments, mostly fresh-water and subaerial MINERALIZATION: Development of epigenetic breccias and polymetallic veins carrying gold, silver, lead, zinc, copper, etc. |
Middle to Late Cretaceous 88-75 m.y. | Erosion |
Late Jurassic to Middle Cretaceous 144-88 m.y. | Columbian Orogeny: intrusion of the Quanchus granitic bodies into Hazelton Group rocks |
Middle Jurassic 167-163 m.y. | Nassian Orogeny: Re-emergence of the Stikine Arch, deepening of flanking basins regional deformation and metamorphism, overriding of Cache Creek Terrane rocks onto Quesnel Terrane Rocks to the east and Stikine Terrane (Hazelton Group) rocks to the west along thrust faults |
Early to Middle Jurassic 200-167 m.y. | Hazelton Group deposition: basal conglomerate followed by andesitic volcanic and open-basin sedimentary deposition |
Late Triassic to Early Jurassic 200-188 m.y. | Inklinian Orogeny: Deformation producing the Stikine Arch, intrusion of granitic bodies, rapid unroofing and deposition of basal conglomerates on an erosional surface along the flanks of the arch |
Early Mississippian to Late Triassic 362-208 m.y | Cache Creek Complex sediments and volcanic rocks deposited in an open ocean basin |
m.y. = million years ago |
37
38
3.2 Regional Geophysics
In 1968, Lockwood Survey Corporation Ltd. Was contracted to fly an aeromagnetic survey over central British Columbia including the Chelaslie Arm area. Energy, Mines, and Resources Maps 5288G and 5289G covering N.T.S. map-areas 93 F/6 and 93 F/5 respectively, were two of the aeromagnetic maps produced. The Tara property area is near the northeastern corner of Map 5289G (Figure 22).
The Tara property is located on the southwestern flank of an aeromagnetic high that is centered on exposures of Hazelton Group and Ootsa Lake Group volcanic rocks (Figures 20 to 22). The most intense part of this high is located southeast of Dog Lake, a small lake located about 1.5 mi (2.4 km) northeast of the Tara property area (Figure 22). Total field magnetism near Dog Lake exceeds 7,500 gammas (nanoteslas) above the base-level of the map-area. The total magnetic field intensity around most of Chelaslie arm is about 5,200 gammas (nanoteslas) above the base-level. There is a positive disturbance in the total magnetic field near the Bull showings area in the central part of the Tara property area.
3.3 Property Geology
Most of the Tara property area is unmapped in detail. The only mapping in the property area is that of D.A. Caulfield (1992) who mapped a 0.22 mi2 (0.6 km2) area around the Bull showings (Figure 23) and some outcrops along logging roads north of it (Figure 24).
Caulfield’s summary of the property geology was as follows:
Where examined, the Bull (currently the Tara) property is underlain by a sequence of Lower to Middle Jurassic Hazelton Group rhyolitic and andesitic volcanics with minor epiclastic sediments. These units have been intruded by Paleocene Ootsa Lake Group rhyolite dykes which in turn are cut by diabase dykes thought to be feeders to the Eocene Endako Group mafic flows (Figures 23 and 24).
The Lower to Middle Jurassic Hazelton Group rock units consist of mafic volcaniclastics and epiclastics in the grid area. The oldest mapped rocks, mafic volcanic tuffs and breccias (Unit 1A), form the large brown-weathering bluffs in the southwestern part of the grid and further south. These bluffs are comprised of a thick succession of grit-textured tuffaceous debris with areas of large sub-angular to sub-rounded, cobble size fragments. On fresh surfaces, the tuffs consist of feldspar fragments supported in a grey-green aphanitic matrix with <1% disseminated pyrite. The breccia unit is similar with regards to composition, colour, and texture of the matrix, but contains large mafic volcanic, quartz-porphyritic rhyolite and siliceous green argillite clasts. The bleached white, rhyolite fragments are easily recognizable against the brown-weathering mafic component of the breccia on the outcrop surface.
39
40
41
The coarse fraction may be poorly sorted, but no graded bedding was observed. Within the grid, the sorted layering indicates a north-south strike and moderate easterly dip to the unit. These volcaniclastics have been assigned to the Hazelton Group as opposed to the older Takla Group, due to the distinct sorting and difference in composition between the matrix and fragments (Tipper, 1959).
The classification of the mafic volcanic flows (Unit 1B) (Figure 23) is based on the outcrops observed on L5+00S on the east side of the grid. Outcrops adjacent to felsic dykes are comprised of dark green weathering, siliceous exposures. Crowded white euhedral feldspar phenocrysts were noted within this unit at 5+15S, 1+30E. The degree of hornfelsing and alteration imparted by nearby intrusives makes classification of these exposures tentative at best.
Exposures of rhyolitic flow banded tuffs (Unit 1C) are exposed in tractor scrapings in two locations along the logging access road passing diagonally through the Bull 2 (currently north of the TARA PROPERTY (776842)) claim. Within the two exposures, five different tuff horizons were identified based on colour variations and textural differences. All of the units are distinguished by their siliceous nature and the presence of quartz and feldspar phenocrysts and/or fragments. In the most northerly exposure, light rusty brown weathering is present throughout the central portion of the outcrop, reflecting 5% pyrite occurring as disseminations and concentrations within clasts. This mineralization is accompanied by epidote and chlorite alteration. Garnet and epidote alteration were observed in outcrop adjacent to a pond west of the logging road (Figure 24).
Hazelton Group epiclastics (Unit 2) were mapped within the grid area and in the logging slash in the (northern part of the TARA PROPERTY (776842)) claim (Figure 24). These consist of argillite, siltstone, and pebble conglomerate. One small, light brown outcrop of interbedded black argillite and grey siltstone, with 2-3% disseminated pyrite, occurs at 6+00S, 0+50W. Calcareous fossil molds of ribbed pelecypods (Trigonia sp.) are found at this location, within similar looking subcrop at 7+00S, 2+50E and in the logging slash north of the grid. At all three locations, this unit is very hard, exhibiting “chert-like” conchoidal fracturing. Elsewhere, the siltstone is interbedded with darker green grit layers composed of volcaniclastic material. The pebble conglomerate was located at the south end of the baseline and at 6+25S, 0+75W. The outcrop surface has weathered to a knobby texture, and is generally a buff in colour. The sub-rounded clasts are 1-2 centimeters in size, dominantly dark green, siliceous and showing no preferred alignment or grading. Stratigraphically, the pebble conglomerate lies within Unit 1A close to the main volcanic-sediment contact (Units 1A-2). Additionally, a very hard, light green argillite bed occurs below this contact (6+00S, 0+75W). Calc silicate development, including epidote and garnet, occurs within sedimentary units adjacent to felsic dykes.
A number of prominent, chalky white rhyolite dykes (Unit 3) trend northwesterly through the grid. In addition to the bleached colour and resistant nature, the dykes can be recognized by their abundant jointing and the presence of goethite coated vugs. The dykes contain euhedral (0.2-0.4 inch) (5-10 mm) feldspar phenocrysts and very often, contain anhedral (0.08 inch) (2 mm) quartz phenocrysts. The colour of the matrix varies from fleshy white to pale green, and the intrusive is non-magnetic. Mafic and sulphide (pyrite>>chalcopyrite) minerals average <1% of the rock mass. The dykes swarm through the eastern part of the grid; there is no evidence to indicate that these dykes coalesce into a larger body at depth or along strike. Where observed, dyke contacts are sharp and crosscut stratigraphy (6+70S, 1+80E). The amount of sulphide mineralization within the dykes is insignificant, but increased pyrite and pyrrhotite mineralization are present in hornfelsed contact rocks. These rhyolite dykes are thought to be feeders to the Paleocene Ootsa Lake Group volcanics.
42
The youngest rock unit on the property is a light grey weathering diabase (Unit 4) dyke. The dyke(s?) strikes northerly and dips moderately to the east, crosscutting all other units. It is probable that these unaltered dykes are feeders for the Eocene Endako Group andesitic and basaltic flows. On fresh surface, the dyke is fine to medium-grained, containing equal amounts of mafic and feldspar grains. Normally, the diabase is equigranular, but porphyritic needles of pyroxene and feldspar have been noted. Metallic minerals include 1-2% pyrite and 3-4% magnetite.
According to the government mapping, a northwest trending syncline passes through the Bull (currently Tara) property. Attitudes taken in the Hazelton strata are consistent with this interpretation, indicating that the strata in the grid area lies on the southwestern limb of the fold. A number of prominent topographic linears cross the property which may be interpreted as faults; displacement was confirmed along one north and one northeast trending fault, suggesting that faulting preceded emplacement of the Eocene dykes. On the south end of the grid, a strong northeast trending linear crosses the property. The location and orientation of the pebble conglomerate (10+50S, 0+25E; 6+25S, 0+75W) on either side of this structure, indicates left lateral displacement has occurred along this linear.
Caulfield, D.A.; 1992: pp. 6-8.
4.0 MINERALIZATION AND DEPOSIT TYPE SOUGHT ON THE TARA PROPERTY
4.1 Deposit Type Sought: Polymetallic Veins
The mineral exploration targets on the Tara property are epigenetic polymetallic vein systems like those exposed in the Bull showings-area. The vein system at the Bull showings-area is one of several such vein systems that have been explored on Nechako Plateau near the Tara property.
A nearly orthogonal fracture pattern revealed by soil-molybdenum concentrations from the 1992 survey indicate that the vein systems on the Tara property may be a manifestation of a molybdenum-bearing hydrothermal system at depth (Figure 25) (section 7.0, this report). At the current state of exploration, any association between these veins and an underlying hydrothermal system is unsubstantiated.
Polymetallic veins were described by D. V. Lefebure and B.N. Church as follows:
POLYMETALLIC VEINS Ag-Pb-Zn+/-Au I05
IDENTIFICATION
| SYNONYMS: | Clastic metasediment-hosted silver-lead-zinc veins, silver/base metal epithermal deposits. |
COMMODITIES (BYPRODUCTS): Ag, Pb, Zn, (Cu, Au, Mn)
43
EXAMPLES (British Columbia (MINFILE # - Canada/ International):
| ! | Metasediment host: Silvana (082FNW050) and Lucky Jim (082KSW023), Slocan-New Denver-Ainsworth district, St. Eugene (082GSW025), Silver Cup (082KNW027), Trout Lake camp; Hector-Calumet and Elsa, Mayo district (Yukon, Canada), Coeur d’Alene district (Idaho, USA), Harz Mountains and Freiberg district (Germany), Pribram district (Czechoslavakia). |
| ! | Igneous host: Wellington (082ESE072) and Highland Lass – Bell (082ESW030, 133), Beverdell camp; Silver Queen (093L002), Duthie (093L088), Cronin (093L127), Porter-Idaho (103P089), Indian (104B031); Sunnyside and Idorado, Silverton district and Creede (Colorado, USA), Pachuca (Mexico). |
GEOLOGICAL CHARACTERISTICS
CAPSULE DESCRIPTION: Sulphide-rich veins containing sphalerite, galena, silver and sulphosalt minerals in carbonate and quartz gangue. These veins can be subdivided into those hosted by metasediments and another group hosted by volcanic or intrusive rocks. The latter type of mineralization is typically contemporaneous with emplacement of a nearby intrusion.
TECTONIC SETTINGS: These veins occur in virtually all tectonic settings except oceanic, including continental margins, island arcs, continental volcanics and cratonic sequences.
DEPOSITIONAL ENVIRONMENT / GEOLOGICAL SETTING:
| ! | Metasediment host: Veins are emplaced along faults and fractures in sedimentary basins dominated by clastic rocks that have been deformed, metamorphosed and intruded by igneous rocks. Veins postdate deformation and metamorphism. |
| ! | Igneous host: Veins typically occur in country rock marginal to an intrusive stock. Typically veins crosscut volcanic sequences and follow volcano-tectonic structures, such as caldera ring-faults or radial faults. In some cases the veins cut older intrusions. |
AGE OF MINERALIZATION: Proterozoic or younger, mainly Cretaceous to Tertiary in British Columbia.
HOST / ASSOCIATED ROCK TYPES: These veins can occur in virtually any host. Most commonly the veins are hosted by thick sequences of clastic metasediments or by intermediate to felsic volcanic rocks. In many districts there are felsic to intermediate intrusive bodies and mafic igneous rocks are less common. Many veins are associated with dykes following the same structures.
DEPOSIT FORM: Typically steeply dipping, narrow, tabular or splayed veins. Commonly occur as sets of parallel and offset veins. Individual veins vary from centimeters up to more than 3 m (9.8 ft) wide and can be followed from a few hundred to more than 1000 m (3,280 ft) in length and depth. Veins may widen to tens of metres in stockwork zones.
TEXTURE / STRUCTURE: Compound veins with a complex paragenetic sequence are common. A wide variety of textures, including cockade texture, colliform banding and crustifications and locally druzy. Veins may grade into broad zones of stockwork or breccia. Coarse-grained sulphides as patches and pods, and fine-grained disseminations are confined to veins.
ORE MINERALOGY [Principal and subordinate): Galena, sphalerite, tetrahedrite-tennanite, other sulphosalts including pyragyrite, stephanite, bournonite, and acanthite, native silver, chalcopyrite, pyrite, arsenopyrite, stibnite. Silver minerals often occur as inclusions in galena. Native gold and electrum in some deposits. Rhythmic compositional banding sometimes present in sphalerite. Some veins contain more chalcopyrite and gold at depth and Au grades are normally low for the amount of sulphides present.
44
GANGUE MINERALOGY [Principal and subordinate]:
| ! | Metasediment host: Carbonates (most commonly siderite with minor dolomite, ankerite and calcite), quartz, barite, fluorite, magnetite, bitumen. |
| ! | Igneous host: Quartz, carbonate (rhodochrosite, siderite, calcite, dolomite), sometimes specular hematite, hematite, barite, fluorite. Carbonate species may correlate with distance from source of hydrothermal fluids with proximal calcium and magnesium-rich carbonates and distal iron and manganese-rich species. |
ATERATION MINERALOGY: Macroscopic wall rock alteration is typically limited in extent (measured in metres or less). The metasediments typically display sericitization, silicification and pyritization. Thin veining of siderite or ankerite may be locally developed adjacent to veins. In the ones dAlene camp a broader zone of bleached sediments is common. In volcanic and intrusive hostrocks the alteration is argillic, sericitic or chloritic and may be quite extensive.
WEATHERING: Black manganese oxide stains, sometimes with whitish melanterite, are common weathering products of some veins. The supergene weathering zone associated with these veins has produced major quantities of manganese. Galena weathers to secondary PB and Zn carbonates and Pb sulphate. In some deposits supergene enrichment has produced native and horn silver.
ORE CONTROLS: Regional faults, fault sets and fractures are an important ore control; however, veins are typically associated with second order structures. In igneous rocks the faults may relate to volcanic centers. Significant deposits restricted to competent lithologies. Dikes are often emplaced along the same faults and in some camps are believed to be roughly contemporaneous with mineralization. Some polymetallic veins are found surrounding intrusions with porphyry deposits or prospects.
GENETIC MODELS: Historically these veins have been considered to result from differentiation of magma with the development of a volatile fluid phase that escaped along faults to form the veins. More recently researchers have preferred to invoke mixing of cooler, upper crustal hydrothermal or meteoric waters with rising fluids that could be metamorphic, groundwater heated by an intrusion or expelled directly from differentiating magma. Any development of genetic models is complicated by the presence of other types of veins in many districts. For example, the Freiberg district has veins carrying F-Ba, Ni-As-Co-Bi-Ag and U.
COMMENTS: Ag-tetrahedrite veins, such as the Sunshine and Galena mines in Idaho, contain very little sphalerite or galena. These may belong to this class of deposits or possibly five-element veins. The styles of alteration , mineralogy, grades and different geometries can usually be used to distinguish the polymetallic from the stringer zones found below syngenetic massive sulphide deposits.
ASSOCIATED DEPOSIT TYPES:
| ! | Metasediment host: Polymetallic mantos (M01). |
| ! | Igneous host: May occur peripheral to all types of porphyry mineralization (L01, L03, L04, L05, L08) and some skarns (K02, K03). |
EXPLORATION GUIDES
GEOCHEMICAL SIGNATURE: Elevated values of Zn, Pb, Mn, Cu, Ba and As. Veins may be within arsenic, copper, silver, mercury aureoles caused by primary dispersion of elements into wallrocks or broader alteration zones associated with porphyry deposit or prospects.
GEOPHYSICAL SIGNATURE: May have elongate zones of low magnetic response and/or electromagnetic, self potential or induced polarization anomalies related to ore zones.
OTHER EXPLORATION GUIDES: Strong structural control on veins and common occurrence of deposits in clusters can be used to locate new veins.
45
ECONOMIC FACTORS
TYPICAL GRADE AND TONNAGE: Individual vein systems range from several hundred to several million ones grading from 5 to 1500 g/t (0.15 to 438 oz/ton) Ag, 0.5 to 20% Pb and 0.5 to 8% Zn. Average grades are strongly influenced by the minimum size of deposit included in the population. For B.C. deposits larger than 20000 t the average size is 161000 t with grades of 340 g/t (9.9 oz/ton) Ag, 3.47% Pb and 2.66% Zn.
Copper and gold are reported in less than half the occurrences, with average grades fo 0.09% Cu and 4 g/t (0.12 oz/ton) Au.
ECONOMIC LIMITATIONS: These veins usually support small to medium-size underground mines. The mineralization may contain arsenic which typically reduces smelting credits.
IMPORTANCE: The most common deposit type in British Columbia with over 2000 occurrences; these veins were a significant source of Ag, Pb, and Zn until the 1960s. They have declined in importance as industry focused more on syngenetic massive sulphide deposits. Larger polymetallic vein deposits are still attractive because of their high grades and relatively easy beneficiation. They are potential sources of cadmium and germanium
Lefebure, D.V. and Church, B.N.
in:
Lefebure, D.V. and Hy, Trygve ed.; 1996, pp. 67-69.
4.2 Polymetallic Vein Systems on the Nechako Plateau near the Tara Property
Several polymetallic vein systems have been explored and developed on Nechako Plateau in the region around the Tara property. Attributes of some of the larger ones were summarized by D.A. Caulfield (1992) as follow:
Several styles and ages of mineralization have been documented in the vicinity of the Bull (currently the Tara) property , despite a relative lack of exploration attention. The Capoose silver deposit, located 30 kilometers (20 miles) southeast of the (Tara property) , is hosted by Lower to Middle Jurassic Hazelton Group mafic flows, rhyolite tuff, argillite and lithic wacke intruded by Late Cretaceous quartz-garnet rhyolite sills related to the Capoose Batholith. Mineralization consists of pyrite, sphalerite, galena, chalcopyrite and arsenopyrite in disseminations, fracture-fillings and replacing garnets, and is thought to be Late Cretaceous in age The Capoose deposit contains 20 million ones (22 million tons) grading 48 g/tonne (1.4 oz/ton) silver and 0.5 g/tonne (0.015 oz/ton) gold The Capoose Batholith itself has been extensively explored for porphyry-style copper-molybdenum mineralization, with the best prospects lying a few kilometers to the northwest of the Capoose silver deposit.
The Wolf epithermal gold-silver prospect, located 25 kilometers (15.3 miles) south of the (Tara) property, is hosted by Paleocene Ootsa Lake rhyolitic flows, tuffs and subvolcanic intrusives. Repeated low-sulphide silicification, brecciation and stockwork veining have been accompanied by up to 8.49 g/tonne (0.25 oz/ton) gold and 42.2 g/tonne (1.25 oz/ton) silver across 7.5 metres (24.6 feet) in trenching
46
The Fawn property, which lies 30 kilometers (20 miles) southeast of the (Tara property), hosts high sulphide epithermal mineralization associated with felsic Paleocene dykes cutting Hazelton Group andesites. Alteration and mineralization are limited to a series of recessive, easterly-trending, VLF-EM (very low frequency electromagnetic) conductors with widths exceeding 20 metres (65.6 feet) and strike lengths which have been defined for up to 2,200 metres (7,216 feet). Separate subcrop samples from the Fawn have returned assays of up to 12.9 g/tonne (0.38 oz/ton) gold and 637 g/tonne (18.58 oz/ton) silver …
The PEM property, located 50 kilometers (30 miles) southeast of the (Tara) property, is underlain by andesitic, dacitic, and rhyolitic tuffs, presumably of the Ootsa Lake Group. These have been brecciated and altered over an area of several hundred metres, with introduction of 2-7% pyrite and lesser sphalerite… Drill intersections up to 6.3 metres (20.7 feet) grading 14.3 g/tonne (0.42 oz/ton) gold, 27 g/tonne (0.79 oz/ton) silver and 1.25% zinc (are reported)…
Caulfield, D.A.; 1992: pp. 5-6.
4.3 Mineralization on the Tara Property
The only detailed description of mineralization on the Tara property was that of D.A. Caulfield (1992). His description of mineral occurrences in the property area is as follows:
The most significant gold- and silver-bearing mineralization found to date on the Bull (currently the Tara) property was located on the grid at 3+00S, 1+00W (Figures 4, 14 to 19 and 23). A quartz vein stockwork and breccia at this location is accompanied by pervasive silicification and up to 5% pyrite, 3% galena and 1% sphalerite. There appear to be at least two vein structures striking east-west with near vertical dips. The veining is exposed over a strike length of 20 metres (65.6 feet), and the width of the zone is difficult to estimate due to lack of exposure, but individual vein outcrops exceed 2.0 metres (6.6 feet) in width and the positions of these outcrops relative to each other would indicate a total width of at least 4.0 metres (13.1 feet). The vein system remains open along strike to the west and probably continues to the east as far as the baseline (see section 2.1, this report), but appears to be cut off by rhyolite dykes farther east. The mineralization is hosted in tuff/breccia of Unit 1A. Sampling data for this occurrence is (as follows:)
Table 7
1992 Sleeping Gold Survey:
Rock Sampling Results
| Sample No. | Type | Width ft m | Gold ppb | Silver ppm | Arsenic ppm | Copper ppm | Lead ppm | Antimony ppm | Zinc ppm |
| 463761 | Float | N/A | 0.62 oz/ton 21.4 gm/mt | 5.44 oz/ton 186.5 | 440 | 168 | 3.30% 33,000 | 288 | 0.05% 532 |
| 463762 | Grab | 1.0 0.30 | 0.06 oz/ton 2.1 gm/mt | 0.64 oz/ton 22.0 | 108 | 10 | 0.27% 2730 | 30 | 34 |
| 463763 | Grab | 1.5 0.45 | 130 | 0.40 oz/ton 13.8 | 116 | 7 | 0.07% 710 | 12 | 38 |
| 463764 | Grab | 6.6 2.00 | 95 | 0.12 oz/ton 4.2 | 230 | 15 | 0.03% 260 | 10 | 68 |
| 463768 | Grab | 1.0 0.30 | 200 | 1.45 oz/ton 49.8 | 310 | 18 | 0.32% 3230 | 34 | 0.01% 106 |
NOTES: 1 gram per metric ton (gm/mt) = 0.2917 troy ounces per short ton (oz/ton).
10,000 parts per million (ppm) = 1%.
47
The assay results show that arsenic, lead and antimony are anomalous in the vein samples. Two northerly trending quartz veins are located 80 metres (262.4 feet) southeast of the above zone; the two samples taken at this location returned low precious metal values. The only other sample (463773), taken from float in the logging slash on the Bull 2 claim, contained elevated zinc values (2090 ppm or 0.21%) with all other metal values at background levels (Figure 24).
The hornfelsed and skarned areas adjacent to the rhyolite dykes are quite often gossanous from weathering of pyrite and pyrrhotite. This mineralization occurs with epidote, chlorite and pervasive silicification. Garnet was found in one spot where fossiliferous limey sedimentary horizons are located. Geochemical analysis of these areas returned background metal values except for a single (soil) sample (463758 – 144 ppm Pb, 304 ppm Zn).
Pyrite is associated with rhyolite tuffs exposed on the logging road on the Bull 2 claim (Figure 24). Two (rock) samples taken at this location returned low metal values.
Caulfield, D.A.; 1992: pp. 8-9.
5.0 EXPLORATION AND DRILLING
5.1 Summary of the Exploration Conducted by Press Ventures Inc.
5.2 Procedures and Parameters of the Current Exploration Program
5.3 Results and Interpretation of the Current Exploration Program
5.4 Exploration Managers and Contractors
5.5 Drilling
To the knowledge of the author, neither Press Ventures Inc. (the issuer) nor any other party has conducted any exploration in the Tara property-area since the Sleeping Gold work program of 1992. Thus there is no current exploration upon which to report.
6.0 SAMPLING
6.1 Sampling Method and Approach
6.2 Sample Preparation, Analysis, and Security
Because no current exploration has been conducted on the Tara property, there is no current sampling upon which to report.
48

49
50
7.0 DATA VERIFICATION
There is no data from a current exploration program to verify. All available data from the 1973, 1980, and 1992 exploration programs have been reviewed by the writer who is the Qualified Person for the Tara project as described in Part 1.1 of National Instrument 43-101.
The 1973 Endako soil survey resulted in the discovery of two co-incident lead and zinc anomalies. The smaller of them was located near the northwestern corner of the current Tara property; the larger was located in the east-central part of it (Figures 5 and 6). Although the 1980 Prism grid covered both 1973 anomalies, only the area covered by the eastern anomaly seems to have been sampled. Concentrations of copper, lead, and zinc from the 1980 Prism survey confirmed the 1973 Endako eastern anomaly (Figures 7 to 9).
The re-analysis of the 1980 sample pulps for molybdenum revealed three small, mild, linear soil-molybdenum anomalies. The largest of them was about 492 ft (150 m) long. It was located about 1,968 ft (600 m) southeast of the Bull showings-area (Harivel and Livingstone, 1982) (Figures 13).
During the early 1990s, molybdenum was out of favor and not sought by many junior exploration companies. Although D.A. Caulfield (1992) had the soil samples from the 1992 Sleeping Gold survey analyzed for molybdenum, he did not contour that data. The author contoured the 1992 Sleeping Gold molybdenum results and plotted them with the most intense 1980 Prism soil-molybdenum anomalies (Figure 25).
In the author’s experience, soil-molybdenum concentrations in areas of exposed molybdenum mineralization range from 10 ppm to in excess of 50 ppm. The soil-molybdenum concentrations in the central part of the TARA PROPERTY (776842) claim range from below a detection limit of 1 ppm to 10 ppm near the Bull showings. The writer considers these concentrations to be elevated but not anomalous. They are typical of what one would expect to encounter in an area of molybdenum leakage up a vein system from a source at depth.
When contoured at 2, 4 and 8 ppm, soil-molybdenum concentrations on the Tara property define a sub-vertical, nearly orthogonal fracture set. Most of the primary fractures seem to have a right-lateral transcurrent displacement and are oriented at N3EW - S3EE (357E - 177E). The secondary fractures are oriented at N83EW - S83EE (277E - 097E). Fractures of both orientations host elevated soil-molybdenum concentrations.
51
By comparison, the soil-molybdenum anomalies from the 1992 survey are quite intense and much more useful in determining the locations of molybdenum enrichment than are those from the 1980 survey (Figure 25). Obviously the amount of molybdenum in those soil profiles has not changed significantly from 1980 to 1992. The author is of the opinion that the difference in the results of the two soil surveys is due to improvements in lab techniques, most notably to the development of the ICP (induced coupled plasma) technique which was used to analyze the 1992 soil samples.
Detailed mapping was conducted during 1992 around the eastern 1973 soil lead-zinc anomaly. That work resulted in the confirmation of the existence of epigenetic quartz vein stockwork and breccia systems that D.A. Caulfield (1992) related to Paleocene-age Ootsa Lake Group felsic volcanic rocks.
The soil-molybdenum distribution from that survey indicates to the author that the epigenetic veins and stockworks that are exposed on surface are related to an orthogonal, near vertical set of fractures that may be located above a molybdenum-bearing hydrothermal system at some unknown depth (Figure 25).
Previous explorers had difficulty tracing mineralization northwest of the Bull showings area. This could be due to a 1,000-ft (305-m) right-lateral translation along a fault near the Bull showings that displaced stockwork and vein mineralization northward (Figure 25). Also, vertical movement along the same fault plane may have displaced rocks northwest of the Bull showings to a comparitively deeper level which could decrease exposure of mineralization in that area.
A detailed examination of the central part of the TARA PROPERTY (776842) claim will be necessary to confirm the author’s speculation regarding the association of epigenetic vein and stockwork mineralization with the upper level of a molybdenum-bearing hydrothermal system (see section 12.2, this report).
8.0 ADJACENT PROPERTIES
No development on any adjacent property affects the potential of the Tara property.
52
9.0 MINERAL PROCESSING, RESOURCES AND RESERVES
9.1 Mineral Processing and Metallurgical Testing
9.2 Mineral Resource and Reserve Estimates
No mineral processing and metallurgical testing conducted on samples from the Tara property area are known to the writer.
No current mineral resource or mineral reserve estimates from the Tara property area are known to the writer.
10.0 OTHER RELEVANT DATA AND INFORMATION
There are no unusual or unique circumstances or facts affecting the ownership, or potential to develop the Tara property.
11.0 REPORTING REQUIREMENTS FOR DEVELOPMENT AND PRODUCTION PROPERTIES
The Tara property is an early-stage exploration property on which no current mineral resources or mineral reserves have been quantified. Reporting requirements for development and production properties contained within National Instrument 43-101 are not applicable to this report.
12.0 CONCLUSIONS AND RECOMMENDATIONS
12.1 Conclusions
Press Ventures Inc. has conducted no exploration on the Tara property, thus there is no current exploration upon which to report. Three reconnaissance exploration campaigns have been conducted in the Tara property-area in: 1973, 1981, and 1992.
The exploration targets currently sought on the Tara property are epigenetic polymetallic vein systems. The Bull showings area, located near the center of the property-area hosts epigenetic quartz vein stockwork and breccia systems that are exposed on surface and in several small prospect trenches. The largest exposed system reportedly exceeds 13.2 ft (4 m) in width and is exposed for a length of 66 ft (20 m). A float sample of mineralization assumed to have been from the stockwork contains 0.62 oz/ton (21.4 gm/mt) gold, 5.44 oz/ton (186.5 gm/mt) silver, and 3.3% lead. Samples from some small exploration cuts
53
into the stockwork yield an average of 0.02 oz/ton (0.63 gm/mt) gold and 0.65 oz/ton (22.4 gm/mt) silver. The system was considered by the most recent examiner to be open to the west along strike and soil data indicated that it could extend for at least 328 ft (100 m) to the east. Soil survey results also indicated that at least one other mineralized system may have been located in the survey area.
Upon contouring elevated soil-molybdenum concentrations from the 1992 data, the author recognized that the epigenetic vein and stockwork systems are located within an extensive sub-vertical, nearly orthogonal fracture set that have surface traces oriented almost north-south and east west. Soil-molybdenum concentrations along the presumed surface traces of these fractures range up to 10 ppm, which is typical of concentrations resulting from molybdenum transport up siliceous fracture fillings from a source at depth. The epigenetic veins and stockwork systems exposed on surface on the Tara property may be an expression of the upper part of a molybdenum-bearing hydrothermal system. Several such hydrothermal systems hosting porphyry-molybdenum deposits have been explored in the region around the Tara property. The best-known is at the Endako molybdenum mine, located at Smithers, British Columbia.
The extent of and depth potential of the polymetallic vein system examined in the Bull showings and their relation to a larger mineralized hydrothermal system remains untested. Also, the areas hosting part of the eastern, and all of the western 1973 soil anomalies remain unexplored.
12.2 Recommendations
I recommend that a two-phase program of exploration be conducted on the Tara property. Because of the paucity of previous work in most of the property-area, it would be prudent to commence exploration with an initial phase of prospecting and 1:5,000-scale geological mapping. Concentration during this phase of work should be on assessing the extent of the epigenetic vein mineralization and its relation to a possible underlying molybdenum-bearing hydrothermal system. There should be a specific focus on the relationships among mineralization, structural geology, and alteration. Also, careful drift prospecting should be conducted throughout the whole property area. The first phase of the recommended program will require a geologist and a prospector to be retained in the field for a total of 9 days of which 7 days will be spent on the property.
Proceeding with the second phase of the recommended exploration program should be contingent upon reasonable encouragement for success having been gained from the results of the previous phase of work.
54
Soil surveys have been successful during previous exploration in the identification of potentially mineralized areas in the Tara property-area. The most recent soil survey was conducted in 1992, 19 years ago. During that time, lab techniques have improved substantially. It is expected that the data generated by a current soil survey will be much more definitive than that from the 1992 soil survey.
I recommend that a soil survey be conducted in an area covering about 80% of the property, including the area of the 1992 survey. The Bull showings are near the crest of a low ridge that transects the property along a northwest-southeast trending axis (Figures 2 and 4). A crest is located on the ridge at 53E 26' 50" N., 125E 31" 03" W. (U.T.M.: 5,924,755 N., 332,825 E.). A baseline should be extended for 2,953 ft (900 m) northwest and for 3,609 ft (1,100 m) southeast of the crest. Lines spaced 328 ft (100 m) apart should be extended northeast and southwest of the baseline. Soils along those lines should be sampled at 164-ft (50-m) intervals.
Lines extending from the baseline near the crest and the center of the grid should be a maximum of 1.22 mi (2 km) long. Line length should decline progressively to the ends of the baseline where they should be from 0.24 to 0.37 mi (0.4 to 0.6 km) long. This will allow a grid with northeast-southwest trending lines to fit on a rectangular claim with north-south and east-west trending boundary lines. It is estimated that the recommended grid will comprise a total of 13.3 mi (21.8 km) of sampled lines and 1.2 mi (2 km) of baseline. It is expected that a total of 457 soil samples will be taken.
Also during a second phase of exploration, any mineral showings that were discovered during the first phase of mapping and prospecting should be cleaned off by hand-trenching and sampled.
The second phase of the recommended program will require a geologist and 2 prospector-technicians to be retained in the field for a total of 30 days of which 28 days will be spent on the property.
Estimated costs of the two phases of the recommended work program are as follow:
55
Table 8
Estimated Cost of the Recommended First-phase Program
| Item | Estimated cost $US $CDN | Cumulative cost $US $CDN |
Wages: Geologist @ $US510 ($CDN500)/day 9 days field work + 7 days reporting . . . . . . . . . . . . . . . . . . . . . Prospector @ $US306 ($CDN300) 9 days field work . . . . . . . . . . . . . . . . . . . . . . . . . . . . . . . . . . . . | $ 8,160 $ 8,000 $ 2,754 $ 2,700 $ 10,914 $ 10,700 | $ 10,914 $ 10,700 |
Transport: Truck; 9 days @ $US102 ($CDN100)/day . . . . . . . . . . . . . . . . Gasoline and oil . . . . . . . . . . . . . . . . . . . . . . . . . . . . . . . . . . . . . Helicopter; 3 hrs @$US1,326 ($CDN1,300)/hour . . . . . . . . . . | $ 918 $ 900 $ 612 $ 600 $ 3,978 $ 3,900 $ 5,508 $ 5,400 | $ 5,508 $ 5,400 |
Camp Supplies and Communications: Satellite phone; 1 month @ $US1,530 ($CDN1,500)/ month . . Fly camp rental including tools and chain saw; 0.33 month @ $US816 ($CDN800)/month . . . . . . . . . . . . . . . . Camp supplies . . . . . . . . . . . . . . . . . . . . . . . . . . . . . . . . . . . . . . | $ 1,530 $ 1,500 $ 272 $ 267 $ 122 $ 120 $ 1,924 $ 1,887 | $ 1,924 $ 1,887 |
Crew Costs: Hotel; 2 nights @ $US102 ($CDN100)/night . . . . . . . . . . . . . . Camp food and restaurant meals . . . . . . . . . . . . . . . . . . . . . . . . | $ 204 $ 200 $ 734 $ 720 $ 938 $ 920 | $ 938 $ 920 |
Reporting Costs: Analysis of 30 rock samples @ $US51 ($CDN50) /sample. . . . Office costs . . . . . . . . . . . . . . . . . . . . . . . . . . . . . . . . . . . . . . . . | $ 1,530 $ 1,500 $ 204 $ 200 $ 1,734 $ 1,700 | $ 1,734 $ 1,700 |
| $ 21,018 $ 20,607 | ||
| H.S.T. (Harmonized sales tax): 12% of previous items | $ 2,522 $ 2,473 | |
| $ 23,540 $ 23,080 | ||
| Contingency: 10% of itemized budget | $ 2,354 $ 2,308 | |
| Total estimated cost of Recommended First-phase Program | $ 25,894 $ 25,388 |
| NOTE: | An exchange rate of $US1.02 : $CDN1.00 as quoted by http://stockwatch.com/ on March 22, 2011 is used to generate costs in American dollars. |
56
Table 9
Estimated Cost of the Recommended Second-phase Program
| Item | Estimated cost $US $CDN | Cumulative cost $US $CDN |
Wages: Geologist @ $US510 ($CDN500)/day 30 days field work + 22 days reporting . . . . . . . . . . . . . . . . . . . 2 prospector-technicians @ $US306 ($CDN300) each 30 days (60 man/days) field work . . . . . . . . . . . . . . . . . . . . . . . | $ 26,520 $ 26,000 $ 18,360 $ 18,000 $ 44,880 $ 44,000 | $ 44,880 $ 44,000 |
Transport: Truck; 30 days @ $US102 ($CDN100)/day. . . . . . . . . . . . . . . . Gasoline and oil . . . . . . . . . . . . . . . . . . . . . . . . . . . . . . . . . . . . . Helicopter; 10 hrs @$US1,530 ($CDN1,500)/hour . . . . . . . . . | $ 3,060 $ 3,000 $ 918 $ 900 $ 15,300 $ 15,000 $ 19,278 $ 18,900 | $ 19,278 $ 18,900 |
Camp Supplies and Communications: Satellite phone; 1 month @ $US1,530 ($CDN1,500)/ month. . Expediting services . . . . . . . . . . . . . . . . . . . . . . . . . . . . . . . . . . Fly camp rental including tools and chain saw; 1 month @ $US816 ($CDN800)/month . . . . . . . . . . . . . . . . . . Camp supplies . . . . . . . . . . . . . . . . . . . . . . . . . . . . . . . . . . . . . . | $ 1,530 $ 1,500 $ 612 $ 600 $ 816 $ 800 $ 122 $ 120 $ 3,080 $ 3,020 | $ 3,080 $ 3,020 |
Crew Costs: Hotel; 3 nights @ $US154 ($CDN150)/night. . . . . . . . . . . . . . Camp food and restaurant meals . . . . . . . . . . . . . . . . . . . . . . . . | $ 459 $ 450 $ 1,836 $ 1,800 $ 2,295 $ 2,250 | $ 2,295 $ 2,250 |
Analysis and Office Costs: Analysis of 10 rock samples @ $US51 ($CDN50) /sample. . . . 457 soils @ $US31 ($CDN30) / soil sample . . . . . . . . . . . . . . . Office costs . . . . . . . . . . . . . . . . . . . . . . . . . . . . . . . . . . . . . . . . | $ 510 $ 500 $ 14,167 $ 13,710 $ 204 $ 200 $ 14,881 $ 14,410 | $ 14,881 $ 14,410 |
| $ 84,414 $ 82,580 | ||
| H.S.T. (Harmonized sales tax): 12% of previous items | $ 10,130 $ 9,910 | |
| Environmental bond | $ 5,100 $ 5,000 | |
| $ 99,644 $ 97,490 | ||
| Contingency: 10% of itemized budget | $ 9,964 $ 9,749 | |
| Total estimated cost of Recommended Second-phase Program | $109,608 $107,239 |
| NOTE: | An exchange rate of $US1.02 : $CDN1.00 as quoted by http://stockwatch.com/ on March 22, 2011 is used to generate costs in American dollars. |
The estimated cost of both phases of the recommended program is $US 135,502 ($CDN 132,625).
57
13.0 REFERENCES
Buckley, Paul; 1973: Geochemical Report MR. Groups of Claims Chelaslie Arm; B.C. Min. Energy, Mines and Petr. Res., Ass. Rept. No. 4,610, 6 p. inc. 1 fig, 6 maps.
Caulfield, D.A.; 1992: 1992 Geological and Geochemical Report on the Bull 1-4 Claims; B.C. Min. Energy, Mines and Petr. Res., Ass. Rept. No. 22,535, 12 p. inc 6 fig., appendices and analyses.
Douglas, J.R.W. ed.; 1970: Geology and Economic Minerals of Canada; Dept. Energy, Mines, Res. Canada, Econ. Geol. Rept. No.1, Ch. VIII, pp. 365-489.
Harivel, Colin and Livingstone, K.W.; 1982: Geochemical Report Precious Metals Mineral Claims Chelaslie Lake, North Central B.C. Omineca Mining Division NTS 93 F/5E and 6W ...; B.C. Min. Energy, Mines and Petr. Res., Ass. Rept. No. 10,323, 6 p. inc 1 fig., 4 maps.
Harivel, Colin and Livingstone, K.W.; 1981: Precious Metals Report on 1980 Reconnaissance Geological Sampling Chelaslie Lake, North Central B.C. Omineca Mining Division NTS 93 F/5E and 6W; B.C. Min. Energy, Mines and Petr. Res., Ass. Rept. No. 9,653, 3 p., 4 maps.
Holland, S.S.; 1976: Landforms of British Columbia, A Physiographic Outline; B.C. Min. Energy, Mines and Petr. Res., Bull. 48, pp. 68-69.
Lefebure, D.V. and Church, B.N., Polymetallic Veins Ag-Pb-Zn +/-Au, in:
Lefebure, D.V. and Höy, Trygve ed.; 1996: Selected British Columbia Mineral Deposit Profiles, Vol. 2 - Metallic Deposits; B.C. Min. Employment and Investment, Geol. Surv. O.F. 1996-13, pp. 67-69.
Tipper, H.W.; 1963: Nechako River Map-area, British Columbia; Geol. Surv. Canada Mem. 324, 59 p.+ Map 1131A.
Tipper, H.W.; 1959: Revision of the Hazelton and Takla Groups of Central British Columbia; Geol. Surv. Canada; Bull. 47, 51p.
Tipper, H.W., Campbell, R.B., Taylor, G.C. and Stott, D.F.; 1979: Parsnip River, British Columbia; Geol. Surv. Canada Map 1424A; 1 map, 1 correlation.
-----; 1968: Natalkuz Lake, British Columbia; Energy, Mines, and Res. Aeromag. Map 5288G.
-----; 1968: Tetachuck Lake, British Columbia; Energy, Mines, and Res. Aeromag. Map 5289G.
/s/ John Ostler
John Ostler: M.Sc., P.Geo.,
Consulting Geologist
West Vancouver, British Columbia,
March 26, 2011
58
APPENDIX ‘A’
CERTIFICATE of the QUALIFIED PERSON
I, John Ostler, of 1015 Clyde Avenue in the City of West Vancouver, Province of British Columbia do hereby certify:
That I am a consulting geologist with business address at 1015 Clyde Avenue, West Vancouver, British Columbia;
That this Certificate of the Qualified Person applies to the Technical Report entitled “The Tara Property” dated March 26, 2011;
That I am a graduate of the University of Guelph in Ontario, Canada where I obtained my Bachelor of Arts degree in Geography (Geomorphology) and Geology in 1973, and that I am a graduate of Carleton University of Ottawa, Ontario, Canada where I obtained my Master of Science degree in Geology in 1977; that I am registered as a Professional Geoscientist with the Association of Professional Engineers and Geoscientists of British Columbia;
That I have been engaged in the study and practice of the geological profession for over 35 years;
That I have participated in exploration for polymetallic veins since 1977 for clients, for two of my own public companies, and on my own behalf in Canada, the United States of America, and Chile;
That I have participated in exploration for polymetallic veins since 1979 for clients, for one of my own public companies, and on my own behalf in Canada and Chile;
That I have read the definition of Qualified Person set out in Part 1.1of National Instrument 43-101and I hereby certify that because of my education, professional affiliation, and relevant experience, I am a Qualified Person with regard to the Tara property as defined in Part 1.1of National Instrument 43-101;
That I have not conducted a Current Personal Inspection of the Tara property in compliance with Part 6.2 of National Instrument 43-101;
That I am responsible for all of the Technical Report entitled “The Tara Property” dated March 26, 2011;
That I am independent of the Tara property and of Press Ventures Inc. as is defined in Part 1.4 of National Instrument 43-101;
That my prior involvement with the Tara property has been research of exploration literature regarding it;
That I have read National Instrument 43-101, and the Technical Report entitled “The Tara Property” dated March 26, 2011 complies with said instrument; and
That as of the date of this certificate, to the best of my knowledge, information, and belief, the Technical Report entitled “The Tara Property” dated March 26, 2011 contains all scientific and technical information that is required to be disclosed to make said Technical Report not misleading.
/s/ John Ostler
John Ostler; M.Sc., P.Geo.
Consulting Geologist
West Vancouver, British Columbia
March 26, 2011
59