Exhibit (C)-(2)
Confidential China Zenix Auto International Limited Confidential Fairness Analysis Presented to the Special Committee of Independent Directors October 19, 2021 The information contained herein is of a confidential nature and is intended for the use of the persons or firm to whom it isfurnished by us. Reproduction, publication, or dissemination of any portion hereof may not be made without prior approval of Kroll, LLC.
Duff & Phelps Disclaimer • The following pages contain materials that are being provided by Duff & Phelps, A Kroll Business operating as Kroll, LLC (“Duff & Phelps”), to the special committee of independent directors (the “Special Committee”) of the board of directors (the “Board of Directors”) (solely in their capacity as members of the Special Committee) of China Zenix Auto International Limited (the “Company”) in the context of a meeting of the Special Committee held to consider the Proposed Transaction (as defined herein). • These materials are, and any Opinion (as defined herein) will be, compiled and presented on a confidential basis, solely for the use and benefit of the Special Committee in connection with its evaluation of the Proposed Transaction and may not be, in whole or in part, distributed to any other party, publicly disclosed, or relied upon for any other purpose without the prior written consent of Duff & Phelps as described in the engagement letter among Duff & Phelps, the Company, and the Special Committee dated August 11, 2021. • Without limiting the prior bullet, because these materials were prepared for use in the context of an oral presentation to the Special Committee, whose members are familiar with the business, assets, liabilities, prospects and affairs of the Company, neither Duff & Phelps nor any of its respective legal or financial advisors or accountants take any responsibility for the accuracy or completeness of any of these materials if used by persons other than the Special Committee. • These materials are not intended to represent an Opinion and shall not be treated, construed, used or relied upon in any way as an Opinion. These materials are intended to serve as discussion materials for the Special Committee to review and as a summary of the basis upon which Duff & Phelps may render an Opinion, and are incomplete without reference to, and should be viewed solely in conjunction with, the discussion between Duff & Phelps and the Special Committee. • These materials do not, and any Opinion provided by Duff & Phelps would not: (i) address the merits of the underlying business decision to enter into the Proposed Transaction versus any alternative strategy or transaction; (ii) constitute a recommendation as to how the Special Committee, the Board of Directors or any other person (including security holders of the Company) should vote or act with respect to any matters relating to the Proposed Transaction, or whether to proceed with the Proposed Transaction or any related transaction; or (iii) create any fiduciary duty on the part of Duff & Phelps to any party. • The credit, financial and stock markets have been experiencing unusual volatility and we express no opinion or view as to any potential effects of such volatility on the Company or the Proposed Transaction. • The information utilized in preparing this presentation was obtained from the Company and from public sources under the assumption that they are complete and accurate as of the date of provision. Duff & Phelps relied without independent verification upon the accuracy, completeness, and fair presentation of all information contained in the unaudited financial statements, financial projections, and other information provided by the management of the Company and relied without independent verification on the accuracy of data and representations that Duff & Phelps obtained from public sources and the management of the Company. • Any estimates and projections contained herein have been prepared by or are based on discussions with the management of the Company and involve numerous and significant subjective assumptions and determinations, which may or may not prove to be correct. Projections necessarily involve risks and uncertainties. No representation or warranty, expressed or implied, is made as to the accuracy or completeness of such information and nothing contained herein is, or shall be relied upon as, a representation, whether as to the past or the future. Duff & Phelps did not independently verify such information. • No selected company or selected transaction used in our analysis is directly comparable to the Company or the Proposed Transaction. • Nothing contained herein should be construed as a valuation opinion, a credit rating, or an analysis of the Company’s credit worthiness nor as tax, legal or accounting advice. Confidential 2
Table of Contents Confidential Table of Contents 1.Introduction and Transaction Overview 2.Valuation Analysis –Discounted Cash Flow Analysis –Selected Public Companies / M&A Transactions Analysis Appendix Liquidation Value Summary3
Introduction and Transaction Overview
Introduction and Transaction Overview The Engagement • Duff & Phelps was retained by the Company to serve as independent financial advisor to the Special Committee (solely in its capacity as such). • Specifically, Duff & Phelps has been asked to provide an opinion (the “Opinion”) as to the fairness, from a financial point of view, to (i) the holders of ordinary shares, par value US$0.0001 per share, of the Company (each, a “Share” or, collectively, the “Shares”), other than the Excluded Shares, the Dissenting Shares and Shares represented by ADSs (each as defined below), and (ii) the holders of American Depositary Shares of the Company, each representing four Shares (each, an “ADS” and collectively, “ADSs”), other than ADSs representing or that are Excluded Shares, of the Merger Consideration (as defined below) to be received by such holders in the Proposed Transaction (as defined below) (without giving effect to any impact of the Proposed Transaction on any particular holder of Shares or ADSs other than in its capacity as a holder of Shares or ADSs). The Proposed Transaction • It is Duff & Phelps’ understanding that the Company and Newrace Limited, a company limited by shares incorporated under the laws of the British Virgin Islands (“Parent”), propose to enter into an Agreement and Plan of Merger (the “Merger Agreement”), dated as of the date hereof, the latest draft of which Duff & Phelps has reviewed is dated as of October 19, 2021. Pursuant to the Merger Agreement, among other things, a company limited by shares incorporated under the laws of the British Virgin Islands to be formed promptly after the date of the Merger Agreement (“Merger Sub”), a wholly-owned subsidiary of Parent, will merge with and into the Company and cease to exist thereafter, with the Company surviving the merger and becoming a wholly-owned subsidiary of Parent. In connection with such merger, (i) each Share issued and outstanding immediately prior to the Effective Time (other than the Excluded Shares, the Dissenting Shares and Shares represented by ADSs) shall be cancelled and cease to exist in exchange for the right to receive US$0.27 in cash per Share without interest (the “Per Share Merger Consideration”) and (ii) each ADS issued and outstanding immediately prior to the Effective Time (other than ADSs representing or that are Excluded Shares), and Shares represented by such ADSs, shall be cancelled and cease to exist in exchange for the right to receive US$1.08 in cash per ADS without interest (the “Per ADS Merger Consideration”, and together with the Per Share Merger Consideration, the “Merger Consideration”) (collectively, the “Proposed Transaction”). • The terms and conditions of the Proposed Transaction are more fully set forth in the Merger Agreement. • For purposes of the Opinion, (i) “Excluded Shares” shall mean, collectively, (a) Shares (including ADSs corresponding to such Shares) held by Parent, Merger Sub and any of their respective Affiliates, (b) any Shares (including ADSs corresponding to such Shares) held by the Depositary and reserved for issuance, settlement and allocation pursuant to any incentive plan, and (c) Shares beneficially owned by the Company or any of its Subsidiaries (or held in the Company’s treasury); and (ii) “Effective Time”, “Dissenting Shares”, “Affiliates”, “Subsidiaries”, and “Depositary” shall have the meanings set forth in the Merger Agreement. Confidential 5
Introduction and Transaction Overview Scope of Analysis Duff & Phelps has made such reviews, analyses and inquiries as it has deemed necessary and appropriate under the circumstances. Duff & Phelps also took into account its assessment of general economic, market and financial conditions, as well as its experience in securities and business valuation, in general, and with respect to similar transactions, in particular. Duff & Phelps’ procedures, investigations, and financial analysis with respect to the preparation of its analysis included, but were not limited to, the items summarized below: 1. Reviewed the following documents: – The Company’s annual reports and audited financial statements on Form 20-F filed with the Securities and Exchange Commission (“SEC”) for the years ended December 31, 2017 through December 31, 2020 and the Company’s unaudited interim financial statements for the six months ended June 30, 2019, June 30, 2020 and June 30, 2021 included in the Company’s Form 6-K filed with the SEC; – Unaudited and segment financial information for the Company for the years ended December 31, 2017 through December 31, 2020 and for the six months ended June 30, 2019, June 30, 2020 and June 30, 2021, each provided by the management of the Company; – A detailed financial projection model for the Company for the years ending December 31, 2021 through December 31, 2028, prepared and provided to Duff & Phelps by the management of the Company, upon which Duff & Phelps has relied, with the Company’s and the Special Committee’s consent, in performing its analysis (collectively, the “Management Projections”); – A liquidation analysis for the Company which contains, among other things, the estimated recovery rates for the Company’s assets and liabilities and the resulting value indication for the Company under a liquidation scenario, prepared and provided to Duff & Phelps by the management of the Company, upon which Duff & Phelps has relied, with the Company’s and the Special Committee’s consent, in performing its analysis (collectively, the “Liquidation Analysis”); – Other internal documents relating to the history, current operations, and probable future outlook of the Company, provided to Duff & Phelps by the management of the Company; – A letter dated October 15, 2021 from the management of the Company, which made certain representations as to historical financial information for the Company, the Management Projections and the underlying assumptions of such projections (the “Management Representation Letter”); and – A draft of the Merger Agreement dated as of October 19, 2021; 2. Discussed the information referred to above and the background and other elements of the Proposed Transaction with the management of the Company; 3. Discussed with the management of the Company its plans and intentions with respect to the management and operation of the Company’s business; 4. Reviewed the historical trading price and trading volume of the ADSs and the publicly traded securities of certain other companies that Duff & Phelps deemed relevant; 5. Performed certain valuation and comparative analyses using generally accepted valuation and analytical techniques including a discounted cash flow analysis, an analysis of selected public companies that Duff & Phelps deemed relevant, and an analysis of selected transactions that Duff & Phelps deemed relevant; and 6. Conducted such other analyses and considered such other factors as Duff & Phelps deemed appropriate. Confidential 6
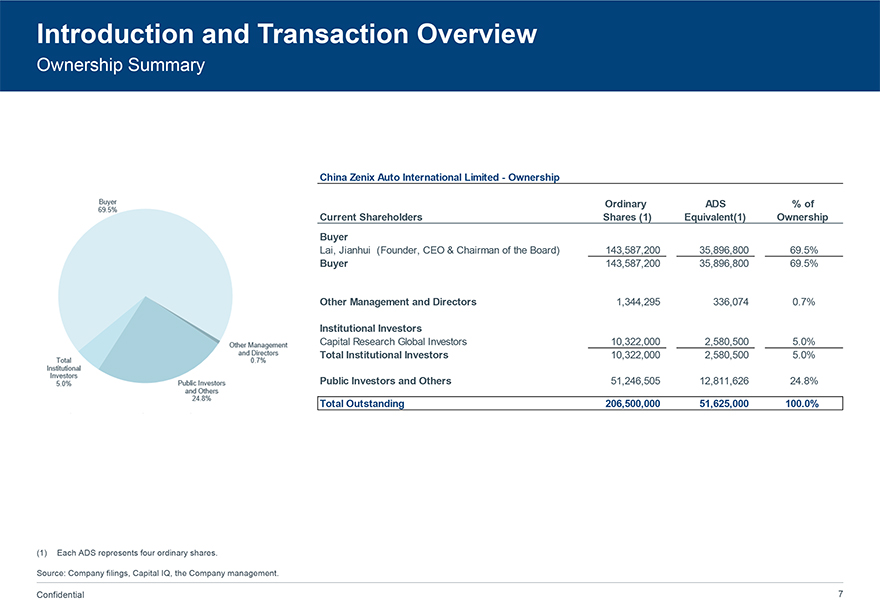
Introduction and Transaction Overview Ownership Summary Confidential Introduction and Transaction Overview Ownership SummaryChina Zenix Auto International Limited—Ownership Ordinary ADS % of Current Shareholders Shares (1) Equivalent(1) Ownership Buyer Lai, Jianhui (Founder, CEO & Chairman of the Board) 143,587,200 35,896,800 69.5% Buyer 143,587,200 35,896,800 69.5% Other Management and Directors 1,344,295 336,074 0.7% Institutional Investors Capital Research Global Investors 10,322,000 2,580,500 5.0% Total Institutional Investors 10,322,000 2,580,500 5.0% Public Investors and Others 51,246,505 12,811,626 24.8% Total Outstanding 206,500,000 51,625,000 100.0% (1)Each ADS represents four ordinary shares. Source: Company filings, Capital IQ, the Company management.7
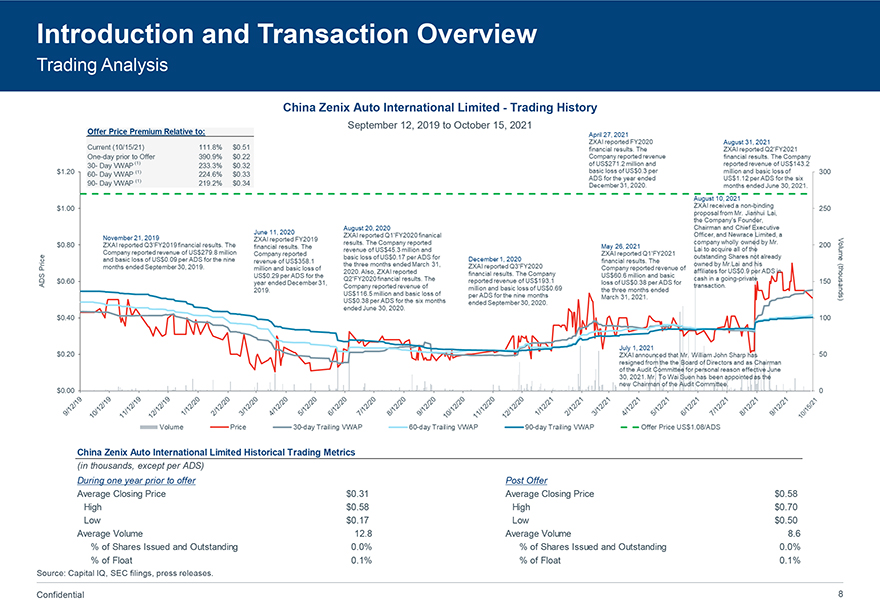
Introduction and Transaction Overview Trading Analysis Confidential Introduction and Transaction Overview Trading Analy China Zenix Auto International Limited Historical Trading Metrics (in thousands, except per ADS) During one year prior to offer Post Offer Average Closing Price $0.31 Average Closing Price $0.58 High $0.58 High $0.70 Low $0.17 Low $0.50 Average Volume 12.8 Average Volume 8.6 % of Shares Issued and Outstanding 0.0% % of Shares Issued and Outstanding 0.0% % of Float 0.1% % of Float 0.1% Source: Capital IQ, SEC filings, press releases. Confidential 8 sis Source: Capital IQ, SEC filings, press releases.China Zenix Auto International Limited -Trading History September 12, 2019 toOctober 15, 2021
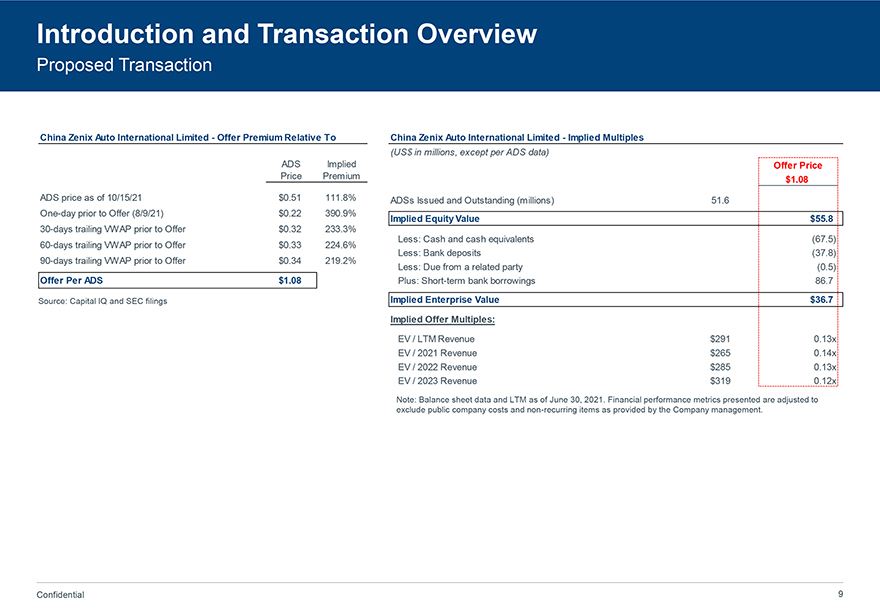
Introduction and Transaction Overview Proposed Transaction China Zenix Auto International Limited—Offer Premium Relative To China Zenix Auto International Limited—Implied Multiples (US$ in millions, except per ADS data) ADS Implied Offer Price Price Premium $1.08 ADS price as of 10/15/21 $0.51 111.8% ADSs Issued and Outstanding (millions) 51.6 One-day prior to Offer (8/9/21) $0.22 390.9% Implied Equity Value $55.8 30-days trailing VWAP prior to Offer $0.32 233.3% Less: Cash and cash equivalents (67.5) 60-days trailing VWAP prior to Offer $0.33 224.6% Less: Bank deposits (37.8) 90-days trailing VWAP prior to Offer $0.34 219.2% Less: Due from a related party (0.5) Offer Per ADS $1.08 Plus: Short-term bank borrowings 86.7 Source: Capital IQ and SEC filings Implied Enterprise Value $36.7 Implied Offer Multiples: EV / LTM Revenue $291 0.13x EV / 2021 Revenue $265 0.14x EV / 2022 Revenue $285 0.13x EV / 2023 Revenue $319 0.12x Note: Balance sheet data and LTM as of June 30, 2021. Financial performance metrics presented are adjusted to exclude public company costs and non-recurring items as provided by the Company management.
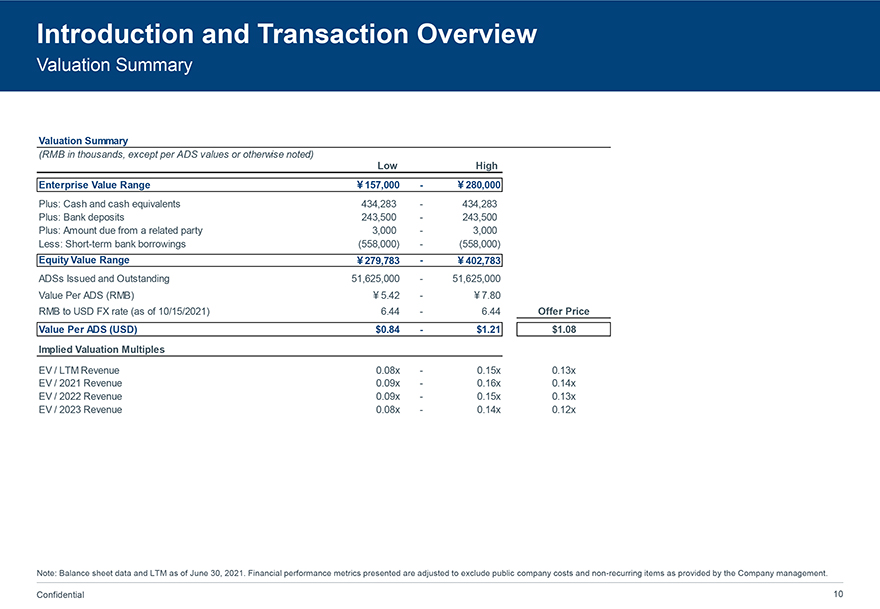
Introduction and Transaction Overview Valuation Summary Valuation Summary (RMB in thousands, except per ADS values or otherwise noted) Low High Enterprise Value Range ï¿¥157,000—ï¿¥280,000 Plus: Cash and cash equivalents 434,283—434,283 Plus: Bank deposits 243,500—243,500 Plus: Amount due from a related party 3,000—3,000 Less: Short-term bank borrowings (558,000)—(558,000) Equity Value Range ï¿¥279,783—ï¿¥402,783 ADSs Issued and Outstanding 51,625,000—51,625,000 Value Per ADS (RMB) ï¿¥5.42—ï¿¥7.80 RMB to USD FX rate (as of 10/15/2021) 6.44—6.44 Offer Price Value Per ADS (USD) $0.84—$1.21 $1.08 Implied Valuation Multiples EV / LTM Revenue 0.08x—0.15x 0.13x EV / 2021 Revenue 0.09x—0.16x 0.14x EV / 2022 Revenue 0.09x—0.15x 0.13x EV / 2023 Revenue 0.08x—0.14x 0.12x Note: Balance sheet data and LTM as of June 30, 2021. Financial performance metrics presented are adjusted to exclude public company costs and non-recurring items as provided by the Company management. Confidential 10
2. Valuation Analysis
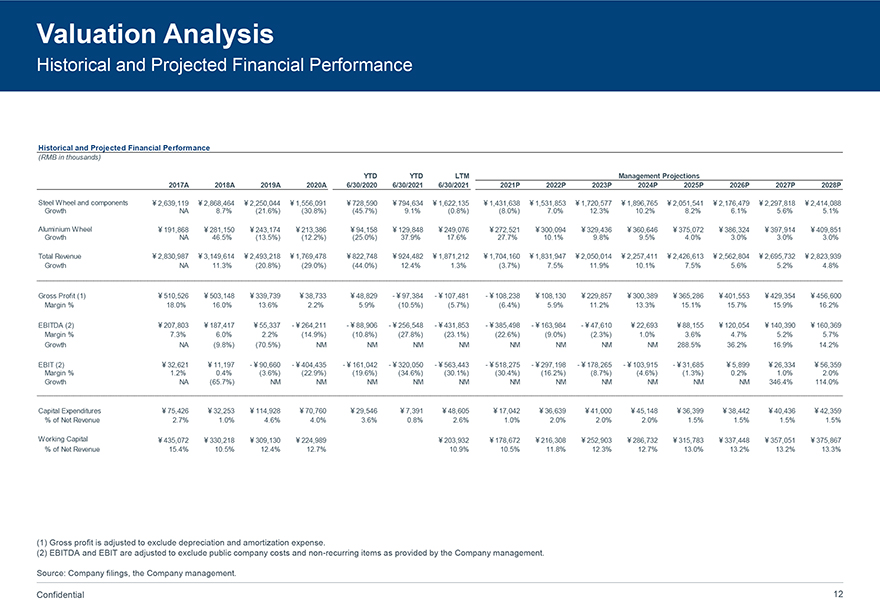
Valuation Analysis Historical and Projected Financial Performance Historical and Projected Financial Performance (RMB in thousands) YTD YTD LTM Management Projections 2017A 2018A 2019A 2020A 6/30/2020 6/30/2021 6/30/2021 2021P 2022P 2023P 2024P 2025P 2026P 2027P 2028P Steel Wheel and components ¿¥2,639,119 ¿¥2,868,464 ¿¥2,250,044 ¿¥1,556,091 ¿¥728,590 ¥794,634 ¥1,622,135 ¥1,431,638 ¥1,531,853 ¥1,720,577 ¥1,896,765 ¥2,051,541 ¥2,176,479 ¥2,297,818 ¥2,414,088 Growth NA 8.7% (21.6%) (30.8%) (45.7%) 9.1% (0.8%) (8.0%) 7.0% 12.3% 10.2% 8.2% 6.1% 5.6% 5.1% Aluminium Wheel ¥191,868 ¥281,150 ¥243,174 ¥213,386 ¥94,158 ¥129,848 ¥249,076 ¥272,521 ¥300,094 ¥329,436 ¥360,646 ¥375,072 ¥386,324 ¥397,914 ¥409,851 Growth NA 46.5% (13.5%) (12.2%) (25.0%) 37.9% 17.6% 27.7% 10.1% 9.8% 9.5% 4.0% 3.0% 3.0% 3.0% Total Revenue ¥2,830,987 ¥3,149,614 ¥2,493,218 ¥1,769,478 ¥822,748 ¥924,482 ¥1,871,212 ¥1,704,160 ¥1,831,947 ¥2,050,014 ¥2,257,411 ¥2,426,613 ¥2,562,804 ¥2,695,732 ¥2,823,939 Growth NA 11.3% (20.8%) (29.0%) (44.0%) 12.4% 1.3% (3.7%) 7.5% 11.9% 10.1% 7.5% 5.6% 5.2% 4.8% Gross Profit (1) ¥510,526 ¥503,148 ¥339,739 ¥38,733 ¥48,829 - ¥97,384 - ¥107,481 - ¥108,238 ¥108,130 ¥229,857 ¥300,389 ¥365,286 ¥401,553 ¥429,354 ¥456,600 Margin % 18.0% 16.0% 13.6% 2.2% 5.9% (10.5%) (5.7%) (6.4%) 5.9% 11.2% 13.3% 15.1% 15.7% 15.9% 16.2% EBITDA (2) ¥207,803 ¥187,417 ¥55,337 - ¥264,211 - ¥88,906 - ¥256,548 - ¥431,853 - ¥385,498 - ¥163,984 - ¥47,610 ¥22,693 ¥88,155 ¥120,054 ¥140,390 ¥160,369 Margin % 7.3% 6.0% 2.2% (14.9%) (10.8%) (27.8%) (23.1%) (22.6%) (9.0%) (2.3%) 1.0% 3.6% 4.7% 5.2% 5.7% Growth NA (9.8%) (70.5%) NM NM NM NM NM NM NM NM 288.5% 36.2% 16.9% 14.2% EBIT (2) ¥32,621 ¥11,197 - ¥90,660 - ¥404,435 - ¥161,042 - ¥320,050 - ¥563,443 - ¥518,275 - ¥297,198 - ¥178,265 - ¥103,915 - ¥31,685 ¥5,899 ¥26,334 ¥56,359 Margin % 1.2% 0.4% (3.6%) (22.9%) (19.6%) (34.6%) (30.1%) (30.4%) (16.2%) (8.7%) (4.6%) (1.3%) 0.2% 1.0% 2.0% Growth NA (65.7%) NM NM NM NM NM NM NM NM NM NM NM 346.4% 114.0% Capital Expenditures ¥75,426 ¥32,253 ¥114,928 ¥70,760 ¥29,546 ¥7,391 ¥48,605 ¥17,042 ¥36,639 ¥41,000 ¥45,148 ¥36,399 ¥38,442 ¥40,436 ¥42,359 % of Net Revenue 2.7% 1.0% 4.6% 4.0% 3.6% 0.8% 2.6% 1.0% 2.0% 2.0% 2.0% 1.5% 1.5% 1.5% 1.5% Working Capital ¥435,072 ¥330,218 ¥309,130 ¥224,989 ¥203,932 ¥178,672 ¥216,308 ¥252,903 ¥286,732 ¥315,783 ¥337,448 ¥357,051 ¥375,867 % of Net Revenue 15.4% 10.5% 12.4% 12.7% 10.9% 10.5% 11.8% 12.3% 12.7% 13.0% 13.2% 13.2% 13.3% (1) Gross profit is adjusted to exclude depreciation and amortization expense. (2) EBITDA and EBIT are adjusted to exclude public company costs and non-recurring items as provided by the Company management. Source: Company filings, the Company management. Confidential 12
Valuation Analysis Discounted Cash Flow Analysis – Methodology and Key Assumptions Discounted Cash Flow Methodology • Duff & Phelps performed a discounted cash flow analysis of the projected unlevered free cash flows. • Unlevered free cash flow is defined as cash generated by the business that is available to either reinvest or to distribute to security holders. • Projected free cash flows are discounted to the present using a discount rate which reflects their relative risk. • The discount rate is equivalent to the rate of return that security holders could expect to realize on alternative investment opportunities with similar risk profiles. Discounted Cash Flow Key Assumptions • Duff & Phelps utilized and relied upon the Management Projections for the fiscal years ending December 31, 2021 through December 31, 2028 (excluding public company expenses, as provided by the management of the Company), discussions with the management of the Company, and a review of the Company’s historical performance and other factors to develop the DCF analysis. • Beyond the projection period, Duff & Phelps estimated the “terminal value” using a perpetuity formula. • Duff & Phelps discounted the resulting free cash flows and terminal value using a weighted average cost of capital range of 10.5% to 11.5%, derived from the Capital Asset Pricing Model. • The following is a summary of the Management Projections utilized in the discounted cash flow analysis: – Revenue increases at a compound annual growth rate of 6.0% from 2020 to 2028. – EBITDA is projected to be negative from 2021 to 2023 and to turn positive in 2024, reaching approximately RMB 160 million by 2028. – EBITDA margin averages -1.7% from 2021 to 2028 and reaches 5.7% by 2028. – Capital expenditures average 1.6% of net revenue from 2021 to 2028. – Net working capital averages 12.5% of net revenue from 2021 to 2028. Confidential 13
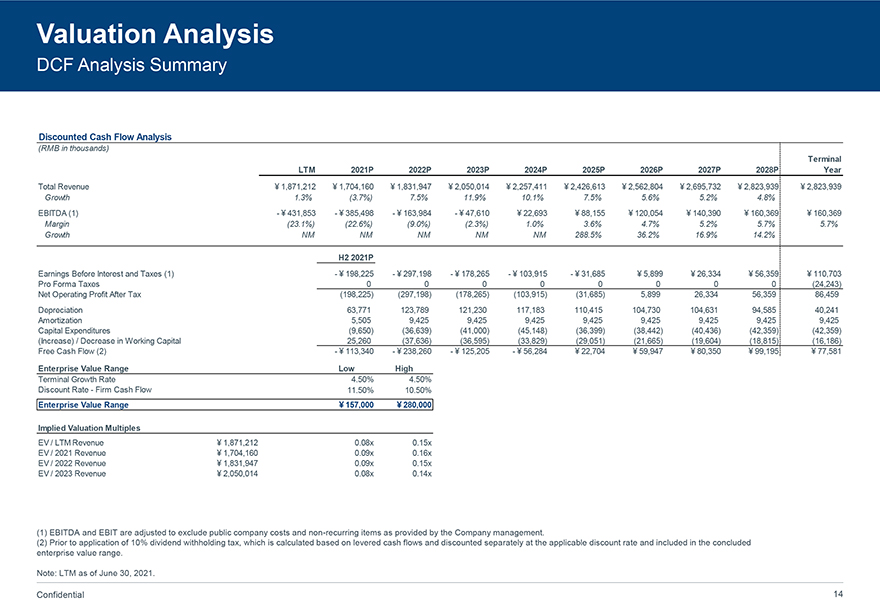
Valuation Analysis DCF Analysis Summary Discounted Cash Flow Analysis (RMB in thousands) Terminal LTM 2021P 2022P 2023P 2024P 2025P 2026P 2027P 2028P Year Total Revenue 1,871,212 1,704,160 1,831,947 2,050,014 2,257,411 2,426,613 2,562,804 2,695,732 2,823,939 2,823,939 Growth 1.3% (3.7%) 7.5% 11.9% 10.1% 7.5% 5.6% 5.2% 4.8% EBITDA (1)—431,853—385,498—163,984—47,610 22,693 88,155 120,054 140,390 160,369 160,369 Margin (23.1%) (22.6%) (9.0%) (2.3%) 1.0% 3.6% 4.7% 5.2% 5.7% 5.7% Growth NM NM NM NM NM 288.5% 36.2% 16.9% 14.2% H2 2021P Earnings Before Interest and Taxes (1)—198,225—297,198—178,265—103,915—31,685 5,899 26,334 56,359 110,703 Pro Forma Taxes 0 0 0 0 0 0 0 0 (24,243) Net Operating Profit After Tax (198,225) (297,198) (178,265) (103,915) (31,685) 5,899 26,334 56,359 86,459 Depreciation 63,771 123,789 121,230 117,183 110,415 104,730 104,631 94,585 40,241 Amortization 5,505 9,425 9,425 9,425 9,425 9,425 9,425 9,425 9,425 Capital Expenditures (9,650) (36,639) (41,000) (45,148) (36,399) (38,442) (40,436) (42,359) (42,359) (Increase) / Decrease in Working Capital 25,260 (37,636) (36,595) (33,829) (29,051) (21,665) (19,604) (18,815) (16,186) Free Cash Flow (2)—113,340—238,260—125,205—56,284 22,704 59,947 80,350 99,195 77,581 Enterprise Value Range Low High Terminal Growth Rate 4.50% 4.50% Discount Rate—Firm Cash Flow 11.50% 10.50% Enterprise Value Range 157,000 280,000 Implied Valuation Multiples EV / LTM Revenue 1,871,212 0.08x 0.15x EV / 2021 Revenue 1,704,160 0.09x 0.16x EV / 2022 Revenue 1,831,947 0.09x 0.15x EV / 2023 Revenue 2,050,014 0.08x 0.14x (1) EBITDA and EBIT are adjusted to exclude public company costs and non-recurring items as provided by the Company management. (2) Prior to application of 10% dividend withholding tax, which is calculated based on levered cash flows and discounted separately at the applicable discount rate and included in the concluded enterprise value range. Note: LTM as of June 30, 2021. Confidential 14
Valuation Analysis Selected Public Companies / M&A Transactions Analysis Methodology Selected Public Companies Analysis • Duff & Phelps selected nine publicly traded companies that were deemed relevant to its analysis. • Duff & Phelps analyzed the financial performance of each of the publicly traded companies. Duff & Phelps then analyzed the selected public companies’ trading multiples, including enterprise value to revenue, EBITDA and EBIT. Selected M&A Transactions Analysis • Duff & Phelps also reviewed certain merger and acquisition (“M&A”) transactions involving target companies that were deemed relevant to its analysis and computed the implied valuation multiples for such transactions. Due to the limited comparability of the financial metrics of the selected public companies and the targets in the selected M&A transactions relative to those of the Company, rather than applying a range of selected multiples from a review of the public companies and M&A transactions, Duff & Phelps reviewed various valuation multiples for the Company implied by the valuation range determined from the DCF analysis in the context of the Company’s relative size, forecasted growth in revenue and profits, profit margins, capital spending, revenue mix, and other characteristics that we deemed relevant. None of the companies utilized for comparative purposes in the following analysis are directly comparable to the Company, and none of the transactions utilized for comparative purposes in the following analysis are directly comparable to the Proposed Transaction. Duff & Phelps does not have access to non-public information of any of the companies used for comparative purposes. Accordingly, a complete valuation analysis of the Company and the Proposed Transaction cannot rely solely upon a quantitative review of the selected companies and selected transactions, and involves complex considerations and judgments concerning differences in financial and operating characteristics of such companies and targets, as well as other factors that could affect their value relative to that of the Company. Therefore, the Selected Public Companies / Selected M&A Transactions Analysis is subject to certain limitations. Confidential 15
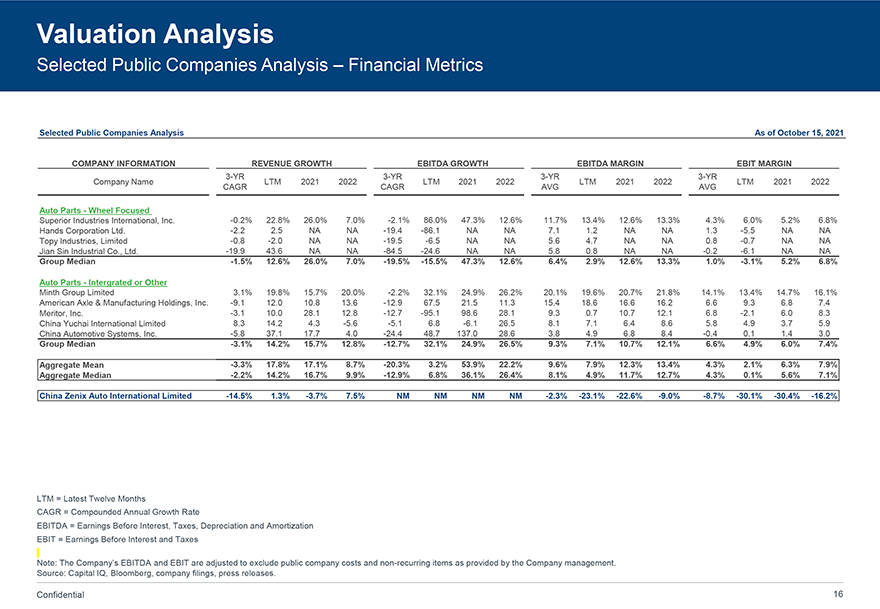
Valuation Analysis Selected Public Companies Analysis – Financial Metrics Selected Public Companies Analysis As of October 15, 2021 COMPANY INFORMATION REVENUE GROWTH EBITDA GROWTH EBITDA MARGIN EBIT MARGIN 3-YR 3-YR 3-YR 3-YR Company Name LTM 2021 2022 LTM 2021 2022 LTM 2021 2022 LTM 2021 2022 CAGR CAGR AVG AVG Auto Parts—Wheel Focused Superior Industries International, Inc. -0.2% 22.8% 26.0% 7.0% -2.1% 86.0% 47.3% 12.6% 11.7% 13.4% 12.6% 13.3% 4.3% 6.0% 5.2% 6.8% Hands Corporation Ltd. -2.2 2.5 NA NA -19.4 -86.1 NA NA 7.1 1.2 NA NA 1.3 -5.5 NA NA Topy Industries, Limited -0.8 -2.0 NA NA -19.5 -6.5 NA NA 5.6 4.7 NA NA 0.8 -0.7 NA NA Jian Sin Industrial Co., Ltd. -19.9 43.6 NA NA -84.5 -24.6 NA NA 5.8 0.8 NA NA -0.2 -6.1 NA NA Group Median -1.5% 12.6% 26.0% 7.0% -19.5% -15.5% 47.3% 12.6% 6.4% 2.9% 12.6% 13.3% 1.0% -3.1% 5.2% 6.8% Auto Parts—Intergrated or Other Minth Group Limited 3.1% 19.8% 15.7% 20.0% -2.2% 32.1% 24.9% 26.2% 20.1% 19.6% 20.7% 21.8% 14.1% 13.4% 14.7% 16.1% American Axle & Manufacturing Holdings, Inc. -9.1 12.0 10.8 13.6 -12.9 67.5 21.5 11.3 15.4 18.6 16.6 16.2 6.6 9.3 6.8 7.4 Meritor, Inc. -3.1 10.0 28.1 12.8 -12.7 -95.1 98.6 28.1 9.3 0.7 10.7 12.1 6.8 -2.1 6.0 8.3 China Yuchai International Limited 8.3 14.2 4.3 -5.6 -5.1 6.8 -6.1 26.5 8.1 7.1 6.4 8.6 5.8 4.9 3.7 5.9 China Automotive Systems, Inc. -5.8 37.1 17.7 4.0 -24.4 48.7 137.0 28.6 3.8 4.9 6.8 8.4 -0.4 0.1 1.4 3.0 Group Median -3.1% 14.2% 15.7% 12.8% -12.7% 32.1% 24.9% 26.5% 9.3% 7.1% 10.7% 12.1% 6.6% 4.9% 6.0% 7.4% Aggregate Mean -3.3% 17.8% 17.1% 8.7% -20.3% 3.2% 53.9% 22.2% 9.6% 7.9% 12.3% 13.4% 4.3% 2.1% 6.3% 7.9% Aggregate Median -2.2% 14.2% 16.7% 9.9% -12.9% 6.8% 36.1% 26.4% 8.1% 4.9% 11.7% 12.7% 4.3% 0.1% 5.6% 7.1% China Zenix Auto International Limited -14.5% 1.3% -3.7% 7.5% NM NM NM NM -2.3% -23.1% -22.6% -9.0% -8.7% -30.1% -30.4% -16.2% LTM = Latest Twelve Months CAGR = Compounded Annual Growth Rate EBITDA = Earnings Before Interest, Taxes, Depreciation and Amortization EBIT = Earnings Before Interest and Taxes Note: The Company’s EBITDA and EBIT are adjusted to exclude public company costs and non-recurring items as provided by the Company management. Source: Capital IQ, Bloomberg, company filings, press releases. Confidential 16
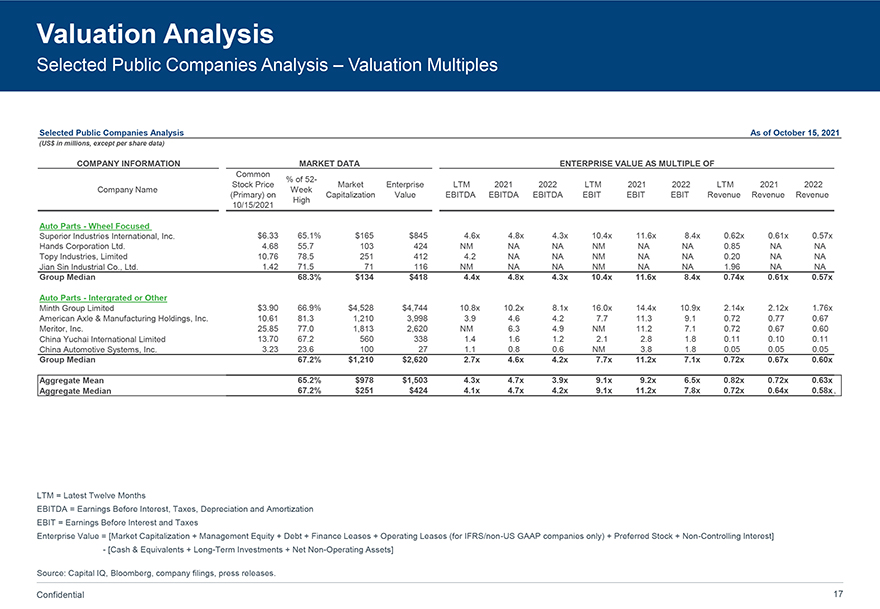
Valuation Analysis Selected Public Companies Analysis – Valuation Multiples Selected Public Companies Analysis As of October 15, 2021 (US$ in millions, except per share data) COMPANY INFORMATION MARKET DATA ENTERPRISE VALUE AS MULTIPLE OF Common % of 52- Stock Price Market Enterprise LTM 2021 2022 LTM 2021 2022 LTM 2021 2022 Company Name Week (Primary) on Capitalization Value EBITDA EBITDA EBITDA EBIT EBIT EBIT Revenue Revenue Revenue High 10/15/2021 Auto Parts—Wheel Focused Superior Industries International, Inc. $6.33 65.1% $165 $845 4.6x 4.8x 4.3x 10.4x 11.6x 8.4x 0.62x 0.61x 0.57x Hands Corporation Ltd. 4.68 55.7 103 424 NM NA NA NM NA NA 0.85 NA NA Topy Industries, Limited 10.76 78.5 251 412 4.2 NA NA NM NA NA 0.20 NA NA Jian Sin Industrial Co., Ltd. 1.42 71.5 71 116 NM NA NA NM NA NA 1.96 NA NA Group Median 68.3% $134 $418 4.4x 4.8x 4.3x 10.4x 11.6x 8.4x 0.74x 0.61x 0.57x Auto Parts—Intergrated or Other Minth Group Limited $3.90 66.9% $4,528 $4,744 10.8x 10.2x 8.1x 16.0x 14.4x 10.9x 2.14x 2.12x 1.76x American Axle & Manufacturing Holdings, Inc. 10.61 81.3 1,210 3,998 3.9 4.6 4.2 7.7 11.3 9.1 0.72 0.77 0.67 Meritor, Inc. 25.85 77.0 1,813 2,620 NM 6.3 4.9 NM 11.2 7.1 0.72 0.67 0.60 China Yuchai International Limited 13.70 67.2 560 338 1.4 1.6 1.2 2.1 2.8 1.8 0.11 0.10 0.11 China Automotive Systems, Inc. 3.23 23.6 100 27 1.1 0.8 0.6 NM 3.8 1.8 0.05 0.05 0.05 Group Median 67.2% $1,210 $2,620 2.7x 4.6x 4.2x 7.7x 11.2x 7.1x 0.72x 0.67x 0.60x Aggregate Mean 65.2% $978 $1,503 4.3x 4.7x 3.9x 9.1x 9.2x 6.5x 0.82x 0.72x 0.63x Aggregate Median 67.2% $251 $424 4.1x 4.7x 4.2x 9.1x 11.2x 7.8x 0.72x 0.64x 0.58x LTM = Latest Twelve Months EBITDA = Earnings Before Interest, Taxes, Depreciation and Amortization EBIT = Earnings Before Interest and Taxes Enterprise Value = [Market Capitalization + Management Equity + Debt + Finance Leases + Operating Leases (for IFRS/non-US GAAP companies only) + Preferred Stock + Non-Controlling Interest]—[Cash & Equivalents + Long-Term Investments + Net Non-Operating Assets] Source: Capital IQ, Bloomberg, company filings, press releases. Confidential 17
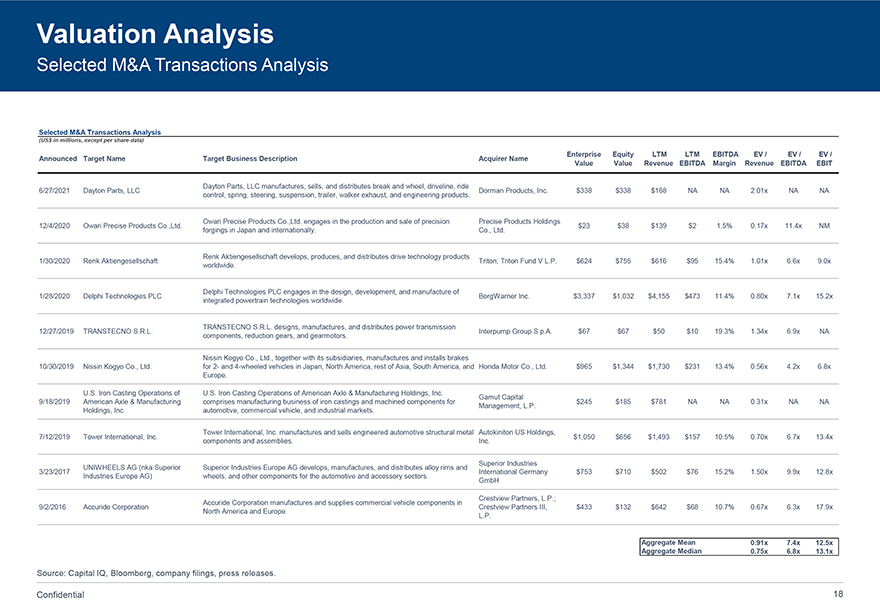
Valuation Analysis Selected M&A Transactions Analysis Selected M&A Transactions Analysis (US$ in millions, except per share data) Enterprise Equity LTM LTM EBITDA EV / EV / EV / Announced Target Name Target Business Description Acquirer Name Value Value Revenue EBITDA Margin Revenue EBITDA EBIT Dayton Parts, LLC manufactures, sells, and distributes break and wheel, driveline, ride 6/27/2021 Dayton Parts, LLC Dorman Products, Inc. $338 $338 $168 NA NA 2.01x NA NA control, spring, steering, suspension, trailer, walker exhaust, and engineering products. Owari Precise Products Co.,Ltd. engages in the production and sale of precision Precise Products Holdings 12/4/2020 Owari Precise Products Co.,Ltd. $23 $38 $139 $2 1.5% 0.17x 11.4x NM forgings in Japan and internationally. Co., Ltd. Renk Aktiengesellschaft develops, produces, and distributes drive technology products 1/30/2020 Renk Aktiengesellschaft Triton; Triton Fund V L.P. $624 $755 $616 $95 15.4% 1.01x 6.6x 9.0x worldwide. Delphi Technologies PLC engages in the design, development, and manufacture of 1/28/2020 Delphi Technologies PLC BorgWarner Inc. $3,337 $1,032 $4,155 $473 11.4% 0.80x 7.1x 15.2x integrated powertrain technologies worldwide. TRANSTECNO S.R.L. designs, manufactures, and distributes power transmission 12/27/2019 TRANSTECNO S.R.L. Interpump Group S.p.A. $67 $67 $50 $10 19.3% 1.34x 6.9x NA components, reduction gears, and gearmotors. Nissin Kogyo Co., Ltd., together with its subsidiaries, manufactures and installs brakes 10/30/2019 Nissin Kogyo Co., Ltd. for 2- and 4-wheeled vehicles in Japan, North America, rest of Asia, South America, and Honda Motor Co., Ltd. $965 $1,344 $1,730 $231 13.4% 0.56x 4.2x 6.8x Europe. U.S. Iron Casting Operations of U.S. Iron Casting Operations of American Axle & Manufacturing Holdings, Inc. Gamut Capital 9/18/2019 American Axle & Manufacturing comprises manufacturing business of iron castings and machined components for $245 $185 $781 NA NA 0.31x NA NA Management, L.P. Holdings, Inc. automotive, commercial vehicle, and industrial markets. Tower International, Inc. manufactures and sells engineered automotive structural metal Autokiniton US Holdings, 7/12/2019 Tower International, Inc. $1,050 $656 $1,493 $157 10.5% 0.70x 6.7x 13.4x components and assemblies. Inc. Superior Industries UNIWHEELS AG (nka:Superior Superior Industries Europe AG develops, manufactures, and distributes alloy rims and 3/23/2017 International Germany $753 $710 $502 $76 15.2% 1.50x 9.9x 12.8x Industries Europe AG) wheels, and other components for the automotive and accessory sectors. GmbH Crestview Partners, L.P.; Accuride Corporation manufactures and supplies commercial vehicle components in 9/2/2016 Accuride Corporation Crestview Partners III, $433 $132 $642 $68 10.7% 0.67x 6.3x 17.9x North America and Europe. L.P. Aggregate Mean 0.91x 7.4x 12.5x Aggregate Median 0.75x 6.8x 13.1x Source: Capital IQ, Bloomberg, company filings, press releases. Confidential 18
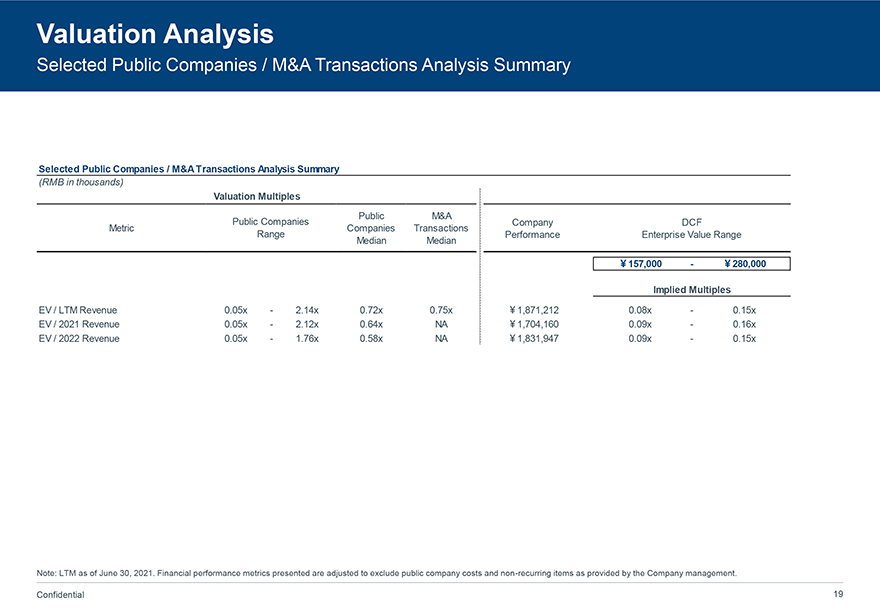
Valuation Analysis Selected Public Companies / M&A Transactions Analysis Summary Selected Public Companies / M&A Transactions Analysis Summary (RMB in thousands) Valuation Multiples Public M&A Public Companies Company DCF Metric Companies Transactions Range Performance Enterprise Value Range Median Median ¥157,000— ¥280,000 Implied Multiples EV / LTM Revenue 0.05x—2.14x 0.72x 0.75x ¥1,871,212 0.08x—0.15x EV / 2021 Revenue 0.05x—2.12x 0.64x NA ¥1,704,160 0.09x—0.16x EV / 2022 Revenue 0.05x—1.76x 0.58x NA ¥1,831,947 0.09x—0.15x Note: LTM as of June 30, 2021. Financial performance metrics presented are adjusted to exclude public company costs and non-recurring items as provided by the Company management. Confidential 19

Appendix
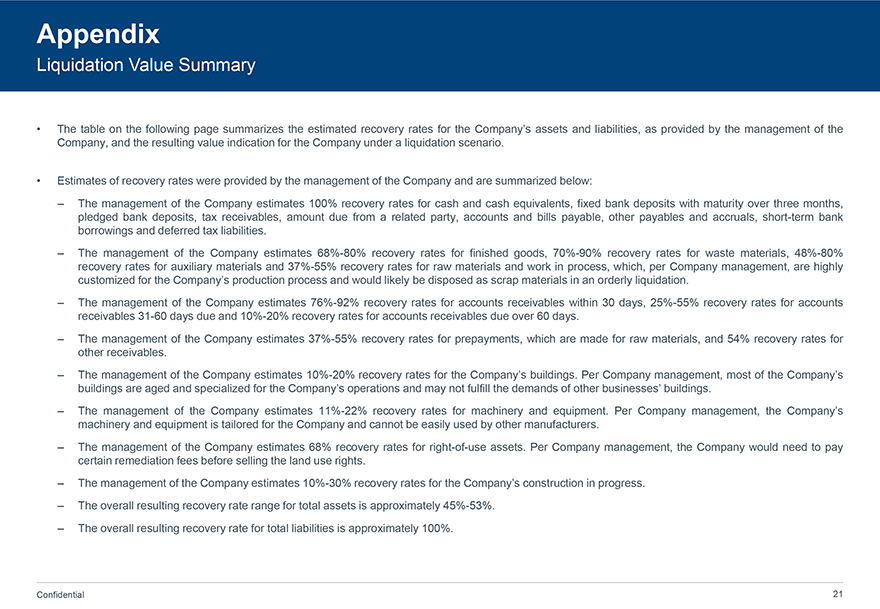
Appendix Liquidation Value Summary • The table on the following page summarizes the estimated recovery rates for the Company’s assets and liabilities, as provided by the management of the Company, and the resulting value indication for the Company under a liquidation scenario. • Estimates of recovery rates were provided by the management of the Company and are summarized below: – The management of the Company estimates 100% recovery rates for cash and cash equivalents, fixed bank deposits with maturity over three months, pledged bank deposits, tax receivables, amount due from a related party, accounts and bills payable, other payables and accruals, short-term bank borrowings and deferred tax liabilities. – The management of the Company estimates 68%-80% recovery rates for finished goods, 70%-90% recovery rates for waste materials, 48%-80% recovery rates for auxiliary materials and 37%-55% recovery rates for raw materials and work in process, which, per Company management, are highly customized for the Company’s production process and would likely be disposed as scrap materials in an orderly liquidation. – The management of the Company estimates 76%-92% recovery rates for accounts receivables within 30 days, 25%-55% recovery rates for accounts receivables 31-60 days due and 10%-20% recovery rates for accounts receivables due over 60 days. – The management of the Company estimates 37%-55% recovery rates for prepayments, which are made for raw materials, and 54% recovery rates for other receivables. – The management of the Company estimates 10%-20% recovery rates for the Company’s buildings. Per Company management, most of the Company’s buildings are aged and specialized for the Company’s operations and may not fulfill the demands of other businesses’ buildings. – The management of the Company estimates 11%-22% recovery rates for machinery and equipment. Per Company management, the Company’s machinery and equipment is tailored for the Company and cannot be easily used by other manufacturers. – The management of the Company estimates 68% recovery rates for right-of-use assets. Per Company management, the Company would need to pay certain remediation fees before selling the land use rights. – The management of the Company estimates 10%-30% recovery rates for the Company’s construction in progress. – The overall resulting recovery rate range for total assets is approximately 45%-53%. – The overall resulting recovery rate for total liabilities is approximately 100%. Confidential 21
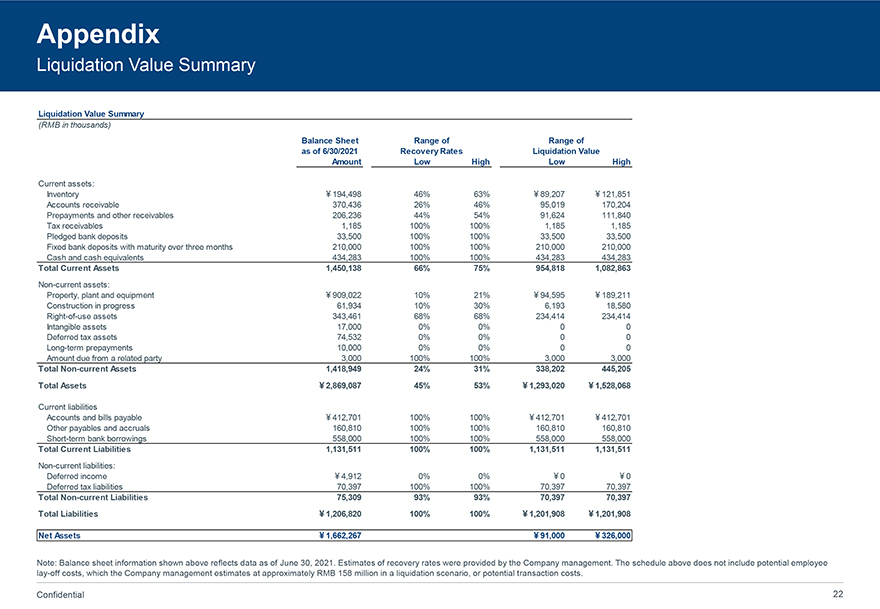
Appendix Liquidation Value Summary Liquidation Value Summary (RMB in thousands) Balance Sheet Range of Range of as of 6/30/2021 Recovery Rates Liquidation Value Amount Low High Low High Current assets: Inventory ¥194,498 46% 63% ¥89,207 ¥121,851 Accounts receivable 370,436 26% 46% 95,019 170,204 Prepayments and other receivables 206,236 44% 54% 91,624 111,840 Tax receivables 1,185 100% 100% 1,185 1,185 Pledged bank deposits 33,500 100% 100% 33,500 33,500 Fixed bank deposits with maturity over three months 210,000 100% 100% 210,000 210,000 Cash and cash equivalents 434,283 100% 100% 434,283 434,283 Total Current Assets 1,450,138 66% 75% 954,818 1,082,863 Non-current assets: Property, plant and equipment ¥909,022 10% 21% ¥94,595 ¥189,211 Construction in progress 61,934 10% 30% 6,193 18,580 Right-of-use assets 343,461 68% 68% 234,414 234,414 Intangible assets 17,000 0% 0% 0 0 Deferred tax assets 74,532 0% 0% 0 0 Long-term prepayments 10,000 0% 0% 0 0 Amount due from a related party 3,000 100% 100% 3,000 3,000 Total Non-current Assets 1,418,949 24% 31% 338,202 445,205 Total Assets ¥2,869,087 45% 53% ¥1,293,020 ¥1,528,068 Current liabilities Accounts and bills payable ¥412,701 100% 100% ¥412,701 ¥412,701 Other payables and accruals 160,810 100% 100% 160,810 160,810 Short-term bank borrowings 558,000 100% 100% 558,000 558,000 Total Current Liabilities 1,131,511 100% 100% 1,131,511 1,131,511 Non-current liabilities: Deferred income ¥4,912 0% 0% ¥0 ¥0 Deferred tax liabilities 70,397 100% 100% 70,397 70,397 Total Non-current Liabilities 75,309 93% 93% 70,397 70,397 Total Liabilities ¥1,206,820 100% 100% ¥1,201,908 ¥1,201,908 Net Assets ¥1,662,267 ¥91,000 ¥326,000 Note: Balance sheet information shown above reflects data as of June 30, 2021. Estimates of recovery rates were provided by the Company management. The schedule above does not include potential employee lay-off costs, which the Company management estimates at approximately RMB 158 million in a liquidation scenario, or potential transaction costs. Confidential 22