UNITED STATES
SECURITIES AND EXCHANGE COMMISSION
WASHINGTON, D.C. 20549
FORM N-CSR
CERTIFIED SHAREHOLDER REPORT OF REGISTERED MANAGEMENT
INVESTMENT COMPANIES
Investment Company Act file number: 811-22504
Clark Fork Trust
(Exact Name of Registrant as Specified in Charter)
218 East Front Street, Suite 205, Missoula, Montana 59802
(Address of Principal Executive Offices) (Zip Code)
Capitol Services, Inc.
615 S. Dupont Hwy, Dover, DE 19901
(Name and Address of Agent for Service)
With Copies To:
John H. Lively
Practus, LLP
11300 Tomahawk Creek Pkwy., Suite 310
Leawood, KS 66211
Registrant’s Telephone Number, including Area Code: (406) 541-0130
Date of fiscal year end: May 31
Date of reporting period: May 31, 2024
Form N-CSR is to be used by management investment companies to file reports with the Commission not later than 10 days after the transmission to stockholders of any report that is required to be transmitted to stockholders under Rule 30e-1 under the Investment Company Act of 1940 (17 CFR 270.30e-1). The Commission may use the information provided on Form N-CSRS in its regulatory, disclosure review, inspection and policymaking roles.
A registrant is required to disclose the information specified by Form N-CSR, and the Commission will make this information public. A registrant is not required to respond to the collection of information contained in Form N-CSR unless the Form displays a currently valid Office of Management and Budget ("OMB") control number. Please direct comments concerning the accuracy of the information collection burden estimate and any suggestions for reducing the burden to Secretary, Securities and Exchange Commission, 450 Fifth Street, NW, Washington, DC 20549-0609. The OMB has reviewed this collection of information under the clearance requirements of 44 U.S.C. § 3507.
Item 1. Reports to Stockholders.
ANNUAL SHAREHOLDER REPORT
May 31, 2024
TARKIO FUND
TARKX
ADDITIONAL INFORMATION
This annual shareholder report contains important information about the Tarkio Fund - TARKX for the period June 1, 2023 to May 31, 2024. You can find additional information about the Fund at https://tarkiofund.com. You can also request this information by contacting us at 1-866-738-3629.
expense Information
What were the Fund costs for the past year?
(based on a hypothetical $10,000 investment)
| Fund Name | Costs of a $10,000 investment | Costs paid as a percentage of a $10,000 investment |
| | | |
| Tarkio Fund | $100.00 | 1.00% |
Performance graph
AVERAGE ANNUAL RETURNS
| | 1 Year | 5 Years | 10 Years | Ending Value |
| Tarkio Fund | 25.07% | 11.75% | 9.53% | $ 24,841 |
| S&P 500 ® Index | 28.19% | 15.79% | 12.68% | $ 33,008 |
Cumulative Performance Comparison of $10,000 Investment
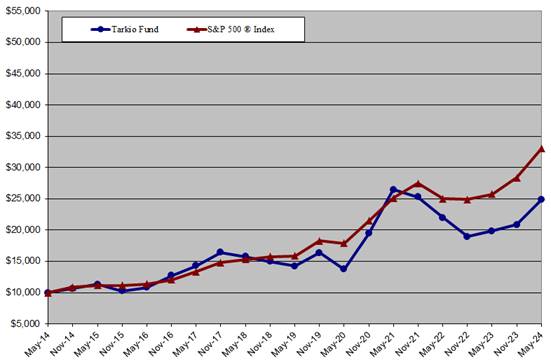
Past performance is not a good predictor of future performance. The returns shown do not reflect taxes that a shareholder would pay on Fund distributions or on the redemption of Fund shares. Updated performance data current to the most recent month-end can be obtained by calling 1-866-738-3629.
FUND STATISTICS
| | | | ADVISORY FEES |
| NET ASSETS: | PORTFOLIO HOLDINGS: | PORTFOLIO TURNOVER: | PAID BY FUND: |
| $154.3 MILLION* | 34 | 6.91% | $1,063,243 |
managment’s discussion of fund performance
The investment strategy of the Tarkio Fund (the “Fund”) is to use our investment criteria to identify companies whose leaders and whose culture can, over time, give them a competitive advantage (including by engaging employees, adapting and innovating, continuously achieving efficiencies, and continually improving in general) through the lens of Humility, Integrity, and trust; Long-term focus; Passion and purpose; Teamwork: cooperation, not internal competition; Employee empowerment: Driving fear out of the organization; and Disciplined capital allocation. Any decision whether to sell to reduce or to eliminate a position is predicated upon whether and to what extent the company’s culture and leadership may drift away from our criteria. Otherwise, our intention is to hold through whatever may occur, including short-term economic cycles and geopolitical and macroeconomic events.
As is typically the case, the stock prices of all the companies in the Fund’s portfolio were subject to a high degree of volatility throughout the period, just like the rest of the market in general. The market dropped in the first quarter of fiscal year ending May 31, 2024, and has seen fairly steady gains during the rest of the year, driven in large part by the top few stocks in the S&P500. The downs and ups of the Fund generally followed the timing of the overall market throughout the fiscal year. The Fund’s performance during the fiscal year ending May 31, 2024 was up 25.07% while the S&P 500® Index was up 28.19% during the same period. The companies with the largest share price increases affecting the Fund’s performance during the period were Modine Manufacturing (MOD, +269.8%), MillerKnoll (MLKN, 103.5%) ESAB (ESAB, +75.1%), and Parker Hannifin (PH, +65.9%). The Fund’s worst performers over the same period were The Container Store (TCS, -72.8%), Envista Holdings (NVST, -39.3%), Lumen Technologies (LUMN, -34.8%), and Cognex (CGNX, -17.2%).
We believe that the significant fluctuations of the market and individual stocks during the fiscal year, due to various geopolitical and macroeconomic events, represented reactions to short-term, temporary conditions. In response to those fluctuations, we purchased a substantial amount of additional stock in a number of what we believe to be high quality holdings at prices that we believe will provide significant increased value for the Fund’s long-term shareholders including Cognex, Manitowoc, ATS, Lumen, and Enovis. We believe we are in a better position than ever to continue to build and compound meaningful wealth for our long-term partners/shareholders in the Fund.
We thank you for your investment in the Tarkio Fund.

Russ, Michele, Ginger, Jeremy & Dominic
PORTFOLIO ILLUSTRATION
The following chart gives a visual breakdown of the Fund by the sectors the underlying securities represent as a percentage of the portfolio of investments.

Sectors are categorized using Morningstar® classifications.
top ten holdings
| 1. | General Electric Company | 12.42% |
| 2. | Cognex Corporation | 9.37% |
| 3. | The Manitowoc Company, Inc. | 7.96% |
| 4. | Danaher Corporation | 7.18% |
| 5. | MillerKnoll, Inc. | 5.84% |
| 6. | ESAB Corporation | 5.17% |
| 7. | Vontier Corporation | 4.32% |
| 8. | The St. Joe Company | 4.10% |
| 9. | Chipotle Mexican Grill, Inc. | 3.96% |
| 10. | Berkshire Hathaway Inc. Class B | 3.56% |
| | Total % of Net Assets | 63.89% |
How has the fund changed
The Fund has not had any material changes during the year ended May 31, 2024.
Householding
To reduce Fund expenses, only one copy of most shareholder documents may be mailed to shareholders with multiple accounts at the same address (Householding). If you would prefer that your Tarkio Fund documents not be householded, please contact Tarkio Fund at 1-866-738-3629, or contact your financial intermediary. Your instructions will typically be effective within 30 days of receipt by Tarkio Fund or your financial intermediary.
For additional information about the Fund; including its prospectus, financial information, holdings and proxy information, visit https://tarkiofund.com or contact us at 1-866-738-3629.
For a more thorough understanding of our investment process, including a fuller description of our investment criteria and how we apply these criteria to our particular companies, we encourage you to read our quarterly shareholder letters, available at https://tarkiofund.com/shareholder-info.
| | Tarkio | S&P 500 |
| 11/30/14 | 10,636 | 10,858 |
| 05/31/15 | 11,304 | 11,181 |
| 11/30/15 | 10,242 | 11,157 |
| 05/31/16 | 10,805 | 11,371 |
| 11/30/16 | 12,733 | 12,055 |
| 05/31/17 | 14,270 | 13,357 |
| 11/30/17 | 16,441 | 14,811 |
| 05/31/18 | 15,726 | 15,277 |
| 11/30/2018 | 14,960 | 15,739 |
| 5/31/2019 | 14,254 | 15,854 |
| 11/30/2019 | 16,353 | 18,273 |
| 5/31/2020 | 13,732 | 17,889 |
| 11/30/2020 | 19,439 | 21,463 |
| 5/31/2021 | 26,461 | 25,098 |
| 11/30/2021 | 25,305 | 27,451 |
| 5/31/2022 | 21,977 | 25,019 |
| 11/30/2022 | 18,936 | 24,920 |
| 5/31/2023 | 19,861 | 25,750 |
| 11/30/2023 | 20,830 | 28,369 |
| 5/31/2024 | 24,841 | 33,008 |
| Basic Materials | 1.49% |
| Communication Services | 3.48% |
| Consumer Cyclical | 13.25% |
| Consumer Defensive | 1.47% |
| Financial Services | 4.34% |
| Healthcare | 10.71% |
| Industrials | 39.32% |
| Money Market Fund | 0.41% |
| Real Estate | 4.09% |
| Technology | 18.13% |
| Utilities | 3.31% |
Item 2. Code of Ethics.
| | (a) | The registrant, as of the end of the period covered by this report, has adopted a code of ethics that applies to the registrant's principal executive officer, principal financial officer, principal accounting officer or controller, or persons performing similar functions, regardless of whether these individuals are employed by the registrant or a third party. |
| | (b) | There have been no amendments, during the period covered by this report, to a provision of the code of ethics that applies to the registrant's principal executive officer, principal financial officer, principal accounting officer or controller, or persons performing similar functions, regardless of whether these individuals are employed by the registrant or a third party, and that relates to any element of the code of ethics description. |
| | (c) | The registrant has not granted any waivers, including an implicit waiver, from a provision of the code of ethics that applies to the registrant's principal executive officer, principal financial officer, principal accounting officer or controller, or persons performing similar functions, regardless of whether these individuals are employed by the registrant or a third party, that relates to one or more of the items set forth in paragraph (b) of this item's instructions. |
Item 3. Audit Committee Financial Expert.
| | (a)(1) | The registrant does not have an audit committee financial expert serving on its audit committee. |
| | (a)(3) | At this time, the registrant believes that the collective experience provided by the members of the audit committee together offer the registrant adequate oversight for the registrant's level of financial complexity. |
Item 4. Principal Accountant Fees and Services
FY 2024 $ 14,500
FY 2023 $ 14,500
Registrant
FY 2024 $ 0
FY 2023 $ 0
Registrant
FY 2024 $ 3,500
FY 2023 $ 3,500
Nature of the fees: Tax preparation and filing.
Registrant
FY 2024 $ 0
FY 2023 $ 0
| (e) | (1) | Audit Committee’s Pre-Approval Policies |
The Audit Committee Charter requires the Audit Committee to be responsible for the selection, retention or termination of auditors and, in connection therewith, to (i) evaluate the proposed fees and other compensation, if any, to be paid to the auditors, (ii) evaluate the independence of the auditors, (iii) pre-approve all audit services and, when appropriate, any non-audit services provided by the independent auditors to the Trust, (iv) pre-approve, when appropriate, any non-audit services provided by the independent auditors to the Trust's investment adviser, or any entity controlling, controlled by, or under common control with the investment adviser and that provides ongoing services to the Trust if the engagement relates directly to the operations and financial reporting of the Trust, and (v) receive the auditors’ specific representations as to their independence;
| | (2) | Percentages of Services for which the Pre-Approval Requirement is Waived |
| Audit-Related Fees: | 0% |
| Tax Fees: | 0% |
| All Other Fees: | 0% |
(f) During audit of registrant's financial statements for the most recent fiscal year, less than fifty percent of the hours expended on the principal accountant's engagement were attributed to work performed by persons other than the principal accountant's full-time, permanent employees.
(g) The aggregate non-audit fees billed by the registrant's accountant for services rendered to the registrant, and rendered to the registrant's investment adviser (not including any sub-adviser whose role is primarily portfolio management and is subcontracted with or overseen by another investment adviser), and any entity controlling, controlled by, or under common control with the adviser that provides ongoing services to the registrant:
Registrant Adviser
FY 2024 $3,500 $0
FY 2023 $3,500 $0
(h) Not applicable. The auditor performed no services for the registrant’s investment adviser or any entity controlling, controlled by, or under common control with the investment adviser that provides ongoing services to the registrant.
(i) Not applicable.
(j) Not applicable.
Item 5. Audit Committee of Listed Companies. Not applicable.
Item 6. Schedule of Investments. Schedule filed with Item 1.
Item 7. Financial Statements and Financial Highlights for Open-End Management Companies.

TARKIO FUND
(TARKX)
CLARK FORK TRUST
ANNUAL REPORT
May 31, 2024
| | | | |
| Tarkio Fund |
| Schedule of Investments |
| May 31, 2024 |
| | | | |
| Shares | | | Value |
| | | | |
| COMMON STOCK - 99.75% | |
| | | | |
| Apparel & Other Finishd Prods of Fabrics & Similar Matl - 0.04% | |
| 10,475 | | FIGS, Inc. Class A * | $ 55,518 |
| | | | |
| Communications Equipment - 0.48% | |
| 16,801 | | Lumentum Holdings, Inc. * | 730,844 |
| | | | |
| Construction Machinery & Equipment - 7.96% | |
| 988,499 | | Manitowoc Co., Inc. (a) * | 12,287,043 |
| | | | |
| Dental Equipment & Supplies - 1.75% | |
| 139,525 | | Envista Holdings Corp. * | 2,701,204 |
| | | | |
| Drawing & Insulation of Nonferrous Wire - 0.61% | |
| 4,300 | | Belden, Inc. | 411,467 |
| 14,075 | | Corning, Inc. | 524,435 |
| | | | 935,902 |
| Electronic & Other Electrical Equipment (No Computer Equipment) - 15.74% | |
| 29,125 | | GE Vernova, Inc. * | 5,123,087 |
| 116,100 | | General Electric Co. | 19,172,754 |
| | | | 24,295,841 |
| Fire, Marine & Casualty Insurance - 4.34% | |
| 13,275 | | Berkshire Hathaway, Inc. Class B * | 5,501,160 |
| 1,075 | | Fairfax Financial Holdings, Ltd. (Canada) | 1,199,700 |
| | | | 6,700,860 |
| General Industrial Machinery & Equipment - 6.87% | |
| 82,250 | | ATS Corp. (Canada) * | 2,618,017 |
| 77,625 | | ESAB Corp. | 7,981,403 |
| | | | 10,599,420 |
| Industrial Instruments for Measurement, Display & Control - 16.55% | |
| 317,675 | | Cognex Corp. | 14,460,566 |
| 43,175 | | Danaher Corp. | 11,087,340 |
| | | | 25,547,906 |
| Industrial Trucks, Tractors, Trailers & Stackers - 2.42% | |
| 62,700 | | Terex Corp. | 3,741,309 |
| | | | |
| Instruments For Meas & Testing of Electricity & Elec Signals - 0.86% | |
| 13,525 | | Veralto Corp. | 1,333,294 |
| | | | |
| Land Subdividers & Developers (No Cemeteries) - 4.10% | |
| 111,700 | | The St. Joe Co. | 6,322,220 |
| | | | |
| Miscellaneous Fabricated Metal Products - 3.15% | |
| 9,150 | | Parker Hannifin Corp. | 4,863,408 |
| | | | |
| Motor Vehicle Parts & Accessories - 3.19% | |
| 48,850 | | Modine Manufacturing Co. * | 4,929,942 |
| | | | |
| Office Furniture - 5.84% | |
| 326,650 | | MillerKnoll, Inc. | 9,009,007 |
| | | | |
| Optical Instruments & Lenses - 2.19% | |
| 59,100 | | Coherent Corp. * | 3,372,246 |
| | | | |
| Orthopedic, Prosthetic & Surgical Appliances & Supplies - 2.96% | |
| 90,825 | | Enovis Corp. * | 4,565,773 |
| | | | |
| Printed Circuit Boards - 0.88% | |
| 59,175 | | Kimball Electronics, Inc. * | 1,356,291 |
| | | | |
| Retail-Catalog & Mail-Order Houses - 0.03% | |
| 300 | | Amazon.com, Inc. * | 52,932 |
| | | | |
| Retail-Eating Places - 3.96% | |
| 1,955 | | Chipotle Mexican Grill, Inc. * | 6,118,212 |
| | | | |
| Retail-Home Furniture, Furnishings & Equipment Stores - 0.21% | |
| 482,874 | | The Container Store Group, Inc. * | 323,622 |
| | | | |
| Retail-Variety Stores - 1.47% | |
| 2,800 | | Costco Wholesale Corp. | 2,267,692 |
| | | | |
| Services-Business Services - 0.93% | |
| 14,150 | | Global Payments, Inc. | 1,441,177 |
| | | | |
| Steel Works, Blast Furnaces & Rolling Mills (Coke Ovens) - 1.49% | |
| 13,650 | | Nucor Corp. | 2,304,802 |
| | | | |
| Telephone & Telegraph Apparatus - 1.21% | |
| 38,600 | | Ciena Corp. * | 1,859,362 |
| | | | |
| Telephone Communications (No Radiotelephone) - 3.49% | |
| 4,173,650 | | Lumen Technologies, Inc. | 5,384,008 |
| | | | |
| Textile Mills Products - 0.92% | |
| 87,875 | | Interface, Inc. | 1,415,666 |
| | | | |
| Totalizing Fluid Meters & Counting Devices - 4.32% | |
| 166,850 | | Vontier Corp. | 6,670,663 |
| | | | |
| X-Ray Apparatus & Tubes & Related Irradiation Apparatus - 1.79% | |
| 35,400 | | GE HealthCare Technologies, Inc. | 2,761,200 |
| | | | |
| TOTAL FOR COMMON STOCK (Cost $97,121,620) - 99.75% | 153,947,364 |
| | | | |
| MONEY MARKET FUND - 0.41% | |
| 636,121 | | Federated Government Obligations Fund - Institutional Class 5.19% ** (Cost $636,121) | 636,121 |
| | | | |
| TOTAL INVESTMENTS (Cost $97,757,741) - 100.16% | 154,583,485 |
| | | | |
| LIABILITIES LESS OTHER ASSETS - (0.16%) | (246,931) |
| | | | |
| NET ASSETS - 100.00% | $154,336,554 |
| | | | |
| | | | |
| * Non-income producing securities during the period. | |
| ** The rate shown represents the 7-day yield at May 31, 2024. | |
| (a) The Fund and the Adviser, in combination, owned more than 5% of the outstanding voting shares of the company during the |
| year ended May 31, 2024. | |
| The accompanying notes are an integral part of these financial statements. | |
| | | |
| Tarkio Fund |
| Statement of Assets and Liabilities |
| May 31, 2024 |
| | | |
| Assets: | | |
| Investments in Securities, at Value (Cost $85,180,387) | $142,296,442 |
| Investment in Affiliated Security, at Value (Cost $12,577,354) | 12,287,043 |
| Cash | | 1,000 |
| Receivables: | | |
| Shareholder Subscriptions | 7,424 |
| Securities Sold | | 63,898 |
| Dividends | | 96,697 |
| Total Assets | 154,752,504 |
| Liabilities: | | |
| Payables: | | |
| Shareholder Redemptions | 284,190 |
| Accrued Adviser Fees | 98,820 |
| Accrued Service Fees | 32,940 |
| Total Liabilities | 415,950 |
| Net Assets | | $154,336,554 |
| | | |
| Net Assets Consist of: | | |
| Paid In Capital | | $ 95,785,639 |
| Distributable Earnings | 58,550,915 |
| Net Assets, for 6,022,472 Shares Outstanding (unlimited shares authorized) | $154,336,554 |
| | | |
| Net asset value, offering price, and redemption price per share | $ 25.63 |
| | | |
| | | |
| The accompanying notes are an integral part of these financial statements. | |
| | | |
| Tarkio Fund |
| Statement of Operations |
| For the Year Ended May 31, 2024 |
| | | |
| | | |
| Investment Income: | | |
| Dividends (Net of foreign withholding tax of $2,644) | $ 906,047 |
| Total Investment Income | 906,047 |
| | | |
| Expenses: | | |
| Advisory Fees (Note 4) | 1,063,243 |
| Service Fees (Note 4) | 354,414 |
| Total Expenses | | 1,417,657 |
| | | |
| Net Investment Loss | | (511,610) |
| | | |
| Realized and Unrealized Gain (Loss) on Investments: | |
| Net Realized Gain on Investments | 2,616,948 |
| Net Realized Loss on Affiliated Investments | (377,334) |
| Net Change in Unrealized Appreciation on Investments | 31,154,502 |
| Net Change in Unrealized Depreciation on Affiliated Investments | (1,274,768) |
| Net Realized and Unrealized Gain on Investments | 32,119,348 |
| | | |
| Net Increase in Net Assets Resulting from Operations | $31,607,738 |
| | | |
| | | |
| | | |
| The accompanying notes are an integral part of these financial statements. | |
| | | | | |
| Tarkio Fund |
| Statements of Changes in Net Assets |
| | | | | |
| | | | | |
| | | | | |
| | | | | |
| | | Year Ended | | Year Ended |
| | | 5/31/2024 | | 5/31/2023 |
| Increase (Decrease) in Net Assets From Operations: | | | |
| Net Investment Loss | $ (511,610) | | $ (302,572) |
| Net Realized Gain on Investments | 2,616,948 | | 6,230,477 |
| Net Realized Loss on Affiliated Investments | (377,334) | | (1,017,168) |
| Net Change in Unrealized Appreciation (Depreciation) on Investments | 31,154,502 | | (16,513,246) |
| Net Change in Unrealized Depreciation on Affiliated Investments | (1,274,768) | | (2,321,559) |
| Net Increase (Decrease) in Net Assets Resulting from Operations | 31,607,738 | | (13,924,068) |
| | | | | |
| Distributions to Shareholders: | | | |
| Distributions | (4,205,623) | | (11,324,810) |
| Total Dividends and Distributions Paid to Shareholders | (4,205,623) | | (11,324,810) |
| | | | | |
| Capital Share Transactions (Note 5): | | | |
| Proceeds from Sale of Shares | 2,508,244 | | 3,769,837 |
| Net Asset Value of Shares Issued on Reinvestment of Dividends | 4,205,622 | | 11,324,808 |
| Cost of Shares Redeemed | (6,706,105) | | (5,997,744) |
| Net Increase in Net Assets from Shareholder Activity | 7,761 | | 9,096,901 |
| | | | | |
| Net Assets: | | | |
| Net Increase (Decrease) in Net Assets | 27,409,876 | | (16,151,977) |
| Beginning of Year | 126,926,678 | | 143,078,655 |
| End of Year | $ 154,336,554 | | $ 126,926,678 |
| | | | | |
| | | | | |
| | | | | |
| The accompanying notes are an integral part of these financial statements. | | | |
| | | | | | | | | | | | |
| Tarkio Fund | |
| Financial Highlights | |
| Selected data for a share outstanding throughout each year. | |
| | | | | | | | | | | | |
| | | | | | | | | | | | |
| | | | | | | | | | | | |
| | | Years Ended | |
| | | 5/31/2024 | | 5/31/2023 | | 5/31/2022 | | 5/31/2021 | | 5/31/2020 | |
| | | | | | | | | | | | |
| Net Asset Value, at Beginning of Year | $ 21.11 | | $ 25.87 | | $ 31.60 | | $ 16.48 | | $ 18.00 | |
| | | | | | | | | | | | |
| Income (Loss) From Operations: | | | | | | | | | | |
| Net Investment Income (Loss) * | (0.08) | | (0.05) | | 0.05 | | 0.15 | | 0.02 | |
| Net Realized and Unrealized Gain (Loss) on Investments | 5.30 | | (2.66) | | (5.35) | | 15.09 | | (0.51) | |
| Total from Investment Operations | 5.22 | | (2.71) | | (5.30) | | 15.24 | | (0.49) | |
| | | | | | | | | | | | |
| Distributions: | | | | | | | | | | | |
| Net Investment Income | - | | (0.05) | | (0.04) | | (0.12) | | (0.03) | |
| Realized Gains | (0.70) | | (2.00) | | (0.39) | | - | | (1.00) | |
| Total from Distributions | (0.70) | | (2.05) | | (0.43) | | (0.12) | | (1.03) | |
| | | | | | | | | | | | |
| Net Asset Value, at End of Year | $ 25.63 | | $ 21.11 | | $ 25.87 | | $ 31.60 | | $ 16.48 | |
| | | | | | | | | | | | |
| Total Return ** | 25.07% | | (9.63)% | | (16.95)% | | 92.70% | | (3.67)% | |
| | | | | | | | | | | | |
| Ratios/Supplemental Data: | | | | | | | | | | |
| Net Assets at End of Year (Thousands) | $ 154,337 | | $ 126,927 | | $ 143,079 | | $ 168,576 | | $ 91,013 | |
| Ratio of Expenses to Average Net Assets | 1.00% | | 1.00% | | 1.00% | | 1.00% | | 1.00% | |
| Ratio of Net Investment Income (Loss) to Average Net Assets | (0.36)% | | (0.24)% | | 0.17% | | 0.62% | | 0.13% | |
| Portfolio Turnover | 6.91% | | 19.20% | | 12.86% | | 12.32% | | 18.76% | |
| | | | | | | | | | | | |
| | | | | | | | | | | | | |
* Per share net investment income (loss) has been determined on the basis of average shares method.
** Total Return represents the rate that the investor would have earned or lost on an investment in the Fund assuming reinvestment of all Fund distributions.
The accompanying notes are an integral part of these financial statements.
Tarkio Fund
NOTES TO FINANCIAL STATEMENTS
MAY 31, 2024
1. ORGANIZATION
The Clark Fork Trust (the “Trust”) is registered as an open-end management investment company under the Investment Company Act of 1940 (the “1940 Act”) and was organized as a statutory trust under the laws of Delaware by the filing of a Certificate of Trust on October 28, 2010. The Trust is authorized to issue one or more series of beneficial interests and issue classes of any series or divide shares of any series into two or more separate classes. The Trust currently consists of one series of units of beneficial interest (“shares”) called the Tarkio Fund (the “Fund”). The Fund is a non-diversified fund. The investment adviser to the Fund is Front Street Capital Management, Inc. (the “Adviser”).
The Fund’s investment objective is long term growth of capital.
2. SIGNIFICANT ACCOUNTING POLICIES
The following is a summary of significant accounting policies followed by the Fund in the preparation of its financial statements. These policies are in conformity with accounting principles generally accepted in the United States of America (“GAAP”). The Fund is considered an investment company under GAAP and follows the accounting and reporting guidance applicable to investment companies in the Financial Accounting Standards Board Accounting Standards Codification Topic 946-Financial Services-Investment Companies.
SECURITIES VALUATIONS: All investments in securities are recorded at their estimated fair value as described in Note 3.
FEDERAL INCOME TAXES: The Fund’s policy is to comply with the requirements of Subchapter M of the Internal Revenue Code that are applicable to regulated investment companies and to distribute all of its taxable income to its shareholders. Therefore, no federal income tax provision is required. It is the Fund’s policy to distribute annually, prior to the end of the calendar year, dividends sufficient to satisfy excise tax requirements of the Internal Revenue Code. This Internal Revenue Code requirement may cause an excess of distributions over the book year-end accumulated income. In addition, it is the Fund’s policy to distribute annually, after the end of the fiscal year, any remaining net investment income and net realized capital gains.
The Fund recognizes the tax benefits of certain tax positions only where the position is “more likely than not” to be sustained assuming examination by tax authorities. Management has analyzed the Fund’s tax positions, and has concluded that no liability for unrecognized tax benefits should be recorded related to uncertain tax positions taken on returns filed for open tax years (2021-2023), or expected to be taken in the Fund’s 2024 year-end tax returns. The Fund is not aware of any tax positions for which it is reasonably possible that the total amounts of unrecognized tax benefits will change materially in the next twelve months.
The Fund recognizes interest and penalties, if any, related to unrecognized tax benefits as income tax expense in the Statement of Operations when incurred. During the year ended May 31, 2024, the Fund did not incur any interest or penalties.
USE OF ESTIMATES: The preparation of financial statements in conformity with GAAP requires management to make estimates and assumptions that affect the reported amounts of assets and liabilities and disclosure of contingent assets and liabilities at the date of the financial statements and the reported amounts of increases and decreases in net assets from operations during the reporting period. Actual results could differ from those estimates.
DISTRIBUTIONS TO SHAREHOLDERS: Distributions to shareholders, which are determined in accordance with income tax regulations, are recorded on the ex-dividend date. The treatment for financial reporting purposes of distributions made to shareholders during the year from net investment income or net realized capital gains may differ from their ultimate treatment for federal income tax purposes. These differences are caused primarily by differences in the timing of the recognition of certain components of income, expense, or realized capital gain for federal income tax purposes. Any such reclassifications will have no effect on net assets, results of operations, or net asset value per share of the Fund.
INVESTMENT INCOME AND SECURITIES TRANSACTIONS: The Fund records security transactions on the trade date. Dividend income is recognized on the ex-dividend date. Interest income is recognized on an accrual basis. The Fund uses the specific identification method in computing gain or loss on sale of investment securities. Withholding taxes on foreign dividends have been provided in accordance with the Fund’s understanding of the applicable country’s tax rules and rates.
3. SECURITIES VALUATIONS
The Fund utilizes various methods to measure the fair value of its investments on a recurring basis. GAAP establishes a hierarchy that prioritizes inputs to valuation methods. The three levels of inputs are:
Level 1 - Unadjusted quoted prices in active markets for identical assets or liabilities that the Fund has the ability to access.
Level 2 - Observable inputs other than quoted prices included in Level 1 that are observable for the asset or liability, either directly or indirectly. These inputs may include quoted prices for the identical instrument on an inactive market, prices for similar instruments, interest rates, prepayment speeds, credit risk, yield curves, default rates, and similar data.
Level 3 - Unobservable inputs for the asset or liability, to the extent relevant observable inputs are not available, representing the Fund’s own assumptions about the assumptions a market participant would use in valuing the asset or liability, based on the best information that is available.
The availability of observable inputs can vary from security to security and is affected by a wide variety of factors, including, for example, the type of security, whether the security is new and not yet established in the marketplace, the liquidity of markets, and other characteristics particular to the security. To the extent that valuation is based on models or inputs that are less observable or unobservable in the market, the determination of fair value requires more judgment. Accordingly, the degree of judgment exercised in determining fair value is greatest for instruments categorized in Level 3.
The inputs used to measure fair value may fall into different levels of the fair value hierarchy. In such cases, for disclosure purposes, the level in the fair value hierarchy within which the fair value measurement falls in its entirety, is determined based on the lowest level input that is significant to the fair value measurement in its entirety.
FAIR VALUE MEASUREMENTS: The following is a description of the valuation techniques applied to the Fund’s major categories of assets and liabilities measured at fair value on a recurring basis. The Board of Trustees (the “Board”) has delegated day-to-day responsibility for oversight of the valuation of the Fund’s assets to the Fund’s Adviser (the “Valuation Designee”) pursuant to Rule 2a-5 under the 1940 Act and the Fund’s Valuation Policies and Procedures.
Equity securities (common stock) - Equity securities are valued by using market quotations furnished by a pricing service when the Valuation Designee believes such prices accurately reflect the fair value of such securities. Securities that are traded on any stock exchange are valued by the pricing service at the last quoted sale price. Lacking a last sale price, an exchange traded security is valued by the pricing service at its last bid price. To the extent these securities are actively traded and valuation adjustments are not applied, they are classified in Level 1 of the fair value hierarchy. When market quotations are not readily available, or when the Valuation Designee determines that the market quotation or the price provided by the pricing service does not accurately reflect the current fair value, such securities are valued at a fair value as determined by the Valuation Designee in good faith, in accordance with guidelines adopted by and subject to review of the Board.
Manually priced securities held by the Fund (if any) are reviewed by the Board on a quarterly basis, and are categorized as Level 2 or 3, depending on the inputs used.
Money market funds are generally priced at the most recent net asset value (“NAV”) provided by the service agent of the funds. These securities will be categorized as Level 1 securities.
The following table summarizes the inputs used to value the Fund’s assets measured at fair value as of May 31, 2024:
| Valuation Inputs of Assets * | Level 1 | Level 2 | Level 3 | Total |
| Common Stock | $ 153,947,364 | $ - | $ - | $ 153,947,364 |
| Money Market Fund | 636,121 | - | - | 636,121 |
| Total | $ 154,583,485 | $ - | $ - | $ 154,583,485 |
* See the Schedule of Investments for common stock listed by industry.
The Fund did not hold any Level 2 or Level 3 assets or derivative instruments at any time during the year ended May 31, 2024.
AFFILIATED COMPANIES: If a Fund and/or Adviser owns 5% or more of the outstanding voting securities, either directly or indirectly, of a particular issuer, the 1940 Act deems such an issuer to be an “affiliate” of the Fund. As of and during the year ended May 31, 2024, the Fund and Adviser, in combination, owned 5% or more of the outstanding voting securities of the issuers identified in the table below and therefore those issuers are considered affiliates of that Fund for purposes of the 1940 Act.
| The Manitowoc Co., Inc. | |
| Fair Value as of May 31, 2023 | $ 15,084,706 |
| Purchases | - |
| Sales | (1,145,561) |
| Net Realized Loss on Sale of Investments | (377,334) |
| Net Change in Unrealized Appreciation on Investments Held at Period End | (1,274,768) |
| Fair Value as of May 31, 2024 | $ 12,287,043 |
| Share Balance as of May 31, 2024 | 988,499 |
| Dividend Income | $ - |
4. RELATED PARTY TRANSACTIONS
INVESTMENT ADVISER: Front Street Capital Management, Inc. serves as investment adviser to the Fund. Subject to the authority of the Board, the Adviser is responsible for management of the Fund’s investment portfolio. The Adviser is responsible for selecting the Fund’s investments according to the Fund’s investment objective, policies, and restrictions. As compensation for its management services, the Fund is obligated to pay the Adviser an advisory fee computed and accrued daily and paid monthly in arrears at an annual rate of 0.75% of the average daily net assets of the Fund under the Investment Advisory Agreement (“Agreement”). For the year ended May 31, 2024, the Adviser earned $1,063,243 in advisory fees. At May 31, 2024, the Fund owed the Adviser $98,820.
The Fund entered into a Services Agreement with the Adviser. Under the Services Agreement the Adviser is obligated to provide executive and administrative services, assist in the preparation of the Trust’s tax returns and various reports to shareholders, and provide non-investment related statistical and research services. In addition, the Adviser is also obligated to pay for certain operational expenses of the Fund including those related to transfer agency, fund accounting, audit, legal, and chief compliance officer services. Under the Services Agreement, the Adviser receives a fee of 0.25% of the average daily net assets of the Fund. For the year ended May 31, 2024, the Adviser earned $354,414 in service fees. As of May 31, 2024 the Fund owed $32,940 in service fees to the Adviser.
Under the Agreement, the Adviser, at its own expense and without reimbursement from the Trust, furnishes office space and all necessary office facilities, equipment and executive personnel necessary for managing the assets of the Fund. The Adviser pays the operating expenses of the Fund excluding advisory fees and service fees payable under the Agreement and the Services Agreement and the Fund pays all brokerage fees and commissions, taxes, borrowing costs (such as (a) interest and (b) dividend expenses on securities sold short), fees and expenses of the non-interested person Trustees, fees and expenses of acquired funds, and such extraordinary or non-recurring expenses as may arise, including litigation to which the Fund may be a party and indemnification of the Trust’s Board and officers with respect thereto. Some of the officers, and one Trustee, of the Trust are also officers of the Adviser.
5. CAPITAL SHARE TRANSACTIONS
Transactions in capital stock were as follows:
| | Year Ended May 31, 2024 | Year Ended May 31, 2023 |
| | Shares | Amount | Shares | Amount |
| Shares sold | 106,215 | $ 2,508,244 | 169,025 | $ 3,769,837 |
Shares issued in reinvestment of
dividends | 180,035 |
4,205,622 | 594,167 |
11,324,808 |
| Shares redeemed | (276,963) | (6,706,405) | (281,659) | (5,997,744) |
| Net increase (decrease) | 9,287 | $ 7,761 | 481,533 | $ 9,096,901 |
6. INVESTMENT TRANSACTIONS
For the year ended May 31, 2024, purchases and sales of investment securities, other than short-term investments, were as follows:
Purchases
Investment Securities $ 9,778,612
Sales
Investment Securities $14,636,128
7. TAX INFORMATION
As of May 31, 2024, the net unrealized appreciation of investments for tax purposes was as follows:
| Gross Appreciation | $ 74,415,444 |
| Gross (Depreciation) | (18,129,358) |
| Net Appreciation on Investments | $ 56,286,086 |
At May 31, 2024, the aggregate cost of securities for federal income tax purposes was $98,297,399.
As of the fiscal year ended May 31, 2024, the components of distributable earnings/(accumulated losses) on a tax basis are as follows:
| Accumulated undistributed capital gain | $ 2,541,126 |
| Post December loss deferral | (276,297) |
| Unrealized appreciation | 56,286,086 |
| | $ 58,550,915 |
Under current tax law, net capital losses realized after October 31st and net ordinary losses incurred after December 31st may be deferred and treated as occurring on the first day of the following year. The Fund incurred and elected to defer $276,297 of such ordinary late year losses.
The difference between book basis and tax basis unrealized appreciation is attributable to the tax deferral of losses on wash sales.
The Fund has recorded a reclassification in the capital accounts. As of May 31, 2024, the Fund recorded permanent book/tax differences of $485,677 from distributable earnings to paid in capital primarily due to net operating loss forfeiture and the utilization of earnings and profits distributed to shareholders on redemption of shares. This reclassification has no impact on the net asset value of the Fund.
8. DISTRIBUTIONS TO SHAREHOLDERS
The tax character of distributions paid during the years ended May 31, 2024 and 2023 were as follows:
| | 2024 | 2023 |
| Ordinary Income | $ - | $ 683,158 |
| Long-Term Capital Gain | $ 4,205,623 | $10,641,652 |
Income and long-term capital gain distributions are determined in accordance with Federal income tax regulations, which may differ from GAAP.
9. COMMITMENTS AND CONTINGENCIES
In the normal course of business, the Fund may enter into contracts that may contain a variety of representations and warranties and provide general indemnifications. The Fund’s maximum exposure under these arrangements is dependent on future claims that may be made against the Fund and, therefore, cannot be estimated; however, management considers the risk of loss from such claims to be remote.
10. CONTROL OWNERSHIP
The beneficial ownership, either directly or indirectly, of more than 25% of the voting securities of a fund creates a presumption of control of the fund, under Section 2 (a) (9) of the 1940 Act. As of May 31, 2024, Charles Schwab & Co., Inc. held in an omnibus account for the benefit of others approximately 83% of the voting securities of the Fund. The Fund does not know whether any underlying account of Charles Schwab & Co., Inc., owned or controlled 25% of the voting securities of the Fund.
11. MARKET RISK
Overall market risks may also affect the value of the Fund. Factors such as domestic economic growth and market conditions, interest rate levels and political events affect the securities markets. Local, regional or global events such as war, acts of terrorism, the spread of infectious illness or other public health issues, recessions and depressions, or other events could have a significant impact on the Fund and its investments and could result in increased premiums or discounts to the Fund’s net asset value, and may impair market liquidity, thereby increasing liquidity risk. The Fund could lose money over short periods due to short-term market movements and over longer periods during more prolonged market downturns. During a general market downturn, multiple asset classes may be negatively affected. Changes in market conditions and interest rates can have the same impact on all types of securities and instruments.
12. SUBSEQUENT EVENTS
The Fund is required to recognize in its financial statements the effects of all subsequent events that provide additional evidence about conditions that existed at the date of the Statement of Assets and Liabilities. For non-recognized subsequent events that must be disclosed to keep the financial statements from being misleading, the Fund is required to disclose the nature of the event as well as an estimate of its financial effect, or a statement that such an estimate cannot be made. Management has evaluated the impact of all subsequent events on the Fund through the issuance date of these financial statements and has noted no events requiring accounting or disclosure.
REPORT OF INDEPENDENT REGISTERED PUBLIC ACCOUNTING FIRM
To the Shareholders of Tarkio Fund and
Board of Trustees of Clark Fork Trust
Opinion on the Financial Statements
We have audited the accompanying statement of assets and liabilities, including the schedule of investments, of Tarkio Fund (the “Fund”), a series of Clark Fork Trust, as of May 31, 2024, the related statement of operations for the year then ended, the statements of changes in net assets for each of the two years in the period then ended, the financial highlights for each of the five years in the period then ended, and the related notes (collectively referred to as the “financial statements”). In our opinion, the financial statements present fairly, in all material respects, the financial position of the Fund as of May 31, 2024, the results of its operations for the year then ended, the changes in net assets for each of the two years in the period then ended, and the financial highlights for each of the five years in the period then ended, in conformity with accounting principles generally accepted in the United States of America.
Basis for Opinion
These financial statements are the responsibility of the Fund’s management. Our responsibility is to express an opinion on the Fund’s financial statements based on our audits. We are a public accounting firm registered with the Public Company Accounting Oversight Board (United States) (“PCAOB”) and are required to be independent with respect to the Fund in accordance with the U.S. federal securities laws and the applicable rules and regulations of the Securities and Exchange Commission and the PCAOB.
We conducted our audits in accordance with the standards of the PCAOB. Those standards require that we plan and perform the audit to obtain reasonable assurance about whether the financial statements are free of material misstatement whether due to error or fraud.
Our audits included performing procedures to assess the risks of material misstatement of the financial statements, whether due to error or fraud, and performing procedures that respond to those risks. Such procedures included examining, on a test basis, evidence regarding the amounts and disclosures in the financial statements. Our procedures included confirmation of securities owned as of May 31, 2024, by correspondence with the custodian and broker; when replies were not received from the broker, we performed other auditing procedures. Our audits also included evaluating the accounting principles used and significant estimates made by management, as well as evaluating the overall presentation of the financial statements. We believe that our audits provide a reasonable basis for our opinion.
We have served as the Fund’s auditor since 2011.

COHEN & COMPANY, LTD.
Cleveland, Ohio
July 25, 2024
Tarkio Fund
ADDITIONAL INFORMATION
May 31, 2024 (UNAUDITED)
Proxy Voting - A description of the policies and procedures that the Fund uses to determine how to vote proxies relating to portfolio securities and information regarding how the Fund voted proxies during the most recent 12-month period ended May 31, are available without charge upon request by (1) calling the Fund at (800) 231-2901 and (2) from Fund documents filed with the Securities and Exchange Commission (“SEC”) on the SEC's website at http://www.sec.gov.
Portfolio Holdings - The Fund files a complete schedule of investments with the SEC for the first and third quarter of each fiscal year on Form N-PORT. The Fund’s first and third fiscal quarters end on August 31 and February 28. The Form N-PORT filing must be made within 60 days of the end of the quarter. The Fund’s Forms N-PORT are available on the SEC’s website at http://www.sec.gov. You may also obtain copies by calling the Fund at 1-800-231-2901.
Additional Information - The Fund’s Statement of Additional Information (“SAI”) includes additional information about the Fund and its trustees and is available, without charge, upon request. You may call toll-free (800) 231-2901 to request a copy of the SAI or to make shareholder inquiries.
Annual Investment Advisory Agreement Renewal - At a meeting held on April 24, 2024, the Board considered the renewal of the Investment Advisory Agreement (the “Agreement”) between the Trust and Front Street Capital Management, Inc. (the “Adviser”) on behalf of the Tarkio Fund (the “Fund”). In approving the Agreement for the Fund, the Board considered and evaluated the following factors: (i) the investment performance of the Fund and the Adviser; (ii) the nature, extent, and quality of the services provided by the Adviser to the Fund; (iii) the cost of the services to be provided and the profits to be realized by the Adviser from the relationship with the Fund; (iv) the extent to which economies of scale will be realized as the Fund grows and whether the fee levels reflect these economies of scale for the benefit of shareholders; and (v) the Adviser’s practices regarding possible conflicts of interest and benefits to the Adviser.
In assessing these factors and reaching its decisions, the Board took into consideration information furnished for the Board’s review and consideration throughout the year at regular Board meetings, as well as information specifically prepared and/or presented in connection with the annual renewal process, including information presented at the Meeting. The Board requested and was provided with information and reports relevant to the annual renewal of the Agreement, including: (i) reports regarding the services and support provided to the Fund and its shareholders by the Adviser; (ii) reports as to assessments of the investment performance of the Fund by personnel of the Adviser; (iii) presentations addressing the Adviser’s investment strategy and techniques used in managing the Fund and qualifications and abilities of its professional personnel; (v) compliance reports concerning the Fund; (vi) disclosure information contained in the registration statement of the Trust and the Form ADV of the Adviser; and (vii) a memorandum from Counsel, that summarized the fiduciary duties and responsibilities of the Board in reviewing and approving the Agreement, including the material factors set forth above and the types of information included in each factor that should be considered by the Board in order to make an informed decision. The Board also requested and received various informational materials including, without limitation: (i) financial information about the Adviser and a description of personnel and the services provided to the Fund, information on investment advice, performance, summaries of Fund expenses, compliance program, current legal matters, and other general information; (ii) comparative expense and performance information for other mutual funds with strategies similar to the Fund; and (iii) benefits to be realized by the Adviser from its relationship with the Fund. The Board did not identify any particular information that was most relevant to its consideration to approve the Agreement and each Trustee may have afforded different weight to the various factors.
1. Nature, Extent, and Quality of the Services Provided by the Adviser
In considering the nature, extent, and quality of the services provided by the Adviser, the Trustees reviewed the responsibilities of the Adviser under the Agreement. The Trustees reviewed the services being provided by the Adviser to the Fund including, without limitation: the quality of its investment advisory services (including research and recommendations with respect to portfolio securities); its process for formulating investment decisions and assuring compliance with the Fund’s investment objective, strategies, and limitations, as well as for ensuring compliance with regulatory requirements; its coordination of services for the Fund among the service providers and the Independent Trustees; its efforts to promote the Fund and grow its assets; and its provision of a Chief Compliance Officer and a Liquidity Risk Management Program Administrator to the Fund. The Trustees noted the Adviser’s continuity of advisory services provided to the Fund, and commitment to retain qualified personnel; and the Adviser’s continued cooperation with the Independent Trustees and Counsel for the Fund. The Trustees evaluated the Adviser’s personnel, including the education and experience of its personnel. The Trustees discussed the Adviser’s ongoing efforts to market the Fund to investors, and the Adviser’s overall investment strategy. After reviewing the foregoing information and further information in the materials provided by the Adviser (including the Adviser’s Form ADV), the Board concluded that, in light of all the facts and circumstances, the nature, extent, and quality of the services provided by the Adviser were satisfactory and adequate for the Fund.
2. Investment Performance of the Fund and the Adviser
In considering the investment performance of the Fund and the Adviser, the Trustees compared the performance of the Fund with the performance of a group of mid-cap blend funds with assets under $500 million as categorized by Morningstar as the Fund’s peer group (the “Category”) and the Fund’s benchmark index, the S&P 500 Index (the “Index”). The comparative Category performance data included 1-year, 3-year, and 5-year periods ended December 31, 2023. The comparative Index performance data included quarterly and annual performance from the Fund’s inception in 2011 to March 28, 2024. The Fund’s performance was within the range of the performance of funds in the comparative Morningstar Category for each period, although for the 3-year period the Fund was among the poorer performing funds in the Morningstar Category. The Fund underperformed its Index for the period since the Fund’s inception, based on annualized total returns during this period. The Trustees noted that the Adviser manages separate accounts with the same investment objective as the Fund and that the performance of the majority of these accounts was generally slightly lower than the Fund’s performance for the calendar year 2023. It was noted that performance differences between the average separate account and the Fund are attributed primarily to differences in the timing of inflows and outflows of cash to the Fund versus those of the separate accounts which directly affect the ability to purchase and sell shares of companies for investment at any particular time. The Trustees noted that the Fund is more concentrated than the Index and performance will fluctuate to a greater extent during market declines and advances. The Trustees further noted that the Fund is not managed to track the performance of the Index or its Category average. After reviewing and discussing the investment performance of the Fund further, the Adviser’s experience managing the Fund, the Adviser’s historical investment performance, and other relevant factors, the Board concluded, in light of all the facts and circumstances, that the investment performance of the Fund and the Adviser was satisfactory.
| 3. | Costs of the Services to be provided and profits to be realized by the Adviser |
In considering the costs of the services to be provided and profits to be realized by the Adviser from the relationship with the Fund, the Trustees considered: (1) the Adviser’s balance sheet and profit and loss statement for the period ended December 31, 2023; (2) the asset level of the Fund; (3) the overall expenses of the Fund; and (4) the nature and frequency of advisory fee payments. The Trustees reviewed information provided by the Adviser regarding its profits associated with managing the Fund, noting that the Adviser was profitable for the 2023 calendar year regarding the provision of its services to the Fund. The Trustees also considered potential benefits for the Adviser in managing the Fund, noting that many of its advisory clients may purchase shares of the Fund for related smaller accounts. The Trustees then compared the fees and expenses of the Fund to its Category. They found that the Fund’s overall expense ratio of 1.00% per annum was 0.15% less than the Category average. The Fund’s advisory fee is 0.75% of the Fund’s assets annually, and the Fund’s overall expense ratio includes a 0.25% annual service fee paid to the Adviser to provide executive and administrative services to the Fund. The Trustees noted that the Adviser does not receive a higher total fee for services provided to separately managed accounts as compared to the fees it receives from the Fund. Based on the foregoing, the Board concluded that the fees to be paid to the Adviser and the profits to be realized by the Adviser, in light of all the facts and circumstances, were satisfactory in relation to the nature, extent and quality of the services provided to the Fund by the Adviser.
4. Economies of Scale
The Trustees next considered the impact of economies of scale and whether advisory fee levels reflect those economies of scale for the benefit of the Fund’s investors. The Trustees considered that while the advisory fee remained the same at all asset levels, the Fund’s shareholders had experienced benefits from the fact that the Adviser was obligated to pay certain of the Fund’s operating expenses which had the effect of limiting the overall expenses paid by the Fund to 1.00% annually. In light of its ongoing consideration of the Fund’s asset levels and Fund expenses, the Board determined that the Fund’s fee arrangements, in light of all the facts and circumstances, were satisfactory in relation to the nature, extent and quality of the services provided to the Fund by the Adviser.
5. Possible conflicts of interest and benefits to the Adviser.
In considering the Adviser’s practices regarding conflicts of interest, the Trustees evaluated the potential for conflicts of interest and considered such matters as the experience and ability of the advisory personnel assigned to the Fund; the basis of decisions to buy or sell securities for the Fund and the Adviser’s other accounts; and the substance and administration of the Adviser’s code of ethics. The Trustees also considered the Adviser’s practices regarding brokerage and portfolio transactions, including particularly the Adviser’s practice for seeking best execution for the Fund’s portfolio transactions and potential benefits to the Adviser that may be viewed as soft dollars that could result from its trading. The Trustees considered the process by which portfolio transactions are made, noting that the Fund is charged brokerage commissions on its exchange traded equity trades. Based on the foregoing, the Board determined that the standards and practices of the Adviser relating to the identification and mitigation of potential conflicts of interest and the benefits to be realized by the Adviser in managing the Fund were satisfactory.
Based on the foregoing, the Board determined that the best interests of the Fund’s shareholders were served by the renewal of the Advisory Agreement for a one-year term.
INVESTMENT ADVISER
Front Street Capital Management, Inc.
218 East Front Street, Suite 205
Missoula, MT 59802
INDEPENDENT REGISTERED PUBLIC ACCOUNTING FIRM
Cohen & Company, Ltd.
1350 Euclid Ave., Suite 800
Cleveland, OH 44115
LEGAL COUNSEL
Practus, LLP
11300 Tomahawk Creek Pkwy., Suite 310
Leawood, KS 66211
CUSTODIAN
Huntington National Bank
41 South Street
Columbus, OH 43125
TRANSFER AGENT AND FUND ACCOUNTANT
Mutual Shareholder Services, LLC
8000 Town Centre Drive, Suite 400
Broadview Heights, OH 44147
DISTRIBUTOR
Arbor Court Capital, LLC
8000 Town Centre Drive, Suite 400
Broadview Heights, OH 44147
This report is intended only for the information of shareholders or those who have received the Fund’s prospectus, which contains information about the Fund’s advisory fee and expenses. Please read the prospectus carefully before investing.
Item 8. Changes in and Disagreements with Accountants for Open-End Management Investment Companies. Not applicable.
Item 9. Proxy Disclosures for Open-End Management Investment Companies. Not applicable.
Item 10. Remuneration Paid to Directors, Officers, and Others of Open-End Management Investment Companies. Total remuneration paid during the twelve-month period covered by this report was $3,200.
Item 11. Statement Regarding Basis for Approval of Investment Advisory Contract. The Fund’s Evaluation and Approval of Advisory Contract summary by fund appears in the Financial Statements filed under Item 7 of this form.
Item 12. Disclosure of Proxy Voting Policies and Procedures for Closed-End Management Investment Companies. Not applicable.
Item 13. Portfolio Managers of Closed-End Management Investment Companies. Not applicable.
Item 14. Purchases of Equity Securities by Closed-End Management Investment Company and Affiliated Purchasers. Not applicable.
Item 15. Submission of Matters to a Vote of Security Holders. The guidelines applicable to shareholders desiring to submit recommendations for nominees to the Registrant's board of trustees are contained in the Trust’s Statement of Additional Information.
Item 16. Controls and Procedures.
(a) Based on their evaluation of the registrant’s disclosure controls and procedures (as defined in Rule 30a-3(c) under the Investment Company Act of 1940, as amended (the “Act”)) as of a date within 90 days of the filing date of this report, the registrant’s principal executive officer and principal financial officer have concluded that such disclosure controls and procedures are reasonably designed and are operating effectively to ensure that material information relating to the registrant is made known to them by others within those entities, particularly during the period in which this report is being prepared, and that the information required in filings on Form N-CSR is recorded, processed, summarized, and reported on a timely basis.
(b) There were no changes in the registrant’s internal control over financial reporting (as defined in Rule 30a-3(d) under the Investment Company Act of 1940) that occurred during the second fiscal quarter of the period covered by this report that have materially affected, or are reasonably likely to materially affect, the registrant’s internal control over financial reporting.
Item 17. Disclosure of Securities Lending Activities for Closed-End Management Investment Companies. Not applicable.
Item 18. Recovery of Erroneously Awarded Compensation.
(a) Not applicable.
(b) Not applicable.
Item 19. Exhibits.
(a)(1) Code of Ethics. Filed herewith.
(a)(2) Certifications by the registrant's principal executive officer and principal financial officer, pursuant to Section 302 of the Sarbanes-Oxley Act of 2002 and required by Rule 30a-2under the Investment Company Act of 1940 are filed herewith.
(a)(3) Not applicable.
(b) Certification pursuant to 18 U.S.C. Section 1350, as adopted pursuant to Section 906 of the Sarbanes-Oxley Act of 2002 is filed herewith.
SIGNATURES
Pursuant to the requirements of the Securities Exchange Act of 1934 and the Investment Company Act of 1940, this report has been signed below by the following persons on behalf of the registrant and in the capacities and on the dates indicated.
Clark Fork Trust
By /s/ Russell T. Piazza
Russell T. Piazza
Chairman of the Board, Principal Executive Officer
Date: August 6, 2024
Pursuant to the requirements of the Securities Exchange Act of 1934 and the Investment Company Act of 1940, the registrant has duly caused this report to be signed on its behalf by the undersigned, thereunto duly authorized.
By /s/ Russell T. Piazza
Russell T. Piazza
Chairman of the Board, Principal Executive Officer
Date: August 6, 2024
By /s/ Michele Blood
Michele Blood
Principal Financial Officer, Treasurer
Date: August 6, 2024