China Shengda Packaging Group Inc. Financial Analysis June 5, 2015 The information contained herein is of a confidential nature and is intended for the use of the persons or firm to whom it is furnished by us. Reproduction, publication, or dissemination of portions hereof may not be made without prior approval of Duff & Phelps, LLC and its affiliates.
2 CONFIDENTIAL Duff & Phelps Disclaimer • The following pages contain materials that are being provided by Duff & Phelps, LLC (“ Duff & Phelps ”) to Yida International Holdings Limited (“ Parent ”) . • The accompanying materials are compiled on a confidential basis for the use and benefit of Parent and may not be distributed to any other party, publicly disclosed, or relied upon for any other purpose without the prior written consent of Duff & Phelps . • Neither Duff & Phelps nor any of its legal advisors takes any responsibility for the accuracy or completeness of any of this material if used by persons other than Parent . • This Financial Analysis provided by Duff & Phelps does not : (i) address the merits of the underlying business decision of Parent , China Shengda Packaging Group Inc . (the “ Company ”), the board of directors of the Company (the “ Board of Directors ”), or any other party to the Transaction (as herein defined) to enter into the Transaction versus any alternative strategy or transaction ; (ii) constitute a recommendation to Parent, the Company, the Board of Directors or any other person, including security holders of the Company, as to how such person should vote or as to any other specific action that should be taken in connection with the Transaction ; or (iii) create any fiduciary duty on Duff & Phelps’ part to any party . • The information utilized in preparing this material was obtained from the Company and from public sources . Any estimates and forecasts contained herein have been prepared by or are based on discussions with the senior management of the Company and involve numerous and significant subjective determinations, which may or may not prove to be correct . No representation or warranty, expressed or implied, is made as to the accuracy or completeness of such information and nothing contained herein is, or shall be relied upon as, a representation, whether as to the past or the future . Duff & Phelps did not independently verify such information . • No selected company or selected transaction used in our analysis is directly comparable to the Company or the Transaction .
3 CONFIDENTIAL Table of Contents 1. Introduction 2. Financial Analysis – Discounted Cash Flow Analysis – Selected Public Companies / M&A Transactions Analysis Appendix 1. Assumptions, Qualifications, and Limiting Conditions 2. Summary of Premiums Paid – Supplemental

Introduction Section 01
5 CONFIDENTIAL Introduction The Engagement • Duff & Phelps has been engaged by Parent to serve as independent financial advisor to provide a financial analysis (this “ Financial Analysis ”) to Parent in connection with the transaction described below (the “ Transaction ”) . The Transaction • Duff & Phelps understands that prior to the completion of the Transaction, Parent will own 90 . 8 % of all outstanding common shares, par value $ 0 . 001 per share (the “ Company Shares ”), of the Company . It is Duff & Phelps’ understanding that the Transaction involves the contribution by Parent of all of the Company Shares it will own to Yida International Acquisition Limited, a wholly owned subsidiary of Parent (“ Merger Sub ”), followed by the merger of Merger Sub with and into the Company, with the Company surviving the merger as a wholly owned subsidiary of Parent . The merger will be effected pursuant to Chapter 92 A . 180 of the Nevada Revised Statutes . At the effective time of the merger, each outstanding Company Share, excluding Company Shares held in treasury, not owned by Parent, Merger Sub and the contributing stockholders will be exchanged for the right to receive US $ 7 . 25 in cash .
6 CONFIDENTIAL Introduction Scope of Analysis • Duff & Phelps has made such reviews, analyses and inquiries as it has deemed necessary and appropriate under the circumstances . Duff & Phelps also took into account its assessment of general economic, market and financial conditions, as well as its experience in securities and business valuation, in general, and with respect to similar transactions, in particular . Duff & Phelps’ procedures, investigations, and analysis with respect to the preparation of its Financial Analysis included , but were not limited to, the items summarized below . 1. Reviewed the following documents : » The Company’s annual reports on Form 10 - K filed with the Securities and Exchange Commission (“ SEC ”) for the years ended December 31 , 2013 and 2014 ; » The Company’s unaudited financial statements for the three months ended March 31 , 2015 and the three months ended March 31 , 2014 ; » Certain financial projections prepared and provided to Duff & Phelps by management of the Company with respect to financial years ending December 31 , 2015 through 2024 (the “ Management Projections ”) ; » Other internal documents relating to the past and current business operations , financial conditions and probable future outlook of the Company, provided to Duff & Phelps by the management of the Company ; » A letter dated June 3 , 2015 from the chief executive officer of the Company which made certain representations as to the Management Projections and the underlying assumptions for the Company (the “ Management Representation Letter ”) ; and » Documents related to the Transaction , including the Contribution Agreement executed on May 21 , 2015 ; 2. Discussed the information referred to above and the business, operations and financial condition and prospects of the Company as well as the background and other elements of the Transaction with the management of the Company ; 3. Reviewed the historical trading price and trading volume of the Company Shares and the publicly traded securities of certain other companies that Duff & Phelps deemed relevant ; 4. Performed certain valuation and comparative analyses using generally accepted valuation and analytical techniques, including a discounted cash flow analysis, an analysis of selected public companies that Duff & Phelps deemed relevant, an analysis of selected transactions that Duff & Phelps deemed relevant, and a review of premiums paid in selected transactions that Duff & Phelps deemed relevant ; and 5. Conducted such other analyses and inquiries and considered such other information and factors as Duff & Phelps deemed appropriate .
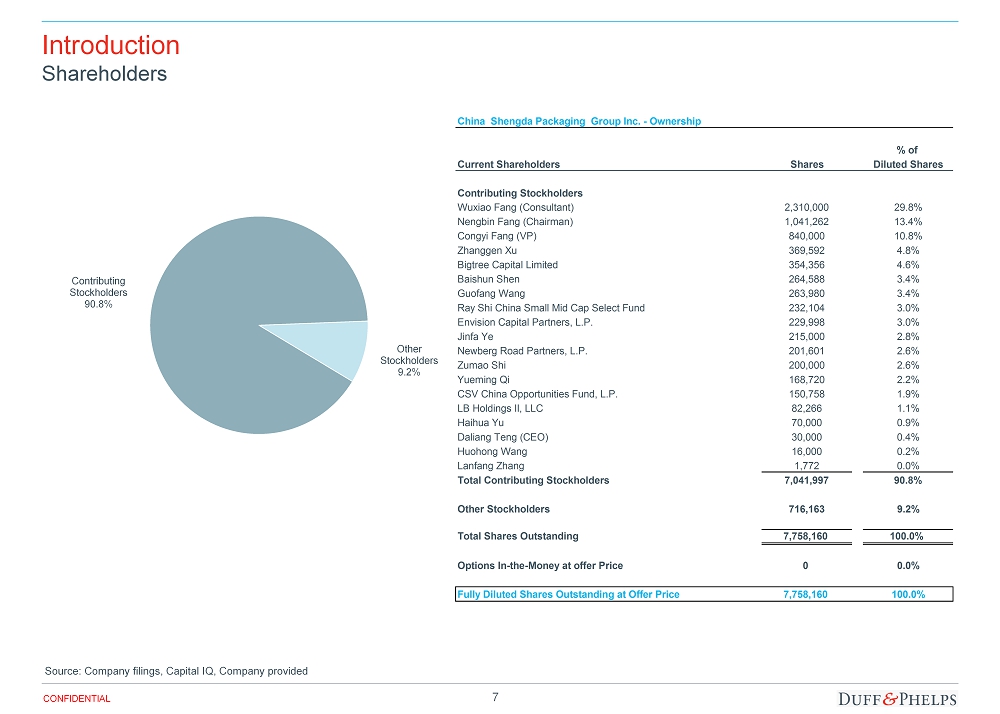
7 CONFIDENTIAL Introduction Shareholders Source: Company filings, Capital IQ, Company provided China Shengda Packaging Group Inc. - Ownership % of Current Shareholders Shares Diluted Shares Contributing Stockholders Wuxiao Fang (Consultant) 2,310,000 29.8% Nengbin Fang (Chairman) 1,041,262 13.4% Congyi Fang (VP) 840,000 10.8% Zhanggen Xu 369,592 4.8% Bigtree Capital Limited 354,356 4.6% Baishun Shen 264,588 3.4% Guofang Wang 263,980 3.4% Ray Shi China Small Mid Cap Select Fund 232,104 3.0% Envision Capital Partners, L.P. 229,998 3.0% Jinfa Ye 215,000 2.8% Newberg Road Partners, L.P. 201,601 2.6% Zumao Shi 200,000 2.6% Yueming Qi 168,720 2.2% CSV China Opportunities Fund, L.P. 150,758 1.9% LB Holdings II, LLC 82,266 1.1% Haihua Yu 70,000 0.9% Daliang Teng (CEO) 30,000 0.4% Huohong Wang 16,000 0.2% Lanfang Zhang 1,772 0.0% Total Contributing Stockholders 7,041,997 90.8% Other Stockholders 716,163 9.2% Total Shares Outstanding 7,758,160 100.0% Options In-the-Money at offer Price 0 0.0% Fully Diluted Shares Outstanding at Offer Price 7,758,160 100.0% Contributing Stockholders 90.8% Other Stockholders 9.2%
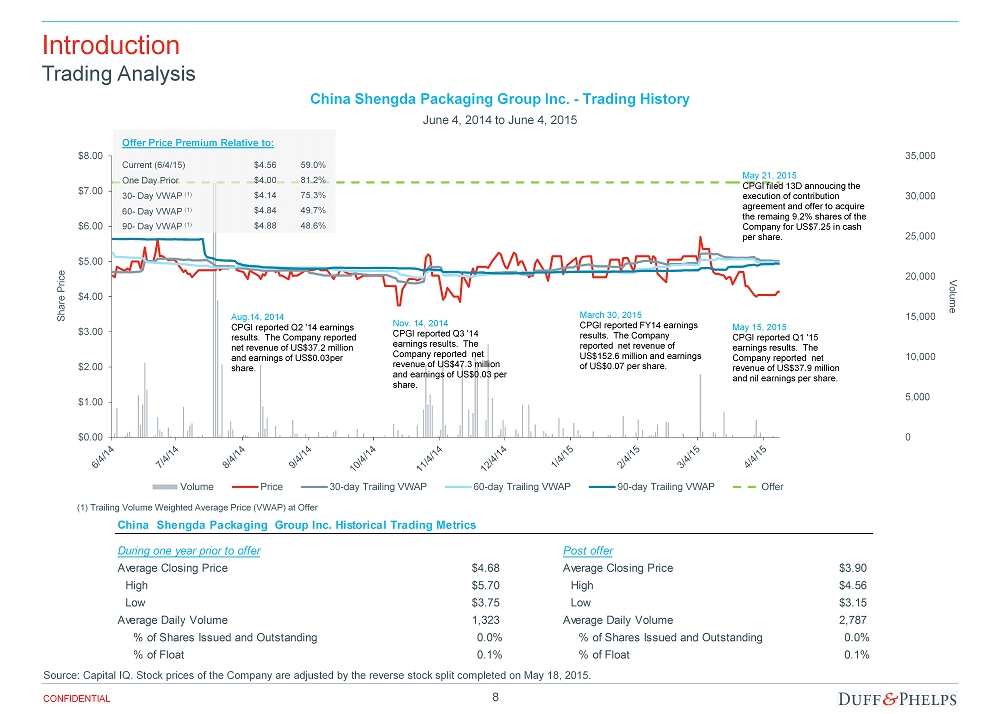
8 CONFIDENTIAL 0 5,000 10,000 15,000 20,000 25,000 30,000 35,000 $0.00 $1.00 $2.00 $3.00 $4.00 $5.00 $6.00 $7.00 $8.00 Volume Share Price Volume Price 30-day Trailing VWAP 60-day Trailing VWAP 90-day Trailing VWAP Offer Current (6/4/15) Offer Price Premium Relative to: 59.0% 30 - Day VWAP (1) 75.3% 49.7% 48.6% 60 - Day VWAP (1) 90 - Day VWAP (1) One Day Prior 81.2% $4.56 $4.14 $4.84 $4.88 $4.00 (1) Trailing Volume Weighted Average Price (VWAP) at Offer May 21, 2015 CPGI filed 13D annoucing the execution of contribution agreement and offer to acquire the remaing 9.2% shares of the Company for US$7.25 in cash per share. Aug.14, 2014 CPGI reported Q2 '14 earnings results. The Company reported net revenue of US$37.2 million and earnings of US$0.03 per share. Nov. 14, 2014 CPGI reported Q3 '14 earnings results. The Company reported net revenue of US$47.3 million and earnings of US$0.03 per share . March 30, 2015 CPGI reported FY14 earnings results. The Company reported net revenue of US$152.6 million and earnings of US$0.07 per share. May 15, 2015 CPGI reported Q1 '15 earnings results. The Company reported net revenue of US$37.9 million and nil earnings per share . Introduction Trading Analysis Source: Capital IQ. Stock prices of the Company are adjusted by the reverse stock split completed on May 18, 2015. China Shengda Packaging Group Inc. - Trading History June 4 , 2014 to June 4, 2015 China Shengda Packaging Group Inc. Historical Trading Metrics During one year prior to offer Post offer Average Closing Price $4.68 Average Closing Price $3.90 High $5.70 High $4.56 Low $3.75 Low $3.15 Average Daily Volume 1,323 Average Daily Volume 2,787 % of Shares Issued and Outstanding 0.0% % of Shares Issued and Outstanding 0.0% % of Float 0.1% % of Float 0.1%
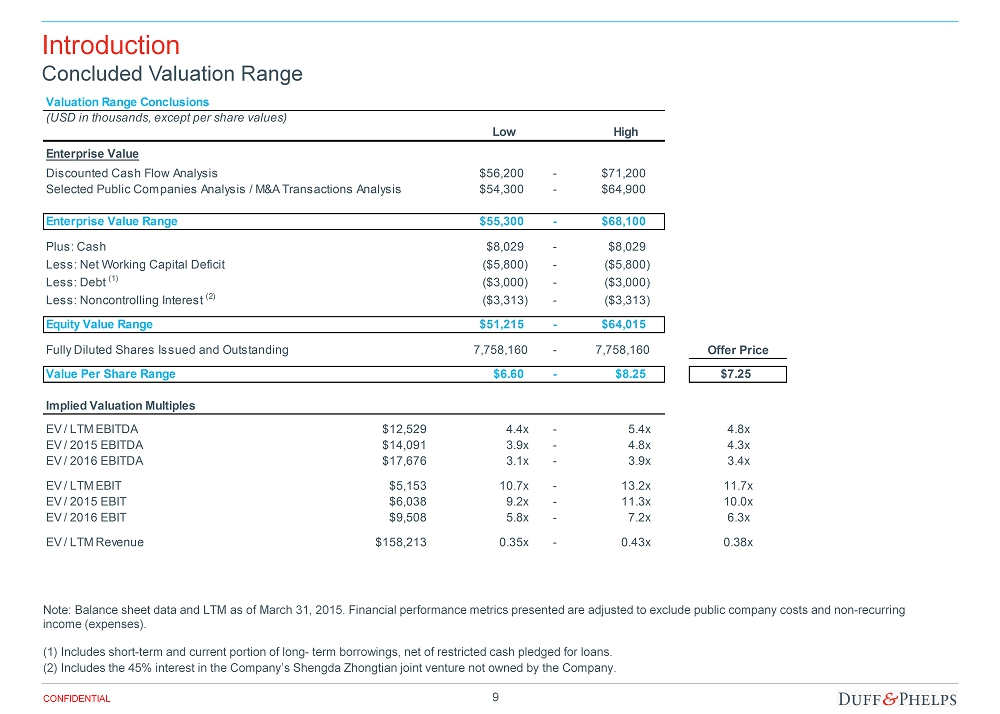
9 CONFIDENTIAL Introduction Concluded Valuation Range Note: Balance sheet data and LTM as of March 31, 2015. Financial performance metrics presented are adjusted to exclude public co mpany costs and non - recurring income (expenses). (1) Includes short - term and current portion of long - term borrowings, net of restricted cash pledged for loans. (2) Includes the 45% interest in the Company’s Shengda Zhongtian joint venture not owned by the Company. Valuation Range Conclusions (USD in thousands, except per share values) Low High Enterprise Value Discounted Cash Flow Analysis $56,200 - $71,200 Selected Public Companies Analysis / M&A Transactions Analysis $54,300 - $64,900 Enterprise Value Range $55,300 - $68,100 Plus: Cash $8,029 - $8,029 Less: Net Working Capital Deficit ($5,800) - ($5,800) Less: Debt (1) ($3,000) - ($3,000) Less: Noncontrolling Interest (2) ($3,313) - ($3,313) Equity Value Range $51,215 - $64,015 Fully Diluted Shares Issued and Outstanding 7,758,160 - 7,758,160 Offer Price Value Per Share Range $6.60 - $8.25 $7.25 Implied Valuation Multiples EV / LTM EBITDA $12,529 4.4x - 5.4x 4.8x EV / 2015 EBITDA $14,091 3.9x - 4.8x 4.3x EV / 2016 EBITDA $17,676 3.1x - 3.9x 3.4x EV / LTM EBIT $5,153 10.7x - 13.2x 11.7x EV / 2015 EBIT $6,038 9.2x - 11.3x 10.0x EV / 2016 EBIT $9,508 5.8x - 7.2x 6.3x EV / LTM Revenue $158,213 0.35x - 0.43x 0.38x
Financial Analysis Section 02
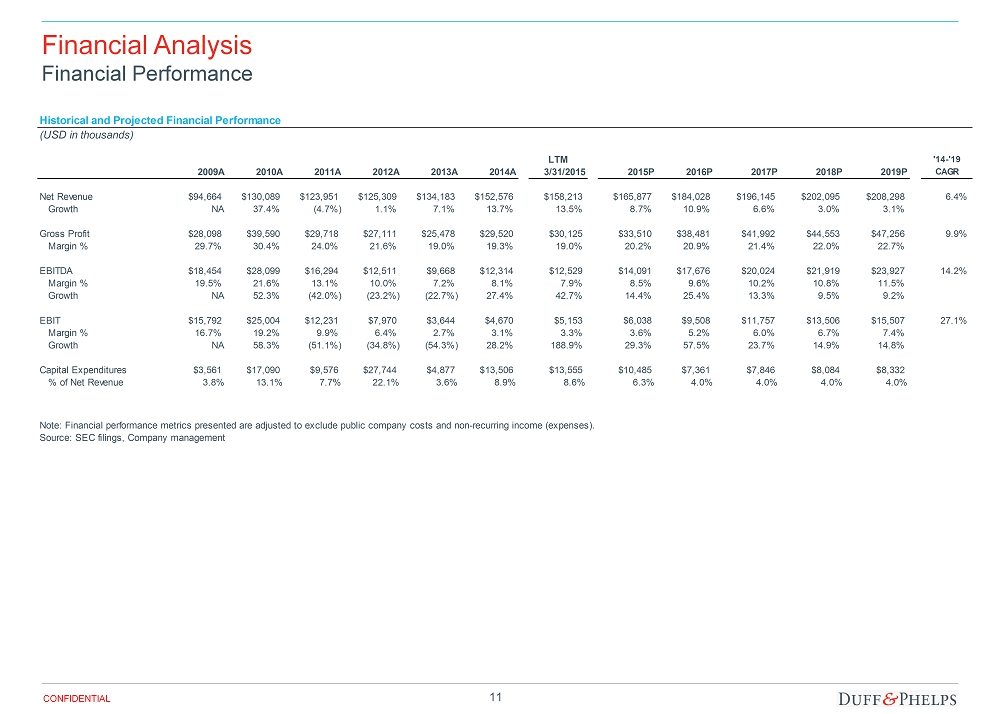
11 CONFIDENTIAL Financial Analysis Financial Performance Historical and Projected Financial Performance (USD in thousands) LTM '14-'19 2009A 2010A 2011A 2012A 2013A 2014A 3/31/2015 2015P 2016P 2017P 2018P 2019P CAGR Net Revenue $94,664 $130,089 $123,951 $125,309 $134,183 $152,576 $158,213 $165,877 $184,028 $196,145 $202,095 $208,298 6.4% Growth NA 37.4% (4.7%) 1.1% 7.1% 13.7% 13.5% 8.7% 10.9% 6.6% 3.0% 3.1% Gross Profit $28,098 $39,590 $29,718 $27,111 $25,478 $29,520 $30,125 $33,510 $38,481 $41,992 $44,553 $47,256 9.9% Margin % 29.7% 30.4% 24.0% 21.6% 19.0% 19.3% 19.0% 20.2% 20.9% 21.4% 22.0% 22.7% EBITDA $18,454 $28,099 $16,294 $12,511 $9,668 $12,314 $12,529 $14,091 $17,676 $20,024 $21,919 $23,927 14.2% Margin % 19.5% 21.6% 13.1% 10.0% 7.2% 8.1% 7.9% 8.5% 9.6% 10.2% 10.8% 11.5% Growth NA 52.3% (42.0%) (23.2%) (22.7%) 27.4% 42.7% 14.4% 25.4% 13.3% 9.5% 9.2% EBIT $15,792 $25,004 $12,231 $7,970 $3,644 $4,670 $5,153 $6,038 $9,508 $11,757 $13,506 $15,507 27.1% Margin % 16.7% 19.2% 9.9% 6.4% 2.7% 3.1% 3.3% 3.6% 5.2% 6.0% 6.7% 7.4% Growth NA 58.3% (51.1%) (34.8%) (54.3%) 28.2% 188.9% 29.3% 57.5% 23.7% 14.9% 14.8% Capital Expenditures $3,561 $17,090 $9,576 $27,744 $4,877 $13,506 $13,555 $10,485 $7,361 $7,846 $8,084 $8,332 % of Net Revenue 3.8% 13.1% 7.7% 22.1% 3.6% 8.9% 8.6% 6.3% 4.0% 4.0% 4.0% 4.0% Note: Financial performance metrics presented are adjusted to exclude public company costs and non-recurring income (expenses). Source: SEC filings, Company management
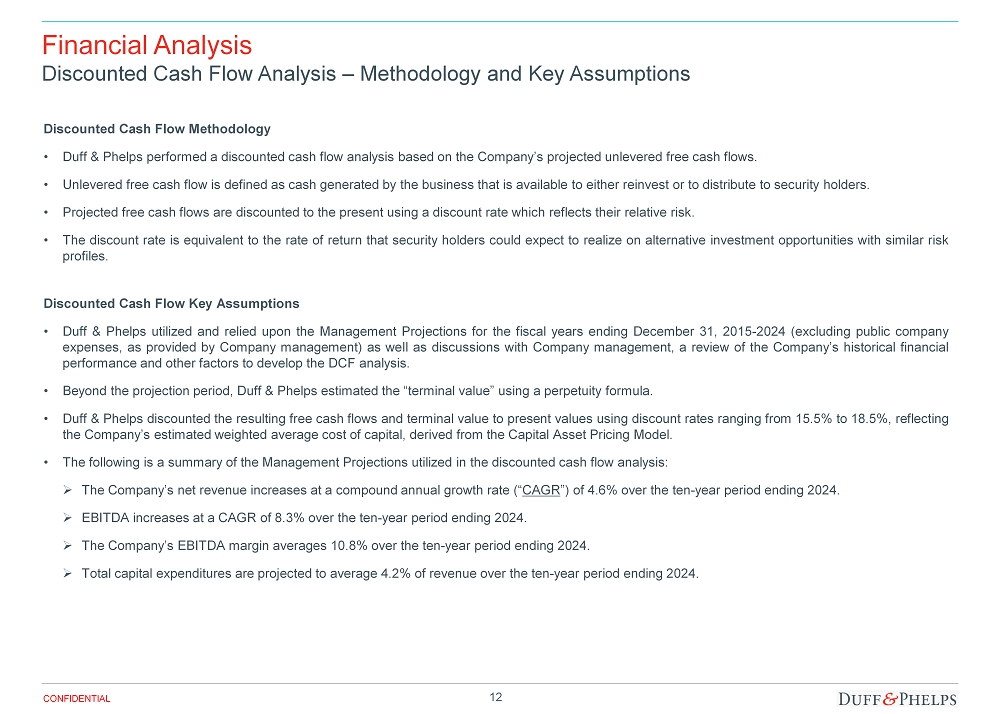
12 CONFIDENTIAL Financial Analysis Discounted Cash Flow Analysis – Methodology and Key Assumptions Discounted Cash Flow Methodology • Duff & Phelps performed a discounted cash flow analysis based on the Company’s projected unlevered free cash flows . • Unlevered free cash flow is defined as cash generated by the business that is available to either reinvest or to distribute to security holders . • Projected free cash flows are discounted to the present using a discount rate which reflects their relative risk . • The discount rate is equivalent to the rate of return that security holders could expect to realize on alternative investment opportunities with similar risk profiles . Discounted Cash Flow Key Assumptions • Duff & Phelps utilized and relied upon the Management Projections for the fiscal years ending December 31 , 2015 - 2024 (excluding public company expenses, as provided by Company management) as well as discussions with Company management, a review of the Company’s historical financial performance and other factors to develop the DCF analysis . • Beyond the projection period, Duff & Phelps estimated the “terminal value” using a perpetuity formula . • Duff & Phelps discounted the resulting free cash flows and terminal value to present values using discount rates ranging from 15 . 5 % to 18 . 5 % , reflecting the Company’s estimated weighted average cost of capital, derived from the Capital Asset Pricing Model . • The following is a summary of the Management Projections utilized in the discounted cash flow analysis : » The Company’s net revenue increases at a compound annual growth rate (“ CAGR ”) of 4 . 6 % over the ten - year period ending 2024 . » EBITDA increases at a CAGR of 8 . 3 % over the ten - year period ending 2024 . » The Company’s EBITDA margin averages 10 . 8 % over the ten - year period ending 2024 . » Total capital expenditures are projected to average 4 . 2 % of revenue over the ten - year period ending 2024 .
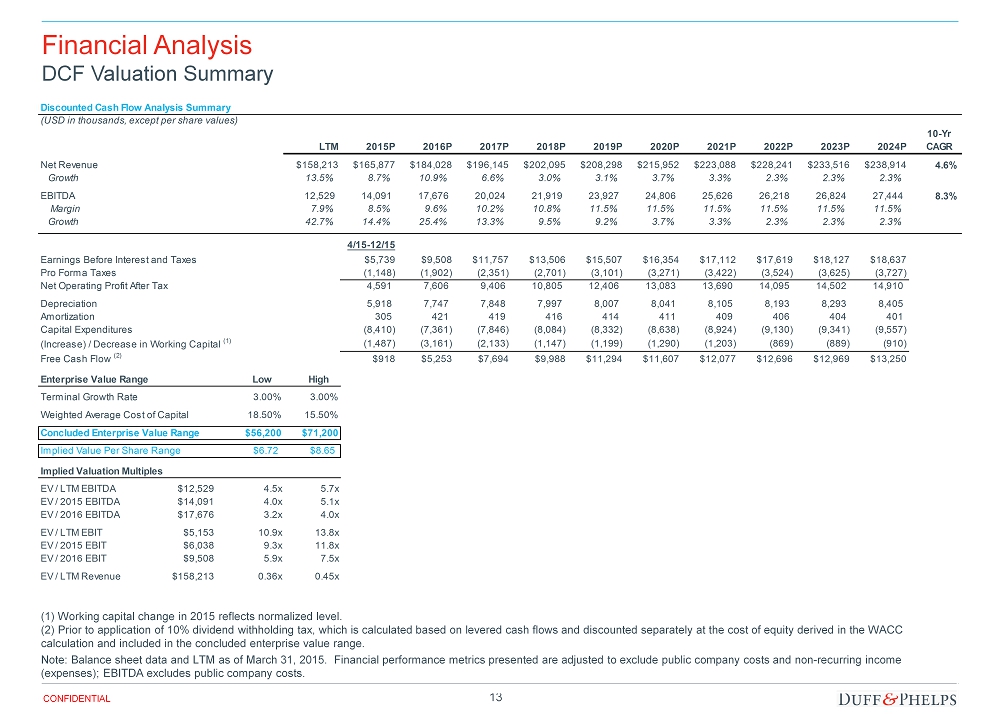
13 CONFIDENTIAL Financial Analysis DCF Valuation Summary (1) Working capital change in 2015 reflects normalized level. (2) Prior to application of 10% dividend withholding tax, which is calculated based on levered cash flows and discounted separately at the cost of equity derived in the WACC calculation and included in the concluded enterprise value range. Note: Balance sheet data and LTM as of March 31, 2015. Financial performance metrics presented are adjusted to exclude publi c c ompany costs and non - recurring income (expenses ); EBITDA excludes public company costs. Discounted Cash Flow Analysis Summary (USD in thousands, except per share values) 10-Yr LTM 2015P 2016P 2017P 2018P 2019P 2020P 2021P 2022P 2023P 2024P CAGR Net Revenue $158,213 $165,877 $184,028 $196,145 $202,095 $208,298 $215,952 $223,088 $228,241 $233,516 $238,914 4.6% Growth 13.5% 8.7% 10.9% 6.6% 3.0% 3.1% 3.7% 3.3% 2.3% 2.3% 2.3% EBITDA 12,529 14,091 17,676 20,024 21,919 23,927 24,806 25,626 26,218 26,824 27,444 8.3% Margin 7.9% 8.5% 9.6% 10.2% 10.8% 11.5% 11.5% 11.5% 11.5% 11.5% 11.5% Growth 42.7% 14.4% 25.4% 13.3% 9.5% 9.2% 3.7% 3.3% 2.3% 2.3% 2.3% 4/15-12/15 Earnings Before Interest and Taxes $5,739 $9,508 $11,757 $13,506 $15,507 $16,354 $17,112 $17,619 $18,127 $18,637 Pro Forma Taxes (1,148) (1,902) (2,351) (2,701) (3,101) (3,271) (3,422) (3,524) (3,625) (3,727) Net Operating Profit After Tax 4,591 7,606 9,406 10,805 12,406 13,083 13,690 14,095 14,502 14,910 Depreciation 5,918 7,747 7,848 7,997 8,007 8,041 8,105 8,193 8,293 8,405 Amortization 305 421 419 416 414 411 409 406 404 401 Capital Expenditures (8,410) (7,361) (7,846) (8,084) (8,332) (8,638) (8,924) (9,130) (9,341) (9,557) (Increase) / Decrease in Working Capital (1) (1,487) (3,161) (2,133) (1,147) (1,199) (1,290) (1,203) (869) (889) (910) Free Cash Flow (2) $918 $5,253 $7,694 $9,988 $11,294 $11,607 $12,077 $12,696 $12,969 $13,250 Enterprise Value Range Low High Terminal Growth Rate 3.00% 3.00% Weighted Average Cost of Capital 18.50% 15.50% Concluded Enterprise Value Range $56,200 $71,200 Implied Value Per Share Range $6.72 $8.65 Implied Valuation Multiples EV / LTM EBITDA $12,529 4.5x 5.7x EV / 2015 EBITDA $14,091 4.0x 5.1x EV / 2016 EBITDA $17,676 3.2x 4.0x EV / LTM EBIT $5,153 10.9x 13.8x EV / 2015 EBIT $6,038 9.3x 11.8x EV / 2016 EBIT $9,508 5.9x 7.5x EV / LTM Revenue $158,213 0.36x 0.45x
14 CONFIDENTIAL Financial Analysis Selected Public Companies / M&A Transactions Analysis Methodology Selected Public Companies Analysis • Duff & Phelps selected nineteen publicly traded companies in the paper and paper packaging industry that were deemed relevant to its analysis . • Duff & Phelps analyzed the financial performance of each of the selected publicly traded companies . Duff & Phelps then analyzed the selected public companies’ trading multiples of enterprise value to LTM revenue, enterprise value to LTM and projected EBITDA and EBIT, and price to LTM and projected earnings per share . Selected M&A Transactions Analysis • Duff & Phelps selected eight precedent transactions within China’s paper packaging and product and twenty - six precedent transactions within the global paper packaging and product that it determined to be relevant to its analysis . Duff & Phelps computed the LTM revenue and EBITDA for each of the target companies (where publicly disclosed) . Duff & Phelps then calculated the implied enterprise value to revenue and enterprise value to EBITDA multiples for each transaction . Duff & Phelps analyzed a number of factors in comparing the Company to the selected public companies and the targets in the selected M&A transactions, including historical and forecasted growth in revenue and EBITDA, EBITDA margins, capital spending levels, and other characteristics that we deemed relevant . Rather than applying the average or median multiple from the public company set, Duff & Phelps selected multiples that reflect the Company’s size, growth outlook, capital requirements, profit margins, revenue mix, and other characteristics relative to the group . None of the companies or the targets in the selected transactions utilized for comparative purposes in the following analysis are directly comparable to the Company . Duff & Phelps does not have access to non - public information of any of these companies . Accordingly, a complete valuation analysis cannot rely solely upon a quantitative review of such companies, and involves complex considerations and judgments concerning differences in financial and operating characteristics of such companies, as well as other factors that could affect their value relative to that of the Company . Therefore, the Selected Public Companies / M&A Transactions Analysis is necessarily subject to limitations .
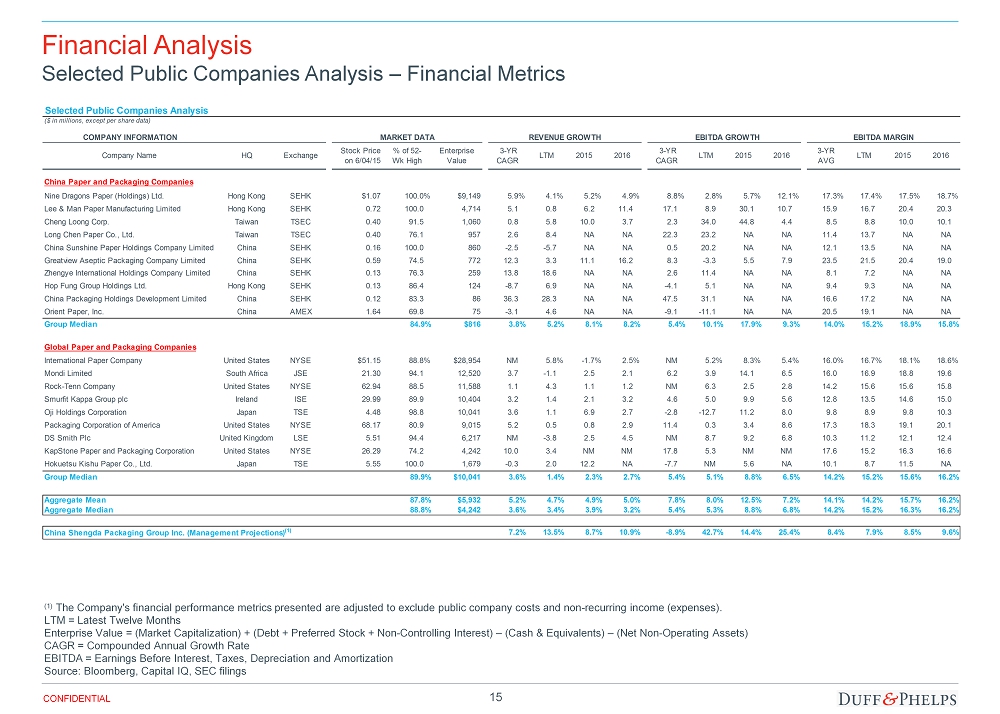
15 CONFIDENTIAL Financial Analysis Selected Public Companies Analysis – Financial Metrics (1) The Company's financial performance metrics presented are adjusted to exclude public company costs and non - recurring income (expense s ). LTM = Latest Twelve Months Enterprise Value = (Market Capitalization) + (Debt + Preferred Stock + Non - Controlling Interest) – (Cash & Equivalents) – (Net N on - Operating Assets) CAGR = Compounded Annual Growth Rate EBITDA = Earnings Before Interest, Taxes, Depreciation and Amortization Source: Bloomberg, Capital IQ, SEC filings Selected Public Companies Analysis ($ in millions, except per share data) COMPANY INFORMATION MARKET DATA REVENUE GROWTH EBITDA GROWTH EBITDA MARGIN Company Name HQ Exchange Stock Price on 6/04/15 % of 52- Wk High Enterprise Value 3-YR CAGR LTM 2015 2016 3-YR CAGR LTM 2015 2016 3-YR AVG LTM 2015 2016 China Paper and Packaging Companies Nine Dragons Paper (Holdings) Ltd. Hong Kong SEHK $1.07 100.0% $9,149 5.9% 4.1% 5.2% 4.9% 8.8% 2.8% 5.7% 12.1% 17.3% 17.4% 17.5% 18.7% Lee & Man Paper Manufacturing Limited Hong Kong SEHK 0.72 100.0 4,714 5.1 0.8 6.2 11.4 17.1 8.9 30.1 10.7 15.9 16.7 20.4 20.3 Cheng Loong Corp. Taiwan TSEC 0.40 91.5 1,060 0.8 5.8 10.0 3.7 2.3 34.0 44.8 4.4 8.5 8.8 10.0 10.1 Long Chen Paper Co., Ltd. Taiwan TSEC 0.40 76.1 957 2.6 8.4 NA NA 22.3 23.2 NA NA 11.4 13.7 NA NA China Sunshine Paper Holdings Company Limited China SEHK 0.16 100.0 860 -2.5 -5.7 NA NA 0.5 20.2 NA NA 12.1 13.5 NA NA Greatview Aseptic Packaging Company Limited China SEHK 0.59 74.5 772 12.3 3.3 11.1 16.2 8.3 -3.3 5.5 7.9 23.5 21.5 20.4 19.0 Zhengye International Holdings Company Limited China SEHK 0.13 76.3 259 13.8 18.6 NA NA 2.6 11.4 NA NA 8.1 7.2 NA NA Hop Fung Group Holdings Ltd. Hong Kong SEHK 0.13 86.4 124 -8.7 6.9 NA NA -4.1 5.1 NA NA 9.4 9.3 NA NA China Packaging Holdings Development Limited China SEHK 0.12 83.3 86 36.3 28.3 NA NA 47.5 31.1 NA NA 16.6 17.2 NA NA Orient Paper, Inc. China AMEX 1.64 69.8 75 -3.1 4.6 NA NA -9.1 -11.1 NA NA 20.5 19.1 NA NA Group Median 84.9% $816 3.8% 5.2% 8.1% 8.2% 5.4% 10.1% 17.9% 9.3% 14.0% 15.2% 18.9% 15.8% Global Paper and Packaging Companies International Paper Company United States NYSE $51.15 88.8% $28,954 NM 5.8% -1.7% 2.5% NM 5.2% 8.3% 5.4% 16.0% 16.7% 18.1% 18.6% Mondi Limited South Africa JSE 21.30 94.1 12,520 3.7 -1.1 2.5 2.1 6.2 3.9 14.1 6.5 16.0 16.9 18.8 19.6 Rock-Tenn Company United States NYSE 62.94 88.5 11,588 1.1 4.3 1.1 1.2 NM 6.3 2.5 2.8 14.2 15.6 15.6 15.8 Smurfit Kappa Group plc Ireland ISE 29.99 89.9 10,404 3.2 1.4 2.1 3.2 4.6 5.0 9.9 5.6 12.8 13.5 14.6 15.0 Oji Holdings Corporation Japan TSE 4.48 98.8 10,041 3.6 1.1 6.9 2.7 -2.8 -12.7 11.2 8.0 9.8 8.9 9.8 10.3 Packaging Corporation of America United States NYSE 68.17 80.9 9,015 5.2 0.5 0.8 2.9 11.4 0.3 3.4 8.6 17.3 18.3 19.1 20.1 DS Smith Plc United Kingdom LSE 5.51 94.4 6,217 NM -3.8 2.5 4.5 NM 8.7 9.2 6.8 10.3 11.2 12.1 12.4 KapStone Paper and Packaging Corporation United States NYSE 26.29 74.2 4,242 10.0 3.4 NM NM 17.8 5.3 NM NM 17.6 15.2 16.3 16.6 Hokuetsu Kishu Paper Co., Ltd. Japan TSE 5.55 100.0 1,679 -0.3 2.0 12.2 NA -7.7 NM 5.6 NA 10.1 8.7 11.5 NA Group Median 89.9% $10,041 3.6% 1.4% 2.3% 2.7% 5.4% 5.1% 8.8% 6.5% 14.2% 15.2% 15.6% 16.2% Aggregate Mean 87.8% $5,932 5.2% 4.7% 4.9% 5.0% 7.8% 8.0% 12.5% 7.2% 14.1% 14.2% 15.7% 16.2% Aggregate Median 88.8% $4,242 3.6% 3.4% 3.9% 3.2% 5.4% 5.3% 8.8% 6.8% 14.2% 15.2% 16.3% 16.2% China Shengda Packaging Group Inc. (Management Projections) (1) 7.2% 13.5% 8.7% 10.9% -8.9% 42.7% 14.4% 25.4% 8.4% 7.9% 8.5% 9.6%
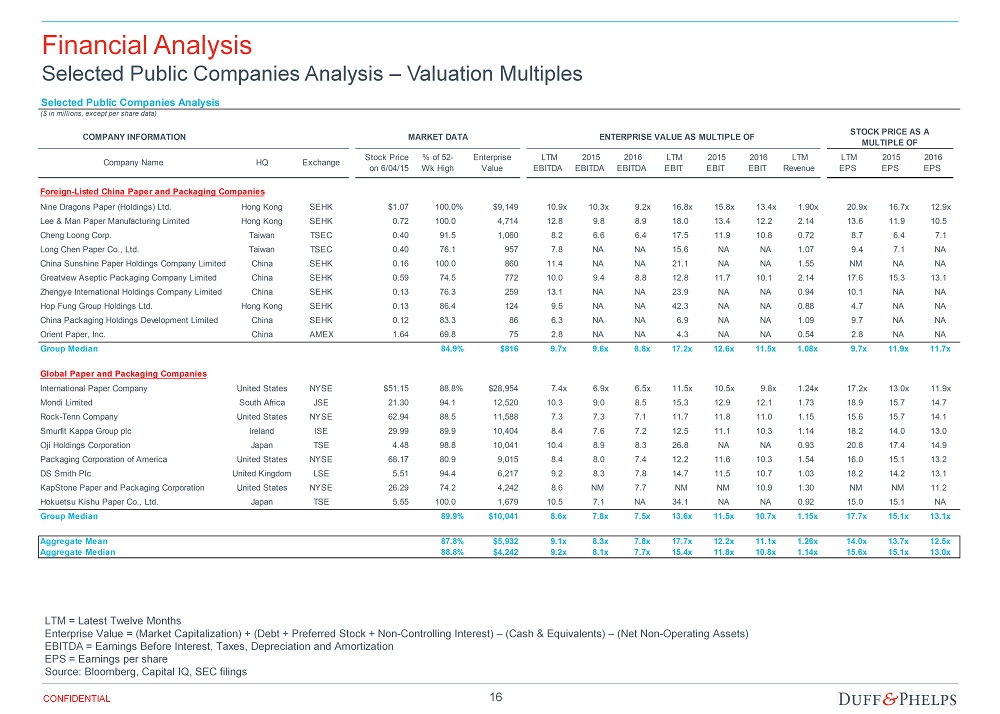
16 CONFIDENTIAL Financial Analysis Selected Public Companies Analysis – Valuation Multiples LTM = Latest Twelve Months Enterprise Value = (Market Capitalization) + (Debt + Preferred Stock + Non - Controlling Interest) – (Cash & Equivalents) – (Net N on - Operating Assets) EBITDA = Earnings Before Interest, Taxes, Depreciation and Amortization EPS = Earnings per share Source : Bloomberg, Capital IQ, SEC filings Selected Public Companies Analysis ($ in millions, except per share data) COMPANY INFORMATION MARKET DATA ENTERPRISE VALUE AS MULTIPLE OF STOCK PRICE AS A MULTIPLE OF Company Name HQ Exchange Stock Price on 6/04/15 % of 52- Wk High Enterprise Value LTM EBITDA 2015 EBITDA 2016 EBITDA LTM EBIT 2015 EBIT 2016 EBIT LTM Revenue LTM EPS 2015 EPS 2016 EPS Foreign-Listed China Paper and Packaging Companies Nine Dragons Paper (Holdings) Ltd. Hong Kong SEHK $1.07 100.0% $9,149 10.9x 10.3x 9.2x 16.8x 15.8x 13.4x 1.90x 20.9x 16.7x 12.9x Lee & Man Paper Manufacturing Limited Hong Kong SEHK 0.72 100.0 4,714 12.8 9.8 8.9 18.0 13.4 12.2 2.14 13.6 11.9 10.5 Cheng Loong Corp. Taiwan TSEC 0.40 91.5 1,060 8.2 6.6 6.4 17.5 11.9 10.8 0.72 8.7 6.4 7.1 Long Chen Paper Co., Ltd. Taiwan TSEC 0.40 76.1 957 7.8 NA NA 15.6 NA NA 1.07 9.4 7.1 NA China Sunshine Paper Holdings Company Limited China SEHK 0.16 100.0 860 11.4 NA NA 21.1 NA NA 1.55 NM NA NA Greatview Aseptic Packaging Company Limited China SEHK 0.59 74.5 772 10.0 9.4 8.8 12.8 11.7 10.1 2.14 17.6 15.3 13.1 Zhengye International Holdings Company Limited China SEHK 0.13 76.3 259 13.1 NA NA 23.9 NA NA 0.94 10.1 NA NA Hop Fung Group Holdings Ltd. Hong Kong SEHK 0.13 86.4 124 9.5 NA NA 42.3 NA NA 0.88 4.7 NA NA China Packaging Holdings Development Limited China SEHK 0.12 83.3 86 6.3 NA NA 6.9 NA NA 1.09 9.7 NA NA Orient Paper, Inc. China AMEX 1.64 69.8 75 2.8 NA NA 4.3 NA NA 0.54 2.8 NA NA Group Median 84.9% $816 9.7x 9.6x 8.8x 17.2x 12.6x 11.5x 1.08x 9.7x 11.9x 11.7x Global Paper and Packaging Companies International Paper Company United States NYSE $51.15 88.8% $28,954 7.4x 6.9x 6.5x 11.5x 10.5x 9.8x 1.24x 17.2x 13.0x 11.9x Mondi Limited South Africa JSE 21.30 94.1 12,520 10.3 9.0 8.5 15.3 12.9 12.1 1.73 18.9 15.7 14.7 Rock-Tenn Company United States NYSE 62.94 88.5 11,588 7.3 7.3 7.1 11.7 11.8 11.0 1.15 15.6 15.7 14.1 Smurfit Kappa Group plc Ireland ISE 29.99 89.9 10,404 8.4 7.6 7.2 12.5 11.1 10.3 1.14 18.2 14.0 13.0 Oji Holdings Corporation Japan TSE 4.48 98.8 10,041 10.4 8.9 8.3 26.8 NA NA 0.93 20.8 17.4 14.9 Packaging Corporation of America United States NYSE 68.17 80.9 9,015 8.4 8.0 7.4 12.2 11.6 10.3 1.54 16.0 15.1 13.2 DS Smith Plc United Kingdom LSE 5.51 94.4 6,217 9.2 8.3 7.8 14.7 11.5 10.7 1.03 18.2 14.2 13.1 KapStone Paper and Packaging Corporation United States NYSE 26.29 74.2 4,242 8.6 NM 7.7 NM NM 10.9 1.30 NM NM 11.2 Hokuetsu Kishu Paper Co., Ltd. Japan TSE 5.55 100.0 1,679 10.5 7.1 NA 34.1 NA NA 0.92 15.0 15.1 NA Group Median 89.9% $10,041 8.6x 7.8x 7.5x 13.6x 11.5x 10.7x 1.15x 17.7x 15.1x 13.1x Aggregate Mean 87.8% $5,932 9.1x 8.3x 7.8x 17.7x 12.2x 11.1x 1.26x 14.0x 13.7x 12.5x Aggregate Median 88.8% $4,242 9.2x 8.1x 7.7x 15.4x 11.8x 10.8x 1.14x 15.6x 15.1x 13.0x
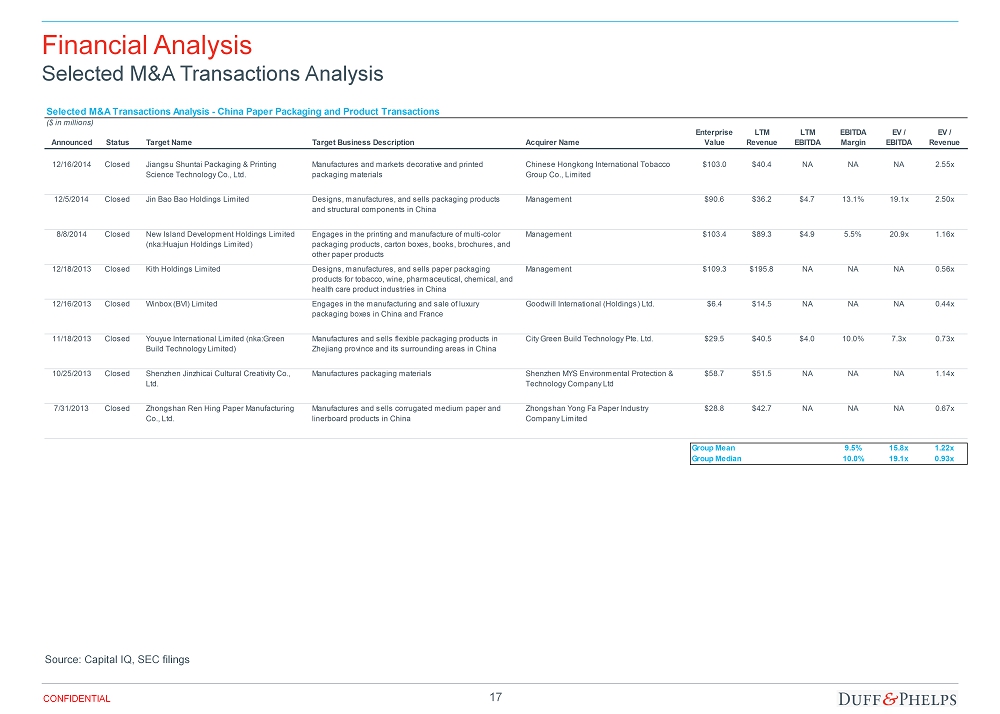
17 CONFIDENTIAL Financial Analysis Selected M&A Transactions Analysis Source: Capital IQ, SEC filings Selected M&A Transactions Analysis - China Paper Packaging and Product Transactions ($ in millions) Announced Status Target Name Target Business Description Acquirer Name Enterprise Value LTM Revenue LTM EBITDA EBITDA Margin EV / EBITDA EV / Revenue 12/16/2014 Closed Jiangsu Shuntai Packaging & Printing Science Technology Co., Ltd. Manufactures and markets decorative and printed packaging materials Chinese Hongkong International Tobacco Group Co., Limited $103.0 $40.4 NA NA NA 2.55x 12/5/2014 Closed Jin Bao Bao Holdings Limited Designs, manufactures, and sells packaging products and structural components in China Management $90.6 $36.2 $4.7 13.1% 19.1x 2.50x 8/8/2014 Closed New Island Development Holdings Limited (nka:Huajun Holdings Limited) Engages in the printing and manufacture of multi-color packaging products, carton boxes, books, brochures, and other paper products Management $103.4 $89.3 $4.9 5.5% 20.9x 1.16x 12/18/2013 Closed Kith Holdings Limited Designs, manufactures, and sells paper packaging products for tobacco, wine, pharmaceutical, chemical, and health care product industries in China Management $109.3 $195.8 NA NA NA 0.56x 12/16/2013 Closed Winbox (BVI) Limited Engages in the manufacturing and sale of luxury packaging boxes in China and France Goodwill International (Holdings) Ltd. $6.4 $14.5 NA NA NA 0.44x 11/18/2013 Closed Youyue International Limited (nka:Green Build Technology Limited) Manufactures and sells flexible packaging products in Zhejiang province and its surrounding areas in China City Green Build Technology Pte. Ltd. $29.5 $40.5 $4.0 10.0% 7.3x 0.73x 10/25/2013 Closed Shenzhen Jinzhicai Cultural Creativity Co., Ltd. Manufactures packaging materials Shenzhen MYS Environmental Protection & Technology Company Ltd $58.7 $51.5 NA NA NA 1.14x 7/31/2013 Closed Zhongshan Ren Hing Paper Manufacturing Co., Ltd. Manufactures and sells corrugated medium paper and linerboard products in China Zhongshan Yong Fa Paper Industry Company Limited $28.8 $42.7 NA NA NA 0.67x Group Mean 9.5% 15.8x 1.22x Group Median 10.0% 19.1x 0.93x
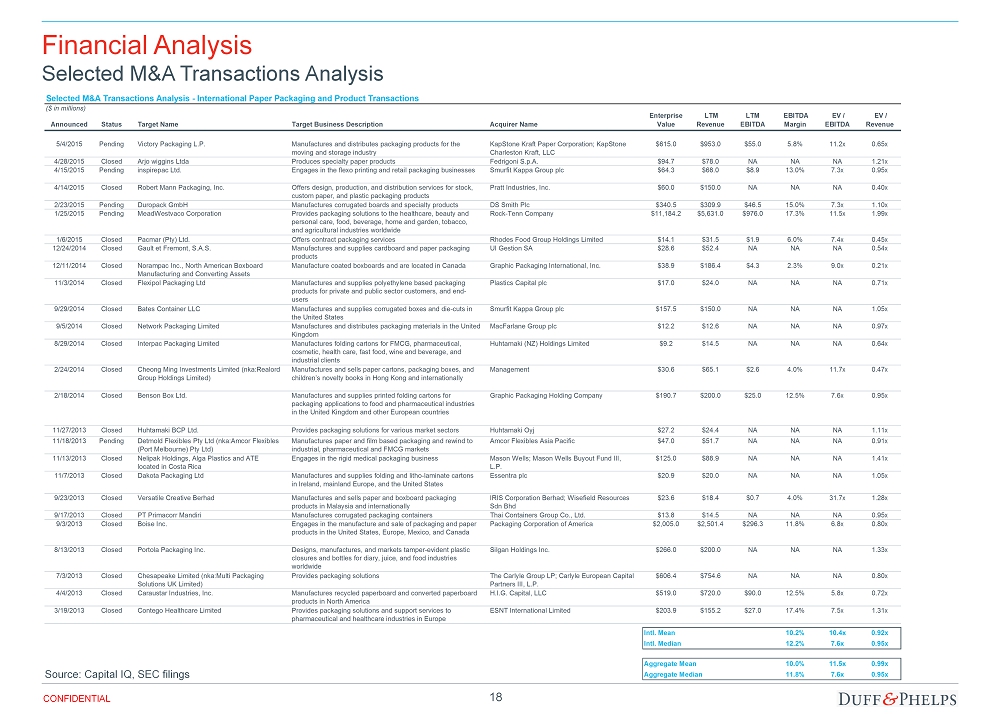
18 CONFIDENTIAL Financial Analysis Selected M&A Transactions Analysis Source: Capital IQ, SEC filings Selected M&A Transactions Analysis - International Paper Packaging and Product Transactions ($ in millions) Announced Status Target Name Target Business Description Acquirer Name Enterprise Value LTM Revenue LTM EBITDA EBITDA Margin EV / EBITDA EV / Revenue 5/4/2015 Pending Victory Packaging L.P. Manufactures and distributes packaging products for the moving and storage industry KapStone Kraft Paper Corporation; KapStone Charleston Kraft, LLC $615.0 $953.0 $55.0 5.8% 11.2x 0.65x 4/28/2015 Closed Arjo wiggins Ltda Produces specialty paper products Fedrigoni S.p.A. $94.7 $78.0 NA NA NA 1.21x 4/15/2015 Pending inspirepac Ltd. Engages in the flexo printing and retail packaging businesses Smurfit Kappa Group plc $64.3 $68.0 $8.9 13.0% 7.3x 0.95x 4/14/2015 Closed Robert Mann Packaging, Inc. Offers design, production, and distribution services for stock, custom paper, and plastic packaging products Pratt Industries, Inc. $60.0 $150.0 NA NA NA 0.40x 2/23/2015 Pending Duropack GmbH Manufactures corrugated boards and specialty products DS Smith Plc $340.5 $309.9 $46.5 15.0% 7.3x 1.10x 1/25/2015 Pending MeadWestvaco Corporation Provides packaging solutions to the healthcare, beauty and personal care, food, beverage, home and garden, tobacco, and agricultural industries worldwide Rock-Tenn Company $11,184.2 $5,631.0 $976.0 17.3% 11.5x 1.99x 1/6/2015 Closed Pacmar (Pty) Ltd. Offers contract packaging services Rhodes Food Group Holdings Limited $14.1 $31.5 $1.9 6.0% 7.4x 0.45x 12/24/2014 Closed Gault et Fremont, S.A.S. Manufactures and supplies cardboard and paper packaging products UI Gestion SA $28.6 $52.4 NA NA NA 0.54x 12/11/2014 Closed Norampac Inc., North American Boxboard Manufacturing and Converting Assets Manufacture coated boxboards and are located in Canada Graphic Packaging International, Inc. $38.9 $186.4 $4.3 2.3% 9.0x 0.21x 11/3/2014 Closed Flexipol Packaging Ltd Manufactures and supplies polyethylene based packaging products for private and public sector customers, and end- users Plastics Capital plc $17.0 $24.0 NA NA NA 0.71x 9/29/2014 Closed Bates Container LLC Manufactures and supplies corrugated boxes and die-cuts in the United States Smurfit Kappa Group plc $157.5 $150.0 NA NA NA 1.05x 9/5/2014 Closed Network Packaging Limited Manufactures and distributes packaging materials in the United Kingdom MacFarlane Group plc $12.2 $12.6 NA NA NA 0.97x 8/29/2014 Closed Interpac Packaging Limited Manufactures folding cartons for FMCG, pharmaceutical, cosmetic, health care, fast food, wine and beverage, and industrial clients Huhtamaki (NZ) Holdings Limited $9.2 $14.5 NA NA NA 0.64x 2/24/2014 Closed Cheong Ming Investments Limited (nka:Realord Group Holdings Limited) Manufactures and sells paper cartons, packaging boxes, and children’s novelty books in Hong Kong and internationally Management $30.6 $65.1 $2.6 4.0% 11.7x 0.47x 2/18/2014 Closed Benson Box Ltd. Manufactures and supplies printed folding cartons for packaging applications to food and pharmaceutical industries in the United Kingdom and other European countries Graphic Packaging Holding Company $190.7 $200.0 $25.0 12.5% 7.6x 0.95x 11/27/2013 Closed Huhtamaki BCP Ltd. Provides packaging solutions for various market sectors Huhtamaki Oyj $27.2 $24.4 NA NA NA 1.11x 11/18/2013 Pending Detmold Flexibles Pty Ltd (nka:Amcor Flexibles (Port Melbourne) Pty Ltd) Manufactures paper and film based packaging and rewind to industrial, pharmaceutical and FMCG markets Amcor Flexibles Asia Pacific $47.0 $51.7 NA NA NA 0.91x 11/13/2013 Closed Nelipak Holdings, Alga Plastics and ATE located in Costa Rica Engages in the rigid medical packaging business Mason Wells; Mason Wells Buyout Fund III, L.P. $125.0 $88.9 NA NA NA 1.41x 11/7/2013 Closed Dakota Packaging Ltd Manufactures and supplies folding and litho-laminate cartons in Ireland, mainland Europe, and the United States Essentra plc $20.9 $20.0 NA NA NA 1.05x 9/23/2013 Closed Versatile Creative Berhad Manufactures and sells paper and boxboard packaging products in Malaysia and internationally IRIS Corporation Berhad; Wisefield Resources Sdn Bhd $23.6 $18.4 $0.7 4.0% 31.7x 1.28x 9/17/2013 Closed PT Primacorr Mandiri Manufactures corrugated packaging containers Thai Containers Group Co., Ltd. $13.8 $14.5 NA NA NA 0.95x 9/3/2013 Closed Boise Inc. Engages in the manufacture and sale of packaging and paper products in the United States, Europe, Mexico, and Canada Packaging Corporation of America $2,005.0 $2,501.4 $296.3 11.8% 6.8x 0.80x 8/13/2013 Closed Portola Packaging Inc. Designs, manufactures, and markets tamper-evident plastic closures and bottles for diary, juice, and food industries worldwide Silgan Holdings Inc. $266.0 $200.0 NA NA NA 1.33x 7/3/2013 Closed Chesapeake Limited (nka:Multi Packaging Solutions UK Limited) Provides packaging solutions The Carlyle Group LP; Carlyle European Capital Partners III, L.P. $606.4 $754.6 NA NA NA 0.80x 4/4/2013 Closed Caraustar Industries, Inc. Manufactures recycled paperboard and converted paperboard products in North America H.I.G. Capital, LLC $519.0 $720.0 $90.0 12.5% 5.8x 0.72x 3/19/2013 Closed Contego Healthcare Limited Provides packaging solutions and support services to pharmaceutical and healthcare industries in Europe ESNT International Limited $203.9 $155.2 $27.0 17.4% 7.5x 1.31x Intl. Mean 10.2% 10.4x 0.92x Intl. Median 12.2% 7.6x 0.95x Aggregate Mean 10.0% 11.5x 0.99x Aggregate Median 11.8% 7.6x 0.95x
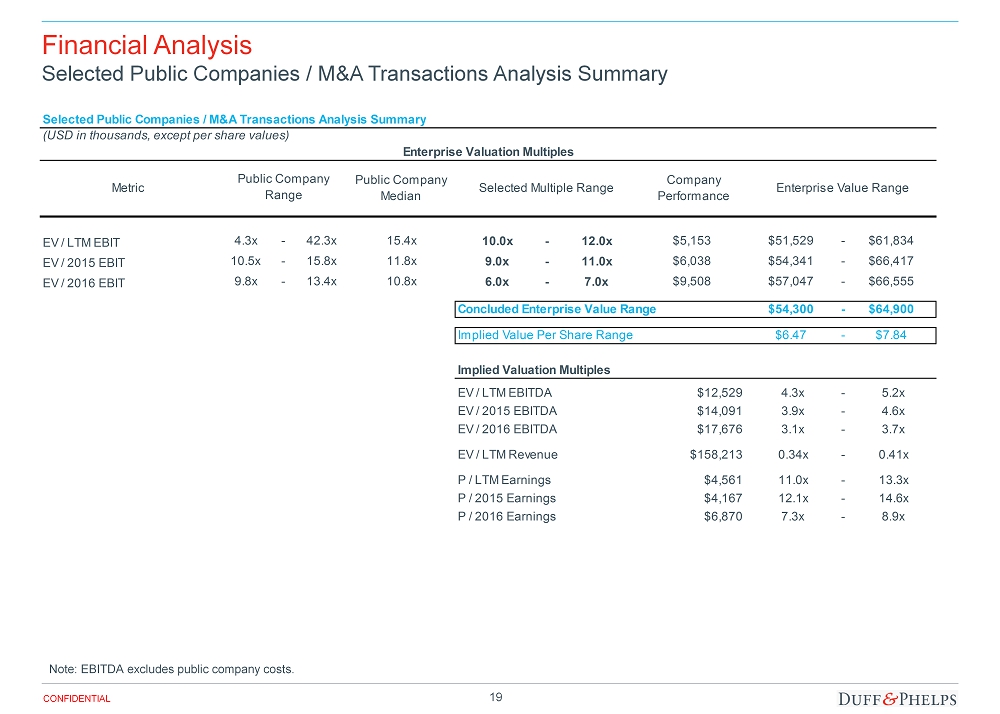
19 CONFIDENTIAL Financial Analysis Selected Public Companies / M&A Transactions Analysis Summary Note: EBITDA excludes public company costs. Selected Public Companies / M&A Transactions Analysis Summary (USD in thousands, except per share values) Enterprise Valuation Multiples Metric Public Company Median Selected Multiple Range Company Performance Enterprise Value Range EV / LTM EBIT 4.3x - 42.3x 15.4x 10.0x - 12.0x $5,153 $51,529 - $61,834 EV / 2015 EBIT 10.5x - 15.8x 11.8x 9.0x - 11.0x $6,038 $54,341 - $66,417 EV / 2016 EBIT 9.8x - 13.4x 10.8x 6.0x - 7.0x $9,508 $57,047 - $66,555 Concluded Enterprise Value Range $54,300 - $64,900 Implied Value Per Share Range $6.47 - $7.84 Implied Valuation Multiples EV / LTM EBITDA $12,529 4.3x - 5.2x EV / 2015 EBITDA $14,091 3.9x - 4.6x EV / 2016 EBITDA $17,676 3.1x - 3.7x EV / LTM Revenue $158,213 0.34x - 0.41x P / LTM Earnings $4,561 11.0x - 13.3x P / 2015 Earnings $4,167 12.1x - 14.6x P / 2016 Earnings $6,870 7.3x - 8.9x Public Company Range
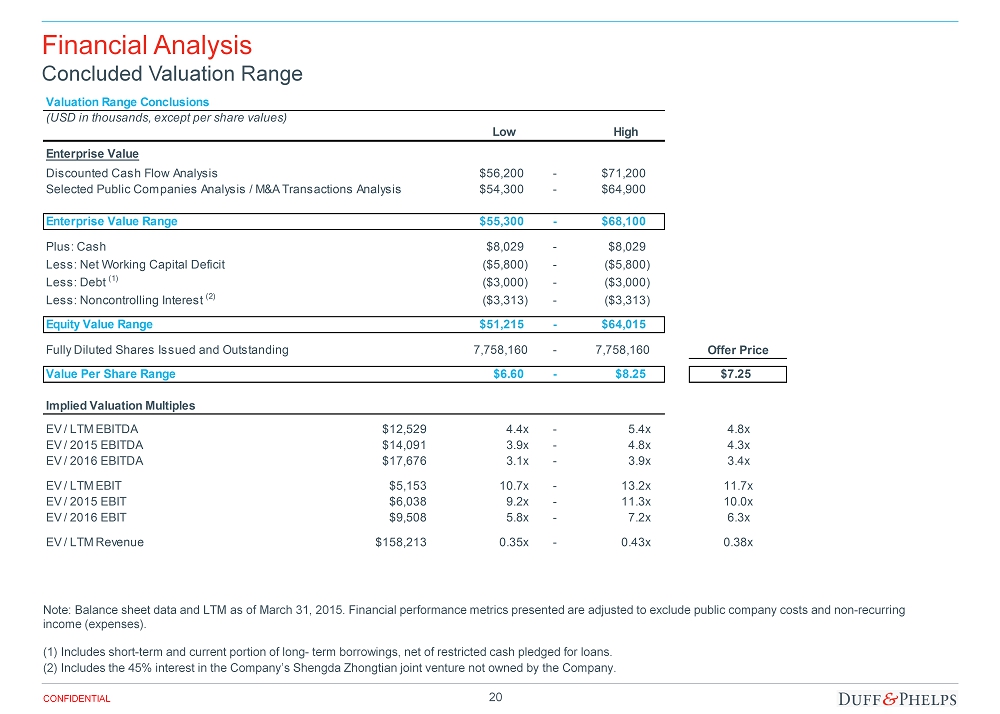
20 CONFIDENTIAL Financial Analysis Concluded Valuation Range Note: Balance sheet data and LTM as of March 31, 2015. Financial performance metrics presented are adjusted to exclude public co mpany costs and non - recurring income (expenses). (1) Includes short - term and current portion of long - term borrowings, net of restricted cash pledged for loans. (2) Includes the 45% interest in the Company’s Shengda Zhongtian joint venture not owned by the Company. Valuation Range Conclusions (USD in thousands, except per share values) Low High Enterprise Value Discounted Cash Flow Analysis $56,200 - $71,200 Selected Public Companies Analysis / M&A Transactions Analysis $54,300 - $64,900 Enterprise Value Range $55,300 - $68,100 Plus: Cash $8,029 - $8,029 Less: Net Working Capital Deficit ($5,800) - ($5,800) Less: Debt (1) ($3,000) - ($3,000) Less: Noncontrolling Interest (2) ($3,313) - ($3,313) Equity Value Range $51,215 - $64,015 Fully Diluted Shares Issued and Outstanding 7,758,160 - 7,758,160 Offer Price Value Per Share Range $6.60 - $8.25 $7.25 Implied Valuation Multiples EV / LTM EBITDA $12,529 4.4x - 5.4x 4.8x EV / 2015 EBITDA $14,091 3.9x - 4.8x 4.3x EV / 2016 EBITDA $17,676 3.1x - 3.9x 3.4x EV / LTM EBIT $5,153 10.7x - 13.2x 11.7x EV / 2015 EBIT $6,038 9.2x - 11.3x 10.0x EV / 2016 EBIT $9,508 5.8x - 7.2x 6.3x EV / LTM Revenue $158,213 0.35x - 0.43x 0.38x
Assumptions, Qualifications, and Limiting Conditions Appendix 01
22 CONFIDENTIAL Assumptions, Qualifications, and Limiting Conditions Assumptions and Reliance – In preparing this Financial Analysis, Duff & Phelps, with Parent’s consent : • Relied upon the accuracy, completeness, and fair presentation of all information, data, advice, opinions and representations obtaine d f rom public sources or provided to it from private sources, including Company management, and did not independently verify such information; • Relied upon the fact that Parent has been advised by counsel as to all legal matters with respect to the Transaction , including whether all procedures required by law to be taken in connection with the Transaction have been duly, validly and timely taken; • Assumed that any estimates, evaluations, forecasts and projections furnished to Duff & Phelps were reasonably prepared and based upon th e best currently available information and good faith judgment of the person furnishing the same; • Assumed that information supplied and representations made by Company management are substantially accurate regarding the Company and th e Transaction ; • Assumed that the final versions of all documents reviewed by Duff & Phelps in draft form conform in all material respects to the draf ts reviewed ; and • Assumed that there has been no material change in the assets, financial condition, business, or prospects of the Company since the da te of the most recent financial statements and other information made available to Duff & Phelps. To the extent that any of the foregoing assumptions or any of the facts on which this Financial Analysis is based prove to be untrue in any material respect, this Financial Analysis cannot and should not be relied upon by Parent . Furthermore, in connection with the preparation of this Financial Analysis, Duff & Phelps has made numerous assumptions with respect to industry performance, general business, market and economic conditions and other matters, many of which are beyond the control of any party involved in the Transaction .
23 CONFIDENTIAL Assumptions, Qualifications, and Limiting Conditions Qualifications – This Financial Analysis is qualified by the following: • Duff & Phelps has prepared this Financial Analysis effective as of the date hereof . This Financial Analysis is necessarily based upon market, economic, financial and other conditions as they exist and can be evaluated as of the date hereof , and Duff & Phelps disclaims any undertaking or obligation to advise any person of any change in any fact or matter affecting this Financial Analysis which may come or be brought to the attention of Duff & Phelps after the date hereof . • Duff & Phelps did not evaluate the Company’s solvency or conduct an independent appraisal or physical inspection of any specific assets or liabilities (contingent or otherwise ) . • This Financial Analysis should not be construed as a fairness opinion, valuation opinion, credit rating, solvency opinion, an analysis of CPGI’s credit worthiness, as tax advice, or as accounting advice . Duff & Phelps has not made, and assumes no responsibility to make, any representation, warranty, assurance, undertaking (express or implied) ; or render any opinion, as to : ( i ) any legal matter ; or (ii) the adequacy, accuracy, completeness or reasonableness of this Financial Analysis . Duff & Phelps expressly disclaims all and any such responsibility or liability . • In providing this Financial Analysis, Duff & Phelps is not expressing any opinion with respect to the amount or nature of any compensation to any of the Company’s officers, directors, or employees, or any class of such persons, relative to the consideration to be received by the public shareholders of the Company in the Transaction, or with respect to the fairness of any such compensation . In addition, this Financial Analysis does not address the fairness of any consideration payable in the Transaction to the holders of any class of securities, creditors or other constituencies of the Company .
24 CONFIDENTIAL Assumptions, Qualifications, and Limiting Conditions Limiting Conditions – The use of this Financial Analysis is strictly limited: • This Financial Analysis is furnished solely for the use and benefit of Parent in connection with its consideration of the Transaction and is not intended to, and does not, confer any rights or remedies upon any other person, and is not intended to be used, and may not be used, by any other person or for any other purpose, without Duff & Phelps’ express consent . • This Financial Analysis ( i) does not address the merits of the underlying business decision to enter into the Transaction versus any alternative strategy or transaction ; (ii) does not address any transaction related to the Transaction ; (iii) is not a recommendation as to how Parent, the Company, the Board of Directors, or any stockholder should vote or act with respect to any matters relating to the Transaction , or whether to proceed with the Transaction or any related transaction, and (iv) does not indicate that the consideration to be received by stockholders of the Company is the best possibly attainable under any circumstances . The decision as to whether to proceed with the Transaction or any related transaction may depend on an assessment of factors unrelated to this Financial Analysis . • This Financial Analysis should not be construed as creating any fiduciary duty on the part of Duff & Phelps to any party . • Duff & Phelps’ liability in connection with this Financial Analysis shall be limited in accordance with the terms set forth in the engagement letter between Duff & Phelps and Parent dated May 18 , 2015 (the “ Engagement Letter ”) . • This Financial Analysis is confidential, and its use and disclosure is strictly limited in accordance with the terms set forth in the Engagement Letter .
Summary of Premiums Paid Appendix 02
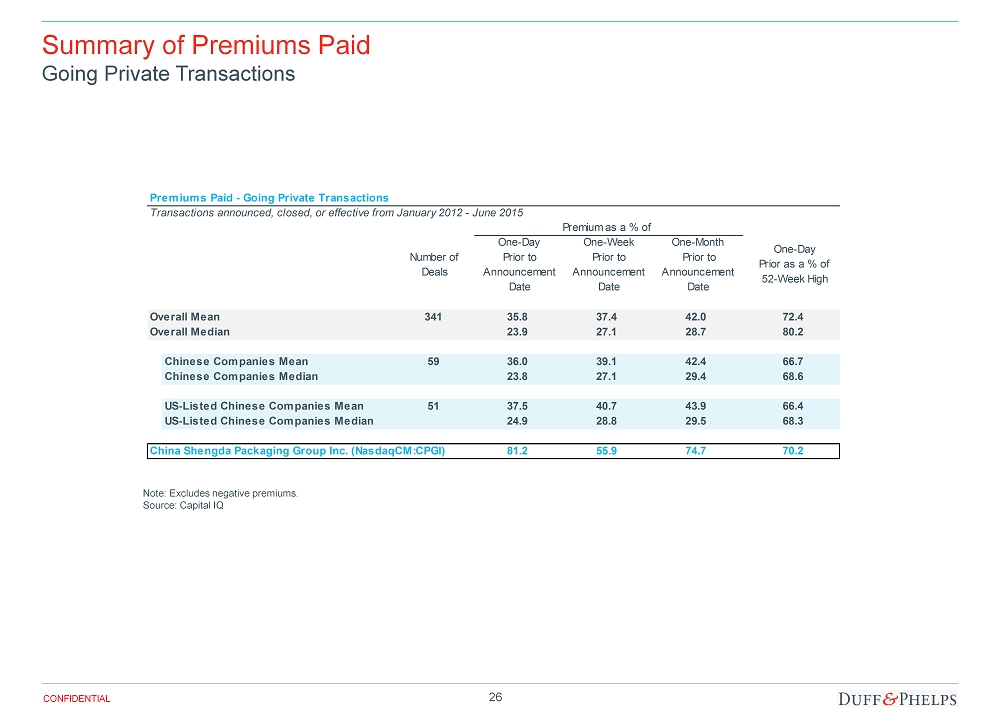
26 CONFIDENTIAL Summary of Premiums Paid Going Private Transactions Note: Excludes negative premiums . Source: Capital IQ Premiums Paid - Going Private Transactions Transactions announced, closed, or effective from January 2012 - June 2015 Premium as a % of Number of Deals One-Day Prior to Announcement Date One-Week Prior to Announcement Date One-Month Prior to Announcement Date One-Day Prior as a % of 52-Week High Overall Mean 341 35.8 37.4 42.0 72.4 Overall Median 23.9 27.1 28.7 80.2 Chinese Companies Mean 59 36.0 39.1 42.4 66.7 Chinese Companies Median 23.8 27.1 29.4 68.6 US-Listed Chinese Companies Mean 51 37.5 40.7 43.9 66.4 US-Listed Chinese Companies Median 24.9 28.8 29.5 68.3 China Shengda Packaging Group Inc. (NasdaqCM:CPGI) 81.2 55.9 74.7 70.2