American Realty Capital Properties Company Overview February 2013 February 2013

Introductory Notes The data and other information described in these slides are of the date of the slides or an earlier date as indicated. Future performance may not be consistent with past performance and is subject to change and inherent risks and uncertainties. This presentation contains certain statements beliefs, expectations, or projections of the future and might be considered to be forward-looking statements under Federal Securities laws. Prospective investors are cautioned that any such forward-looking statements are not guarantees of future performance, and results may differ significantly from the matters discussed in these forward-looking statements, and we may not release revisions to these forward-looking statements to reflect statements. Factors and risks that could cause actual results to differ materially from expectations are disclosed from time to time in greater detail Commission (the "SEC") including, but -K, the Company'snot Quarterly Report on Form 10-Q filed with the SEC, as well as Company press releases.2
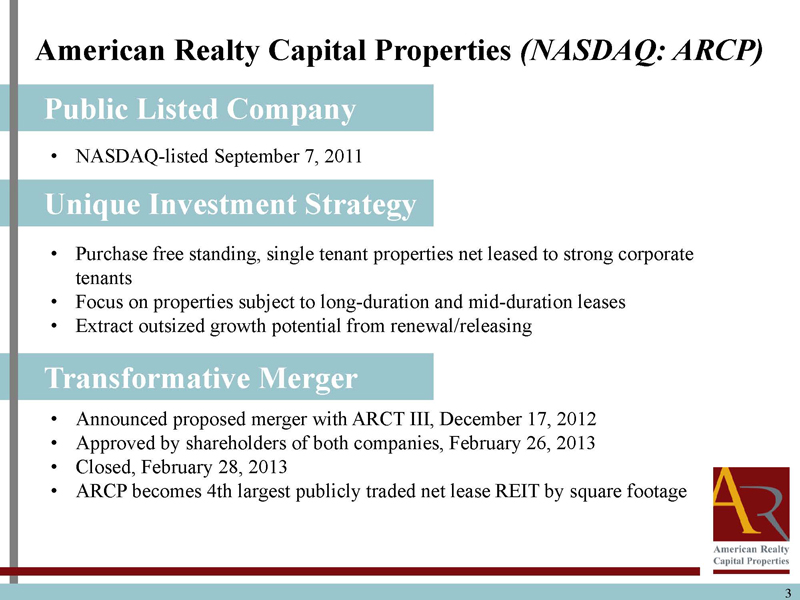
American Realty Capital Properties (NASDAQ: ARCP) Public Listed Company NASDAQ-listed September 7, 2011 Unique Investment Strategy Purchase free standing, single tenant properties net leased to strong corporate tenants Focus on properties subject to long-duration and mid-duration leases Extract outsized growth potential from renewal/releasing Transformative Merger Announced proposed merger with ARCT III, December 17, 2012 Approved by shareholders of both companies, February 26, 2013 Closed, February 28, 2013 ARCP becomes 4th largest publicly traded net lease REIT by square footage 3
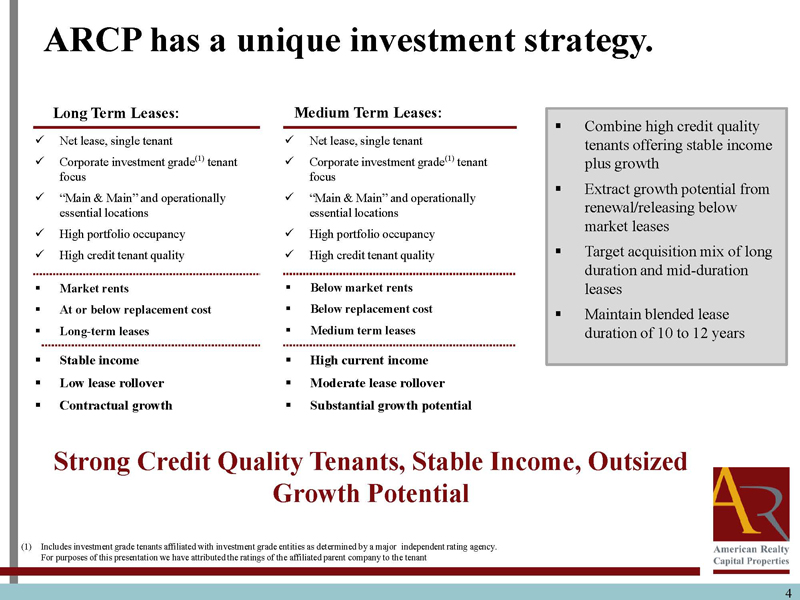
ARCP has a unique investment strategy. Long Term Leases: Medium Term Leases: Combine high credit quality Net lease, single tenant Net lease, single tenant tenants offering stable income Corporate investment grade(1) tenantCorporate investment grade(1) tenant plus growth focus focus Extract growth potential from “Main & Main” and operationally “Main & Main” and operationally essential locations essential locations renewal/releasing below market leases High portfolio occupancy High portfolio occupancy High credit tenant quality High credit tenant quality Target acquisition mix of long duration and mid-duration Market rents Below market rents leases At or below replacement cost Below replacement cost Maintain blended lease Long-term leases Medium term leases duration of 10 to 12 years Stable income High current income Low lease rollover Moderate lease rollover Contractual growth Substantial growth potential Strong Credit Quality Tenants, Stable Income, Outsized Growth Potential (1) Includes investment grade tenants affiliated with investment grade entities as determined by a major independent rating agency. For purposes of this presentation we have attributed the ratings of the affiliated parent company to the tenant 4
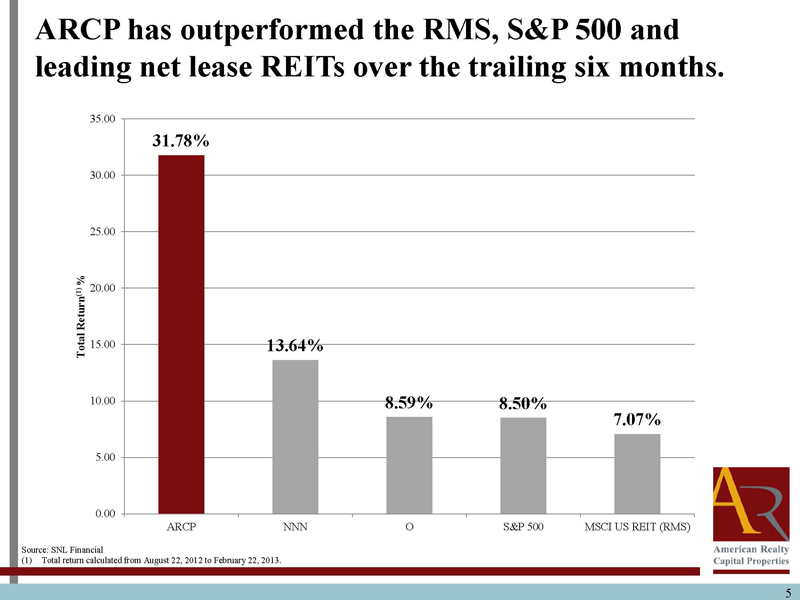
ARCP has outperformed the RMS, S&P 500 and leading net lease REITs over the trailing six months. 35.00 31.78% 30.00 25.00 % (1) 20.00 Return Total 15.00 13.64% 10.00 8.59% 8.50% 7.07% 5.00 0.00 ARCP NNN O S&P 500 MSCI US REIT (RMS) Source: SNL Financial (1) Total return calculated from August 22, 2012 to February 22, 2013. 5

ARCP has increased its dividend 5 times in last 5 quarters. Historical Annualized Dividend(1) $0.905 $0.900 $0.900 $0.895 $0.895 $0.890 $0.890 $0.885 $0.885 $0.880 Per Share $0.880 $0.875 $0.875 $0.875 $0.870 $0.865 $0.860 Q'3 2011 Q'4 2011 Q'1 2012 Q'2 2012 Q'3 2012 Q'4 2012 Q'1 2013 (1) Dividends based on dividend rate at the end of each period. 6
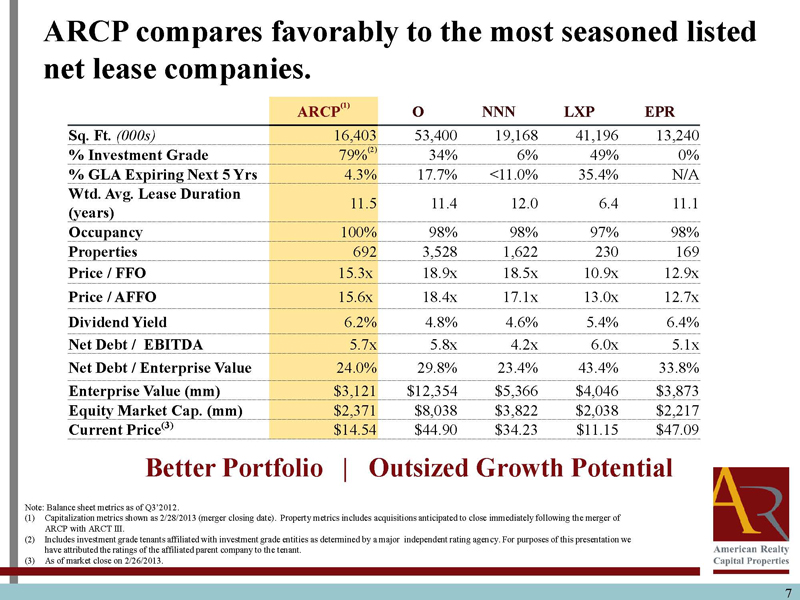
ARCP compares favorably to the most seasoned listed net lease companies. ARCP(1) O NNN LXP EPR Sq. Ft. (000s) 16,403 53,400 19,168 41,196 13,240 % Investment Grade 79%(2) 34% 6% 49% 0% % GLA Expiring Next 5 Yrs 4.3% 17.7% <11.0% 35.4% N/A Wtd. Avg. Lease Duration 11.5 11.4 12.0 6.4 11.1 (years) Occupancy 100% 98% 98% 97% 98% Properties 692 3,528 1,622 230 169 Price / FFO 15.3x 18.9x 18.5x 10.9x 12.9x Price / AFFO 15.6x 18.4x 17.1x 13.0x 12.7x Dividend Yield 6.2% 4.8% 4.6% 5.4% 6.4% Net Debt / EBITDA 5.7x 5.8x 4.2x 6.0x 5.1x Net Debt / Enterprise Value 24.0% 29.8% 23.4% 43.4% 33.8% Enterprise Value (mm) $3,121 $12,354 $5,366 $4,046 $3,873 Equity Market Cap. (mm) $2,371 $8,038 $3,822 $2,038 $2,217 Current Price(3) $14.54 $44.90 $34.23 $11.15 $47.09 Better Portfolio | Outsized Growth Potential Note: Balance sheet metrics as of Q3’2012. (1) Capitalization metrics shown as 2/28/2013 (merger closing date). Property metrics includes acquisitions anticipated to close immediately following the merger of ARCP with ARCT III. (2) Includes investment grade tenants affiliated with investment grade entities as determined by a major independent rating agency. For purposes of this presentation we have attributed the ratings of the affiliated parent company to the tenant. (3) As of market close on 2/26/2013. 7
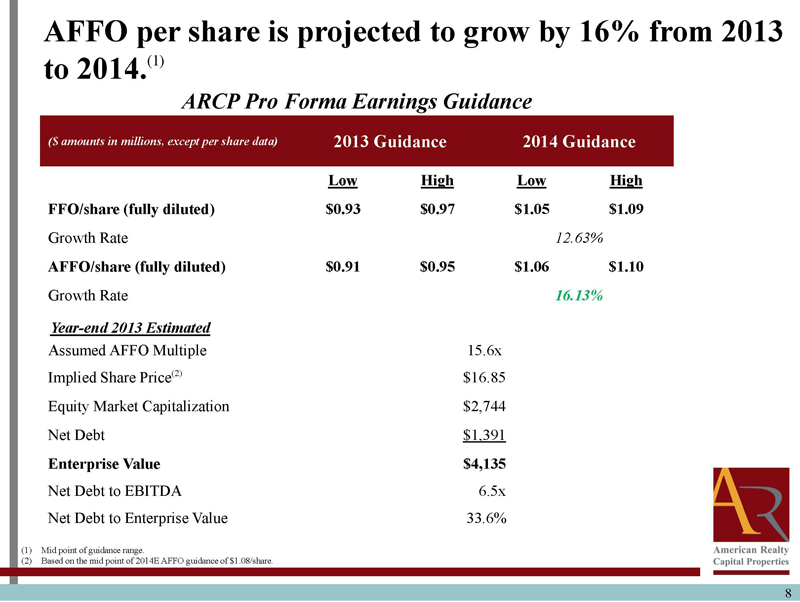
AFFO per share is projected to grow by 16% from 2013 to 2014.(1) ARCP Pro Forma Earnings Guidance ($ amounts in millions, except per share data) 2013 Guidance 2014 GuidanceLowHighLowHigh FFO/share (fully diluted) $0.93 $0.97 $1.05 $1.09 Growth Rate 12.63% AFFO/share (fully diluted) $0.91 $0.95 $1.06 $1.10 Growth Rate 16.13% Year-end 2013 Estimated Assumed AFFO Multiple 15.6x Implied Share Price(2) $16.85 Equity Market Capitalization $2,744 Net Debt$1,391 Enterprise Value $4,135 Net Debt to EBITDA 6.5x Net Debt to Enterprise Value 33.6% (1) Mid point of guidance range. (2) Based on the mid point of 2014E AFFO guidance of $1.08/share. 8
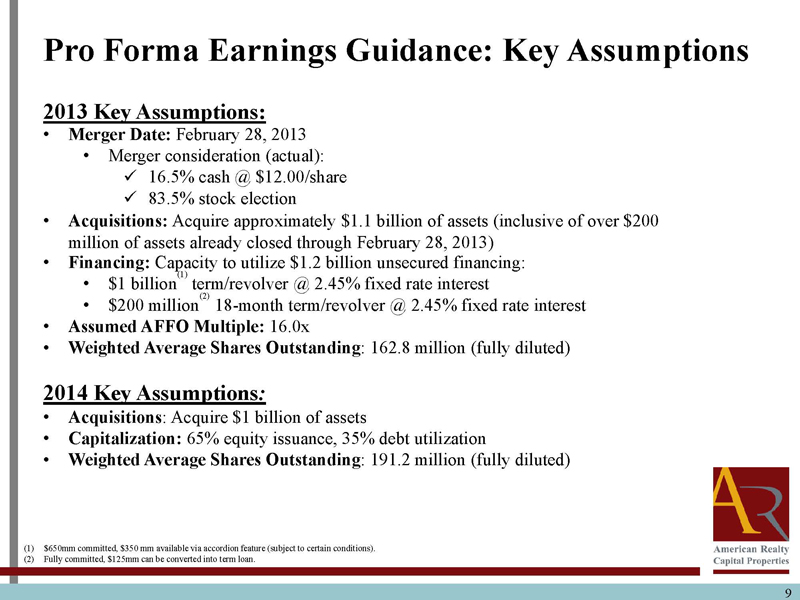
Pro Forma Earnings Guidance: Key Assumptions2013 Key Assumptions: Merger Date: February 28, 2013 Merger consideration (actual):16.5% cash @ $12.00/share83.5% stock election Acquisitions: Acquire approximately $1.1 billion of assets (inclusive of over $200 million of assets already closed through February 28, 2013) Financing: Capacity to utilize $1.2 billion unsecured financing: $1 billion(1) term/revolver @ 2.45% fixed rate interest $200 million(2) 18-month term/revolver @ 2.45% fixed rate interest Assumed AFFO Multiple: 16.0x Weighted Average Shares Outstanding: 162.8 million (fully diluted)2014 Key Assumptions: Acquisitions: Acquire $1 billion of assets Capitalization: 65% equity issuance, 35% debt utilization Weighted Average Shares Outstanding: 191.2 million (fully diluted) (1) $650mm committed, $350 mm available via accordion feature (subject to certain conditions). (2) Fully committed, $125mm can be converted into term loan. 9
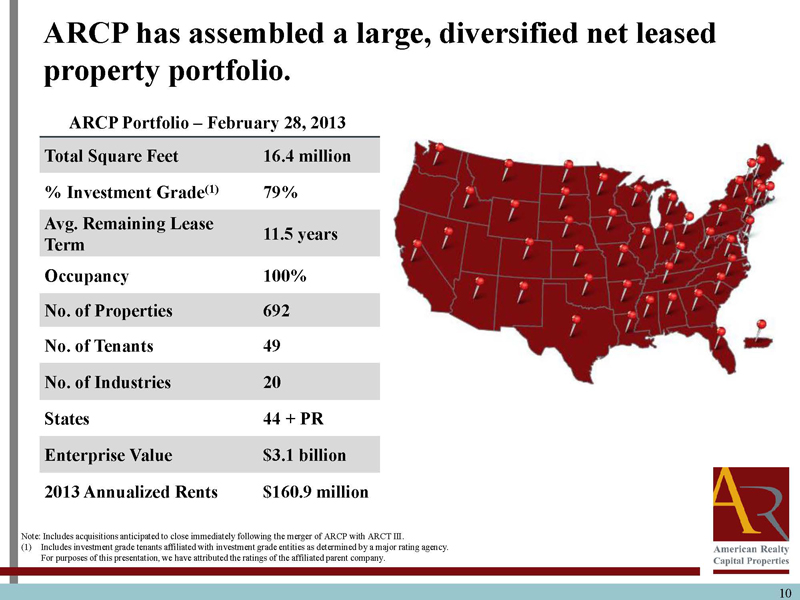
ARCP has assembled a large, diversified net leased property portfolio. ARCP Portfolio February 28, 2013 Total Square Feet 16.4 million % Investment Grade(1) 79% Avg. Remaining Lease 11.5 years Term Occupancy 100% No. of Properties 692 No. of Tenants 49 No. of Industries 20 States 44 + PR Enterprise Value $3.1 billion 2013 Annualized Rents $160.9 million Note: Includes acquisitions anticipated to close immediately following the merger of ARCP with ARCT III. (1) Includes investment grade tenants affiliated with investment grade entities as determined by a major rating agency. For purposes of this presentation, we have attributed the ratings of the affiliated parent company. 10
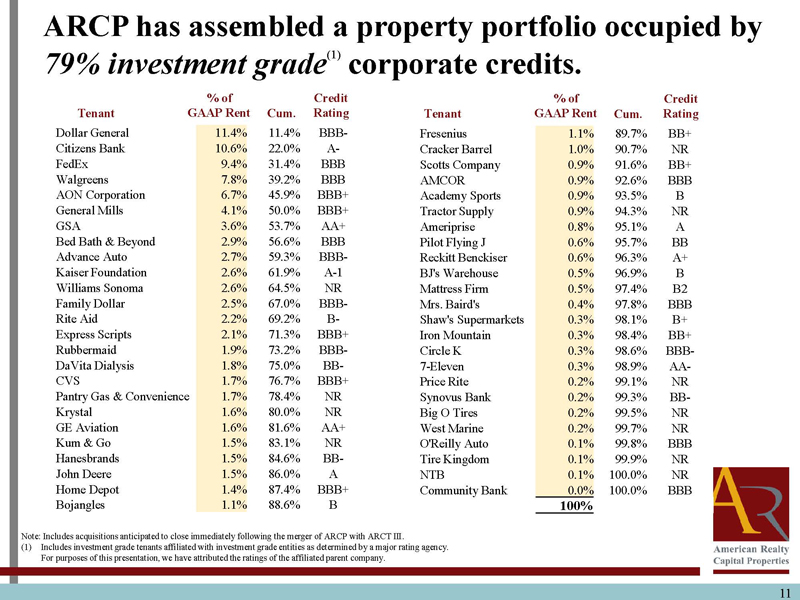
ARCP has assembled a property portfolio occupied by 79% investment grade(1) corporate credits. % of Credit % of Credit Tenant GAAP Rent Cum. Rating Tenant GAAP Rent Cum. Rating Dollar General 11.4% 11.4% BBB- Fresenius 1.1% 89.7% BB+ Citizens Bank 10.6% 22.0% A- Cracker Barrel 1.0% 90.7% NR FedEx 9.4% 31.4% BBB Scotts Company 0.9% 91.6% BB+ Walgreens 7.8% 39.2% BBB AMCOR 0.9% 92.6% BBB AON Corporation 6.7% 45.9% BBB+ Academy Sports 0.9% 93.5% B General Mills 4.1% 50.0% BBB+ Tractor Supply 0.9% 94.3% NR GSA 3.6% 53.7% AA+ Ameriprise 0.8% 95.1% A Bed Bath & Beyond 2.9% 56.6% BBB Pilot Flying J 0.6% 95.7% BB Advance Auto 2.7% 59.3% BBB- Reckitt Benckiser 0.6% 96.3% A+ Kaiser Foundation 2.6% 61.9% A-1 BJ's Warehouse 0.5% 96.9% B Williams Sonoma 2.6% 64.5% NR Mattress Firm 0.5% 97.4% B2 Family Dollar 2.5% 67.0% BBB- Mrs. Baird's 0.4% 97.8% BBB Rite Aid 2.2% 69.2% B- Shaw's Supermarkets 0.3% 98.1% B+ Express Scripts 2.1% 71.3% BBB+ Iron Mountain 0.3% 98.4% BB+ Rubbermaid 1.9% 73.2% BBB- Circle K 0.3% 98.6% BBB- DaVita Dialysis 1.8% 75.0% BB- 7-Eleven 0.3% 98.9% AA- CVS 1.7% 76.7% BBB+ Price Rite 0.2% 99.1% NR Pantry Gas & Convenience 1.7% 78.4% NR Synovus Bank 0.2% 99.3% BB- Krystal 1.6% 80.0% NR Big O Tires 0.2% 99.5% NR GE Aviation 1.6% 81.6% AA+ West Marine 0.2% 99.7% NR Kum & Go 1.5% 83.1% NR O'Reilly Auto 0.1% 99.8% BBB Hanesbrands 1.5% 84.6% BB- Tire Kingdom 0.1% 99.9% NR John Deere 1.5% 86.0% A NTB 0.1% 100.0% NR Home Depot 1.4% 87.4% BBB+ Community Bank 0.0% 100.0% BBB Bojangles 1.1% 88.6% B 100% Note: Includes acquisitions anticipated to close immediately following the merger of ARCP with ARCT III. (1) Includes investment grade tenants affiliated with investment grade entities as determined by a major rating agency. For purposes of this presentation, we have attributed the ratings of the affiliated parent company. 11
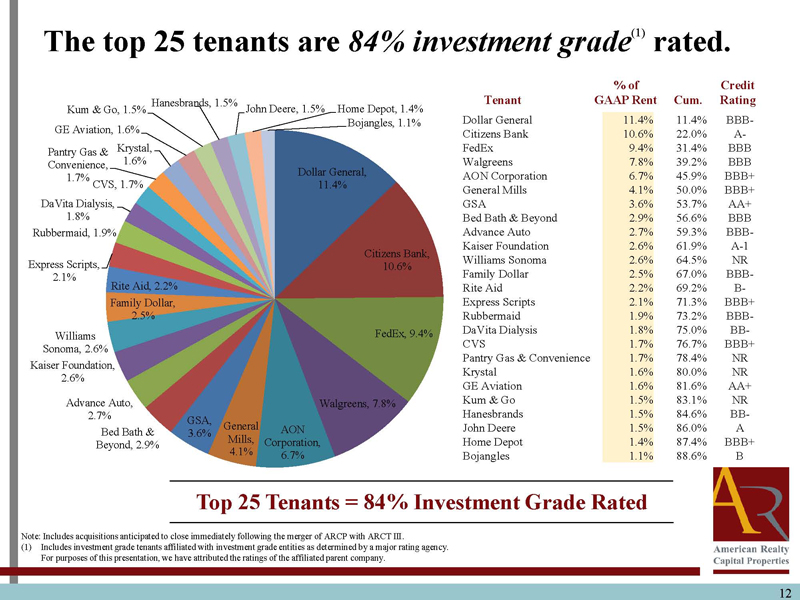
The top 25 tenants are 84% investment grade(1) rated. % of Credit Tenant GAAP Rent Cum. Rating Kum & Go, 1.5% Hanesbrands, 1.5% John Deere, 1.5% Home Depot, 1.4% Bojangles, 1.1% Dollar General 11.4% 11.4% BBB- GE Aviation, 1.6% Citizens Bank 10.6% 22.0% A- Pantry Gas & Krystal, FedEx 9.4% 31.4% BBB Convenience, 1.6% Walgreens 7.8% 39.2% BBB Dollar General, AON Corporation 6.7% 45.9% BBB+ 1.7% CVS, 1.7% 11.4% General Mills 4.1% 50.0% BBB+ DaVita Dialysis, GSA 3.6% 53.7% AA+ 1.8% Bed Bath & Beyond 2.9% 56.6% BBB Rubbermaid, 1.9% Advance Auto 2.7% 59.3% BBB- Kaiser Foundation 2.6% 61.9% A-1 Citizens Bank, Express Scripts, Williams Sonoma 2.6% 64.5% NR 10.6% 2.1% Family Dollar 2.5% 67.0% BBB- Rite Aid, 2.2% Rite Aid 2.2% 69.2% B- Family Dollar, Express Scripts 2.1% 71.3% BBB+ 2.5% Rubbermaid 1.9% 73.2% BBB- FedEx, 9.4% DaVita Dialysis 1.8% 75.0% BB- Williams CVS 1.7% 76.7% BBB+ Sonoma, 2.6% Pantry Gas & Convenience 1.7% 78.4% NR Kaiser Foundation, Krystal 1.6% 80.0% NR 2.6% GE Aviation 1.6% 81.6% AA+ Advance Auto, Walgreens, 7.8% Kum & Go 1.5% 83.1% NR 2.7% Hanesbrands 1.5% 84.6% BB- GSA, General AON John Deere 1.5% 86.0% A Bed Bath & 3.6% Mills, Corporation, Home Depot 1.4% 87.4% BBB+ Beyond, 2.9% 4.1% 6.7% Bojangles 1.1% 88.6% B Top 25 Tenants = 84% Investment Grade Rated Note: Includes acquisitions anticipated to close immediately following the merger of ARCP with ARCT III. (1) Includes investment grade tenants affiliated with investment grade entities as determined by a major rating agency. For purposes of this presentation, we have attributed the ratings of the affiliated parent company. 12

ARCP’s property portfolio grade rated(1) tenants. Top 10 tenants are 100% investment grade rated Top 10 Tenants % Annual Rent Credit Rating Top 10 Tenants 11.4% BBB- Rated 100% 10.6% A- Investment Grade 100% 9.4% BBB 7.8% BBB 6.7% BBB+ Total Portfolio 4.1% BBB+ Rated 90% 3.6% AA+ Investment Grade 79% 2.9% BBB 2.7% BBB- 2.6% A-1 62% Top 10 Tenants = 100% Investment Grade Note: Includes acquisitions anticipated to close immediately following the merger of ARCP with ARCT III. (1) Includes investment grade tenants affiliated with investment grade entities as determined by a major rating agency. For purposes of this presentation, we have attributed the ratings of the affiliated parent company. 13
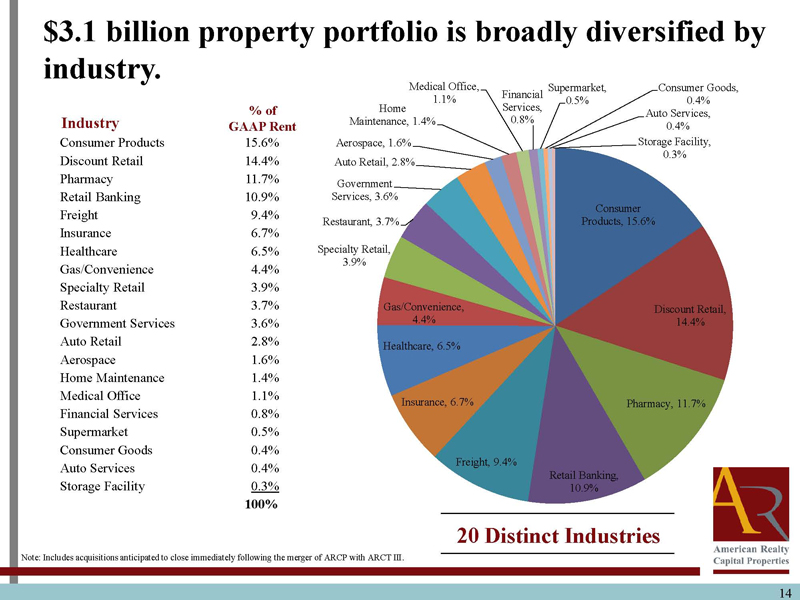
$3.1 billion property portfolio is broadly diversified by industry. Medical Office, Supermarket, Consumer Goods, Financial 1.1% 0.5% 0.4% % of Home Services, Auto Services, Industry Maintenance, 1.4% 0.8% GAAP Rent 0.4% Consumer Products 15.6% Aerospace, 1.6% Storage Facility, 0.3% Discount Retail 14.4% Auto Retail, 2.8% Pharmacy 11.7% Government Retail Banking 10.9% Services, 3.6% Consumer Freight 9.4% Restaurant, 3.7% Products, 15.6% Insurance 6.7% Healthcare 6.5% Specialty Retail, 3.9% Gas/Convenience 4.4% Specialty Retail 3.9% Restaurant 3.7% Gas/Convenience, Discount Retail, Government Services 3.6% 4.4% 14.4% Auto Retail 2.8% Healthcare, 6.5% Aerospace 1.6% Home Maintenance 1.4% Medical Office 1.1% Insurance, 6.7% Pharmacy, 11.7% Financial Services 0.8% Supermarket 0.5% Consumer Goods 0.4% Freight, 9.4% Auto Services 0.4% Retail Banking, Storage Facility 0.3% 10.9% 100% 20 Distinct Industries Note: Includes acquisitions anticipated to close immediately following the merger of ARCP with ARCT III. 14

Only 4.35% of leases mature in the next 5 years. 10.0% 9.0% 8.0% 7.0% 6.0% % GAAP NOI 5.0% 4.0% 3.2% 3.0% 2.0% 1.0% 0.5% 0.4% 0.0% 0.2% 0.0% 2013 2014 2015 2016 2017 Year ARCP has limited near-term lease rollover Note: Includes acquisitions anticipated to close immediately following the merger of ARCP with ARCT III. 15
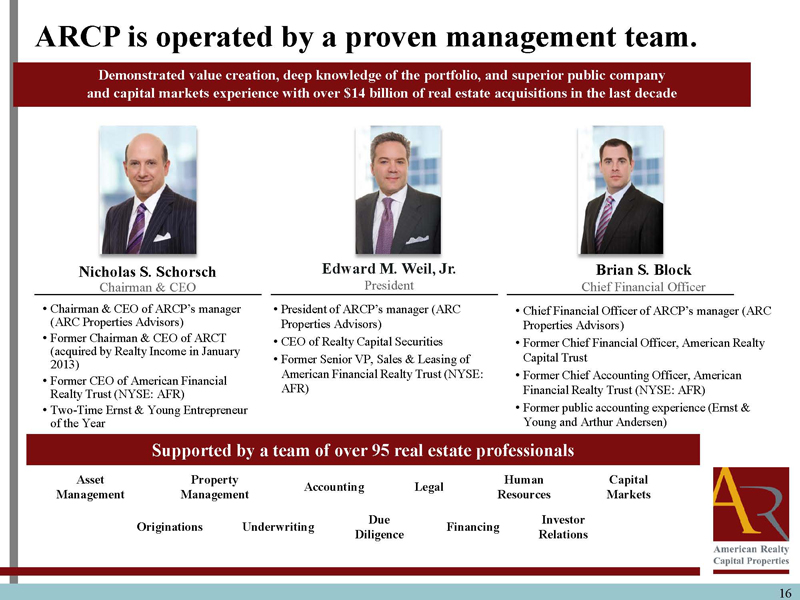
ARCP is operated by a proven management team. Demonstrated value creation, deep knowledge of the portfolio, and superior public company and capital markets experience with over $14 billion of real estate acquisitions in the last decade Nicholas S. Schorsch Edward M. Weil, Jr. Brian S. Block Chairman & CEO PresidentChief Financial OfficerChairman & CEO of ARCP’s President of ARCP’s manager (ARC manager Chief Financial manager (ARCOfficer (ARC Properties Advisors) Properties Advisors) Properties Advisors) Former Chairman & CEO of ARCT CEO of Realty Capital Securities Former Chief Financial Officer, American Realty (acquired by Realty Income in January Former Senior VP, Sales & Leasing of Capital Trust 2013) American Financial Realty Trust (NYSE: Former Chief Accounting Officer, American Former CEO of American Financial AFR) Financial Realty Trust (NYSE: AFR) Realty Trust (NYSE: AFR) Two-Time Ernst & Young Entrepreneur Former public accounting experience (Ernst & of the Year Young and Arthur Andersen) Supported by a team of over 95 real estate professionals Asset Property Human Capital Accounting Legal Management Management Resources Markets Due Investor Originations Underwriting Financing Diligence Relations 16
ARCP’s management team competitive advantages.OOwnership: Management owns over 5% of the CompanyOIntegration: Fully-integrated services platform: 95 professionals and support personnel provide all critical real estate and investment functionsOExperience: Deep net lease experience and expertise, having invested over $10 billion in net lease properties in all major industry sectorsORelationships: Long-standing relationships with key industry participants including: corporate tenants, financial institutions, developers, advisors and intermediaries 17
ARCP’s management structure benefits to shareholders.OLargest U.S. buyer of net lease real estateOVertically integrated team of 95 real estate professionalsOEfficient operational, legal and administrative supportOStrong, consistent track record in net lease spaceOLower fees and expensesOPerformance based management compensation Scale and expertise generate better execution at lower costs 18

ARCP has among the lowest G&A expenses of all its REIT industry peers. G&A as % of Gross Asset Value 3.0% 2.7% 2.4% 2.5% 2.0% 1.7% 1.4% 1.5% 1.2% 1.2% 1.0% 1.0% 0.9% 0.9% 0.9% 1.0% 0.8% 0.7% 0.6% 0.5% 0.5% 0.5% 0.0% ARCP (3bp) (50bps) ARCP’s G&A is half of REIT industry averageless than Source: SNL Financial Note: ARCP excludes professional fees and incremental corporate level G&A. 19
ARCP offers investors significant benefits. 1 Unique Strategy: Unlike any competitor, ARCP acquires both long and mid-duration leases 2 Stable Income Plus Growth: ARCP offers a well-diversified net lease portfolio with high credit quality tenants, long weighted and mid weighted average lease terms and growth potential 3 Significant Size and Scale: 4th largest listed net lease REIT by square footageAccess to public capital markets and eligible for index inclusions to support growthAble to lower cost of capital from investment grade ratingLarger REITs tend to deliver stronger performance, trade at better multiples 4 Outsized Growth Potential: ARCP has significant capacity to grow earnings through acquisitions, internal rent growth, and re-leasing/renewing existing leases 5 Materially Lower Operating Costs: ARCP has more efficient cost structure, having eliminated acquisition and financing fees, reduced management fees and benefiting from economies of scale 6 Expert Management Team: Experienced, expert management team that assembled and managed the real estate portfolio 20
ARCP is a leading net lease REIT. 1 $3.1 Billion Enterprise Value: Increased portfolio size, 4th largest net lease REIT by square footage 2 16% AFFO Growth: AFFO per share growth from $0.93 (mid point 2013E) to $1.08 (mid point 2014E) 3 Significantly Lower Operating Costs: More efficient cost structure, reduced management fees and benefits from economies of scale 4 2.45% Cost of Debt: Lower cost of fixed rate debt financing provides a competitive advantage 5 $3 Billion of Acquisitions: Unmatched total net lease acquisitions by ARC management in the past 24 months 21
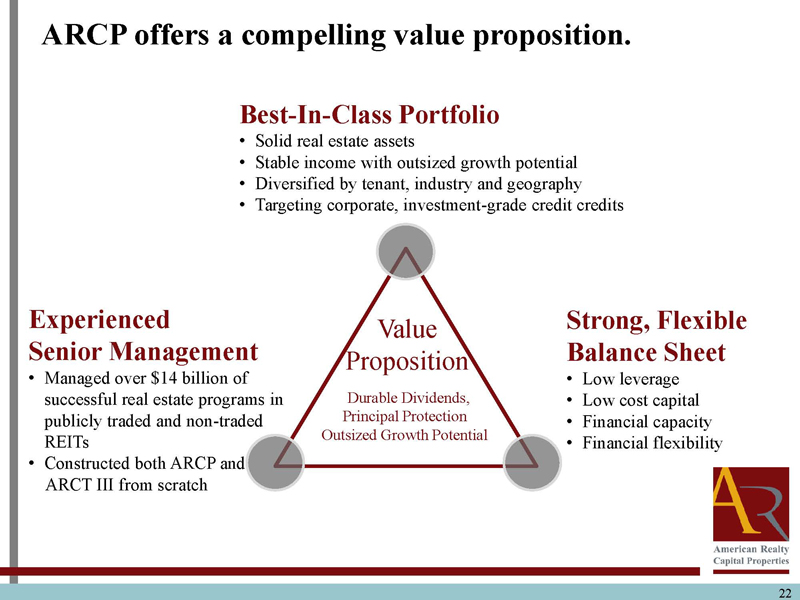
ARCP offers a compelling value proposition. Best-In-Class Portfolio Solid real estate assets Stable income with outsized growth potential Diversified by tenant, industry and geography Targeting corporate, investment-grade credit credits Experienced Value Strong, Flexible Senior Management Proposition Balance Sheet Managed over $14 billion of Low leverage successful real estate programs in Durable Dividends, Low cost capital publicly traded and non-traded Principal Protection Financial capacity REITs Outsized Growth Potential Financial flexibility Constructed both ARCP and ARCT III from scratch 22
Funds from Operations and Adjusted Funds from Operations ARCP considers funds from operations ( “FFO” ) and -related fees and expenses, amortization of above-market lease assets and liabilities, amortization of deferred financing costs, straight-line rent, non-cash mark-to-market adjustments, amortization of restricted stock, non-cash compensation and gains and losses useful indicators of the performance of a real estate investment trust ( “REIT” ). Because FFO calculations exclude such and gains or losses from sales of operating real estate assets (which can vary among owners of identical assets in similar conditions based on historical cost accounting and useful-life estimates), they facilitate comparisons of operating performance between periods and between other REITs in our peer group. Accounting for real estate assets in accordance with generally accepted value of real estate assets diminishes predictably over time. Since real estate values have historically risen or fallen with market conditions, many industry investors and analysts have considered the presentation of operating results for real estate companies that use historical cost accounting to be insufficient by themselves. Additionally, ARCP believes that AFFO, by excluding acquisition-related fees and expenses, amortization of above-market lease assets and liabilities, amortization of deferred financing costs, straight-line rent, non-cash mark-to-market adjustments, amortization of restricted stock, non-cash compensation and gains and losses, provides information consistent with management's analysis of the operating performance of the properties. By providing AFFO, ARCP believes it is presenting useful information that assists investors and analysts to better assess the sustainability of our operating performance. Further, ARCP believes AFFO is useful in comparing the sustainability of our operating performance with the sustainability of the operating performance of other real estate companies, including exchange-traded and non-traded REITs. As a result, ARCP believes that the use of FFO and AFFO, together with the required GAAP presentations, provide a more complete understanding of our performance relative to our peers and a more informed and appropriate basis on which to make decisions involving operating, financing, and investing activities. 23
Forward-Looking Statements Information set forth herein (including information included or incorporated by reference herein) contains “forward -looking statements” (as defined in Section 21E of the Securities Exchange Act of 1934, as amended), which reflect ARCP's expectations regarding future events. The forward-looking statements involve a number of risks, uncertainties and other factors that could cause actual results to differ materially from those contained in the forward-looking statements. Such forward-looking statements include, but are not limited to, the new combined company’s plans, market and other expectations, objectives, intentions, as well as any expectations or projections with respect to the combined company, including regarding future dividends and market valuations, and estimates of growth, including funds from operations and adjusted funds from operations, and other statements that are not historical facts. The following additional factors, among others, could cause actual results to differ from those set forth in the forward-looking statements: market volatility, unexpected costs or unexpected liabilities that may arise from the transaction; the inability to retain key personnel; continuation or deterioration of current market conditions; whether or not ARCP common stock will be included in REIT and public exchange indices; uncertainty regarding the level of demand for ARCP common stock that inclusion in such indices would generate; future regulatory or legislative actions that could adversely affect ARCP; and the business plans of the tenants of ARCP. Additional factors that may affect future results are contained in ARCP's filings with the SEC, which are available at the SEC's website at www.sec.gov. ARCP disclaims any obligation to update and revise statements contained in these materials based on new information or otherwise. 24