ISSUER FREE WRITING PROSPECTUS
Dated July 24, 2013
Filed Pursuant to Rule 433
Registration No. 333-187240
AMERICAN REALTY CAPITAL PROPERTIES, INC.
FREE WRITING PROSPECTUS
American Realty Capital Properties, Inc. (the “Company”) filed an automatically effective universal shelf registration statement on Form S-3 (including a prospectus) with the Securities and Exchange Commission (the “SEC”) for the offering to which this communication (attached asAnnex A) relates. Before you invest, you should read the prospectus in the registration statement, any prospectus supplements thereto and other documents that the Company has filed with the SEC for more complete information about the Company and its offering. You may get these documents for free by visiting EDGAR on the SEC Web site at www.sec.gov.
The prospectus, dated March 13, 2013, and the preliminary prospectus supplement dated July 23, 2013 thereto, are available on the SEC Web site at:
http://www.sec.gov/Archives/edgar/data/1507385/000114420413014900/v337914_s3asr.htm and
http://www.sec.gov/Archives/edgar/data/1507385/000114420413040583/v350481_424b5.htm
Alternatively, the Company, any underwriter or any dealer participating in the offering will arrange to send you the prospectus if you request it by contacting:
| • | J.P. Morgan Securities LLC, c/o Broadridge Financial Solutions, 1155 Long Island Avenue, Edgewood, NY 11717, telephone: 1+ (866) 803-9204; or | ||
| • | Citigroup, c/o Broadridge Financial Solutions, 1155 Long Island Avenue, Edgewood, NY 11717, telephone: 1+ (800) 831-9146. |
Annex A
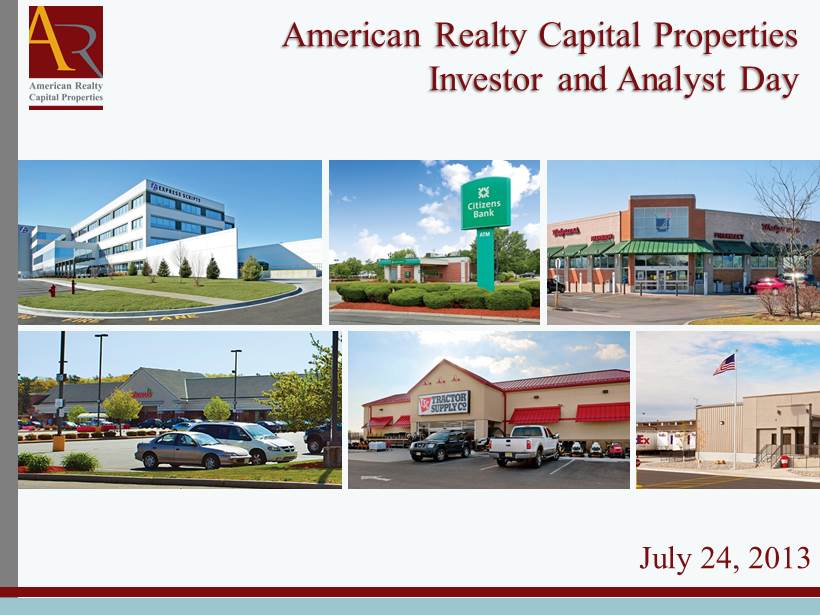
February 2013 American Realty Capital Properties Investor and Analyst Day July 24, 2013
Additional Information Additional Information about the Proposed CapLease Transaction and Where to Find It This communication does not constitute an offer to sell or the solicitation of an offer to buy any securities or a solicitation of any vote or approval. In connection with the proposed transaction between American Realty Capital Properties, Inc. (“ARCP”) and CapLease, Inc. (“CapLease”), ARCP and CapLease intend to file relevant materials with the Securities and Exchange Commission (the “SEC”), including CapLease’s proxy statement on Schedule 14A. CAPLEASE STOCKHOLDERS ARE URGED TO READ THE PROXY STATEMENT (INCLUDING ALL AMENDMENTS AND SUPPLEMENTS THERETO) AND OTHER RELEVANT DOCUMENTS FILED WITH THE SEC IF AND WHEN THEY BECOME AVAILABLE BECAUSE THEY WILL CONTAIN IMPORTANT INFORMATION ABOUT THE PROPOSED TRANSACTION . Investors may obtain free copies of the CapLease proxy statement and other relevant documents filed by ARCP and CapLease with the SEC (if and when they become available) through the website maintained by the SEC at www.sec.gov . Copies of documents filed by ARCP with the SEC are also available free of charge on ARCP’s website at www.arcpreit.com , and copies of documents filed by CapLease with the SEC are available free of charge on CapLease’s website at www.caplease.com or by a direct request to: CapLease, Inc., 1065 Avenue of the Americas, New York, New York 10018, Attn: Investor Relations, (212) 217 - 6300. ARCP and CapLease and their respective directors and executive officers may be deemed to be participants in the solicitation of proxies from CapLease’s stockholders in respect of the proposed transaction. Information regarding ARCP’s directors and executive officers can be found in ARCP’s definitive proxy statement filed with the SEC on April 30, 2013. Information regarding CapLease’s directors and executive officers can be found in CapLease’s definitive proxy statement filed with the SEC on April 19, 2013. Additional information regarding the interests of such potential participants will be included in CapLease’s proxy statement and other relevant documents filed with the SEC in connection with the proposed transaction if and when they become available. These documents are available free of charge on the SEC’s website and from ARCP and CapLease, as applicable, using the sources indicated above. 2 2
Additional Information Additional Information about the Proposed ARCT IV Transaction and Where to Find It This communication does not constitute an offer to sell or the solicitation of an offer to buy any securities or a solicitation of any vote or approval. In connection with the proposed transaction between ARCP and American Realty Capital Trust IV, Inc. (“ARCT IV”), ARCP and ARCT IV intend to file relevant materials with the SEC, including a joint proxy statement on Schedule 14A. BOTH ARCP AND ARCT IV STOCKHOLDERS ARE URGED TO READ THE PROXY STATEMENT (INCLUDING ALL AMENDMENTS AND SUPPLEMENTS THERETO) AND OTHER RELEVANT DOCUMENTS FILED WITH THE SEC IF AND WHEN THEY BECOME AVAILABLE BECAUSE THEY WILL CONTAIN IMPORTANT INFORMATION ABOUT THE PROPOSED TRANSACTION . Investors may obtain free copies of the proxy statement and other relevant documents filed by ARCP and ARCT IV with the SEC (if and when they become available) through the website maintained by the SEC at www.sec.gov . Copies of documents filed by ARCP with the SEC are also available free of charge on ARCP’s website at www.arcpreit.com , and copies of documents filed by ARCT IV with the SEC are available free of charge on ARCT IV’s website at www.arct - 4.com . ARCP and ARCT IV and their respective directors and executive officers may be deemed to be participants in the solicitation of proxies from both companies’ stockholders in respect of the proposed transaction. Information regarding ARCP’s directors and executive officers can be found in ARCP’s definitive proxy statement filed with the SEC on April 30, 2013. Information regarding ARCT IV’s directors and executive officers can be found in ARCT IV’s definitive proxy statement filed with the SEC on April 30, 2013. Additional information regarding the interests of such potential participants will be included in the joint proxy statement and other relevant documents filed with the SEC in connection with the proposed transaction if and when they become available. These documents are available free of charge on the SEC’s website and from ARCP and ARCT IV, as applicable, using the sources indicated above. 3 3
Additional Information about the Proposed Transaction and Where to Find It This communication does not constitute an offer to sell or the solicitation of an offer to buy any securities. In connection with the proposed transaction, American Realty Capital Properties, Inc. (“ARCP”) has filed a registration statement (including a prospectus and preliminary prospectus supplement) with the Securities and Exchange Commission (the “SEC”) for the offering to which this communication relates. You should read the prospectus and supplements there to, including the Risk Factors set forth therein, and the documents that we have filed as exhibits to the registration statement, of which the prospectus and supplements there to are a part, completely and with the understanding that our actual future results may be materially different from what we expect. Except as required by law, we assume no obligation to update these forward - looking statements publicly, or to update the reasons why actual results could differ materially from those anticipated in the forward - looking statements, even if new information becomes available in the future. Before you invest, you should read the prospectus in the registration statement and supplements there to and other documents we have filed with the SEC for more complete information about ARCP and this offering. You may get these documents for free by visiting EDGAR on the SEC web site at http://www.sec.gov. Alternatively, we, any underwriter or any dealer participating in the offering will arrange to send you the prospectus if you request it from either J.P. Morgan Securities LLC, c/o Broadridge Financial Solutions, 1155 Long Island Avenue, Edgewood, NY 11717 or by calling 1+ (866) 803 - 9204, or Citigroup, c/o Broadridge Financial Solutions, 1155 Long Island Avenue, Edgewood, NY 11717 or by calling 1+ (800) 831 - 9146. 4 4
Forward - Looking Statements Information set forth herein (including information included or incorporated by reference herein) contains “forward - looking statements” (as defined in Section 21 E of the Securities Exchange Act of 1934 , as amended), which reflect ARCP's expectations regarding future events . The forward - looking statements involve a number of risks, uncertainties and other factors that could cause actual results to differ materially from those contained in the forward - looking statements . Such forward - looking statements include, but are not limited to , ARCP’s plans, market and other expectations, objectives, intentions, as well as any expectations or projections with respect to ARCP, including regarding future dividends and market valuations, and estimates of growth, including funds from operations and adjusted funds from operations, and other statements that are not historical facts . The following additional factors, among others, could cause actual results to differ from those set forth in the forward - looking statements: our use of the proceeds of offerings of securities; our business and investment strategy; our ability to renew leases as they expire; the performance and economic condition of our tenants; our ability to make additional investments in a timely manner or on acceptable terms; current credit market conditions and our ability to obtain long - term financing for our property investments in a timely manner and on terms that are consistent with what we project when we invest in the property; the effect of general market, real estate market, economic and political conditions, including the recent economic slowdown and dislocation in the global credit markets; our ability to make scheduled payments on our debt obligations; our ability to generate sufficient cash flows to make distributions to our stockholders; the degree and nature of our competition; the availability of qualified personnel; our ability to maintain our qualification as a real estat e investment trust, for U.S. federal income tax purposes, or REIT; we may not be able consummate our pending merger with CapLease, Inc. (“CapLease”), or our pending merger with American Realty Capital Trust IV, Inc. (“ARCT IV”) (“collectively, the mergers”); we may be unable to integrate into our existing portfolio the portfolio of 447 properties we purchased from certain affiliates of GE Capital Corp. (“the GE Capital Portfolio”), on June 27, 2013, which could negatively impact our future business and financial results; and if one or more of the CapLease or ARCT IV mergers is consummated, as applicable, we may encounter substantial difficulties and expenses in integrating ARCT IV’s or CapLease’s properties and systems into our operations and systems, resulting in disruption to our ongoing business and the business of the combined company. Additional factors that may affect future results are contained in ARCP’s filings with the SEC, which are available at the SEC’s website at www.sec.gov . ARCP disclaims any obligation to update and revise statements contained in these materials based on new information or otherwise. 5 5
6 ARCP considers funds from operations (“FFO”) and AFFO, which is FFO as adjusted to exclude acquisition - related fees and expenses, amortization of above - market lease assets and liabilities, amortization of deferred financing costs, straight - line ren t, non - cash mark - to - market adjustments, amortization of restricted stock, non - cash compensation and gains and losses useful indicators of the performance of a real estate investment trust (“REIT”). Because FFO calculations exclude such factors as depreciation and amortization of real estate assets and gains or losses from sales of operating real estate assets (which can vary among owner s o f identical assets in similar conditions based on historical cost accounting and useful - life estimates), they facilitate compariso ns of operating performance between periods and between other REITs in our peer group. Accounting for real estate assets in accordance with generally accepted accounting principles (“GAAP”) implicitly assumes that the value of real estate assets diminishes predictably over time. Since real estate values have historically risen or fallen with market conditions, many ind ust ry investors and analysts have considered the presentation of operating results for real estate companies that use historical co st accounting to be insufficient by themselves. FFO and AFFO are not in accordance with, or a substitute for, measures prepared in accordance with GAAP, and may be different from non - GAAP measures used by other companies. In addition, FFO and AFFO are not based on any comprehensive set of accounting rules or principles. Non - GAAP measures, such as FFO and AFFO, have limitations in that they do not reflect all of the amounts associated with ARCP's results of operations that would be reflected in measures determined in accordance with GAAP. These measures should only be used to evaluate ARCP's performance in conjunction with corresponding GAAP measures. Additionally , ARCP believes that AFFO, by excluding acquisition - related fees and expenses, amortization of above - market lease assets and liabilities, amortization of deferred financing costs, straight - line rent, non - cash mark - to - market adjustments, amortization of restricted stock, non - cash compensation and gains and losses, provides information consistent with management's analysis of the operating performance of the properties. By providing AFFO, ARCP believes it is presenting useful information that assists investors and analysts to better assess the sustainability of our operating performance. Further, ARCP believes AFF O is useful in comparing the sustainability of our operating performance with the sustainability of the operating performance of o the r real estate companies, including exchange - traded and non - traded REITs. As a result, ARCP believes that the use of FFO and AFFO, together with the required GAAP presentations, provide a more complete understanding of our performance relative to our peers and a more informed and appropriate basis on which to make decisions involving operating, financing, and investing activities . Funds from Operations and Adjusted Funds from Operations
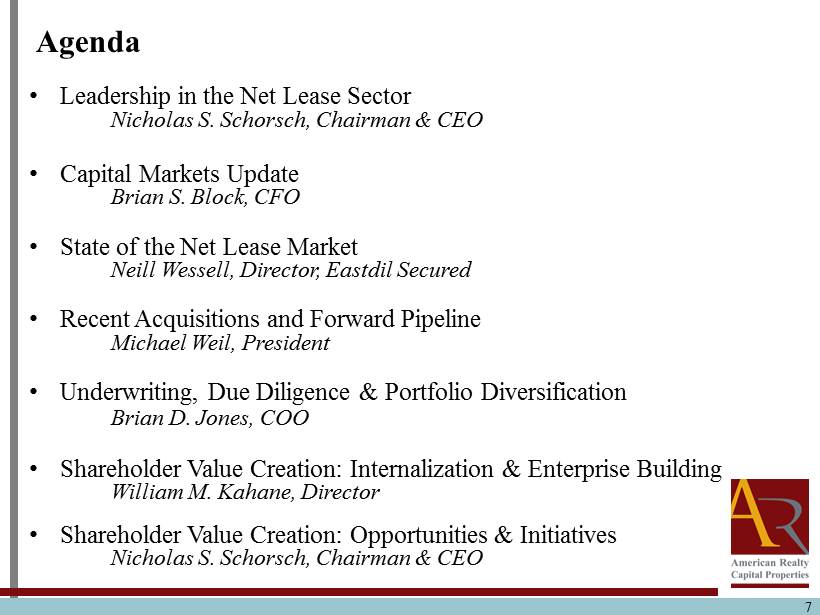
7 Agenda • Leadership in the Net Lease Sector Nicholas S. Schorsch, Chairman & CEO • Capital Markets Update Brian S. Block, CFO • State of the Net Lease Market Neill Wessell , Director, Eastdil Secured • Recent Acquisitions and Forward Pipeline Michael Weil, President • Underwriting, Due Diligence & Portfolio Diversification Brian D. Jones, COO • Shareholder Value Creation: Internalization & Enterprise Building William M. Kahane, Director • Shareholder Value Creation: Opportunities & Initiatives Nicholas S. Schorsch, Chairman & CEO
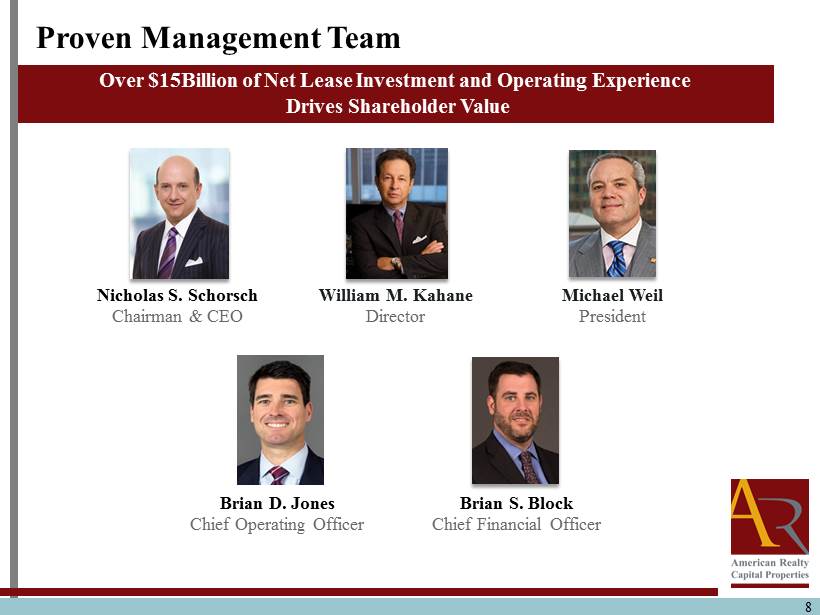
8 Proven Management Team Over $15Billion of Net Lease Investment and Operating Experience Drives Shareholder Value Nicholas S. Schorsch Chairman & CEO Brian S. Block Chief Financial Officer Michael Weil President Brian D. Jones Chief Operating Officer William M. Kahane Director

Leadership in the Net Lease Sector Nicholas S. Schorsch Chairman and CEO 9
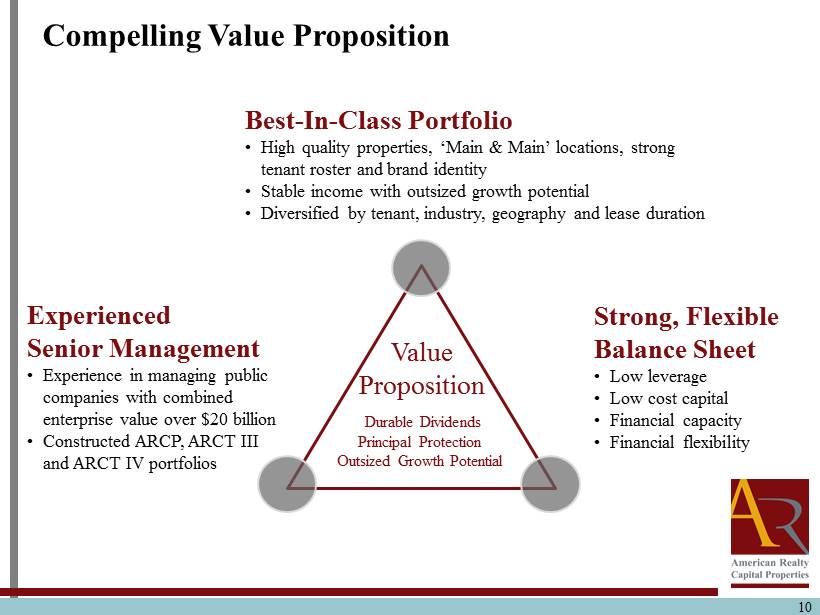
10 Experienced Senior Management • Experience in managing public companies with combined enterprise value over $20 billion • Constructed ARCP, ARCT III and ARCT IV portfolios Best - In - Class Portfolio • High quality properties, ‘Main & Main’ locations, strong tenant roster and brand identity • Stable income with outsized growth potential • Diversified by tenant, industry, geography and lease duration Value Proposition Durable Dividends Principal Protection Outsized Growth Potentia l Strong, Flexible Balance Sheet • Low leverage • Low cost capital • Financial capacity • Financial flexibility Compelling Value Proposition

Long Term Leases 11 Unique Investment Strategy Strong Credit Quality Tenants and National Brands, Stable Income, Outsized Growth Potential Single Tenant, Net Lease Corporate, Investment Grade Tenant Focus Main & Main/Essential Locations High Occupancy High Credit Quality Market Rents At Market Below Market Replacement Cost At Below Lease Terms Over 10 Years Below 10 Years Current Income Stable High Lease Rollover Maturity Low Moderate Rent Growth Contractual Strong Growth Potential ▪ Combine high credit quality tenants offering stable income plus growth ▪ Extract growth potential from renewal/releasing below market leases ▪ Target acquisition mix of 70% long - duration and 30% mid - duration leases ▪ Maintain blended lease duration of 10 to 12 years “Vintage” Leases Investment Characteristics
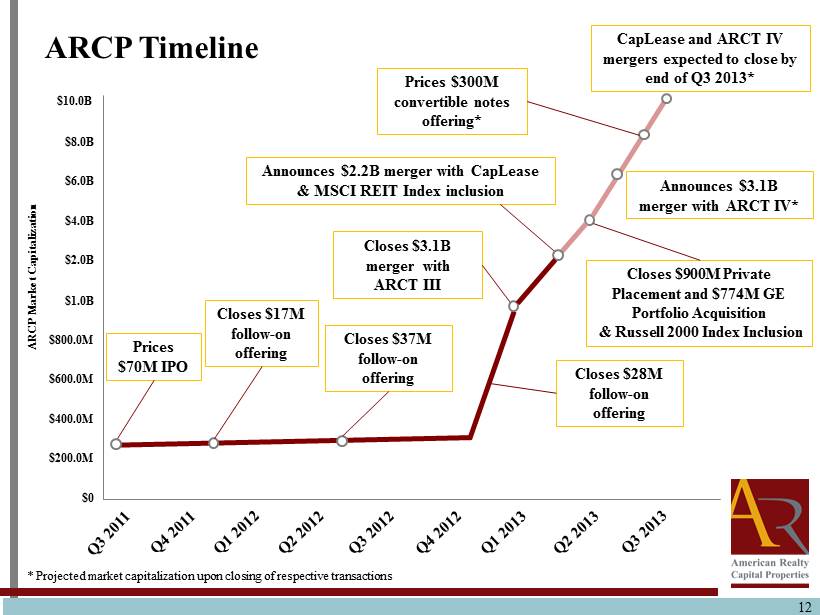
Closes $900M Private Placement and $774M GE Portfolio Acquisition & Russell 2000 Index Inclusion Closes $3.1B merger with ARCT III 12 ARCP Timeline $10.0B Closes $17M follow - on offering Closes $37M follow - on offering $8.0B $6.0B $4.0B $2.0B Announces $2.2B merger with CapLease & MSCI REIT Index inclusion $1.0B $800.0M $600.0M $400.0M $200.0M $0 CapLease and ARCT IV mergers expected to close by end of Q3 2013* ARCP Market Capitalization Announces $ 3.1B merger with ARCT IV* Prices $70M IPO Prices $300M convertible notes offering* * Projected market capitalization upon closing of respective transactions Closes $28M follow - on offering
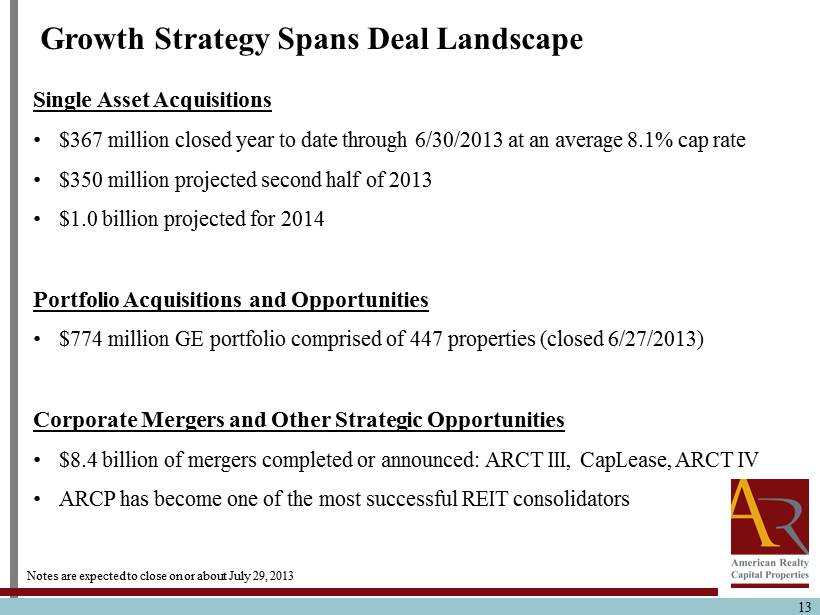
13 Single Asset Acquisitions • $ 367 million closed year to date through 6/30/2013 at an average 8.1 % cap rate • $ 350 million projected second half of 2013 • $1.0 billion projected for 2014 Portfolio Acquisitions and Opportunities • $774 million GE portfolio comprised of 447 properties (closed 6/27/2013) Corporate Mergers and Other Strategic Opportunities • $8.4 billion of mergers completed or announced: ARCT III, CapLease, ARCT IV • ARCP has become one of the most successful REIT consolidators Growth Strategy Spans Deal Landscape Notes are expected to close on or about July 29, 2013
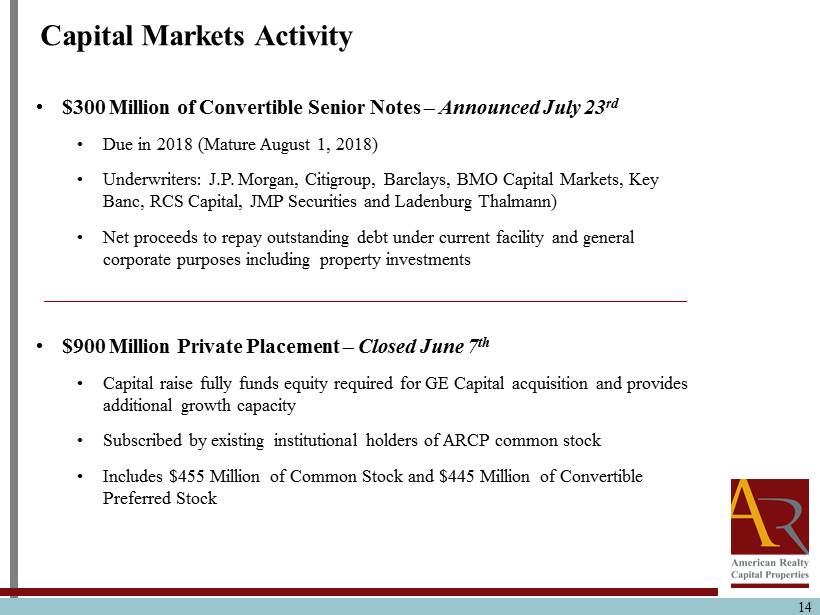
14 • $300 Million of Convertible Senior Notes – Announced July 23 rd • D ue in 2018 (Mature August 1, 2018) • Underwriters: J.P . Morgan, Citigroup, Barclays, BMO Capital Markets, Key Banc, RCS Capital, JMP Securities and Ladenburg Thalmann ) • Net proceeds to repay outstanding debt under current facility and general corporate purposes including property investments • $900 M illion Private Placement – Closed June 7 th • Capital raise fully funds equity required for GE Capital acquisition and provides additional growth capacity • Subscribed by existing institutional holders of ARCP common stock • Includes $ 455 Million of Common Stock and $445 Million of Convertible Preferred Stock Capital Markets Activity
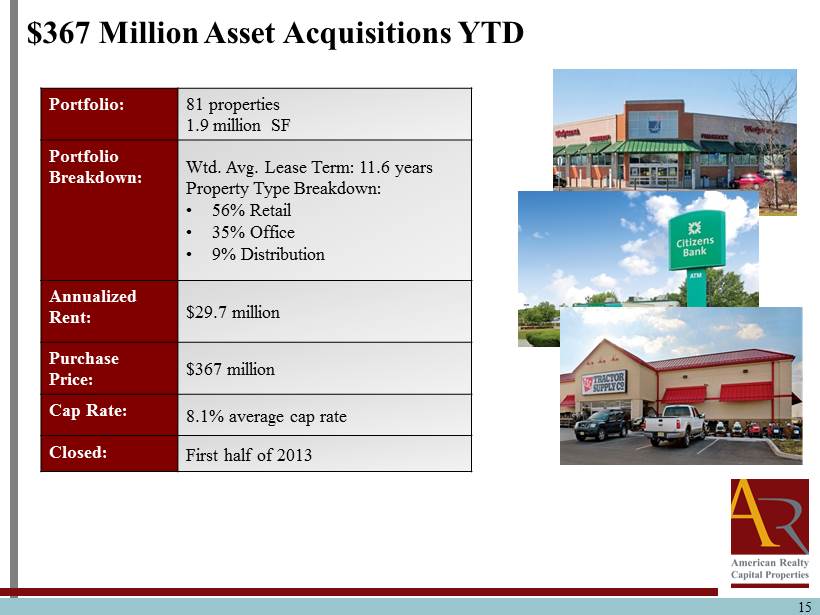
15 $367 Million Asset Acquisitions YTD Portfolio: 81 properties 1.9 million SF Portfolio Breakdown: Wtd . Avg. Lease Term: 11.6 years Property Type Breakdown: • 56% Retail • 35% Office • 9% Distribution Annualized Rent : $29.7 million Purchase Price: $367 million Cap Rate: 8.1% average cap rate Closed: First half of 2013
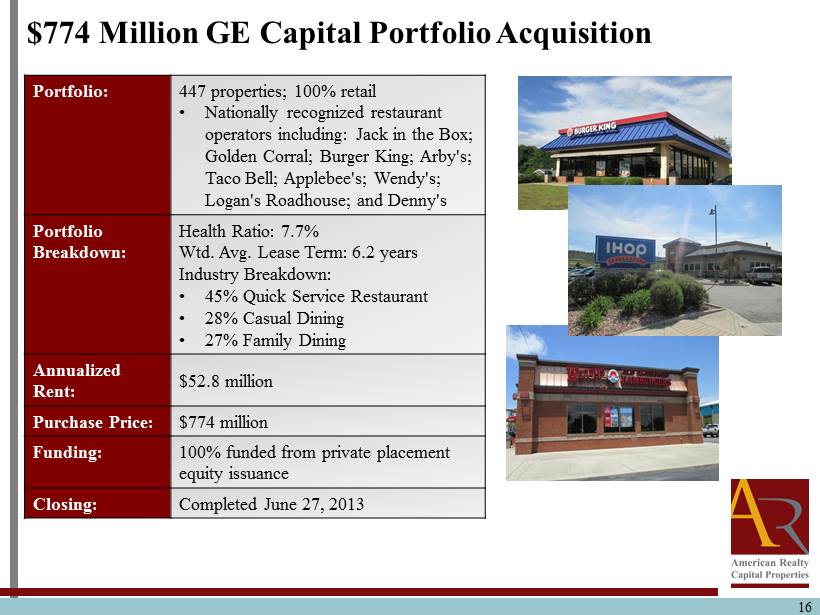
16 $ 774 Million GE Capital Portfolio Acquisition Portfolio: 447 properties; 100% retail • Nationally recognized restaurant operators including: Jack in the Box; Golden Corral; Burger King; Arby's; Taco Bell; Applebee's; Wendy's; Logan's Roadhouse; and Denny's Portfolio Breakdown: Health Ratio: 7.7% Wtd . Avg. Lease Term: 6.2 years Industry Breakdown: • 45% Quick Service Restaurant • 28 % Casual Dining • 27% Family Dining Annualized Rent : $52.8 million Purchase Price: $774 million Funding: 100% funded from private placement equity issuance Closing: Completed June 27, 2013
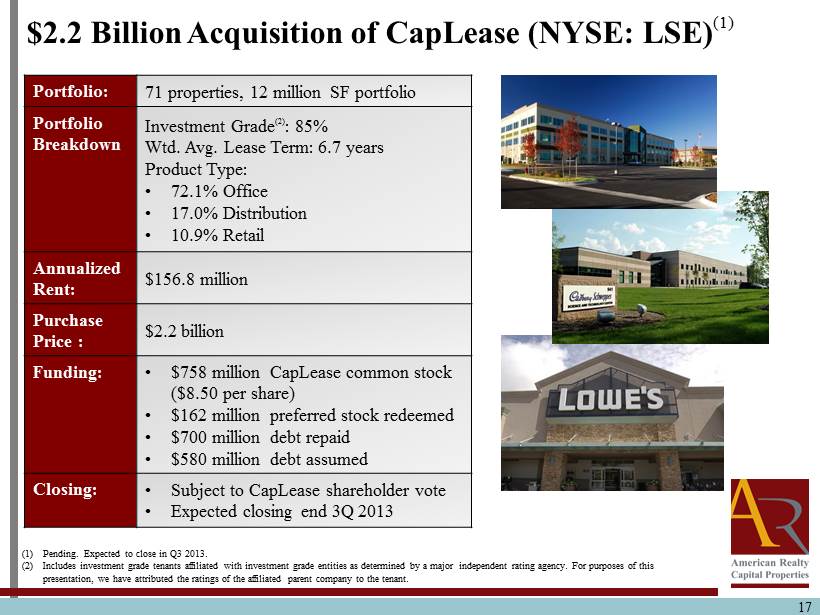
17 $2.2 Billion Acquisition of CapLease (NYSE: LSE) (1) Portfolio: 71 properties, 12 million SF portfolio Portfolio Breakdown Investment Grade (2) : 85% Wtd . Avg. Lease Term: 6.7 years Product Type : • 72.1% Office • 17.0% Distribution • 10.9% Retail Annualized Rent : $156.8 million Purchase Price : $2.2 billion Funding: • $758 million CapLease common stock ($8.50 per share) • $162 million preferred stock redeemed • $700 million debt repaid • $580 million debt assumed Closing: • Subject to CapLease shareholder vote • Expected closing end 3Q 2013 (1) Pending. Expected to close in Q3 2013. (2) Includes investment grade tenants affiliated with investment grade entities as determined by a major independent rating agen cy. For purposes of this presentation, we have attributed the ratings of the affiliated parent company to the tenant .
• Originated and underwritten over $4.8 billion in net lease transactions (1) • Added over $350 million in high - quality assets since 2010 through accretive acquisitions and build - to - suit business • 2012: $190M; highest level since 2008 • Transactions provide for competitive pricing and significant flexibility • Long - term partnerships with net lease developers • Acquisition program has helped CapLease developer partners pursue build - to - suit business more competitively, resulting in increased deal flow and favorable pricing • Certainty of execution (project completion in less than 18 months) • Secures long - term investment assets at yields significantly higher than buying completed properties 18 Build - to - Suit Capabilities Added CapLease Build - to - Suit Expertise Spans 20 Years (1) Includes acquisitions and build - to - suit business.
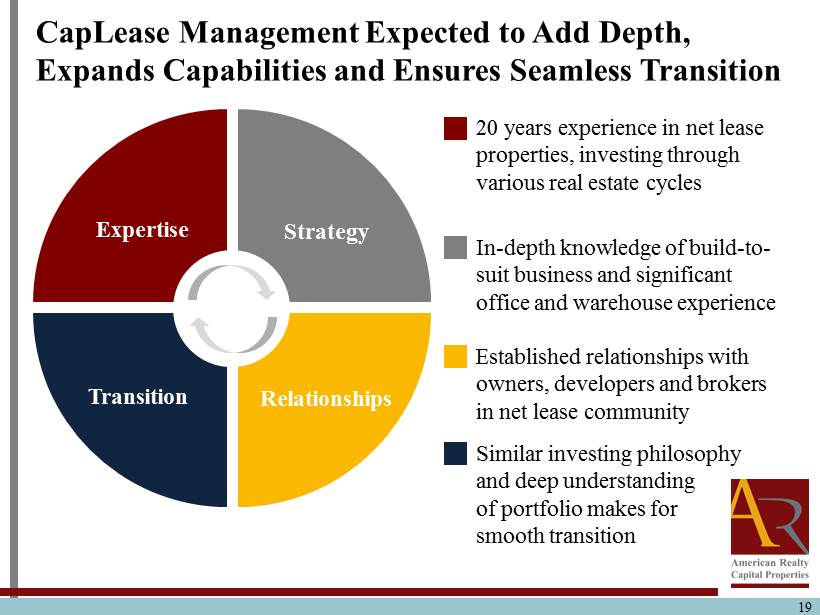
19 2013 Highlights CapLease Management Expected to Add Depth, Expands Capabilities and Ensures Seamless Transition Strategy Expertise Transition Relationships 20 years experience in net lease properties, investing through various real estate cycles In - depth knowledge of build - to - suit business and significant office and warehouse experience Established relationships with owners, developers and brokers in net lease community Similar investing philosophy and deep understanding of portfolio makes for smooth transition
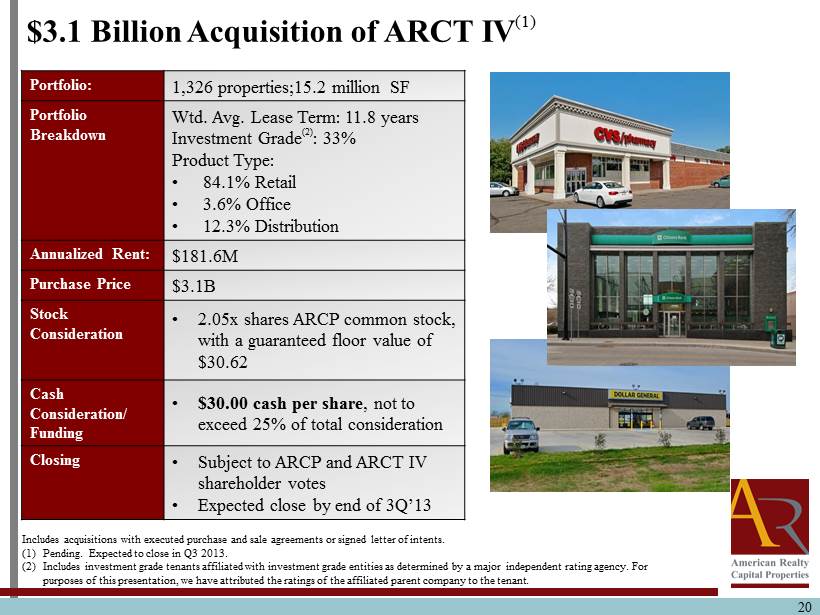
20 $ 3.1 Billion Acquisition of ARCT IV (1) Portfolio: 1,326 properties;15.2 million SF Portfolio Breakdown Wtd . Avg. Lease Term: 11.8 years Investment Grade (2) : 33% Product Type: • 84.1% Retail • 3.6% Office • 12.3% Distribution Annualized Rent : $181.6M Purchase Price $3.1B Stock Consideration • 2.05x shares ARCP common stock, with a guaranteed floor value of $30.62 Cash Consideration/ Funding • $30.00 cash per share , not to exceed 25% of total consideration Closing • Subject to ARCP and ARCT IV shareholder votes • Expected close by end of 3Q’13 Includes acquisitions with executed purchase and sale agreements or signed letter of intents. (1) Pending. Expected to close in Q3 2013. (2) Includes investment grade tenants affiliated with investment grade entities as determined by a major independent rating agen cy. For purposes of this presentation, we have attributed the ratings of the affiliated parent company to the tenant .

Questions & Answers 21
Capital Markets Update Brian S. Block Chief Financial Officer 22
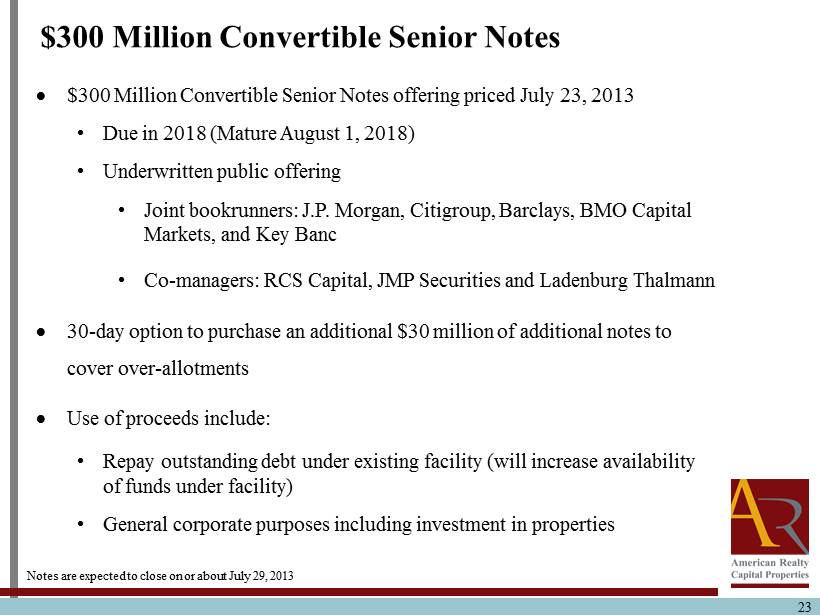
23 $300 M illion Convertible Senior Notes offering priced July 23, 2013 • Due in 2018 (Mature August 1, 2018) • Underwritten public offering • Joint bookrunners : J.P. Morgan, Citigroup, Barclays, BMO Capital Markets, and Key Banc • Co - managers: RCS Capital, JMP Securities and Ladenburg Thalmann 30 - day option to purchase an additional $30 million of additional notes to cover over - allotments Use of proceeds include: • Repay outstanding debt under existing facility (will increase availability of funds under facility) • General corporate purposes including investment in properties $300 Million Convertible Senior Notes Notes are expected to close on or about July 29, 2013
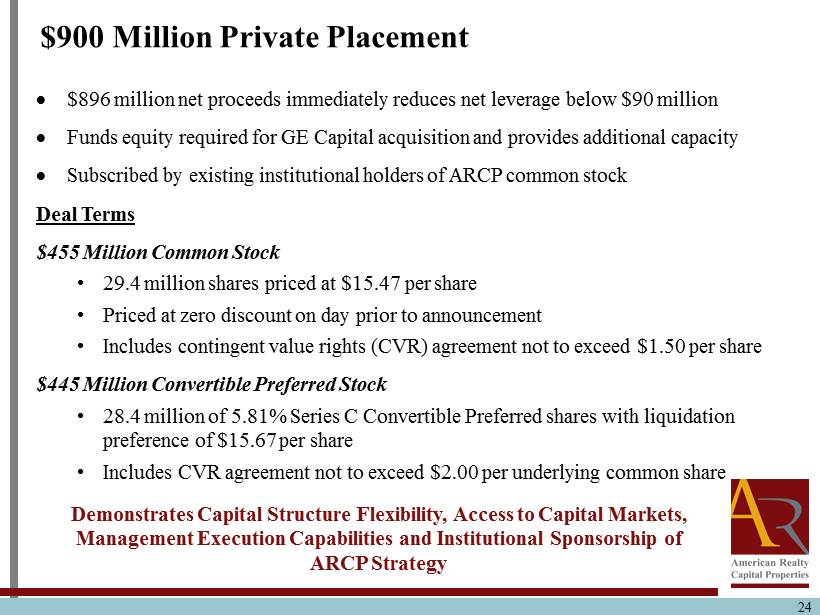
24 $896 million net proceeds immediately reduces net leverage below $90 million Funds equity required for GE Capital acquisition and provides additional capacity Subscribed by existing institutional holders of ARCP common stock Deal Terms $455 Million Common Stock • 29.4 million shares priced at $15.47 per share • Priced at zero discount on day prior to announcement • Includes contingent value rights (CVR) agreement not to exceed $1.50 per share $445 Million Convertible Preferred Stock • 28.4 million of 5.81% Series C Convertible Preferred shares with liquidation preference of $ 15.67 per share • Includes CVR agreement not to exceed $2.00 per underlying common share $900 Million Private Placement Demonstrates Capital Structure Flexibility , Access to Capital Markets , Management Execution Capabilities and Institutional Sponsorship of ARCP Strategy
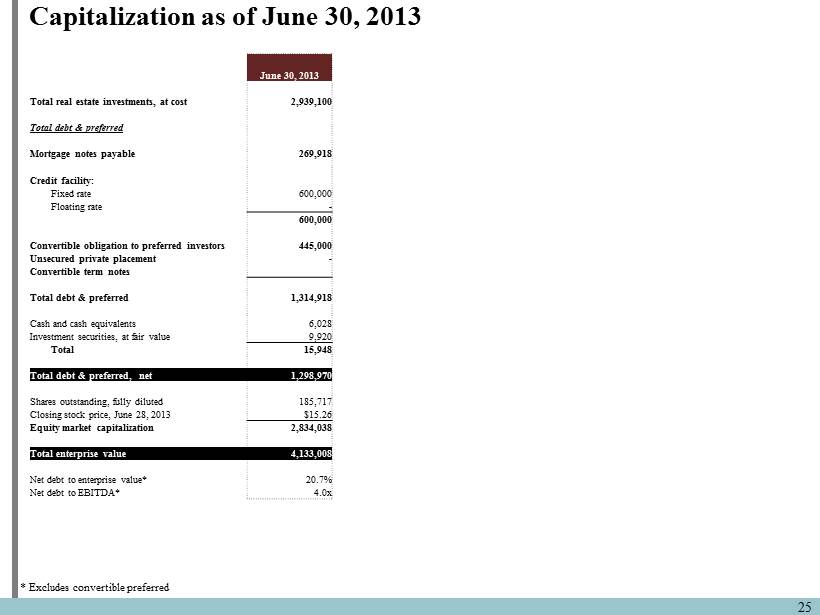
25 Capitalization as of June 30, 2013 June 30 , 2013 Total real estate investments, at cost 2,939,100 Total debt & preferred Mortgage notes payable 269,918 Credit facility: Fixed rate 600,000 Floating rate - 600,000 Convertible obligation to preferred investors 445,000 Unsecured private placement - Convertible term notes Total debt & preferred 1,314,918 Cash and cash equivalents 6,028 Investment securities, at fair value 9,920 Total 15,948 Total debt & preferred, net 1,298,970 Shares outstanding, fully diluted 185,717 Closing stock price, June 28, 2013 $15.26 Equity market capitalization 2,834,038 Total enterprise value 4,133,008 Net debt to enterprise value* 20.7% Net debt to EBITDA* 4.0x * Excludes convertible preferred
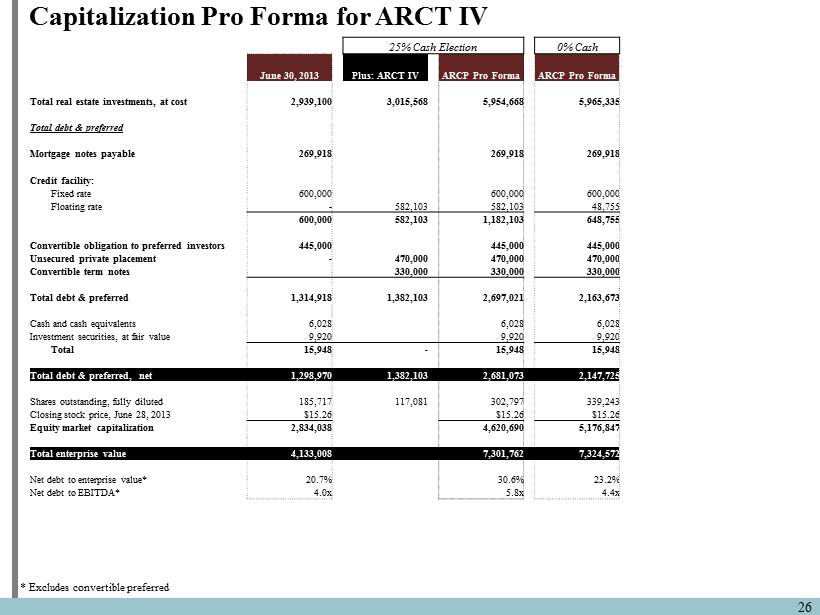
26 Capitalization Pro Forma for ARCT IV 25 % Cash Election 0% Cash June 30, 2013 Plus: ARCT IV ARCP Pro Forma ARCP Pro Forma Total real estate investments, at cost 2,939,100 3,015,568 5,954,668 5,965,335 Total debt & preferred Mortgage notes payable 269,918 269,918 269,918 Credit facility: Fixed rate 600,000 600,000 600,000 Floating rate - 582,103 582,103 48,755 600,000 582,103 1,182,103 648,755 Convertible obligation to preferred investors 445,000 445,000 445,000 Unsecured private placement - 470,000 470,000 470,000 Convertible term notes 330,000 330,000 330,000 Total debt & preferred 1,314,918 1,382,103 2,697,021 2,163,673 Cash and cash equivalents 6,028 6,028 6,028 Investment securities, at fair value 9,920 9,920 9,920 Total 15,948 - 15,948 15,948 Total debt & preferred, net 1,298,970 1,382,103 2,681,073 2,147,725 Shares outstanding, fully diluted 185,717 117,081 302,797 339,243 Closing stock price, June 28, 2013 $15.26 $15.26 $15.26 Equity market capitalization 2,834,038 4,620,690 5,176,847 Total enterprise value 4,133,008 7,301,762 7,324,572 Net debt to enterprise value* 20.7% 30.6% 23.2% Net debt to EBITDA* 4.0x 5.8x 4.4x * Excludes convertible preferred
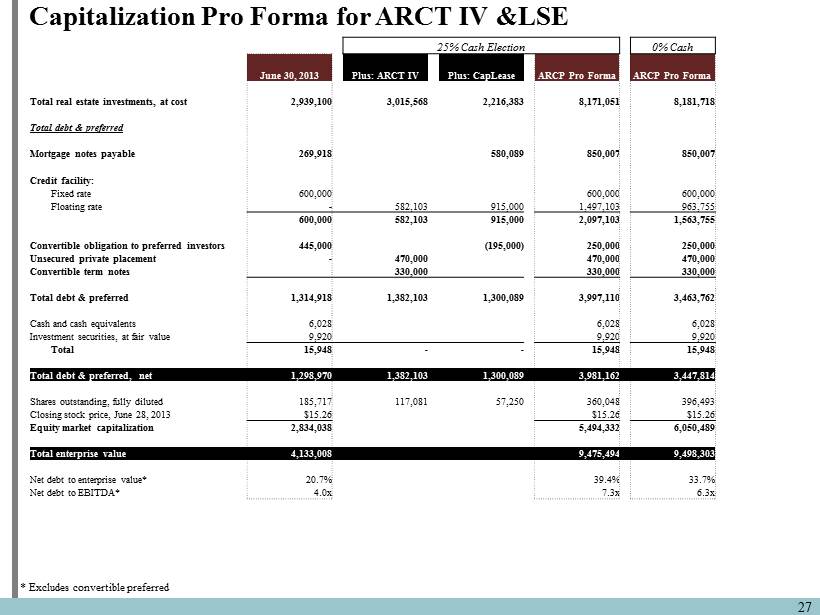
27 Capitalization Pro Forma for ARCT IV &LSE 25 % Cash Election 0% Cash June 30, 2013 Plus: ARCT IV Plus: CapLease ARCP Pro Forma ARCP Pro Forma Total real estate investments, at cost 2,939,100 3,015,568 2,216,383 8,171,051 8,181,718 Total debt & preferred Mortgage notes payable 269,918 580,089 850,007 850,007 Credit facility: Fixed rate 600,000 600,000 600,000 Floating rate - 582,103 915,000 1,497,103 963,755 600,000 582,103 915,000 2,097,103 1,563,755 Convertible obligation to preferred investors 445,000 (195,000) 250,000 250,000 Unsecured private placement - 470,000 470,000 470,000 Convertible term notes 330,000 330,000 330,000 Total debt & preferred 1,314,918 1,382,103 1,300,089 3,997,110 3,463,762 Cash and cash equivalents 6,028 6,028 6,028 Investment securities, at fair value 9,920 9,920 9,920 Total 15,948 - - 15,948 15,948 Total debt & preferred, net 1,298,970 1,382,103 1,300,089 3,981,162 3,447,814 Shares outstanding, fully diluted 185,717 117,081 57,250 360,048 396,493 Closing stock price, June 28, 2013 $15.26 $15.26 $15.26 Equity market capitalization 2,834,038 5,494,332 6,050,489 Total enterprise value 4,133,008 9,475,494 9,498,303 Net debt to enterprise value* 20.7% 39.4% 33.7% Net debt to EBITDA* 4.0x 7.3x 6.3x * Excludes convertible preferred
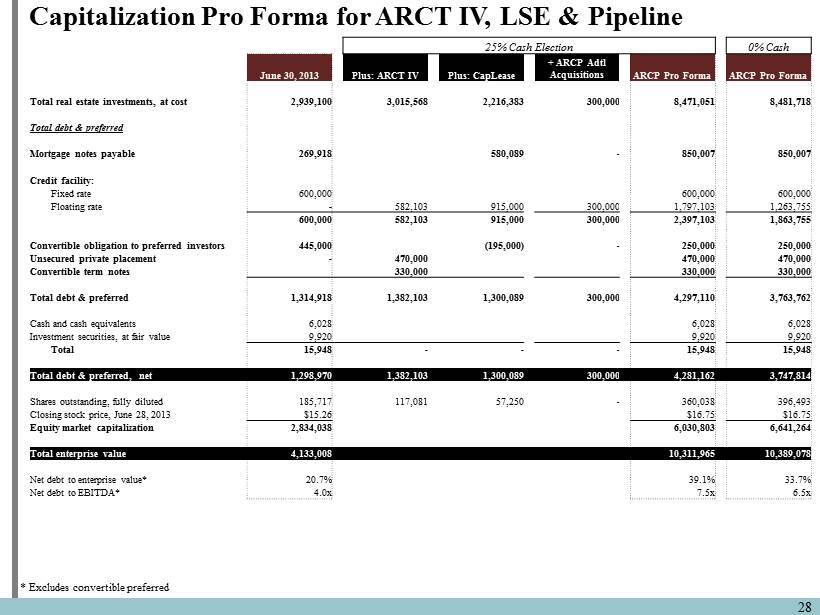
28 Capitalization Pro Forma for ARCT IV, LSE & Pipeline 25 % Cash Election 0% Cash June 30, 2013 Plus: ARCT IV Plus: CapLease + ARCP Adtl Acquisitions ARCP Pro Forma ARCP Pro Forma Total real estate investments, at cost 2,939,100 3,015,568 2,216,383 300,000 8,471,051 8,481,718 Total debt & preferred Mortgage notes payable 269,918 580,089 - 850,007 850,007 Credit facility: Fixed rate 600,000 600,000 600,000 Floating rate - 582,103 915,000 300,000 1,797,103 1,263,755 600,000 582,103 915,000 300,000 2,397,103 1,863,755 Convertible obligation to preferred investors 445,000 (195,000) - 250,000 250,000 Unsecured private placement - 470,000 470,000 470,000 Convertible term notes 330,000 330,000 330,000 Total debt & preferred 1,314,918 1,382,103 1,300,089 300,000 4,297,110 3,763,762 Cash and cash equivalents 6,028 6,028 6,028 Investment securities, at fair value 9,920 9,920 9,920 Total 15,948 - - - 15,948 15,948 Total debt & preferred, net 1,298,970 1,382,103 1,300,089 300,000 4,281,162 3,747,814 Shares outstanding, fully diluted 185,717 117,081 57,250 - 360,038 396,493 Closing stock price, June 28, 2013 $15.26 $16.75 $16.75 Equity market capitalization 2,834,038 6,030,803 6,641,264 Total enterprise value 4,133,008 10,311,965 10,389,078 Net debt to enterprise value* 20.7% 39.1% 33.7% Net debt to EBITDA* 4.0x 7.5x 6.5x * Excludes convertible preferred
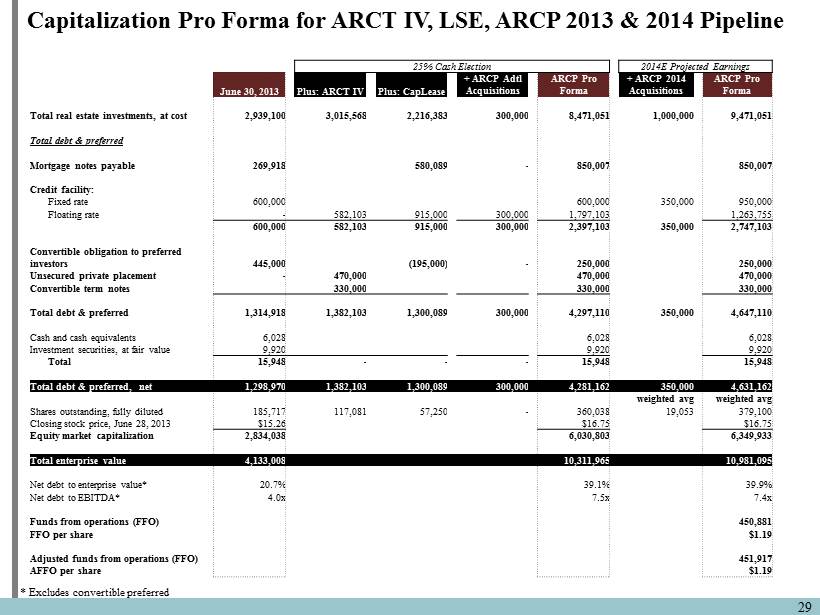
29 Capitalization Pro Forma for ARCT IV, LSE, ARCP 2013 & 2014 Pipeline 25 % Cash Election 2014E Projected Earnings June 30, 2013 Plus: ARCT IV Plus: CapLease + ARCP Adtl Acquisitions ARCP Pro Forma + ARCP 2014 Acquisitions ARCP Pro Forma Total real estate investments, at cost 2,939,100 3,015,568 2,216,383 300,000 8,471,051 1,000,000 9,471,051 Total debt & preferred Mortgage notes payable 269,918 580,089 - 850,007 850,007 Credit facility: Fixed rate 600,000 600,000 350,000 950,000 Floating rate - 582,103 915,000 300,000 1,797,103 1,263,755 600,000 582,103 915,000 300,000 2,397,103 350,000 2,747,103 Convertible obligation to preferred investors 445,000 (195,000) - 250,000 250,000 Unsecured private placement - 470,000 470,000 470,000 Convertible term notes 330,000 330,000 330,000 Total debt & preferred 1,314,918 1,382,103 1,300,089 300,000 4,297,110 350,000 4,647,110 Cash and cash equivalents 6,028 6,028 6,028 Investment securities, at fair value 9,920 9,920 9,920 Total 15,948 - - - 15,948 15,948 Total debt & preferred, net 1,298,970 1,382,103 1,300,089 300,000 4,281,162 350,000 4,631,162 weighted avg weighted avg Shares outstanding, fully diluted 185,717 117,081 57,250 - 360,038 19,053 379,100 Closing stock price, June 28, 2013 $15.26 $16.75 $16.75 Equity market capitalization 2,834,038 6,030,803 6,349,933 Total enterprise value 4,133,008 10,311,965 10,981,095 Net debt to enterprise value* 20.7% 39.1% 39.9% Net debt to EBITDA* 4.0x 7.5x 7.4x Funds from operations (FFO) 450,881 FFO per share $1.19 Adjusted funds from operations (FFO) 451,917 AFFO per share $1.19 * Excludes convertible preferred
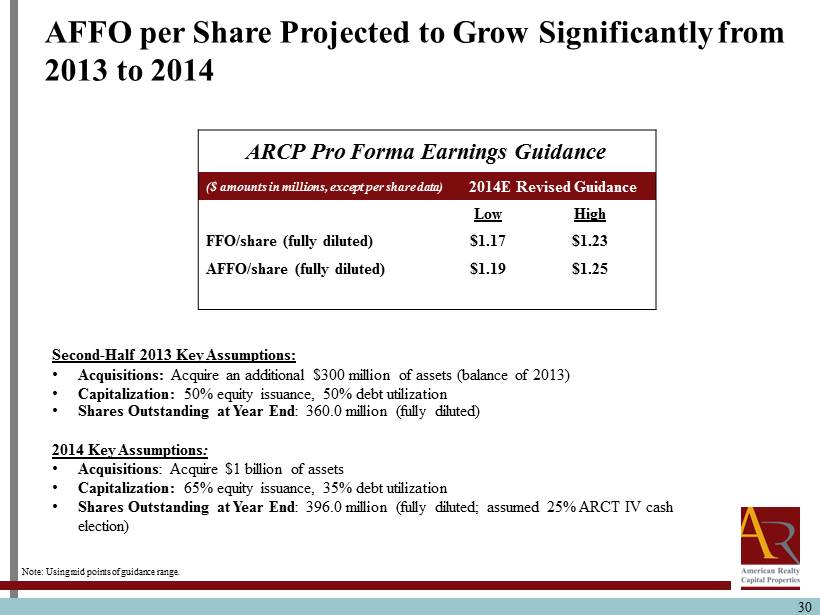
30 AFFO per Share Projected to Grow S ignificantly from 2013 to 2014 ARCP Pro Forma Earnings Guidance ($ amounts in millions, except per share data) 2014E Revised Guidance Low High FFO/share (fully diluted) $1.17 $1.23 AFFO/share (fully diluted) $1.19 $1.25 Note: Using mid points of guidance range. Second - Half 2013 Key Assumptions: • Acquisitions: Acquire an additional $300 million of assets (balance of 2013) • Capitalization: 50% equity issuance, 50% debt utilization • Shares Outstanding at Year End : 360.0 million (fully diluted) 2014 Key Assumptions : • Acquisitions : Acquire $1 billion of assets • Capitalization: 65% equity issuance, 35% debt utilization • Shares Outstanding at Year End : 396.0 million (fully diluted; assumed 25% ARCT IV cash election)

31 Accounting, Human Resources and Information Technology Capabilities : 41 Dedicated Professionals Accounting • 31 Team Members • Prepare Financial Reports • Report Analysis and Reconciliation • Monitor and Refine Accounting Activities • Budgeting Human Resources • 4 Team Members • Company Recruiting Needs • Manage Administrative Processes and Programs • Performance Management • Employee Relations Information Technology • 6 Team Members • Efficient Communication Providers • Enterprise Resource Planning • Data Management • Process Improvements Accounting and Administration Teams Play a Key Role in the Successful Controls, Reporting and Disclosures Includes services provided to ARCP by ARC entities

Questions & Answers 32
State of the Net Lease Market Neill Wessell Director, Net Lease Group Eastdil Secured 33
Recent Acquisitions and Forward Pipeline Michael Weil President 34
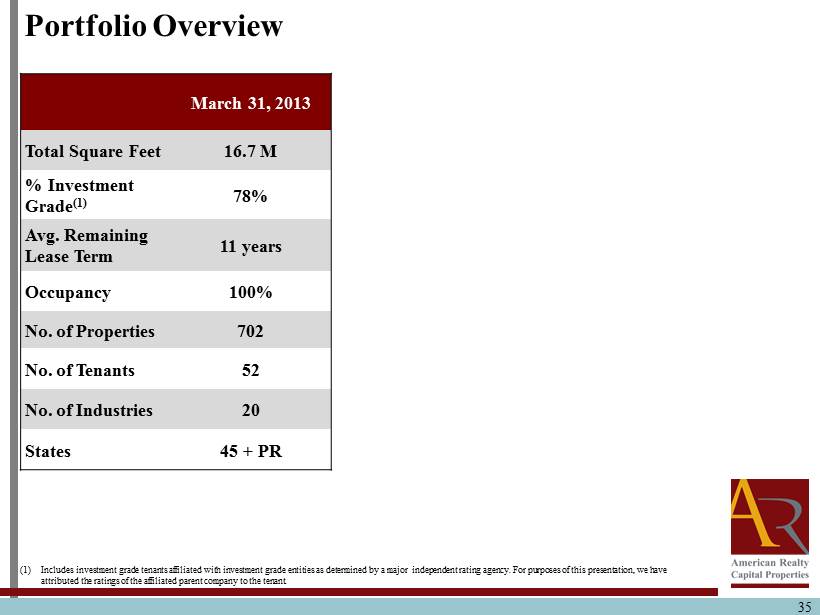
Portfolio Overview 35 (1) Includes investment grade tenants affiliated with investment grade entities as determined by a major independent rating agen cy. For purposes of this presentation, we have attributed the ratings of the affiliated parent company to the tenant. March 31, 2013 Total Square Feet 16.7 M % Investment Grade (1) 78% Avg. Remaining Lease Term 11 years Occupancy 100% No. of Properties 702 No. of Tenants 52 No. of Industries 20 States 45 + PR
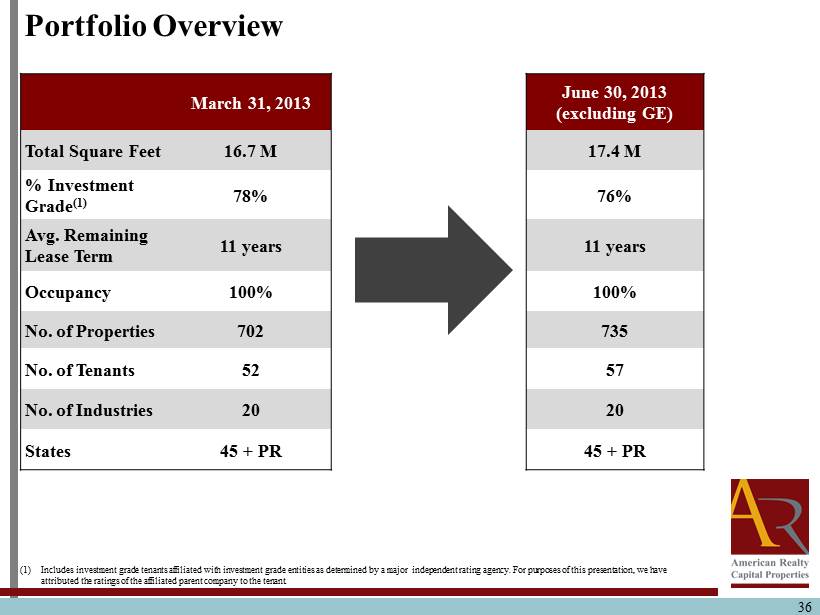
36 March 31, 2013 June 30, 2013 (excluding GE) Total Square Feet 16.7 M 17.4 M % Investment Grade (1) 78% 76% Avg. Remaining Lease Term 11 years 11 years Occupancy 100% 100% No. of Properties 702 735 No. of Tenants 52 57 No. of Industries 20 20 States 45 + PR 45 + PR (1) Includes investment grade tenants affiliated with investment grade entities as determined by a major independent rating agen cy. For purposes of this presentation, we have attributed the ratings of the affiliated parent company to the tenant. Portfolio Overview

37 March 31, 2013 June 30, 2013 Total Square Feet 16.7 M 19.4 M % Investment Grade (1) 78% 59% Avg. Remaining Lease Term 11 years 10 years Occupancy 100% 100% No. of Properties 702 1,182 No. of Tenants 52 180 No. of Industries 20 21 States 45 + PR 48 + PR (1) Includes investment grade tenants affiliated with investment grade entities as determined by a major independent rating agen cy. For purposes of this presentation, we have attributed the ratings of the affiliated parent company to the tenant. Portfolio Overview

38 June 30, 2013 June 30, 2013 + ARCT IV + LSE Total Square Feet 19.4 M 43.4 M % Investment Grade (1) 59% 53% Avg. Remaining Lease Term 10 years 10 years Occupancy 100% 100% No. of Properties 1,182 2,574 No. of Tenants 180 457 No. of Industries 21 34 States 48 + PR 49 + PR Includes acquisitions with executed purchase and sale agreements or signed letter of intents . (1) Includes investment grade tenants affiliated with investment grade entities as determined by a major independent rating agency. For p urp oses of this presentation, we have attributed the ratings of the affiliated parent company to the tenant. Portfolio Overview
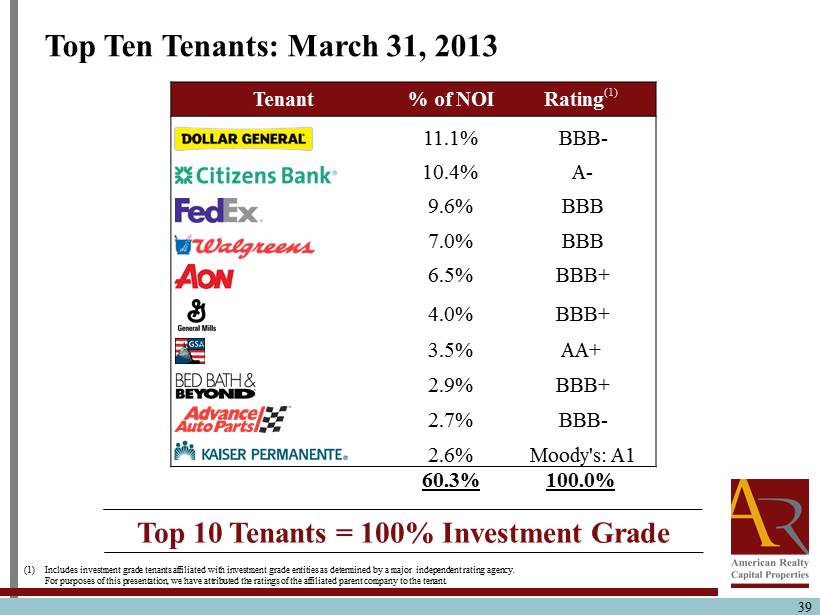
Tenant % of NOI Rating (1) 11.1% BBB - 10.4% A - 9.6% BBB 7.0% BBB 6.5% BBB+ 4.0% BBB+ 3.5% AA+ 2.9% BBB+ 2.7% BBB - 2.6% Moody's: A1 60.3% 100.0% 39 39 Top Ten Tenants: March 31, 2013 (1) Includes investment grade tenants affiliated with investment grade entities as determined by a major independent rating agency. For purposes of this presentation, we have attributed the ratings of the affiliated parent company to the tenant. Top 10 Tenants = 100% Investment Grade
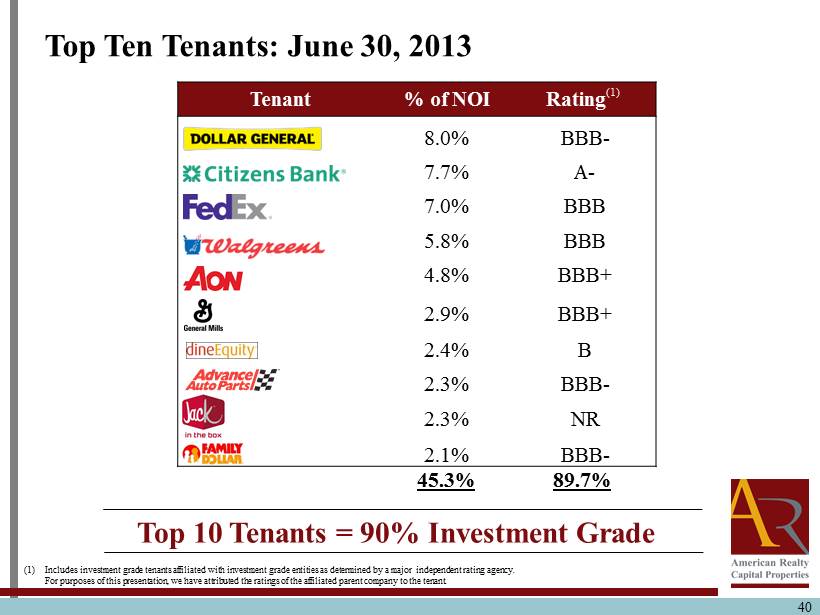
40 40 Top Ten Tenants: June 30, 2013 (1) Includes investment grade tenants affiliated with investment grade entities as determined by a major independent rating agency. For purposes of this presentation, we have attributed the ratings of the affiliated parent company to the tenant. Top 10 Tenants = 90% Investment Grade Tenant % of NOI Rating (1) 8.0% BBB - 7.7% A - 7.0% BBB 5.8% BBB 4.8% BBB+ 2.9% BBB+ 2.4% B 2.3% BBB - 2.3% NR 2.1% BBB - 45.3% 89.7%
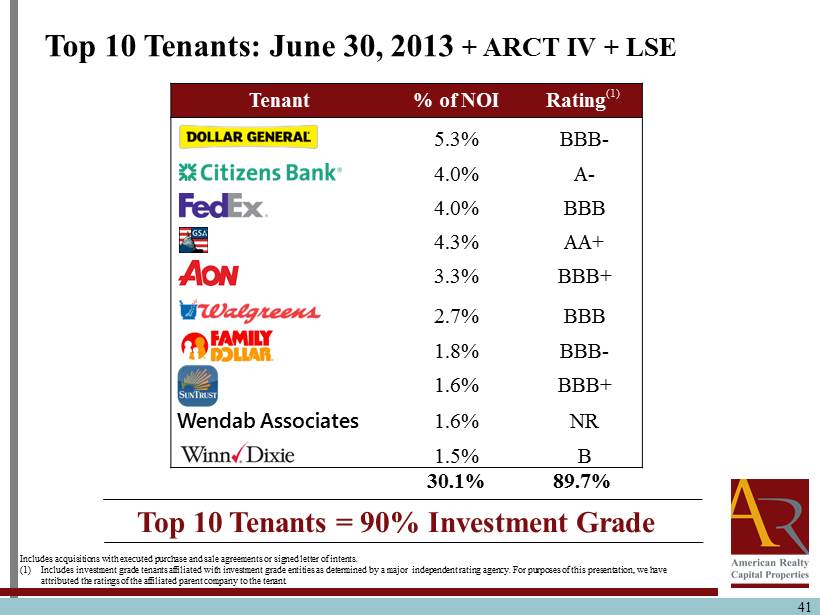
41 Tenant % of NOI Rating (1) 5.3% BBB - 4.0% A - 4.0% BBB 4.3% AA+ 3.3% BBB+ 2.7% BBB 1.8% BBB - 1.6% BBB+ Wendab Associates 1.6% NR 1.5% B 30.1% 89.7% Top 10 Tenants: June 30, 2013 + ARCT IV + LSE Top 10 Tenants = 90% Investment Grade Includes acquisitions with executed purchase and sale agreements or signed letter of intents . (1) Includes investment grade tenants affiliated with investment grade entities as determined by a major independent rating agency. For p urp oses of this presentation, we have attributed the ratings of the affiliated parent company to the tenant.
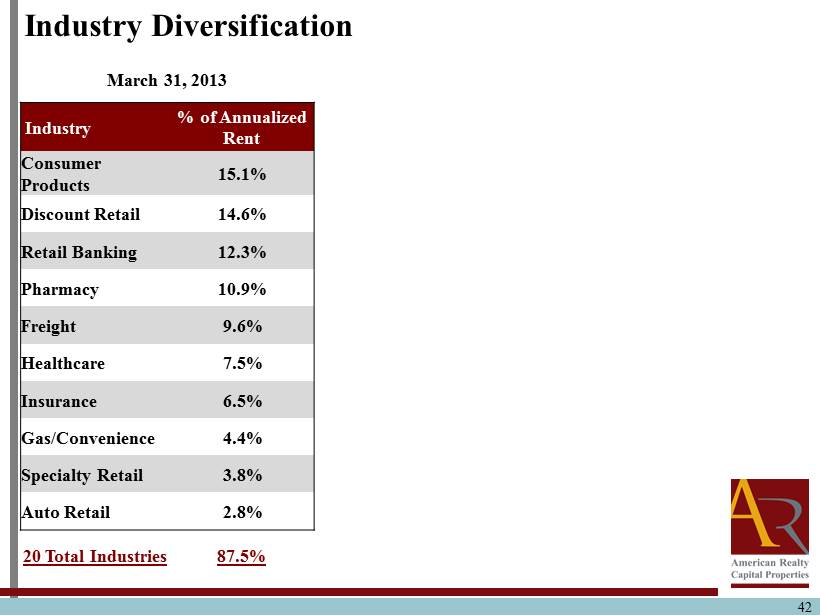
Industry Diversification 42 March 31, 2013 Industry % of Annualized Rent Consumer Products 15.1% Discount Retail 14.6% Retail Banking 12.3% Pharmacy 10.9% Freight 9.6% Healthcare 7.5% Insurance 6.5% Gas/Convenience 4.4% Specialty Retail 3.8% Auto Retail 2.8% 20 Total Industries 87.5%
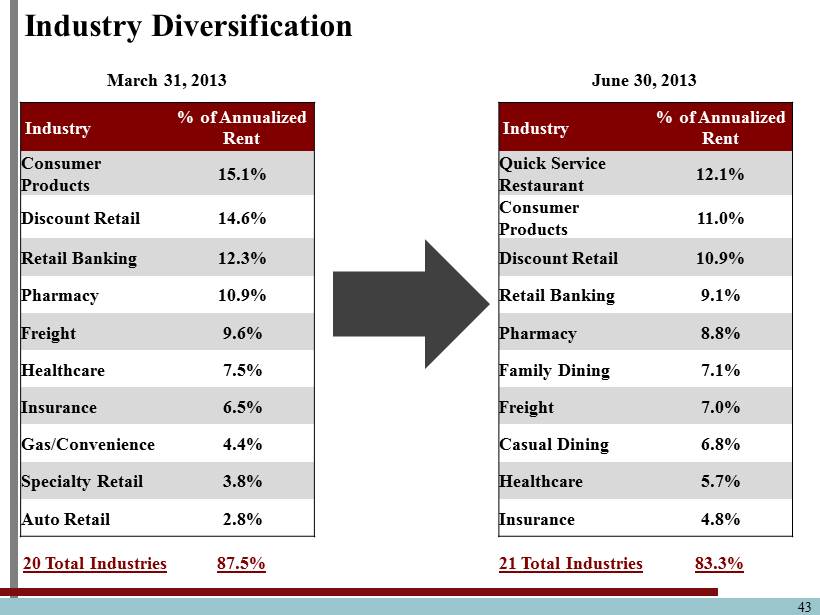
Industry Diversification 43 March 31, 2013 June 30, 2013 Industry % of Annualized Rent Industry % of Annualized Rent Consumer Products 15.1% Quick Service Restaurant 12.1% Discount Retail 14.6% Consumer Products 11.0% Retail Banking 12.3% Discount Retail 10.9% Pharmacy 10.9% Retail Banking 9.1% Freight 9.6% Pharmacy 8.8% Healthcare 7.5% Family Dining 7.1% Insurance 6.5% Freight 7.0% Gas/Convenience 4.4% Casual Dining 6.8% Specialty Retail 3.8% Healthcare 5.7% Auto Retail 2.8% Insurance 4.8% 20 Total Industries 87.5% 21 Total Industries 83.3%

Industry Diversification 44 June 30, 2013 June 30, 2013 + ARCT IV + LSE Industry % of Annualized Rent Industry % of Annualized Rent Quick Service Restaurant 12.1% Quick Service Restaurant 15.4% Consumer Products 11.0% Discount Retail 8.6% Discount Retail 10.9% Casual Dining 8.1% Retail Banking 9.1% Consumer Products 7.5% Pharmacy 8.8% Retail Banking 6.7% Family Dining 7.1% Insurance 5.6% Freight 7.0% Specialty Retail 5.5% Casual Dining 6.8% Family Dining 5.4% Healthcare 5.7% Pharmacy 4.5% Insurance 4.8% Government Services 4.5% 21 Total Industries 83.3% 34 Total Industries 71.8% Includes acquisitions with executed purchase and sale agreements or signed letter of intents.
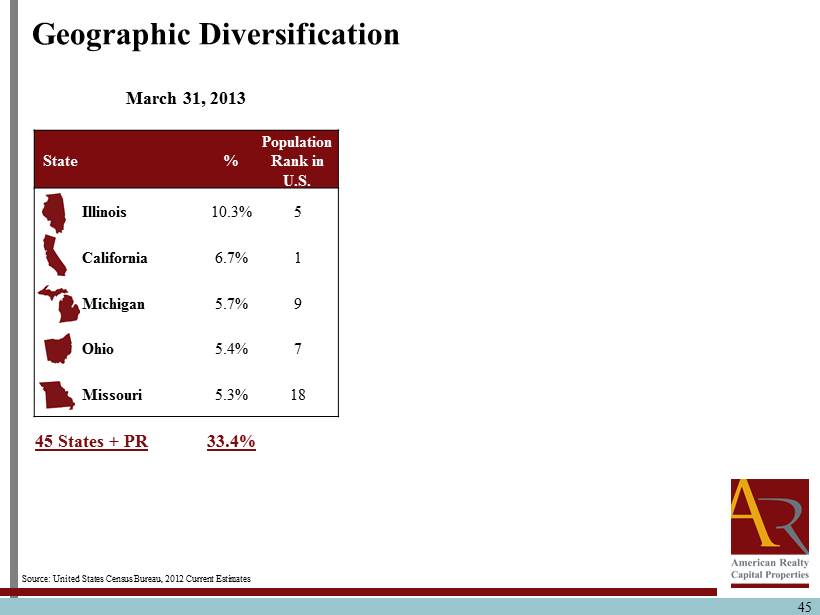
45 Geographic Diversification March 31, 2013 State % Population Rank in U.S. Illinois 10.3% 5 California 6.7% 1 Michigan 5.7% 9 Ohio 5.4% 7 Missouri 5.3% 18 45 States + PR 33.4% Source: United States Census Bureau, 2012 Current Estimates
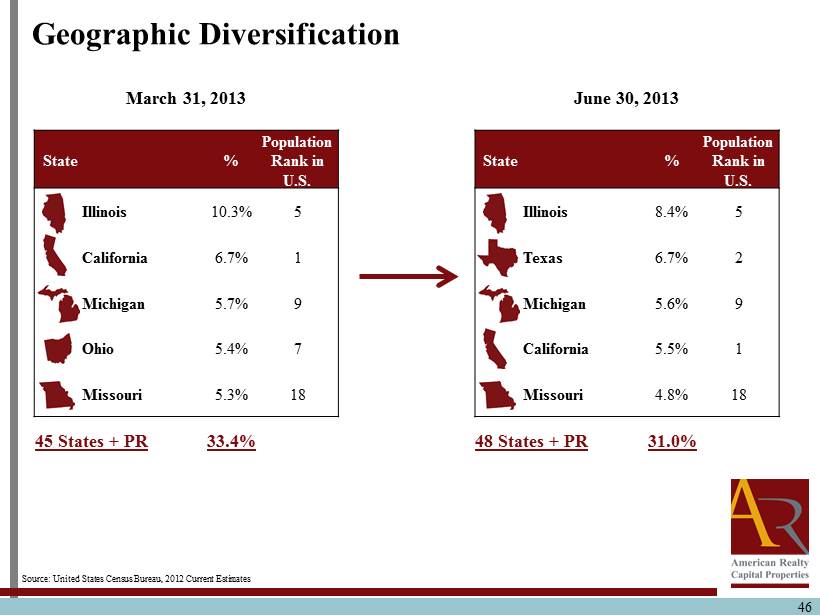
46 Source: United States Census Bureau, 2012 Current Estimates March 31, 2013 State % Population Rank in U.S. Illinois 10.3% 5 California 6.7% 1 Michigan 5.7% 9 Ohio 5.4% 7 Missouri 5.3% 18 45 States + PR 33.4% June 30, 2013 State % Population Rank in U.S. Illinois 8.4% 5 Texas 6.7% 2 Michigan 5.6% 9 California 5.5% 1 Missouri 4.8% 18 48 States + PR 31.0% Geographic Diversification
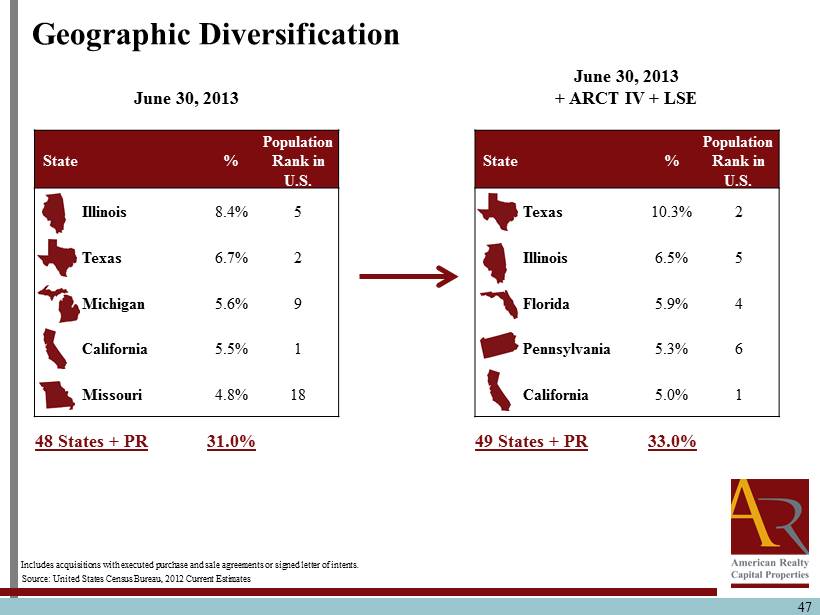
47 Source: United States Census Bureau, 2012 Current Estimates June 30, 2013 + ARCT IV + LSE State % Population Rank in U.S. Texas 10.3% 2 Illinois 6.5% 5 Florida 5.9% 4 Pennsylvania 5.3% 6 California 5.0% 1 49 States + PR 33.0% June 30, 2013 State % Population Rank in U.S. Illinois 8.4% 5 Texas 6.7% 2 Michigan 5.6% 9 California 5.5% 1 Missouri 4.8% 18 48 States + PR 31.0% Geographic Diversification Includes acquisitions with executed purchase and sale agreements or signed letter of intents.
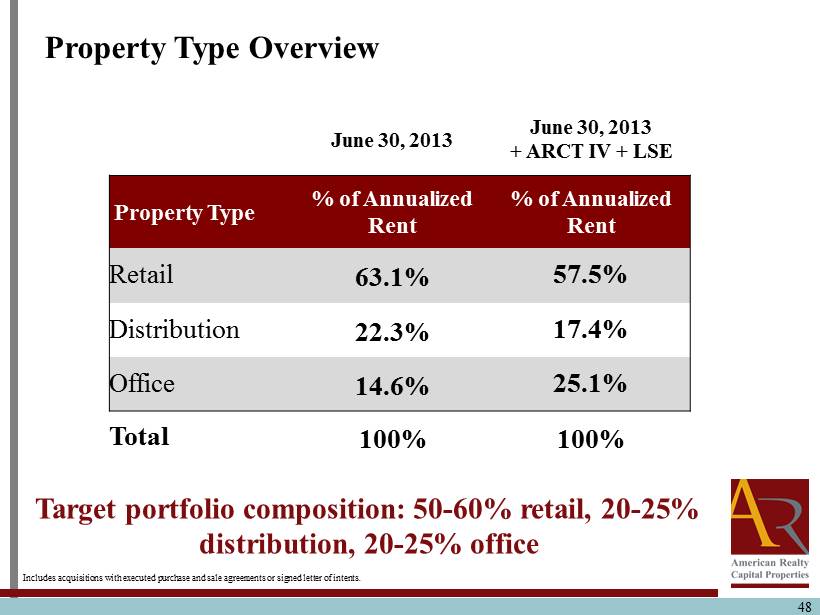
48 Property Type Overview June 30, 2013 June 30, 2013 + ARCT IV + LSE Property Type % of Annualized Rent % of Annualized Rent Retail 63.1% 57.5% Distribution 22.3% 17.4% Office 14.6% 25.1% Total 100% 100% Target portfolio composition: 50 - 60% retail, 20 - 25% distribution, 20 - 25 % office Includes acquisitions with executed purchase and sale agreements or signed letter of intents.
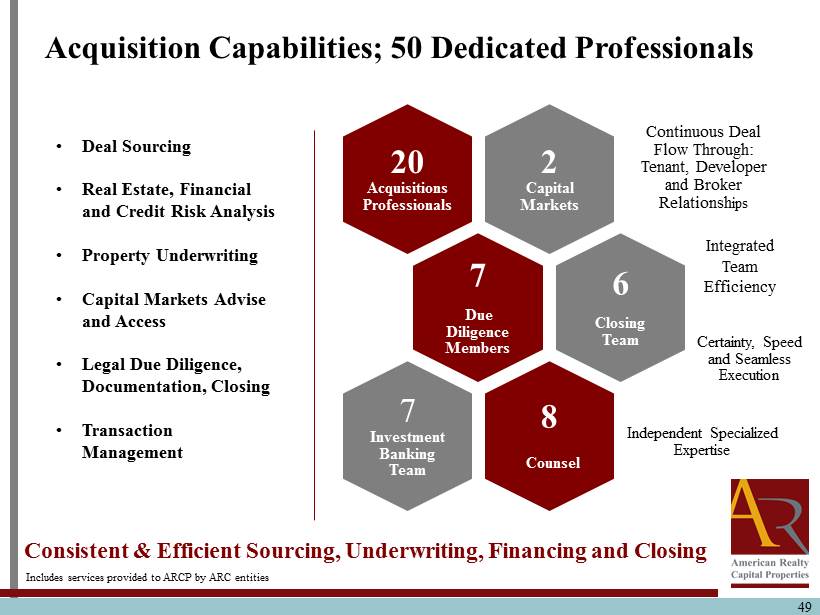
49 Acquisition Capabilities; 50 Dedicated Professionals 2 Capital Markets Continuous Deal Flow Through: Tenant, Developer and Broker Relationsh ips 20 Acquisitions Professionals 7 Due Diligence Members Certainty, Speed and Seamless Execution 6 Closing Team 8 Counsel Independent Specialized Expertise 7 Investment Banking Team Consistent & Efficient Sourcing, Underwriting , Financing and Closing • Deal Sourcing • Real Estate, Financial and Credit Risk Analysis • Property Underwriting • Capital Markets Advise and Access • Legal Due Diligence, Documentation, Closing • Transaction Management Integrated Team Efficiency Includes services provided to ARCP by ARC entities
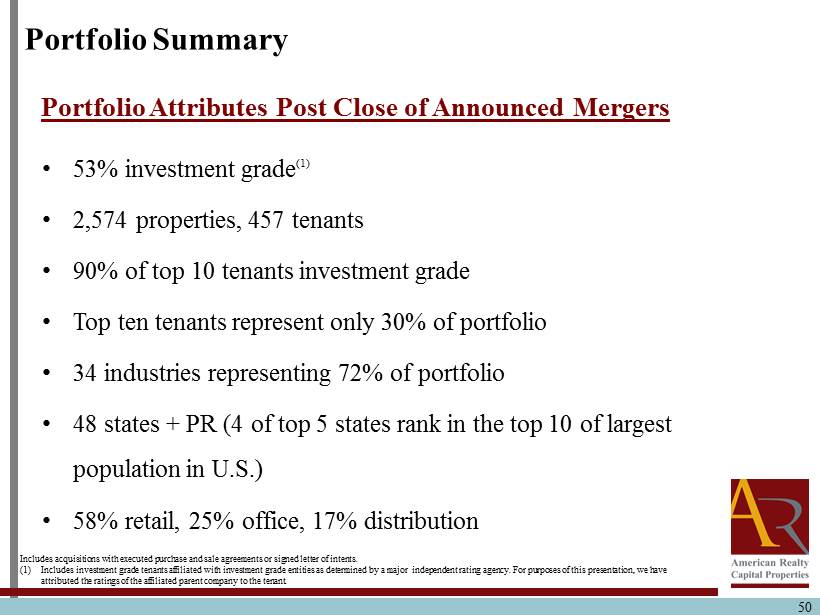
Portfolio Summary • 53% investment grade (1) • 2,574 properties, 457 tenants • 90% of top 10 tenants investment grade • Top ten tenants represent only 30% of portfolio • 34 industries representing 72% of portfolio • 48 states + PR (4 of top 5 states rank in the top 10 of largest population in U.S.) • 58% retail, 25% office, 17% distribution Portfolio Attributes Post Close of Announced Mergers 50 Includes acquisitions with executed purchase and sale agreements or signed letter of intents . (1) Includes investment grade tenants affiliated with investment grade entities as determined by a major independent rating agency. For p urp oses of this presentation, we have attributed the ratings of the affiliated parent company to the tenant.
Questions & Answers 51
Break 52

Underwriting, Due Diligence and Portfolio Diversification Brian D. Jones Chief Operating Officer 53
54 Investment Approach Four Important Elements That Point to the Right Single - Tenant Asset Location
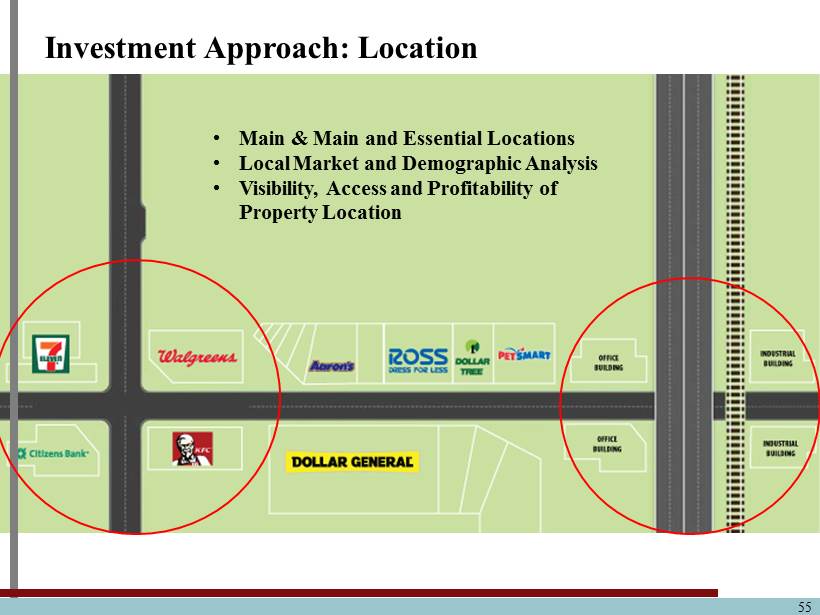
55 Investment Approach: Location • Main & Main and Essential Locations • Local Market and Demographic Analysis • Visibility, Access and Profitability of Property Location
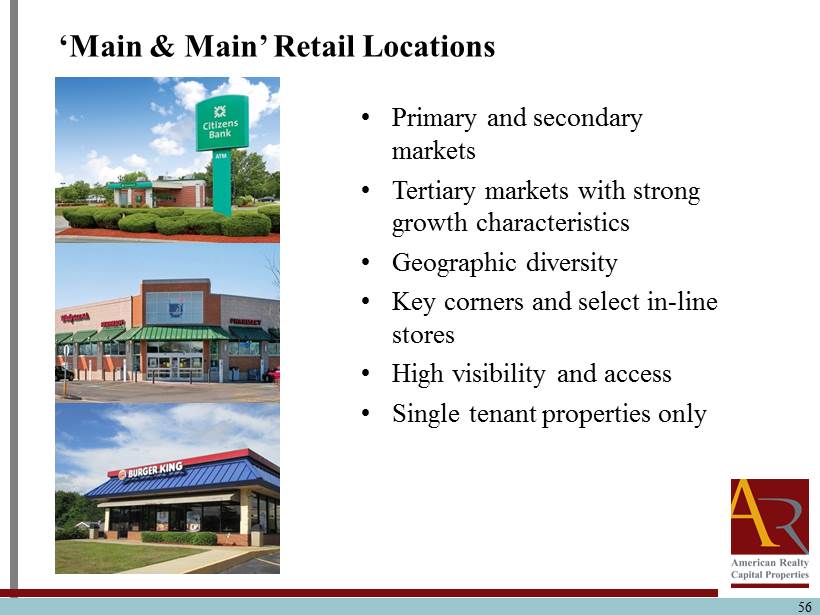
• Primary and s econdary markets • Tertiary markets with strong growth characteristics • Geographic diversity • Key corners and select in - line stores • High visibility and access • Single tenant properties only ‘Main & Main’ Retail Locations 56
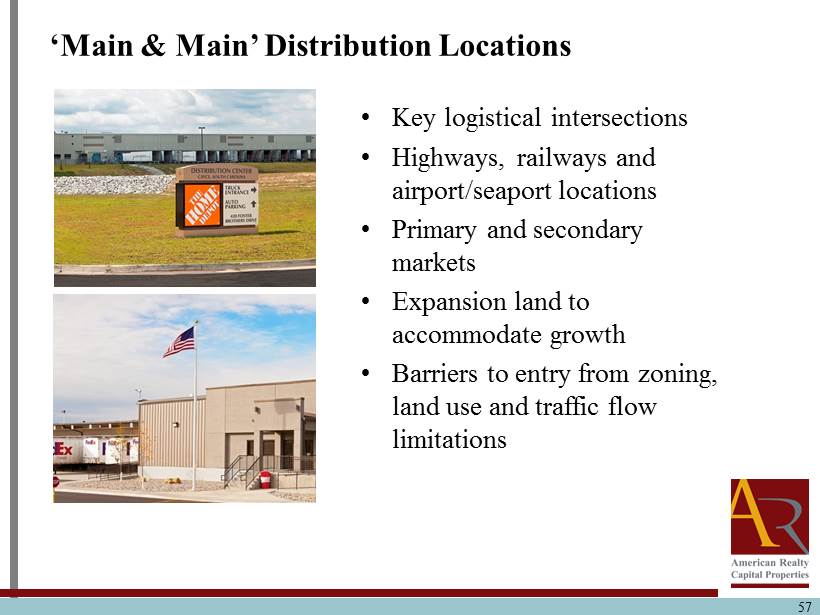
• Key logistical intersections • Highways, railways and airport /seaport locations • Primary and secondary markets • Expansion land to accommodate growth • Barriers to entry from zoning, land use and traffic flow limitations ‘Main & Main’ Distribution Locations 57
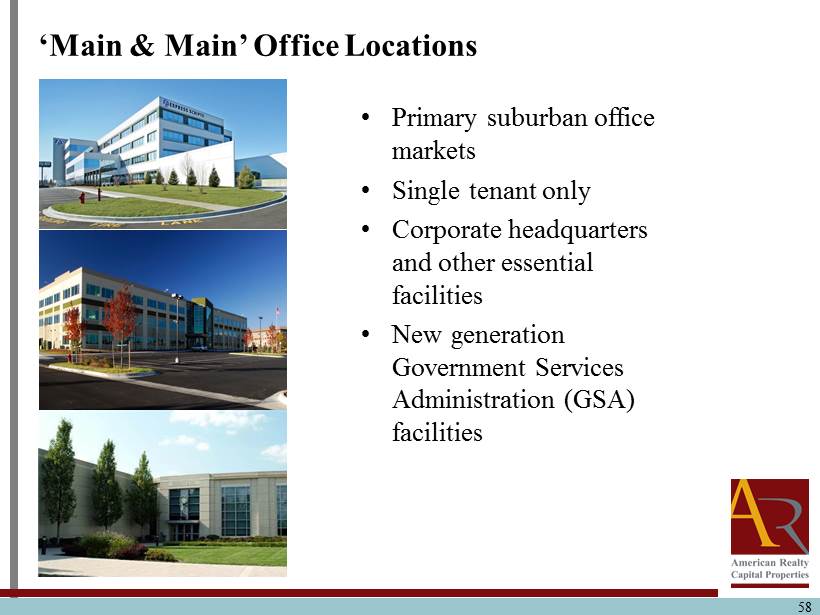
• Primary suburban office markets • Single tenant only • Corporate headquarters and other essential facilities • New generation Government Services Administration (GSA) facilities ‘Main & Main’ Office Locations 58
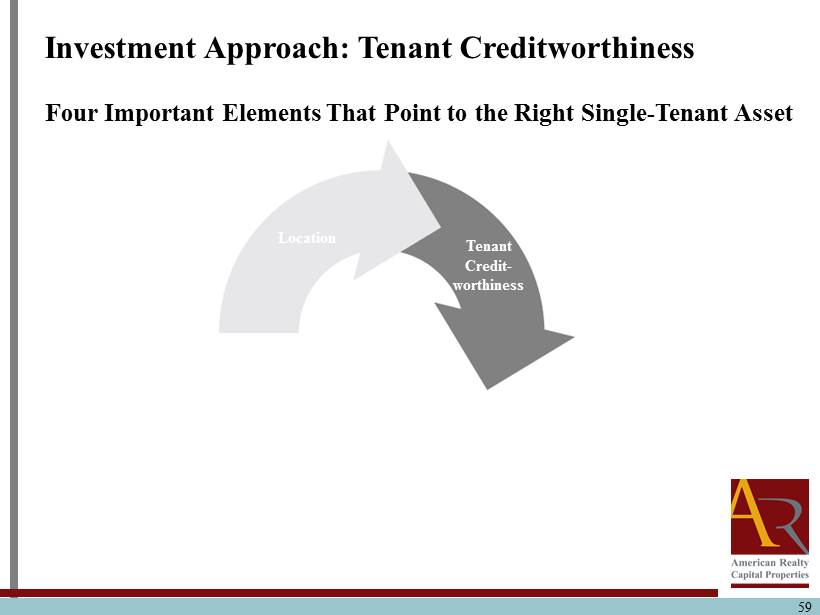
59 Investment Approach: Tenant Creditworthiness Four Important Elements That Point to the Right Single - Tenant Asset Tenant Credit - worthiness Location
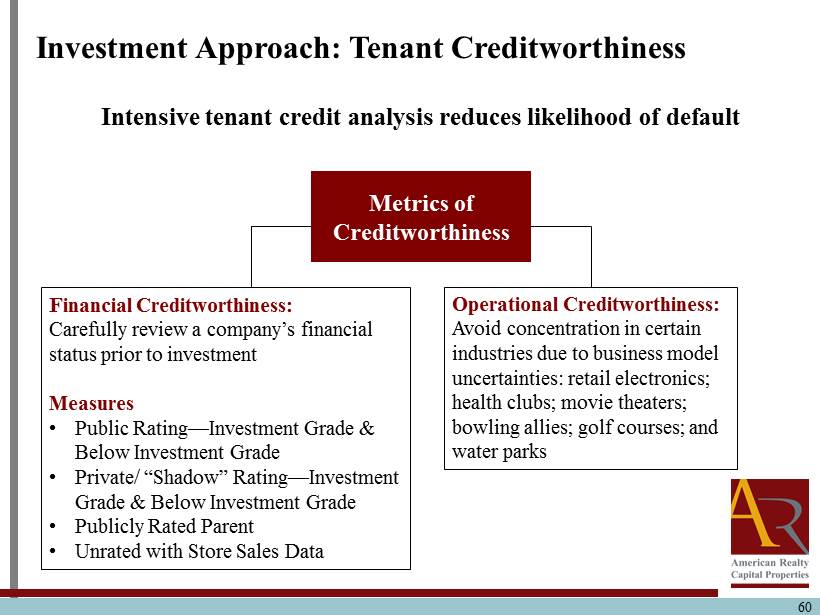
Intensive tenant credit analysis reduces likelihood of default Investment Approach: Tenant Creditworthiness 60 Metrics of Creditworthiness Operational Creditworthiness: Avoid concentration in certain industries due to business model uncertainties: retail electronics; health clubs; movie theaters; bowling allies; golf courses; and water parks Financial Creditworthiness: Carefully review a company’s financial status prior to investment Measures • Public Rating — Investment Grade & Below Investment Grade • Private/ “Shadow” Rating — Investment Grade & Below Investment Grade • Publicly Rated Parent • Unrated with Store Sales Data
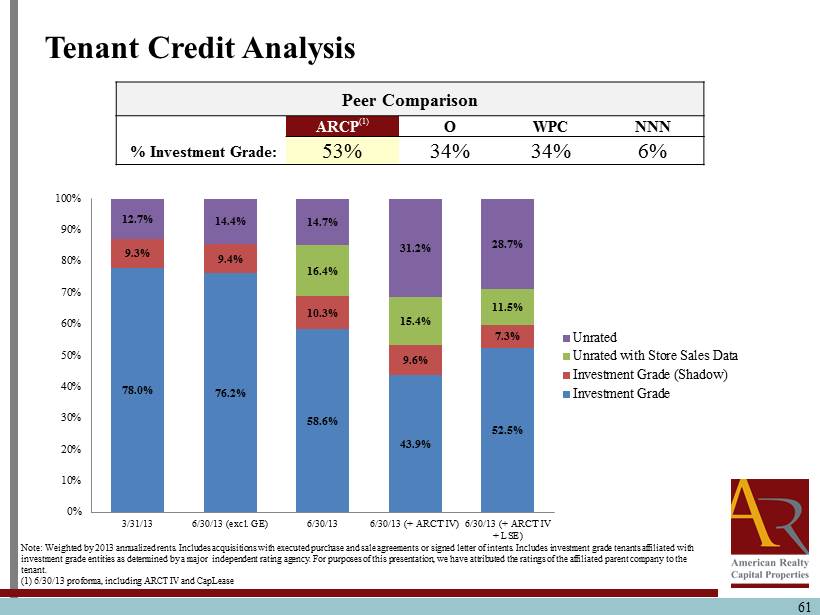
61 Tenant Credit Analysis Note: Weighted by 2013 annualized rents. Includes acquisitions with executed purchase and sale agreements or signed letter of intents. Includes investment grade tenan ts affiliated with investment grade entities as determined by a major independent rating agency. For purposes of this presentation, we have att rib uted the ratings of the affiliated parent company to the tenant . (1) 6/30/13 pro forma, including ARCT IV and CapLease 78.0% 76.2% 58.6% 43.9% 52.5% 9.3% 9.4% 10.3% 9.6% 7.3% 16.4% 15.4% 11.5% 12.7% 14.4% 14.7% 31.2% 28.7% 0% 10% 20% 30% 40% 50% 60% 70% 80% 90% 100% 3/31/13 6/30/13 (excl. GE) 6/30/13 6/30/13 (+ ARCT IV) 6/30/13 (+ ARCT IV + LSE) Unrated Unrated with Store Sales Data Investment Grade (Shadow) Investment Grade Peer Comparison ARCP (1) O WPC NNN % Investment Grade: 53% 34% 34% 6%
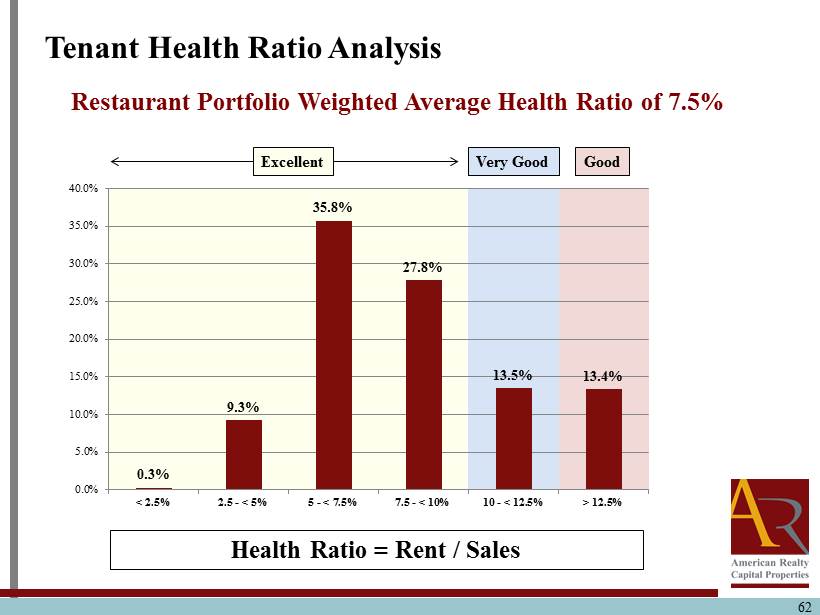
0.3% 9.3% 35.8% 27.8% 13.5% 13.4% 0.0% 5.0% 10.0% 15.0% 20.0% 25.0% 30.0% 35.0% 40.0% < 2.5% 2.5 - < 5% 5 - < 7.5% 7.5 - < 10% 10 - < 12.5% > 12.5% 62 Tenant Health Ratio Analysis Health Ratio = Rent / Sales Restaurant Portfolio W eighted Average Health Ratio of 7.5% Excellent Very Good Good
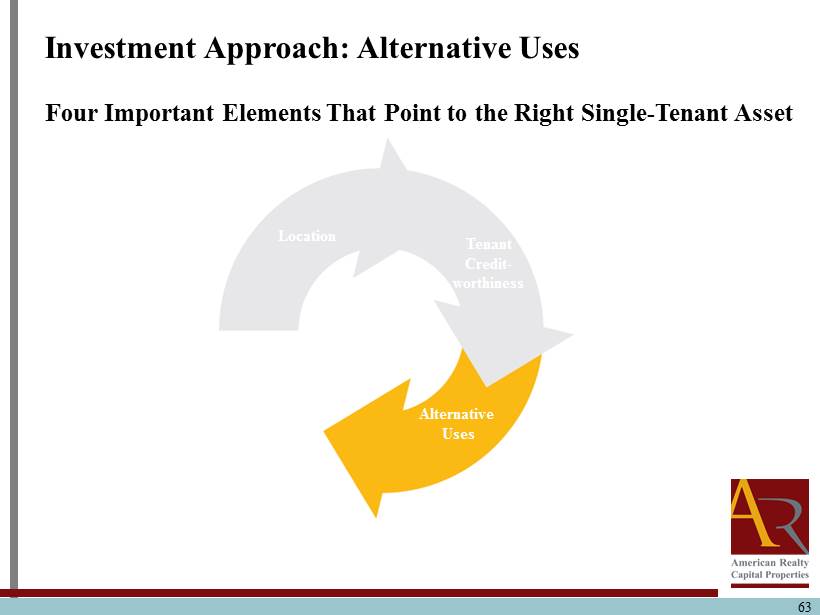
63 Investment Approach: Alternative Uses Four Important Elements That Point to the Right Single - Tenant Asset Tenant Credit - worthiness Location Alternative Uses
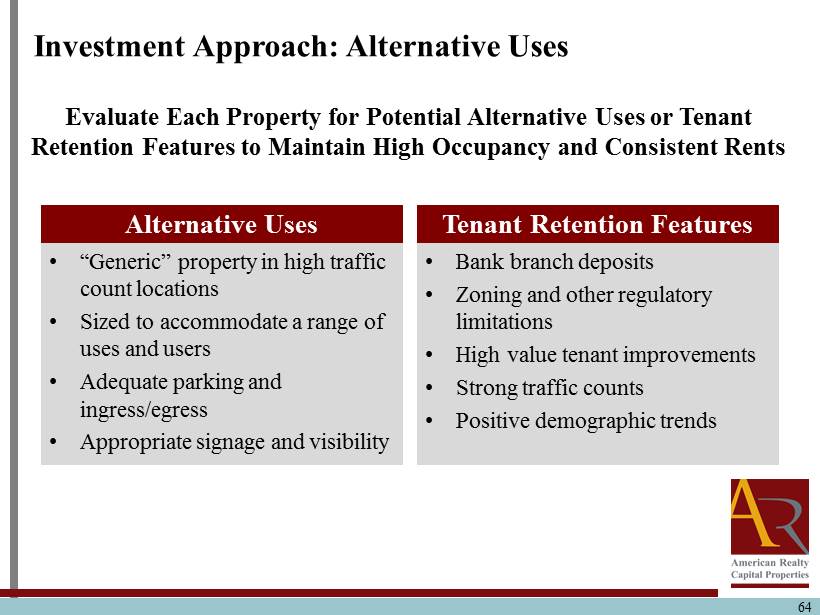
Evaluate Each Property for Potential Alternative Uses or Tenant Retention Features to Maintain High Occupancy and Consistent Rents • “Generic” property in high traffic count locations • Sized to accommodate a range of uses and users • Adequate parking and ingress/egress • Appropriate signage and visibility Tenant Retention Features • Bank branch deposits • Zoning and other regulatory limitations • High value tenant improvements • Strong traffic counts • Positive demographic trends Investment Approach: Alternative Uses Alternative Uses 64
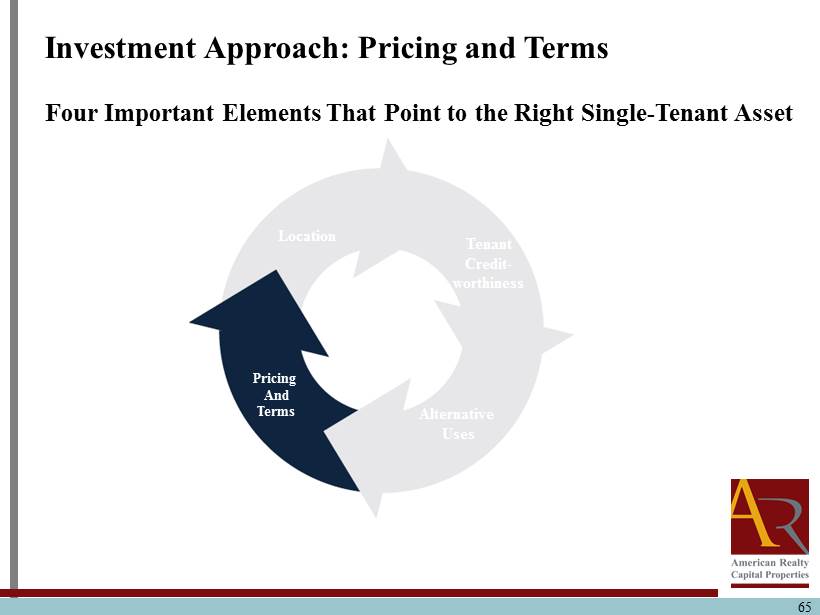
65 Investment Approach: Pricing and Terms Four Important Elements That Point to the Right Single - Tenant Asset Pricing And Terms Alternative Uses Tenant Credit - worthiness Location
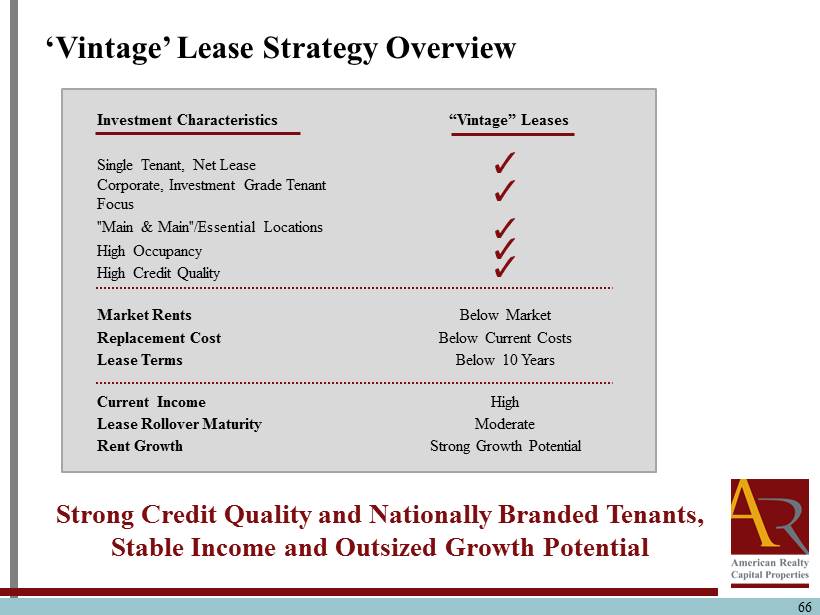
66 Strong Credit Quality and Nationally Branded Tenants, Stable Income and Outsized Growth Potential Single Tenant, Net Lease Corporate, Investment Grade Tenant Focus "Main & Main"/Essential Locations High Occupancy High Credit Quality Market Rents Below Market Replacement Cost Below Current Costs Lease Terms Below 10 Years Current Income High Lease Rollover Maturity Moderate Rent Growth Strong Growth Potential “Vintage” Leases Investment Characteristics ‘Vintage’ Lease Strategy Overview
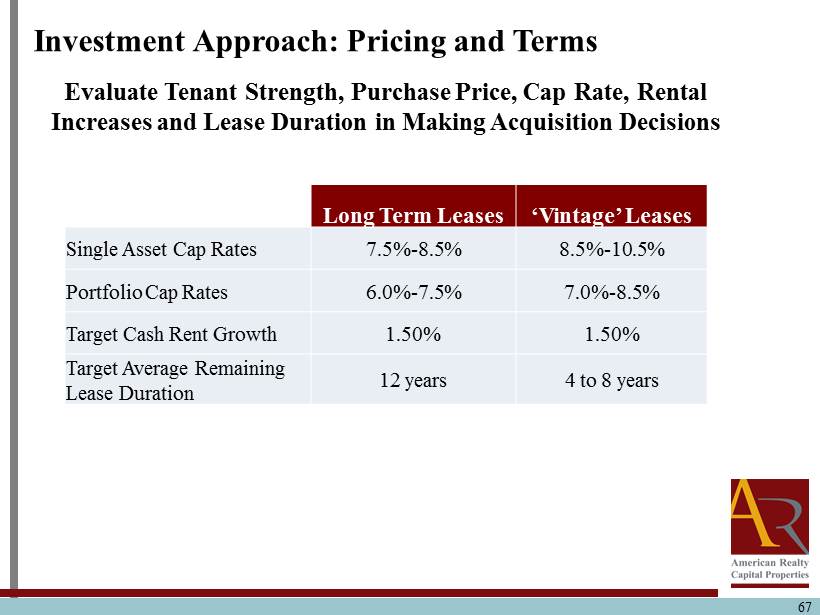
67 Investment Approach: Pricing and Terms Evaluate Tenant Strength, Purchase Price, Cap Rate, Rental Increases and Lease Duration in Making Acquisition Decisions Long Term Leases ‘Vintage’ Leases Single Asset Cap Rates 7.5% - 8.5% 8.5% - 10.5% Portfolio Cap Rates 6.0% - 7.5% 7.0% - 8.5% Target Cash Rent Growth 1.50% 1.50% Target Average Remaining Lease Duration 12 years 4 to 8 years
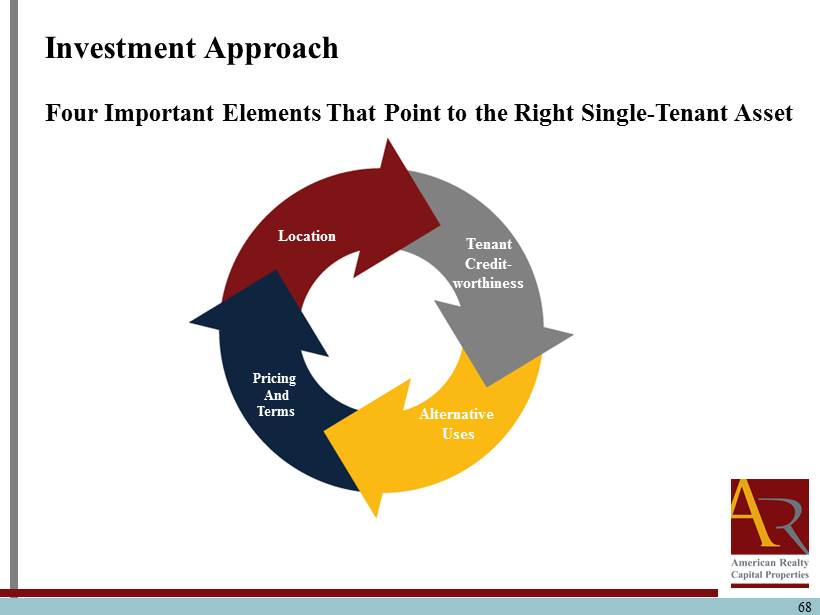
68 Investment Approach Four Important Elements That Point to the Right Single - Tenant Asset Pricing And Terms Alternative Uses Tenant Credit - worthiness Location
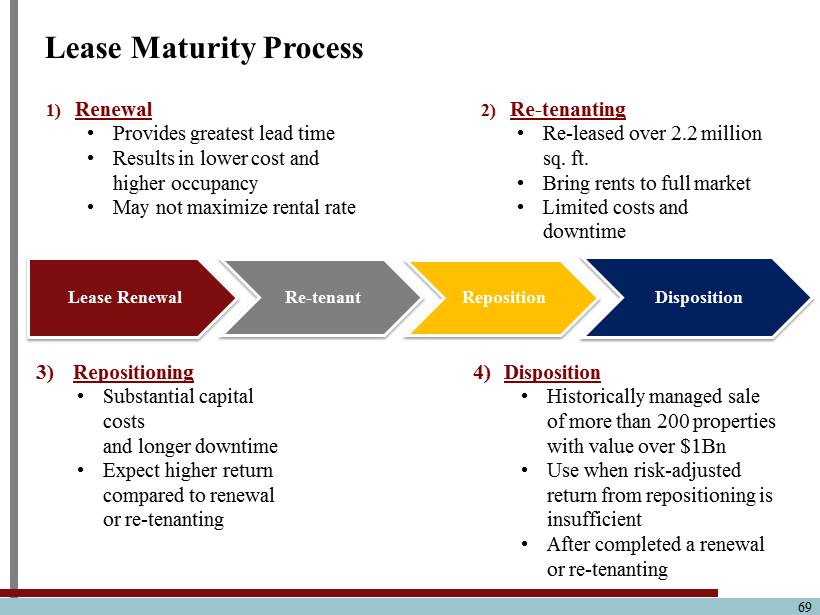
Lease Maturity Process 69 1) Renewal • Provides greatest lead time • Results in lower cost and higher occupancy • May not maximize rental rate 2) Re - tenanting • Re - leased over 2.2 million sq. ft. • Bring rents to full market • Limited costs and downtime 3) Repositioning • Substantial capital costs and longer downtime • Expect higher return compared to renewal or re - tenanting 4) Disposition • Historically managed sale of more than 200 properties with value over $1Bn • Use when risk - adjusted return from repositioning is insufficient • After completed a renewal or re - tenanting Lease Renewal Re - tenant Reposition Disposition
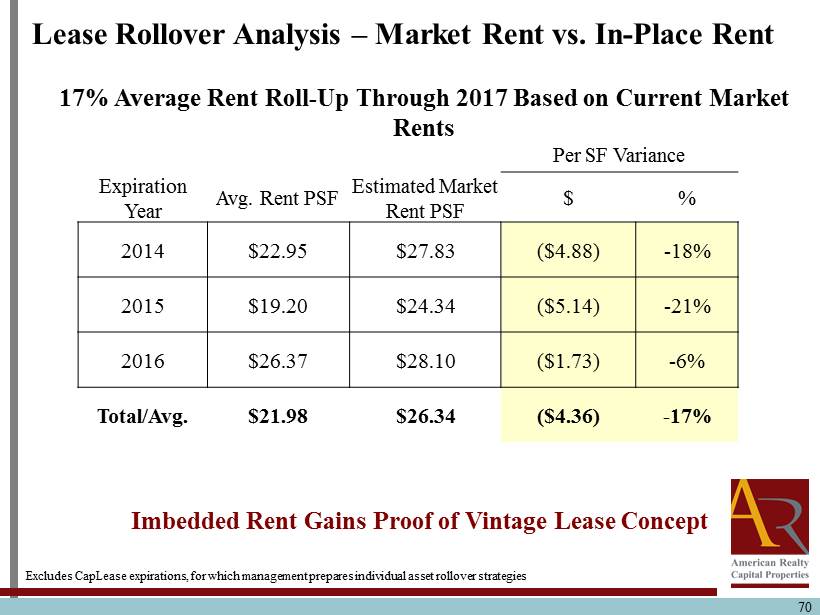
70 Lease Rollover Analysis – Market Rent vs. In - Place Rent Per SF Variance Expiration Year Avg. Rent PSF Estimated Market Rent PSF $ % 2014 $22.95 $27.83 ($4.88) - 18% 2015 $19.20 $24.34 ($5.14) - 21% 2016 $26.37 $28.10 ($1.73) - 6% Total/Avg. $21.98 $26.34 ($4.36) - 17% Excludes CapLease expirations, for which management prepares individual asset rollover strategies 17% Average Rent Roll - Up Through 2017 Based on Current Market Rents Imbedded Rent Gains Proof of Vintage Lease Concept
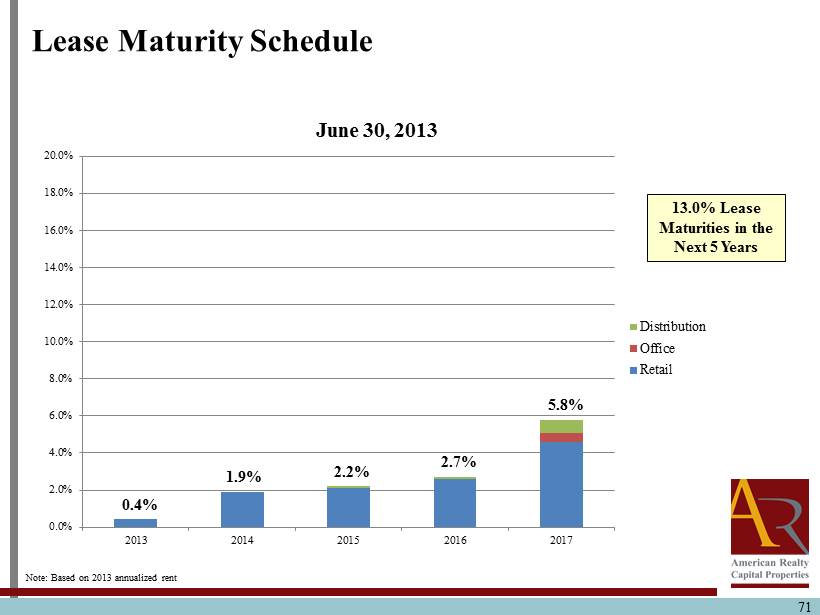
0.0% 2.0% 4.0% 6.0% 8.0% 10.0% 12.0% 14.0% 16.0% 18.0% 20.0% 2013 2014 2015 2016 2017 June 30, 2013 Distribution Office Retail 71 Note: Based on 2013 annualized rent Lease Maturity Schedule 1.9% 2.2% 2.7% 5.8% 0.4% 13.0% Lease Maturities in the Next 5 Years
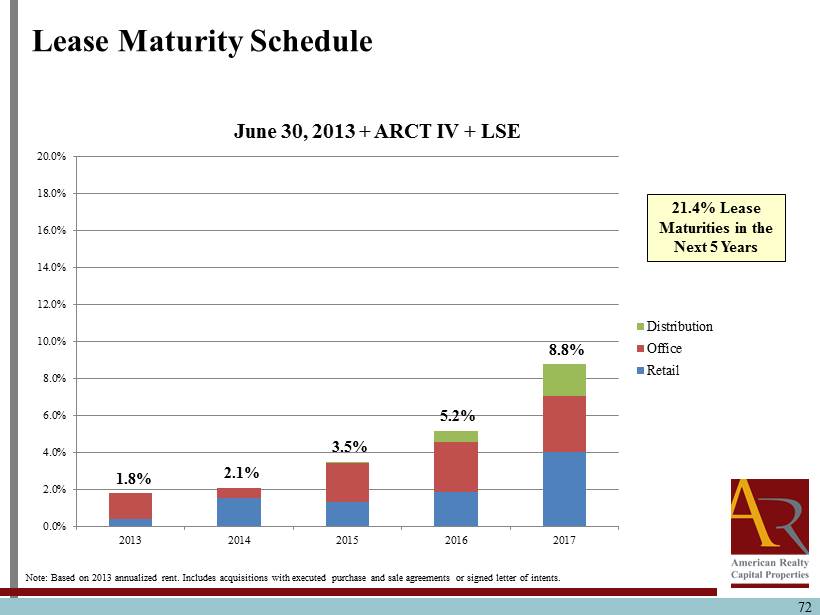
0.0% 2.0% 4.0% 6.0% 8.0% 10.0% 12.0% 14.0% 16.0% 18.0% 20.0% 2013 2014 2015 2016 2017 June 30, 2013 + ARCT IV + LSE Distribution Office Retail 72 Note: Based on 2013 annualized rent . Includes acquisitions with executed purchase and sale agreements or signed letter of intents. Lease Maturity Schedule 2.1% 3.5% 5.2% 8.8% 1.8% 21.4% Lease Maturities in the Next 5 Years
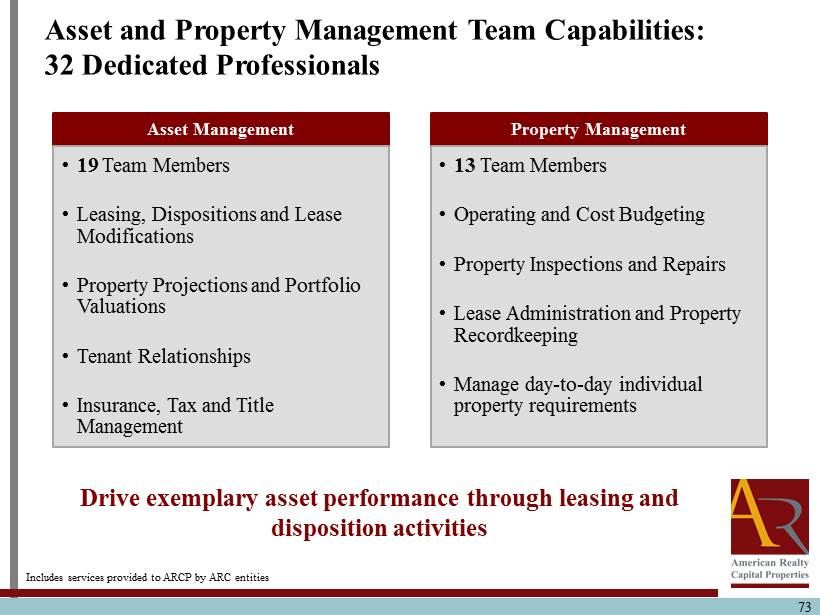
73 Asset and Property Management Team Capabilities: 32 Dedicated Professionals Asset Management • 19 Team Members • Leasing, Dispositions and Lease Modifications • Property Projections and Portfolio Valuations • Tenant Relationships • Insurance, Tax and Title Management Property Management • 13 Team Members • Operating and Cost Budgeting • Property Inspections and Repairs • Lease Administration and Property Recordkeeping • Manage day - to - day individual property requirements Drive exemplary asset performance through leasing and disposition activities Includes services provided to ARCP by ARC entities

Questions & Answers 74
Shareholder Value Creation: Internalization & Enterprise Building William M. Kahane Director 75
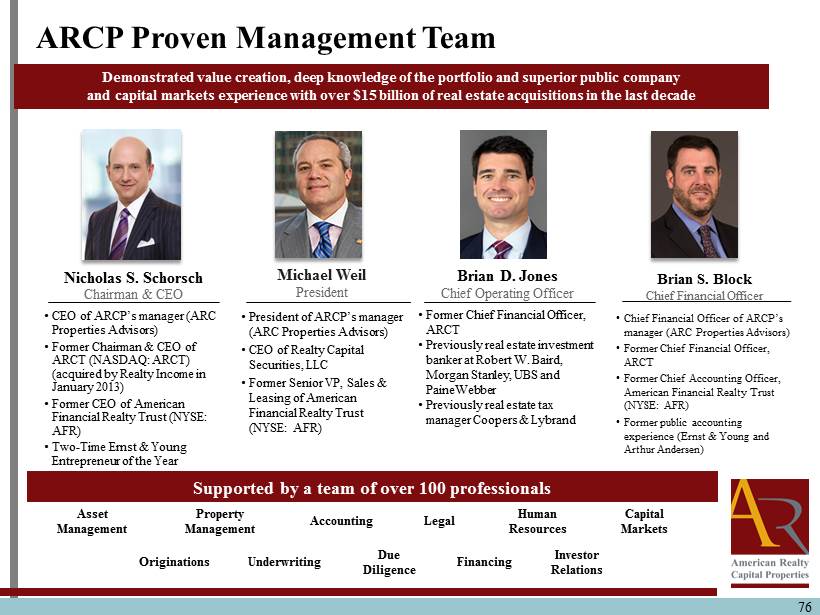
76 ARCP Proven Management Team Demonstrated value creation, deep knowledge of the portfolio and superior public company and capital markets experience with over $15 billion of real estate acquisitions in the last decade Supported by a team of over 100 professionals Asset Management Property Management Accounting Legal Human Resources Capital Markets Originations Underwriting Due Diligence Financing Investor Relations Nicholas S. Schorsch Chairman & CEO • CEO of ARCP’s manager (ARC Properties Advisors) • Former Chairman & CEO of ARCT (NASDAQ: ARCT) (acquired by Realty Income in January 2013) • Former CEO of American Financial Realty Trust (NYSE: AFR) • Two - Time Ernst & Young Entrepreneur of the Year Brian S. Block Chief Financial Officer • Chief Financial Officer of ARCP’s manager (ARC Properties Advisors ) • Former Chief Financial Officer, ARCT • Former Chief Accounting Officer, American Financial Realty Trust (NYSE: AFR) • Former public accounting experience (Ernst & Young and Arthur Andersen) Michael Weil President • President of ARCP’s manager (ARC Properties Advisors) • CEO of Realty Capital Securities, LLC • Former Senior VP, Sales & Leasing of American Financial Realty Trust (NYSE: AFR) Brian D. Jones Chief Operating Officer • Former Chief Financial Officer, ARCT • Previously real estate investment banker at Robert W. Baird, Morgan Stanley, UBS and PaineWebber • Previously real estate tax manager Coopers & Lybrand
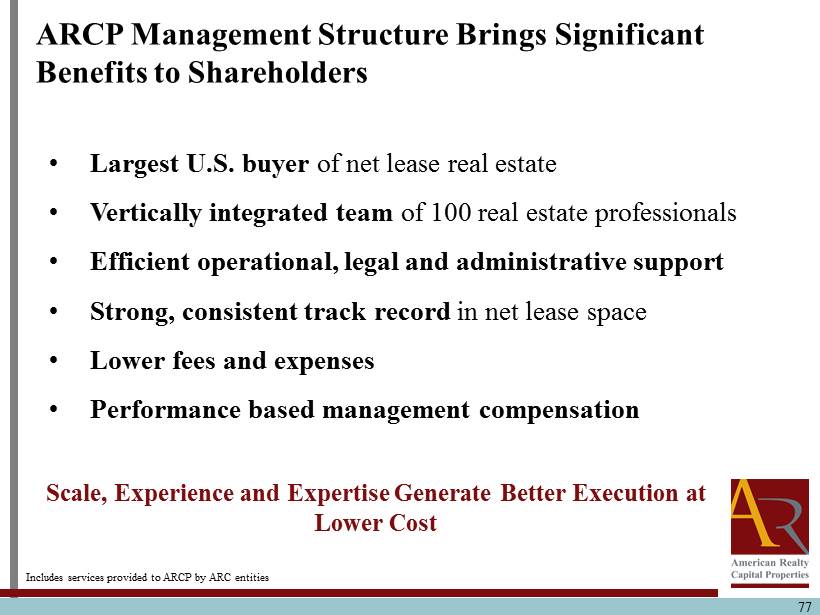
77 • Largest U.S. buyer of net lease real estate • Vertically integrated team of 100 real estate professionals • Efficient operational, legal and administrative support • Strong, consistent track record in net lease space • Lower fees and expenses • Performance based management compensation Scale, Experience and Expertise Generate Better Execution at Lower Cost ARCP Management Structure Brings Significant Benefits to Shareholders Includes services provided to ARCP by ARC entities
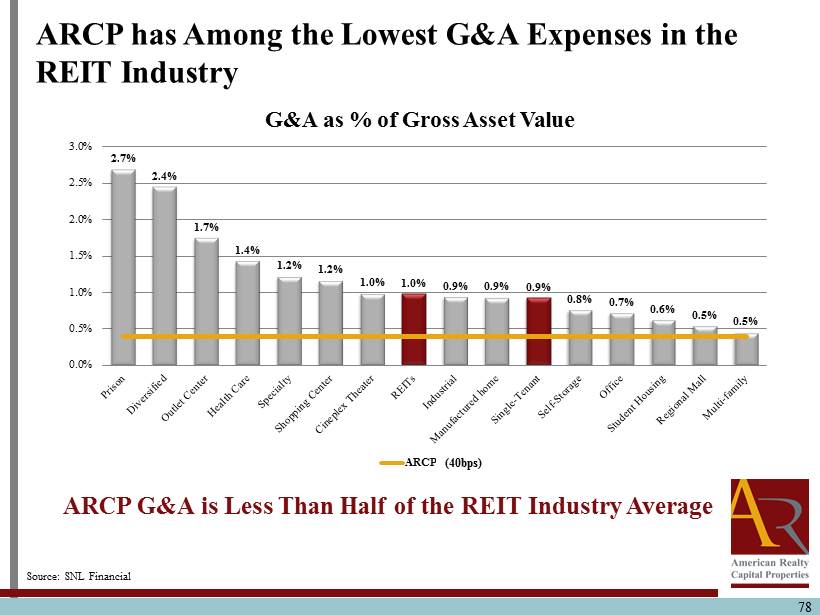
78 ARCP G&A is Less Than Half of the REIT Industry Average Source: SNL Financial 2.7% 2.4% 1.7% 1.4% 1.2% 1.2% 1.0% 1.0% 0.9% 0.9% 0.9% 0.8% 0.7% 0.6% 0.5% 0.5% 0.0% 0.5% 1.0% 1.5% 2.0% 2.5% 3.0% G&A as % of Gross Asset Value ARCP (3bp) (40bps) ARCP has Among the Lowest G&A Expenses in the REIT Industry
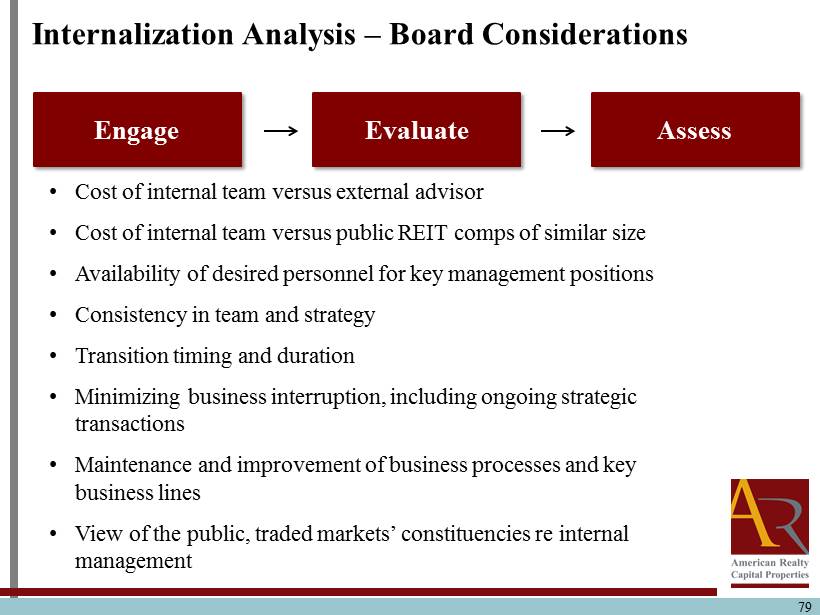
79 Internalization Analysis – Board Considerations • Cost of internal team versus external advisor • Cost of internal team versus public REIT comps of similar size • Availability of desired personnel for key management positions • Consistency in team and strategy • Transition timing and duration • Minimizing business interruption, including ongoing strategic transactions • Maintenance and improvement of business processes and key business lines • View of the public, traded markets’ constituencies re internal management Engage Evaluate Assess

Questions & Answers 80
Shareholder Value Creation: Opportunities & Initiatives Nicholas S. Schorsch Chairman & CEO 81
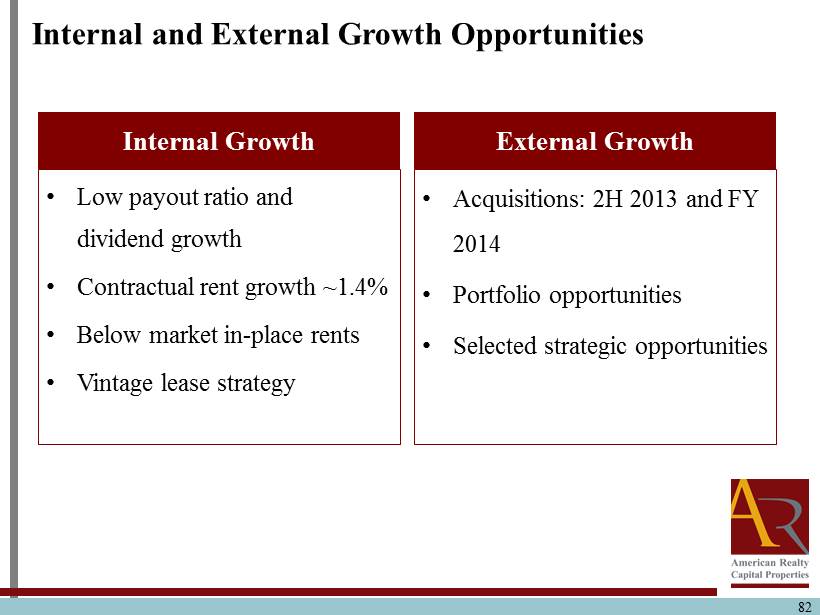
82 Internal and External Growth Opportunities Internal Growth • Low payout ratio and dividend growth • Contractual rent growth ~1.4 % • Below market in - place rents • Vintage lease strategy External Growth • Acquisitions: 2H 2013 and FY 2014 • Portfolio opportunities • Selected strategic opportunities
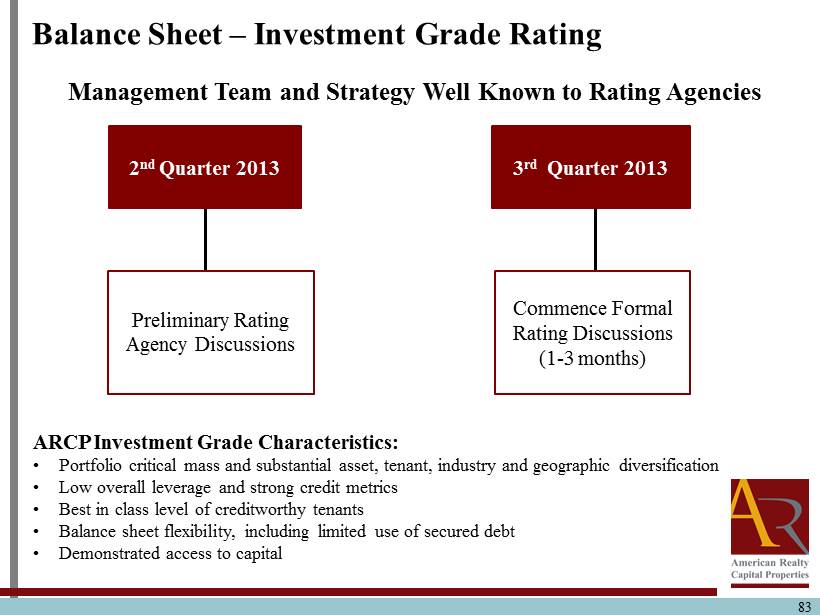
83 Balance Sheet – Investment Grade Rating ARCP Investment Grade Characteristics: • Portfolio critical mass and substantial asset, tenant, industry and geographic diversification • Low overall leverage and strong credit metrics • Best in class level of creditworthy tenants • Balance sheet flexibility, including limited use of secured debt • Demonstrated access to capital Management Team and Strategy Well Known to Rating Agencies Preliminary Rating Agency Discussions Commence Formal Rating Discussions (1 - 3 months) 2 nd Quarter 2013 3 rd Quarter 2013
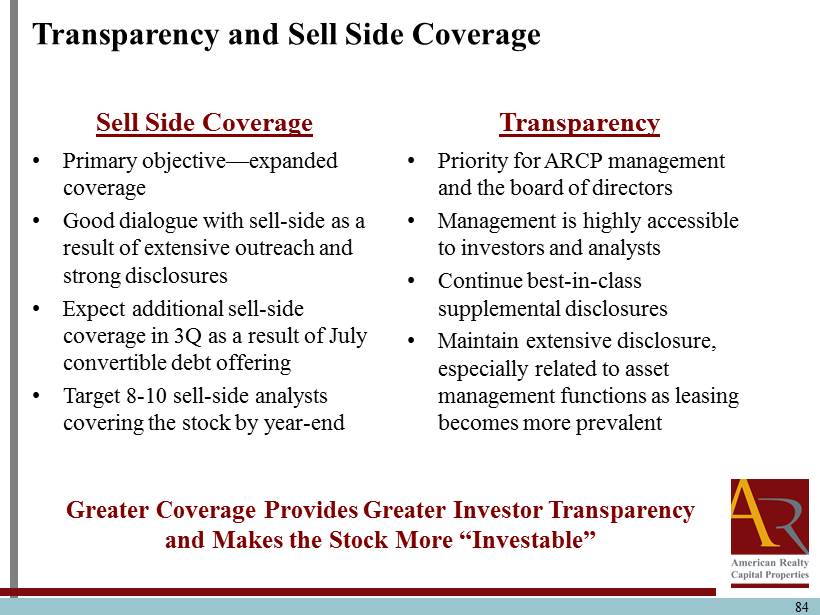
84 Transparency and Sell Side Coverage Sell Side Coverage • Primary objective — expanded coverage • Good dialogue with sell - side as a result of extensive outreach and strong disclosures • Expect additional sell - side coverage in 3Q as a result of July convertible debt offering • Target 8 - 10 sell - side analysts covering the stock by year - end Transparency • Priority for ARCP management and the board of directors • Management is highly accessible to investors and analysts • Continue best - in - class supplemental disclosures • Maintain extensive disclosure, especially related to asset management functions as leasing becomes more prevalent Greater Coverage Provides Greater Investor Transparency and Makes the Stock More “Investable”
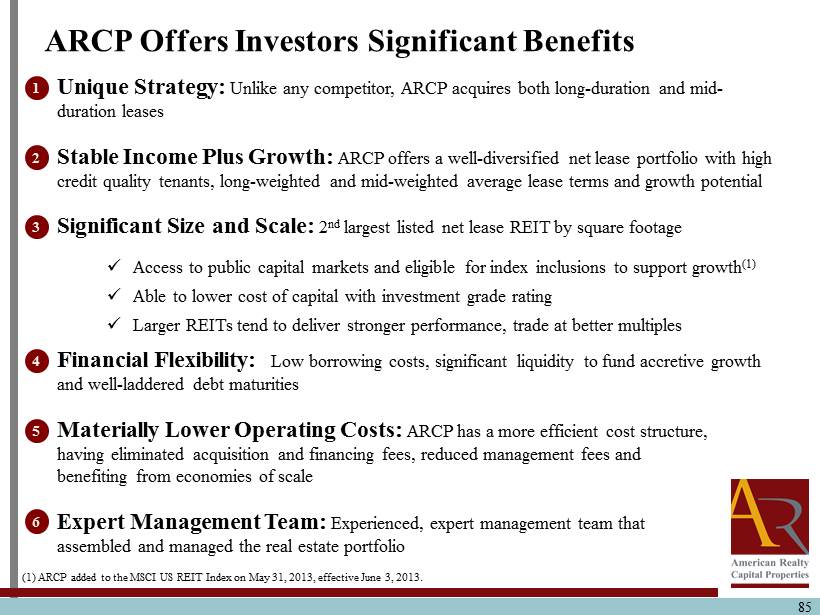
85 ARCP Offers Investors Significant Benefits Unique Strategy: Unlike any competitor, ARCP acquires both long - duration and mid - duration leases Stable Income Plus Growth: ARCP offers a well - diversified net lease portfolio with high credit quality tenants, long - weighted and mid - weighted average lease terms and growth potential Significant Size and Scale: 2 nd largest listed net lease REIT by square footage x Access to public capital markets and eligible for index inclusions to support growth (1) x Able to lower cost of capital with investment grade rating x Larger REITs tend to deliver stronger performance, trade at better multiples Financial Flexibility: Low borrowing costs, significant liquidity to fund accretive growth and well - laddered debt maturities Materially Lower Operating Costs: ARCP has a more efficient cost structure, having eliminated acquisition and financing fees, reduced management fees and benefiting from economies of scale Expert Management Team: Experienced, expert management team that assembled and managed the real estate portfolio 1 2 3 4 5 6 (1 ) ARCP added to the MSCI US REIT Index on May 31, 2013, effective June 3, 2013.
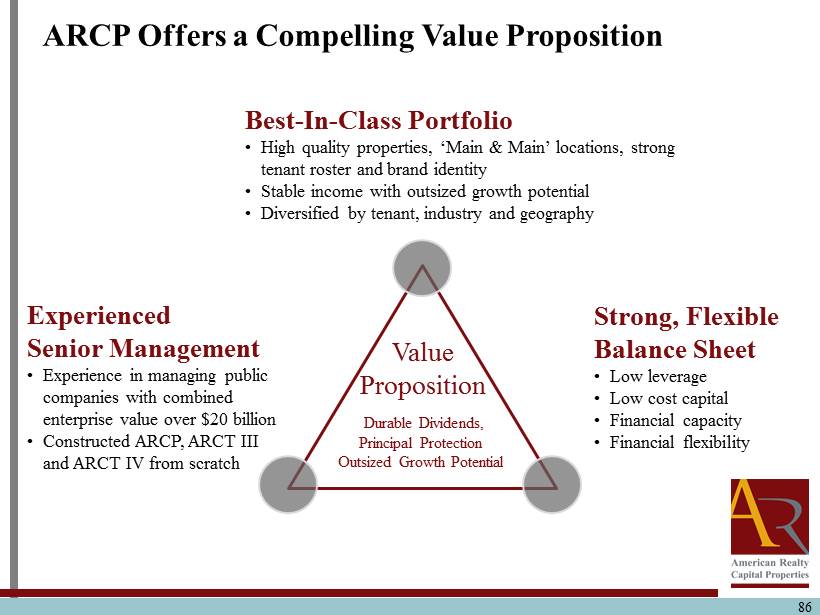
86 Experienced Senior Management • Experience in managing public companies with combined enterprise value over $20 billion • Constructed ARCP, ARCT III and ARCT IV from scratch Best - In - Class Portfolio • High quality properties, ‘Main & Main’ locations, strong tenant roster and brand identity • Stable income with outsized growth potential • Diversified by tenant, industry and geography Value Proposition Durable Dividends, Principal Protection Outsized Growth Potentia l Strong, Flexible Balance Sheet • Low leverage • Low cost capital • Financial capacity • Financial flexibility ARCP Offers a Compelling Value Proposition

Questions & Answers 87