|
| | |
| | |
| Q3 2016 SUPPLEMENTAL INFORMATION |
|
| |
| VEREIT Supplemental Information | |
| September 30, 2016 | |
|
| | |
| Section | Page | |
| | |
| Company Overview | |
| | |
| Financial Information | |
| Financial Summary | |
| Financial and Operations Statistics and Ratios | |
| Key Balance Sheet Metrics and Capital Structure | |
| Business Model | |
| Consolidated Balance Sheets | |
| Consolidated Statements of Operations | |
| Consolidated FFO and AFFO | | |
| Consolidated EBITDA and Normalized EBITDA | |
| | |
| Real Estate Investments | |
| Statements of Operations | |
| FFO and AFFO | |
| EBITDA and Normalized EBITDA | |
| Net Operating Income | |
| Same Store Contract Rental Revenue | |
| Debt and Preferred Equity Summary | |
| Mortgage Notes Payable | |
| Credit Facility and Corporate Bond Covenants | | |
| Development Projects and Dispositions | |
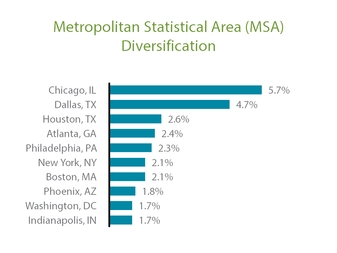
| Diversification Statistics | |
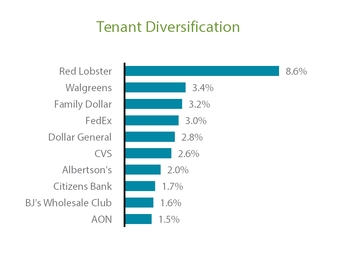
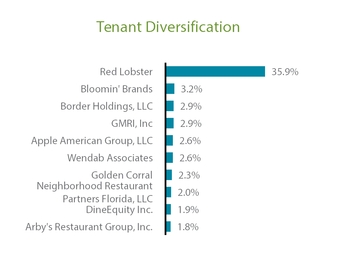
| Top 10 Concentrations | |
| Tenants Comprising Over 1% of Annualized Rental Revenue | |
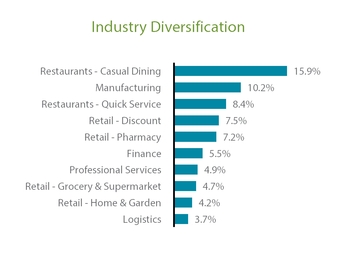
| Tenant Industry Diversification | |
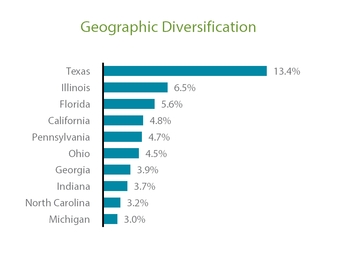
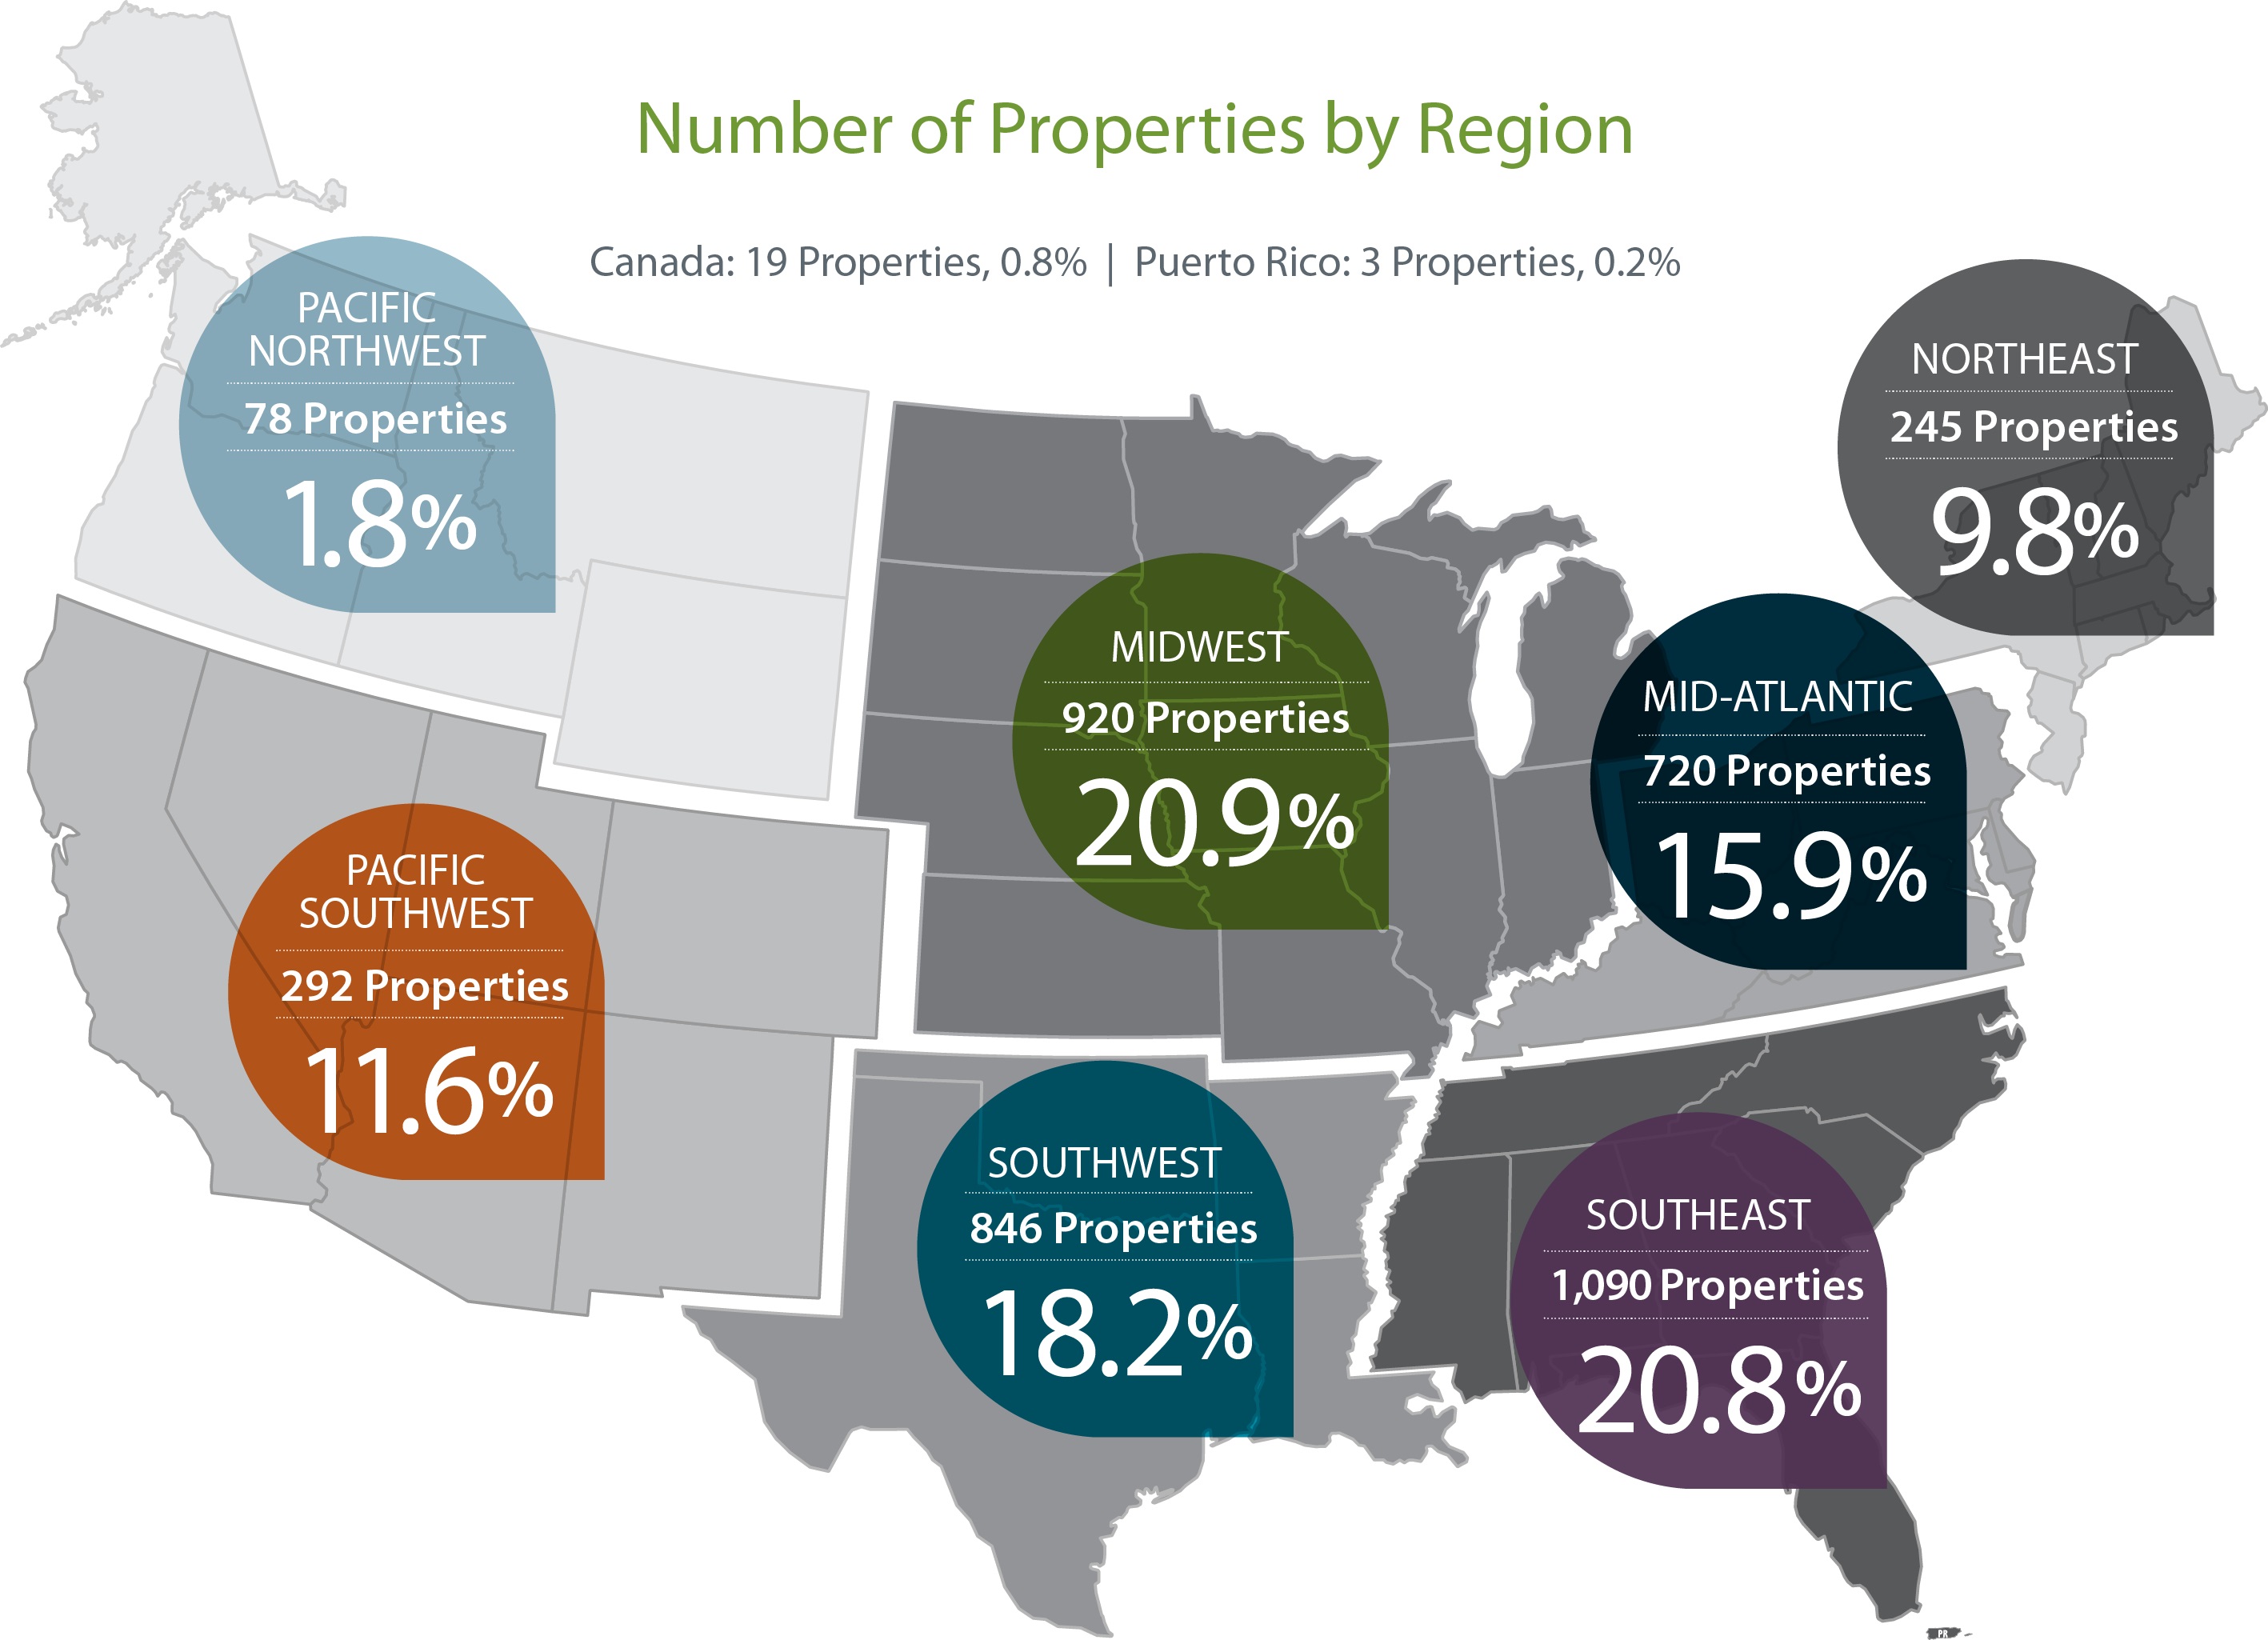
| Property Geographic Diversification | |
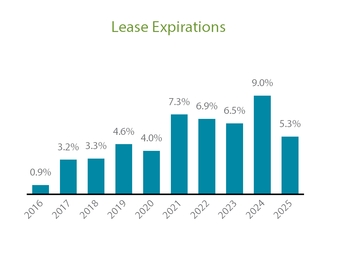
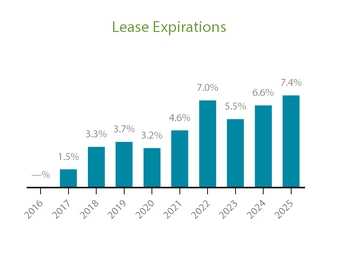
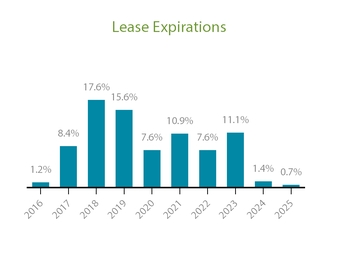
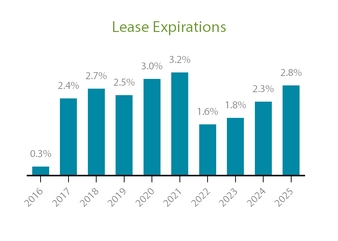
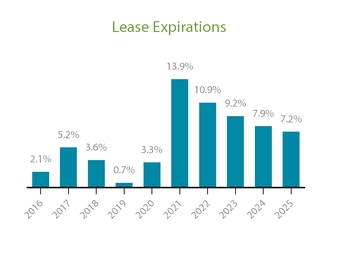
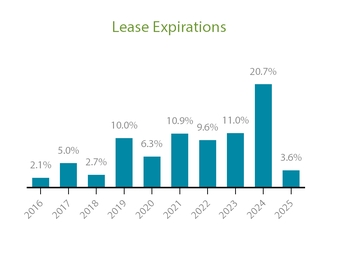
| Lease Expirations | |
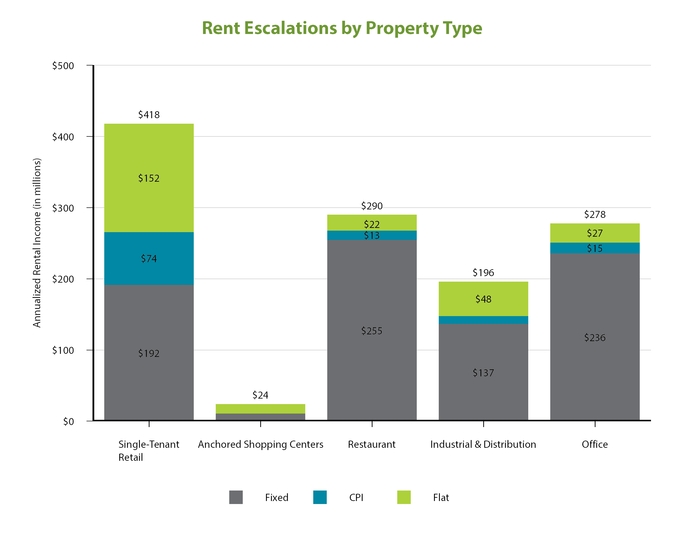
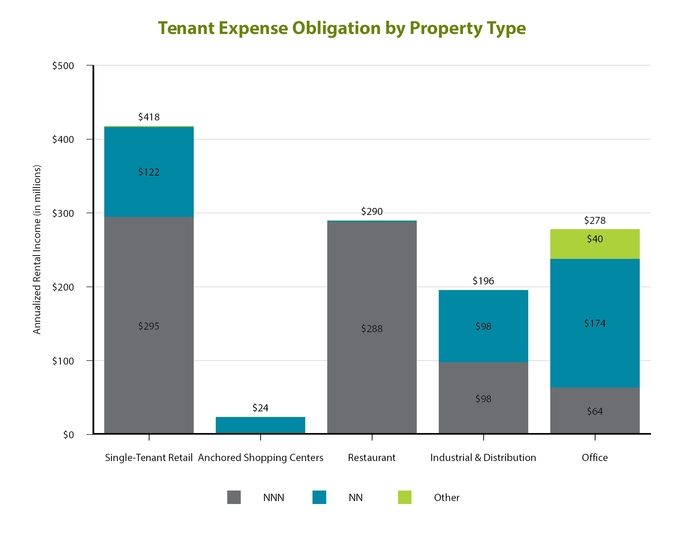
| Lease Summary | |
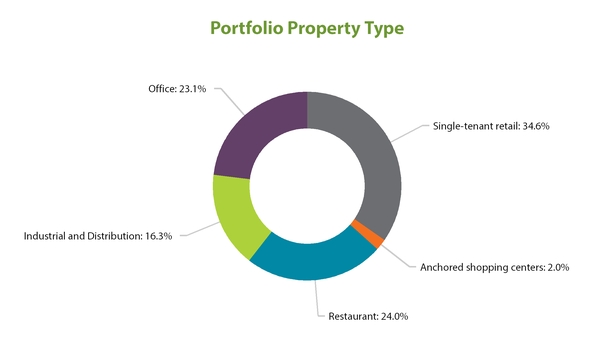
| Diversification by Property Type | |
| Unconsolidated Joint Venture Investment Summary | | |
| | |
| Cole Capital | |
| Statements of Operations | |
| FFO and AFFO | |
| EBITDA and Normalized EBITDA | |
| Net G&A | |
| Program Development Costs | |
| Cole REITs and Other Real Estate Programs | |
| Definitions | |
| | |
See the Definitions section for a description of the Company's non-GAAP and other financial measures.
|
| | |
| | |
| Q3 2016 SUPPLEMENTAL INFORMATION |
This data and other information described herein are as of and for the three months ended September 30, 2016, unless otherwise indicated. Future performance may not be consistent with past performance and is subject to change and inherent risks and uncertainties. Certain balances have been reclassified to conform with the current period’s presentation. This information should be read in conjunction with the financial statements and the Management's Discussion and Analysis of Financial Condition and Results of Operations sections contained in VEREIT Inc.'s (the "Company", "VEREIT", "us", "our" and "we") Annual Report on Form 10-K for the year ended December 31, 2015 and Quarterly Reports on Form 10-Q for the quarters ended September 30, 2016, June 30, 2016, March 31, 2016 and September 30, 2015.
Forward-Looking Statements
Information set forth herein (including information included or incorporated by reference herein) contains “forward-looking statements” (within the meaning of Section 27A of the Securities Act of 1933, as amended, and Section 21E of the Securities Exchange Act of 1934, as amended), which reflect VEREIT’s expectations regarding future events and VEREIT's future financial condition, results of operations and business. The forward-looking statements involve a number of assumptions, risks, uncertainties and other factors that could cause actual results to differ materially from those contained in the forward-looking statements. Generally, the words “expects,” “anticipates,”“assumes,” “targets,” “goals,” “projects,” “intends,” “plans,” “believes,” “seeks,” “estimates,” variations of such words and similar expressions identify forward-looking statements. These forward-looking statements are subject to a number of risks, uncertainties and assumptions, most of which are difficult to predict and many of which are beyond VEREIT’s control. If a change occurs, VEREIT’s business, financial condition, liquidity and results of operations may vary materially from those expressed in the forward-looking statements.
The following factors, among others, could cause actual results to differ from those set forth in the forward-looking statements: VEREIT’s plans, market and other expectations, objectives, intentions and other statements that are not historical facts; the developments disclosed herein; VEREIT’s ability to execute on and realize success from its business plan; VEREIT’s ability to meet its 2016 guidance; the unpredictability of the business plans and financial condition of VEREIT’s tenants; the impact of impairment charges in respect of certain of VEREIT’s properties or other assets; risks associated with pending government investigations related to VEREIT's previously disclosed audit committee investigation and related litigations; the inability of Cole Capital to regain its prior level of capital raise; the ability to retain or hire key personnel; and continuation or deterioration of current market conditions. Additional factors that may affect future results are contained in VEREIT’s filings with the U.S. Securities and Exchange Commission (the “SEC”), which are available at the SEC’s website at www.sec.gov. VEREIT disclaims any obligation to publicly update or revise any forward-looking statements, whether as a result of changes in underlying assumptions or factors, new information, future events or otherwise, except as required by law.
See the Definitions section for a description of the Company's non-GAAP and other financial measures.
|
| | |
| | |
| Q3 2016 SUPPLEMENTAL INFORMATION |
|
|
| |
Company Overview (unaudited) |
| |
VEREIT is a real estate company incorporated in Maryland on December 2, 2010, which has elected to be taxed as a real estate investment trust ("REIT") for U.S. federal income tax purposes. On September 6, 2011, the Company completed its initial public offering.
VEREIT is a full service real estate operating company that operates through two business segments, its real estate investment ("REI") segment and its investment management segment, Cole Capital® ("Cole Capital"). Through its REI segment, the Company owns and actively manages a diversified portfolio of retail, restaurant, office and industrial real estate properties primarily subject to long-term net leases with creditworthy tenants. The Company targets properties that are strategically located and essential to the business operations of the tenant, as well as retail properties that offer necessity- and value-oriented products or services. At September 30, 2016, approximately 41.5% of the Company's Annualized Rental Income was earned from Investment-Grade Tenants, Economic Occupancy was 98.0% and the weighted-average lease term was 10.0 years. Cole Capital is contractually responsible for raising capital for, managing the affairs of and identifying and making acquisitions and investments on behalf of non-traded REITs (the "Cole REITs") and other real estate programs sponsored by Cole Capital on a day-to-day basis. The Company receives compensation and reimbursement for services relating to the Cole REITs and other real estate programs' offerings and the investment, management, financing and disposition of their respective assets, as applicable. Cole Capital allows the Company to generate earnings without the corresponding need to invest capital in that business or incur balance sheet debt in order to fund or expand operations. Cole Capital also develops new REIT offerings and coordinates receipt of regulatory approvals from the SEC, the Financial Industry Regulatory Authority, Inc. and various blue sky jurisdictions for such offerings. At the appropriate time, Cole Capital recommends to each of the Cole REIT's respective board of directors an approach for providing investors with liquidity.
See the Definitions section for a description of the Company's non-GAAP and other financial measures.
VEREIT, Inc. | WWW.VEREIT.COM | 4
|
| | |
| | |
| Q3 2016 SUPPLEMENTAL INFORMATION |
|
| | |
| Senior Management | | Board of Directors |
| | | |
| Glenn J. Rufrano, Chief Executive Officer | | Hugh R. Frater, Non-Executive Chairman |
| | | |
| Michael J. Bartolotta, Executive Vice President and Chief Financial Officer | | Bruce D. Frank, Independent Director |
| | | |
| Lauren Goldberg, Executive Vice President, General Counsel and Secretary | | David B. Henry, Independent Director |
| | | |
| Paul H. McDowell, Executive Vice President and Chief Operating Officer | | Mark S. Ordan, Independent Director |
| | | |
| William C. Miller, Executive Vice President and Investment Management | | Eugene A. Pinover, Independent Director |
| | | |
| Thomas W. Roberts, Executive Vice President and Chief Investment Officer | | Julie G. Richardson, Independent Director |
| | | |
| Gavin B. Brandon, Senior Vice President and Chief Accounting Officer | | Glenn J. Rufrano, Chief Executive Officer |
| | | |
Corporate Offices and Contact Information
|
| | |
| 2325 E. Camelback Road, Suite 1100 | | 5 Bryant Park, 23rd Floor |
| Phoenix, AZ 85016 | | New York, NY 10018 |
| 800-606-3610 | | 212-413-9100 |
| www.VEREIT.com | | |
Trading Symbols: VER, VER PRF
Stock Exchange Listing: New York Stock Exchange
Transfer Agent
Computershare Trust Company, N.A.
250 Royall Street
Canton, MA 02021
800-736-3001
See the Definitions section for a description of the Company's non-GAAP and other financial measures.
VEREIT, Inc. | WWW.VEREIT.COM | 5
|
| | |
| | |
| Q3 2016 SUPPLEMENTAL INFORMATION |
|
|
| |
Quarterly Financial Summary (unaudited, dollars in thousands, except per share amounts) |
| |
|
| | | | | | | | | | | | | | | | | | | |
| | Q3 2016 | | Q2 2016 | | Q1 2016 | | Q4 2015 | | Q3 2015 |
| Consolidated Financial Results | | | | | | | | | |
| Revenue | $ | 362,915 |
| | $ | 371,019 |
| | $ | 369,020 |
| | $ | 383,374 |
| | $ | 384,954 |
|
| Net income (loss) | $ | 30,246 |
| | $ | 3,233 |
| | $ | (116,080 | ) | | $ | (192,231 | ) | | $ | 8,141 |
|
| Basic and diluted net income (loss) per share attributable to common stockholders and limited partners | $ | 0.01 |
| | $ | (0.02 | ) | | $ | (0.15 | ) | | $ | (0.23 | ) | | $ | (0.01 | ) |
| Normalized EBITDA | $ | 285,906 |
| | $ | 283,060 |
| | $ | 288,607 |
| | $ | 286,674 |
| | $ | 301,772 |
|
| FFO attributable to common stockholders and limited partners | $ | 179,472 |
| | $ | 184,174 |
| | $ | 196,229 |
| | $ | 4,623 |
| | $ | 191,562 |
|
| FFO attributable to common stockholders and limited partners per diluted share | $ | 0.185 |
| | $ | 0.198 |
| | $ | 0.211 |
| | $ | 0.005 |
| | $ | 0.206 |
|
| AFFO attributable to common stockholders and limited partners | $ | 198,108 |
| | $ | 180,107 |
| | $ | 192,675 |
| | $ | 183,157 |
| | $ | 196,428 |
|
| AFFO attributable to common stockholders and limited partners per diluted share | $ | 0.205 |
| | $ | 0.193 |
| | $ | 0.207 |
| | $ | 0.197 |
| | $ | 0.211 |
|
| Dividends declared per common share | $ | 0.1375 |
| | $ | 0.1375 |
| | $ | 0.1375 |
| | $ | 0.1375 |
| | $ | 0.1375 |
|
| Weighted-average shares outstanding - diluted | 968,686,543 |
| | 931,252,045 |
| | 930,179,874 |
| | 929,367,308 |
| | 929,457,209 |
|
| | | | | | | | | | |
| Real Estate Investments | | | | | | | | | |
| Revenue | $ | 331,846 |
| | $ | 338,533 |
| | $ | 337,787 |
| | $ | 350,061 |
| | $ | 357,408 |
|
| Net income (loss) | $ | 30,006 |
| | $ | 2,167 |
| | $ | (115,534 | ) | | $ | (5,961 | ) | | $ | 8,740 |
|
| Normalized EBITDA | $ | 277,593 |
| | $ | 274,683 |
| | $ | 282,243 |
| | $ | 280,822 |
| | $ | 294,743 |
|
| FFO attributable to common stockholders and limited partners | $ | 179,232 |
| | $ | 183,108 |
| | $ | 196,775 |
| | $ | 190,893 |
| | $ | 192,161 |
|
| FFO attributable to common stockholders and limited partners per diluted share | $ | 0.185 |
| | $ | 0.197 |
| | $ | 0.212 |
| | $ | 0.205 |
| | $ | 0.207 |
|
| AFFO attributable to common stockholders and limited partners | $ | 182,371 |
| | $ | 177,599 |
| | $ | 185,528 |
| | $ | 187,339 |
| | $ | 191,419 |
|
| AFFO attributable to common stockholders and limited partners per diluted share | $ | 0.188 |
| | $ | 0.191 |
| | $ | 0.199 |
| | $ | 0.202 |
| | $ | 0.206 |
|
| Properties owned | 4,213 |
| | 4,291 |
| | 4,378 |
| | 4,435 |
| | 4,572 |
|
| Rentable square feet (in thousands) | 96,885 |
| | 99,229 |
| | 99,015 |
| | 99,578 |
| | 100,950 |
|
| Economic occupancy rate | 98.0 | % | | 97.7 | % | | 98.6 | % | | 98.6 | % | | 98.3 | % |
| Weighted-average remaining lease term (years) | 10.0 |
| | 10.2 |
| | 10.4 |
| | 10.6 |
| | 11.1 |
|
Investment-grade tenants (1) | 41.5 | % | | 42.7 | % | | 42.1 | % | | 42.5 | % | | 43.5 | % |
| | | | | | | | | | |
| Cole Capital | | | | | | | | | |
| Revenue | $ | 31,069 |
| | $ | 32,486 |
| | $ | 31,233 |
| | $ | 33,313 |
| | $ | 27,546 |
|
| Net income (loss) | $ | 240 |
| | $ | 1,066 |
| | $ | (546 | ) | | $ | (186,270 | ) | | $ | (599 | ) |
| Normalized EBITDA | $ | 8,313 |
| | $ | 8,377 |
| | $ | 6,364 |
| | $ | 5,852 |
| | $ | 7,029 |
|
| FFO attributable to common stockholders and limited partners | $ | 240 |
| | $ | 1,066 |
| | $ | (546 | ) | | $ | (186,270 | ) | | $ | (599 | ) |
| FFO attributable to common stockholders and limited partners per diluted share | $ | 0.000 |
| | $ | 0.001 |
| | $ | (0.001 | ) | | $ | (0.200 | ) | | $ | (0.001 | ) |
| AFFO attributable to common stockholders and limited partners | $ | 15,737 |
| | $ | 2,508 |
| | $ | 7,147 |
| | $ | (4,182 | ) | | $ | 5,009 |
|
| AFFO attributable to common stockholders and limited partners per diluted share | $ | 0.016 |
| | $ | 0.003 |
| | $ | 0.008 |
| | $ | (0.004 | ) | | $ | 0.005 |
|
| Capital raised on behalf of Cole REITs, excluding DRIP | $ | 136,381 |
| | $ | 138,655 |
| | $ | 144,620 |
| | $ | 116,634 |
| | $ | 66,603 |
|
| Purchase price of property acquisitions on behalf of Cole REITs | $ | 173,869 |
| | $ | 211,178 |
| | $ | 102,075 |
| | $ | 236,398 |
| | $ | 315,301 |
|
| Assets Under Management | $ | 7,131,400 |
| | $ | 7,005,695 |
| | $ | 6,827,885 |
| | $ | 6,740,911 |
| | $ | 6,561,950 |
|
| |
| (1) | The weighted-average credit rating of our investment-grade tenants was A- as of September 30, 2016. |
See the Definitions section for a description of the Company's non-GAAP and other financial measures.
VEREIT, Inc. | WWW.VEREIT.COM | 6
|
| | |
| | |
| Q3 2016 SUPPLEMENTAL INFORMATION |
|
|
| |
Financial and Operations Statistics and Ratios (unaudited, dollars in thousands) |
| |
|
| | | | | | | | | | | | | | | | | | | | |
| | | Three Months Ended |
| | | September 30,
2016 | | June 30,
2016 | | March 31,
2016 | | December 31,
2015 | | September 30,
2015 |
| Interest Coverage Ratio | | | | | | | | | | |
Interest expense, excluding non-cash amortization (1) | | $ | 76,511 |
| | $ | 78,998 |
| | $ | 77,542 |
| | $ | 80,349 |
| | $ | 83,140 |
|
| Normalized EBITDA | | 285,906 |
| | 283,060 |
| | 288,607 |
| | 286,674 |
| | 301,772 |
|
| Interest Coverage Ratio | | 3.74x |
| | 3.58x |
| | 3.72x |
| | 3.57x |
|
| 3.63x |
|
| | | | | | | | | | | |
| Fixed Charge Coverage Ratio | | | | | | | | | | |
Interest expense, excluding non-cash amortization (1) | | $ | 76,511 |
| | $ | 78,998 |
| | $ | 77,542 |
| | $ | 80,349 |
| | $ | 83,140 |
|
| Secured debt principal amortization | | 5,734 |
| | 5,168 |
| | 8,449 |
| | 5,834 |
| | 6,089 |
|
Dividends attributable to preferred shares | | 17,973 |
| | 17,973 |
| | 17,973 |
| | 17,972 |
| | 17,974 |
|
| Total fixed charges | | 100,218 |
| | 102,139 |
| | 103,964 |
| | 104,155 |
| | 107,203 |
|
| Normalized EBITDA | | 285,906 |
| | 283,060 |
| | 288,607 |
| | 286,674 |
|
| 301,772 |
|
| Fixed Charge Coverage Ratio | | 2.85 | x | | 2.77 | x | | 2.78 | x | | 2.75 | x | | 2.81 | x |
| | | | | | | | | | | |
| | | September 30,
2016 | | June 30,
2016 | | March 31,
2016 | | December 31,
2015 | | September 30,
2015 |
| Net Debt Ratios | | | | | | | | | | |
Debt Outstanding (2) | | $ | 6,586,839 |
| | $ | 8,514,700 |
| | $ | 7,826,603 |
| | $ | 8,083,345 |
| | $ | 8,928,412 |
|
| Less: cash and cash equivalents | | 116,618 |
| | 1,029,620 |
| | 104,450 |
| | 69,103 |
| | 171,659 |
|
| Net Debt | | 6,470,221 |
| | 7,485,080 |
| | 7,722,153 |
| | 8,014,242 |
| | 8,756,753 |
|
| Normalized EBITDA annualized | | 1,143,624 |
| | 1,132,240 |
| | 1,154,428 |
| | 1,146,696 |
| | 1,207,088 |
|
| Net Debt to Normalized EBITDA annualized ratio | | 5.66 | x | | 6.61 | x | | 6.69 | x | | 6.99 | x | | 7.25 | x |
| | | | | | | | | | | |
| Net Debt | | $ | 6,470,221 |
| | $ | 7,485,080 |
| | $ | 7,722,153 |
| | $ | 8,014,242 |
| | $ | 8,756,753 |
|
| Gross Real Estate Investments | | 15,815,333 |
| | 16,085,149 |
| | 16,247,476 |
| | 16,694,977 |
| | 17,392,001 |
|
| Net Debt Leverage Ratio | | 40.9 | % | | 46.5 | % | | 47.5 | % | | 48.0 | % | | 50.3 | % |
| | | | | | | | | | | |
| Unencumbered Assets/Real Estate Assets | | | | | | | | |
| Unencumbered Gross Real Estate Investments | | $ | 10,394,146 |
| | $ | 10,585,494 |
| | $ | 10,612,483 |
| | $ | 10,744,554 |
| | $ | 11,085,546 |
|
| Gross Real Estate Investments | | 15,815,333 |
| | 16,085,149 |
| | 16,247,476 |
| | 16,694,977 |
| | 17,392,001 |
|
| Unencumbered Asset Ratio | | 65.7 | % | | 65.8 | % | | 65.3 | % | | 64.4 | % | | 63.7 | % |
___________________________________
| |
| (1) | Refer to the Consolidated Statements of Operations section for interest expense calculated in accordance with GAAP. |
| |
| (2) | Refer to the Consolidated Balance Sheets section for total debt calculated in accordance with GAAP. |
See the Definitions section for a description of the Company's non-GAAP and other financial measures.
VEREIT, Inc. | WWW.VEREIT.COM | 7
|
| | |
| | |
| Q3 2016 SUPPLEMENTAL INFORMATION |
|
|
| |
Key Balance Sheet Metrics and Capital Structure (unaudited, dollars and shares in thousands, except per share amounts) |
| |
|
| | | |
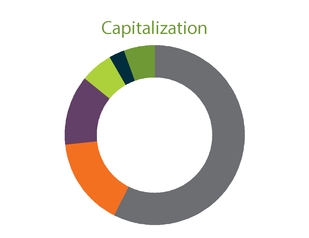
| | | Common equity | 57.6% |
| | | | |
| | | Secured debt | 15.7% |
| | | | |
| | | Corporate bonds | 12.5% |
| | | | |
| | | Preferred equity | 5.9% |
| | | | |
| | | Convertible notes | 5.5% |
| | | | |
| | | Unsecured term loan | 2.8% |
Fixed vs. Variable Rate Debt
|
| | |
| Fixed | 88.6 | % |
| Swapped to Fixed | 11.3 | % |
| Variable | 0.1 | % |
|
| | | | | | | |
| VEREIT Capitalization Table | | | |
| | Wtd. Avg. Maturity (Years) | | Rate (1) | | September 30, 2016 |
| Diluted shares outstanding | | | | | 1,000,717 |
|
| Stock price | | | | | $ | 10.37 |
|
| Implied Equity Market Capitalization | | $ | 10,377,435 |
|
| | | | | | |
Series F Perpetual Preferred (2) | | 6.70% | | $ | 1,070,853 |
|
| | | | | | |
| Mortgage notes payable | 4.6 | | 5.01% | | $ | 2,813,829 |
|
| Secured term loan | 1.3 | | 5.81% | | 23,010 |
|
| Total secured debt | 4.6 | | 5.01% | | $ | 2,836,839 |
|
| | | | | | |
| Unsecured term loan (swapped to fixed) | 1.7 | | 3.25% | | $ | 500,000 |
|
| 2018 convertible notes | 1.8 | | 3.00% | | 597,500 |
|
| 2019 corporate bonds | 2.4 | | 3.00% | | 750,000 |
|
| 2020 convertible notes | 4.2 | | 3.75% | | 402,500 |
|
| 2021 corporate bonds | 4.7 | | 4.13% | | 400,000 |
|
| 2024 corporate bonds | 7.4 | | 4.60% | | 500,000 |
|
| 2026 corporate bonds | 9.7 | | 4.88% | | 600,000 |
|
| Total unsecured debt | 4.5 | | 3.75% | | $ | 3,750,000 |
|
| | | | | | |
| Total Debt Outstanding | 4.5 | | 4.29% | | $ | 6,586,839 |
|
| | | | | | |
| Total Capitalization | | $ | 18,035,128 |
|
| Less: Cash and cash equivalents | | | | | 116,618 |
|
| Enterprise Value | | $ | 17,918,510 |
|
| | | | | | |
| Net Debt/Enterprise Value | | | | | 36.1 | % |
| Net Debt/Normalized EBITDA Annualized | | | | 5.66 | x |
| Net Debt + Preferred/Normalized EBITDA Annualized | | 6.59 | x |
| Fixed Charge Coverage Ratio | | | | | 2.85 | x |
Liquidity (3) | | | | | $ | 2,416,618 |
|
(1)Weighted-average interest rate for variable-rate debt represents the interest rate in effect as of September 30, 2016.
(2)Balance represents 42.8 million shares outstanding at September 30, 2016 multiplied by the liquidation preference of $25 per share.
(3)Liquidity represents cash and cash equivalents of $116.6 million and $2.3 billion available capacity on our revolving credit facility.
See the Definitions section for a description of the Company's non-GAAP and other financial measures.
VEREIT, Inc. | WWW.VEREIT.COM | 8
|
| | |
| | |
| Q3 2016 SUPPLEMENTAL INFORMATION |
|
|
| |
Business Model (unaudited) |
| |
|
| | | | | | |
| | | | | | | |
| | | | | | |
| | | | $16.1 Billion | |
| | | Book Value of Total Assets | |
| | | | | |
| | | | | | |
| | | | | Retail (1) | Restaurants (1) | |
| | A full-service real estate operating company with investment management capability. | | 2,037 Properties | 1,837 Properties | |
| | | | | |
| | | Industrial & Distribution (1) | Office (1) | |
| | | | | 166 Properties | 161 Properties | |
| | | | | | | |
| | | | | | | |
| | | | | $7.1 Billion | |
| | | | |
| | | Assets Under Management | |
| | | | |
| | | | | |
| | | | | Open Offerings | |
| | Cole Capital is a combination of Cole Capital distribution and Cole Capital investment management. Cole Capital investment management is a shared resource model with VEREIT. | | CCPT V(2) l Income NAV(2) l CCIT III(2) | |
| | | | | |
| | | Closed Offerings | |
| | | CCIT II(2) l CCPT IV(2) l TIC & DST(2) | |
| | | | | | | |
| | | | | | | |
___________________________________
| |
| (1) | Excludes 12 properties that consist of billboards, construction in progress, land, and parking lots. |
| |
| (2) | Defined in the "Program Summary" of the Cole REITs and Other Real Estate Programs section. |
See the Definitions section for a description of the Company's non-GAAP and other financial measures.
VEREIT, Inc. | WWW.VEREIT.COM | 9
|
| | |
| | |
| Q3 2016 SUPPLEMENTAL INFORMATION |
|
|
| |
Consolidated Balance Sheets (unaudited, in thousands) |
| |
|
| | | | | | | | | | | | | | | | | | | | |
| | | September 30,
2016 | | June 30,
2016 | | March 31,
2016 | | December 31,
2015 | | September 30,
2015 |
| Assets | | | | | | | | | | |
| Real estate investments, at cost: | | | | | | | | | | |
| Land | | $ | 2,946,105 |
| | $ | 2,992,848 |
| | $ | 3,058,879 |
| | $ | 3,120,653 |
| | $ | 3,257,396 |
|
| Buildings, fixtures and improvements | | 10,800,316 |
| | 10,956,605 |
| | 11,161,327 |
| | 11,445,690 |
| | 11,652,830 |
|
| Intangible lease assets | | 2,073,076 |
| | 2,102,606 |
| | 2,145,734 |
| | 2,218,378 |
| | 2,313,369 |
|
| Total real estate investments, at cost | | 15,819,497 |
|
| 16,052,059 |
| | 16,365,940 |
| | 16,784,721 |
| | 17,223,595 |
|
| Less: accumulated depreciation and amortization | | 2,188,998 |
| | 2,029,121 |
| | 1,865,674 |
| | 1,778,597 |
| | 1,595,667 |
|
| Total real estate investments, net | | 13,630,499 |
|
| 14,022,938 |
| | 14,500,266 |
| | 15,006,124 |
| | 15,627,928 |
|
| Investment in unconsolidated entities | | 24,711 |
| | 22,435 |
| | 23,445 |
| | 56,824 |
| | 57,247 |
|
| Investment in direct financing leases, net | | 40,785 |
| | 43,155 |
| | 45,611 |
| | 46,312 |
| | 49,244 |
|
| Investment securities, at fair value | | 48,098 |
| | 48,347 |
| | 48,162 |
| | 53,304 |
| | 54,455 |
|
| Loans held for investment, net | | 23,014 |
| | 23,297 |
| | 23,559 |
| | 24,238 |
| | 40,002 |
|
| Cash and cash equivalents | | 116,618 |
| | 1,029,620 |
| | 104,450 |
| | 69,103 |
| | 171,659 |
|
| Restricted cash | | 61,828 |
| | 60,837 |
| | 60,132 |
| | 59,767 |
| | 47,775 |
|
| Intangible assets, net | | 30,849 |
| | 37,088 |
| | 43,327 |
| | 50,779 |
| | 127,835 |
|
| Rent and tenant receivables and other assets, net | | 339,529 |
| | 333,124 |
| | 313,903 |
| | 303,637 |
| | 318,001 |
|
| Goodwill | | 1,602,610 |
| | 1,620,233 |
| | 1,642,858 |
| | 1,656,374 |
| | 1,828,005 |
|
| Due from affiliates | | 20,883 |
| | 8,043 |
| | 11,617 |
| | 60,633 |
| | 66,981 |
|
| Assets held for sale | | 118,396 |
| | 159,394 |
| | 26,282 |
| | 18,771 |
| | 247,951 |
|
| Total assets | | $ | 16,057,820 |
|
| $ | 17,408,511 |
|
| $ | 16,843,612 |
| | $ | 17,405,866 |
| | $ | 18,637,083 |
|
| | | | | | | | | | | |
| Liabilities and Equity | | | | | | | | | | |
| Mortgage notes payable and other debt, net | | $ | 2,861,210 |
| | $ | 2,938,072 |
| | $ | 3,029,666 |
| | $ | 3,111,985 |
| | $ | 3,187,960 |
|
| Corporate bonds, net | | 2,225,157 |
| | 3,522,297 |
| | 2,537,699 |
| | 2,536,333 |
| | 2,534,977 |
|
| Convertible debt, net | | 970,691 |
| | 968,059 |
| | 965,469 |
| | 962,894 |
| | 960,361 |
|
| Credit facility, net | | 496,008 |
| | 1,045,872 |
| | 1,269,731 |
| | 1,448,590 |
| | 2,097,400 |
|
| Below-market lease liabilities, net | | 229,340 |
| | 237,403 |
| | 245,093 |
| | 251,692 |
| | 264,232 |
|
| Accounts payable and accrued expenses | | 139,150 |
| | 163,122 |
| | 118,970 |
| | 151,877 |
| | 164,204 |
|
| Deferred rent, derivative and other liabilities | | 89,154 |
| | 84,486 |
| | 88,997 |
| | 87,490 |
| | 114,343 |
|
| Distributions payable | | 159,415 |
| | 146,695 |
| | 143,973 |
| | 140,816 |
| | 137,647 |
|
| Due to affiliates | | — |
| | — |
| | — |
| | 230 |
| | 241 |
|
| Mortgage notes payable associated with assets held for sale | | — |
| | — |
| | — |
| | — |
| | 118,493 |
|
| Total liabilities | | 7,170,125 |
|
| 9,106,006 |
| | 8,399,598 |
| | 8,691,907 |
| | 9,579,858 |
|
| | | | | | | | | | | |
| Series F preferred stock | | 428 |
| | 428 |
| | 428 |
| | 428 |
| | 428 |
|
| Common stock | | 9,742 |
| | 9,048 |
| | 9,048 |
| | 9,049 |
| | 9,050 |
|
| Additional paid-in capital | | 12,637,049 |
| | 11,934,864 |
| | 11,932,859 |
| | 11,931,768 |
| | 11,928,184 |
|
| Accumulated other comprehensive (loss) income | | (4,687 | ) | | (12,297 | ) | | (11,345 | ) | | (2,025 | ) | | (9,806 | ) |
| Accumulated deficit | | (3,933,092 | ) | | (3,810,341 | ) | | (3,671,050 | ) | | (3,415,233 | ) | | (3,085,906 | ) |
| Total stockholders' equity | | 8,709,440 |
|
| 8,121,702 |
| | 8,259,940 |
| | 8,523,987 |
| | 8,841,950 |
|
| Non-controlling interests | | 178,255 |
| | 180,803 |
| | 184,074 |
| | 189,972 |
| | 215,275 |
|
| Total equity | | 8,887,695 |
|
| 8,302,505 |
|
| 8,444,014 |
| | 8,713,959 |
| | 9,057,225 |
|
| Total liabilities and equity | | $ | 16,057,820 |
|
| $ | 17,408,511 |
| | $ | 16,843,612 |
| | $ | 17,405,866 |
| | $ | 18,637,083 |
|
See the Definitions section for a description of the Company's non-GAAP and other financial measures.
VEREIT, Inc. | WWW.VEREIT.COM | 10
|
| | |
| | |
| Q3 2016 SUPPLEMENTAL INFORMATION |
|
|
| |
Consolidated Statements of Operations (unaudited, in thousands, except per share data) |
| |
|
| | | | | | | | | | | | | | | | | | | | |
| | | Three Months Ended |
| | | September 30,
2016 | | June 30,
2016 | | March 31,
2016 | | December 31,
2015 | | September 30,
2015 |
| Revenues: | | | | | | | | | | |
| Rental income | | $ | 303,383 |
| | $ | 311,352 |
| | $ | 313,971 |
| | $ | 322,079 |
| | $ | 333,766 |
|
| Direct financing lease income | | 494 |
| | 535 |
| | 569 |
| | 623 |
| | 659 |
|
| Operating expense reimbursements | | 27,969 |
| | 26,646 |
| | 23,247 |
| | 27,359 |
| | 22,983 |
|
| Cole Capital revenue | | 31,069 |
| | 32,486 |
| | 31,233 |
| | 33,313 |
| | 27,546 |
|
| Total revenues | | 362,915 |
|
| 371,019 |
|
| 369,020 |
|
| 383,374 |
|
| 384,954 |
|
| Operating expenses: | | | | | | | | | | |
| Cole Capital reallowed fees and commissions | | 5,897 |
| | 6,975 |
| | 8,068 |
| | 6,558 |
| | 3,896 |
|
| Acquisition related | | 90 |
| | 41 |
| | 242 |
| | 734 |
| | 1,764 |
|
| Litigation and other non-routine costs, net of insurance recoveries | | 4,630 |
| | 2,917 |
| | (5,175 | ) | | (7,691 | ) | | 8,032 |
|
| Property operating | | 34,820 |
| | 38,199 |
| | 34,813 |
| | 35,308 |
| | 31,950 |
|
| General and administrative | | 29,761 |
| | 33,094 |
| | 29,400 |
| | 49,160 |
| | 32,842 |
|
| Depreciation and amortization | | 195,173 |
| | 197,345 |
| | 204,308 |
| | 202,415 |
| | 208,542 |
|
| Impairments | | 6,872 |
| | 8,825 |
| | 160,517 |
| | 219,753 |
| | — |
|
| Total operating expenses | | 277,243 |
| | 287,396 |
| | 432,173 |
| | 506,237 |
| | 287,026 |
|
| Operating income (loss) | | 85,672 |
| | 83,623 |
| | (63,153 | ) | | (122,863 | ) | | 97,928 |
|
| Other (expense) income: | | | | | | | | | | |
| Interest expense | | (79,869 | ) | | (82,468 | ) | | (80,426 | ) | | (82,591 | ) | | (89,530 | ) |
| (Loss) gain on extinguishment and forgiveness of debt, net | | (2,003 | ) | | 252 |
| | — |
| | (490 | ) | | — |
|
| Other income (expense), net | | 1,744 |
| | 1,216 |
| | 1,062 |
| | (3,816 | ) | | 2,368 |
|
| Reserve for loan loss | | — |
| | — |
| | — |
| | (15,300 | ) | | — |
|
| Equity in income and gain on disposition of unconsolidated entities | | 212 |
| | 70 |
| | 10,404 |
| | 752 |
| | 6,837 |
|
| (Loss) gain on derivative instruments, net | | (2,023 | ) | | (177 | ) | | (1,086 | ) | | 677 |
| | (1,420 | ) |
| Total other expenses, net | | (81,939 | ) | | (81,107 | ) | | (70,046 | ) | | (100,768 | ) | | (81,745 | ) |
| Income (loss) before taxes and real estate dispositions | | 3,733 |
| | 2,516 |
| | (133,199 | ) | | (223,631 | ) | | 16,183 |
|
| Gain (loss) on disposition of real estate, net | | 28,111 |
| | 437 |
| | 17,175 |
| | (9,727 | ) | | (6,542 | ) |
| Income (loss) before taxes | | 31,844 |
| | 2,953 |
| | (116,024 | ) | | (233,358 | ) | | 9,641 |
|
| (Provision for) benefit from income taxes | | (1,598 | ) | | 280 |
| | (56 | ) | | 41,127 |
| | (1,500 | ) |
| Net income (loss) | | 30,246 |
|
| 3,233 |
|
| (116,080 | ) |
| (192,231 | ) |
| 8,141 |
|
| Net (income) loss attributable to non-controlling interests | | (751 | ) | | (87 | ) | | 2,994 |
| | 4,841 |
| | (612 | ) |
| Net income (loss) attributable to the General Partner | | $ | 29,495 |
| | $ | 3,146 |
| | $ | (113,086 | ) | | $ | (187,390 | ) | | $ | 7,529 |
|
| | | | | | | | | | | |
| Basic and diluted net income (loss) per share attributable to common stockholders and limited partners | | $ | 0.01 |
| | $ | (0.02 | ) | | $ | (0.15 | ) | | $ | (0.23 | ) | | $ | (0.01 | ) |
See the Definitions section for a description of the Company's non-GAAP and other financial measures.
VEREIT, Inc. | WWW.VEREIT.COM | 11
|
| | |
| | |
| Q3 2016 SUPPLEMENTAL INFORMATION |
|
|
| |
Consolidated FFO and AFFO (unaudited, in thousands, except share and per share data) |
| |
|
| | | | | | | | | | | | | | | | | | | | |
| | | Three Months Ended |
| | | September 30,
2016 | | June 30,
2016 | | March 31,
2016 | | December 31,
2015 | | September 30,
2015 |
| Net income (loss) | | $ | 30,246 |
| | $ | 3,233 |
| | $ | (116,080 | ) | | $ | (192,231 | ) | | $ | 8,141 |
|
| Dividends on non-convertible preferred stock | | (17,973 | ) | | (17,973 | ) | | (17,973 | ) | | (17,972 | ) | | (17,974 | ) |
| (Gain) loss on disposition of real estate assets, including joint ventures, net | | (28,111 | ) | | (437 | ) | | (27,373 | ) | | 9,727 |
| | (187 | ) |
| Depreciation and amortization of real estate assets | | 187,898 |
| | 190,236 |
| | 195,991 |
| | 197,408 |
| | 200,159 |
|
| Impairment of real estate | | 6,872 |
| | 8,825 |
| | 160,517 |
| | 6,414 |
| | — |
|
| Proportionate share of adjustments for unconsolidated entities | | 540 |
| | 290 |
| | 1,147 |
| | 1,277 |
| | 1,423 |
|
| FFO attributable to common stockholders and limited partners | | $ | 179,472 |
| | $ | 184,174 |
| | $ | 196,229 |
| | $ | 4,623 |
| | $ | 191,562 |
|
| | | | | | | | | | | |
| Acquisition related expenses | | 90 |
| | 41 |
| | 242 |
| | 734 |
| | 1,764 |
|
| Litigation and other non-routine costs, net of insurance recoveries | | 4,630 |
| | 2,917 |
| | (5,175 | ) | | (7,691 | ) | | 8,032 |
|
| Impairment of intangible assets | | — |
| | — |
| | — |
| | 213,339 |
| | — |
|
| Reserve for loan loss | | — |
| | — |
| | — |
| | 15,300 |
| | — |
|
| Gain on investment securities | | — |
| | — |
| | — |
| | — |
| | (4 | ) |
| Loss (gain) on derivative instruments, net | | 2,023 |
| | 177 |
| | 1,086 |
| | (677 | ) | | 1,420 |
|
| Amortization of premiums and discounts on debt and investments, net | | (3,553 | ) | | (4,030 | ) | | (4,426 | ) | | (5,107 | ) | | (4,920 | ) |
| Amortization of above-market lease assets and deferred lease incentives, net of amortization of below-market lease liabilities | | 1,632 |
| | 1,248 |
| | 1,296 |
| | 1,299 |
| | 1,152 |
|
| Net direct financing lease adjustments | | 571 |
| | 590 |
| | 559 |
| | 544 |
| | 507 |
|
| Amortization and write-off of deferred financing costs | | 6,878 |
| | 7,461 |
| | 7,307 |
| | 7,321 |
| | 11,320 |
|
| Amortization of management contracts | | 6,240 |
| | 6,240 |
| | 7,451 |
| | 3,373 |
| | 7,510 |
|
Deferred tax expense (benefit)(1) | | 6,941 |
| | (6,417 | ) | | (1,457 | ) | | (38,695 | ) | | (5,701 | ) |
| Loss (gain) on extinguishment and forgiveness of debt, net | | 2,003 |
| | (252 | ) | | — |
| | 490 |
| | — |
|
| Straight-line rent, net of bad debt expense related to straight-line rent | | (12,319 | ) | | (15,663 | ) | | (13,045 | ) | | (17,589 | ) | | (21,705 | ) |
| Equity-based compensation expense | | 2,588 |
| | 2,779 |
| | 1,730 |
| | 4,311 |
| | 4,016 |
|
| Other amortization and non-cash charges | | 929 |
| | 751 |
| | 743 |
| | 1,540 |
| | 781 |
|
| Proportionate share of adjustments for unconsolidated entities | | (17 | ) | | 91 |
| | 135 |
| | 42 |
| | 694 |
|
| AFFO attributable to common stockholders and limited partners | | $ | 198,108 |
| | $ | 180,107 |
| | $ | 192,675 |
| | $ | 183,157 |
| | $ | 196,428 |
|
| | | | | | | | | | | |
| Weighted-average shares outstanding - basic | | 943,480,170 |
| | 904,107,378 |
| | 903,825,726 |
| | 903,638,159 |
| | 903,461,323 |
|
Effect of Limited Partner OP Units and dilutive securities (2) | | 25,206,373 |
| | 27,144,667 |
| | 26,354,148 |
| | 25,729,149 |
| | 25,995,886 |
|
Weighted-average shares outstanding - diluted (3) | | 968,686,543 |
| | 931,252,045 |
| | 930,179,874 |
| | 929,367,308 |
| | 929,457,209 |
|
| | | | | | | | | | | |
FFO attributable to common stockholders and limited partners per diluted share (4) | | $ | 0.185 |
| | $ | 0.198 |
| | $ | 0.211 |
| | $ | 0.005 |
| | $ | 0.206 |
|
AFFO attributable to common stockholders and limited partners per diluted share (4) | | $ | 0.205 |
| | $ | 0.193 |
| | $ | 0.207 |
| | $ | 0.197 |
| | $ | 0.211 |
|
| |
| (1) | This adjustment represents the non-current portion of the provision for or benefit from income taxes in order to show only the current portion of the provision for or benefit from income taxes as an impact to AFFO. |
| |
| (2) | Dilutive securities include unvested restricted shares of common stock and unvested restricted stock units. |
| |
| (3) | Weighted-average shares for all periods presented exclude the effect of the convertible debt as the Company would expect to settle the debt in cash and any shares underlying restricted stock units that are contingently issuable which are not issuable based on the Company’s level of achievement of certain performance targets through the respective reporting period. |
| |
| (4) | Refer to the Consolidated Statements of Operations section for basic and diluted net loss per share attributable to common stockholders. |
See the Definitions section for a description of the Company's non-GAAP and other financial measures.
VEREIT, Inc. | WWW.VEREIT.COM | 12
|
| | |
| | |
| Q3 2016 SUPPLEMENTAL INFORMATION |
|
|
| |
Consolidated EBITDA and Normalized EBITDA (unaudited, in thousands) |
| |
|
| | | | | | | | | | | | | | | | | | | | |
| | | Three Months Ended |
| | | September 30,
2016 | | June 30,
2016 | | March 31,
2016 | | December 31,
2015 | | September 30,
2015 |
| Net income (loss) | | $ | 30,246 |
| | $ | 3,233 |
| | $ | (116,080 | ) | | $ | (192,231 | ) | | $ | 8,141 |
|
| Adjustments: | | | | | | | | | | |
| Interest expense | | 79,869 |
| | 82,468 |
| | 80,426 |
| | 82,591 |
| | 89,530 |
|
| Depreciation and amortization | | 195,173 |
| | 197,345 |
| | 204,308 |
| | 202,415 |
| | 208,542 |
|
| Provision for (benefit from) income taxes | | 1,598 |
| | (280 | ) | | 56 |
| | (41,127 | ) | | 1,500 |
|
| Proportionate share of adjustments for unconsolidated entities | | 959 |
| | 554 |
| | 1,822 |
| | 1,978 |
| | 2,554 |
|
| EBITDA | | $ | 307,845 |
| | $ | 283,320 |
| | $ | 170,532 |
| | $ | 53,626 |
| | $ | 310,267 |
|
| (Gain) loss on disposition of real estate assets, including joint ventures, net | | (28,111 | ) | | (437 | ) | | (27,373 | ) | | 9,727 |
| | (187 | ) |
| Impairments | | 6,872 |
| | 8,825 |
| | 160,517 |
| | 219,753 |
| | — |
|
| Reserve for loan loss | | — |
| | — |
| | — |
| | 15,300 |
| | — |
|
| Acquisition related expenses | | 90 |
| | 41 |
| | 242 |
| | 734 |
| | 1,764 |
|
| Litigation and other non-routine costs, net of insurance recoveries | | 4,630 |
| | 2,917 |
| | (5,175 | ) | | (7,691 | ) | | 8,032 |
|
| Gain on investment securities | | — |
| | — |
| | — |
| | — |
| | (4 | ) |
| Loss (gain) on derivative instruments, net | | 2,023 |
| | 177 |
| | 1,086 |
| | (677 | ) | | 1,420 |
|
| Amortization of above-market lease assets and deferred lease incentives, net of amortization of below-market lease liabilities | | 1,632 |
| | 1,248 |
| | 1,296 |
| | 1,299 |
| | 1,152 |
|
| Loss (gain) on extinguishment and forgiveness of debt, net | | 2,003 |
| | (252 | ) | | — |
| | 490 |
| | — |
|
| Net direct financing lease adjustments | | 571 |
| | 590 |
| | 559 |
| | 544 |
| | 507 |
|
| Straight-line rent, net of bad debt expense related to straight-line rent | | (12,319 | ) | | (15,663 | ) | | (13,045 | ) | | (17,589 | ) | | (21,705 | ) |
| Program development costs write-off | | 845 |
| | 2,377 |
| | — |
| | 11,295 |
| | — |
|
| Other amortization and non-cash charges | | (139 | ) | | (157 | ) | | (126 | ) | | (122 | ) | | (82 | ) |
| Proportionate share of adjustments for unconsolidated entities | | (36 | ) | | 74 |
| | 94 |
| | (15 | ) | | 608 |
|
| Normalized EBITDA | | $ | 285,906 |
| | $ | 283,060 |
| | $ | 288,607 |
| | $ | 286,674 |
| | $ | 301,772 |
|
See the Definitions section for a description of the Company's non-GAAP and other financial measures.
VEREIT, Inc. | WWW.VEREIT.COM | 13
See the Definitions section for a description of the Company's non-GAAP and other financial measures.
VEREIT, Inc. | WWW.VEREIT.COM | 14
|
| | |
| | |
| Q3 2016 SUPPLEMENTAL INFORMATION |
|
|
| |
Statements of Operations - REI Segment (unaudited, in thousands) |
| |
|
| | | | | | | | | | | | | | | | | | | | |
| | | Three Months Ended |
| | | September 30,
2016 | | June 30,
2016 | | March 31,
2016 | | December 31,
2015 | | September 30,
2015 |
| Revenues: | | | | | | | | | | |
| Rental income | | $ | 303,383 |
| | $ | 311,352 |
| | $ | 313,971 |
| | $ | 322,079 |
| | $ | 333,766 |
|
| Direct financing lease income | | 494 |
| | 535 |
| | 569 |
| | 623 |
| | 659 |
|
| Operating expense reimbursements | | 27,969 |
| | 26,646 |
| | 23,247 |
| | 27,359 |
| | 22,983 |
|
| Total real estate investment revenues | | 331,846 |
|
| 338,533 |
|
| 337,787 |
|
| 350,061 |
|
| 357,408 |
|
| Operating expenses: | | | | | | | | | | |
| Acquisition related | | 90 |
| | 27 |
| | 217 |
| | 673 |
| | 1,690 |
|
| Litigation and other non-routine costs, net of insurance recoveries | | 4,630 |
| | 2,917 |
| | (5,175 | ) | | (7,691 | ) | | 8,032 |
|
| Property operating | | 34,820 |
| | 38,199 |
| | 34,813 |
| | 35,308 |
| | 31,950 |
|
| General and administrative | | 12,069 |
| | 13,701 |
| | 12,228 |
| | 16,646 |
| | 15,848 |
|
| Depreciation and amortization | | 187,897 |
| | 190,236 |
| | 195,991 |
| | 197,409 |
| | 200,158 |
|
| Impairment of real estate | | 6,872 |
| | 8,825 |
| | 160,517 |
| | 6,414 |
| | — |
|
| Total operating expenses | | 246,378 |
|
| 253,905 |
|
| 398,591 |
| | 248,759 |
| | 257,678 |
|
| Operating income (loss) | | 85,468 |
|
| 84,628 |
|
| (60,804 | ) | | 101,302 |
| | 99,730 |
|
| Other (expense) income: | | | | | | | | | | |
| Interest expense | | (79,869 | ) | | (82,468 | ) | | (80,426 | ) | | (82,591 | ) | | (89,530 | ) |
| (Loss) gain on extinguishment and forgiveness of debt | | (2,003 | ) | | 252 |
| | — |
| | (490 | ) | | — |
|
| Other income, net | | 1,649 |
| | 1,216 |
| | 568 |
| | (4,226 | ) | | 1,903 |
|
| Reserve for loan loss | | — |
| | — |
| | — |
| | (15,300 | ) | | — |
|
| Equity in income and gain on disposition of unconsolidated entities | | 212 |
| | 70 |
| | 10,404 |
| | 752 |
| | 6,837 |
|
| (Loss) gain on derivative instruments, net | | (2,023 | ) | | (177 | ) | | (1,086 | ) | | 677 |
| | (1,420 | ) |
| Total other expenses, net | | (82,034 | ) |
| (81,107 | ) |
| (70,540 | ) | | (101,178 | ) | | (82,210 | ) |
| Income (loss) before taxes and real estate dispositions | | 3,434 |
| | 3,521 |
| | (131,344 | ) | | 124 |
| | 17,520 |
|
| Gain (loss) on disposition of real estate, net | | 28,111 |
| | 437 |
| | 17,175 |
| | (9,727 | ) | | (6,542 | ) |
| Income (loss) before taxes | | 31,545 |
|
| 3,958 |
|
| (114,169 | ) | | (9,603 | ) | | 10,978 |
|
| (Provision for) benefit from income taxes | | (1,539 | ) | | (1,791 | ) | | (1,365 | ) | | 3,642 |
| | (2,238 | ) |
| Net income (loss) | | $ | 30,006 |
|
| $ | 2,167 |
|
| $ | (115,534 | ) |
| $ | (5,961 | ) |
| $ | 8,740 |
|
See the Definitions section for a description of the Company's non-GAAP and other financial measures.
VEREIT, Inc. | WWW.VEREIT.COM | 15
|
| | |
| | |
| Q3 2016 SUPPLEMENTAL INFORMATION |
|
|
| |
FFO and AFFO - REI Segment (unaudited, in thousands, except share and per share data) |
| |
|
| | | | | | | | | | | | | | | | | | | | |
| | | Three Months Ended |
| | | September 30,
2016 | | June 30,
2016 | | March 31,
2016 | | December 31,
2015 | | September 30,
2015 |
| Net income (loss) | | $ | 30,006 |
| | $ | 2,167 |
| | $ | (115,534 | ) | | $ | (5,961 | ) | | $ | 8,740 |
|
| Dividends on non-convertible preferred stock | | (17,973 | ) | | (17,973 | ) | | (17,973 | ) | | (17,972 | ) | | (17,974 | ) |
| (Gain) loss on disposition of real estate assets, including joint ventures, net | | (28,111 | ) | | (437 | ) | | (27,373 | ) | | 9,727 |
| | (187 | ) |
| Depreciation and amortization of real estate assets | | 187,898 |
| | 190,236 |
| | 195,991 |
| | 197,408 |
| | 200,159 |
|
| Impairment of real estate | | 6,872 |
| | 8,825 |
| | 160,517 |
| | 6,414 |
| | — |
|
| Proportionate share of adjustments for unconsolidated entities | | 540 |
| | 290 |
| | 1,147 |
| | 1,277 |
| | 1,423 |
|
| FFO attributable to common stockholders and limited partners | | $ | 179,232 |
| | $ | 183,108 |
| | $ | 196,775 |
| | $ | 190,893 |
| | $ | 192,161 |
|
| | | | | | | | | | | |
| Acquisition related expenses | | 90 |
| | 27 |
| | 217 |
| | 673 |
| | 1,690 |
|
| Litigation and other non-routine costs, net of insurance recoveries | | 4,630 |
| | 2,917 |
| | (5,175 | ) | | (7,691 | ) | | 8,032 |
|
| Reserve for loan loss | | — |
| | — |
| | — |
| | 15,300 |
| | — |
|
| Gain on investment securities | | — |
| | — |
| | — |
| | — |
| | (4 | ) |
| Loss (gain) on derivative instruments, net | | 2,023 |
| | 177 |
| | 1,086 |
| | (677 | ) | | 1,420 |
|
| Amortization of premiums and discounts on debt and investments, net | | (3,553 | ) | | (4,030 | ) | | (4,426 | ) | | (5,107 | ) | | (4,920 | ) |
| Amortization of above-market lease assets and deferred lease incentives, net of amortization of below-market lease liabilities | | 1,632 |
| | 1,248 |
| | 1,296 |
| | 1,299 |
| | 1,152 |
|
| Net direct financing lease adjustments | | 571 |
| | 590 |
| | 559 |
| | 544 |
| | 507 |
|
| Amortization and write-off of deferred financing costs | | 6,878 |
| | 7,461 |
| | 7,307 |
| | 7,321 |
| | 11,320 |
|
| Loss (gain) on extinguishment and forgiveness of debt, net | | 2,003 |
| | (252 | ) | | — |
| | 490 |
| | — |
|
| Straight-line rent, net of bad debt expense related to straight-line rent | | (12,319 | ) | | (15,663 | ) | | (13,045 | ) | | (17,589 | ) | | (21,705 | ) |
| Equity-based compensation expense | | 1,201 |
| | 1,925 |
| | 799 |
| | 1,840 |
| | 1,073 |
|
| Other amortization and non-cash charges | | — |
| | — |
| | — |
| | 1 |
| | (1 | ) |
| Proportionate share of adjustments for unconsolidated entities | | (17 | ) | | 91 |
| | 135 |
| | 42 |
| | 694 |
|
| AFFO attributable to common stockholders and limited partners | | $ | 182,371 |
| | $ | 177,599 |
| | $ | 185,528 |
| | $ | 187,339 |
| | $ | 191,419 |
|
| | | | | | | | | | | |
| Weighted-average shares outstanding - basic | | 943,480,170 |
| | 904,107,378 |
| | 903,825,726 |
| | 903,638,159 |
| | 903,461,323 |
|
Effect of Limited Partner OP Units and dilutive securities (1) | | 25,206,373 |
| | 27,144,667 |
| | 26,354,148 |
| | 25,729,149 |
| | 25,995,886 |
|
Weighted-average shares outstanding - diluted (2) | | 968,686,543 |
| | 931,252,045 |
| | 930,179,874 |
| | 929,367,308 |
| | 929,457,209 |
|
| | | | | | | | | | | |
| FFO attributable to common stockholders and limited partners per diluted share | | $ | 0.185 |
| | $ | 0.197 |
| | $ | 0.212 |
| | $ | 0.205 |
| | $ | 0.207 |
|
| AFFO attributable to common stockholders and limited partners per diluted share | | $ | 0.188 |
| | $ | 0.191 |
| | $ | 0.199 |
| | $ | 0.202 |
| | $ | 0.206 |
|
___________________________________
| |
| (1) | Dilutive securities include unvested restricted shares of common stock and unvested restricted stock units. |
| |
| (2) | Weighted-average shares for all periods presented exclude the effect of the convertible debt as the Company would expect to settle the debt in cash and any shares underlying restricted stock units that are contingently issuable which are not issuable based on the Company’s level of achievement of certain performance targets through the respective reporting period. |
See the Definitions section for a description of the Company's non-GAAP and other financial measures.
VEREIT, Inc. | WWW.VEREIT.COM | 16
|
| | |
| | |
| Q3 2016 SUPPLEMENTAL INFORMATION |
|
|
| |
EBITDA and Normalized EBITDA - REI Segment (unaudited, in thousands) |
| |
|
| | | | | | | | | | | | | | | | | | | | |
| | | Three Months Ended |
| | | September 30,
2016 | | June 30,
2016 | | March 31,
2016 | | December 31,
2015 | | September 30,
2015 |
| Net income (loss) | | $ | 30,006 |
| | $ | 2,167 |
| | $ | (115,534 | ) | | $ | (5,961 | ) | | $ | 8,740 |
|
| Adjustments: | | | | | | | | | | |
| Interest expense | | 79,869 |
| | 82,468 |
| | 80,426 |
| | 82,591 |
| | 89,530 |
|
| Depreciation and amortization | | 187,897 |
| | 190,236 |
| | 195,991 |
| | 197,409 |
| | 200,158 |
|
| Provision for (benefit from) income taxes | | 1,539 |
| | 1,791 |
| | 1,365 |
| | (3,642 | ) | | 2,238 |
|
| Proportionate share of adjustments for unconsolidated entities | | 959 |
| | 554 |
| | 1,822 |
| | 1,978 |
| | 2,554 |
|
| EBITDA | | $ | 300,270 |
| | $ | 277,216 |
| | $ | 164,070 |
| | $ | 272,375 |
| | $ | 303,220 |
|
| (Gain) loss on disposition of real estate assets, including joint ventures, net | | (28,111 | ) | | (437 | ) | | (27,373 | ) | | 9,727 |
| | (187 | ) |
| Impairment of real estate assets | | 6,872 |
| | 8,825 |
| | 160,517 |
| | 6,414 |
| | — |
|
| Reserve for loan loss | | — |
| | — |
| | — |
| | 15,300 |
| | — |
|
| Acquisition related expenses | | 90 |
| | 27 |
| | 217 |
| | 673 |
| | 1,690 |
|
| Litigation and other non-routine costs, net of insurance recoveries | | 4,630 |
| | 2,917 |
| | (5,175 | ) | | (7,691 | ) | | 8,032 |
|
| Gain on investment securities | | — |
| | — |
| | — |
| | — |
| | (4 | ) |
| Loss (gain) on derivative instruments, net | | 2,023 |
| | 177 |
| | 1,086 |
| | (677 | ) | | 1,420 |
|
| Amortization of above-market lease assets and deferred lease incentives, net of amortization of below-market lease liabilities | | 1,632 |
| | 1,248 |
| | 1,296 |
| | 1,299 |
| | 1,152 |
|
| Loss (gain) on extinguishment and forgiveness of debt, net | | 2,003 |
| | (252 | ) | | — |
| | 490 |
| | — |
|
| Net direct financing lease adjustments | | 571 |
| | 590 |
| | 559 |
| | 544 |
| | 507 |
|
| Straight-line rent, net of bad debt expense related to straight-line rent | | (12,319 | ) | | (15,663 | ) | | (13,045 | ) | | (17,589 | ) | | (21,705 | ) |
| Other amortization and non-cash charges | | (32 | ) | | (39 | ) | | (3 | ) | | (28 | ) | | 10 |
|
| Proportionate share of adjustments for unconsolidated entities | | (36 | ) | | 74 |
| | 94 |
| | (15 | ) | | 608 |
|
| Normalized EBITDA | | $ | 277,593 |
| | $ | 274,683 |
| | $ | 282,243 |
| | $ | 280,822 |
| | $ | 294,743 |
|
See the Definitions section for a description of the Company's non-GAAP and other financial measures.
VEREIT, Inc. | WWW.VEREIT.COM | 17
|
| | |
| | |
| Q3 2016 SUPPLEMENTAL INFORMATION |
|
|
| |
Net Operating Income - REI Segment (unaudited, dollars in thousands) |
| |
REI Segment NOI and Cash NOI
|
| | | | | | | | | | | | | | | | | | | | |
| | | Three Months Ended |
| | | September 30,
2016 | | June 30,
2016 | | March 31,
2016 | | December 31,
2015 | | September 30,
2015 |
Rental income - as reported(1) | | 303,383 |
| | $ | 311,352 |
| | $ | 313,971 |
| | $ | 322,079 |
| | $ | 333,766 |
|
| Direct financing lease income - as reported | | 494 |
| | 535 |
| | 569 |
| | 623 |
| | 659 |
|
| Operating expense reimbursements - as reported | | 27,969 |
| | 26,646 |
| | 23,247 |
| | 27,359 |
| | 22,983 |
|
| Property operating expense - as reported | | (34,820 | ) | | (38,199 | ) | | (34,813 | ) | | (35,308 | ) | | (31,950 | ) |
| NOI | | 297,026 |
|
| 300,334 |
|
| 302,974 |
| | 314,753 |
| | 325,458 |
|
| Adjustments: | | | | | | | | | | |
| Straight-line rent, net of bad debt expense related to straight-line rent | | (12,319 | ) | | (15,663 | ) | | (13,045 | ) | | (17,589 | ) | | (21,705 | ) |
| Amortization of above-market lease assets and deferred lease incentives, net of amortization of below-market lease liabilities | | 1,632 |
| | 1,248 |
| | 1,296 |
| | 1,299 |
| | 1,152 |
|
| Net direct financing lease adjustments | | 571 |
| | 590 |
| | 559 |
| | 544 |
| | 507 |
|
| Cash NOI | | $ | 286,910 |
|
| $ | 286,509 |
|
| $ | 291,784 |
| | $ | 299,007 |
| | $ | 305,412 |
|
| |
| (1) | Rental income includes percentage rent of $1.2 million, $1.7 million, $2.5 million, $1.8 million and $2.1 million for the three months ended September 30, 2016 , June 30, 2016, March 31, 2016, December 31, 2015, and September 30, 2015, respectively. |
Normalized Cash NOI
|
| | | | |
| | | Three Months Ended |
| | | September 30, 2016 |
| Cash NOI | | $ | 286,910 |
|
Adjustments for intra-quarter dispositions and completed build-to-suit properties(1) | | (1,374 | ) |
| Normalized Cash NOI | | $ | 285,536 |
|
___________________________________
| |
| (1) | For properties acquired or build-to-suits completed during the three months ended September 30, 2016 the adjustment eliminates Cash NOI for such properties and replaces Cash NOI for the partial period with an amount estimated to be equivalent to Cash NOI for the full period. For properties disposed of during the three months ended September 30, 2016, the adjustment eliminates Cash NOI for the period. |
See the Definitions section for a description of the Company's non-GAAP and other financial measures.
VEREIT, Inc. | WWW.VEREIT.COM | 18
|
| | |
| | |
| Q3 2016 SUPPLEMENTAL INFORMATION |
|
|
| |
Same Store Contract Rental Revenue (unaudited, dollars in thousands) |
| |
The Company reviews the stabilized operating results from properties that we refer to as "same store." In determining the same store property pool, we include all properties that were owned for the entirety of both the current and prior reporting periods, except for properties during the current or prior year that were under development or redevelopment. The following tables show the Company's same store portfolio statistics, which included 4,187(1) properties, with 95.9 million aggregate square feet, acquired prior to July 1, 2015 and owned through September 30, 2016:
|
| | | | | | | | | | | | |
| | | Three Months Ended September 30, | | Increase/(Decrease) |
| | | 2016 | | 2015 | | $ Change | | % Change |
| Contract Rental Revenue | | 287,382 |
| | 287,069 |
| | 313 |
| | 0.1 | % |
| Economic occupancy rate | | 98.0 | % | | 98.3 | % | | NA |
| | NA |
|
|
| | | | | | | | | | | | | | | | | | | |
| | | | | Contract Rental Revenue | |
| | | Number of | | Three Months Ended September 30, | | Increase/(Decrease) | |
| | | Properties | | 2016 | | 2015 | | $ Change | | % Change | |
| Single-tenant retail | | 2,001 |
| | $ | 101,128 |
| | $ | 100,077 |
| | $ | 1,051 |
| | 1.1 | % | |
| Anchored shopping centers | | 20 |
| | 5,900 |
| | 5,852 |
| | 48 |
| | 0.8 | % | |
| Restaurant | | 1,837 |
| | 66,127 |
| | 68,047 |
| | (1,920 | ) | | (2.8 | )% | (3) |
| Industrial and Distribution | | 160 |
| | 47,366 |
| | 46,717 |
| | 649 |
| | 1.4 | % | |
| Office | | 159 |
| | 66,730 |
| | 66,245 |
| | 485 |
| | 0.7 | % | |
Other(2) | | 10 |
| | 131 |
| | 131 |
| | — |
| | — | % | |
| Total | | 4,187 |
| | $ | 287,382 |
| | $ | 287,069 |
| | $ | 313 |
| | 0.1 | % | (4) |
| |
| (1) | Development and expansion properties are included in the same store population if the placed in service date was prior to July 1, 2015. |
| |
| (2) | Other properties include billboards, land and parking lots. |
| |
| (3) | Ovation Brands, Inc. filed for chapter 11 bankruptcy on March 7, 2016. Excluding the impact of Ovation Brands, Inc., restaurant same store contract rental revenue was flat during the three months ended September 30, 2016, as compared to the same quarter in 2015. |
| |
| (4) | Excluding the impact of Ovation Brands, Inc., total same store contract rental revenue increased 0.8% during the three months ended September 30, 2016, as compared to the same quarter in 2015. |
See the Definitions section for a description of the Company's non-GAAP and other financial measures.
VEREIT, Inc. | WWW.VEREIT.COM | 19
|
| | |
| | |
| Q3 2016 SUPPLEMENTAL INFORMATION |
|
|
| |
| Same Store Contract Rental Revenue |
| |
The following graphs compare the Company's same store Contract Rental Revenue composition to the Company's total portfolio,
based on Annualized Rental Income, as of September 30, 2016.
See the Definitions section for a description of the Company's non-GAAP and other financial measures.
VEREIT, Inc. | WWW.VEREIT.COM | 20
|
| | |
| | |
| Q3 2016 SUPPLEMENTAL INFORMATION |
|
|
| |
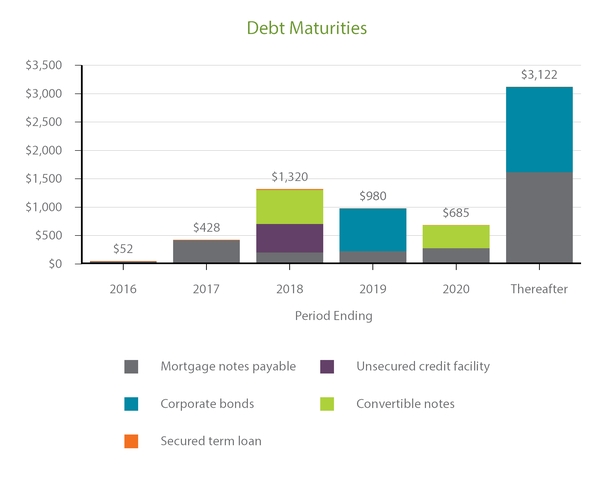
Debt Outstanding and Preferred Equity Summary (unaudited, dollars in thousands) |
| |
|
| | | | | | | | | | | | | | | | | | | | | | | | | | | | |
| Principal Payments Due | | Total | | 2016 | | 2017 | | 2018 | | 2019 | | 2020 | | Thereafter |
| Mortgage notes payable | | $ | 2,813,829 |
| | $ | 49,767 |
| | $ | 420,662 |
| | $ | 209,229 |
| | $ | 229,516 |
| | $ | 282,190 |
| | $ | 1,622,465 |
|
| Unsecured credit facility | | 500,000 |
| | — |
| | — |
| | 500,000 |
| | — |
| | — |
| | — |
|
| Corporate bonds | | 2,250,000 |
| | — |
| | — |
| | — |
| | 750,000 |
| | — |
| | 1,500,000 |
|
| Convertible notes | | 1,000,000 |
| | — |
| | — |
| | 597,500 |
| | — |
| | 402,500 |
| | — |
|
| Secured term loan | | 23,010 |
| | 2,063 |
| | 7,680 |
| | 13,267 |
| | — |
| | — |
| | — |
|
| Total | | $ | 6,586,839 |
| | $ | 51,830 |
| | $ | 428,342 |
| | $ | 1,319,996 |
| | $ | 979,516 |
|
| $ | 684,690 |
| | $ | 3,122,465 |
|
|
| | | | | | | | | |
| Debt Type | | Percentage of Debt Outstanding | | Weighted-Average Effective Interest Rate | | Weighted-Average Years to Maturity |
| Mortgage notes payable | | 42.7 | % | | 5.01 | % | | 4.6 |
|
| Unsecured credit facility | | 7.6 | % | | 3.25 | % | | 1.7 |
|
| Corporate bonds | | 34.2 | % | | 4.06 | % | | 5.8 |
|
| Convertible notes | | 15.2 | % | | 3.30 | % | | 2.8 |
|
| Secured term loan | | 0.3 | % | | 5.81 | % | | 1.3 |
|
| Total | | 100.0 | % | | 4.29 | % | | 4.5 |
|
|
| | | | | | | | | |
| Debt Type | | Percentage of Debt Outstanding | | Weighted-Average Effective Interest Rate | | Weighted-Average Years to Maturity |
| Total unsecured debt | | 56.9 | % | | 3.75 | % | | 4.5 |
|
| Total secured debt | | 43.1 | % | | 5.01 | % | | 4.6 |
|
| Total | | 100.0 | % | | 4.29 | % | | 4.5 |
|
| | | | | | | |
Total fixed-rate debt (1) | | 99.9 | % | | 4.29 | % | | 4.5 |
|
| Total variable-rate debt | | 0.1 | % | | 3.84 | % | | 0.9 |
|
| Total | | 100.0 | % | | 4.29 | % | | 4.5 |
|
|
| | | | | | | | | | |
| Preferred Equity | | Balance (2) | | Percent of Total Preferred Equity | | Dividend Rate |
| Series F preferred stock | | $ | 1,070,853 |
| | 100.00 | % | | 6.7 | % |
| |
| (1) | Includes $742.4 million of variable-rate debt with its interest rate fixed by way of an interest rate swap agreement. |
| |
| (2) | Balance represents 42.8 million shares outstanding at September 30, 2016 multiplied by the liquidation preference of $25 per share. |
See the Definitions section for a description of the Company's non-GAAP and other financial measures.
VEREIT, Inc. | WWW.VEREIT.COM | 21
|
| | |
| | |
| Q3 2016 SUPPLEMENTAL INFORMATION |
|
|
| |
Debt and Preferred Equity Summary (cont.) (unaudited, dollars in millions) |
| |
See the Definitions section for a description of the Company's non-GAAP and other financial measures.
VEREIT, Inc. | WWW.VEREIT.COM | 22
|
| | |
| | |
| Q3 2016 SUPPLEMENTAL INFORMATION |
|
|
| |
Mortgage Notes Payable (unaudited, dollars in thousands) |
| |
|
| | | | | | | | | | | | | | |
| Lender | | Maturity | | Debt Outstanding As Of September 30, 2016 | | Coupon Rate | | Effective Rate (1) | | Payment Terms (2) |
| Cantor Commercial Real Estate Lending, L.P. | | 1/6/2024 | | $ | 465,000 |
| | 4.97 | % | | 4.97 | % | | I/O |
| Cantor Commercial Real Estate Lending, L.P. | | 1/6/2024 | | 155,000 |
| | 4.97 | % | | 4.97 | % | | I/O |
| Wells Fargo Bank, National Association | | 1/1/2018 | | 131,801 |
| | 5.61 | % | | 5.61 | % | | P&I |
| JPMorgan Chase Bank, N.A. | | 9/1/2020 | | 99,608 |
| | 5.55 | % | | 5.55 | % | | P&I |
| Bank of America, N.A. | | 1/1/2017 | | 94,884 |
| | 6.30 | % | | 6.38 | % | | I/O |
| Wells Fargo Bank, National Association | | 3/1/2023 | | 74,250 |
| | 4.23 | % | | 4.23 | % | | I/O |
| Wells Fargo Bank, National Association | | 7/1/2022 | | 68,110 |
| | 4.54 | % | | 4.54 | % | | I/O |
| Wells Fargo Bank, National Association | | 1/1/2023 | | 66,000 |
| | 4.24 | % | | 4.24 | % | | I/O |
| Goldman Sachs Commercial Mortgage Capital, L.P. | | 6/6/2020 | | 62,649 |
| | 5.73 | % | | 5.73 | % | | P&I |
| Wells Fargo Bank, National Association | | 5/1/2021 | | 60,450 |
| | 5.54 | % | | 5.54 | % | | I/O |
| PNC Bank, National Association | | 1/1/2019 | | 59,500 |
| | 4.10 | % | | 4.10 | % | | I/O |
| Citigroup Global Markets Realty Corp | | 5/6/2022 | | 54,300 |
| | 6.05 | % | | 6.05 | % | | I/O |
| Bank of America, N.A. | | 1/1/2017 | | 51,836 |
| | 5.90 | % | | 5.91 | % | | I/O |
| Capital One, N.A. | | 11/20/2019 | | 51,400 |
| | 1mo. Libor + 1.95% |
| (3) | 5.22 | % | | I/O through 11/01/2017, then P&I |
| American General Life Insurance Company | | 11/1/2021 | | 51,250 |
| | 5.25 | % | | 5.25 | % | | I/O |
| US Bank National Association | | 8/11/2029 | | 44,676 |
| | 7.23 | % | | 7.73 | % | | I/O |
| Wells Fargo Bank, National Association | | 2/1/2017 | | 48,500 |
| | 1mo. Libor + 2.47% |
| (3) | 3.79 | % | | I/O |
| JPMorgan Chase Bank, N.A. | | 5/1/2021 | | 46,910 |
| | 5.53 | % | | 5.53 | % | | I/O |
| Goldman Sachs Commercial Mortgage Capital, L.P. | | 5/6/2021 | | 46,670 |
| | 5.92 | % | | 5.92 | % | | I/O |
| People's United Bank | | 4/1/2021 | | 42,277 |
| | 5.55 | % | | 5.55 | % | | P&I |
| JPMorgan Chase Bank, N.A. | | 6/1/2020 | | 40,939 |
| | 5.71 | % | | 5.71 | % | | P&I |
| Wells Fargo Bank, National Association | | 6/1/2022 | | 41,000 |
| | 4.73 | % | | 4.73 | % | | I/O |
| Morgan Stanley Mortgage Capital Holdings LLC | | 1/1/2023 | | 40,800 |
| | 4.46 | % | | 4.46 | % | | I/O |
| JPMorgan Chase Bank, N.A. | | 11/1/2019 | | 38,500 |
| | 4.10 | % | | 4.10 | % | | I/O |
| JPMorgan Chase Bank, N.A. | | 11/1/2017 | | 38,315 |
| | 6.34 | % | | 6.34 | % | | I/O |
| The Royal Bank of Scotland Plc | | 1/1/2021 | | 34,000 |
| | 5.48 | % | | 5.48 | % | | I/O |
| Goldman Sachs Mortgage Company | | 12/6/2020 | | 31,500 |
| | 5.25 | % | | 5.25 | % | | I/O |
| Oritani Bank | | 5/1/2024 | | 30,050 |
| | 3.25 | % | | 3.25 | % | | I/O through 05/01/2019, then P&I |
| Goldman Sachs Mortgage Company | | 12/6/2020 | | 30,000 |
| | 5.25 | % | | 5.25 | % | | I/O |
| BOKF, NA dba Bank of Oklahoma | | 7/29/2018 | | 28,625 |
| | 1mo. Libor + 2.75% |
| (3) | 4.10 | % | | I/O |
| Jackson National Life Insurance Company | | 10/1/2021 | | 29,450 |
| | 4.25 | % | | 4.25 | % | | I/O through 11/01/2018, then P&I |
| German American Capital Corporation | | 10/6/2022 | | 29,160 |
| | 4.48 | % | | 4.48 | % | | I/O |
| PNC Bank, National Association | | 9/1/2022 | | 27,827 |
| | 4.00 | % | | 4.00 | % | | P&I |
| German American Capital Corporation | | 10/6/2022 | | 28,440 |
| | 4.48 | % | | 4.48 | % | | I/O |
| BOKF, NA dba Bank of Texas | | 7/31/2017 | | 28,350 |
| | 1mo. Libor + 2.20% |
| (3) | 3.28 | % | | I/O |
| PNC Bank, National Association | | 6/1/2022 | | 27,750 |
| | 4.22 | % | | 4.22 | % | | I/O |
| GS Commercial Real Estate LP | | 8/6/2019 | | 27,725 |
| | 4.73 | % | | 4.73 | % | | I/O |
| Jackson National Life Insurance Company | | 7/1/2019 | | 27,200 |
| | 3.10 | % | | 3.10 | % | | I/O |
| LaSalle Bank National Association | | 1/1/2017 | | 25,620 |
| | 5.81 | % | | 5.81 | % | | I/O |
| Bank of America, N.A. | | 9/1/2017 | | 23,801 |
| | 5.28 | % | | 5.28 | % | | P&I |
| John Hancock Life Insurance Company | | 10/3/2022 | | 22,500 |
| | 4.04 | % | | 4.04 | % | | I/O |
| BOKF, NA dba Bank of Texas | | 12/31/2018 | | 21,766 |
| | 1mo. Libor + 1.80% |
| (3) | 3.57 | % | | I/O |
See the Definitions section for a description of the Company's non-GAAP and other financial measures.
VEREIT, Inc. | WWW.VEREIT.COM | 23
|
| | |
| | |
| Q3 2016 SUPPLEMENTAL INFORMATION |
|
|
| |
Mortgage Notes Payable (cont.) (unaudited, dollars in thousands) |
| |
|
| | | | | | | | | | | | | | |
| Lender | | Maturity | | Debt Outstanding As Of September 30, 2016 | | Coupon Rate | | Effective Rate (1) | | Payment Terms (2) |
| Aviva Life and Annuity Company | | 7/1/2021 | | $ | 19,600 |
| | 5.02 | % | | 5.02 | % | | I/O through 08/01/2019, then P&I |
| German American Capital Corp | | 6/6/2022 | | 19,260 |
| | 4.60 | % | | 4.60 | % | | P&I |
| The Variable Annuity Life Insurance Company | | 1/1/2023 | | 19,525 |
| | 4.00 | % | | 4.00 | % | | I/O |
| Morgan Stanley Mortgage Capital Holdings LLC | | 5/10/2021 | | 19,513 |
| | 5.67 | % | | 5.67 | % | | I/O |
| Oritani Bank | | 5/1/2024 | | 18,889 |
| | 3.25 | % | | 3.25 | % | | I/O through 05/01/2019, then P&I |
| The Royal Bank of Scotland Plc | | 3/1/2021 | | 18,100 |
| | 5.88 | % | | 5.88 | % | | I/O |
| US Bank National Association | | 12/11/2016 | | 17,500 |
| | 5.55 | % | | 5.55 | % | | I/O |
| BOKF, NA dba Bank of Texas | | 7/31/2017 | | 16,555 |
| | 1mo. Libor + 2.20% |
| (3) | 3.28 | % | | I/O |
| JPMorgan Chase Bank, National Association | | 5/1/2021 | | 15,910 |
| | 5.54 | % | | 5.54 | % | | P&I |
| US Bank National Association | | 1/11/2017 | | 16,200 |
| | 5.48 | % | | 5.48 | % | | I/O |
| Wachovia Bank, National Association | | 12/11/2016 | | 16,043 |
| | 5.63 | % | | 5.63 | % | | I/O |
| Oritani Bank | | 1/1/2023 | | 15,000 |
| | 3.75 | % | | 3.75 | % | | I/O through 01/01/2018, then P&I |
| BOKF, NA dba Bank of Texas | | 12/31/2018 | | 14,150 |
| | 1mo. Libor + 1.80% |
| (3) | 3.57 | % | | I/O |
| BOKF, NA dba Bank of Texas | | 12/31/2020 | | 13,420 |
| | 1mo. Libor + 1.85% |
| (3) | 4.25 | % | | I/O |
| BOKF, NA dba Bank of Texas | | 7/13/2017 | | 12,725 |
| | 1mo. Libor + 2.25% |
| (3) | 3.43 | % | | I/O |
| Goldman Sachs Commercial Mortgage Capital, L.P. | | 9/6/2017 | | 12,270 |
| | 3.70 | % | | 3.70 | % | | I/O |
| Customers Bank | | 12/29/2016 | | 11,625 |
| | 3.75 | % | | 3.75 | % | | I/O |
| JPMorgan Chase Bank, N.A. | | 7/1/2020 | | 11,196 |
| | 5.50 | % | | 5.50 | % | | P&I |
| US Bank National Association | | 2/11/2017 | | 10,332 |
| | 5.68 | % | | 5.68 | % | | I/O |
| 40/86 Mortgage Capital, Inc. | | 1/1/2019 | | 10,050 |
| | 5.00 | % | | 5.00 | % | | I/O |
| Monumental Life Insurance Company | | 4/1/2023 | | 9,558 |
| | 3.95 | % | | 3.95 | % | | P&I |
| Amegy Bank, National Association | | 8/19/2017 | | 9,687 |
| | 1mo. Libor + 2.95% |
| | 3.79 | % | | I/O |
| Transamerica Life Insurance Company | | 8/1/2030 | | 7,173 |
| | 5.57 | % | | 5.57 | % | | P&I |
| Transamerica Life Insurance Company | | 8/1/2030 | | 6,397 |
| | 5.32 | % | | 5.32 | % | | P&I |
| US Bank National Association | | 5/11/2017 | | 6,262 |
| | 5.45 | % | | 5.45 | % | | I/O |
| Customers Bank | | 8/16/2017 | | 5,500 |
| | 3.63 | % | | 3.63 | % | | I/O |
| Wells Fargo Bank, National Association | | 3/1/2017 | | 4,800 |
| | 1mo. Libor + 2.50% |
| (3) | 3.76 | % | | I/O |
| Bear Stearns Commercial Mortgage, Inc. | | 9/1/2017 | | 1,678 |
| | 5.88 | % | | 5.88 | % | | I/O |
| BOKF, NA dba Bank of Texas | | 4/12/2018 | | 1,562 |
| | 1mo. Libor + 2.45% |
| (3) | 3.39 | % | | I/O |
| Capital Lease Funding, LLC | | 7/15/2018 | | 1,525 |
| | 7.20 | % | | 7.20 | % | | P&I |
| US Bank National Association | | 4/15/2019 | | 1,258 |
| | 5.40 | % | | 5.40 | % | | I/O |
| US Bank National Association | | 12/11/2016 | | 1,250 |
| | 6.18 | % | | 6.18 | % | | I/O |
| BOKF, NA dba Bank of Texas | | 4/12/2018 | | 562 |
| | 1mo. Libor + 2.45% |
| (3) | 3.39 | % | | I/O |
| Transamerica Life Insurance Company | | 8/1/2030 | | 365 |
| | 5.93 | % | | 5.93 | % | | P&I |
| | | | | $ | 2,813,829 |
| | | | 5.01 | % | | |
| |
| (1) | Represents interest rate in effect at September 30, 2016. For loans subject to interest rate swaps, this represents the all-in fixed interest rate. |
| |
| (2) | I/O means interest only is due monthly with the principal due at maturity. P&I means both principal and interest are due monthly. |
| |
| (3) | Variable-rate loan fixed by way of interest rate swap agreement. |
See the Definitions section for a description of the Company's non-GAAP and other financial measures.
VEREIT, Inc. | WWW.VEREIT.COM | 24
|
| | |
| | |
| Q3 2016 SUPPLEMENTAL INFORMATION |
|
|
| |
Credit Facility and Corporate Bond Covenants (unaudited) |
| |
The following is a summary of key financial covenants for the Company's unsecured credit facility and corporate bonds, as defined and calculated per the terms of the facility's credit agreement and the bonds' governing documents, respectively. These calculations, which are not based on U.S. GAAP measurements, are presented to investors to show that the Company is in compliance with the covenants and are not measures of our liquidity or performance. As of September 30, 2016, the Company believes it is in compliance with these covenants based on the covenant limits and calculations in place at that time.
|
| | | | |
| Unsecured Credit Facility Key Covenants | | Required | | September 30, 2016 |
| Minimum tangible net worth | | ≥ $5.5B | | $9.4B |
| Ratio of total indebtedness to total asset value | | ≤ 60% | | 39.5% |
| Ratio of adjusted EBITDA to fixed charges | | ≥ 1.5x | | 2.78x |
| Ratio of secured indebtedness to total asset value | | ≤ 45% | | 16.7% |
| Ratio of unsecured indebtedness to unencumbered asset value | | ≤ 60% | | 34.0% |
| Ratio of unencumbered adjusted NOI to unsecured interest expense | | ≥ 1.75x | | 4.69x |
| Minimum unencumbered asset value | | ≥ $8.0B | | $10.7B |
|
| | | | |
| Corporate Bond Key Covenants | | Required | | September 30, 2016 |
| Limitation on incurrence of total debt | | ≤ 65% | | 40.1% |
| Limitation on incurrence of secured debt | | ≤ 40% | | 17.5% |
| Debt service coverage | | ≥ 1.5x | | 3.84x |
| Maintenance of total unencumbered assets | | ≥ 150% | | 291.3% |
See the Definitions section for a description of the Company's non-GAAP and other financial measures.
VEREIT, Inc. | WWW.VEREIT.COM | 25
|
| | |
| | |
| Q3 2016 SUPPLEMENTAL INFORMATION |
|
|
| |
Development Projects and Dispositions (unaudited, square feet and dollars in thousands) |
| |
Development Projects
During the three months ended September 30, 2016, the Company capitalized $0.8 million of additional development costs related to two projects, and placed one project into service at $3.5 million.
As of September 30, 2016, there is one Family Dollar build-to-suit property under development and estimated to be completed during Q1 2017, with $1.1 million invested to date and an estimated remaining investment of $0.7 million, and an estimated cash cap rate of 7.3%.
Dispositions
The following table shows the 78 properties that were disposed of and the related gains/losses during the three months ended September 30, 2016. |
| | | | | | | | | | | | | | | | | | | | | | | | | | | |
| Property | | Number of Properties | | Square Feet | | Weighted Average Remaining Lease Term (Years)(1) | | Cash Cap Rate | | Sale Price | | Real Estate Gain (Loss)(2) | | Goodwill Allocation(3) | | GAAP Gain (Loss)(4) |
| Single-tenant retail | | 7 | | 110 |
| | 15.8 |
| | 6.3 | % | | $ | 39,526 |
| | $ | 6,885 |
| | $ | (1,879 | ) | | $ | 5,006 |
|
| Office | | 3 | | 204 |
| | 5.2 |
| | 6.8 | % | | 77,403 |
| | 7,512 |
| | — |
| | 7,512 |
|
| Industrial and Distribution | | 3 | | 494 |
| | 13.3 |
| | 5.3 | % | | 52,584 |
| | 11,922 |
| | (185 | ) | | 11,737 |
|
Red Lobster(5) | | 23 | | 164 |
| | 23.0 |
| | 6.9 | % | | 78,134 |
| | 6,082 |
| | (3,871 | ) | | 2,211 |
|
| Other Restaurants | | 24 | | 93 |
| | 2.8 |
| | 8.2 | % | | 24,606 |
| | 3,096 |
| | (1,124 | ) | | 1,972 |
|
| Vacant | | 10 | | 38 |
| | N/A |
| | N/A |
| | 5,740 |
| | 818 |
| | (241 | ) | | 577 |
|
Other (6) | | 8 | | 267 |
| | N/A |
| | N/A |
| | — |
| | (503 | ) | | — |
| | (503 | ) |
| Total dispositions | | 78 | | 1,370 | | 12.7 |
| | 6.6 | % | | $ | 277,993 |
| | $ | 35,812 |
| | $ | (7,300 | ) | | $ | 28,512 |
|
| Held for sale assets | | | | | | | | | | | | | | | (401 | ) |
| Total gain on disposition of real estate , net | | | | | | | | | $ | 28,111 |
|
| |
| (1) | Represents the remaining lease term from the date of sale. |
| |
| (2) | Equals sale price less GAAP net book value and selling costs. |
| |
| (3) | In accordance with GAAP, the Company allocates a portion of the REI segment goodwill to a respective property when it is classified as held for sale or when it is disposed of to calculate the GAAP gain (loss). The goodwill allocation presented excludes any amounts allocated to properties classified as held for sale in prior periods. See Note 4 – Goodwill and Other Intangibles of our Quarterly Report on Form 10-Q for the nine months ended September 30, 2016 for a further description of our goodwill allocation methodology. |
| |
| (4) | Equals sale price less GAAP net book value, including goodwill allocation, and selling costs. |
| |
| (5) | The Red Lobster properties were sold under an agreement with the tenant, under which the tenant received a portion of the sales proceeds. The sales price and cash cap rate presented are based on our proceeds after making the participation payment to the tenant. The cash cap rate on the gross sales price of $91.3M was 5.9%. |
| |
| (6) | Includes one property foreclosed upon by the respective lender and seven properties relinquished to the ground lessor upon termination of the ground lease. The gain relating to the property foreclosed upon is included in (loss) gain on extinguishment and forgiveness of debt, net in the Consolidated Statements of Operations. |
See the Definitions section for a description of the Company's non-GAAP and other financial measures.
VEREIT, Inc. | WWW.VEREIT.COM | 26
|
| | |
| | |
| Q3 2016 SUPPLEMENTAL INFORMATION |
|
|
| |
Diversification Statistics: Real Estate Portfolio (unaudited, percentages based on portfolio Annualized Rental Income) |
| |
___________________________________________________
___________________________________________________
___________________________________________________
___________________________________________________
|
| | | | |
Statistics (square feet in thousands) |
| | | | |
| Properties owned | | 4,213 |
| |
| Rentable square feet | | 96,885 |
| |
| Economic occupancy rate | | 98.0 | % | |
| Weighted-average remaining lease term (years) | | 10.0 |
| |
| Investment-Grade Tenants | | 41.5 | % | |
| Flat leases | | 21.7 | % | |
| NNN leases | | 62.0 | % | |
See the Definitions section for a description of the Company's non-GAAP and other financial measures.
VEREIT, Inc. | WWW.VEREIT.COM | 27
|
| | |
| | |
| Q3 2016 SUPPLEMENTAL INFORMATION |
|
|
| |
Top 10 Concentrations: Real Estate Portfolio (unaudited, square feet and dollars in thousands) |
| |
|
| | | | | | | | | | | | | | | | | | |
| Tenant Concentration | | Number of Leases | | Square Feet | | Square Feet as a % of Total Portfolio | | Annualized Rental Income | | Annualized Rental Income as a % of Total Portfolio | | Investment Rating |
| Red Lobster | | 31 |
| | 2,678 |
| | 2.8 | % | | $ | 104,180 |
| | 8.6 | % | | B- |
| Walgreens | | 115 |
| | 1,668 |
| | 1.7 | % | | 41,408 |
| | 3.4 | % | | BBB |
| Family Dollar | | 191 |
| | 3,477 |
| | 3.6 | % | | 38,247 |
| | 3.2 | % | | BB+ |
| FedEx | | 51 |
| | 3,734 |
| | 3.9 | % | | 35,657 |
| | 3.0 | % | | BBB |
| Dollar General | | 404 |
| | 3,741 |
| | 3.9 | % | | 34,246 |
| | 2.8 | % | | BBB |
| CVS | | 98 |
| | 1,388 |
| | 1.4 | % | | 31,343 |
| | 2.6 | % | | BBB+ |
| Albertson's | | 33 |
| | 1,923 |
| | 2.0 | % | | 23,633 |
| | 2.0 | % | | B+ |
| Citizens Bank | | 176 |
| | 851 |
| | 0.9 | % | | 20,686 |
| | 1.7 | % | | A- |
| BJ's Wholesale Club | | 3 |
| | 2,223 |
| | 2.3 | % | | 19,559 |
| | 1.6 | % | | B- |
| AON | | 8 |
| | 1,203 |
| | 1.2 | % | | 18,154 |
| | 1.5 | % | | A- |
| Total | | 1,110 |
| | 22,886 |
| | 23.7 | % | | $ | 367,113 |
| | 30.4 | % | | |
|
| | | | | | | | | | | | | | | | |
| Tenant Industry Concentration | | Number of Leases | | Square Feet | | Square Feet as a % of Total Portfolio | | Annualized Rental Income | | Annualized Rental Income as a % of Total Portfolio |
| Restaurants - Casual Dining | | 368 |
| | 5,362 |
| | 5.5 | % | | $ | 192,272 |
| | 15.9 | % |
| Manufacturing | | 68 |
| | 19,312 |
| | 19.9 | % | | 122,663 |
| | 10.2 | % |
| Restaurants - Quick Service | | 856 |
| | 3,449 |
| | 3.6 | % | | 101,129 |
| | 8.4 | % |
| Retail - Discount | | 622 |
| | 10,054 |
| | 10.4 | % | | 90,759 |
| | 7.5 | % |
| Retail - Pharmacy | | 253 |
| | 3,763 |
| | 3.9 | % | | 86,504 |
| | 7.2 | % |
| Finance | | 304 |
| | 3,050 |
| | 3.2 | % | | 66,392 |
| | 5.5 | % |
| Professional Services | | 71 |
| | 4,222 |
| | 4.4 | % | | 59,644 |
| | 4.9 | % |
| Retail - Grocery & Supermarket | | 83 |
| | 5,445 |
| | 5.6 | % | | 57,092 |
| | 4.7 | % |
| Retail - Home & Garden | | 99 |
| | 7,012 |
| | 7.2 | % | | 50,240 |
| | 4.2 | % |
| Logistics | | 57 |
| | 4,798 |
| | 5.0 | % | | 44,050 |
| | 3.7 | % |
| Total | | 2,781 |
| | 66,467 |
| | 68.7 | % | | $ | 870,745 |
| | 72.2 | % |
|
| | | | | | | | | | | | | | | | |
| Geographic Concentration | | Number of Properties | | Square Feet | | Square Feet as a % of Total Portfolio | | Annualized Rental Income | | Annualized Rental Income as a % of Total Portfolio |
| Texas | | 574 |
| | 11,440 |
| | 11.8 | % | | $ | 161,699 |
| | 13.4 | % |
| Illinois | | 177 |
| | 6,028 |
| | 6.2 | % | | 78,078 |
| | 6.5 | % |
| Florida | | 267 |
| | 4,870 |
| | 5.0 | % | | 67,137 |
| | 5.6 | % |
| California | | 83 |
| | 4,204 |
| | 4.3 | % | | 58,286 |
| | 4.8 | % |
| Pennsylvania | | 167 |
| | 5,749 |
| | 5.9 | % | | 56,289 |
| | 4.7 | % |
| Ohio | | 282 |
| | 5,702 |
| | 5.9 | % | | 54,526 |
| | 4.5 | % |
| Georgia | | 199 |
| | 3,877 |
| | 4.0 | % | | 47,157 |
| | 3.9 | % |
| Indiana | | 137 |
| | 5,926 |
| | 6.1 | % | | 45,172 |
| | 3.7 | % |
| North Carolina | | 171 |
| | 3,688 |
| | 3.8 | % | | 38,818 |
| | 3.2 | % |
| Michigan | | 180 |
| | 2,436 |
| | 2.5 | % | | 36,184 |
| | 3.0 | % |
| Total | | 2,237 |
| | 53,920 |
| | 55.5 | % | | $ | 643,346 |
| | 53.3 | % |
See the Definitions section for a description of the Company's non-GAAP and other financial measures.
VEREIT, Inc. | WWW.VEREIT.COM | 28
|
| | |
| | |
| Q3 2016 SUPPLEMENTAL INFORMATION |
|
| | | | | | | | | | | | | | | | |
| Metropolitan Statistical Area (MSA) Concentration | | Number of Properties | | Square Feet | | Square Feet as a % of Total Portfolio | | Annualized Rental Income | | Annualized Rental Income as a % of Total Portfolio |
| Chicago, IL | | 115 |
| | 5,649 |
| | 5.8 | % | | $ | 69,175 |
| | 5.7 | % |
| Dallas, TX | | 113 |
| | 3,756 |
| | 3.9 | % | | 56,577 |
| | 4.7 | % |
| Houston, TX | | 96 |
| | 2,867 |
| | 3.0 | % | | 31,711 |
| | 2.6 | % |
| Atlanta, GA | | 93 |
| | 2,719 |
| | 2.8 | % | | 28,846 |
| | 2.4 | % |
| Philadelphia, PA | | 52 |
| | 2,028 |
| | 2.1 | % | | 27,956 |
| | 2.3 | % |
| New York, NY | | 25 |
| | 1,132 |
| | 1.2 | % | | 25,709 |
| | 2.1 | % |
| Boston, MA | | 28 |
| | 1,819 |
| | 1.9 | % | | 24,953 |
| | 2.1 | % |
| Phoenix, AZ | | 46 |
| | 1,133 |
| | 1.2 | % | | 21,748 |
| | 1.8 | % |
| Washington, DC | | 28 |
| | 870 |
| | 0.9 | % | | 20,137 |
| | 1.7 | % |
| Indianapolis, IN | | 40 |
| | 2,693 |
| | 2.8 | % | | 20,058 |
| | 1.7 | % |
| Total | | 636 |
| | 24,666 |
| | 25.6 | % | | $ | 326,870 |
| | 27.1 | % |
See the Definitions section for a description of the Company's non-GAAP and other financial measures.
VEREIT, Inc. | WWW.VEREIT.COM | 29
|
| | |
| | |
| Q3 2016 SUPPLEMENTAL INFORMATION |
|
|
| |
Tenants Comprising Over 1% of Annualized Rental Revenue (unaudited, square feet and dollars in thousands) |
| |
|
| | | | | | | | | | | | | | | | | | |
| Tenant | | Number of Leases | | Square Feet | | Square Feet as a % of Total Portfolio | | Annualized Rental Income | | Annualized Rental Income as a % of Total Portfolio | | Investment Rating |
| Red Lobster | | 31 |
| | 2,678 |
| | 2.8 | % | | $ | 104,180 |
| | 8.6 | % | | B- |
| Walgreens | | 115 |
| | 1,668 |
| | 1.7 | % | | 41,408 |
| | 3.4 | % | | BBB |
| Family Dollar | | 191 |
| | 3,477 |
| | 3.6 | % | | 38,247 |
| | 3.2 | % | | BB+ |
| FedEx | | 51 |
| | 3,734 |
| | 3.9 | % | | 35,657 |
| | 3.0 | % | | BBB |
| Dollar General | | 404 |
| | 3,741 |
| | 3.9 | % | | 34,246 |
| | 2.8 | % | | BBB |
| CVS | | 98 |
| | 1,388 |
| | 1.4 | % | | 31,343 |
| | 2.6 | % | | BBB+ |
| Albertson's | | 33 |
| | 1,923 |
| | 2.0 | % | | 23,633 |
| | 2.0 | % | | B+ |
| Citizens Bank | | 176 |
| | 851 |
| | 0.9 | % | | 20,686 |
| | 1.7 | % | | A- |
| BJ's Wholesale Club | | 3 |
| | 2,223 |
| | 2.3 | % | | 19,559 |
| | 1.6 | % | | B- |
| AON | | 8 |
| | 1,203 |
| | 1.2 | % | | 18,154 |
| | 1.5 | % | | A- |
| Petsmart | | 12 |
| | 858 |
| | 0.9 | % | | 17,619 |
| | 1.5 | % | | B+ |
| Goodyear | | 10 |
| | 4,728 |
| | 4.9 | % | | 16,550 |
| | 1.4 | % | | BB |
| General Service Administration | | 20 |
| | 817 |
| | 0.8 | % | | 15,714 |
| | 1.3 | % | | AA+ |
| Tractor Supply | | 58 |
| | 1,213 |
| | 1.3 | % | | 15,709 |
| | 1.3 | % | | NR |
| Amazon | | 3 |
| | 3,048 |
| | 3.2 | % | | 14,159 |
| | 1.2 | % | | AA- |
| L.A. Fitness | | 15 |
| | 656 |
| | 0.7 | % | | 12,723 |
| | 1.1 | % | | B |
| Advance Auto Parts | | 106 |
| | 736 |
| | 0.8 | % | | 12,099 |
| | 1.0 | % | | BBB- |
| Total | | 1,334 |
| | 34,942 |
| | 36.3 | % | | $ | 471,686 |
| | 39.2 | % | | |
See the Definitions section for a description of the Company's non-GAAP and other financial measures.
VEREIT, Inc. | WWW.VEREIT.COM | 30
|
| | |
| | |
| Q3 2016 SUPPLEMENTAL INFORMATION |
|
|
| |
Diversification: Tenant Industry (unaudited, square feet and dollars in thousands) |
| |
|
| | | | | | | | | | | | | | | | |
| Industry | | Number of Leases | | Leased Square Feet | | Leased Square Feet as a % of Total Portfolio | | Annualized Rental Income | | Annualized Rental Income as a % of Total Portfolio |
| Administration & Support Services | | 5 |
| | 430 |
| | 0.5 | % | | $ | 4,054 |
| | 0.3 | % |
| Agricultural | | 2 |
| | 137 |
| | 0.1 | % | | 1,245 |
| | 0.1 | % |
| Education | | 4 |
| | 1,287 |
| | 1.3 | % | | 5,812 |
| | 0.5 | % |
| Entertainment & Recreation | | 20 |
| | 803 |
| | 0.8 | % | | 15,784 |
| | 1.3 | % |
| Finance | | 304 |
| | 3,050 |
| | 3.1 | % | | 66,392 |
| | 5.5 | % |
| Government & Public Services | | 28 |
| | 1,076 |
| | 1.1 | % | | 23,243 |
| | 1.9 | % |
| Healthcare | | 84 |
| | 1,711 |
| | 1.8 | % | | 30,793 |
| | 2.5 | % |
| Information & Communication | | 15 |
| | 507 |
| | 0.5 | % | | 7,766 |
| | 0.6 | % |
| Insurance | | 16 |
| | 1,725 |
| | 1.8 | % | | 34,288 |
| | 2.8 | % |
| Logistics | | 57 |
| | 4,798 |
| | 5.0 | % | | 44,050 |
| | 3.7 | % |
| Manufacturing | | 68 |
| | 19,312 |
| | 19.9 | % | | 122,663 |
| | 10.2 | % |
| Mining & Natural Resources | | 16 |
| | 731 |
| | 0.8 | % | | 14,735 |
| | 1.2 | % |
| Other Services | | 31 |
| | 5,217 |
| | 5.4 | % | | 18,978 |
| | 1.6 | % |
| Professional Services | | 71 |
| | 4,222 |
| | 4.4 | % | | 59,644 |
| | 4.9 | % |
| Real Estate | | 5 |
| | 63 |
| | 0.1 | % | | 978 |
| | 0.1 | % |
| Rental | | 11 |
| | 719 |
| | 0.8 | % | | 6,784 |
| | 0.6 | % |
| Restaurants - Casual Dining | | 368 |
| | 5,362 |
| | 5.5 | % | | 192,272 |
| | 15.9 | % |
| Restaurants - Quick Service | | 856 |
| | 3,449 |
| | 3.6 | % | | 101,129 |
| | 8.4 | % |
| Retail - Apparel & Jewelry | | 14 |
| | 1,400 |
| | 1.4 | % | | 15,268 |
| | 1.3 | % |
| Retail - Department Stores | | 13 |
| | 964 |
| | 1.0 | % | | 8,010 |
| | 0.7 | % |
| Retail - Discount | | 622 |
| | 10,054 |
| | 10.4 | % | | 90,759 |
| | 7.5 | % |
| Retail - Electronics & Appliances | | 22 |
| | 676 |
| | 0.7 | % | | 9,202 |
| | 0.8 | % |
| Retail - Gas & Convenience | | 127 |
| | 526 |
| | 0.5 | % | | 27,375 |
| | 2.3 | % |
| Retail - Grocery & Supermarket | | 83 |
| | 5,444 |
| | 5.6 | % | | 57,092 |
| | 4.7 | % |
| Retail - Hobby, Books & Music | | 9 |
| | 340 |
| | 0.4 | % | | 2,978 |
| | 0.2 | % |
| Retail - Home & Garden | | 99 |
| | 7,012 |
| | 7.2 | % | | 50,240 |
| | 4.2 | % |
| Retail - Home Furnishings | | 40 |
| | 492 |
| | 0.5 | % | | 7,837 |
| | 0.7 | % |
| Retail - Internet | | 3 |
| | 3,048 |
| | 3.2 | % | | 14,159 |
| | 1.2 | % |
| Retail - Motor Vehicle | | 166 |
| | 1,190 |
| | 1.2 | % | | 21,994 |
| | 1.8 | % |
| Retail - Office Supply | | 4 |
| | 76 |
| | 0.1 | % | | 1,155 |
| | 0.1 | % |
| Retail - Pet Supply | | 15 |
| | 902 |
| | 0.9 | % | | 18,453 |
| | 1.5 | % |
| Retail - Pharmacy | | 253 |
| | 3,763 |
| | 3.9 | % | | 86,504 |
| | 7.2 | % |
| Retail - Specialty (Other) | | 23 |
| | 561 |
| | 0.6 | % | | 6,160 |
| | 0.5 | % |
| Retail - Sporting Goods | | 20 |
| | 1,186 |
| | 1.2 | % | | 14,246 |
| | 1.2 | % |
| Retail - Warehouse Clubs | | 7 |
| | 2,631 |
| | 2.7 | % | | 22,673 |
| | 1.9 | % |
| Other | | 11 |
| | 70 |
| | — | % | | 1,371 |
| | 0.1 | % |
| Total | | 3,492 |
| | 94,934 |
| | 98.0 | % | | $ | 1,206,086 |
| | 100.0 | % |
See the Definitions section for a description of the Company's non-GAAP and other financial measures.
VEREIT, Inc. | WWW.VEREIT.COM | 31
|
| | |
| | |
| Q3 2016 SUPPLEMENTAL INFORMATION |
|
|
| |
Diversification: Property Geographic (unaudited, square feet and dollars in thousands) |
| |
|
| | | | | | | | | | | | | | | | |
| Location | | Number of Properties | | Square Feet | | Square Feet as a % of Total Portfolio | | Annualized Rental Income | | Annualized Rental Income as a % of Total Portfolio |
| United States | | | | | | | | | | |
| Alabama | | 147 |
| | 1,583 |
| | 1.6 | % | | $ | 23,715 |
| | 2.0 | % |
| Alaska | | 3 |
| | 25 |
| | — | % | | 774 |
| | 0.1 | % |
| Arizona | | 74 |
| | 1,832 |
| | 1.9 | % | | 31,774 |
| | 2.6 | % |
| Arkansas | | 96 |
| | 1,004 |
| | 1.0 | % | | 12,591 |
| | 1.0 | % |
| California | | 83 |
| | 4,204 |
| | 4.3 | % | | 58,286 |
| | 4.8 | % |
| Colorado | | 49 |
| | 1,749 |
| | 1.8 | % | | 27,283 |
| | 2.3 | % |
| Connecticut | | 18 |
| | 89 |
| | 0.1 | % | | 2,496 |
| | 0.2 | % |
| Delaware | | 11 |
| | 93 |
| | 0.1 | % | | 2,025 |
| | 0.2 | % |
| Florida | | 267 |
| | 4,870 |
| | 5.0 | % | | 67,137 |
| | 5.6 | % |
| Georgia | | 199 |
| | 3,877 |
| | 4.0 | % | | 47,157 |
| | 3.9 | % |
| Idaho | | 18 |
| | 138 |
| | 0.1 | % | | 3,361 |
| | 0.3 | % |
| Illinois | | 177 |
| | 6,028 |
| | 6.2 | % | | 78,078 |
| | 6.5 | % |
| Indiana | | 137 |
| | 5,926 |
| | 6.1 | % | | 45,172 |
| | 3.7 | % |
| Iowa | | 52 |
| | 1,597 |
| | 1.7 | % | | 13,773 |
| | 1.1 | % |
| Kansas | | 44 |
| | 2,344 |
| | 2.4 | % | | 11,343 |
| | 0.9 | % |
| Kentucky | | 81 |
| | 2,153 |
| | 2.2 | % | | 23,616 |
| | 1.9 | % |
| Louisiana | | 96 |
| | 1,617 |
| | 1.7 | % | | 21,560 |
| | 1.8 | % |
| Maine | | 25 |
| | 649 |
| | 0.7 | % | | 8,544 |
| | 0.7 | % |
| Maryland | | 30 |
| | 846 |
| | 0.9 | % | | 16,209 |
| | 1.3 | % |
| Massachusetts | | 39 |
| | 2,579 |
| | 2.7 | % | | 30,170 |
| | 2.5 | % |
| Michigan | | 180 |
| | 2,436 |
| | 2.5 | % | | 36,184 |
| | 3.0 | % |
| Minnesota | | 41 |
| | 505 |
| | 0.5 | % | | 7,154 |
| | 0.6 | % |
| Mississippi | | 76 |
| | 1,833 |
| | 1.9 | % | | 15,027 |
| | 1.2 | % |
| Missouri | | 160 |
| | 1,831 |
| | 1.9 | % | | 24,681 |
| | 2.0 | % |
| Montana | | 10 |
| | 124 |
| | 0.1 | % | | 2,129 |
| | 0.1 | % |
| Nebraska | | 21 |
| | 759 |
| | 0.8 | % | | 11,171 |
| | 0.9 | % |
| Nevada | | 28 |
| | 717 |
| | 0.7 | % | | 8,240 |
| | 0.7 | % |
| New Hampshire | | 20 |
| | 254 |
| | 0.3 | % | | 4,402 |
| | 0.4 | % |
| New Jersey | | 35 |
| | 1,668 |
| | 1.7 | % | | 36,134 |
| | 3.0 | % |
| New Mexico | | 50 |
| | 937 |
| | 1.0 | % | | 13,030 |
| | 1.1 | % |
| New York | | 87 |
| | 1,750 |
| | 1.8 | % | | 32,350 |
| | 2.7 | % |
| North Carolina | | 171 |
| | 3,688 |
| | 3.8 | % | | 38,818 |
| | 3.2 | % |
| North Dakota | | 12 |
| | 201 |
| | 0.2 | % | | 4,277 |
| | 0.4 | % |
| Ohio | | 282 |
| | 5,702 |
| | 5.9 | % | | 54,526 |
| | 4.5 | % |
| Oklahoma | | 80 |
| | 2,063 |
| | 2.1 | % | | 25,244 |
| | 2.1 | % |
| Oregon | | 15 |
| | 309 |
| | 0.3 | % | | 5,137 |
| | 0.4 | % |
| Pennsylvania | | 167 |
| | 5,749 |
| | 5.9 | % | | 56,289 |
| | 4.7 | % |
| Rhode Island | | 14 |
| | 215 |
| | 0.2 | % | | 3,226 |
| | 0.3 | % |
| South Carolina | | 118 |
| | 3,342 |
| | 3.5 | % | | 29,203 |
| | 2.4 | % |
| South Dakota | | 12 |
| | 180 |
| | 0.2 | % | | 2,169 |
| | 0.2 | % |
| Tennessee | | 112 |
| | 3,332 |
| | 3.5 | % | | 29,408 |
| | 2.4 | % |
| Texas | | 574 |
| | 11,440 |
| | 11.8 | % | | 161,699 |
| | 13.4 | % |
| Utah | | 8 |
| | 91 |
| | 0.1 | % | | 1,650 |
| | 0.1 | % |
| Vermont | | 7 |
| | 23 |
| | — | % | | 472 |
| | — | % |
| Virginia | | 111 |
| | 1,893 |
| | 2.0 | % | | 33,243 |
| | 2.8 | % |
| Washington | | 23 |
| | 459 |
| | 0.5 | % | | 9,247 |
| | 0.8 | % |
| West Virginia | | 38 |
| | 237 |
| | 0.3 | % | | 5,673 |
| | 0.5 | % |
See the Definitions section for a description of the Company's non-GAAP and other financial measures.
VEREIT, Inc. | WWW.VEREIT.COM | 32
|
| | |
| | |
| Q3 2016 SUPPLEMENTAL INFORMATION |
|
|
| |
Diversification: Property Geographic (cont.) (unaudited, square feet and dollars in thousands)
|
| |
|
| | | | | | | | | | | | | | | | |
| Location | | Number of Properties | | Square Feet | | Square Feet as a % of Total Portfolio | | Annualized Rental Income | | Annualized Rental Income as a % of Total Portfolio |
| Wisconsin | | 84 |
| | 1,655 |
| | 1.7 | % | | 18,482 |
| | 1.6 | % |
| Wyoming | | 9 |
| | 58 |
| | 0.1 | % | | 1,552 |
| | 0.1 | % |
| Territories | | | | | | | | | | |
| Puerto Rico | | 3 |
| | 88 |
| | 0.1 | % | | 2,430 |
| | 0.2 | % |
| Canadian Provinces | | | | | | | | | | |
| Alberta | | 4 |
| | 32 |
| | — | % | | 1,912 |
| | 0.2 | % |
| Manitoba | | 2 |
| | 16 |
| | — | % | | 827 |
| | 0.1 | % |
| Ontario | | 11 |
| | 78 |
| | 0.1 | % | | 4,208 |
| | 0.4 | % |
| Saskatchewan | | 2 |
| | 17 |
| | — | % | | 828 |
| | 0.1 | % |
| Total | | 4,213 |
| | 96,885 |
| | 100.0 | % | | $ | 1,206,086 |
| | 100.0 | % |
Percentages based on annualized rental income.
See the Definitions section for a description of the Company's non-GAAP and other financial measures.
VEREIT, Inc. | WWW.VEREIT.COM | 33
|
| | |
| | |
| Q3 2016 SUPPLEMENTAL INFORMATION |
|
|
| |
Lease Expirations (unaudited, square feet and dollars in thousands) |
| |
|
| | | | | | | | | | | | | | | | |
| Year of Expiration | | Number of Leases
Expiring | | Leased Square Feet | | Leased Square Feet as a % of Total Portfolio | | Annualized Rental Income Expiring | | Annualized Rental Income Expiring as a % of Total Portfolio |
| Remaining 2016 | | 36 |
| | 1,821 |
| | 1.8 | % | | $ | 11,000 |
| | 0.9 | % |
| 2017 | | 146 |
| | 4,026 |
| | 4.2 | % | | 39,173 |
| | 3.2 | % |
| 2018 | | 217 |
| | 3,670 |
| | 3.8 | % | | 40,051 |
| | 3.3 | % |
| 2019 | | 185 |
| | 3,263 |
| | 3.4 | % | | 55,731 |
| | 4.6 | % |
| 2020 | | 235 |
| | 4,512 |
| | 4.7 | % | | 48,046 |
| | 4.0 | % |
| 2021 | | 193 |
| | 11,221 |
| | 11.6 | % | | 88,290 |
| | 7.3 | % |
| 2022 | | 264 |
| | 9,890 |
| | 10.2 | % | | 83,668 |
| | 6.9 | % |
| 2023 | | 216 |
| | 6,176 |
| | 6.4 | % | | 79,099 |
| | 6.5 | % |
| 2024 | | 179 |
| | 9,214 |
| | 9.5 | % | | 107,559 |
| | 9.0 | % |
| 2025 | | 279 |
| | 4,428 |
| | 4.6 | % | | 63,020 |
| | 5.3 | % |
| Thereafter | | 1,542 |
| | 36,713 |
| | 37.8 | % | | 590,449 |
| | 49.0 | % |
| Total | | 3,492 |
| | 94,934 |
| | 98.0 | % | | $ | 1,206,086 |
| | 100.0 | % |
See the Definitions section for a description of the Company's non-GAAP and other financial measures.
VEREIT, Inc. | WWW.VEREIT.COM | 34
|
| | |
| | |
| Q3 2016 SUPPLEMENTAL INFORMATION |
|
|
| |
Lease Expirations (cont.) (unaudited, square feet and dollars in thousands) |
| |
|
| | | | | | | | | | | | | | | | |
| Year of Expiration | | Number of Leases Expiring | | Leased Square Feet | | Square Feet as a % of Total Portfolio | | Annualized Rental Income Expiring | | Annualized Rental Income Expiring as a % of Total Portfolio |
| | | | | | | | | | | |
| Remaining 2016 | | | | | | | | | | |
| Anchored shopping centers | | 4 |
| | 19 |
| | — | % | | 280 |
| | — | % |
| Restaurant | | 23 |
| | 119 |
| | 0.1 | % | | 969 |
| | 0.1 | % |
| Industrial & Distribution | | 2 |
| | 1,399 |
| | 1.4 | % | | 4,061 |
| | 0.3 | % |
| Office | | 5 |
| | 284 |
| | 0.3 | % | | 5,690 |
| | 0.5 | % |
Other(1) | | 2 |
| | — |
| | — | % | | — |
| | — | % |
| Total Remaining 2016 | | 36 |
| | 1,821 |
| | 1.8 | % | | $ | 11,000 |
| | 0.9 | % |
| | | | | | | | | | | |
| 2017 | |
|
| |
|
| |
|
| |
|
| |
|
|
| Single-tenant retail | | 46 |
| | 282 |
| | 0.3 | % | | $ | 6,105 |
| | 0.5 | % |
| Anchored shopping centers | | 25 |
| | 101 |
| | 0.1 | % | | 2,004 |
| | 0.2 | % |
| Restaurant | | 45 |
| | 452 |
| | 0.5 | % | | 6,959 |
| | 0.6 | % |
| Industrial & Distribution | | 9 |
| | 2,329 |
| | 2.4 | % | | 10,209 |
| | 0.8 | % |
| Office | | 20 |
| | 862 |
| | 0.9 | % | | 13,881 |
| | 1.1 | % |
Other(1) | | 1 |
| | — |
| | — | % | | 15 |
| | — | % |
| Total 2017 | | 146 |
| | 4,026 |
| | 4.2 | % | | $ | 39,173 |
| | 3.2 | % |
| | | | | | | | | | | |
| 2018 | |
|
| |
|
| |
|
| |
|
| |
|
|
| Single-tenant retail | | 72 |
| | 944 |
| | 1.0 | % | | $ | 13,631 |
| | 1.1 | % |
| Anchored shopping centers | | 30 |
| | 304 |
| | 0.3 | % | | 4,213 |
| | 0.4 | % |
| Restaurant | | 88 |
| | 330 |
| | 0.3 | % | | 7,695 |
| | 0.6 | % |
| Industrial & Distribution | | 12 |
| | 1,751 |
| | 1.8 | % | | 7,008 |
| | 0.6 | % |
| Office | | 13 |
| | 341 |
| | 0.4 | % | | 7,486 |
| | 0.6 | % |
Other(1) | | 2 |
| | — |
| | — | % | | 18 |
| | — | % |
| Total 2018 | | 217 |
| | 3,670 |
| | 3.8 | % | | $ | 40,051 |
| | 3.3 | % |
| | | | | | | | | | | |
| 2019 | |
|
| |
|
| |
|
| |
|
| |
|
|
| Single-tenant retail | | 54 |
| | 1,315 |
| | 1.4 | % | | $ | 15,510 |
| | 1.3 | % |
| Anchored shopping centers | | 30 |
| | 250 |
| | 0.3 | % | | 3,725 |
| | 0.3 | % |
| Restaurant | | 76 |
| | 313 |
| | 0.3 | % | | 7,317 |
| | 0.6 | % |
| Industrial & Distribution | | 3 |
| | 137 |
| | 0.1 | % | | 1,275 |
| | 0.1 | % |
| Office | | 22 |
| | 1,248 |
| | 1.3 | % | | 27,904 |
| | 2.3 | % |
| Total 2019 | | 185 |
| | 3,263 |
| | 3.4 | % | | $ | 55,731 |
| | 4.6 | % |
| | | | | | | | | | | |
| |
| (1) | Includes billboards, land and parking lots. |
See the Definitions section for a description of the Company's non-GAAP and other financial measures.
VEREIT, Inc. | WWW.VEREIT.COM | 35
|
| | |
| | |
| Q3 2016 SUPPLEMENTAL INFORMATION |
|
|
| |
Lease Expirations (cont.) (unaudited, square feet and dollars in thousands) |
| |
|
| | | | | | | | | | | | | | | | |
| Year of Expiration | | Number of Leases Expiring | | Leased Square Feet | | Square Feet as a % of Total Portfolio | | Annualized Rental Income Expiring | | Annualized Rental Income Expiring as a % of Total Portfolio |
| | | | | | | | | | | |
| 2020 | | | | | | | | | | |
| Single-tenant retail | | 81 |
| | 1,056 |
| | 1.1 | % | | $ | 13,452 |
| | 1.1 | % |
| Anchored shopping centers | | 16 |
| | 140 |
| | 0.1 | % | | 1,825 |
| | 0.2 | % |
| Restaurant | | 106 |
| | 432 |
| | 0.5 | % | | 8,761 |
| | 0.7 | % |
| Industrial & distribution | | 9 |
| | 1,651 |
| | 1.7 | % | | 6,435 |
| | 0.5 | % |
| Office | | 22 |
| | 1,233 |
| | 1.3 | % | | 17,572 |
| | 1.5 | % |
Other(1) | | 1 |
| | — |
| | — | % | | 1 |
| | — | % |
| Total 2020 | | 235 |
| | 4,512 |
| | 4.7 | % | | $ | 48,046 |
| | 4.0 | % |
| | | | | | | | | | | |
| 2021 | | | | | | | | | | |
| Single-tenant retail | | 67 |
| | 1,259 |
| | 1.3 | % | | $ | 19,224 |
| | 1.6 | % |
| Anchored shopping centers | | 17 |
| | 162 |
| | 0.2 | % | | 2,599 |
| | 0.2 | % |
| Restaurant | | 68 |
| | 354 |
| | 0.3 | % | | 9,130 |
| | 0.8 | % |
| Industrial & distribution | | 16 |
| | 7,653 |
| | 7.9 | % | | 27,171 |
| | 2.2 | % |
| Office | | 25 |
| | 1,793 |
| | 1.9 | % | | 30,166 |
| | 2.5 | % |
Other(1) | | — |
| | — |
| | — | % | | — |
| | — | % |
| Total 2021 | | 193 |
| | 11,221 |
| | 11.6 | % | | $ | 88,290 |
| | 7.3 | % |
| | | | | | | | | | | |
| 2022 | | | | | | | | | | |
| Single-tenant retail | | 166 |
| | 2,180 |
| | 2.3 | % | | $ | 29,085 |
| | 2.4 | % |
| Anchored shopping centers | | 10 |
| | 118 |
| | 0.1 | % | | 1,820 |
| | 0.1 | % |
| Restaurant | | 45 |
| | 203 |
| | 0.2 | % | | 4,550 |
| | 0.4 | % |
| Industrial & distribution | | 26 |
| | 5,819 |
| | 6.0 | % | | 21,386 |
| | 1.8 | % |
| Office | | 15 |
| | 1,570 |
| | 1.6 | % | | 26,739 |
| | 2.2 | % |
Other(1) | | 2 |
| | — |
| | — | % | | 88 |
| | — | % |
| Total 2022 | | 264 |
| | 9,890 |
| | 10.2 | % | | $ | 83,668 |
| | 6.9 | % |
| | | | | | | | | | | |
| 2023 | | | | | | | | | | |
| Single-tenant retail | | 123 |
| | 1,832 |
| | 1.9 | % | | $ | 22,928 |
| | 1.9 | % |
| Anchored shopping centers | | 7 |
| | 130 |
| | 0.1 | % | | 2,653 |
| | 0.2 | % |
| Restaurant | | 48 |
| | 212 |
| | 0.2 | % | | 5,113 |
| | 0.4 | % |
| Industrial & distribution | | 15 |
| | 2,583 |
| | 2.7 | % | | 17,944 |
| | 1.5 | % |
| Office | | 23 |
| | 1,419 |
| | 1.5 | % | | 30,461 |
| | 2.5 | % |
| Total 2023 | | 216 |
| | 6,176 |
| | 6.4 | % | | $ | 79,099 |
| | 6.5 | % |
___________________________________
| |
| (1) | Includes billboards, land and parking lots. |
See the Definitions section for a description of the Company's non-GAAP and other financial measures.
VEREIT, Inc. | WWW.VEREIT.COM | 36
|
| | |
| | |
| Q3 2016 SUPPLEMENTAL INFORMATION |
|
|
| |
Lease Expirations (cont.) (unaudited, square feet and dollars in thousands) |
| |
|
| | | | | | | | | | | | | | | | |
| Year of Expiration | | Number of Leases Expiring | | Leased Square Feet | | Square Feet as a % of Total Portfolio | | Annualized Rental Income Expiring | | Annualized Rental Income Expiring as a % of Total Portfolio |
| 2024 | | | | | | | | | | |
| Single-tenant retail | | 87 |
| | 2,119 |
| | 2.2 | % | | $ | 27,446 |
| | 2.3 | % |
| Anchored shopping centers | | 3 |
| | 14 |
| | — | % | | 332 |
| | — | % |
| Restaurant | | 48 |
| | 253 |
| | 0.3 | % | | 6,657 |
| | 0.6 | % |
| Industrial & Distribution | | 12 |
| | 3,509 |
| | 3.6 | % | | 15,482 |
| | 1.3 | % |
| Office | | 28 |
| | 3,319 |
| | 3.4 | % | | 57,603 |
| | 4.8 | % |
Other(1) | | 1 |
| | — |
| | — | % | | 39 |
| | — | % |
| Total 2024 | | 179 |
| | 9,214 |
| | 9.5 | % | | $ | 107,559 |
| | 9.0 | % |
| | | | | | | | | | | |
| 2025 | | | | | | | | | | |
| Single-tenant retail | | 181 |
| | 1,757 |
| | 1.8 | % | | $ | 30,830 |
| | 2.6 | % |
| Anchored shopping centers | | 2 |
| | 10 |
| | — | % | | 160 |
| | — | % |
| Restaurant | | 63 |
| | 271 |
| | 0.3 | % | | 8,001 |
| | 0.7 | % |
| Industrial & Distribution | | 12 |
| | 1,844 |
| | 1.9 | % | | 14,154 |
| | 1.2 | % |
| Office | | 21 |
| | 546 |
| | 0.6 | % | | 9,875 |
| | 0.8 | % |
| Total 2025 | | 279 |
| | 4,428 |
| | 4.6 | % | | $ | 63,020 |
| | 5.3 | % |
| | | | | | | | | | | |
| Thereafter | | | | | | | | | | |
| Single-tenant retail | | 873 |
| | 16,898 |
| | 17.4 | % | | $ | 239,406 |
| | 19.9 | % |
| Anchored shopping centers | | 18 |
| | 426 |
| | 0.4 | % | | 4,287 |
| | 0.4 | % |
| Restaurant | | 567 |
| | 5,717 |
| | 5.9 | % | | 224,946 |
| | 18.7 | % |
| Industrial & distribution | | 45 |
| | 11,063 |
| | 11.4 | % | | 70,711 |
| | 5.8 | % |
| Office | | 38 |
| | 2,609 |
| | 2.7 | % | | 50,684 |
| | 4.2 | % |
Other(1) | | 1 |
| | — |
| | — | % | | 415 |
| | — | % |
| Total Thereafter | | 1,542 |
| | 36,713 |
| | 37.8 | % | | $ | 590,449 |
| | 49.0 | % |
| | | | | | | | | | | |
| Total Remaining Lease Expirations | | 3,492 |
| | 94,934 |
| | 98.0 | % | | $ | 1,206,086 |
| | 100.0 | % |
___________________________________
| |
| (1) | Includes billboards, land and parking lots. |
See the Definitions section for a description of the Company's non-GAAP and other financial measures.
VEREIT, Inc. | WWW.VEREIT.COM | 37
|
| | |
| | |
| Q3 2016 SUPPLEMENTAL INFORMATION |
Rent Escalations
(square feet and dollars in thousands)
|
| | | | | | | | | | | | | | | | |
| | | Number of Leases | | Leased Square Feet | | Leased Square Feet as a % of Total Portfolio | | Annualized Rental Income | | Annualized Rental Income as a % of Total Portfolio |
| Fixed dollar or percent increase | | 2,143 |
| | 61,175 |
| | 63.1 | % | | $ | 830,751 |
| | 68.9 | % |
| CPI | | 250 |
| | 7,687 |
| | 7.9 | % | | 113,904 |
| | 9.4 | % |
| Flat | | 1,099 |
| | 26,072 |
| | 27.0 | % | | 261,431 |
| | 21.7 | % |
| Total | | 3,492 |
|
| 94,934 |
|
| 98.0 | % |
| $ | 1,206,086 |
|
| 100.0 | % |
See the Definitions section for a description of the Company's non-GAAP and other financial measures.
VEREIT, Inc. | WWW.VEREIT.COM | 38
|
| | |
| | |
| Q3 2016 SUPPLEMENTAL INFORMATION |
|
|
| |
Lease Summary (cont.) (unaudited) |
| |
Tenant Expense Obligation
(square feet and dollars in thousands)
|
| | | | | | | | | | | | | | | | |
| | | Number of Leases | | Leased Square Feet | | Leased Square Feet as a % of Total Portfolio | | Annualized Rental Income | | Annualized Rental Income as a % of Total Portfolio |
| NNN | | 2,488 |
| | 55,600 |
| | 57.4 | % | | $ | 747,168 |
| | 62.0 | % |
| NN | | 951 |
| | 37,643 |
| | 38.9 | % | | 418,069 |
| | 34.6 | % |
Other (1) | | 53 |
| | 1,691 |
| | 1.7 | % | | 40,849 |
| | 3.4 | % |
| Total | | 3,492 |
|
| 94,934 |
| | 98.0 | % | | $ | 1,206,086 |
| | 100.0 | % |
| |
| (1) | Includes gross, modified gross, and billboard. |
See the Definitions section for a description of the Company's non-GAAP and other financial measures.
VEREIT, Inc. | WWW.VEREIT.COM | 39
|
| | |
| | |
| Q3 2016 SUPPLEMENTAL INFORMATION |
|
|
| |
Diversification: Property Type (unaudited, square feet and dollars in thousands) |
| |
|
| | | | | | | | | | | | | | | | |
| Property Type | | Number of Properties | | Square Feet | | Square Feet as a % of Total Portfolio | | Annualized Rental Income | | Annualized Rental Income as a % of Total Portfolio |
| Single-tenant retail | | 2,017 |
| | 29,704 |
| | 30.7 | % | | $ | 417,617 |
| | 34.6 | % |
| Anchored shopping centers | | 20 |
| | 1,723 |
| | 1.8 | % | | 23,898 |
| | 2.0 | % |
| Restaurant | | 1,837 |
| | 9,143 |
| | 9.4 | % | | 290,098 |
| | 24.0 | % |
| Industrial & Distribution | | 166 |
| | 40,422 |
| | 41.7 | % | | 195,836 |
| | 16.3 | % |
Office(1) | | 161 |
| | 15,893 |
| | 16.4 | % | | 278,061 |
| | 23.1 | % |
Other(2) | | 12 |
| | — |
| | — | % | | 576 |
| | — | % |
| Total | | 4,213 |
|
| 96,885 |
|
| 100.0 | % |
| $ | 1,206,086 |
|
| 100.0 | % |
(1) The office portfolio is comprised of the following sub-categories:
|
| | | | | | | | | | | | | | | | |
| Property Type | | Number of Properties | | Square Feet | | Square Feet as a % of Total Portfolio | | Annualized Rental Income | | Annualized Rental Income as a % of Total Portfolio |
| Corporate headquarters | | 84 |
| | 11,433 |
| | 11.8 | % | | $ | 190,057 |
| | 15.8 | % |
| Corporate operations | | 21 |
| | 4,013 |
| | 4.1 | % | | 77,392 |
| | 6.4 | % |
| Medical retail services | | 56 |
| | 447 |
| | 0.5 | % | | 10,612 |
| | 0.9 | % |
| Total | | 161 |
| | 15,893 |
| | 16.4 | % | | $ | 278,061 |
| | 23.1 | % |
(2) Includes billboard, construction in progress, land and parking lots.
See the Definitions section for a description of the Company's non-GAAP and other financial measures.
VEREIT, Inc. | WWW.VEREIT.COM | 40
|
| | |
| | |
| Q3 2016 SUPPLEMENTAL INFORMATION |
|
|
| |
Diversification by Property Type: Single-Tenant Retail (unaudited, percentages based on Annualized Rental Income of the single-tenant retail properties) |
| |
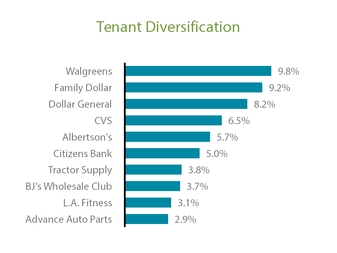 ____________________________________________________
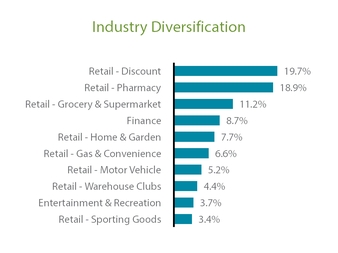 ______________________________________________________
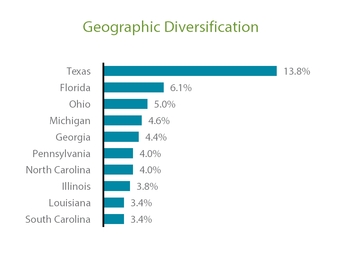 _________________________________________________
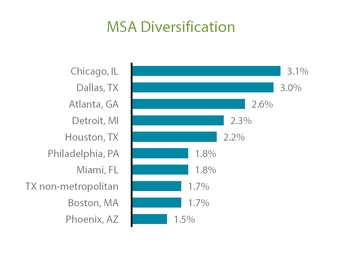 _________________________________________________
 |
| | | | |
Statistics (square feet in thousands) |
| | | | |
| Number of single-tenant retail properties | | 2,017 |
| |
| Rentable square feet | | 29,704 |
| |
| Economic occupancy rate | | 99.8 | % | |
| Weighted-average remaining lease term | | 10.5 |
| |
| Investment grade tenants | | 49.1 | % | |
| Flat leases | | 36.3 | % | |
| NNN leases | | 70.7 | % | |
See the Definitions section for a description of the Company's non-GAAP and other financial measures.
VEREIT, Inc. | WWW.VEREIT.COM | 41
|
| | |
| | |
| Q3 2016 SUPPLEMENTAL INFORMATION |
|
|
| |
Diversification by Property Type: Anchored Shopping Centers (unaudited, percentages based on Annualized Rental Income of the anchored shopping center properties)
|
| |
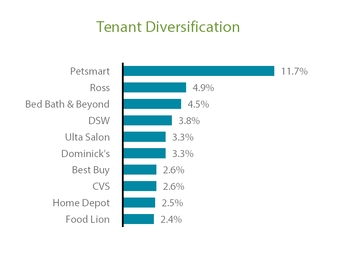 ____________________________________________________
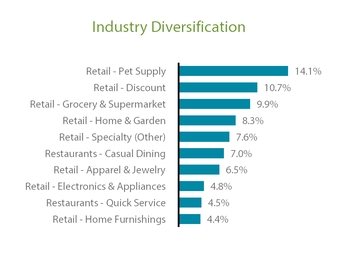 ______________________________________________________
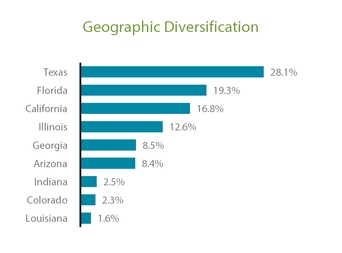 _________________________________________________
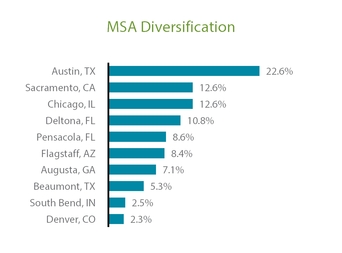 _________________________________________________
 |
| | | | |
Statistics (square feet in thousands) |
| | | | |
| Number of anchored shopping centers | | 20 |
| |
| Rentable square feet | | 1,723 |
| |
| Economic occupancy rate | | 97.1 | % | |
| Weighted-average remaining lease term | | 5.5 |
| |
| Investment grade tenants | | 32.6 | % | |
| Flat leases | | 52.0 | % | |
| NNN leases | | 6.9 | % | |
See the Definitions section for a description of the Company's non-GAAP and other financial measures.
VEREIT, Inc. | WWW.VEREIT.COM | 42
|
| | |
| | |
| Q3 2016 SUPPLEMENTAL INFORMATION |
|
|
| |
Diversification by Property Type: Restaurants (unaudited, percentages based on Annualized Rental Income of the restaurant properties)
|
| |
____________________________________________________
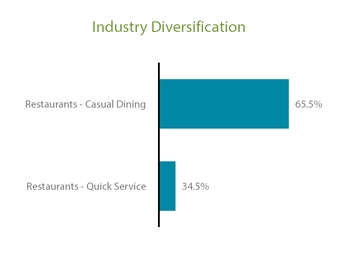 ______________________________________________________
_________________________________________________
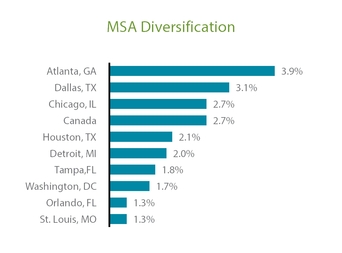 _________________________________________________
 |
| | | | |
Statistics (square feet in thousands) |
| | | | |
| Number of restaurant properties | | 1,837 |
| |
| Rentable square feet | | 9,143 |
| |
| Economic occupancy rate | | 94.7 | % | |
| Weighted-average remaining lease term | | 14.5 |
| |
| Investment grade tenants | | 2.9 | % | |
| Flat leases | | 7.7 | % | |
| NNN leases | | 99.4 | % | |
See the Definitions section for a description of the Company's non-GAAP and other financial measures.
VEREIT, Inc. | WWW.VEREIT.COM | 43
|
| | |
| | |
| Q3 2016 SUPPLEMENTAL INFORMATION |
|
|
| |
Diversification by Property Type: Industrial and Distribution (unaudited, percentages based on Annualized Rental Income of the industrial & distribution properties)
|
| |
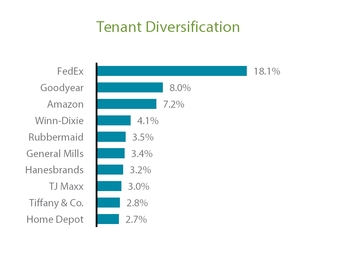 ____________________________________________________
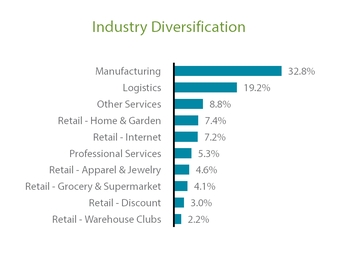 ______________________________________________________
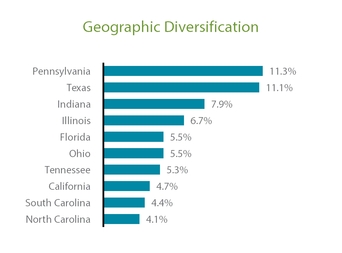 _________________________________________________
 _________________________________________________
 |
| | | | |
Statistics (square feet in thousands) |
| | | | |
| Number of industrial and distribution properties | | 166 |
| |
| Rentable square feet | | 40,422 |
| |
| Economic occupancy rate | | 98.3 | % | |
| Weighted-average remaining lease term | | 8.3 |
| |
| Investment grade tenants | | 54.5 | % | |
| Flat leases | | 24.8 | % | |
| NNN leases | | 49.8 | % | |
See the Definitions section for a description of the Company's non-GAAP and other financial measures.
VEREIT, Inc. | WWW.VEREIT.COM | 44
|
| | |
| | |
| Q3 2016 SUPPLEMENTAL INFORMATION |
|
|
| |
Diversification by Property Type: Office (unaudited, percentages based on Annualized Rental Income of the office properties)
|
| |
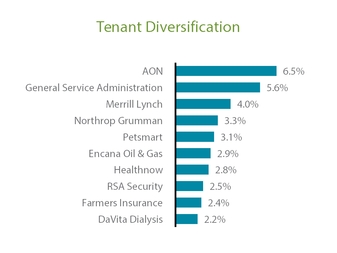 ____________________________________________________
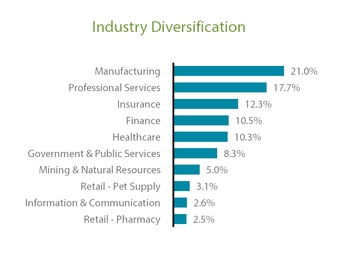 ______________________________________________________
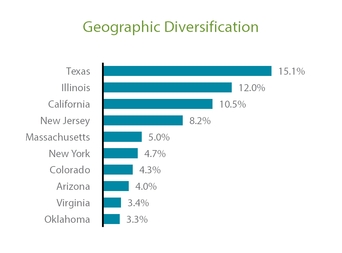 _________________________________________________
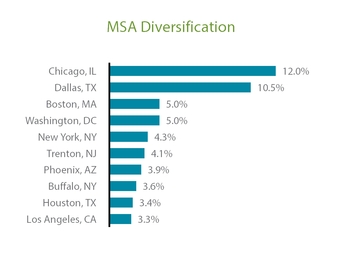 _________________________________________________
 |
| | | | |
Statistics (square feet in thousands) |
| | | | |
| Number of office properties | | 161 |
| |
| Rentable square feet | | 15,893 |
| |
| Economic occupancy rate | | 95.8 | % | |
| Weighted-average remaining lease term | | 6.7 |
| |
| Investment grade tenants | | 64.3 | % | |
| Flat leases | | 9.6 | % | |
| NNN leases | | 23.0 | % | |
See the Definitions section for a description of the Company's non-GAAP and other financial measures.
VEREIT, Inc. | WWW.VEREIT.COM | 45
|
| | |
| | |
| Q3 2016 SUPPLEMENTAL INFORMATION |
|
|
| |
Unconsolidated Joint Venture Investment Summary (unaudited, square feet and dollars in thousands) |
| |
The following table shows certain information regarding the Company's interests in unconsolidated joint ventures as of September 30, 2016:
|
| | | | | | | | | | | | | | | | | | | | | |
| Joint Venture | | Partner | | Ownership % (1) | | Pro rata Share of Purchase Price | | Rentable Square Feet (2) | | Annualized Rental Income (2) | | Debt (2) (3) | | Major Tenants |
| Cole/Mosaic JV South Elgin IL, LLC | | Affiliate of Mosaic Properties and Development, LLC | | 50% | | $ | 17,000 |
| | 232 |
| | $ | 3,011 |
| | $ | 20,400 |
| | Home Depot, Best Buy |
| Cole/Faison JV Bethlehem GA, LLC | | Faison-Winder Investors, LLC | | 90% | | 33,429 |
| | 280 |
| | 3,240 |
| | 25,788 |
| | Publix, Belk |
| Total | | | | $ | 50,429 |
| | 512 |
|
| 6,251 |
|
| 46,188 |
| | |
| | | | | | | | | | | | | | | |
| Company's aggregate interest | | | | | | | | $ | 4,421 |
| | $ | 33,409 |
| | |
| |
| (1) | The Company's ownership interest reflects its legal ownership interest. Legal ownership may, at times, not equal the Company's economic interest in the listed properties because of various provisions in certain joint venture agreements regarding distributions of cash flow based on capital account balances, allocations of profits and losses and payments of preferred returns. As a result, the Company's actual economic interest (as distinct from its legal ownership interest) in certain of the properties could fluctuate from time to time and may not wholly align with its legal ownership interests. |
| |
| (2) | Represents information for the total unconsolidated joint venture. |
| |
| (3) | Debt represents secured fixed and variable rates ranging from 2.93% to 5.20% and maturities ranging from October 2016 to July 2021, with a weighted-average interest rate of 3.93% as of September 30, 2016 and a weighted-average years to maturity of 2.1 years as of September 30, 2016. |
See the Definitions section for a description of the Company's non-GAAP and other financial measures.
VEREIT, Inc. | WWW.VEREIT.COM | 46
See the Definitions section for a description of the Company's non-GAAP and other financial measures.
VEREIT, Inc. | WWW.VEREIT.COM | 47
|
| | |
| | |
| Q3 2016 SUPPLEMENTAL INFORMATION |
|
|
| |
Statements of Operations - Cole Capital (unaudited, in thousands) |
| |
|
| | | | | | | | | | | | | | | | | | | | |
| | Three Months Ended |
| | | September 30,
2016 | | June 30,
2016 | | March 31,
2016 | | December 31,
2015 | | September 30,
2015 |
| Revenues: | | | | | | | | | | |
| Offering-related fees and reimbursements | | $ | 9,545 |
| | $ | 10,914 |
| | $ | 12,391 |
| | $ | 9,927 |
| | $ | 5,850 |
|
| Transaction service fees and reimbursements | | 3,779 |
| | 4,476 |
| | 2,384 |
| | 5,413 |
| | 7,400 |
|
| Management fees and reimbursements | | 17,745 |
| | 17,096 |
| | 16,458 |
| | 17,973 |
| | 14,296 |
|
| Total Cole Capital revenues | | 31,069 |
|
| 32,486 |
| | 31,233 |
| | 33,313 |
| | 27,546 |
|
| Operating Expenses: | | | | | | | | | | |
| Cole Capital reallowed fees and commissions | | 5,897 |
| | 6,975 |
| | 8,068 |
| | 6,558 |
| | 3,896 |
|
| Acquisition related | | — |
| | 14 |
| | 25 |
| | 61 |
| | 74 |
|
| General and administrative | | 17,692 |
| | 19,393 |
| | 17,172 |
| | 32,514 |
| | 16,994 |
|
| Depreciation and amortization | | 7,276 |
| | 7,109 |
| | 8,317 |
| | 5,006 |
| | 8,384 |
|
| Impairment of intangible assets | | — |
| | — |
| | — |
| | 213,339 |
| | — |
|
| Total operating expenses | | 30,865 |
| | 33,491 |
| | 33,582 |
| | 257,478 |
| | 29,348 |
|
| Operating income (loss) | | 204 |
| | (1,005 | ) | | (2,349 | ) | | (224,165 | ) | | (1,802 | ) |
| Total other income, net | | 95 |
| | — |
| | 494 |
| | 410 |
| | 465 |
|
| Income (loss) before taxes | | 299 |
|
| (1,005 | ) | | (1,855 | ) | | (223,755 | ) | | (1,337 | ) |
| (Provision for) benefit from income taxes | | (59 | ) | | 2,071 |
| | 1,309 |
| | 37,485 |
| | 738 |
|
| Net income (loss) | | $ | 240 |
| | $ | 1,066 |
| | $ | (546 | ) | | $ | (186,270 | ) | | $ | (599 | ) |
See the Definitions section for a description of the Company's non-GAAP and other financial measures.
VEREIT, Inc. | WWW.VEREIT.COM | 48
|
| | |
| | |
| Q3 2016 SUPPLEMENTAL INFORMATION |
|
|
| |
FFO and AFFO - Cole Capital (unaudited, in thousands, except share and per share data) |
| |
|
| | | | | | | | | | | | | | | | | | | | |
| | | Three Months Ended |
| | | September 30,
2016 | | June 30,
2016 | | March 31,
2016 | | December 31,
2015 | | September 30,
2015 |
| Net income (loss) | | $ | 240 |
| | $ | 1,066 |
| | $ | (546 | ) | | $ | (186,270 | ) | | $ | (599 | ) |
| FFO attributable to common stockholders and limited partners | | 240 |
| | 1,066 |
| | (546 | ) | | (186,270 | ) | | (599 | ) |
| | | | | | | | | | | |
| Acquisition related expenses | | — |
| | 14 |
| | 25 |
| | 61 |
| | 74 |
|
| Impairment of intangible assets | | — |
| | — |
| | — |
| | 213,339 |
| | — |
|
| Amortization of management contracts | | 6,240 |
| | 6,240 |
| | 7,451 |
| | 3,373 |
| | 7,510 |
|
Deferred tax expense (benefit) (1) | | 6,941 |
| | (6,417 | ) | | (1,457 | ) | | (38,695 | ) | | (5,701 | ) |
| Equity-based compensation expense | | 1,387 |
| | 854 |
| | 931 |
| | 2,471 |
| | 2,943 |
|
| Other amortization and non-cash charges | | 929 |
| | 751 |
| | 743 |
| | 1,539 |
| | 782 |
|
| AFFO attributable to common stockholders and limited partners | | $ | 15,737 |
| | $ | 2,508 |
| | $ | 7,147 |
| | $ | (4,182 | ) | | $ | 5,009 |
|
| | | | | | | | | | | |
| Weighted-average shares outstanding - basic | | 943,480,170 |
| | 904,107,378 |
| | 903,825,726 |
| | 903,638,159 |
| | 903,461,323 |
|
Effect of Limited Partner OP Units and dilutive securities (2) | | 25,206,373 |
| | 27,144,667 |
| | 26,354,148 |
| | 25,729,149 |
| | 25,995,886 |
|
Weighted-average shares outstanding - diluted (3) | | 968,686,543 |
| | 931,252,045 |
| | 930,179,874 |
| | 929,367,308 |
| | 929,457,209 |
|
| | | | | | | | | | | |
FFO attributable to common stockholders and limited partners per diluted share | | $ | 0.000 |
| | $ | 0.001 |
| | $ | (0.001 | ) | | $ | (0.200 | ) | | $ | (0.001 | ) |
| AFFO attributable to common stockholders and limited partners per diluted share | | $ | 0.016 |
| | $ | 0.003 |
| | $ | 0.008 |
| | $ | (0.004 | ) | | $ | 0.005 |
|
| |
| (1) | This adjustment represents the non-current portion of the provision for or benefit from income taxes in order to show only the current portion of the provision for or benefit from income taxes as an impact to AFFO. |
| |
| (2) | Dilutive securities include unvested restricted shares of common stock and unvested restricted stock units. |
| |
| (3) | Weighted-average shares for all periods presented exclude the effect of the convertible debt as the Company would expect to settle the debt in cash and any shares underlying restricted stock units that are contingently issuable which are not issuable based on the Company’s level of achievement of certain performance targets through the respective reporting period. |
See the Definitions section for a description of the Company's non-GAAP and other financial measures.
VEREIT, Inc. | WWW.VEREIT.COM | 49
|
| | |
| | |
| Q3 2016 SUPPLEMENTAL INFORMATION |
|
|
| |
EBITDA and Normalized EBITDA - Cole Capital (unaudited, in thousands)
|
| |
|
| | | | | | | | | | | | | | | | | | | | |
| | | Three Months Ended |
| | | September 30,
2016 | | June 30,
2016 | | March 31,
2016 | | December 31,
2015 | | September 30,
2015 |
| Net income (loss) | | $ | 240 |
| | $ | 1,066 |
| | $ | (546 | ) | | $ | (186,270 | ) | | $ | (599 | ) |
| Adjustments: | | | | | | | | | | |
| Depreciation and amortization | | 7,276 |
| | 7,109 |
| | 8,317 |
| | 5,006 |
| | 8,384 |
|
| Provision for (benefit from) income taxes | | 59 |
| | (2,071 | ) | | (1,309 | ) | | (37,485 | ) | | (738 | ) |
| EBITDA | | $ | 7,575 |
| | $ | 6,104 |
| | $ | 6,462 |
| | $ | (218,749 | ) | | $ | 7,047 |
|
| Impairment of intangible assets | | — |
| | — |
| | — |
| | 213,339 |
| | — |
|
| Acquisition related expenses | | — |
| | 14 |
| | 25 |
| | 61 |
| | 74 |
|
| Program development costs write-off | | 845 |
| | 2,377 |
| | — |
| | 11,295 |
| | — |
|
| Other amortization and non-cash charges | | (107 | ) | | (118 | ) | | (123 | ) | | (94 | ) | | (92 | ) |
| Normalized EBITDA | | $ | 8,313 |
| | $ | 8,377 |
| | $ | 6,364 |
| | $ | 5,852 |
| | $ | 7,029 |
|
See the Definitions section for a description of the Company's non-GAAP and other financial measures.
VEREIT, Inc. | WWW.VEREIT.COM | 50
|
| | |
| | |
| Q3 2016 SUPPLEMENTAL INFORMATION |
|
|
| |
Net G&A (unaudited, dollars in thousands)
|
| |
In its capacity as advisor to the Cole REITs, Cole Capital incurs certain costs on behalf of the Cole REITs, which are reimbursable. In accordance with GAAP, the Company records these costs as general and administrative expenses and the reimbursements as revenue in the same period. The following table presents the Cole Capital segment revenue and general and administrative expenses, each net of reimbursements from the Cole REITs.
|
| | | | | | | | | | | | | | | | | | | | |
| | | Three Months Ended |
| | | September 30,
2016 | | June 30,
2016 | | March 31,
2016 | | December 31,
2015 | | September 30,
2015 |
| Cole Capital revenue, net of reallowed fees and commissions | | $ | 25,172 |
| | $ | 25,511 |
| | $ | 23,165 |
| | $ | 26,755 |
| | $ | 23,650 |
|
| Less: Expense reimbursements from Cole REITs recorded as revenue | | 7,416 |
| | 7,342 |
| | 7,515 |
| | 8,094 |
| | 4,549 |
|
| Net Cole Capital Revenue | | 17,756 |
|
| 18,169 |
| | 15,650 |
| | 18,661 |
| | 19,101 |
|
| Other income | | 95 |
| | — |
| | 494 |
| | 410 |
| | 465 |
|
| Net Cole Capital Revenue and other income | | $ | 17,851 |
|
| $ | 18,169 |
| | $ | 16,144 |
| | $ | 19,071 |
| | $ | 19,566 |
|
| | | | | | | | | | | |
| Total consolidated general and administrative expenses | | $ | 29,761 |
| | $ | 33,094 |
| | $ | 29,400 |
| | $ | 49,160 |
| | $ | 32,842 |
|
| Less: REI segment general and administrative expenses | | 12,069 |
| | 13,701 |
| | 12,228 |
| | 16,646 |
| | 15,848 |
|
| Cole Capital general and administrative expenses | | 17,692 |
|
| 19,393 |
| | 17,172 |
| | 32,514 |
| | 16,994 |
|
| Less: | | | | | | | | | | |
| Expenses reimbursed from Cole REITs | | 7,416 |
| | 7,342 |
| | 7,515 |
| | 8,094 |
| | 4,549 |
|
| Net Cole Capital G&A expense | | 10,276 |
|
| 12,051 |
| | 9,657 |
| | 24,420 |
| | 12,445 |
|
| Expenses incurred recorded as program development costs | | 2,452 |
| | 973 |
| | 3,433 |
| | (5,840 | ) | | 3,002 |
|
| Normalized Net Cole Capital G&A expense | | $ | 12,728 |
|
| $ | 13,024 |
| | $ | 13,090 |
| | $ | 18,580 |
| | $ | 15,447 |
|
| | | | | | | | | | | |
| Normalized EBITDA Margin | | 46.6 | % |
| 46.1 | % | | 39.4 | % | | 30.7 | % | | 35.9 | % |
| Normalized Net Cole Capital G&A expense as percent of Net Cole Capital Revenue and other income | | 71.3 | % |
| 71.7 | % | | 81.1 | % | | 97.4 | % | | 78.9 | % |
See the Definitions section for a description of the Company's non-GAAP and other financial measures.
VEREIT, Inc. | WWW.VEREIT.COM | 51
|
| | |
| | |
| Q3 2016 SUPPLEMENTAL INFORMATION |
|
|
| |
Program Development Costs (unaudited, in thousands) |
| |
Cole Capital pays for organization, registration and offering expenses associated with the sale of common stock of the Cole REITs. The reimbursement of these expenses by the Cole REITs is limited to a certain percentage of the proceeds raised from their offerings, in accordance with their respective advisory agreements and charters. Such expenses paid by the Company on behalf of the Cole REITs in excess of these limits that are expected to be collected as the Cole REITs raise additional funds are recorded as program development costs, which are included in rent and tenant receivables and other assets, net on the balance sheet. The Company assesses the collectability of the program development costs, considering the offering period and historical and forecasted sales of shares under the Cole REITs' respective offerings, and reserves for any balances considered not collectible.
The following table presents a rollforward of the program development costs balance: |
| | | | | | | | | | | | | | | | | | | | | |
| | | Program Development Costs(1) for the Three Months Ended |
| | | September 30,
2016 | | June 30,
2016 | | March 31,
2016 | | December 31,
2015 | | September 30,
2015 | |
| Beginning Balance | | $ | 12,115 |
| | $ | 13,578 |
| | $ | 12,855 |
| | $ | 20,878 |
| | $ | 19,006 |
| |
| Expenses incurred | | 7,010 |
| | 6,993 |
| | 6,474 |
| | 8,802 |
| | 5,054 |
| |
| Offering-related reimbursement revenue | | (2,299 | ) | | (2,436 | ) | | (2,710 | ) | | (2,183 | ) | | (1,130 | ) | |
Reserve for uncollectible amounts and write-offs(2) | | (4,558 | ) | | (6,020 | ) | | (3,041 | ) | | (14,642 | ) | | (2,052 | ) | |
| Ending Balance | | $ | 12,268 |
|
| $ | 12,115 |
| | $ | 13,578 |
| | $ | 12,855 |
| | $ | 20,878 |
| |
| |
| (1) | Excludes INAV (as defined in the "Program Summary" of the Cole REITs and Other Real Estate Programs section), as expenses are recorded as incurred and revenue is recorded when reimbursement is received. |
| |
| (2) | The Company assesses the collectability of the program development costs and records monthly reserves for the portion that is not expected to be collected. Certain triggering events, such as impairment evaluations of the Cole Capital segment and the closing of a Cole REIT's offering, may result in a write-off of additional program development costs. Reserves for uncollectible amounts and write-offs are recorded as a general and administrative expense in the respective period. |
See the Definitions section for a description of the Company's non-GAAP and other financial measures.
VEREIT, Inc. | WWW.VEREIT.COM | 52
|
| | |
| | |
| Q3 2016 SUPPLEMENTAL INFORMATION |
|
|
| |
Cole REITs and Other Real Estate Programs (unaudited, dollars in thousands) |
| |
Program Summary
The following table shows the Cole REITs and other real estate programs' cumulative activity summary information from each respective program's offering commencement date through or as of September 30, 2016:
|
| | | | | | | | | | | | | | | | | | | |
| Program | | Capital Raised (1) | | DRIP (2) | | Number of Investments (3) | | Assets Under Management | | Debt Outstanding |
| Open Programs: | | | | | | | | | | |
| Cole Credit Property Trust V, Inc. ("CCPT V") | | $ | 283,109 |
| | $ | 14,488 |
| | 116 |
| | $ | 499,188 |
| | $ | 257,349 |
|
| Cole Real Estate Income Strategy (Daily NAV), Inc. ("INAV") | | 303,374 |
| | 10,400 |
| | 96 |
| | 352,030 |
| | 120,769 |
|
| Cole Office & Industrial REIT (CCIT III), Inc. ("CCIT III") | | 2,500 |
| (4) | — |
| | 1 |
| | 32,750 |
| | 32,300 |
|
| Total Open Programs | | 588,983 |
| | 24,888 |
| | 213 |
| | 883,968 |
| | 410,418 |
|
| | | | | | | | | | | |
| Closed Programs: | | | | | | | | | | |
| Cole Office & Industrial REIT (CCIT II), Inc. ("CCIT II") | | 651,063 |
| | 26,692 |
| | 32 |
| | 1,036,254 |
| | 495,542 |
|
| Cole Credit Property Trust IV, Inc. ("CCPT IV") | | 2,915,961 |
| | 326,473 |
| | 882 |
| | 4,840,078 |
| | 2,239,899 |
|
Other Programs (5) | | — |
| | — |
| | 35 |
| | 371,100 |
| | 173,752 |
|
| Total Closed Programs | | 3,567,024 |
| | 353,165 |
| | 949 |
| | 6,247,432 |
| | 2,909,193 |
|
| | | | | | | | | | | |
| Total | | $ | 4,156,007 |
| | $ | 378,053 |
| | 1,162 |
| | $ | 7,131,400 |
| | $ | 3,319,611 |
|
| |
| (1) | Represents gross proceeds, excluding DRIP shares issued. |
| |
| (2) | Represents the value of shares issued under each respective program's distribution reinvestment plan. |
| |
| (3) | Includes properties owned through consolidated and unconsolidated joint ventures. |
| |
| (4) | Represents an investment made by VEREIT in order for CCIT III to break escrow and commence operations. |
| |
| (5) | Includes tenant-in-common programs ("TIC"), Delaware statutory trust programs ("DST") and Cole Growth Opportunity Fund I, L.P. ("GOP"). |
See the Definitions section for a description of the Company's non-GAAP and other financial measures.
VEREIT, Inc. | WWW.VEREIT.COM | 53
|
| | |
| | |
| Q3 2016 SUPPLEMENTAL INFORMATION |
|
|
| |
| Cole REITs and Other Real Estate Programs (cont.) |
| |
Offering Summary
The following table shows offering summary information for the Cole REITs in offering as of September 30, 2016: |
| | | | | | | | | | | | | | | | | |
| Program | | Primary Investment Strategy | | Offering Commencement Date | | NAV per Share | | Offering Price per Share | | Annualized Distribution per Share (2) | |
| CCPT V | | | | | | | | |
|
|
| |
| A Shares | | Retail | | 3/17/2014 | | $ | 24.00 |
| (1) | $ | 26.37 |
| | $ | 1.58 |
| |
| T Shares | | Retail | | 4/29/2016 | | $ | 24.00 |
| (1) | $ | 25.26 |
| | $ | 1.58 |
| |
| | | | | | | | | | | | |
| INAV | | | | | | | | | | | |
| W Shares | | Diversified | | 12/6/2011 | | $ | 18.25 |
| (3) | $ | 18.25 |
| | $ | 0.98 |
| |
| A Shares | | Diversified | | 10/10/2013 | | $ | 18.13 |
| (3) | $ | 18.84 |
| | $ | 0.97 |
| |
| I Shares | | Diversified | | 11/19/2013 | | $ | 18.37 |
| (3) | $ | 18.37 |
| | $ | 0.99 |
| |
| | | | | | | | | | | | |
| CCIT III | | | | | | | | | | | |
| A Shares | | Office and Industrial | | 9/22/2016 | | N/A |
| | $ | 10.00 |
| | $ | 0.60 |
| |
| T Shares | | Office and Industrial | | 9/22/2016 | | N/A |
| | $ | 9.57 |
| | $ | 0.60 |
| |
| |
| (1) | Represents the estimated net asset value per share determined by CCPT V's board of directors as of February 29, 2016. |
| |
| (2) | The annualized distribution does not include the effect of any trailing fees. |
| |
| (3) | The NAV per share for each share class is calculated daily as of the close of business using a process that reflects (i) estimated values of each of INAV's commercial real estate assets, related liabilities and notes receivable secured by real estate provided periodically by INAV's independent valuation expert in individual appraisal reports, (ii) daily updates in the price of liquid assets for which third party market quotes are available, (iii) accruals of INAV's daily distributions and (iv) estimates of daily accruals, on a net basis, of operating revenues and expenses and debt service costs and fees. |
See the Definitions section for a description of the Company's non-GAAP and other financial measures.
VEREIT, Inc. | WWW.VEREIT.COM | 54
|
| | |
| | |
| Q3 2016 SUPPLEMENTAL INFORMATION |
|
|
| |
Cole REITs and Other Real Estate Programs (cont.) (unaudited)
|
| |
Fee Summary
The following table shows the summary of the fee information relating to the offering of the Cole REITs as of September 30, 2016.
|
| | | | | | | | | | |
| Program | | Selling Commissions (1) | | Dealer Manager Fees (2) | | Annual Distribution and Stockholder Servicing Fees (2) | |
| CCPT V | | | | | | | |
| A Shares | | 7 | % | | 2 | % | | — |
| |
| T Shares | | 3 | % | | 2 | % | | 0.8 | % | (3)(5) |
| | | | | | | | |
| INAV | | | | | | | |
| W Shares | | — |
| | 0.55 | % | (4) | — |
| |
| A Shares | | up to 3.75% |
| | 0.55 | % | (4) | 0.50 | % | (4) |
| I Shares | | — |
| | 0.25 | % | (4) | — |
| |
| | | | | | | | |
| CCIT III | | | | | | | |
| A Shares | | 7 | % | | 2 | % | | — |
| |
| T Shares | | 3 | % | | 2 | % | | 1.0 | % | (5) |
___________________________________
| |
| (1) | The Company reallows 100% of selling commissions earned to participating broker-dealers. |
| |
| (2) | The Company may reallow all or a portion of its dealer manager or distribution and stockholder servicing fee to participating broker-dealers as a marketing and due diligence expense reimbursement. Fees are calculated on a daily basis and payable monthly in arrears. |
| |
| (3) | Subsequent to September 30, 2016, the distribution and stockholder servicing fee was changed to be 1.0%. |
| |
| (4) | Fees are calculated on a daily basis and payable monthly in arrears. |
| |
| (5) | The maximum amount of the distribution and stockholder servicing fee with respect to sales of Class T shares is 4.0% of the gross offering proceeds. |
The following table shows the summary of the fee information relating to transactions and portfolio management for the Cole REITs and other real estate programs as of September 30, 2016.
|
| | | | | | | | | | | | | | | | | | | |
| | | Transaction Fees | | Management Fees | |
| Program | | Acquisition
Fees (1) | | Disposition
Fees | | Liquidation Performance Fees | | Financing Coordination Fee | | Asset Management / Advisory Fees | | Performance Fees | |
| Open Programs | | | | | | | | | | | | | |
| CCPT V | | 2 | % | | 1 | % | | 15 | % | (2) | — |
| | 0.65% - 0.75% |
| (4) | — |
|
|
| INAV | | — |
| | — |
| | N/A |
| | — |
| | 0.90 | % | (5) | 25 | % | (6) |
| CCIT III | | 2 | % | | 1 | % | | 15 | % | (2) | 1 | % | (3) | 0.65% - 0.75% |
| (4) | — |
| |
| | | | | | | | | | | | | | |
| Closed Programs | | | | | | | | | | | | | |
| CCIT II | | 2 | % | | 1 | % | | 15 | % | (2) | — |
| | 0.65% - 0.75% |
| (4) | — |
| |
| CCPT IV | | 2 | % | | 1 | % | | 15 | % | (2) | — |
| | 0.65% - 0.75% |
| (4) | — |
|
|
| Other Programs | | Various |
| | Various |
| | — |
| | — |
| | Various |
| | Various |
| |
___________________________________
| |
| (1) | Percent taken on gross purchase price. |
| |
| (2) | Paid only under the following circumstances: (i) if shares are listed on a national securities exchange; (ii) if the respective program is sold or the assets are liquidated; or (iii) upon termination of the advisory agreement. In connection with such events, the performance fee will only be earned upon the return to investors of their net capital invested and a 6% annual cumulative, non-compounded return (8% in the case of CCIT II and CCPT IV). |
| |
| (3) | Financing coordination fee payable for services in connection with the origination, assumption, or refinancing for any debt (other than loans advanced by the Company) to acquire properties or make other permitted investments. |
| |
| (4) | Annualized fee based on the average monthly invested assets. |
| |
| (5) | Annualized fee based on the average daily NAV. |
| |
| (6) | Paid on the amount by which the total return on stockholders' capital exceeds 6% per annum on a calendar year basis. |
See the Definitions section for a description of the Company's non-GAAP and other financial measures.
VEREIT, Inc. | WWW.VEREIT.COM | 55
|
| | |
| | |
| Q3 2016 SUPPLEMENTAL INFORMATION |
|
|
| |
Cole REITs and Other Real Estate Programs (cont.) (unaudited, dollars in thousands)
|
| |
Program Activity Summary
The following table shows the Cole REITs and other real estate programs' activity summary information for the three months ended September 30, 2016 :
|
| | | | | | | | | | | | | | | | | | | | | | |
| Program | | Capital Raised (1) | | DRIP(2) | | Number of Investments Acquired | | Purchase Price of Acquisitions (3) | | Number of Investments Sold | | Sales Price of Dispositions |
| Open Programs: | | | | | | | | | | | | |
| CCPT V | | $ | 13,561 |
| | $ | 2,225 |
| | — |
| | $ | — |
| | — |
| | $ | — |
|
| INAV | | 43,097 |
| | 1,590 |
| | 6 |
| | 44,033 |
| | — |
| | — |
|
| CCIT III | | 2,500 |
| (4) | — |
| | 1 |
| | 32,750 |
| | — |
| | — |
|
| Total Open Programs | | 59,158 |
| | 3,815 |
| | 7 |
| | 76,783 |
| | — |
| | — |
|
| | | | | | | | | | | | | |
| Closed Programs: | | | | | | | | | | | | |
| CCIT II | | 77,223 |
| | 5,098 |
| | — |
| | — |
| | — |
| | — |
|
| CCPT IV | | — |
| | 27,285 |
| | 6 |
| | 97,086 |
| | 2 |
| | 16,413 |
|
Other Programs(5) | | — |
| | — |
| | — |
| | — |
| | 2 |
| | 34,400 |
|
| Total Closed Programs | | 77,223 |
| | 32,383 |
| | 6 |
| | 97,086 |
| | 4 |
| | 50,813 |
|
| | | | | | | | | | | | | |
| Total | | $ | 136,381 |
| | $ | 36,198 |
| | 13 |
| | $ | 173,869 |
| | 4 |
| | $ | 50,813 |
|
| |
| (1) | Represents gross proceeds, excluding DRIP shares issued. |
| |
| (2) | Represents the value of shares issued under each respective program's distribution reinvestment plan. |
| |
| (3) | Includes any GAAP adjustments, such as fair value adjustments of assumed notes payable and earn-out provisions. |
| |
| (4) | Represents an investment made by VEREIT in order for CCIT III to break escrow and commence operations. |
| |
| (5) | Includes TIC and DST programs and GOP. |
See the Definitions section for a description of the Company's non-GAAP and other financial measures.
VEREIT, Inc. | WWW.VEREIT.COM | 56
|
| | |
| | |
| Q3 2016 SUPPLEMENTAL INFORMATION |
|
|
| |
Cole REITs and Other Real Estate Programs (cont.) (unaudited, dollars in thousands)
|
| |
Revenue Summary
The following table shows revenue earned from the Cole REITs and other real estate programs for the three months ended September 30, 2016 by activity type (dollars in thousands):
|
| | | | | | | | | | | | | | | | |
| Program | | Offering-Related Fees and Reimbursements | | Transaction Service Revenue and Reimbursements | | Management Service Revenue and Reimbursements | | Total Revenue and Reimbursements |
| Open Programs: | | | | | | | | |
| CCPT V | | $ | 1,316 |
| | $ | — |
| | $ | 1,769 |
| | $ | 3,085 |
|
| INAV | | 1,430 |
| | 460 |
| | 1,219 |
| | 3,109 |
|
| CCIT III | | 27 |
| | 875 |
| | 5 |
| | 907 |
|
| Gross revenue - Open Programs | | 2,773 |
| | 1,335 |
| | 2,993 |
| | 7,101 |
|
| Less: | | | | | | | | |
| Reallowed revenues | | 1,611 |
| | — |
| | — |
| | 1,611 |
|
| Reimbursements | | 680 |
| | 584 |
| | 3,742 |
| | 5,006 |
|
| Net Cole Capital Revenue - Open Programs | | 482 |
| | 751 |
| | (749 | ) | | 484 |
|
| | | | | | | | | |
| Closed Programs: | | | | | | | | |
| CCIT II | | 6,772 |
| | 102 |
| | 2,789 |
| | 9,663 |
|
| CCPT IV | | — |
| | 2,062 |
| | 11,659 |
| | 13,721 |
|
| Other Programs | | — |
| | 280 |
| | 304 |
| | 584 |
|
| Gross revenue - Closed Programs | | 6,772 |
| | 2,444 |
| | 14,752 |
| | 23,968 |
|
| Less: | | | | | | | | |
| Reallowed revenues | | 4,286 |
| | — |
| | — |
| | 4,286 |
|
| Reimbursements | | 1,620 |
| | 102 |
| | 688 |
| | 2,410 |
|
| Net Cole Capital Revenue - Closed Programs | | 866 |
| | 2,342 |
| | 14,064 |
| | 17,272 |
|
| | | | | | | | | |
| Total Net Cole Capital Revenue | | $ | 1,348 |
| | $ | 3,093 |
| | $ | 13,315 |
| | $ | 17,756 |
|
See the Definitions section for a description of the Company's non-GAAP and other financial measures.
VEREIT, Inc. | WWW.VEREIT.COM | 57
|
| | |
| | |
| Q3 2016 SUPPLEMENTAL INFORMATION |
|
|
| |
Cole REITs and Other Real Estate Programs (cont.) (unaudited, dollars in thousands)
|
| |
The following tables present the primary revenue drivers and Net Cole Capital Revenue earned by activity type for the Cole REITs and other real estate programs:
Offering-related fees and reimbursements
|
| | | | | | | | | | | | | | | | | | | | |
| | | Three Months Ended |
| | | September 30,
2016 | | June 30,
2016 | | March 31,
2016 | | December 31,
2015 | | September 30,
2015 |
| Capital raised (excluding DRIP) | | $ | 136,381 |
| | $ | 138,655 |
| | $ | 144,620 |
| | $ | 116,634 |
| | $ | 66,603 |
|
| | | | | | | | | | | |
| Securities commissions | | 5,008 |
| | 6,063 |
| | 7,041 |
| | 5,756 |
| | 3,328 |
|
| Dealer manager and distribution fees | | 2,237 |
| | 2,415 |
| | 2,640 |
| | 1,988 |
| | 1,258 |
|
| Reimbursement revenue | | 2,300 |
| | 2,436 |
| | 2,710 |
| | 2,183 |
| | 1,264 |
|
| Gross offering-related revenue | | 9,545 |
|
| 10,914 |
| | 12,391 |
| | 9,927 |
| | 5,850 |
|
| Less: | | | | | | | | | | |
| Reallowed securities commissions | | 5,008 |
| | 6,063 |
| | 7,041 |
| | 5,756 |
| | 3,328 |
|
| Reallowed dealer manager and distribution fees | | 889 |
| | 912 |
| | 1,027 |
| | 802 |
| | 568 |
|
| Reimbursement revenue | | 2,300 |
| | 2,436 |
| | 2,710 |
| | 2,183 |
| | 1,264 |
|
| Net offering-related revenue | | $ | 1,348 |
|
| $ | 1,503 |
| | $ | 1,613 |
| | $ | 1,186 |
| | $ | 690 |
|
Transaction service revenue
|
| | | | | | | | | | | | | | | | | | | | |
| | | Three Months Ended |
| | | September 30,
2016 | | June 30,
2016 | | March 31,
2016 | | December 31,
2015 | | September 30,
2015 |
Purchase price of acquisitions(1) | | $ | 173,869 |
| | $ | 211,178 |
| | $ | 102,075 |
| | $ | 236,398 |
| | $ | 315,301 |
|
| | | | | | | | | | | |
| Acquisition fees | | 2,813 |
| | 3,758 |
| | 1,702 |
| | 3,829 |
| | 6,233 |
|
| Performance fees | | — |
| | — |
| | — |
| | — |
| | — |
|
| Disposition fees | | 280 |
| | 62 |
| | — |
| | 1,013 |
| | 764 |
|
| Reimbursement revenue | | 686 |
| | 656 |
| | 682 |
| | 571 |
| | 403 |
|
| Gross transaction service revenue | | 3,779 |
|
| 4,476 |
| | 2,384 |
| | 5,413 |
| | 7,400 |
|
| Less: Reimbursement revenue | | 686 |
| | 656 |
| | 682 |
| | 571 |
| | 403 |
|
| Net transaction service revenue | | $ | 3,093 |
|
| $ | 3,820 |
| | $ | 1,702 |
| | $ | 4,842 |
| | $ | 6,997 |
|
(1) Purchase price of acquisitions includes any GAAP adjustments, such as fair value adjustments of assumed notes payable and earn-out provisions.
Management service revenue |
| | | | | | | | | | | | | | | | | | | | |
| | | Three Months Ended |
| | | September 30,
2016 | | June 30,
2016 | | March 31,
2016 | | December 31,
2015 | | September 30,
2015 |
| Assets under management | | $ | 7,131,400 |
| | $ | 7,005,695 |
| | $ | 6,827,885 |
| | $ | 6,740,911 |
| | $ | 6,561,950 |
|
| | | | | | | | | | | |
| Asset and property management and leasing fees | | 304 |
| | 286 |
| | 285 |
| | 359 |
| | 416 |
|
| Advisory and performance fee revenue | | 13,011 |
| | 12,560 |
| | 12,050 |
| | 12,274 |
| | 10,998 |
|
| Reimbursement revenue | | 4,430 |
| | 4,250 |
| | 4,123 |
| | 5,340 |
| | 2,882 |
|
| Gross management service revenue | | 17,745 |
|
| 17,096 |
| | 16,458 |
| | 17,973 |
| | 14,296 |
|
| Less: Reimbursement revenue | | 4,430 |
| | 4,250 |
| | 4,123 |
| | 5,340 |
| | 2,882 |
|
| Net management service revenue |
| $ | 13,315 |
|
| $ | 12,846 |
| | $ | 12,335 |
| | $ | 12,633 |
| | $ | 11,414 |
|
See the Definitions section for a description of the Company's non-GAAP and other financial measures.
VEREIT, Inc. | WWW.VEREIT.COM | 58
|
| | |
| | |
| Q3 2016 SUPPLEMENTAL INFORMATION |
|
|
| |
Cole REITs and Other Real Estate Programs (cont.) (unaudited)
|
| |
The following table shows the capital raised on behalf of programs managed by Cole Capital since 2009:
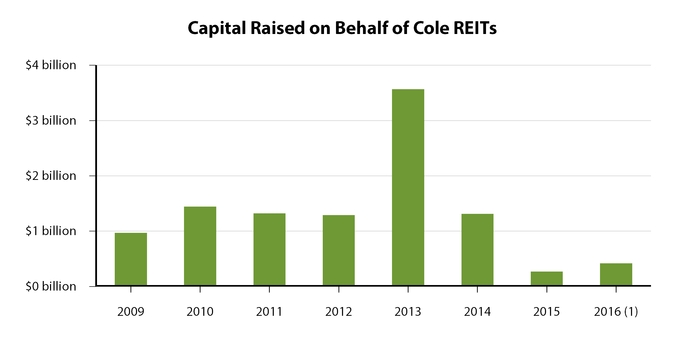 _______________________________________________
(1) Represents capital raised on behalf of Cole REITs for nine months ended September 30, 2016. Includes a $2.5 million investment made by VEREIT in order for CCIT III to break escrow and commence operations.
Source: Robert A. Stanger & Co., Inc.; Represents aggregate capital raised, excluding DRIP, on behalf of programs managed by Cole Capital.
See the Definitions section for a description of the Company's non-GAAP and other financial measures.
VEREIT, Inc. | WWW.VEREIT.COM | 59
|
| | |
| | |
| Q3 2016 SUPPLEMENTAL INFORMATION |
Annualized Rental Income is rental revenue under our leases on operating properties owned at the respective reporting date on a straight-line basis, which includes the effect of rent escalations and any tenant concessions, such as free rent, and excludes any bad debt allowances and any contingent rent, such as percentage rent. Management uses Annualized Rental Income as a basis for tenant, industry and geographic concentrations and other metrics within the portfolio. Annualized Rental Income is not indicative of future performance.
Assets Under Management represents the Cole REITs and other real estate programs' total gross real estate assets, including net investments in unconsolidated entities, net of gross intangible lease liabilities.
Cash Cap Rate equals the estimated future 12-month Cash NOI, excluding any rent concessions or abatements, at acquisition or disposition divided by the purchase or sale price. For properties acquired or disposed of as a portfolio, the amount presented represents the portfolio cash cap rate. For development projects, Cash Cap Rate equals the estimated future 12-month NOI from the date rent commences divided by the total estimated investment. For certain properties, the Cash Cap Rate is equal to future 12-month Contract Rental Revenue, excluding any rent concessions or abatements, divided by the purchase price or sale price, as the majority of the Company's properties are subject to Triple Net Leases.
Contract Rental Revenue includes minimum rent, percentage rent and other contingent consideration, and rental revenue from parking and storage space and excludes GAAP adjustments, such as straight-line rent and amortization of above-market lease assets and below-market lease liabilities. Contract Rental Revenue includes such revenues from properties subject to a direct financing lease. The Company believes that Contract Rental Revenue is a useful supplemental measure to investors and analysts for assessing the performance of the Company's REI segment, although it does not represent revenue that is computed in accordance with GAAP. Therefore, Contract Rental Revenue should not be considered as an alternative to revenue, as computed in accordance with GAAP, or as an indicator of the Company's financial performance. Contract Rental Revenue may not be comparable to similarly titled measures of other companies.
The following table shows the calculation of the REI segment Contract Rental Revenue for the three months ended September 30, 2016 and 2015 (dollar amounts in thousands):
|
| | | | | | | | |
| | | Three Months Ended September 30, |
| | | 2016 | | 2015 |
| Rental income - as reported | | $ | 303,383 |
| | $ | 333,766 |
|
| Direct financing lease income - as reported | | 494 |
| | 659 |
|
| Adjustments: | | | | |
| Straight-line rent | | (12,454 | ) | | (21,705 | ) |
| Amortization of above-market lease assets and deferred lease incentives, net of amortization of below-market lease liabilities | | 1,632 |
| | 1,152 |
|
| Net direct financing lease adjustments | | 571 |
| | 507 |
|
| Other non-contract rental revenue | | — |
| | (73 | ) |
| Contract Rental Revenue | | $ | 293,626 |
| | $ | 314,306 |
|
CPI is a lease in which base rent is adjusted based on changes in a consumer price index.
Debt Outstanding represents the Company's outstanding principal debt balance, excluding certain GAAP adjustments, such as premiums and discounts, financing and issuance costs, and related accumulated amortization. We believe that the presentation of Debt Outstanding, which shows our contractual debt obligations, provides useful information to investors to assess our overall liquidity, financial flexibility, capital structure and leverage. Debt Outstanding should not be considered as an alternative to the Company's consolidated debt balance as determined in accordance with GAAP or any other GAAP financial measures and should only be considered together with, and as a supplement to, the Company's financial information prepared in accordance with GAAP.
VEREIT, Inc. | WWW.VEREIT.COM | 60
|
| | |
| | |
| Q3 2016 SUPPLEMENTAL INFORMATION |
The following table shows a reconciliation of Debt Outstanding to the amounts presented in accordance with GAAP on the balance sheet for the periods presented (dollar amounts in thousands):
|
| | | | | | | | | | | | | | | | | | | | |
| | | Three Months Ended |
| | | September 30,
2016 | | June 30,
2016 | | March 31,
2016 | | December 31,
2015 | | September 30,
2015 |
| Mortgage notes payable and other debt, net | | $ | 2,861,210 |
| | $ | 2,938,072 |
| | $ | 3,029,666 |
| | $ | 3,111,985 |
| | $ | 3,187,960 |
|
| Corporate bonds, net | | 2,225,157 |
| | 3,522,297 |
| | 2,537,699 |
| | 2,536,333 |
| | 2,534,977 |
|
| Convertible debt, net | | 970,691 |
| | 968,059 |
| | 965,469 |
| | 962,894 |
| | 960,361 |
|
| Credit facility, net | | 496,008 |
| | 1,045,872 |
| | 1,269,731 |
| | 1,448,590 |
| | 2,097,400 |
|
| Mortgage notes payable associated with assets held for sale | | — |
| | — |
| | — |
| | — |
| | 118,493 |
|
| Total debt - as reported | | 6,553,066 |
| | 8,474,300 |
| | 7,802,565 |
| | 8,059,802 |
| | 8,899,191 |
|
| Adjustments: | | | | | | | | | | |
| Deferred financing costs, net | | 59,467 |
| | 69,719 |
| | 57,652 |
| | 62,674 |
| | 67,804 |
|
| Net premiums | | (25,694 | ) | | (29,319 | ) | | (33,614 | ) | | (39,131 | ) | | (38,583 | ) |
| Debt Outstanding | | $ | 6,586,839 |
| | $ | 8,514,700 |
| | $ | 7,826,603 |
| | $ | 8,083,345 |
| | $ | 8,928,412 |
|
Direct Financing Lease is a lease that requires specific treatment due to the significance of the lease payments from the inception of the lease compared to the fair value of the property, term of the lease, a transfer of ownership, or a bargain purchase option. These leases are recorded as a net asset on the balance sheet. The amount booked is calculated as the fair value of the remaining lease payments on the leases and the estimated fair value of any expected residual property value at the end of the lease term.
Double Net Lease ("NN") is a lease under which the tenant agrees to pay all operating expenses associated with the property (e.g., real estate taxes, insurance, maintenance), but excludes some or all major repairs (e.g. roof, structure, parking lot).
Earnings Before Interest, Taxes, Depreciation and Amortization ("EBITDA") and Normalized EBITDA
Normalized EBITDA as disclosed represents EBITDA, or earnings before interest, taxes, depreciation and amortization, modified to exclude non-routine items such as acquisition related costs, merger and other non-routine transactions costs, gains or losses on sale of investments, insurance and litigation settlements and extinguishment of debt cost. We also exclude certain non-cash items such as impairments of intangible assets, straight-line rental revenue, unrealized gains or losses on derivatives, write-off of program development costs, and amortization of intangibles, deferred financing costs, above-market lease assets and below-market lease liabilities. Management believes that excluding these costs from EBITDA provides investors with supplemental performance information that is consistent with the performance models and analysis used by management, and provides investors a view of the performance of our portfolio over time. The Company believes that Normalized EBITDA is a useful supplemental measure to investors and analysts for assessing the performance of the Company's business segments, although it does not represent net income that is computed in accordance with GAAP. Therefore, Normalized EBITDA should not be considered as an alternative to net income or as an indicator of the Company's financial performance. The Company uses Normalized EBITDA as one measure of its operating performance when formulating corporate goals and evaluating the effectiveness of the Company's strategies. Normalized EBITDA may not be comparable to similarly titled measures of other companies.
Economic Occupancy equals the sum of square feet leased (including month-to-month agreements) divided by total square feet.
Enterprise Value equals the sum of the Implied Equity Market Capitalization, preferred stock and Net Debt.
Fixed Charge Coverage Ratio is the sum of (i)interest expense incurred on the outstanding principal balance of our debt, excluding certain GAAP adjustments reported as interest expense, such as amortization of deferred financing costs, premiums and discounts, (ii) secured debt principal amortization and (iii) dividends attributable to preferred shares divided by Normalized EBITDA.
Flat Lease is a lease that requires equal rent payments, with no increases, throughout the initial term of the lease agreement. A Flat Lease may include a period of free rent at the beginning or end of the lease.
VEREIT, Inc. | WWW.VEREIT.COM | 61
|
| | |
| | |
| Q3 2016 SUPPLEMENTAL INFORMATION |
Funds from Operations ("FFO") and Adjusted Funds from Operations ("AFFO")
Due to certain unique operating characteristics of real estate companies, as discussed below, the National Association of Real Estate Investment Trusts, Inc. ("NAREIT"), an industry trade group, has promulgated a supplemental performance measure known as FFO, which we believe to be an appropriate supplemental performance measure to reflect the operating performance of a REIT. FFO is not equivalent to our net income or loss as determined under U.S. GAAP.
NAREIT defines FFO as net income or loss computed in accordance with U.S. GAAP, excluding gains or losses from disposition of property, depreciation and amortization of real estate assets and impairment write-downs on real estate including the pro rata share of adjustments for unconsolidated partnerships and joint ventures. We calculated FFO in accordance with NAREIT's definition described above.
In addition to FFO, we use adjusted funds from operations (“AFFO”) as a non-GAAP supplemental financial performance measure to evaluate the operating performance of the Company. AFFO, as defined by the Company, excludes from FFO non-routine items such as acquisition related costs, litigation and other non-routine costs, gains or losses on sale of investment securities or loans held for investment, insurance recoveries and legal settlements. We also exclude certain non-cash items such as impairments of goodwill and intangible assets, straight-line rental revenue, unrealized gains or losses on derivatives, reserves for loan loss, gain or loss on the extinguishment or forgiveness of debt, non-current portion of the tax benefit or expense, equity-based compensation and amortization of intangible assets, deferred financing costs, above-market lease assets and below-market lease liabilities. Management believes that excluding these costs from FFO provides investors with supplemental performance information that is consistent with the performance models and analysis used by management, and provides investors a view of the performance of our portfolio over time. AFFO allows for a comparison of the performance of our operations with other traded REITs, as AFFO, or an equivalent measure, is routinely reported by traded REITs, and we believe often used by analysts and investors for comparison purposes.
For all of these reasons, we believe FFO and AFFO, in addition to net income (loss), as defined by GAAP, are helpful supplemental performance measures and useful in understanding the various ways in which our management evaluates the performance of the Company over time. However, not all REITs calculate FFO and AFFO the same way, so comparisons with other REITs may not be meaningful. FFO and AFFO should not be considered as alternatives to net income (loss) and are not intended to be used as a liquidity measure indicative of cash flow available to fund our cash needs. Neither the SEC, NAREIT, nor any other regulatory body has evaluated the acceptability of the exclusions used to adjust FFO in order to calculate AFFO and its use as a non-GAAP financial performance measure.
Gross Lease is a lease under which the landlord is responsible for all expenses associated with the property (e.g., real estate taxes, insurance, maintenance and repairs).
Gross Real Estate Investments represent total gross real estate and related assets, including net investments in unconsolidated entities, investment in direct financing leases, investment securities backed by real estate and loans held for investment, net of gross intangible lease liabilities.
Implied Equity Market Capitalization equals shares of common stock outstanding, including restricted stock awards, multiplied by the closing sale price of the Company's stock as reported on the New York Stock Exchange.
Industry is derived from the North American Industry Classification System, NAICS, which is a system used by Federal statistical agencies to classify business establishments, for the purpose of collecting, analyzing, and publishing statistical data related to the U.S. business economy.
Interest Coverage Ratio reflects interest expense incurred on the outstanding principal balance of our debt, excluding certain GAAP adjustments reported as interest expense, such as amortization of deferred financing costs, premiums and discounts divided by Normalized EBITDA.
VEREIT, Inc. | WWW.VEREIT.COM | 62
|
| | |
| | |
| Q3 2016 SUPPLEMENTAL INFORMATION |
Interest Expense, Excluding Non-Cash Amortization reflects interest expense incurred on the outstanding principal balance of our debt, which excludes the amortization of deferred financing costs, premiums and discounts, which are reported as interest expense in accordance with GAAP. We believe that the presentation of Interest Expense, Excluding Non-Cash Amortization, which shows the interest expense on our contractual debt obligations, provides useful information to investors to assess our overall solvency and financial flexibility. Interest Expense, Excluding Non-Cash Amortization should not be considered as an alternative to the Company's interest expense as determined in accordance with GAAP or any other GAAP financial measures and should only be considered together with and as a supplement to the Company's financial information prepared in accordance with GAAP.
The following table shows a reconciliation of interest expense, excluding non-cash amortization to interest expense presented in accordance with GAAP on the statements of operations for the periods presented (dollar amounts in thousands):
|
| | | | | | | | | | | | | | | | | | | | |
| | | Three Months Ended |
| | | September 30,
2016 | | June 30,
2016 | | March 31,
2016 | | December 31,
2015 | | September 30,
2015 |
| Interest expense - as reported | | $ | 79,869 |
| | $ | 82,468 |
| | $ | 80,426 |
| | $ | 82,591 |
| | $ | 89,530 |
|
| Adjustments: | | | | | | | | | | |
| Amortization of deferred financing and issuance costs | | (7,081 | ) | | (7,470 | ) | | (7,307 | ) | | (7,321 | ) | | (11,320 | ) |
| Amortization of net premiums | | 3,723 |
| | 4,000 |
| | 4,423 |
| | 5,079 |
| | 4,930 |
|
| Interest expense, excluding non-cash amortization | | $ | 76,511 |
| | $ | 78,998 |
| | $ | 77,542 |
| | $ | 80,349 |
| | $ | 83,140 |
|
Investment-Grade Tenants are those with a Standard & Poor’s credit rating of BBB- or higher or a Moody’s credit rating of Baa3 or higher. The ratings may reflect those assigned by Standard & Poor’s or Moody’s to the lease guarantor or the parent company, as applicable.
Metropolitan Statistical Area (MSA) is a large metropolitan area represented by a large group of zip codes, as defined by Real Capital Analytics.
Modified Gross Lease is a lease under which the landlord is responsible for most expenses associated with the property (e.g., real estate taxes, insurance, maintenance and repairs), but passes through some operating expenses to the tenant.
NAV per share represents the net asset value of the respective share class.
Net Cole Capital G&A Expense
Cole Capital incurs certain costs on behalf of the Cole REITs, which are reimbursable. In accordance with GAAP, the Company records these costs as general and administrative expenses and the subsequent reimbursements as revenue. We believe Net Cole Capital G&A Expense is a helpful supplemental measure in determining the effective cost to the Company, eliminating any gross up presentation required by GAAP.
Net Cole Capital Revenue
Cole Capital incurs certain costs on behalf of the Cole REITs, which are reimbursable. In accordance with GAAP, Cole Capital records the reimbursement of these costs as fee and commission revenue and as reimbursement revenue and records the expense in reallowed fees and commissions and general and administrative expenses. We believe Net Revenue is a helpful supplemental measure in determining the effective revenue earned by the Company, eliminating any gross up presentation required by GAAP.
Net Debt is a non-GAAP measure used to show the Company's Debt Outstanding, less all cash and cash equivalents. We believe that the presentation of net debt provides useful information to investors because our management reviews net debt as part of its management of our overall liquidity, financial flexibility, capital structure and leverage.
Net Debt Leverage Ratio equals Net Debt divided by Gross Real Estate Investments.
Net Debt to Normalized EBITDA Annualized equals Net Debt divided by the current quarter Normalized EBITDA multiplied by four.
VEREIT, Inc. | WWW.VEREIT.COM | 63
|
| | |
| | |
| Q3 2016 SUPPLEMENTAL INFORMATION |
Net Operating Income ("NOI") and Cash NOI
NOI is a non-GAAP performance measure used to evaluate the operating performance of a real estate company. NOI represents rental and other property income and tenant reimbursement income less property operating expenses. NOI excludes depreciation and amortization, general and administrative expenses, acquisition related expenses and litigation and other non-routine costs. Cash NOI excludes the impact of certain GAAP adjustments to rental revenue, such as straight-line rent adjustments and amortization of above-market intangible lease assets and below-market lease intangible liabilities. It is management's view that NOI and Cash NOI provide investors relevant and useful information because it reflects only income and operating expense items that are incurred at the property level and presents them on an unleveraged basis. NOI and Cash NOI should not be considered as an alternative to operating income. Further, NOI and Cash NOI may not be comparable to similarly titled measures of other companies.
The following table shows the calculation of the REI segment NOI and Cash NOI for the periods presented (dollar amounts in thousands):
|
| | | | | | | | | | | | | | | | | | | | |
| | | Three Months Ended |
| | | September 30,
2016 | | June 30,
2016 | | March 31,
2016 | | December 31,
2015 | | September 30,
2015 |
| Operating income (loss) | | 85,468 |
| | $ | 84,628 |
| | $ | (60,804 | ) | | $ | 101,302 |
| | $ | 99,730 |
|
| Acquisition related | | 90 |
| | 27 |
| | 217 |
| | 673 |
| | 1,690 |
|
| Litigation and other non-routine costs, net of insurance recoveries | | 4,630 |
| | 2,917 |
| | (5,175 | ) | | (7,691 | ) | | 8,032 |
|
| General and administrative | | 12,069 |
| | 13,701 |
| | 12,228 |
| | 16,646 |
| | 15,848 |
|
| Depreciation and amortization | | 187,897 |
| | 190,236 |
| | 195,991 |
| | 197,409 |
| | 200,158 |
|
| Impairment of real estate | | 6,872 |
| | 8,825 |
| | 160,517 |
| | 6,414 |
| | — |
|
| NOI | | 297,026 |
| | 300,334 |
| | 302,974 |
| | 314,753 |
| | 325,458 |
|
| Straight-line rent, net of bad debt expense related to straight-line rent | | (12,319 | ) | | (15,663 | ) | | (13,045 | ) | | (17,589 | ) | | (21,705 | ) |
| Amortization of above-market lease assets and deferred lease incentives, net of amortization of below-market lease liabilities | | 1,632 |
| | 1,248 |
| | 1,296 |
| | 1,299 |
| | 1,152 |
|
| Net direct financing lease adjustments | | 571 |
| | 590 |
| | 559 |
| | 544 |
| | 507 |
|
| Cash NOI | | $ | 286,910 |
| | $ | 286,509 |
| | $ | 291,784 |
| | $ | 299,007 |
| | $ | 305,412 |
|
Normalized Cash NOI equals our Cash NOI for our most recently reported quarter and eliminates the Cash NOI for properties acquired or developments completed during the most recently reported quarter and replaces Cash NOI for the partial period with an amount estimated to be equivalent to Cash NOI for the full period. Additionally, Normalized Cash NOI eliminates the Cash NOI contributed by properties disposed of during the most recently reported period. It is management's view that Normalized Cash NOI provides investors relevant and useful information because it reflects only the Cash NOI of properties owned as of the most recent reporting period. Normalized Cash NOI should not be considered as an alternative to operating income.
Normalized EBITDA Annualized equals Normalized EBITDA, for the respective quarter, multiplied by four.
Normalized EBITDA Margin is a measurement of a company's operating profitability. It is equal to Normalized EBITDA divided by Net Cole Capital Revenue and other income.
Normalized Net Cole Capital G&A Expense equals Net Cole Capital G&A Expense adjusted for the net change in program development costs. We believe Normalized Net G&A Expense is a helpful supplemental measure in determining the effective cost to the Company, eliminating any gross up presentation required by GAAP and adjusting to include costs incurred and recorded as program development costs on the balance sheet.
Property Operating Expense includes reimbursable and non-reimbursable costs to operate a property, including real estate taxes, utilities, insurance, repairs, maintenance, legal, property management fees, etc.
Triple Net Lease ("NNN") is a lease under which the tenant agrees to pay all expenses associated with the property (e.g., real estate taxes, insurance, maintenance and repairs).
Weighted Average Remaining Lease Term is the number of years remaining on each respective lease, weighted based on Annualized Rental Income.
VEREIT, Inc. | WWW.VEREIT.COM | 64