Exhibit 99.2
 | ||
| Q3 2019 SUPPLEMENTAL INFORMATION | ||
| VEREIT Supplemental Information | |
| September 30, 2019 | |
| Section | Page |  |
| Company Overview | ||
| Financial Summary | ||
| Financial and Operations Statistics and Ratios | ||
| Key Balance Sheet Metrics and Capital Structure | ||
| Balance Sheets | ||
| Statements of Operations | ||
| Funds From Operations (FFO) | ||
| Adjusted Funds From Operations (AFFO) | ||
| EBITDA, EBITDAre and Normalized EBITDA | ||
| Net Operating Income |  | |
| Same Store Contract Rental Revenue | ||
| Debt and Preferred Equity Summary | ||
| Credit Facility and Corporate Bond Covenants | ||
| Acquisitions and Dispositions | ||
| Diversification Statistics | ||
| Top 10 Concentrations | ||
| Tenants Comprising Over 1% of Annualized Rental Income | ||
| Tenant Industry Diversification | ||
| Property Geographic Diversification | ||
| Lease Expirations |  | |
| Lease Summary | ||
| Property Type Diversification | ||
| Unconsolidated Joint Venture Investment Summary | ||
| Definitions | ||
 | ||
See the Definitions section for a description of the Company's non-GAAP and operating metrics.
VEREIT, Inc. | WWW.VEREIT.COM | 2
| ||
| Q3 2019 SUPPLEMENTAL INFORMATION | ||
| About the Data |
This data and other information described herein are as of and for the three months ended September 30, 2019, unless otherwise indicated. Certain balances have been reclassified to conform with the current period's presentations, including the operating expense reimbursements line item which has been combined into rental revenue for all periods presented. Future performance may not be consistent with past performance and is subject to change and inherent risks and uncertainties. This information should be read in conjunction with the financial statements and the Management's Discussion and Analysis of Financial Condition and Results of Operations sections contained in VEREIT, Inc.'s (the "Company," "VEREIT," "us," "our" and "we") Annual Report on Form 10-K for the year ended December 31, 2018 and Quarterly Reports on Form 10-Q for the periods ended September 30, 2019, June 30, 2019, March 31, 2019, and September 30, 2018.
In the third quarter of 2019, the Company entered into agreements to settle certain outstanding litigation, including the pending class action litigation, In re American Realty Capital Properties, Inc. Litigation, No. 1:15-mc-00040 (AKH) (the “Class Action”). In accordance with the terms of the stipulation of settlement and settlement contemplated therein for the Class Action (the "Class Action Settlement"), certain defendants agreed to pay in the aggregate $1.025 billion, comprised of contributions from the Company’s former external manager and its principals (together, the “Former Manager”) totaling $225.0 million, $12.5 million from the Company’s former Chief Financial Officer (the “Former CFO”), $49.0 million from the Company’s former auditor, and the balance of $738.5 million from the Company. The contribution from the Company’s Former Manager and Former CFO was satisfied with a combination of (i) limited partner OP Units held by the Former Manager and Former CFO, (ii) amounts due related to dividends on certain of such limited partner OP Units previously withheld from distribution, (iii) the value of substantially all of the limited partner OP Units and dividends surrendered to the Company in July 2019 as a result of a settlement by the Former Manager with the U.S. Securities and Exchange Commission (the "SEC"), and (iv) cash paid by the Former Manager and Former CFO. Pursuant to the Class Action Settlement, on October 15, 2019, the Company funded $966.3 million in connection therewith, which includes the Company's contribution of $738.5 million and cash contributed by the Company to the Class Action Settlement fund for the surrendered limited partner OP Units and amounts due related to the previously withheld dividends. The Company determined that Net Debt as of September 30, 2019 should include the amounts payable in cash pursuant to the Class Action Settlement. Management believes that including the impact of the payables in Net Debt provides useful information to investors to assess our liquidity, financial flexibility, capital structure and leverage, as the Company maintained a high cash balance at September 30, 2019 with the intent to use the cash to fund the Class Action Settlement.
The Company also entered into settlement agreements and releases to settle the remaining opt out actions and paid $27.0 million during the three months ended September 30, 2019 in connection therewith, which when aggregated with the Company's contribution to the Class Action Settlement is a total cost to the Company of approximately $765.5 million in the third quarter of 2019.
In the second quarter of 2019, the Company sold six consolidated properties to two newly-formed unconsolidated joint ventures (the "Industrial Partnership"), over which the Company exercises significant influence, but not control. Under GAAP, the Company accounts for its investment in the Industrial Partnership and one previously existing joint venture under the equity method of accounting and does not consolidate the financial results and position of the underlying joint ventures. The Company determined that effective April 1, 2019, certain non-GAAP measures and operating metrics should include the Company's pro rata share of such measures and metrics from the Company's unconsolidated joint ventures, based upon the Company's legal ownership percentage, which may, at times, not equal the Company's economic interest because of various provisions in the joint venture agreements regarding distributions of cash flow based on capital account balances, allocations of profits and losses and payments of preferred returns. Management believes that including the Company's pro rata share of certain non-GAAP measures and operating metrics is helpful in understanding the financial condition and performance and operating metrics of the Company. The Company did not update data presented for prior periods as the impact on prior period non-GAAP measures and operating metrics was immaterial. The Company does not adjust non-GAAP measures and operating metrics for the partner's pro rata share of the Company's consolidated joint venture as the impact is immaterial.
Prior to the fourth quarter of 2017, the Company operated through two business segments, the real estate investment segment and the investment management segment, Cole Capital. On February 1, 2018, the Company completed the sale of Cole Capital. Substantially all of the Cole Capital segment is presented as discontinued operations and the Company's remaining financial results are reported as a single segment for all periods presented. The Company's continuing operations represent primarily those of the real estate investment segment.
See the Definitions section for a description of the Company's non-GAAP and operating metrics.
VEREIT, Inc. | WWW.VEREIT.COM | 3
| ||
| Q3 2019 SUPPLEMENTAL INFORMATION | ||
| Forward-Looking Statements |
Information set forth herein contains “forward-looking statements” (within the meaning of the federal securities laws, Section 27A of the Securities Act of 1933, as amended, and Section 21E of the Securities Exchange Act of 1934, as amended), which reflect VEREIT’s expectations and projections regarding future events and plans, VEREIT's future financial condition, results of operations and business. The forward-looking statements involve a number of assumptions, risks, uncertainties and other factors that could cause actual results to differ materially from those contained in the forward-looking statements. Generally, the words “expects,” “anticipates,”“assumes,” “targets,” “goals,” “projects,” “intends,” “plans,” “believes,” “seeks,” “estimates,” "may," "will," "should," "could," "continues," variations of such words and similar expressions identify forward-looking statements. These forward-looking statements are based on information currently available to us and are subject to a number of known and unknown risks, uncertainties and other factors, most of which are difficult to predict and many of which are beyond VEREIT’s control. If a change occurs, VEREIT’s business, financial condition, liquidity and results of operations may vary materially from those expressed in or implied by the forward-looking statements.
The following factors, among others, could cause actual results to differ from those set forth in the forward-looking statements: VEREIT’s plans, market and other expectations, objectives, intentions and other statements that are not historical facts; VEREIT’s ability to meet its 2019 guidance; VEREIT’s ability to renew leases, lease vacant space or re-lease space as leases expire on favorable terms or at all; risks associated with tenant, geographic and industry concentrations with respect to VEREIT's properties; risks accompanying the management of its Industrial Partnership; the impact of impairment charges in respect of certain of VEREIT's properties; unexpected costs or liabilities that may arise from potential dispositions, including related to limited partnership, tenant-in-common and Delaware statutory trust real estate programs and VEREIT’s management with respect to such programs; competition in the acquisition and disposition of properties and in the leasing of its properties; the inability to acquire, dispose of, or lease properties on advantageous terms; risks associated with bankruptcies or insolvencies of tenants, from tenant defaults generally or from the unpredictability of the business plans and financial condition of VEREIT's tenants; risks associated with the pending SEC investigation and remaining derivative litigations, including the expense of such investigation and litigation and any additional potential payments upon resolution; risks associated with obtaining final court approval of the class action and derivative settlements; risks associated with VEREIT’s substantial indebtedness, including that such indebtedness may affect VEREIT's ability to pay dividends and the terms and restrictions within the agreements governing VEREIT's indebtedness may restrict its borrowing and operating flexibility; the ability to retain or hire key personnel; and continuation or deterioration of current market conditions. Additional factors that may affect future results are contained in VEREIT’s filings with the SEC, which are available at the SEC’s website at www.sec.gov. VEREIT disclaims any obligation to publicly update or revise any forward-looking statements, whether as a result of changes in underlying assumptions or factors, new information, future events or otherwise, except as required by law.
See the Definitions section for a description of the Company's non-GAAP and operating metrics.
VEREIT, Inc. | WWW.VEREIT.COM | 4
| ||
| Q3 2019 SUPPLEMENTAL INFORMATION | ||
Company Overview (unaudited) |
VEREIT is a real estate company incorporated in Maryland on December 2, 2010, which has elected to be taxed as a real estate investment trust ("REIT") for U.S. federal income tax purposes. On September 6, 2011, the Company completed its initial public offering.
VEREIT is a full-service real estate operating company which owns and manages one of the largest portfolios of single-tenant commercial properties in the U.S. VEREIT's business model provides equity capital to creditworthy corporations in return for long-term leases on their properties. The Company targets properties that are strategically located and essential to the business operations of the tenant, as well as retail properties that offer necessity- and value-oriented products or services. At September 30, 2019, approximately 39.5% of the Company's Annualized Rental Income was earned from Investment-Grade Tenants, Economic Occupancy Rate was 99.0% and the Weighted Average Remaining Lease Term was 8.4 years.
Tenants, Trademarks and Logos
VEREIT is not affiliated with, is not endorsed by, does not endorse and is not sponsored by or a sponsor of the products or services pictured or mentioned. The names, logos and all related product and service names, design marks and slogans are the trademarks or service marks of their respective companies.
See the Definitions section for a description of the Company's non-GAAP and operating metrics.
VEREIT, Inc. | WWW.VEREIT.COM | 5
| ||
| Q3 2019 SUPPLEMENTAL INFORMATION | ||
| Company Overview (cont.) |
| Senior Management | Board of Directors | |
| Glenn J. Rufrano, Chief Executive Officer | Hugh R. Frater, Non-Executive Chairman | |
| Michael J. Bartolotta, Executive Vice President and Chief Financial Officer | David B. Henry, Independent Director | |
| Lauren Goldberg, Executive Vice President, General Counsel and Secretary | Mary Hogan Preusse, Independent Director | |
| Paul H. McDowell, Executive Vice President and Chief Operating Officer | Richard J. Lieb, Independent Director | |
| Thomas W. Roberts, Executive Vice President and Chief Investment Officer | Mark S. Ordan, Independent Director | |
| Gavin B. Brandon, Senior Vice President and Chief Accounting Officer | Eugene A. Pinover, Independent Director | |
| Julie G. Richardson, Independent Director | ||
| Glenn J. Rufrano, Chief Executive Officer | ||
Corporate Offices and Contact Information
| 2325 E. Camelback Road, 9th Floor | 19 West 44th Street, Suite 1401 | |
| Phoenix, AZ 85016 | New York, NY 10036 | |
| 800-606-3610 | 212-413-9100 | |
| www.VEREIT.com | ||
Trading Symbols: VER, VER PF
Stock Exchange Listing: New York Stock Exchange
Transfer Agent
Computershare Trust Company, N.A.
250 Royall Street
Canton, MA 02021
800-736-3001
See the Definitions section for a description of the Company's non-GAAP and operating metrics.
VEREIT, Inc. | WWW.VEREIT.COM | 6
| ||
| Q3 2019 SUPPLEMENTAL INFORMATION | ||
Quarterly Financial Summary (unaudited, dollars in thousands, except share and per share amounts) |
The following table summarizes the Company's quarterly financial results and portfolio metrics. Data presented represents continuing operations.
| Three Months Ended | |||||||||||||||||||
| Financial Results | September 30, 2019 | June 30, 2019 | March 31, 2019 | December 31, 2018 | September 30, 2018 | ||||||||||||||
| Rental revenue | $ | 302,985 | $ | 312,043 | $ | 316,843 | $ | 313,263 | $ | 313,866 | |||||||||
(Loss) income from continuing operations | $ | (741,529 | ) | $ | 292,284 | $ | 70,971 | $ | 27,872 | $ | (73,942 | ) | |||||||
Basic and diluted (loss) income from continuing operations per share attributable to common stockholders and limited partners | $ | (0.76 | ) | $ | 0.27 | $ | 0.05 | $ | 0.01 | $ | (0.09 | ) | |||||||
| Normalized EBITDA | $ | 258,625 | $ | 260,345 | $ | 263,936 | $ | 257,486 | $ | 261,084 | |||||||||
FFO attributable to common stockholders and limited partners from continuing operations | $ | (657,147 | ) | $ | 179,038 | $ | 190,304 | $ | 154,606 | $ | 38,055 | ||||||||
FFO attributable to common stockholders and limited partners from continuing operations per diluted share | $ | (0.655 | ) | $ | 0.179 | $ | 0.192 | $ | 0.156 | $ | 0.038 | ||||||||
| AFFO attributable to common stockholders and limited partners | $ | 177,580 | $ | 177,099 | $ | 178,403 | $ | 172,511 | $ | 178,529 | |||||||||
| AFFO attributable to common stockholders and limited partners per diluted share | $ | 0.177 | $ | 0.177 | $ | 0.180 | $ | 0.174 | $ | 0.180 | |||||||||
| Dividends declared per common share | $ | 0.1375 | $ | 0.1375 | $ | 0.1375 | $ | 0.1375 | $ | 0.1375 | |||||||||
| Weighted-average shares outstanding - diluted | 1,002,899,652 | 999,777,735 | 993,298,314 | 992,337,959 | 991,924,017 | ||||||||||||||
| Portfolio Metrics | |||||||||||||||||||
| Operating Properties | 3,926 | 3,950 | 3,980 | 3,994 | 4,021 | ||||||||||||||
| Rentable Square Feet (in thousands) | 90,704 | 90,631 | 94,742 | 94,953 | 93,856 | ||||||||||||||
| Economic Occupancy Rate | 99.0 | % | 99.0 | % | 98.9 | % | 98.8 | % | 99.1 | % | |||||||||
| Weighted Average Remaining Lease Term (years) | 8.4 | 8.6 | 8.7 | 8.9 | 8.9 | ||||||||||||||
Investment-Grade Tenants (1) | 39.5 | % | 39.6 | % | 41.3 | % | 41.9 | % | 42.7 | % | |||||||||
___________________________________
| (1) | The weighted-average credit rating of our investment-grade tenants was BBB+ as of September 30, 2019. |
See the Definitions section for a description of the Company's non-GAAP and operating metrics.
VEREIT, Inc. | WWW.VEREIT.COM | 7
| ||
| Q3 2019 SUPPLEMENTAL INFORMATION | ||
Financial and Operations Statistics and Ratios (unaudited, dollars in thousands) |
| Three Months Ended | ||||||||||||||||||||
| September 30, 2019 | June 30, 2019 | March 31, 2019 | December 31, 2018 | September 30, 2018 | ||||||||||||||||
| Interest Coverage Ratio | ||||||||||||||||||||
Interest Expense, excluding non-cash amortization (1) | $ | 66,223 | $ | 67,815 | $ | 69,036 | $ | 68,314 | $ | 66,445 | ||||||||||
Normalized EBITDA (2) | 258,625 | 260,345 | 263,936 | 257,486 | 261,084 | |||||||||||||||
| Interest Coverage Ratio | 3.91x | 3.84x | 3.82x | 3.77x | 3.93x | |||||||||||||||
| Fixed Charge Coverage Ratio | ||||||||||||||||||||
Interest Expense, excluding non-cash amortization (1) | $ | 66,223 | $ | 67,815 | $ | 69,036 | $ | 68,314 | $ | 66,445 | ||||||||||
| Secured debt principal amortization | 2,326 | 2,256 | 2,430 | 2,424 | 3,007 | |||||||||||||||
Dividends attributable to preferred shares | 16,578 | 17,973 | 17,973 | 17,973 | 17,973 | |||||||||||||||
| Total fixed charges | 85,127 | 88,044 | 89,439 | 88,711 | 87,425 | |||||||||||||||
Normalized EBITDA (2) | 258,625 | 260,345 | 263,936 | 257,486 | 261,084 | |||||||||||||||
| Fixed Charge Coverage Ratio | 3.04 | x | 2.96x | 2.95x | 2.90x | 2.99x | ||||||||||||||
| September 30, 2019 | June 30, 2019 | March 31, 2019 | December 31, 2018 | September 30, 2018 | ||||||||||||||||
| Net Debt Ratios | ||||||||||||||||||||
Net Debt (3) | $ | 5,658,503 | $ | 5,514,805 | $ | 6,049,418 | $ | 6,091,874 | $ | 5,949,843 | ||||||||||
| Normalized EBITDA annualized | 1,034,500 | 1,041,380 | 1,055,744 | 1,029,944 | 1,044,336 | |||||||||||||||
| Net Debt to Normalized EBITDA annualized ratio | 5.47 | x | 5.30 | x | 5.73 | x | 5.91 | x | 5.70 | x | ||||||||||
Net Debt (3) | $ | 5,658,503 | $ | 5,514,805 | $ | 6,049,418 | $ | 6,091,874 | $ | 5,949,843 | ||||||||||
Gross Real Estate Investments (3) | 14,911,108 | 14,950,309 | 15,411,364 | 15,411,026 | 15,385,925 | |||||||||||||||
| Net Debt Leverage Ratio | 37.9 | % | 36.9 | % | 39.3 | % | 39.5 | % | 38.7 | % | ||||||||||
| Unencumbered Assets/Real Estate Assets | ||||||||||||||||||||
| Unencumbered Gross Real Estate Investments | $ | 11,374,138 | $ | 11,361,522 | $ | 11,577,487 | $ | 11,574,315 | $ | 11,507,837 | ||||||||||
Gross Real Estate Investments (3) | 14,911,108 | 14,950,309 | 15,411,364 | 15,411,026 | 15,385,925 | |||||||||||||||
| Unencumbered Asset Ratio | 76.3 | % | 76.0 | % | 75.1 | % | 75.1 | % | 74.8 | % | ||||||||||
___________________________________
| (1) | Refer to the Statements of Operations section for interest expense calculated in accordance with GAAP and to the Definitions section for the required reconciliation to the most directly comparable GAAP financial measure. |
| (2) | Refer to the Statements of Operations section for net income calculated in accordance with GAAP and to the EBITDA, EBITDAre and Normalized EBITDA section for the required reconciliation to the most directly comparable GAAP financial measure. |
| (3) | Refer to the Balance Sheets section for total debt and real estate investments, at cost calculated in accordance with GAAP and to the Definitions section for the required reconciliation to the most directly comparable GAAP financial measure. As discussed in the About the Data section, Net Debt includes the amounts payable in cash pursuant to the Class Action settlement paid on October 15, 2019. |
See the Definitions section for a description of the Company's non-GAAP and operating metrics.
VEREIT, Inc. | WWW.VEREIT.COM | 8
| ||
| Q3 2019 SUPPLEMENTAL INFORMATION | ||
Key Balance Sheet Metrics and Capital Structure (unaudited, dollars and shares in thousands, except per share amounts) |
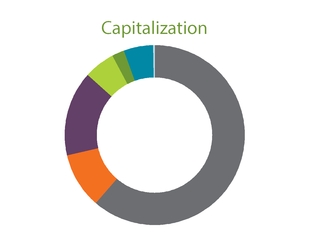
| Common equity | 61.5% | ||
| Corporate bonds | 15.2% | ||
| Mortgage notes payable | 9.9% | ||
| Preferred equity | 5.6% | ||
| Credit facility term loan | 5.2% | ||
| Convertible notes | 2.3% | ||
| Unconsolidated joint ventures' pro rata share | 0.3% | ||
Fixed vs. Variable Rate Debt
| Fixed | 84.1 | % |
| Swapped to Fixed | 15.7 | % |
| Variable | 0.2 | % |
| VEREIT Capitalization Table | ||||||||
Wtd. Avg. Maturity (Years) | Rate (1) | September 30, 2019 | ||||||
Diluted shares outstanding (2) | 1,094,225 | |||||||
| Stock price | $ | 9.78 | ||||||
| Implied Equity Market Capitalization | $ | 10,701,521 | ||||||
Series F Perpetual Preferred (3) | 6.70 | % | $ | 973,025 | ||||
| Mortgage notes payable | 2.9 | 5.05 | % | 1,716,199 | ||||
| Unconsolidated joint ventures' pro rata share | 4.7 | 3.57 | % | 53,850 | ||||
| Total secured debt | 3.0 | 5.01 | % | $ | 1,770,049 | |||
| Credit facility term loan | 3.6 | 3.84 | % | 900,000 | ||||
| 2020 convertible notes | 1.2 | 3.75 | % | 402,500 | ||||
| 2021 corporate bonds | 1.7 | 4.13 | % | 400,000 | ||||
| 2024 corporate bonds | 4.4 | 4.60 | % | 500,000 | ||||
| 2025 corporate bonds | 6.1 | 4.63 | % | 550,000 | ||||
| 2026 corporate bonds | 6.7 | 4.88 | % | 600,000 | ||||
| 2027 corporate bonds | 7.9 | 3.95 | % | 600,000 | ||||
| Total unsecured debt | 4.7 | 4.24 | % | $ | 3,952,500 | |||
| Total Adjusted Principal Outstanding | 4.2 | 4.48 | % | $ | 5,722,549 | |||
| Total Capitalization | $ | 17,397,095 | ||||||
| Less: Cash and cash equivalents | 1,029,315 | |||||||
| Less: Pro rata share of unconsolidated joint ventures' cash and cash equivalents | 1,046 | |||||||
| Enterprise Value | $ | 16,366,734 | ||||||
Net Debt (4)/Enterprise Value | 34.6 | % | ||||||
Net Debt (4)/Normalized EBITDA Annualized | 5.47 | x | ||||||
Net Debt (4) + Preferred (3)/Normalized EBITDA Annualized | 6.41 | x | ||||||
| Fixed Charge Coverage Ratio | 3.04 | x | ||||||
Liquidity (5) | $ | 2,060,146 | ||||||
(1)Weighted average interest rate for variable rate debt represents the interest rate in effect as of September 30, 2019.
(2)Diluted shares outstanding at September 30, 2019 includes 19.9 million limited partner OP Units surrendered to the Company by the Former Manager and the Former CFO and subsequently canceled on October 15, 2019.
(3)Balance represents 38.9 million shares of Series F Preferred Stock (and 38.9 million corresponding general partner Series F Preferred Units) and 49,766 limited partner Series F Preferred Units outstanding at September 30, 2019, multiplied by the liquidation preference of $25 per share.
(4)As discussed in the About the Data section, Net Debt as of September 30, 2019 includes the amounts payable in cash pursuant to the Class Action Settlement of $966.3 million paid on October 15, 2019.
(5)Liquidity represents cash and cash equivalents of $1.0 billion and $2.0 billion available capacity on our revolving credit facility, reduced by the amounts payable in cash pursuant to the Class Action Settlement of $966.3 million at September 30, 2019. Available capacity on our revolving credit facility is reduced by letters of credit outstanding of $3.9 million at September 30, 2019.
See the Definitions section for a description of the Company's non-GAAP and operating metrics.
VEREIT, Inc. | WWW.VEREIT.COM | 9
| ||
| Q3 2019 SUPPLEMENTAL INFORMATION | ||
Balance Sheets (unaudited, in thousands) |
| September 30, 2019 | June 30, 2019 | March 31, 2019 | December 31, 2018 | September 30, 2018 | ||||||||||||||||
| Assets | ||||||||||||||||||||
| Real estate investments, at cost: | ||||||||||||||||||||
| Land | $ | 2,728,560 | $ | 2,763,348 | $ | 2,824,666 | $ | 2,843,212 | $ | 2,847,393 | ||||||||||
| Buildings, fixtures and improvements | 10,287,047 | 10,352,928 | 10,741,995 | 10,749,228 | 10,652,578 | |||||||||||||||
| Intangible lease assets | 1,909,932 | 1,927,699 | 2,003,825 | 2,012,399 | 2,019,718 | |||||||||||||||
| Total real estate investments, at cost | 14,925,539 | 15,043,975 | 15,570,486 | 15,604,839 | 15,519,689 | |||||||||||||||
| Less: accumulated depreciation and amortization | 3,559,403 | 3,488,838 | 3,544,252 | 3,436,772 | 3,323,990 | |||||||||||||||
| Total real estate investments, net | 11,366,136 | 11,555,137 | 12,026,234 | 12,168,067 | 12,195,699 | |||||||||||||||
| Operating lease right-of-use assets | 218,393 | 221,798 | 224,859 | — | — | |||||||||||||||
| Investment in unconsolidated entities | 69,025 | 68,633 | 35,790 | 35,289 | 34,293 | |||||||||||||||
| Cash and cash equivalents | 1,029,315 | 211,510 | 12,788 | 30,758 | 25,264 | |||||||||||||||
| Restricted cash | 20,742 | 20,692 | 18,517 | 22,905 | 27,449 | |||||||||||||||
| Rent and tenant receivables and other assets, net | 347,455 | 343,788 | 361,641 | 366,092 | 412,053 | |||||||||||||||
| Goodwill | 1,337,773 | 1,337,773 | 1,337,773 | 1,337,773 | 1,337,773 | |||||||||||||||
| Real estate assets held for sale, net | 66,684 | 22,553 | 36,022 | 2,609 | 24,349 | |||||||||||||||
| Total assets | $ | 14,455,523 | $ | 13,781,884 | $ | 14,053,624 | $ | 13,963,493 | $ | 14,056,880 | ||||||||||
| Liabilities and Equity | ||||||||||||||||||||
| Mortgage notes payable, net | $ | 1,717,817 | $ | 1,745,331 | $ | 1,918,826 | $ | 1,922,657 | $ | 1,936,586 | ||||||||||
| Corporate bonds, net | 2,622,320 | 2,621,130 | 2,619,956 | 3,368,609 | 2,825,541 | |||||||||||||||
| Convertible debt, net | 397,726 | 396,766 | 395,823 | 394,883 | 393,961 | |||||||||||||||
| Credit facility, net | 895,351 | 895,033 | 1,089,725 | 401,773 | 793,000 | |||||||||||||||
| Below-market lease liabilities, net | 147,997 | 152,654 | 166,708 | 173,479 | 179,192 | |||||||||||||||
| Accounts payable and accrued expenses | 1,125,703 | 127,799 | 141,126 | 145,611 | 269,150 | |||||||||||||||
| Deferred rent and other liabilities | 101,828 | 77,713 | 70,220 | 69,714 | 51,663 | |||||||||||||||
| Distributions payable | 201,451 | 187,359 | 190,246 | 186,623 | 183,913 | |||||||||||||||
| Operating lease liabilities | 223,288 | 225,972 | 228,120 | — | — | |||||||||||||||
| Total liabilities | 7,433,481 | 6,429,757 | 6,820,750 | 6,663,349 | 6,633,006 | |||||||||||||||
| Series F preferred stock | 389 | 429 | 429 | 428 | 428 | |||||||||||||||
| Common stock | 10,677 | 9,734 | 9,716 | 9,675 | 9,674 | |||||||||||||||
| Additional paid-in capital | 13,360,675 | 12,655,018 | 12,645,148 | 12,615,472 | 12,612,407 | |||||||||||||||
| Accumulated other comprehensive loss | (47,886 | ) | (28,026 | ) | (12,202 | ) | (1,280 | ) | (1,031 | ) | ||||||||||
| Accumulated deficit | (6,306,590 | ) | (5,416,759 | ) | (5,550,574 | ) | (5,467,236 | ) | (5,343,368 | ) | ||||||||||
| Total stockholders' equity | 7,017,265 | 7,220,396 | 7,092,517 | 7,157,059 | 7,278,110 | |||||||||||||||
| Non-controlling interests | 4,777 | 131,731 | 140,357 | 143,085 | 145,764 | |||||||||||||||
| Total equity | 7,022,042 | 7,352,127 | 7,232,874 | 7,300,144 | 7,423,874 | |||||||||||||||
| Total liabilities and equity | $ | 14,455,523 | $ | 13,781,884 | $ | 14,053,624 | $ | 13,963,493 | $ | 14,056,880 | ||||||||||
See the Definitions section for a description of the Company's non-GAAP and operating metrics.
VEREIT, Inc. | WWW.VEREIT.COM | 10
| ||
| Q3 2019 SUPPLEMENTAL INFORMATION | ||
Statements of Operations (unaudited, in thousands, except per share data) |
| Three Months Ended | ||||||||||||||||||||
| September 30, 2019 | June 30, 2019 | March 31, 2019 | December 31, 2018 | September 30, 2018 | ||||||||||||||||
| Rental revenue | $ | 302,985 | $ | 312,043 | $ | 316,843 | $ | 313,263 | $ | 313,866 | ||||||||||
| Operating expenses: | ||||||||||||||||||||
| Acquisition-related | 1,199 | 985 | 985 | 1,136 | 810 | |||||||||||||||
| Litigation and non-routine costs, net | 832,024 | (3,769 | ) | (21,492 | ) | 23,541 | 138,595 | |||||||||||||
| Property operating | 30,822 | 32,503 | 32,378 | 32,567 | 31,893 | |||||||||||||||
| General and administrative | 14,483 | 16,416 | 14,846 | 17,220 | 15,186 | |||||||||||||||
| Depreciation and amortization | 115,111 | 118,022 | 136,555 | 153,050 | 157,181 | |||||||||||||||
| Impairments | 3,944 | 8,308 | 11,988 | 18,565 | 18,382 | |||||||||||||||
| Restructuring | 783 | 290 | 9,076 | — | — | |||||||||||||||
| Total operating expenses | 998,366 | 172,755 | 184,336 | 246,079 | 362,047 | |||||||||||||||
| Other income (expense): | ||||||||||||||||||||
| Interest expense | (67,889 | ) | (69,803 | ) | (71,254 | ) | (70,832 | ) | (69,310 | ) | ||||||||||
| Gain (loss) on extinguishment and forgiveness of debt, net | 975 | (1,472 | ) | — | 21 | 90 | ||||||||||||||
| Other income (loss), net | 2,737 | 3,175 | (402 | ) | 7,008 | (947 | ) | |||||||||||||
| Equity in income of unconsolidated entities | 677 | 505 | 500 | 225 | 252 | |||||||||||||||
| Gain on disposition of real estate and held for sale assets, net | 18,520 | 221,755 | 10,831 | 25,880 | 45,295 | |||||||||||||||
| Total other (expenses) income, net | (44,980 | ) | 154,160 | (60,325 | ) | (37,698 | ) | (24,620 | ) | |||||||||||
| (Loss) income before taxes | (740,361 | ) | 293,448 | 72,182 | 29,486 | (72,801 | ) | |||||||||||||
| Provision for income taxes from continuing operations | (1,168 | ) | (1,164 | ) | (1,211 | ) | (1,614 | ) | (1,141 | ) | ||||||||||
| (Loss) income from continuing operations | (741,529 | ) | 292,284 | 70,971 | 27,872 | (73,942 | ) | |||||||||||||
| Loss from discontinued operations, net of tax | — | — | — | (30 | ) | — | ||||||||||||||
| Net (loss) income | (741,529 | ) | 292,284 | 70,971 | 27,842 | (73,942 | ) | |||||||||||||
| Net loss (income) attributable to non-controlling interests | 15,089 | (6,626 | ) | (1,667 | ) | (624 | ) | 1,825 | ||||||||||||
| Net (loss) income attributable to the General Partner | $ | (726,440 | ) | $ | 285,658 | $ | 69,304 | $ | 27,218 | $ | (72,117 | ) | ||||||||
| Basic and diluted net (loss) income per share from continuing operations attributable to common stockholders and limited partners | $ | (0.76 | ) | $ | 0.27 | $ | 0.05 | $ | 0.01 | $ | (0.09 | ) | ||||||||
| Basic and diluted net loss per share from discontinued operations attributable to common stockholders and limited partners | — | — | — | (0.00 | ) | — | ||||||||||||||
| Basic and diluted net (loss) income per share attributable to common stockholders and limited partners | $ | (0.76 | ) | $ | 0.27 | $ | 0.05 | $ | 0.01 | $ | (0.09 | ) | ||||||||
See the Definitions section for a description of the Company's non-GAAP and operating metrics.
VEREIT, Inc. | WWW.VEREIT.COM | 11
| ||
| Q3 2019 SUPPLEMENTAL INFORMATION | ||
Funds From Operations (FFO) (unaudited, in thousands, except share and per share data) |
| Three Months Ended | ||||||||||||||||||||
| September 30, 2019 | June 30, 2019 | March 31, 2019 | December 31, 2018 | September 30, 2018 | ||||||||||||||||
| Net (loss) income | $ | (741,529 | ) | $ | 292,284 | $ | 70,971 | $ | 27,842 | $ | (73,942 | ) | ||||||||
| Dividends on non-convertible preferred stock | (16,578 | ) | (17,973 | ) | (17,973 | ) | (17,973 | ) | (17,973 | ) | ||||||||||
| Gain on disposition of real estate assets, net | (18,520 | ) | (221,762 | ) | (10,831 | ) | (25,951 | ) | (45,226 | ) | ||||||||||
| Depreciation and amortization of real estate assets | 114,695 | 117,616 | 135,861 | 151,837 | 156,527 | |||||||||||||||
| Impairment of real estate | 3,944 | 8,308 | 11,988 | 18,565 | 18,382 | |||||||||||||||
| Proportionate share of adjustments for unconsolidated entities | 841 | 565 | 288 | 256 | 287 | |||||||||||||||
| FFO attributable to common stockholders and limited partners | $ | (657,147 | ) | $ | 179,038 | $ | 190,304 | $ | 154,576 | $ | 38,055 | |||||||||
| FFO attributable to common stockholders and limited partners from continuing operations | (657,147 | ) | 179,038 | 190,304 | 154,606 | 38,055 | ||||||||||||||
| FFO attributable to common stockholders and limited partners from discontinued operations | — | — | — | (30 | ) | — | ||||||||||||||
| Weighted-average shares outstanding - basic | 978,982,729 | 973,723,139 | 968,460,296 | 967,817,245 | 967,798,401 | |||||||||||||||
Limited Partner OP Units and effect of dilutive securities (1) | 23,916,923 | 26,054,596 | 24,838,018 | 24,520,714 | 24,125,616 | |||||||||||||||
Weighted-average shares outstanding - diluted (2) | 1,002,899,652 | 999,777,735 | 993,298,314 | 992,337,959 | 991,924,017 | |||||||||||||||
FFO attributable to common stockholders and limited partners per diluted share (3) | $ | (0.655 | ) | $ | 0.179 | $ | 0.192 | $ | 0.156 | $ | 0.038 | |||||||||
FFO attributable to common stockholders and limited partners from continuing operations per diluted share (3) | (0.655 | ) | 0.179 | 0.192 | 0.156 | 0.038 | ||||||||||||||
FFO attributable to common stockholders and limited partners from discontinued operations per diluted share (3) | — | — | — | (0.000 | ) | — | ||||||||||||||
| (1) | Limited partner OP units includes 19.9 million limited partner OP Units surrendered to the Company by the Former Manager and the Former CFO in connection with the Class Action Settlement and subsequently canceled on October 15, 2019. Dilutive securities include unvested restricted shares of Common Stock, unvested restricted stock units and stock options. |
| (2) | Weighted-average shares for all periods presented exclude the effect of the convertible debt as the Company would expect to settle the debt in cash and any shares underlying restricted stock units that are not issuable based on the Company’s level of achievement of certain performance targets through the respective reporting period. |
| (3) | Refer to the Statements of Operations section for basic and diluted net income (loss) per share attributable to common stockholders and limited partners. |
See the Definitions section for a description of the Company's non-GAAP and operating metrics.
VEREIT, Inc. | WWW.VEREIT.COM | 12
| ||
| Q3 2019 SUPPLEMENTAL INFORMATION | ||
Adjusted Funds From Operations (AFFO) (unaudited, in thousands, except share and per share data) |
| Three Months Ended | ||||||||||||||||||||
| September 30, 2019 | June 30, 2019 | March 31, 2019 | December 31, 2018 | September 30, 2018 | ||||||||||||||||
| FFO attributable to common stockholders and limited partners | $ | (657,147 | ) | $ | 179,038 | $ | 190,304 | $ | 154,576 | $ | 38,055 | |||||||||
| Acquisition-related expenses | 1,199 | 985 | 985 | 1,136 | 810 | |||||||||||||||
| Litigation and non-routine costs, net | 832,024 | (3,769 | ) | (21,492 | ) | 23,541 | 138,595 | |||||||||||||
| Loss on disposition of discontinued operations | — | — | — | 30 | — | |||||||||||||||
| Payments received on fully reserved loans | — | — | — | (4,792 | ) | — | ||||||||||||||
| Loss (gain) on investments | 28 | (5 | ) | 470 | (1,790 | ) | 3,336 | |||||||||||||
| Loss (gain) on derivative instruments, net | — | 24 | 34 | 92 | (69 | ) | ||||||||||||||
| Amortization of premiums and discounts on debt and investments, net | (1,177 | ) | (1,392 | ) | (1,264 | ) | (1,154 | ) | (1,123 | ) | ||||||||||
| Amortization of above-market lease assets and deferred lease incentives, net of amortization of below-market lease liabilities | 692 | 611 | 731 | 945 | 1,058 | |||||||||||||||
| Net direct financing lease adjustments | 411 | 410 | 409 | 498 | 483 | |||||||||||||||
| Amortization and write-off of deferred financing costs | 3,319 | 3,346 | 3,494 | 3,715 | 3,926 | |||||||||||||||
| (Gain) loss on extinguishment and forgiveness of debt, net | (975 | ) | 1,472 | — | (21 | ) | (90 | ) | ||||||||||||
Straight-line rent, net of bad debt expense related to straight-line rent (1) | (5,470 | ) | (8,043 | ) | (7,412 | ) | (8,341 | ) | (8,720 | ) | ||||||||||
| Equity-based compensation | 2,924 | 3,706 | 2,687 | 2,924 | 3,003 | |||||||||||||||
| Restructuring expenses | 783 | 290 | 9,076 | — | — | |||||||||||||||
| Other adjustments, net | 1,138 | 617 | 569 | 1,092 | (726 | ) | ||||||||||||||
| Proportionate share of adjustments for unconsolidated entities | (128 | ) | (196 | ) | (188 | ) | 60 | (9 | ) | |||||||||||
| Adjustment for Excluded Properties | (41 | ) | 5 | — | — | — | ||||||||||||||
| AFFO attributable to common stockholders and limited partners | $ | 177,580 | $ | 177,099 | $ | 178,403 | $ | 172,511 | $ | 178,529 | ||||||||||
| Weighted-average shares outstanding - basic | 978,982,729 | 973,723,139 | 968,460,296 | 967,817,245 | 967,798,401 | |||||||||||||||
Limited Partner OP Units and effect of dilutive securities (2) | 23,916,923 | 26,054,596 | 24,838,018 | 24,520,714 | 24,125,616 | |||||||||||||||
Weighted-average shares outstanding - diluted (3) | 1,002,899,652 | 999,777,735 | 993,298,314 | 992,337,959 | 991,924,017 | |||||||||||||||
AFFO attributable to common stockholders and limited partners per diluted share (4) | $ | 0.177 | $ | 0.177 | $ | 0.180 | $ | 0.174 | $ | 0.180 | ||||||||||
| (1) | Upon adoption of ASC 842 in Q1 2019, the Company recognizes all changes in the collectability assessment for an operating lease as an adjustment to rental revenue and does not record bad debt expense for uncollectible accounts. |
| (2) | Limited partner OP Units includes 19.9 million limited partner OP Units surrendered to the Company by the Former Manager and the Former CFO in connection with the Class Action Settlement and subsequently canceled on October 15, 2019. Dilutive securities include unvested restricted shares of Common Stock, unvested restricted stock units and stock options. |
| (3) | Weighted-average shares for all periods presented exclude the effect of the convertible debt as the Company would expect to settle the debt in cash and any shares underlying restricted stock units that are not issuable based on the Company’s level of achievement of certain performance targets through the respective reporting period. |
| (4) | Refer to the Statements of Operations section for basic and diluted net income (loss) per share attributable to common stockholders and limited partners. |
See the Definitions section for a description of the Company's non-GAAP and operating metrics.
VEREIT, Inc. | WWW.VEREIT.COM | 13
| ||
| Q3 2019 SUPPLEMENTAL INFORMATION | ||
EBITDA, EBITDAre and Normalized EBITDA (unaudited, in thousands) |
| Three Months Ended | ||||||||||||||||||||
| September 30, 2019 | June 30, 2019 | March 31, 2019 | December 31, 2018 | September 30, 2018 | ||||||||||||||||
| Net (loss) income | $ | (741,529 | ) | $ | 292,284 | $ | 70,971 | $ | 27,842 | $ | (73,942 | ) | ||||||||
| Adjustments: | ||||||||||||||||||||
| Interest expense | 67,889 | 69,803 | 71,254 | 70,832 | 69,310 | |||||||||||||||
| Depreciation and amortization | 115,111 | 118,022 | 136,555 | 153,050 | 157,181 | |||||||||||||||
| Provision for income taxes | 1,168 | 1,164 | 1,211 | 1,614 | 1,141 | |||||||||||||||
| Proportionate share of adjustments for unconsolidated entities | 1,337 | 738 | 288 | 254 | 286 | |||||||||||||||
| EBITDA | $ | (556,024 | ) | $ | 482,011 | $ | 280,279 | $ | 253,592 | $ | 153,976 | |||||||||
| Gain on disposition of real estate assets, net | (18,520 | ) | (221,762 | ) | (10,831 | ) | (25,951 | ) | (45,226 | ) | ||||||||||
| Impairment of real estate | 3,944 | 8,308 | 11,988 | 18,565 | 18,382 | |||||||||||||||
| EBITDAre | $ | (570,600 | ) | $ | 268,557 | $ | 281,436 | $ | 246,206 | $ | 127,132 | |||||||||
| Loss on disposition of discontinued operations | — | — | — | 30 | — | |||||||||||||||
| Payments received on fully reserved loans | — | — | — | (4,792 | ) | — | ||||||||||||||
| Acquisition-related expenses | 1,199 | 985 | 985 | 1,136 | 810 | |||||||||||||||
| Litigation and non-routine costs, net | 832,024 | (3,769 | ) | (21,492 | ) | 23,541 | 138,595 | |||||||||||||
| (Gain) loss on investments | 28 | (5 | ) | 470 | (1,790 | ) | 3,336 | |||||||||||||
| Loss (gain) on derivative instruments, net | — | 24 | 34 | 92 | (69 | ) | ||||||||||||||
| Amortization of above-market lease assets and deferred lease incentives, net of amortization of below-market lease liabilities | 692 | 611 | 731 | 945 | 1,058 | |||||||||||||||
| (Gain) loss on extinguishment and forgiveness of debt, net | (975 | ) | 1,472 | — | (21 | ) | (90 | ) | ||||||||||||
| Net direct financing lease adjustments | 411 | 410 | 409 | 498 | 483 | |||||||||||||||
Straight-line rent, net of bad debt expense related to straight-line rent (1) | (5,470 | ) | (8,043 | ) | (7,412 | ) | (8,341 | ) | (8,720 | ) | ||||||||||
| Restructuring expenses | 783 | 290 | 9,076 | — | — | |||||||||||||||
| Other adjustments, net | 724 | 214 | (113 | ) | (78 | ) | (1,442 | ) | ||||||||||||
| Proportionate share of adjustments for unconsolidated entities | (134 | ) | (198 | ) | (188 | ) | 60 | (9 | ) | |||||||||||
| Adjustment for Excluded Properties | (57 | ) | (203 | ) | — | — | — | |||||||||||||
| Normalized EBITDA | $ | 258,625 | $ | 260,345 | $ | 263,936 | $ | 257,486 | $ | 261,084 | ||||||||||
| (1) | Upon adoption of ASC 842 in Q1 2019, the Company recognizes all changes in the collectability assessment for an operating lease as an adjustment to rental revenue and does not record bad debt expense for uncollectible accounts. |
See the Definitions section for a description of the Company's non-GAAP and operating metrics.
VEREIT, Inc. | WWW.VEREIT.COM | 14
| ||
| Q3 2019 SUPPLEMENTAL INFORMATION | ||
Net Operating Income (unaudited, dollars in thousands) |
NOI and Cash NOI
| Three Months Ended | ||||||||||||||||||||
| September 30, 2019 | June 30, 2019 | March 31, 2019 | December 31, 2018 | September 30, 2018 | ||||||||||||||||
Rental revenue - as reported (1) | $ | 302,985 | $ | 312,043 | $ | 316,843 | $ | 313,263 | $ | 313,866 | ||||||||||
| Property operating expense - as reported | (30,822 | ) | (32,503 | ) | (32,378 | ) | (32,567 | ) | (31,893 | ) | ||||||||||
| NOI | 272,163 | 279,540 | 284,465 | 280,696 | 281,973 | |||||||||||||||
| Adjustments: | ||||||||||||||||||||
Straight-line rent, net of bad debt expense related to straight-line rent (2) | (5,470 | ) | (8,043 | ) | (7,412 | ) | (8,341 | ) | (8,720 | ) | ||||||||||
| Amortization of above-market lease assets and deferred lease incentives, net of amortization of below-market lease liabilities | 692 | 611 | 731 | 945 | 1,058 | |||||||||||||||
| Net direct financing lease adjustments | 411 | 410 | 409 | 498 | 483 | |||||||||||||||
| Unconsolidated joint ventures' pro rata share | 1,817 | 1,176 | — | — | — | |||||||||||||||
| Adjustment for Excluded Properties | (54 | ) | (203 | ) | — | — | — | |||||||||||||
| Cash NOI | $ | 269,559 | $ | 273,491 | $ | 278,193 | $ | 273,798 | $ | 274,794 | ||||||||||
| (1) | Rental revenue includes percentage rent of $0.9 million, $1.2 million, $1.3 million, $1.4 million and $1.2 million for the three months ended September 30, 2019, June 30, 2019, March 31, 2019, December 31, 2018, and September 30, 2018, respectively. |
| (2) | Upon adoption of ASC 842 in Q1 2019, the Company recognizes all changes in the collectability assessment for an operating lease as an adjustment to rental revenue and does not record bad debt expense for uncollectible accounts. |
Normalized Cash NOI
| Three Months Ended | ||||
| September 30, 2019 | ||||
| Cash NOI | $ | 269,559 | ||
Adjustments for intra-quarter acquisitions and dispositions (1) | (1,037 | ) | ||
| Normalized Cash NOI | $ | 268,522 | ||
___________________________________
| (1) | The adjustment eliminates Cash NOI for properties acquired during the three months ended September 30, 2019 and replaces Cash NOI for the partial period with an amount estimated to be equivalent to Cash NOI for the full period. The adjustment eliminates Cash NOI for properties disposed of during the three months ended September 30, 2019. |
See the Definitions section for a description of the Company's non-GAAP and operating metrics.
VEREIT, Inc. | WWW.VEREIT.COM | 15
| ||
| Q3 2019 SUPPLEMENTAL INFORMATION | ||
Same Store Contract Rental Revenue (unaudited, dollars in thousands) |
The Company reviews the stabilized operating results from properties that we refer to as "same store." In determining the same store property pool, we include Operating Properties and properties owned by unconsolidated joint ventures that were owned for the entirety of both the current and prior reporting periods, except for development or redevelopment properties. The following tables show the Company's same store portfolio statistics, which for the three months ended September 30, 2019 included 3,849(1) Operating Properties, with 85.4 million aggregate square feet, acquired prior to July 1, 2018 and owned through September 30, 2019 and the pro rata share of Contract Rental Revenue from properties owned by unconsolidated joint ventures.
| Three Months Ended September 30, | Increase/(Decrease) | ||||||||||||||
| 2019 | 2018 | $ Change | % Change | ||||||||||||
| Contract Rental Revenue | $ | 261,564 | $ | 259,027 | $ | 2,537 | 1.0 | % | |||||||
| Economic Occupancy Rate | 99.0 | % | 99.3 | % | (0.3 | )% | N/A | ||||||||
| Contract Rental Revenue | |||||||||||||||||||
| Number of | Three Months Ended September 30, | Increase/(Decrease) | |||||||||||||||||
| Properties | 2019 | 2018 | $ Change | % Change | |||||||||||||||
| Retail | 2,047 | $ | 112,116 | $ | 112,539 | $ | (423 | ) | (0.4 | )% | |||||||||
| Restaurant | 1,573 | 55,459 | 55,171 | 288 | 0.5 | % | |||||||||||||
| Industrial | 142 | 42,277 | 41,850 | 427 | 1.0 | % | |||||||||||||
| Office | 79 | 51,678 | 49,421 | 2,257 | 4.6 | % | |||||||||||||
Other (2) | 8 | 34 | 46 | (12 | ) | (26.1 | )% | ||||||||||||
| Total | 3,849 | $ | 261,564 | $ | 259,027 | $ | 2,537 | 1.0 | % | ||||||||||
| (1) | Development and expansion properties are included in the same store population if the placed in service date was prior to July 1, 2018. |
| (2) | Other properties include billboards, land and parking lots. |
See the Definitions section for a description of the Company's non-GAAP and operating metrics.
VEREIT, Inc. | WWW.VEREIT.COM | 16
| ||
| Q3 2019 SUPPLEMENTAL INFORMATION | ||
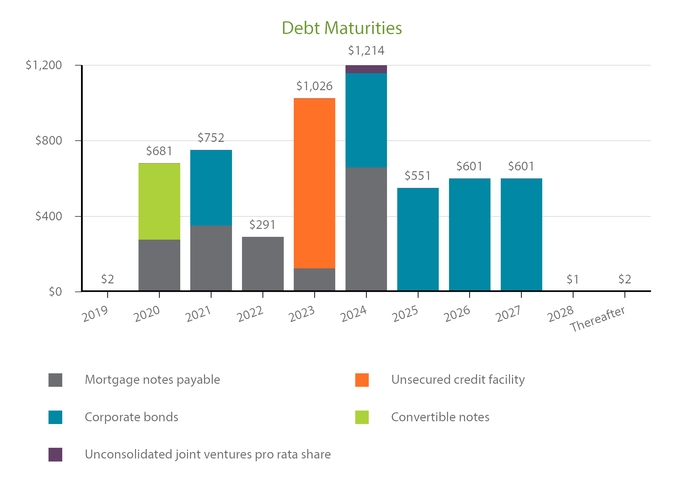
Adjusted Principal Outstanding and Preferred Equity Summary (unaudited, dollars in thousands) |
| Principal Payments Due | Total | 2019 | 2020 | 2021 | 2022 | 2023 | 2024 | 2025 | Thereafter | |||||||||||||||||||||||||||
| Mortgage notes payable | $ | 1,716,199 | $ | 2,458 | $ | 278,391 | $ | 352,259 | $ | 290,728 | $ | 125,537 | $ | 659,858 | $ | 1,078 | $ | 5,890 | ||||||||||||||||||
Credit facility | 900,000 | — | — | — | — | 900,000 | — | — | — | |||||||||||||||||||||||||||
| Corporate bonds | 2,650,000 | — | — | 400,000 | — | — | 500,000 | 550,000 | 1,200,000 | |||||||||||||||||||||||||||
| Convertible notes | 402,500 | — | 402,500 | — | — | — | — | — | — | |||||||||||||||||||||||||||
| Unconsolidated joint ventures' pro rata share | 53,850 | — | — | — | — | — | 53,850 | — | — | |||||||||||||||||||||||||||
| Total Adjusted Principal Outstanding | $ | 5,722,549 | $ | 2,458 | $ | 680,891 | $ | 752,259 | $ | 290,728 | $ | 1,025,537 | $ | 1,213,708 | $ | 551,078 | $ | 1,205,890 | ||||||||||||||||||
| Debt Type | Percentage of Adjusted Principal Outstanding | Weighted-Average Interest Rate | Weighted-Average Years to Maturity | ||||||
| Mortgage notes payable | 30.1 | % | 5.05 | % | 2.9 | ||||
| Unsecured credit facility | 15.7 | % | 3.84 | % | 3.6 | ||||
| Corporate bonds | 46.3 | % | 4.45 | % | 5.6 | ||||
| Convertible notes | 7.0 | % | 3.75 | % | 1.2 | ||||
| Unconsolidated joint ventures' pro rata share | 0.9 | % | 3.57 | % | 4.7 | ||||
| Total | 100.0 | % | 4.48 | % | 4.2 | ||||
| Debt Type | Percentage of Adjusted Principal Outstanding | Weighted-Average Interest Rate | Weighted-Average Years to Maturity | ||||||
| Total unsecured debt | 69.1 | % | 4.24 | % | 4.7 | ||||
| Total secured debt | 30.9 | % | 5.01 | % | 3.0 | ||||
| Total | 100.0 | % | 4.48 | % | 4.2 | ||||
Total fixed-rate debt (1) | 99.8 | % | 4.47 | % | 4.2 | ||||
| Total variable-rate debt | 0.2 | % | 5.29 | % | 0.9 | ||||
| Total | 100.0 | % | 4.48 | % | 4.2 | ||||
| Preferred Equity | Balance (2) | Percent of Total Preferred Equity | Dividend Rate | |||||||
| Series F preferred stock | $ | 973,025 | 100.0 | % | 6.7 | % | ||||
| (1) | Includes $900.0 million of variable rate debt effectively fixed through the use of interest rate swap agreements. Debt payment obligations in future periods are based on the effective interest rates fixed under the agreements. |
| (2) | Balance represents 38.9 million shares of Series F Preferred Stock (and 38.9 million corresponding general partner Series F Preferred Units) and 49,766 limited partner Series F Preferred Units outstanding at September 30, 2019, multiplied by the liquidation preference of $25 per share. |
See the Definitions section for a description of the Company's non-GAAP and operating metrics.
VEREIT, Inc. | WWW.VEREIT.COM | 17
| ||
| Q3 2019 SUPPLEMENTAL INFORMATION | ||
Adjusted Principal Outstanding and Preferred Equity Summary (cont.) (unaudited, dollars in millions) |
See the Definitions section for a description of the Company's non-GAAP and operating metrics.
VEREIT, Inc. | WWW.VEREIT.COM | 18
| ||
| Q3 2019 SUPPLEMENTAL INFORMATION | ||
Credit Facility and Corporate Bond Covenants (unaudited) |
The following is a summary of key financial covenants for the Company's unsecured credit facility and corporate bonds, as defined and calculated per the terms of the facility's credit agreement and the bonds' governing documents, respectively. These calculations, which are not based on GAAP measurements, are presented to investors to show that the Company is in compliance with the financial covenants and are not measures of our liquidity or performance. As of September 30, 2019, the Company believes it is in compliance with these covenants based on the covenant limits and calculations in place at that time.
Unsecured Credit Facility Key Covenants (1) | Required | September 30, 2019 | ||
| Ratio of total indebtedness to total asset value | ≤ 60% | 30.7% | ||
| Ratio of adjusted EBITDA to fixed charges | ≥ 1.5x | 2.94x | ||
| Ratio of secured indebtedness to total asset value | ≤ 45% | 7.7% | ||
| Ratio of unsecured indebtedness to unencumbered asset value | ≤ 60% | 27.7% | ||
| Ratio of unencumbered adjusted NOI to unsecured interest expense | ≥ 1.75x | 4.47x | ||
Corporate Bond Key Covenants (1) | Required | September 30, 2019 | ||
| Limitation on incurrence of total debt | ≤ 65% | 34.9% | ||
| Limitation on incurrence of secured debt | ≤ 40% | 10.6% | ||
| Debt service coverage | ≥ 1.5x | 3.89x | ||
| Maintenance of total unencumbered assets | ≥ 150% | 319.5% | ||
___________________________________
(1) The covenants are calculated in compliance with the terms of the respective agreements, as such no adjustment was made for the amounts payable in cash pursuant to the Class Action Settlement.
See the Definitions section for a description of the Company's non-GAAP and operating metrics.
VEREIT, Inc. | WWW.VEREIT.COM | 19
| ||
| Q3 2019 SUPPLEMENTAL INFORMATION | ||
Acquisitions and Dispositions (unaudited, square feet and dollars in thousands) |
Acquisitions
The following table summarizes the Company's property acquisition activity during the three months ended September 30, 2019.
| Property Type | Number of Properties | Square Feet | Weighted Average Lease Term (Years) (1) | Weighted Average Cash Cap Rate | Purchase Price (2) | ||||||||||
| Retail | 6 | 144 | 12.8 | 7.2 | % | $ | 38,465 | ||||||||
| Industrial | 1 | 282 | 12.1 | 6.6 | % | 21,380 | |||||||||
Total acquisitions (3) | 7 | 426 | 12.6 | 7.0 | % | $ | 59,845 | ||||||||
Dispositions
The following table summarizes the Company's disposition activity and the related gains/losses during the three months ended September 30, 2019.
| Real Estate | Number of Properties | Square Feet | Weighted Average Lease Term (Years) (4) | Weighted Average Cash Cap Rate (5) | Sale Price | Gain (Loss) | |||||||||||||
| Retail | 7 | 213 | 8.2 | 7.2 | % | $ | 44,575 | $ | 6,376 | ||||||||||
Red Lobster - GGC Participation (6) | 10 | 78 | 19.5 | 7.4 | % | 43,944 | 7,024 | ||||||||||||
| Industrial | 2 | 67 | 7.4 | 6.8 | % | 11,016 | 3,662 | ||||||||||||
| Other restaurants | 2 | 11 | 9.4 | 7.6 | % | 7,092 | 1,201 | ||||||||||||
Vacant and other (7) | 11 | 195 | N/A | N/A | 2,838 | 257 | |||||||||||||
| Total real estate dispositions | 32 | 564 | 12.9 | 7.3 | % | $ | 109,465 | $ | 18,520 | ||||||||||
| Held for sale assets | — | ||||||||||||||||||
| Total gain on disposition of real estate, net | $ | 18,520 | |||||||||||||||||
| Other | |||||||||||||||||||
Mortgage-related investments (8) | N/A | N/A | N/A | N/A | $ | 1,679 | $ | (28 | ) | ||||||||||
| Total dispositions | $ | 111,144 | |||||||||||||||||
| (1) | Represents the remaining lease term from the date of acquisition. |
| (2) | Excludes acquisition-related expenses capitalized. |
| (3) | During the three months ended September 30, 2019, the Company invested $11.0 million in one build-to-suit project. As of September 30, 2019, build-to-suit programs included one property with an investment to date of $27.3 million, including acquisition-related expenses that were capitalized. There is no estimated investment by the Company remaining, and the property is expected to be placed in service during the three months ended December 31, 2019. |
| (4) | Represents the remaining lease term from the date of sale. |
| (5) | Excludes certain properties' cash cap rates considered not meaningful due to factors such as physical and economic vacancy or short remaining lease terms. Of the $109.5 million of dispositions, $105.9 million was used in the total weighted average cash cap rate calculation of 7.3%. |
| (6) | The Red Lobster properties were sold under an agreement with the tenant, under which the tenant received a portion of the sales proceeds. The sales price and cash cap rate presented are based on our proceeds after making the participation payment to the tenant. The cash cap rate on the gross sales price of $51.3 million was 6.4%. |
| (7) | Represents the foreclosure sale of one former Excluded Property to settle the related mortgage note obligation for no proceeds to the Company, eight vacant restaurants, and two vacant retail properties. Gain (loss) amounts also include partial condemnations or easements related to certain properties and post-closing adjustments. |
| (8) | Represents one mortgage note receivable investment sold during the three months ended September 30, 2019. |
See the Definitions section for a description of the Company's non-GAAP and operating metrics.
VEREIT, Inc. | WWW.VEREIT.COM | 20
| ||
| Q3 2019 SUPPLEMENTAL INFORMATION | ||
Diversification Statistics: Real Estate Portfolio (unaudited, percentages based on portfolio Annualized Rental Income) |
___________________________________________________
___________________________________________________
___________________________________________________
___________________________________________________
Statistics (square feet in thousands) | ||||
| Operating Properties | 3,926 | |||
| Rentable Square Feet | 90,704 | |||
| Economic Occupancy Rate | 99.0 | % | ||
| Weighted Average Remaining Lease Term | 8.4 | |||
| Investment-Grade Tenants | 39.5 | % | ||
| Flat leases | 19.8 | % | ||
| NNN leases | 62.7 | % | ||
See the Definitions section for a description of the Company's non-GAAP and operating metrics.
VEREIT, Inc. | WWW.VEREIT.COM | 21
| ||
| Q3 2019 SUPPLEMENTAL INFORMATION | ||
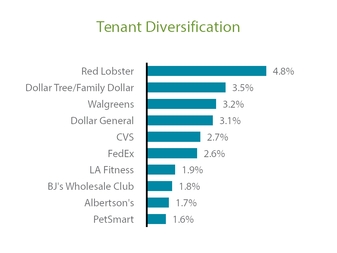
Top 10 Concentrations: Real Estate Portfolio (unaudited, square feet and dollars in thousands) |
| Tenant Concentration | Number of Leases | Leased Square Feet | Square Feet as a % of Total Portfolio | Annualized Rental Income | Annualized Rental Income as a % of Total Portfolio | Investment Rating | ||||||||||||
| Red Lobster | 25 | 1,558 | 1.7 | % | $ | 53,289 | 4.8 | % | B- | |||||||||
| Dollar Tree/Family Dollar | 132 | 3,470 | 3.8 | % | 39,155 | 3.5 | % | BBB- | ||||||||||
| Walgreens | 102 | 1,445 | 1.6 | % | 35,310 | 3.2 | % | BBB | ||||||||||
| Dollar General | 410 | 3,794 | 4.2 | % | 34,977 | 3.1 | % | BBB | ||||||||||
| CVS | 93 | 1,328 | 1.5 | % | 29,936 | 2.7 | % | BBB | ||||||||||
| FedEx | 42 | 3,028 | 3.3 | % | 28,446 | 2.6 | % | BBB | ||||||||||
| LA Fitness | 25 | 1,087 | 1.2 | % | 20,923 | 1.9 | % | B+ | ||||||||||
| BJ's Wholesale Club | 3 | 2,223 | 2.5 | % | 20,228 | 1.8 | % | B+ | ||||||||||
| Albertson's | 26 | 1,536 | 1.7 | % | 18,628 | 1.7 | % | B+ | ||||||||||
| PetSmart | 13 | 886 | 1.0 | % | 18,106 | 1.6 | % | B- | ||||||||||
| Total | 871 | 20,355 | 22.5 | % | $ | 298,998 | 26.9 | % | ||||||||||
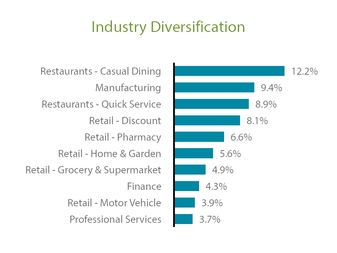
| Tenant Industry Concentration | Number of Leases | Leased Square Feet | Square Feet as a % of Total Portfolio | Annualized Rental Income | Annualized Rental Income as a % of Total Portfolio | |||||||||||
| Restaurants - Casual Dining | 312 | 3,908 | 4.3 | % | $ | 135,421 | 12.2 | % | ||||||||
| Manufacturing | 53 | 16,537 | 18.2 | % | 104,561 | 9.4 | % | |||||||||
| Restaurants - Quick Service | 812 | 3,251 | 3.6 | % | 98,858 | 8.9 | % | |||||||||
| Retail - Discount | 571 | 9,458 | 10.4 | % | 90,084 | 8.1 | % | |||||||||
| Retail - Pharmacy | 214 | 3,217 | 3.5 | % | 73,139 | 6.6 | % | |||||||||
| Retail - Home & Garden | 112 | 8,360 | 9.2 | % | 61,724 | 5.6 | % | |||||||||
| Retail - Grocery & Supermarket | 78 | 4,918 | 5.4 | % | 54,137 | 4.9 | % | |||||||||
| Finance | 215 | 2,205 | 2.4 | % | 48,088 | 4.3 | % | |||||||||
| Retail - Motor Vehicle | 181 | 6,034 | 6.7 | % | 43,846 | 3.9 | % | |||||||||
| Professional Services | 48 | 3,223 | 3.6 | % | 41,056 | 3.7 | % | |||||||||
| Total | 2,596 | 61,111 | 67.3 | % | $ | 750,914 | 67.6 | % | ||||||||
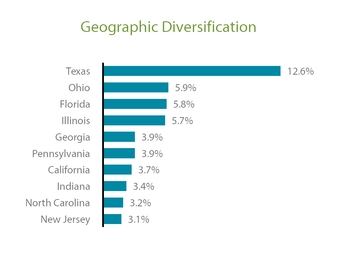
| Geographic Concentration | Number of Properties | Rentable Square Feet | Square Feet as a % of Total Portfolio | Annualized Rental Income | Annualized Rental Income as a % of Total Portfolio | |||||||||||
| Texas | 543 | 10,539 | 11.6 | % | $ | 140,114 | 12.6 | % | ||||||||
| Ohio | 284 | 8,435 | 9.3 | % | 65,543 | 5.9 | % | |||||||||
| Florida | 250 | 4,265 | 4.7 | % | 63,943 | 5.8 | % | |||||||||
| Illinois | 155 | 4,754 | 5.2 | % | 63,663 | 5.7 | % | |||||||||
| Georgia | 175 | 4,017 | 4.4 | % | 43,799 | 3.9 | % | |||||||||
| Pennsylvania | 136 | 3,908 | 4.3 | % | 42,924 | 3.9 | % | |||||||||
| California | 64 | 3,400 | 3.7 | % | 40,679 | 3.7 | % | |||||||||
| Indiana | 131 | 4,058 | 4.5 | % | 37,750 | 3.4 | % | |||||||||
| North Carolina | 150 | 3,270 | 3.6 | % | 35,546 | 3.2 | % | |||||||||
| New Jersey | 31 | 1,614 | 1.8 | % | 34,729 | 3.1 | % | |||||||||
| Total | 1,919 | 48,260 | 53.1 | % | $ | 568,690 | 51.2 | % | ||||||||
See the Definitions section for a description of the Company's non-GAAP and operating metrics.
VEREIT, Inc. | WWW.VEREIT.COM | 22
| ||
| Q3 2019 SUPPLEMENTAL INFORMATION | ||
Top 10 Concentrations: Real Estate Portfolio (unaudited, square feet and dollars in thousands) |
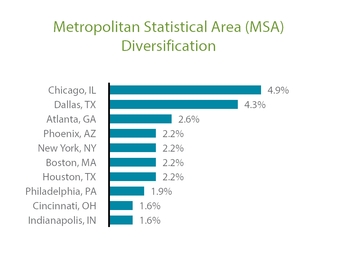
| Metropolitan Statistical Area (MSA) Concentration | Number of Properties | Rentable Square Feet | Square Feet as a % of Total Portfolio | Annualized Rental Income | Annualized Rental Income as a % of Total Portfolio | |||||||||||
| Chicago, IL | 99 | 4,066 | 4.5 | % | $ | 53,979 | 4.9 | % | ||||||||
| Dallas, TX | 110 | 3,456 | 3.8 | % | 47,609 | 4.3 | % | |||||||||
| Atlanta, GA | 80 | 2,971 | 3.3 | % | 28,730 | 2.6 | % | |||||||||
| Phoenix, AZ | 49 | 1,341 | 1.5 | % | 24,798 | 2.2 | % | |||||||||
| New York, NY | 24 | 1,100 | 1.2 | % | 24,353 | 2.2 | % | |||||||||
| Boston, MA | 26 | 1,810 | 2.0 | % | 23,985 | 2.2 | % | |||||||||
| Houston, TX | 88 | 2,428 | 2.7 | % | 23,978 | 2.2 | % | |||||||||
| Philadelphia, PA | 42 | 1,159 | 1.3 | % | 21,046 | 1.9 | % | |||||||||
| Cincinnati, OH | 40 | 2,264 | 2.5 | % | 17,741 | 1.6 | % | |||||||||
| Indianapolis, IN | 41 | 1,721 | 1.9 | % | 17,510 | 1.6 | % | |||||||||
| Total | 599 | 22,316 | 24.7 | % | $ | 283,729 | 25.7 | % | ||||||||
See the Definitions section for a description of the Company's non-GAAP and operating metrics.
VEREIT, Inc. | WWW.VEREIT.COM | 23
| ||
| Q3 2019 SUPPLEMENTAL INFORMATION | ||
Tenants Comprising Over 1% of Annualized Rental Income (unaudited, square feet and dollars in thousands) |
| Tenant | Number of Leases | Leased Square Feet | Square Feet as a % of Total Portfolio | Annualized Rental Income | Annualized Rental Income as a % of Total Portfolio | Investment Rating | ||||||||||||
| Red Lobster | 25 | 1,558 | 1.7 | % | $ | 53,289 | 4.8 | % | B- | |||||||||
| Dollar Tree/Family Dollar | 132 | 3,470 | 3.8 | % | 39,155 | 3.5 | % | BBB- | ||||||||||
| Walgreens | 102 | 1,445 | 1.6 | % | 35,310 | 3.2 | % | BBB | ||||||||||
| Dollar General | 410 | 3,794 | 4.2 | % | 34,977 | 3.1 | % | BBB | ||||||||||
| CVS | 93 | 1,328 | 1.5 | % | 29,936 | 2.7 | % | BBB | ||||||||||
| FedEx | 42 | 3,028 | 3.3 | % | 28,446 | 2.6 | % | BBB | ||||||||||
| LA Fitness | 25 | 1,087 | 1.2 | % | 20,923 | 1.9 | % | B+ | ||||||||||
| BJ's Wholesale Club | 3 | 2,223 | 2.5 | % | 20,228 | 1.8 | % | B+ | ||||||||||
| Albertson's | 26 | 1,536 | 1.7 | % | 18,628 | 1.7 | % | B+ | ||||||||||
| PetSmart | 13 | 886 | 1.0 | % | 18,106 | 1.6 | % | B- | ||||||||||
| Goodyear | 7 | 4,728 | 5.2 | % | 17,417 | 1.6 | % | BB | ||||||||||
| Tractor Supply | 61 | 1,274 | 1.4 | % | 16,548 | 1.5 | % | NR | ||||||||||
| General Service Administration | 14 | 705 | 0.8 | % | 15,645 | 1.4 | % | AA+ | ||||||||||
| Citizens Bank | 122 | 649 | 0.7 | % | 14,365 | 1.3 | % | A- | ||||||||||
| At Home | 5 | 1,406 | 1.6 | % | 12,112 | 1.1 | % | B+ | ||||||||||
| Advance Auto Parts | 104 | 716 | 0.8 | % | 11,863 | 1.1 | % | BBB- | ||||||||||
| Lowe's | 14 | 1,751 | 1.9 | % | 11,442 | 1.0 | % | BBB+ | ||||||||||
| Total | 1,198 | 31,584 | 34.9 | % | $ | 398,390 | 35.9 | % | ||||||||||
See the Definitions section for a description of the Company's non-GAAP and operating metrics.
VEREIT, Inc. | WWW.VEREIT.COM | 24
| ||
| Q3 2019 SUPPLEMENTAL INFORMATION | ||
Diversification: Tenant Industry (unaudited, square feet and dollars in thousands) |
| Industry | Number of Leases | Leased Square Feet | Leased Square Feet as a % of Total Portfolio | Annualized Rental Income | Annualized Rental Income as a % of Total Portfolio | |||||||||||
| Administration & Support Services | 3 | 425 | 0.5 | % | $ | 3,960 | 0.4 | % | ||||||||
| Agricultural | 2 | 137 | 0.1 | % | 1,245 | 0.1 | % | |||||||||
| Education | 5 | 219 | 0.2 | % | 2,155 | 0.2 | % | |||||||||
| Entertainment & Recreation | 34 | 1,450 | 1.6 | % | 30,050 | 2.7 | % | |||||||||
| Finance | 215 | 2,205 | 2.4 | % | 48,088 | 4.3 | % | |||||||||
| Government & Public Services | 20 | 923 | 1.0 | % | 18,557 | 1.7 | % | |||||||||
| Healthcare | 11 | 1,063 | 1.2 | % | 16,518 | 1.5 | % | |||||||||
| Information & Communication | 6 | 505 | 0.6 | % | 7,133 | 0.6 | % | |||||||||
| Insurance | 12 | 1,308 | 1.4 | % | 25,755 | 2.3 | % | |||||||||
| Logistics | 45 | 3,701 | 4.1 | % | 33,551 | 3.0 | % | |||||||||
| Manufacturing | 53 | 16,537 | 18.2 | % | 104,561 | 9.4 | % | |||||||||
| Mining & Natural Resources | 4 | 412 | 0.5 | % | 6,605 | 0.6 | % | |||||||||
| Other Services | 11 | 475 | 0.5 | % | 3,220 | 0.3 | % | |||||||||
| Professional Services | 48 | 3,223 | 3.6 | % | 41,056 | 3.7 | % | |||||||||
| Rental | 10 | 708 | 0.8 | % | 6,835 | 0.6 | % | |||||||||
| Restaurants - Casual Dining | 312 | 3,908 | 4.3 | % | 135,421 | 12.2 | % | |||||||||
| Restaurants - Quick Service | 812 | 3,251 | 3.6 | % | 98,858 | 8.9 | % | |||||||||
| Retail - Apparel & Jewelry | 11 | 1,338 | 1.5 | % | 15,549 | 1.4 | % | |||||||||
| Retail - Department Stores | 12 | 1,020 | 1.1 | % | 8,224 | 0.7 | % | |||||||||
| Retail - Discount | 571 | 9,458 | 10.4 | % | 90,084 | 8.1 | % | |||||||||
| Retail - Electronics & Appliances | 17 | 1,541 | 1.7 | % | 10,440 | 0.9 | % | |||||||||
| Retail - Gas & Convenience | 126 | 638 | 0.7 | % | 31,141 | 2.8 | % | |||||||||
| Retail - Grocery & Supermarket | 78 | 4,918 | 5.4 | % | 54,137 | 4.9 | % | |||||||||
| Retail - Hobby, Books & Music | 16 | 2,103 | 2.3 | % | 13,297 | 1.2 | % | |||||||||
| Retail - Home & Garden | 112 | 8,360 | 9.2 | % | 61,724 | 5.6 | % | |||||||||
| Retail - Home Furnishings | 44 | 2,633 | 2.9 | % | 30,435 | 2.7 | % | |||||||||
| Retail - Internet | 1 | 1,423 | 1.6 | % | 6,797 | 0.6 | % | |||||||||
| Retail - Medical Services | 63 | 531 | 0.6 | % | 11,933 | 1.1 | % | |||||||||
| Retail - Motor Vehicle | 181 | 6,034 | 6.7 | % | 43,846 | 3.9 | % | |||||||||
| Retail - Office Supply | 3 | 69 | 0.1 | % | 963 | 0.1 | % | |||||||||
| Retail - Pet Supply | 17 | 944 | 1.0 | % | 19,162 | 1.7 | % | |||||||||
| Retail - Pharmacy | 214 | 3,217 | 3.5 | % | 73,139 | 6.6 | % | |||||||||
| Retail - Specialty (Other) | 21 | 595 | 0.7 | % | 5,828 | 0.5 | % | |||||||||
| Retail - Sporting Goods | 20 | 1,715 | 1.9 | % | 22,698 | 2.1 | % | |||||||||
| Retail - Warehouse Clubs | 6 | 2,596 | 2.9 | % | 23,206 | 2.1 | % | |||||||||
| Other | 21 | 241 | 0.2 | % | 5,455 | 0.5 | % | |||||||||
| Total | 3,137 | 89,824 | 99.0 | % | $ | 1,111,626 | 100.0 | % | ||||||||
See the Definitions section for a description of the Company's non-GAAP and operating metrics.
VEREIT, Inc. | WWW.VEREIT.COM | 25
| ||
| Q3 2019 SUPPLEMENTAL INFORMATION | ||
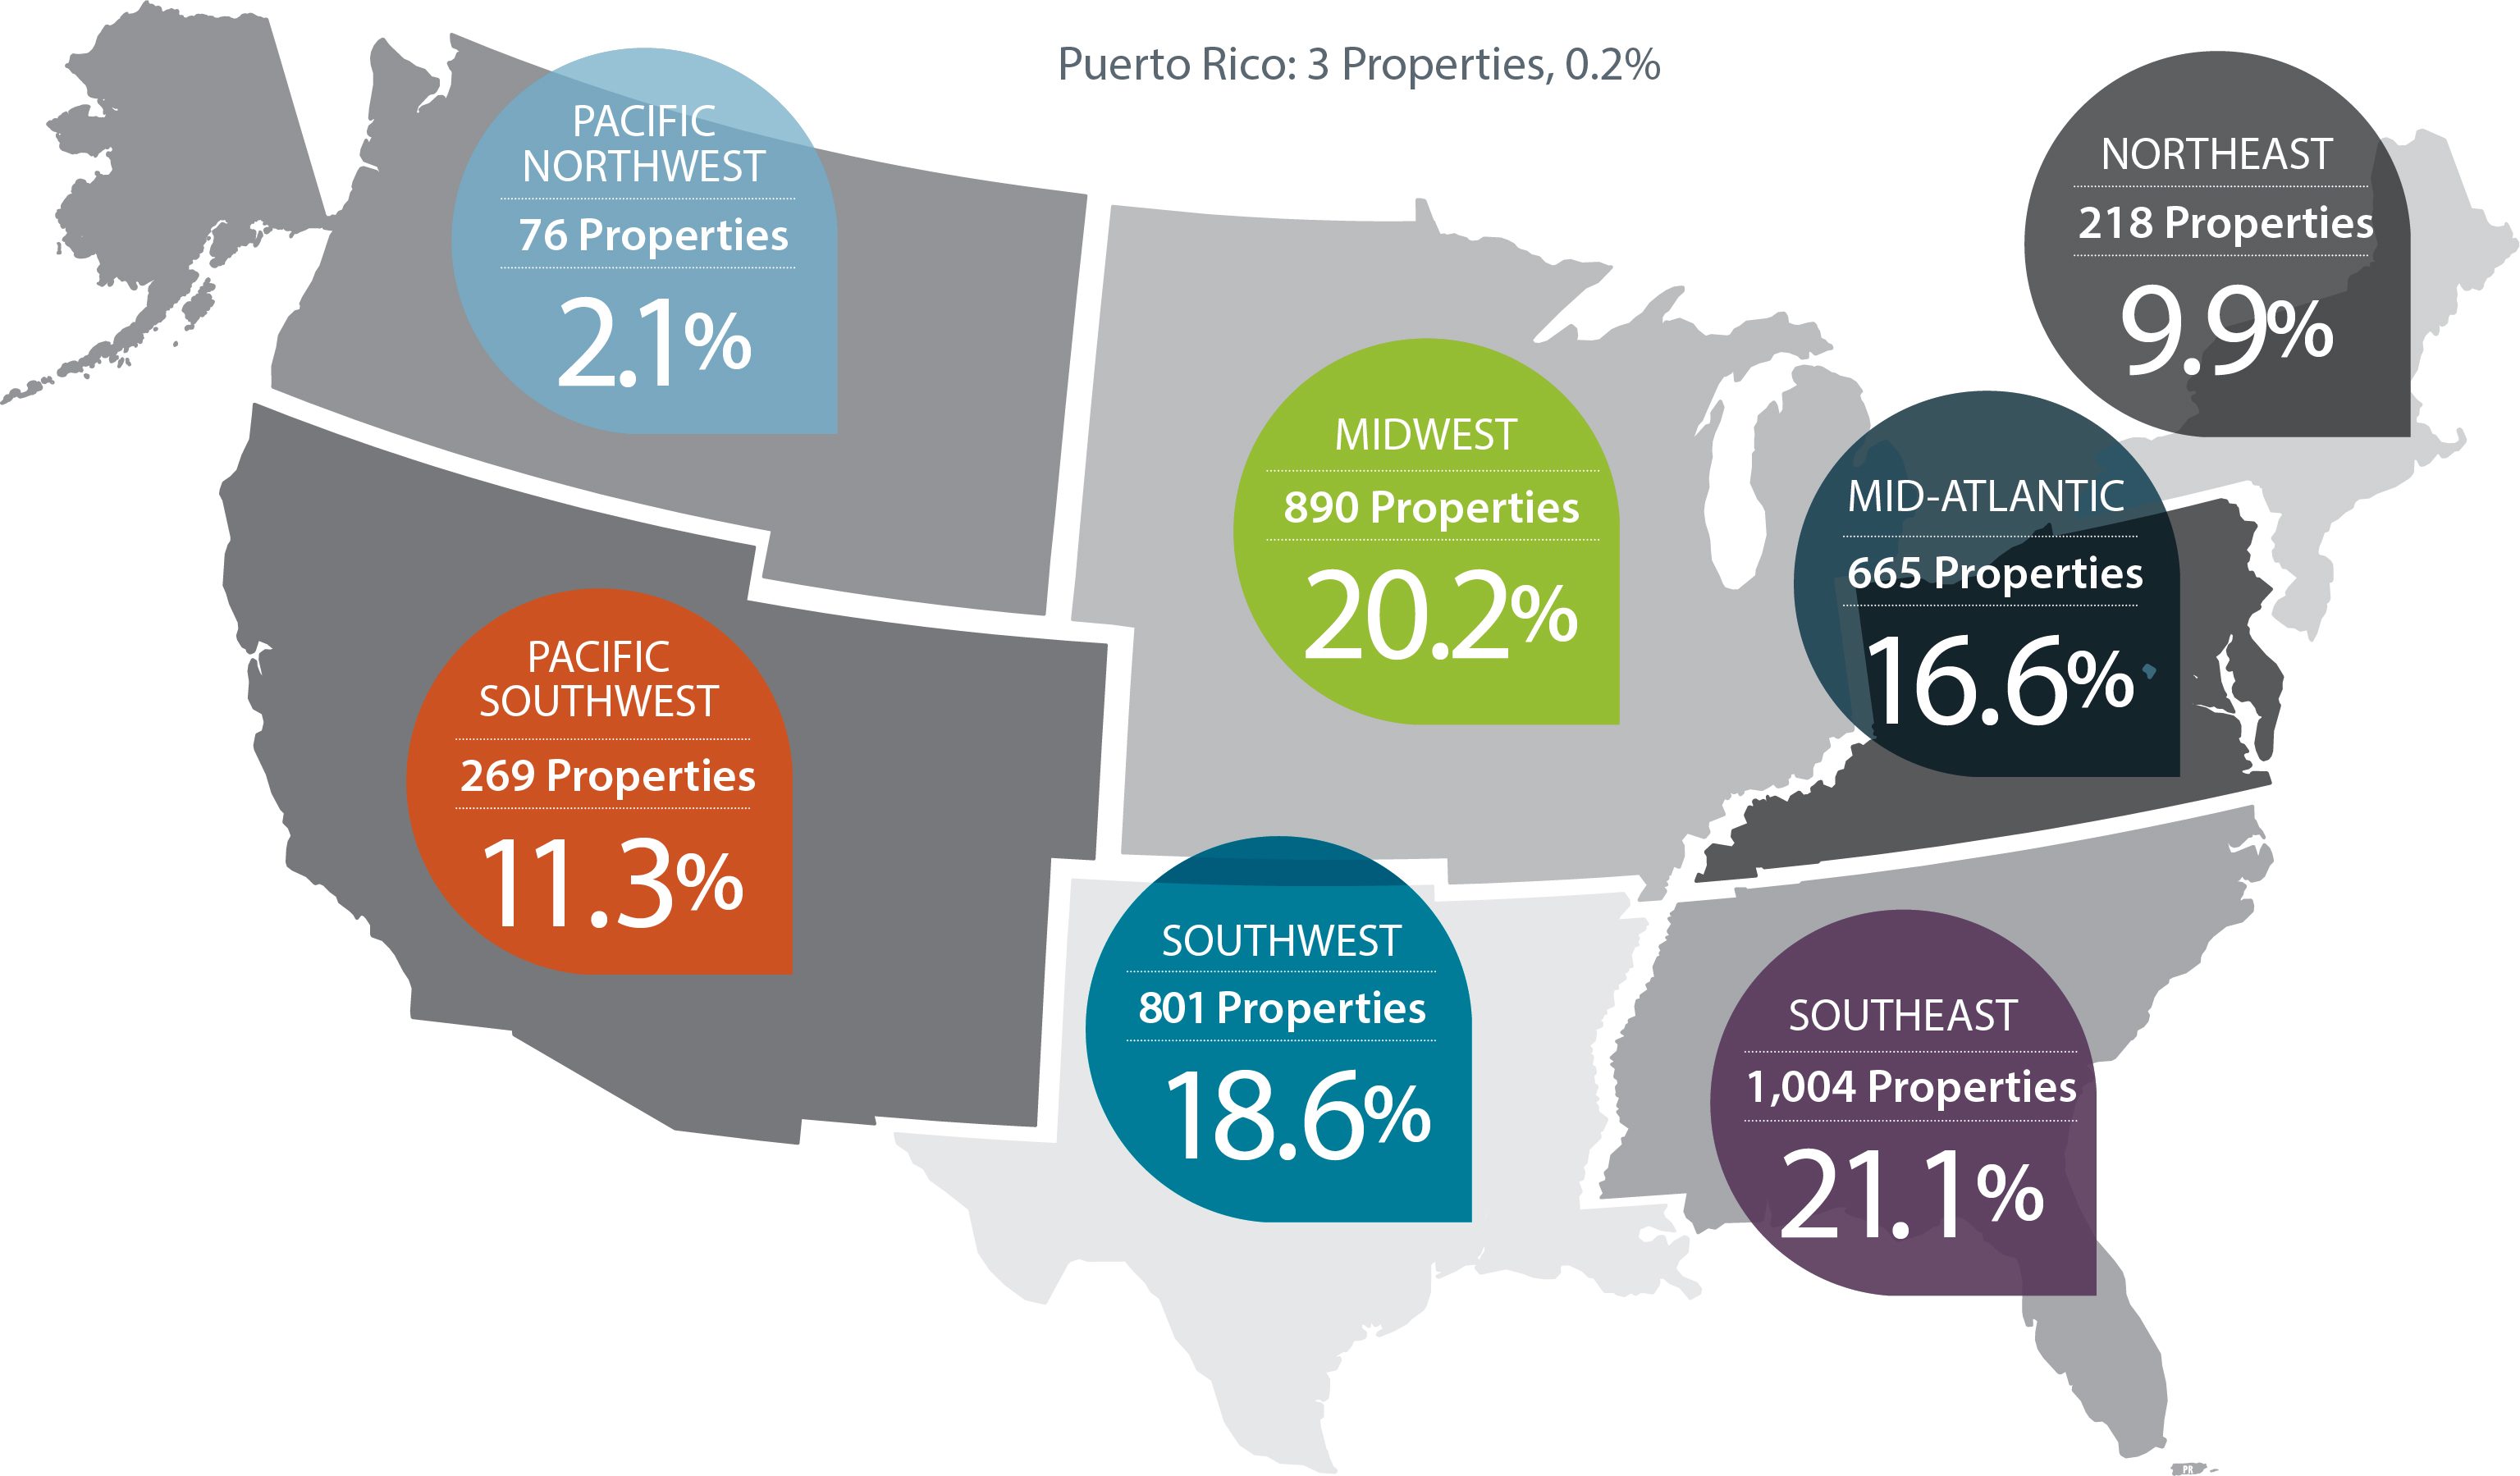
Diversification: Property Geographic (unaudited, square feet and dollars in thousands) |
| Location | Number of Properties | Rentable Square Feet | Square Feet as a % of Total Portfolio | Annualized Rental Income | Annualized Rental Income as a % of Total Portfolio | |||||||||||
| United States | ||||||||||||||||
| Alabama | 146 | 1,690 | 1.9 | % | $ | 25,893 | 2.3 | % | ||||||||
| Alaska | 3 | 25 | — | % | 792 | 0.1 | % | |||||||||
| Arizona | 78 | 1,955 | 2.2 | % | 34,383 | 3.1 | % | |||||||||
| Arkansas | 91 | 1,168 | 1.3 | % | 13,922 | 1.3 | % | |||||||||
| California | 64 | 3,400 | 3.7 | % | 40,679 | 3.7 | % | |||||||||
| Colorado | 45 | 1,680 | 1.8 | % | 25,633 | 2.3 | % | |||||||||
| Connecticut | 16 | 83 | 0.1 | % | 2,278 | 0.2 | % | |||||||||
| Delaware | 9 | 83 | 0.1 | % | 1,595 | 0.1 | % | |||||||||
| Florida | 250 | 4,265 | 4.7 | % | 63,943 | 5.8 | % | |||||||||
| Georgia | 175 | 4,017 | 4.4 | % | 43,799 | 3.9 | % | |||||||||
| Idaho | 16 | 130 | 0.1 | % | 3,053 | 0.3 | % | |||||||||
| Illinois | 155 | 4,754 | 5.2 | % | 63,663 | 5.7 | % | |||||||||
| Indiana | 131 | 4,058 | 4.5 | % | 37,750 | 3.4 | % | |||||||||
| Iowa | 46 | 874 | 1.0 | % | 9,658 | 0.9 | % | |||||||||
| Kansas | 41 | 2,207 | 2.4 | % | 10,529 | 0.9 | % | |||||||||
| Kentucky | 78 | 2,200 | 2.4 | % | 23,119 | 2.1 | % | |||||||||
| Louisiana | 90 | 2,798 | 3.1 | % | 27,770 | 2.5 | % | |||||||||
| Maine | 26 | 703 | 0.8 | % | 9,102 | 0.8 | % | |||||||||
| Maryland | 27 | 596 | 0.7 | % | 14,238 | 1.3 | % | |||||||||
| Massachusetts | 36 | 2,567 | 2.8 | % | 29,231 | 2.6 | % | |||||||||
| Michigan | 172 | 2,004 | 2.2 | % | 34,720 | 3.1 | % | |||||||||
| Minnesota | 52 | 793 | 0.9 | % | 12,702 | 1.1 | % | |||||||||
| Mississippi | 72 | 1,918 | 2.1 | % | 14,633 | 1.3 | % | |||||||||
| Missouri | 150 | 1,689 | 1.9 | % | 22,753 | 2.0 | % | |||||||||
| Montana | 9 | 115 | 0.1 | % | 1,948 | 0.2 | % | |||||||||
| Nebraska | 19 | 335 | 0.4 | % | 5,868 | 0.5 | % | |||||||||
| Nevada | 28 | 717 | 0.8 | % | 8,491 | 0.8 | % | |||||||||
| New Hampshire | 19 | 253 | 0.3 | % | 4,473 | 0.4 | % | |||||||||
| New Jersey | 31 | 1,614 | 1.8 | % | 34,729 | 3.1 | % | |||||||||
| New Mexico | 43 | 771 | 0.8 | % | 10,591 | 1.0 | % | |||||||||
| New York | 72 | 1,502 | 1.7 | % | 26,251 | 2.4 | % | |||||||||
| North Carolina | 150 | 3,270 | 3.6 | % | 35,546 | 3.2 | % | |||||||||
| North Dakota | 12 | 209 | 0.2 | % | 4,348 | 0.4 | % | |||||||||
| Ohio | 284 | 8,435 | 9.3 | % | 65,543 | 5.9 | % | |||||||||
| Oklahoma | 77 | 2,077 | 2.3 | % | 25,555 | 2.3 | % | |||||||||
| Oregon | 13 | 88 | 0.1 | % | 2,009 | 0.2 | % | |||||||||
| Pennsylvania | 136 | 3,908 | 4.3 | % | 42,924 | 3.9 | % | |||||||||
| Rhode Island | 13 | 171 | 0.2 | % | 3,226 | 0.3 | % | |||||||||
| South Carolina | 103 | 2,384 | 2.6 | % | 22,014 | 2.0 | % | |||||||||
| South Dakota | 12 | 180 | 0.2 | % | 2,169 | 0.2 | % | |||||||||
| Tennessee | 108 | 3,022 | 3.3 | % | 29,110 | 2.6 | % | |||||||||
| Texas | 543 | 10,539 | 11.6 | % | 140,114 | 12.6 | % | |||||||||
| Utah | 11 | 515 | 0.6 | % | 5,744 | 0.5 | % | |||||||||
| Vermont | 5 | 14 | — | % | 292 | — | % | |||||||||
| Virginia | 94 | 2,446 | 2.7 | % | 31,834 | 2.9 | % | |||||||||
| Washington | 27 | 762 | 0.8 | % | 13,622 | 1.2 | % | |||||||||
| West Virginia | 37 | 238 | 0.3 | % | 5,457 | 0.5 | % | |||||||||
See the Definitions section for a description of the Company's non-GAAP and operating metrics.
VEREIT, Inc. | WWW.VEREIT.COM | 26
| ||
| Q3 2019 SUPPLEMENTAL INFORMATION | ||
Diversification: Property Geographic (cont.) (unaudited, square feet and dollars in thousands) |
| Location | Number of Properties | Rentable Square Feet | Square Feet as a % of Total Portfolio | Annualized Rental Income | Annualized Rental Income as a % of Total Portfolio | |||||||||||
| Wisconsin | 100 | 1,340 | 1.5 | % | 20,159 | 1.8 | % | |||||||||
| Wyoming | 8 | 54 | 0.1 | % | 1,436 | 0.1 | % | |||||||||
| Territories | ||||||||||||||||
| Puerto Rico | 3 | 88 | 0.1 | % | 2,335 | 0.2 | % | |||||||||
| Total | 3,926 | 90,704 | 100.0 | % | $ | 1,111,626 | 100.0 | % | ||||||||
Percentages based on Annualized Rental Income.
See the Definitions section for a description of the Company's non-GAAP and operating metrics.
VEREIT, Inc. | WWW.VEREIT.COM | 27
| ||
| Q3 2019 SUPPLEMENTAL INFORMATION | ||
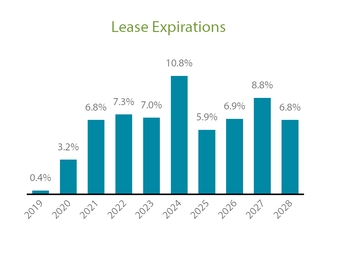
Lease Expirations (unaudited, square feet and dollars in thousands) |
| Year of Expiration | Number of Leases Expiring | Leased Square Feet | Leased Square Feet as a % of Total Portfolio | Annualized Rental Income Expiring | Annualized Rental Income Expiring as a % of Total Portfolio | |||||||||||
| 2019 | 38 | 309 | 0.4 | % | $ | 3,916 | 0.4 | % | ||||||||
| 2020 | 183 | 3,132 | 3.4 | % | 35,395 | 3.2 | % | |||||||||
| 2021 | 180 | 8,413 | 9.3 | % | 75,962 | 6.8 | % | |||||||||
| 2022 | 260 | 8,841 | 9.7 | % | 80,768 | 7.3 | % | |||||||||
| 2023 | 301 | 6,274 | 6.9 | % | 78,132 | 7.0 | % | |||||||||
| 2024 | 245 | 9,906 | 10.8 | % | 119,546 | 10.8 | % | |||||||||
| 2025 | 283 | 4,644 | 5.1 | % | 65,389 | 5.9 | % | |||||||||
| 2026 | 221 | 7,961 | 8.7 | % | 76,275 | 6.9 | % | |||||||||
| 2027 | 348 | 6,972 | 7.6 | % | 98,022 | 8.8 | % | |||||||||
| 2028 | 300 | 6,114 | 6.8 | % | 75,204 | 6.8 | % | |||||||||
| Thereafter | 778 | 27,258 | 30.3 | % | 403,017 | 36.1 | % | |||||||||
| Total | 3,137 | 89,824 | 99.0 | % | $ | 1,111,626 | 100.0 | % | ||||||||
See the Definitions section for a description of the Company's non-GAAP and operating metrics.
VEREIT, Inc. | WWW.VEREIT.COM | 28
| ||
| Q3 2019 SUPPLEMENTAL INFORMATION | ||
Lease Expirations (cont.) (unaudited, square feet and dollars in thousands) |
| Year of Expiration | Number of Leases Expiring | Leased Square Feet | Square Feet as a % of Total Portfolio | Annualized Rental Income Expiring | Annualized Rental Income Expiring as a % of Total Portfolio | |||||||||||
| 2019 | ||||||||||||||||
| Retail | 12 | 139 | 0.2 | % | $ | 1,041 | 0.2 | % | ||||||||
| Restaurant | 23 | 148 | 0.2 | % | 2,453 | 0.2 | % | |||||||||
| Office | 2 | 22 | — | % | 373 | — | % | |||||||||
Other (1) | 1 | — | — | % | 49 | — | % | |||||||||
| Total 2019 | 38 | 309 | 0.4 | % | $ | 3,916 | 0.4 | % | ||||||||
| 2020 | ||||||||||||||||
| Retail | 71 | 841 | 0.9 | % | $ | 11,536 | 1.0 | % | ||||||||
| Restaurant | 93 | 396 | 0.4 | % | 7,092 | 0.7 | % | |||||||||
| Industrial | 7 | 1,103 | 1.2 | % | 4,117 | 0.4 | % | |||||||||
| Office | 9 | 792 | 0.9 | % | 12,140 | 1.1 | % | |||||||||
Other (1) | 3 | — | — | % | 510 | — | % | |||||||||
| Total 2020 | 183 | 3,132 | 3.4 | % | $ | 35,395 | 3.2 | % | ||||||||
| 2021 | ||||||||||||||||
| Retail | 74 | 1,233 | 1.4 | % | $ | 20,016 | 1.8 | % | ||||||||
| Restaurant | 74 | 365 | 0.4 | % | 9,202 | 0.8 | % | |||||||||
| Industrial | 12 | 5,158 | 5.7 | % | 19,058 | 1.7 | % | |||||||||
| Office | 18 | 1,657 | 1.8 | % | 27,626 | 2.5 | % | |||||||||
Other (1) | 2 | — | — | % | 60 | — | % | |||||||||
| Total 2021 | 180 | 8,413 | 9.3 | % | $ | 75,962 | 6.8 | % | ||||||||
| 2022 | ||||||||||||||||
| Retail | 165 | 2,256 | 2.5 | % | $ | 30,534 | 2.7 | % | ||||||||
| Restaurant | 57 | 271 | 0.3 | % | 7,197 | 0.6 | % | |||||||||
| Industrial | 23 | 4,923 | 5.4 | % | 17,768 | 1.6 | % | |||||||||
| Office | 14 | 1,391 | 1.5 | % | 25,196 | 2.3 | % | |||||||||
Other (1) | 1 | — | — | % | 73 | 0.1 | % | |||||||||
| Total 2022 | 260 | 8,841 | 9.7 | % | $ | 80,768 | 7.3 | % | ||||||||
| (1) | Includes redevelopment property, billboards, land and parking lots. |
See the Definitions section for a description of the Company's non-GAAP and operating metrics.
VEREIT, Inc. | WWW.VEREIT.COM | 29
| ||
| Q3 2019 SUPPLEMENTAL INFORMATION | ||
Lease Expirations (cont.) (unaudited, square feet and dollars in thousands) |
| Year of Expiration | Number of Leases Expiring | Leased Square Feet | Square Feet as a % of Total Portfolio | Annualized Rental Income Expiring | Annualized Rental Income Expiring as a % of Total Portfolio | |||||||||||
| 2023 | ||||||||||||||||
| Retail | 191 | 2,499 | 2.8 | % | $ | 33,343 | 3.0 | % | ||||||||
| Restaurant | 76 | 308 | 0.3 | % | 7,941 | 0.7 | % | |||||||||
| Industrial | 18 | 2,458 | 2.7 | % | 16,387 | 1.5 | % | |||||||||
| Office | 11 | 1,009 | 1.1 | % | 19,995 | 1.8 | % | |||||||||
Other (1) | 5 | — | — | % | 466 | — | % | |||||||||
| Total 2023 | 301 | 6,274 | 6.9 | % | $ | 78,132 | 7.0 | % | ||||||||
| 2024 | ||||||||||||||||
| Retail | 133 | 2,492 | 2.7 | % | $ | 35,186 | 3.2 | % | ||||||||
| Restaurant | 74 | 316 | 0.3 | % | 8,345 | 0.8 | % | |||||||||
| Industrial | 12 | 3,459 | 3.8 | % | 14,958 | 1.3 | % | |||||||||
| Office | 24 | 3,639 | 4.0 | % | 60,928 | 5.5 | % | |||||||||
Other (1) | 2 | — | — | % | 129 | — | % | |||||||||
| Total 2024 | 245 | 9,906 | 10.8 | % | $ | 119,546 | 10.8 | % | ||||||||
| 2025 | ||||||||||||||||
| Retail | 206 | 2,155 | 2.4 | % | $ | 35,412 | 3.2 | % | ||||||||
| Restaurant | 61 | 266 | 0.3 | % | 7,512 | 0.7 | % | |||||||||
| Industrial | 11 | 1,645 | 1.8 | % | 13,217 | 1.2 | % | |||||||||
| Office | 5 | 578 | 0.6 | % | 9,248 | 0.8 | % | |||||||||
| Total 2025 | 283 | 4,644 | 5.1 | % | $ | 65,389 | 5.9 | % | ||||||||
| 2026 | ||||||||||||||||
| Retail | 92 | 1,933 | 2.1 | % | $ | 22,002 | 2.0 | % | ||||||||
| Restaurant | 106 | 480 | 0.5 | % | 17,031 | 1.5 | % | |||||||||
| Industrial | 14 | 4,804 | 5.3 | % | 21,704 | 2.0 | % | |||||||||
| Office | 8 | 744 | 0.8 | % | 15,392 | 1.4 | % | |||||||||
Other (1) | 1 | — | — | % | 146 | — | % | |||||||||
| Total 2026 | 221 | 7,961 | 8.7 | % | $ | 76,275 | 6.9 | % | ||||||||
___________________________________
| (1) | Includes redevelopment property, billboards, land and parking lots. |
See the Definitions section for a description of the Company's non-GAAP and operating metrics.
VEREIT, Inc. | WWW.VEREIT.COM | 30
| ||
| Q3 2019 SUPPLEMENTAL INFORMATION | ||
Lease Expirations (cont.) (unaudited, square feet and dollars in thousands) |
| Year of Expiration | Number of Leases Expiring | Leased Square Feet | Square Feet as a % of Total Portfolio | Annualized Rental Income Expiring | Annualized Rental Income Expiring as a % of Total Portfolio | |||||||||||
| 2027 | ||||||||||||||||
| Retail | 239 | 3,830 | 4.2 | % | $ | 50,474 | 4.5 | % | ||||||||
| Restaurant | 97 | 857 | 0.9 | % | 27,779 | 2.5 | % | |||||||||
| Industrial | 9 | 1,751 | 1.9 | % | 12,365 | 1.1 | % | |||||||||
| Office | 3 | 534 | 0.6 | % | 7,404 | 0.7 | % | |||||||||
| Total 2027 | 348 | 6,972 | 7.6 | % | $ | 98,022 | 8.8 | % | ||||||||
| 2028 | ||||||||||||||||
| Retail | 184 | 2,988 | 3.3 | % | $ | 39,196 | 3.5 | % | ||||||||
| Restaurant | 89 | 320 | 0.4 | % | 11,336 | 1.0 | % | |||||||||
| Industrial | 19 | 2,166 | 2.4 | % | 14,524 | 1.4 | % | |||||||||
| Office | 8 | 640 | 0.7 | % | 10,148 | 0.9 | % | |||||||||
| Total 2028 | 300 | 6,114 | 6.8 | % | $ | 75,204 | 6.8 | % | ||||||||
| Thereafter | ||||||||||||||||
| Retail | 403 | 14,108 | 15.6 | % | $ | 209,615 | 18.9 | % | ||||||||
| Restaurant | 346 | 3,346 | 3.8 | % | 125,847 | 11.3 | % | |||||||||
| Industrial | 19 | 9,019 | 10.0 | % | 49,751 | 4.4 | % | |||||||||
| Office | 6 | 785 | 0.9 | % | 17,589 | 1.5 | % | |||||||||
Other (1) | 4 | — | — | % | 215 | — | % | |||||||||
| Total Thereafter | 778 | 27,258 | 30.3 | % | $ | 403,017 | 36.1 | % | ||||||||
| Total Remaining Lease Expirations | 3,137 | 89,824 | 99.0 | % | $ | 1,111,626 | 100.0 | % | ||||||||
___________________________________
| (1) | Includes redevelopment property, billboards, land and parking lots. |
See the Definitions section for a description of the Company's non-GAAP and operating metrics.
VEREIT, Inc. | WWW.VEREIT.COM | 31
| ||
| Q3 2019 SUPPLEMENTAL INFORMATION | ||
Lease Summary (unaudited) |
Rent Escalations
(square feet and dollars in thousands)
| Number of Leases | Leased Square Feet | Leased Square Feet as a % of Total Portfolio | Annualized Rental Income | Annualized Rental Income as a % of Total Portfolio | ||||||||||||
| Fixed dollar or percent increase | 2,004 | 62,275 | 68.7 | % | $ | 784,994 | 70.6 | % | ||||||||
| CPI | 173 | 7,121 | 7.8 | % | 106,538 | 9.6 | % | |||||||||
| Flat | 960 | 20,428 | 22.5 | % | 220,094 | 19.8 | % | |||||||||
| Total | 3,137 | 89,824 | 99.0 | % | $ | 1,111,626 | 100.0 | % | ||||||||
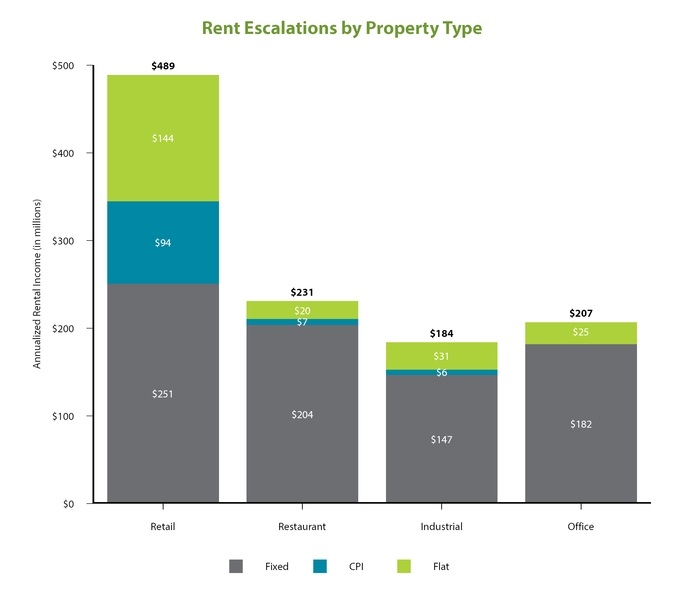
See the Definitions section for a description of the Company's non-GAAP and operating metrics.
VEREIT, Inc. | WWW.VEREIT.COM | 32
| ||
| Q3 2019 SUPPLEMENTAL INFORMATION | ||
Lease Summary (cont.) (unaudited) |
Tenant Expense Obligation
(square feet and dollars in thousands)
| Number of Leases | Leased Square Feet | Leased Square Feet as a % of Total Portfolio | Annualized Rental Income | Annualized Rental Income as a % of Total Portfolio | ||||||||||||
| NNN | 2,217 | 54,545 | 60.1 | % | $ | 696,617 | 62.7 | % | ||||||||
| NN | 889 | 33,934 | 37.4 | % | 382,888 | 34.4 | % | |||||||||
Other (1) | 31 | 1,345 | 1.5 | % | 32,121 | 2.9 | % | |||||||||
| Total | 3,137 | 89,824 | 99.0 | % | $ | 1,111,626 | 100.0 | % | ||||||||
| (1) | Includes gross, modified gross and billboard leases. |
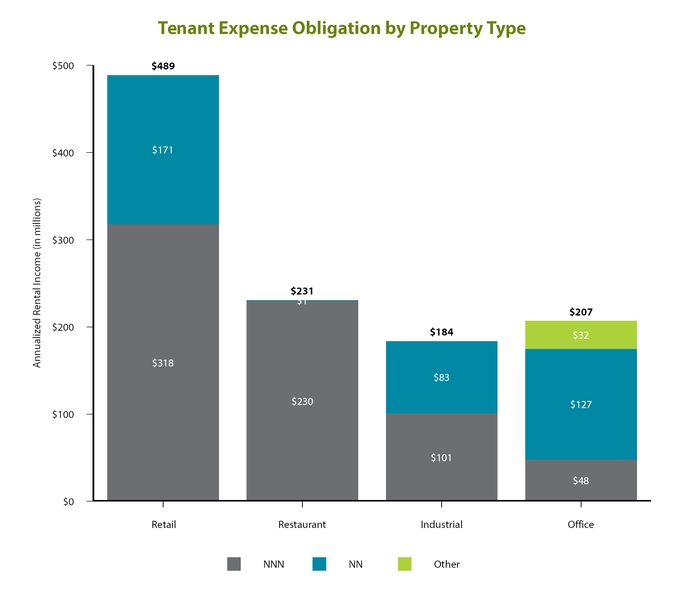
See the Definitions section for a description of the Company's non-GAAP and operating metrics.
VEREIT, Inc. | WWW.VEREIT.COM | 33
| ||
| Q3 2019 SUPPLEMENTAL INFORMATION | ||
Property Type Diversification (unaudited, square feet and dollars in thousands) |
Property Type Diversification
| Property Type | Number of Properties (1) | Rentable Square Feet | Square Feet as a % of Total Portfolio | Annualized Rental Income | Annualized Rental Income as a % of Total Portfolio | |||||||||||
Retail (1) | 2,116 | 34,862 | 38.5 | % | $ | 488,355 | 43.9 | % | ||||||||
| Restaurant | 1,573 | 7,284 | 8.0 | % | 231,735 | 20.9 | % | |||||||||
| Industrial | 147 | 36,485 | 40.2 | % | 183,849 | 16.5 | % | |||||||||
| Office | 80 | 12,073 | 13.3 | % | 206,039 | 18.5 | % | |||||||||
Other (2) | 10 | — | — | % | 1,648 | 0.2 | % | |||||||||
| Total | 3,926 | 90,704 | 100.0 | % | $ | 1,111,626 | 100.0 | % | ||||||||
(1) Includes six anchored shopping centers, representing 1.0% of Annualized Rental Income.
(2) Includes redevelopment property, billboards, construction in progress, land and parking lots.
See the Definitions section for a description of the Company's non-GAAP and operating metrics.
VEREIT, Inc. | WWW.VEREIT.COM | 34
| ||
| Q3 2019 SUPPLEMENTAL INFORMATION | ||
Diversification by Property Type: Retail (unaudited, percentages based on Annualized Rental Income of the retail properties) |
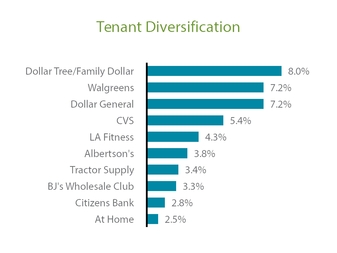 ____________________________________________________
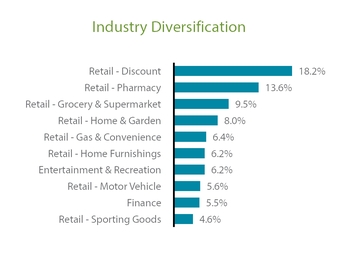 ______________________________________________________
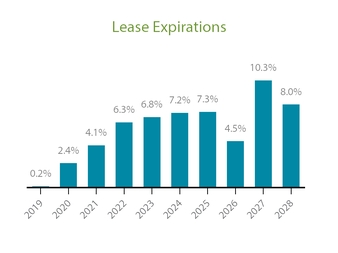
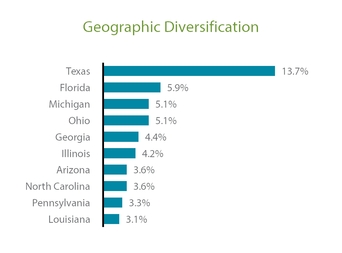 _________________________________________________
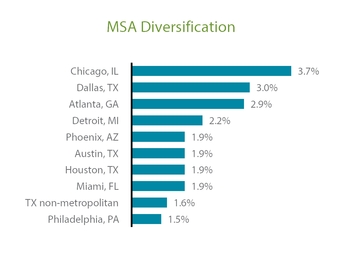 _________________________________________________
Statistics (square feet in thousands) | ||||
| Operating Properties | 2,116 | |||
| Rentable Square Feet | 34,862 | |||
| Economic Occupancy Rate | 98.9 | % | ||
| Weighted Average Remaining Lease Term | 8.9 | |||
| Investment-Grade Tenants | 49.8 | % | ||
| Flat leases | 29.5 | % | ||
| NNN leases | 65.1 | % | ||
See the Definitions section for a description of the Company's non-GAAP and operating metrics.
VEREIT, Inc. | WWW.VEREIT.COM | 35
| ||
| Q3 2019 SUPPLEMENTAL INFORMATION | ||
Diversification by Property Type: Restaurants (unaudited, percentages based on Annualized Rental Income of the restaurant properties) |
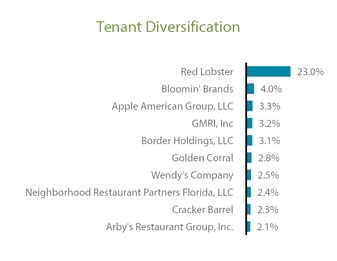
______________________________________________________
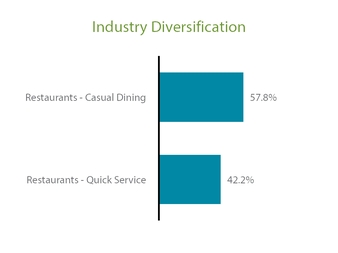 ______________________________________________________
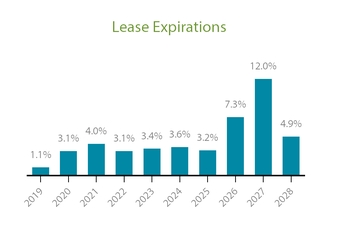
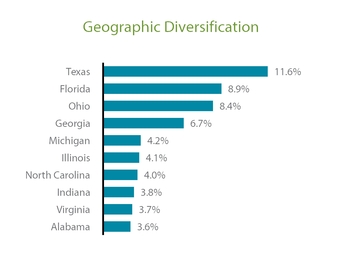
_________________________________________________
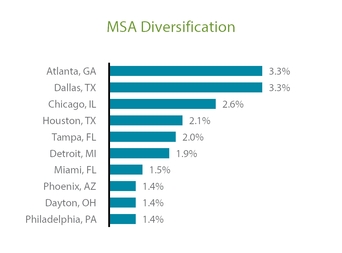 _________________________________________________
Statistics (square feet in thousands) | ||||
| Operating Properties | 1,573 | |||
| Rentable Square Feet | 7,284 | |||
| Economic Occupancy Rate | 97.1 | % | ||
| Weighted Average Remaining Lease Term | 11.0 | |||
| Investment-Grade Tenants | 3.3 | % | ||
| Flat leases | 8.8 | % | ||
| NNN leases | 99.4 | % | ||
See the Definitions section for a description of the Company's non-GAAP and operating metrics.
VEREIT, Inc. | WWW.VEREIT.COM | 36
| ||
| Q3 2019 SUPPLEMENTAL INFORMATION | ||
Diversification by Property Type: Industrial (unaudited, percentages based on Annualized Rental Income of the industrial properties) |
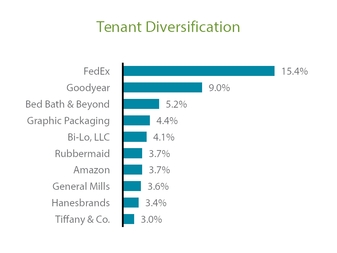 ____________________________________________________
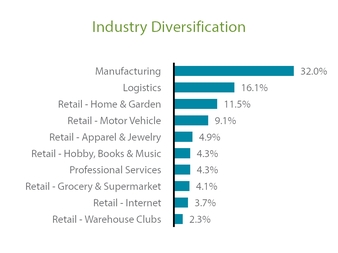 ______________________________________________________
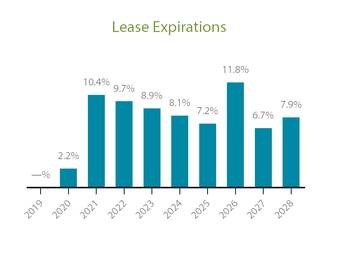
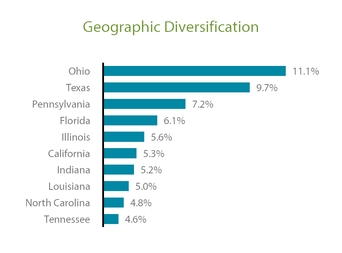 _________________________________________________
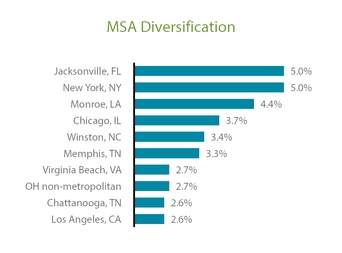 _________________________________________________
Statistics (square feet in thousands) | ||||
| Operating Properties | 147 | |||
| Rentable Square Feet | 36,485 | |||
| Economic Occupancy Rate | 100.0 | % | ||
| Weighted Average Remaining Lease Term | 7.5 | |||
| Investment-Grade Tenants | 45.4 | % | ||
| Flat leases | 17.0 | % | ||
| NNN leases | 54.9 | % | ||
See the Definitions section for a description of the Company's non-GAAP and operating metrics.
VEREIT, Inc. | WWW.VEREIT.COM | 37
| ||
| Q3 2019 SUPPLEMENTAL INFORMATION | ||
Diversification by Property Type: Office (unaudited, percentages based on Annualized Rental Income of the office properties) |
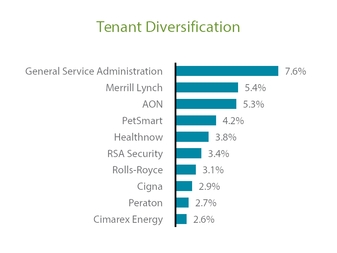 ____________________________________________________
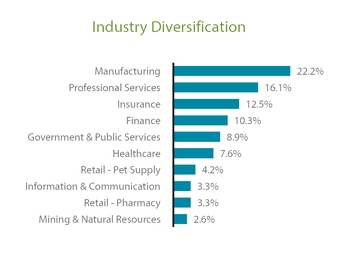 ______________________________________________________
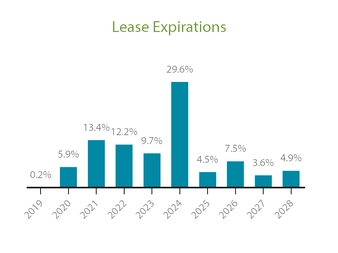
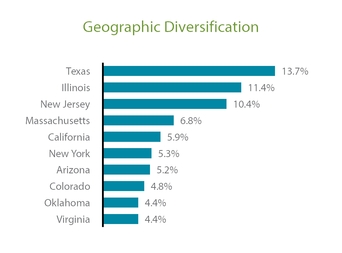 _________________________________________________
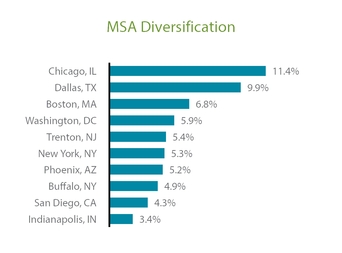 _________________________________________________
Statistics (square feet in thousands) | ||||
| Operating Properties | 80 | |||
| Rentable Square Feet | 12,073 | |||
| Economic Occupancy Rate | 97.7 | % | ||
| Weighted Average Remaining Lease Term | 5.0 | |||
| Investment-Grade Tenants | 50.6 | % | ||
| Flat leases | 11.5 | % | ||
| NNN leases | 22.9 | % | ||
See the Definitions section for a description of the Company's non-GAAP and operating metrics.
VEREIT, Inc. | WWW.VEREIT.COM | 38
| ||
| Q3 2019 SUPPLEMENTAL INFORMATION | ||
Unconsolidated Joint Venture Investment Summary (unaudited, square feet and dollars in thousands) |
| Joint Venture | Legal Ownership % | Property Type | Number of Properties | Pro Rata Share of Gross Real Estate Investments | Pro Rata Share of Rentable Square Feet | Pro Rata Share of Annualized Rental Income | Pro Rata Share of Adjusted Principal Outstanding | ||||||||||||||
| Industrial Partnership | 20% | Industrial | 6 | $ | 81,545 | 952 | $ | 5,267 | $ | 53,850 | |||||||||||
| Faison JV Bethlehem GA | 90% | Retail | 1 | 40,022 | 295 | 3,247 | — | ||||||||||||||
| Total | $ | 121,567 | 1,247 | $ | 8,514 | $ | 53,850 | ||||||||||||||
See the Definitions section for a description of the Company's non-GAAP and operating metrics.
VEREIT, Inc. | WWW.VEREIT.COM | 39
| ||
| Q3 2019 SUPPLEMENTAL INFORMATION | ||
| Definitions |
Annualized Rental Income is rental revenue under our leases on Operating Properties on a straight-line basis, which includes the effect of rent escalations and any tenant concessions, such as free rent, and our pro rata share of such revenues from properties owned by unconsolidated joint ventures. Annualized Rental Income excludes any adjustments to rental income due to changes in the collectability assessment, contingent rent, such as percentage rent, and operating expense reimbursements. Management uses Annualized Rental Income as a basis for tenant, industry and geographic concentrations and other metrics within the portfolio. Annualized Rental Income is not indicative of future performance.
Cash Cap Rate equals the estimated future 12-month Cash NOI, excluding any rent concessions or abatements, at acquisition or disposition divided by the purchase or sale price. For properties acquired or disposed of as a portfolio, the amount presented represents the portfolio cash cap rate. For development projects, Cash Cap Rate equals the estimated future 12-month NOI from the date rent commences divided by the total estimated investment. For certain properties, the Cash Cap Rate is equal to future 12-month Contract Rental Revenue, excluding any rent concessions or abatements, divided by the purchase price or sale price, as the majority of the Company's properties are subject to Triple Net Leases.
Contract Rental Revenue includes minimum rent, percentage rent and other contingent consideration, and rental revenue from parking and storage space and the Company's pro rata share of such revenues from properties owned by unconsolidated joint ventures. Contract Rental Revenue excludes GAAP adjustments, such as straight-line rent and amortization of above-market lease assets and below-market lease liabilities. Contract Rental Revenue includes such revenues from properties subject to a direct financing lease, and omits the Contract Rental Revenue related to Excluded Properties. The Company believes that Contract Rental Revenue is a useful non-GAAP supplemental measure to investors and analysts for assessing performance. However, Contract Rental Revenue should not be considered as an alternative to revenue, as computed in accordance with GAAP, or as an indicator of the Company's financial performance. Contract Rental Revenue may not be comparable to similarly titled measures of other companies.
The following table shows the calculation of Contract Rental Revenue for the three months ended September 30, 2019 and 2018 (dollar amounts in thousands):
| Three Months Ended September 30, | ||||||||
| 2019 | 2018 | |||||||
| Rental revenue - as reported | $ | 302,985 | $ | 313,866 | ||||
| Adjustments: | ||||||||
| Costs reimbursed related to CAM, property operating expenses and ground leases | (25,965 | ) | (24,833 | ) | ||||
| Straight-line rent | (5,470 | ) | (8,780 | ) | ||||
| Amortization of above-market lease assets and deferred lease incentives, net of amortization of below-market lease liabilities | 692 | 1,058 | ||||||
| Net direct financing lease adjustments | 411 | 483 | ||||||
| Other non-contract rental revenue | (38 | ) | (380 | ) | ||||
| Unconsolidated joint ventures' pro rata share | 1,950 | — | ||||||
| Contract Rental Revenue - Excluded Properties | (26 | ) | — | |||||
| Contract Rental Revenue | $ | 274,539 | $ | 281,414 | ||||
CPI is a lease in which base rent is adjusted based on changes in a consumer price index.
Direct Financing Lease is a lease that requires specific treatment due to the significance of the lease payments from the inception of the lease compared to the fair value of the property, term of the lease, a transfer of ownership, or a bargain purchase option. These leases are recorded as a net asset on the balance sheet. The amount booked is calculated as the fair value of the remaining lease payments on the leases and the estimated fair value of any expected residual property value at the end of the lease term.
Double Net Lease ("NN") is a lease under which the tenant agrees to pay all operating expenses associated with the property (e.g., real estate taxes, insurance, maintenance), but excludes some or all major repairs (e.g., roof, structure, parking lot).
VEREIT, Inc. | WWW.VEREIT.COM | 40
| ||
| Q3 2019 SUPPLEMENTAL INFORMATION | ||
| Definitions (cont.) |
Earnings Before Interest, Taxes, Depreciation and Amortization ("EBITDA"), EBITDA for Real Estate ("EBITDAre") and Normalized EBITDA
Due to certain unique operating characteristics of real estate companies, as discussed below, the National Association of Real Estate Investment Trusts, Inc. ("Nareit"), an industry trade group, has promulgated a supplemental performance measure known as Earnings Before Interest, Taxes, Depreciation and Amortization for Real Estate. Nareit defines EBITDAre as net income or loss computed in accordance with GAAP, adjusted for interest expense, income tax expense (benefit), depreciation and amortization, impairment write-downs on real estate, gains or losses from disposition of property and our pro rata share of EBITDAre adjustments related to unconsolidated partnerships and joint ventures. We calculated EBITDAre in accordance with Nareit's definition described above.
In addition to EBITDAre, we use Normalized EBITDA as a non-GAAP supplemental performance measure to evaluate the operating performance of the Company. Normalized EBITDA, as defined by the Company, represents EBITDAre, modified to exclude non-routine items such as acquisition-related expenses, litigation and non-routine costs, net, loss on disposition of discontinued operations, net revenue or expense earned or incurred that is related to the services agreement, gains or losses on sale of investment securities or mortgage notes receivable, payments on fully reserved loan receivables and restructuring expenses. We also exclude certain non-cash items such as impairments of goodwill and intangible assets, straight-line rental revenue, gains or losses on derivatives, gains or losses on the extinguishment or forgiveness of debt, write-off of program development costs, and amortization of intangibles, above-market lease assets and below-market lease liabilities. Normalized EBITDA omits the Normalized EBITDA impact of Excluded Properties. Management believes that excluding these costs from EBITDAre provides investors with supplemental performance information that is consistent with the performance models and analysis used by management, and provides investors a view of the performance of our portfolio over time. Therefore, EBITDA, EBITDAre and Normalized EBITDA should not be considered as an alternative to net income, as computed in accordance with GAAP. The Company uses EBITDA, EBITDAre and Normalized EBITDA as one measure of its operating performance when formulating corporate goals and evaluating the effectiveness of the Company's strategies. Normalized EBITDA may not be comparable to similarly titled measures of other companies.
Economic Occupancy Rate equals the sum of Leased Square Feet divided by Rentable Square Feet.
Enterprise Value equals the sum of the Implied Equity Market Capitalization, preferred stock and Net Debt.
Excluded Properties are properties for which (i) the related mortgage loan is in default, and (ii) management decides to transfer the properties to the lender in connection with settling the mortgage note obligation. Certain non-GAAP measures and operating metrics omit the impact of such properties for the month beginning with the date that such criteria are met and ending with the disposition date, in order to better reflect the ongoing operations of the Company.
At and during the three months ended September 30, 2019, there were no Excluded Properties. At and during the three months ended June 30, 2019, there was one Excluded Property which was an office property comprising 145,186 square feet, of which 6,926 square feet was vacant, with Principal Outstanding of $19.5 million. At March 31, 2019, December 31, 2018, and September 30, 2018, there were no Excluded Properties.
Fixed Charge Coverage Ratio is the sum of (i) Interest Expense, excluding non-cash amortization, (ii) secured debt principal amortization on Adjusted Principal Outstanding and (iii) dividends attributable to preferred shares divided by Normalized EBITDA. Management believes that Fixed Charge Coverage Ratio is a useful supplemental measure of our ability to satisfy fixed financing obligations.
Flat Lease is a lease that requires equal rent payments, with no increases, throughout the initial term of the lease agreement. A Flat Lease may include a period of free rent at the beginning or end of the lease.
Funds from Operations ("FFO") and Adjusted Funds from Operations ("AFFO")
Due to certain unique operating characteristics of real estate companies, as discussed below, Nareit has promulgated a supplemental performance measure known as FFO, which we believe to be an appropriate supplemental performance measure to reflect the operating performance of a REIT. FFO is not equivalent to our net income or loss as determined under GAAP.
VEREIT, Inc. | WWW.VEREIT.COM | 41
| ||
| Q3 2019 SUPPLEMENTAL INFORMATION | ||
| Definitions (cont.) |
Nareit defines FFO as net income or loss computed in accordance with GAAP adjusted for gains or losses from disposition of property, depreciation and amortization of real estate assets, impairment write-downs on real estate, and our pro rata share of FFO adjustments related to unconsolidated partnerships and joint ventures. We calculate FFO in accordance with Nareit's definition described above.
In addition to FFO, we use AFFO as a non-GAAP supplemental financial performance measure to evaluate the operating performance of the Company. AFFO, as defined by the Company, excludes from FFO non-routine items such as acquisition-related expenses, litigation and non-routine costs, net, loss on disposition of discontinued operations, net revenue or expense earned or incurred that is related to the services agreement, gains or losses on sale of investment securities or mortgage notes receivable, payments on fully reserved loan receivables and restructuring expenses. We also exclude certain non-cash items such as impairments of goodwill and intangible assets, straight-line rent, net of bad debt expense related to straight-line rent, net direct financing lease adjustments, gains or losses on derivatives, reserves for loan loss, gains or losses on the extinguishment or forgiveness of debt, non-current portion of the tax benefit or expense, equity-based compensation and amortization of intangible assets, deferred financing costs, premiums and discounts on debt and investments, above-market lease assets and below-market lease liabilities. We omit the impact of the Excluded Properties and related non-recourse mortgage notes from FFO to calculate AFFO. Management believes that excluding these costs from FFO provides investors with supplemental performance information that is consistent with the performance models and analysis used by management, and provides investors a view of the performance of our portfolio over time. AFFO allows for a comparison of the performance of our operations with other publicly-traded REITs, as AFFO, or an equivalent measure, is routinely reported by publicly-traded REITs, and we believe often used by analysts and investors for comparison purposes.
For all of these reasons, we believe FFO and AFFO, in addition to net income (loss), as defined by GAAP, are helpful supplemental performance measures and useful in understanding the various ways in which our management evaluates the performance of the Company over time. However, not all REITs calculate FFO and AFFO the same way, so comparisons with other REITs may not be meaningful. FFO and AFFO should not be considered as alternatives to net income (loss) and are not intended to be used as a liquidity measure indicative of cash flow available to fund our cash needs. Neither the SEC, Nareit, nor any other regulatory body has evaluated the acceptability of the exclusions used to adjust FFO in order to calculate AFFO and its use as a non-GAAP financial performance measure.
GAAP is an abbreviation for generally accepted accounting principles in the United States.
Gross Lease is a lease under which the landlord is responsible for all expenses associated with the property (e.g., real estate taxes, insurance, maintenance and repairs).
Gross Real Estate Investments represent total gross real estate and related assets of Operating Properties, equity investments in the Cole REITs, investment in direct financing leases, investment securities backed by real estate and mortgage notes receivable, and the Company's pro rata share of such amounts related to properties owned by unconsolidated joint ventures, net of gross intangible lease liabilities. As discussed in the About the Data section, prior to April 1, 2019, gross real estate investments included net investments in unconsolidated entities, not the Company's pro rata share of unconsolidated joint ventures' Gross Real Estate Investments. We believe that the presentation of Gross Real Estate Investments, which shows our total investments in real estate and related assets, in connection with Net Debt, provides useful information to investors to assess our overall financial flexibility, capital structure and leverage. Gross Real Estate Investments should not be considered as an alternative to the Company's real estate investments balance as determined in accordance with GAAP or any other GAAP financial measures and should only be considered together with, and as a supplement to, the Company's financial information prepared in accordance with GAAP.
The following table shows a reconciliation of Gross Real Estate Investments to the amounts presented in accordance with GAAP on the balance sheet for the periods presented (dollar amounts in thousands):
VEREIT, Inc. | WWW.VEREIT.COM | 42
| ||
| Q3 2019 SUPPLEMENTAL INFORMATION | ||
| Definitions (cont.) |
| September 30, 2019 | June 30, 2019 | March 31, 2019 | December 31, 2018 | September 30, 2018 | ||||||||||||||||
| Total real estate investments, at cost - as reported | $ | 14,925,539 | $ | 15,043,975 | $ | 15,570,486 | $ | 15,604,839 | $ | 15,519,689 | ||||||||||
| Adjustments: | ||||||||||||||||||||
| Investment in unconsolidated entities | — | — | 35,790 | 35,289 | 34,293 | |||||||||||||||
| Investment in Cole REITs | 7,552 | 7,552 | 7,552 | 7,844 | 7,844 | |||||||||||||||
| Gross assets held for sale | 91,444 | 28,312 | 45,065 | 3,020 | 30,014 | |||||||||||||||
| Investment in direct financing leases, net | 9,914 | 10,323 | 10,735 | 13,254 | 14,082 | |||||||||||||||
| Investment securities, at fair value | — | — | — | — | 26,282 | |||||||||||||||
| Mortgage notes receivable, net | — | 1,687 | 1,713 | 10,164 | 18,757 | |||||||||||||||
| Gross intangible lease liabilities | (244,908 | ) | (246,135 | ) | (259,976 | ) | (263,384 | ) | (265,036 | ) | ||||||||||
| Unconsolidated joint ventures' pro rata share | 121,567 | 121,295 | — | — | — | |||||||||||||||
| Gross Real Estate Investments - Excluded Properties | — | (16,700 | ) | — | — | — | ||||||||||||||
| Gross Real Estate Investments | $ | 14,911,108 | $ | 14,950,309 | $ | 15,411,365 | $ | 15,411,026 | $ | 15,385,925 | ||||||||||
Implied Equity Market Capitalization equals shares of common stock outstanding, including restricted stock awards, multiplied by the closing sale price of the Company's stock as reported on the New York Stock Exchange.
Industry is derived from the North American Industry Classification System, NAICS, which is a system used by federal statistical agencies to classify business establishments, for the purpose of collecting, analyzing, and publishing statistical data related to the U.S. business economy.
Interest Coverage Ratio equals Normalized EBITDA divided by Interest Expense, excluding non-cash amortization. Management believes that Interest Coverage Ratio is a useful supplemental measure of our ability to service our debt obligations.
Interest Expense, excluding non-cash amortization is a non-GAAP measure that represents interest expense incurred on the outstanding principal balance of our debt and the Company's pro rata share of the unconsolidated joint ventures' outstanding principal balance. This measure excludes (i) the amortization of deferred financing costs, premiums and discounts, which is included in interest expense in accordance with GAAP, and (ii) the impact of Excluded Properties and related non-recourse mortgage notes. We believe that the presentation of Interest Expense, excluding non-cash amortization, which shows the interest expense on our contractual debt obligations, provides useful information to investors to assess our overall solvency and financial flexibility. Interest Expense, excluding non-cash amortization should not be considered as an alternative to the Company's interest expense as determined in accordance with GAAP or any other GAAP financial measures and should only be considered together with and as a supplement to the Company's financial information prepared in accordance with GAAP.
The following table shows a reconciliation of Interest Expense, excluding non-cash amortization to interest expense presented in accordance with GAAP on the statements of operations for the periods presented (dollar amounts in thousands):
| Three Months Ended | ||||||||||||||||||||
| September 30, 2019 | June 30, 2019 | March 31, 2019 | December 31, 2018 | September 30, 2018 | ||||||||||||||||
| Interest expense - as reported | $ | (67,889 | ) | $ | (69,803 | ) | $ | (71,254 | ) | $ | (70,832 | ) | $ | (69,310 | ) | |||||
| Adjustments: | ||||||||||||||||||||
| Amortization of deferred financing costs and other non-cash charges | (3,254 | ) | (3,348 | ) | (3,546 | ) | (3,813 | ) | (4,003 | ) | ||||||||||
| Amortization of net premiums | 1,114 | 1,397 | 1,328 | 1,295 | 1,138 | |||||||||||||||
| Unconsolidated joint ventures' pro rata share | (490 | ) | (171 | ) | — | — | — | |||||||||||||
| Interest Expense, excluding non-cash amortization - Excluded Properties | (16 | ) | (208 | ) | — | — | — | |||||||||||||
| Interest Expense, excluding non-cash amortization | $ | (66,223 | ) | $ | (67,815 | ) | $ | (69,036 | ) | $ | (68,314 | ) | $ | (66,445 | ) | |||||
VEREIT, Inc. | WWW.VEREIT.COM | 43
| ||
| Q3 2019 SUPPLEMENTAL INFORMATION | ||
| Definitions (cont.) |
Investment-Grade Tenants are those with a Standard & Poor’s credit rating of BBB- or higher or a Moody’s credit rating of Baa3 or higher. The ratings may reflect those assigned by Standard & Poor’s or Moody’s to the lease guarantor or the parent company, as applicable.
Leased Square Feet is Rentable Square Feet leased (including month-to-month agreements).
Metropolitan Statistical Area (MSA) is a large metropolitan area represented by a large group of zip codes, as defined by Real Capital Analytics.
Modified Gross Lease is a lease under which the landlord is responsible for most expenses associated with the property (e.g., real estate taxes, insurance, maintenance and repairs), but passes through some operating expenses to the tenant.
Net Debt, Principal Outstanding and Adjusted Principal Outstanding
Principal Outstanding is a non-GAAP measure that represents the Company's outstanding principal debt balance, excluding certain GAAP adjustments, such as premiums and discounts, financing and issuance costs, and related accumulated amortization. Adjusted Principal Outstanding includes the Company's pro rata share of the unconsolidated joint ventures' outstanding principal debt balance and omits the outstanding principal balance of mortgage notes secured by Excluded Properties. We believe that the presentation of Principal Outstanding and Adjusted Principal Outstanding, which show our contractual debt obligations, provides useful information to investors to assess our overall financial flexibility, capital structure and leverage. Principal Outstanding and Adjusted Principal Outstanding should not be considered as alternatives to the Company's consolidated debt balance as determined in accordance with GAAP or any other GAAP financial measures and should only be considered together with, and as a supplement to, the Company's financial information prepared in accordance with GAAP.
Net Debt is a non-GAAP measure used to show the Company's Adjusted Principal Outstanding, less all cash and cash equivalents and the Company's pro rata share of unconsolidated joint ventures' cash and cash equivalents. As discussed in the About the Data section, Net Debt at September 30, 2019 includes the impact of the amounts payable in cash pursuant to the Class Action Settlement. We believe that the presentation of Net Debt provides useful information to investors because our management reviews Net Debt as part of its management of our overall liquidity, financial flexibility, capital structure and leverage.
The following table shows a reconciliation of Net Debt, Principal Outstanding and Adjusted Principal Outstanding to the amounts presented in accordance with GAAP on the balance sheet for the periods presented (dollar amounts in thousands):
| September 30, 2019 | June 30, 2019 | March 31, 2019 | December 31, 2018 | September 30, 2018 | ||||||||||||||||
| Mortgage notes payable, net | $ | 1,717,817 | $ | 1,745,331 | $ | 1,918,826 | $ | 1,922,657 | $ | 1,936,586 | ||||||||||
| Corporate bonds, net | 2,622,320 | 2,621,130 | 2,619,956 | 3,368,609 | 2,825,541 | |||||||||||||||
| Convertible debt, net | 397,726 | 396,766 | 395,823 | 394,883 | 393,961 | |||||||||||||||
| Credit facility, net | 895,351 | 895,033 | 1,089,725 | 401,773 | 793,000 | |||||||||||||||
| Total debt - as reported | 5,633,214 | 5,658,260 | 6,024,330 | 6,087,922 | 5,949,088 | |||||||||||||||
| Deferred financing costs, net | 39,807 | 42,085 | 44,602 | 42,763 | 39,085 | |||||||||||||||
| Net premiums | (4,322 | ) | (5,435 | ) | (6,726 | ) | (8,053 | ) | (13,066 | ) | ||||||||||
| Principal Outstanding | 5,668,699 | 5,694,910 | 6,062,206 | 6,122,632 | 5,975,107 | |||||||||||||||
| Unconsolidated joint ventures' pro rata share | 53,850 | 53,850 | — | — | — | |||||||||||||||
| Principal Outstanding - Excluded Properties | — | (19,525 | ) | — | — | — | ||||||||||||||
| Adjusted Principal Outstanding | $ | 5,722,549 | $ | 5,729,235 | $ | 6,062,206 | $ | 6,122,632 | $ | 5,975,107 | ||||||||||
| Cash and cash equivalents | (1,029,315 | ) | (211,510 | ) | (12,788 | ) | (30,758 | ) | (25,264 | ) | ||||||||||
| Pro rata share of unconsolidated joint ventures' cash and cash equivalents | (1,046 | ) | (2,920 | ) | — | — | — | |||||||||||||
| Amounts payable in cash pursuant to the Class Action Settlement | 966,315 | — | — | — | — | |||||||||||||||
| Net Debt | $ | 5,658,503 | $ | 5,514,805 | $ | 6,049,418 | $ | 6,091,874 | $ | 5,949,843 | ||||||||||
VEREIT, Inc. | WWW.VEREIT.COM | 44
| ||
| Q3 2019 SUPPLEMENTAL INFORMATION | ||
| Definitions (cont.) |
Net Debt Leverage Ratio equals Net Debt divided by Gross Real Estate Investments. We believe that the presentation of Net Debt Leverage Ratio provides useful information to investors because our management reviews Net Debt Leverage Ratio as part of its management of our overall liquidity, financial flexibility, capital structure and leverage.
Net Debt to Normalized EBITDA Annualized equals Net Debt divided by the respective quarter Normalized EBITDA multiplied by four. We believe that the presentation of Net Debt to Normalized EBITDA Annualized provides useful information to investors because our management reviews Net Debt to Normalized EBITDA Annualized as part of its management of our overall liquidity, financial flexibility, capital structure and leverage.
Net Operating Income ("NOI") and Cash NOI
NOI is a non-GAAP performance measure used to evaluate the operating performance of a real estate company. NOI represents rental revenue less property operating expenses and excludes impairment, depreciation and amortization, general and administrative expenses, acquisition-related expenses, litigation and non-routine costs, net and restructuring expenses. Cash NOI excludes the impact of certain GAAP adjustments to rental revenue, such as straight-line rent adjustments and amortization of above-market intangible lease assets and below-market lease intangible liabilities. Cash NOI includes the pro rata share of such amounts from properties owned by unconsolidated joint ventures and omits the Cash NOI impact of Excluded Properties. It is management's view that NOI and Cash NOI provide investors relevant and useful information because it reflects only income and operating expense items that are incurred at the property level and presents them on an unleveraged basis. NOI and Cash NOI should not be considered as an alternative to operating income. Further, NOI and Cash NOI may not be comparable to similarly titled measures of other companies.
The following table shows the calculation of NOI and Cash NOI for the periods presented (dollar amounts in thousands):
| Three Months Ended | ||||||||||||||||||||
| September 30, 2019 | June 30, 2019 | March 31, 2019 | December 31, 2018 | September 30, 2018 | ||||||||||||||||
| Rental revenue | $ | 302,985 | $ | 312,043 | $ | 316,843 | $ | 313,263 | $ | 313,866 | ||||||||||
| Less total operating expenses | (998,366 | ) | (172,755 | ) | (184,336 | ) | (246,079 | ) | (362,047 | ) | ||||||||||
| Acquisition-related expenses | 1,199 | 985 | 985 | 1,136 | 810 | |||||||||||||||
| Litigation and non-routine costs, net | 832,024 | (3,769 | ) | (21,492 | ) | 23,541 | 138,595 | |||||||||||||
| General and administrative | 14,483 | 16,416 | 14,846 | 17,220 | 15,186 | |||||||||||||||
| Depreciation and amortization | 115,111 | 118,022 | 136,555 | 153,050 | 157,181 | |||||||||||||||
| Impairment of real estate | 3,944 | 8,308 | 11,988 | 18,565 | 18,382 | |||||||||||||||
| Restructuring expenses | 783 | 290 | 9,076 | — | — | |||||||||||||||
| NOI | 272,163 | 279,540 | 284,465 | 280,696 | 281,973 | |||||||||||||||
| Straight-line rent, net of bad debt expense related to straight-line rent | (5,470 | ) | (8,043 | ) | (7,412 | ) | (8,341 | ) | (8,720 | ) | ||||||||||
| Amortization of above-market lease assets and deferred lease incentives, net of amortization of below-market lease liabilities | 692 | 611 | 731 | 945 | 1,058 | |||||||||||||||
| Net direct financing lease adjustments | 411 | 410 | 409 | 498 | 483 | |||||||||||||||
| Unconsolidated joint ventures' pro rata share | 1,817 | 1,176 | — | — | — | |||||||||||||||
| Cash NOI - Excluded Properties | (54 | ) | (203 | ) | — | — | — | |||||||||||||
| Cash NOI | $ | 269,559 | $ | 273,491 | $ | 278,193 | $ | 273,798 | $ | 274,794 | ||||||||||
Normalized Cash NOI equals our Cash NOI for our most recently reported quarter and eliminates the Cash NOI for properties acquired or developments completed during the most recently reported quarter and replaces Cash NOI for the partial period with an amount estimated to be equivalent to Cash NOI for the full period. Additionally, Normalized Cash NOI eliminates the Cash NOI contributed by properties disposed of during the most recently reported period. It is management's view that Normalized Cash NOI provides investors relevant and useful information because it reflects only the Cash NOI of properties owned as of the most recent reporting period. Normalized Cash NOI should not be considered as an alternative to operating income.
Normalized EBITDA Annualized equals Normalized EBITDA, for the respective quarter, multiplied by four.
VEREIT, Inc. | WWW.VEREIT.COM | 45
| ||
| Q3 2019 SUPPLEMENTAL INFORMATION | ||
| Definitions (cont.) |
Operating Properties refers to all properties owned and consolidated by the Company except Excluded Properties as of the reporting date.
Property Operating Expense includes reimbursable and non-reimbursable costs to operate a property, including real estate taxes, utilities, insurance, repairs, maintenance, legal, property management fees, etc.
Rentable Square Feet is leasable square feet of Operating Properties and the Company's pro rata share of leasable square feet of properties owned by unconsolidated joint ventures. Rentable Square Feet at September 30, 2019, June 30, 2019, and March 31, 2019 excludes the square feet of one redevelopment property.
Triple Net Lease ("NNN") is a lease under which the tenant agrees to pay all expenses associated with the property (e.g., real estate taxes, insurance, maintenance and repairs).
Unencumbered Asset Ratio equals unencumbered Gross Real Estate Investments divided by Gross Real Estate Investments. Management believes that Unencumbered Asset Ratio is a useful supplemental measure of our overall liquidity and leverage.
Weighted Average Remaining Lease Term is the number of years remaining on each respective lease, weighted based on Annualized Rental Income.
VEREIT, Inc. | WWW.VEREIT.COM | 46