 2015 Q3 Earnings Call October 27, 2015 9:30 AM ET Exhibit 99.2 |
 2 Important Disclosure Information This presentation contains forward-looking statements within the meaning of the federal securities laws. Statements related to, among other things, future financial performance, including our 2015 outlook and performance, free cash flow, debt reduction and distribution growth, as such, may involve known and unknown risks, uncertainties and other factors that may cause actual results or performance to differ from those projected in the forward-looking statements, possibly materially. For a description of factors that may cause actual results or performance to differ from any forward-looking statements, please review the information under the headings “Cautionary Note Regarding Forward-looking Statements” and “Risk Factors” included in the combined annual report on Form 10-K of Extended Stay America, Inc. and ESH Hospitality, Inc. (collectively, the “Company”) filed with the SEC on February 26, 2015 and other documents of the Company on file with or furnished to the SEC. Any forward-looking statements made in this presentation are qualified by these cautionary statements, and there can be no assurance that the actual results or developments anticipated by the Company will be realized or, even if substantially realized, will have the expected consequences to, or effects on, the Company or its business or operations. Except as required by law, the Company undertakes no obligation to update publicly or revise any forward-looking statement, whether as a result of new information, future developments or otherwise. We caution you that actual outcomes and results may differ materially from what is expressed, implied or forecasted by the Company’s forward-looking statements. This presentation includes certain non-GAAP financial measures, including EBITDA, Adjusted EBITDA, Hotel Operating Profit, Hotel Operating Margin, Paired Share Income, Adjusted Paired Share Income and Adjusted Paired Share Income per Paired Share. These non-GAAP financial measures should be considered only as supplemental to, and not as superior to, financial measures prepared in accordance with U.S. GAAP. Please refer to the Appendix of this presentation for a reconciliation of the non-GAAP financial measures included in this presentation to the most directly comparable financial measures prepared in accordance with U.S. GAAP. |
 3 1 See Appendix for Adjusted EBITDA, Adjusted Paired Share Income Per Paired Share, and Hotel Operating Margin Calculations Occupancy (%) Q3 2015 Result Highlights $47.72 $50.83 Q3 2014 Q3 2015 $60.14 $64.95 Q3 2014 Q3 2015 Average Daily Rate (“ADR”) 79.3% 78.3% Q3 2014 Q3 2015 +6.5% +8.0% -100bps $163.1 $181.4 Q3 2014 Q3 2015 Hotel Operating Margin (%) 53.1% 56.2% Q3 2014 Q3 2015 Adjusted Paired Share Income Per Paired Share 1 11.2% +310bps +11.1% $0.29 $0.33 Q3 2014 Q3 2015 Adjusted EBITDA 1 (Millions) Revenue Per Available Room (“RevPAR”) 1 |
 4 Nine Months 2015 Result Highlights $44.09 $46.95 Q1-Q3 2014 Q1-Q3 2015 $57.95 $62.38 Q1-Q3 2014 Q1-Q3 2015 Average Daily Rate (“ADR”) 76.1% 75.3% Q1-Q3 2014 Q1-Q3 2015 Occupancy (%) +6.5% +7.6% -80bps $433.3 $476.0 Q1-Q3 2014 Q1-Q3 2015 $0.67 $0.80 Q1-Q3 2014 Q1-Q3 2015 Hotel Operating Margin (%) 52.1% 54.8% Q1-Q3 2014 Q1-Q3 2015 Adjusted Paired Share Income Per Paired Share 1 9.8% +270bps +19.6% 1 See Appendix for Adjusted EBITDA, Adjusted Paired Share Income Per Paired Share, and Hotel Operating Margin Calculations Revenue Per Available Room (“RevPAR”) Adjusted EBITDA 1 (Millions) 1 |
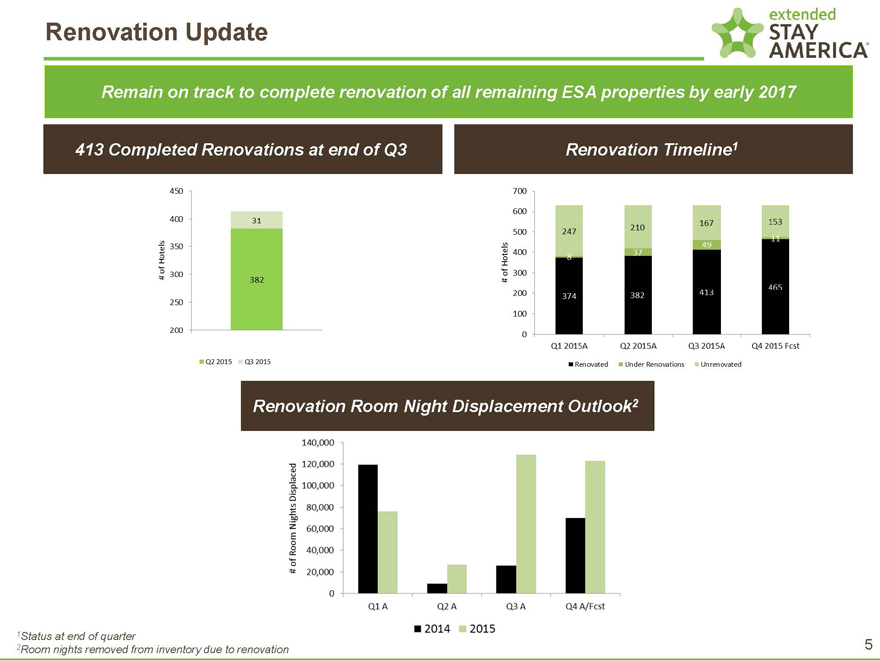
Renovation Update
Remain on track to complete renovation of all remaining ESA properties by early 2017
413 Completed Renovations at end of Q3 Renovation Timeline1
Renovation Room Night Displacement Outlook2
1Status at end of quarter 5
2Room nights removed from inventory due to renovation
 6 Segmentation Data Q3 2015 Length of Stay Revenue Mix Q3 2015 RevPAR Growth by Property Type 1 Renovated Status as of 06/30/2015 2 Under Renovation at any point during Q3 2015 Q3 2015 Contribution to Revenue Growth by Length of Stay 1-6 nights % 31% 32% 7-29 nights % 24% 24% 30+ nights % 45% 44% Q3 2015 Q3 2014 1-6 Nights, 56% 7-29 Nights, 18% 30+ Nights, 26% Property Status RevPAR ADR Occupancy Renovated 1 8.5% 8.0% +40 bps Unrenovated 6.3% 6.1% +20 bps Under Renovation 2 -9.9% 7.8% -1,240 bps |
 7 Quarterly Distribution, Cash Balance and Net Debt Ratio Quarterly Paired Share Distribution 1 $0.15 $0.17 Q3 2014 Q3 2015 +13.3% Net Debt / TTM Adjusted EBITDA Ratio 3 4.5X 4.3X Q2 2015 Q3 2015 ¹ Distribution dates of November 24, 2015 and December 5, 2014 2 Includes Unrestricted and Restricted Cash 3 Ratio not adjusted for announced 53 hotel disposition, which we expect will reduce our leverage ratio by 1/10th of a turn Cash Balance (Millions) 2 $260.0 $300.6 Q2 2015 Q3 2015 |
Renovation Update
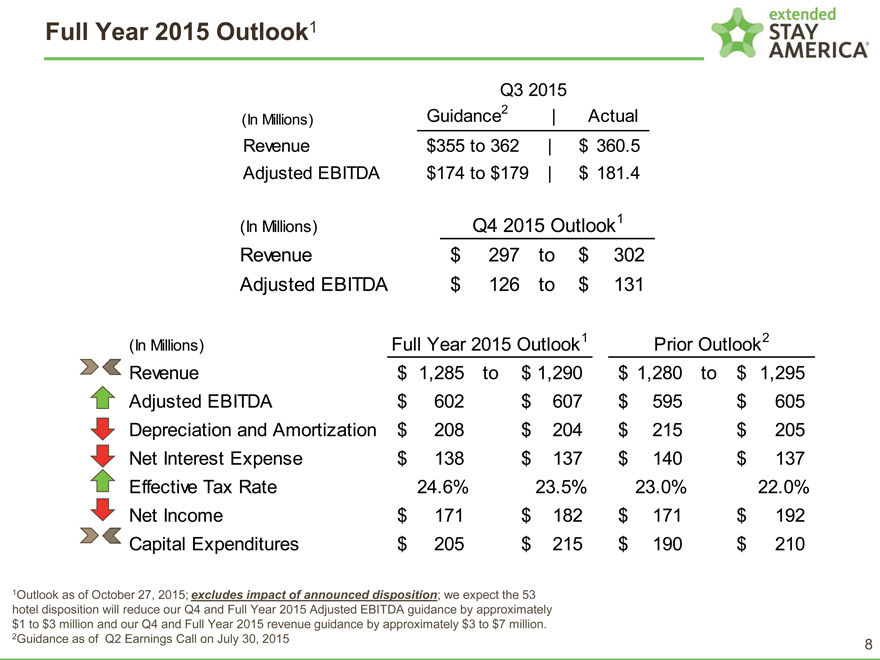
Full Year 2015 Outlook1
Q3 2015
Guidance2 | Actual
(In Millions)
Revenue $355 to 362 | $ 360.5
Adjusted EBITDA $174 to $179 | $ 181.4
1
(In Millions) Q4 2015 Outlook
Revenue $ 297 to $ 302
Adjusted EBITDA $ 126 to $ 131
1 2
(In Millions) Full Year 2015 Outlook Prior Outlook
Revenue $ 1,285 to $ 1,290 $ 1,280 to $ 1,295
Adjusted EBITDA $ 602 $ 607 $ 595 $ 605
Depreciation and Amortization $ 208 $ 204 $ 215 $ 205
Net Interest Expense $ 138 $ 137 $ 140 $ 137
Effective Tax Rate 24.6% 23.5% 23.0% 22.0%
Net Income $ 171 $ 182 $ 171 $ 192
Capital Expenditures $ 205 $ 215 $ 190 $ 210
1Outlook as of October 27, 2015; excludes impact of announced disposition; we expect the 53
hotel disposition will reduce our Q4 and Full Year 2015 Adjusted EBITDA guidance by approximately
$1 to $3 million and our Q4 and Full Year 2015 revenue guidance by approximately $3 to $7 million.
2Guidance as of Q2 Earnings Call on July 30, 2015
8
 9 APPENDIX |
 10 Non-GAAP Reconciliation of Net Income to EBITDA and Adjusted EBITDA For the Three and Nine Months Ended September 30, 2015 and 2014 2015 2014 2015 2014 $ 58,225 60,185 $ Net income $ 150,890 122,550 $ 35,157 33,377 Interest expense, net 101,975 116,464 21,293 18,970 Income tax expense 48,119 38,187 52,268 47,124 Depreciation and amortization 151,980 139,401 166,943 159,656 EBITDA 452,964 416,602 3,021 2,283 Non-cash equity-based compensation 7,940 7,173 1,143 1,058 Other non-operating expense 2,035 2,837 9,011 - Impairment of long-lived assets 9,011 - - (864) Gain on sale of hotel properties - (864) 1,290 (1) 969 (2) Other expenses 4,034 (3) 7,561 (4) 181,408 $ 163,102 $ Adjusted EBITDA 475,984 $ 433,309 $ 11.2% Adjusted EBITDA % growth 9.8% (4) Includes public company transition costs of approximately $3.2 million, including approximately $1.5 million in costs incurred in connection with the August 2014 secondary offering, consulting fees of approximately $1.9 million related to the implementation of certain key strategic initiatives, including review of our corporate infrastructure, and loss on disposal of assets of approximately $2.5 million. (3) Includes costs incurred in connection with the preparation of the registration statement filed on June 5, 2015 of approximately $0.7 million, and loss on disposal of assets of approximately $3.3 million. Three Months Ended September 30, Nine Months Ended September 30, (1) Includes loss on disposal of assets of approximately $1.3 million. (2) Includes public company transition costs of approximately $0.8 million, including approximately $0.6 million in costs incurred in connection with the August 2014 secondary offering, and loss on disposal of assets of approximately $0.2 million. (Unaudited) (In thousands) |
 11 Non-GAAP Reconciliation of Hotel Operating Profit and Hotel Operating Margin For the Three and Nine Months Ended September 30, 2015 and 2014 2015 2014 % Variance 2015 2014 % Variance 355,445 $ 333,970 $ 6.4% Room revenues 974,127 $ 917,286 $ 6.2% 5,071 4,583 10.6% Other hotel revenues 14,291 13,497 5.9% 360,516 338,553 6.5% Total hotel revenues 988,418 930,783 6.2% 157,761 158,914 (0.7)% Hotel operating expenses (1) 447,217 445,756 0.3% 202,755 $ 179,639 $ 12.9% Hotel Operating Profit 541,201 $ 485,027 $ 11.6% 56.2% 53.1% 310 bps Hotel Operating Margin 54.8% 52.1% 270 bps (1) Excludes loss on disposal of assets of approximately $1.3 million, $0.2 million, $3.3 million and $2.5 million, respectively. (In thousands) (Unaudited) Nine Months Ended September 30, Three Months Ended September 30, |
 12 Non-GAAP Reconciliation of Net Income Attributable to Common Shareholders to Paired Share Income, Adjusted Paired Share Income and Adjusted Paired Share Income Per Paired Share for the Three and Nine Months Ended September 30, 2015 and 2014 2015 2014 2015 2014 37,656 $ 43,875 $ Net income attributable to common shareholders 117,187 $ 97,901 $ 20,565 16,306 Noncontrolling interests attributable to Class B common shares of ESH REIT 33,691 24,637 58,221 60,181 Paired Share Income 150,878 122,538 - - Debt extinguishment costs 1,790 7,185 837 281 Other non-operating expense 1,487 2,158 6,598 - Impairment of long-lived assets 6,598 - - (659) Gain on sale of hotel properties - (659) 944 (1) 76 (2) Other expenses 3,050 (3) 5,761 (4) 66,600 $ 59,879 $ Adjusted Paired Share Income 163,803 $ 136,983 $ 0.33 $ 0.29 $ Adjusted Paired Share Income per Paired Share – basic 0.80 $ 0.67 $ 0.33 $ 0.29 $ Adjusted Paired Share Income per Paired Share – diluted 0.80 $ 0.67 $ 204,281 203,593 Weighted average Paired Shares outstanding – basic 204,171 203,449 204,685 204,540 Weighted average Paired Shares outstanding – diluted 204,538 204,492 (In thousands, except per Paired Share data) (Unaudited) (3) Includes costs incurred in connection with the preparation of the registration statement filed on June 5, 2015 of approximately $0.7 million pre-tax and loss on disposal of assets of approximately $3.3 million pre-tax, which total approximately $3.1 million after-tax. (4) Includes public company transition costs of approximately $3.2 million pre-tax, including approximately $1.5 million pre-tax in costs incurred in connection with the August 2014 secondary offering, consulting fees of approximately $1.9 million pre-tax related to the implementation of certain key strategic initiatives, including review of our corporate infrastructure, and loss on disposal of assets of approximately $2.5 million pre-tax, which total approximately $5.8 million after-tax. (2) Includes public company transition costs of approximately $0.8 million pre-tax, including approximately $0.6 million pre-tax in costs incurred in connection with the August 2014 secondary offering, and loss on disposal of assets of approximately $0.2 million pre-tax, which total approximately $0.1 million after-tax. (1) Includes loss on disposal of assets of approximately $1.3 million pre-tax, which totals approximately $0.9 million after-tax. Three Months Ended September 30, Nine Months Ended September 30, |