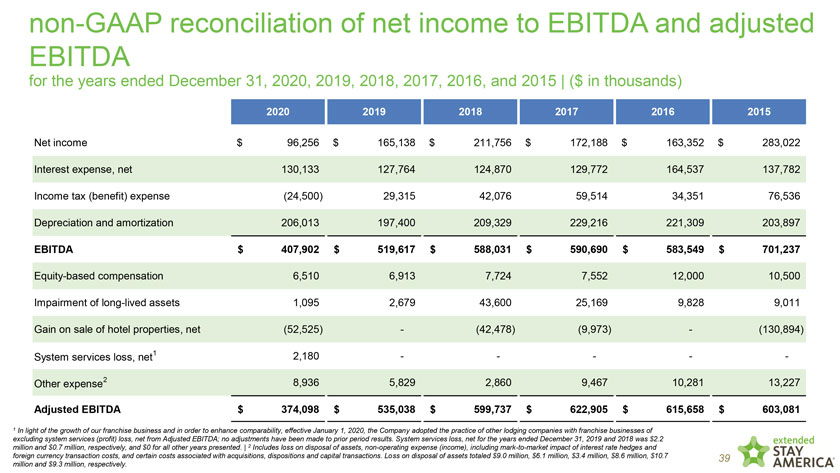
non-GAAP reconciliation of net income to EBITDA and adjusted EBITDA for the years ended December 31, 2020, 2019, 2018, 2017, 2016, and 2015 | ($ in thousands) 2020 2019 2018 2017 2016 2015 Net income $ 96,256 $ 165,138 $ 211,756 $ 172,188 $ 163,352 $ 283,022 Interest expense, net 130,133 127,764 124,870 129,772 164,537 137,782 Income tax (benefit) expense (24,500) 29,315 42,076 59,514 34,351 76,536 Depreciation and amortization 206,013 197,400 209,329 229,216 221,309 203,897 EBITDA $ 407,902 $ 519,617 $ 588,031 $ 590,690 $ 583,549 $ 701,237 Equity-based compensation 6,510 6,913 7,724 7,552 12,000 10,500 Impairment of long-lived assets 1,095 2,679 43,600 25,169 9,828 9,011 Gain on sale of hotel properties, net (52,525) - (42,478) (9,973) - (130,894) System services loss, net1 2,180 - - - - -Other expense2 8,936 5,829 2,860 9,467 10,281 13,227 Adjusted EBITDA $ 374,098 $ 535,038 $ 599,737 $ 622,905 $ 615,658 $ 603,081 1 In light of the growth of our franchise business and in order to enhance comparability, effective January 1, 2020, the Company adopted the practice of other lodging companies with franchise businesses of excluding system services (profit) loss, net from Adjusted EBITDA; no adjustments have been made to prior period results. System services loss, net for the years ended December 31, 2019 and 2018 was $2.2 million and $0.7 million, respectively, and $0 for all other years presented. | 2 Includes loss on disposal of assets, non-operating expense (income), including mark-to-market impact of interest rate hedges and foreign currency transaction costs, and certain costs associated with acquisitions, dispositions and capital transactions. Loss on disposal of assets totaled $9.0 million, $6.1 million, $3.4 million, $8.6 million, $10.7 39