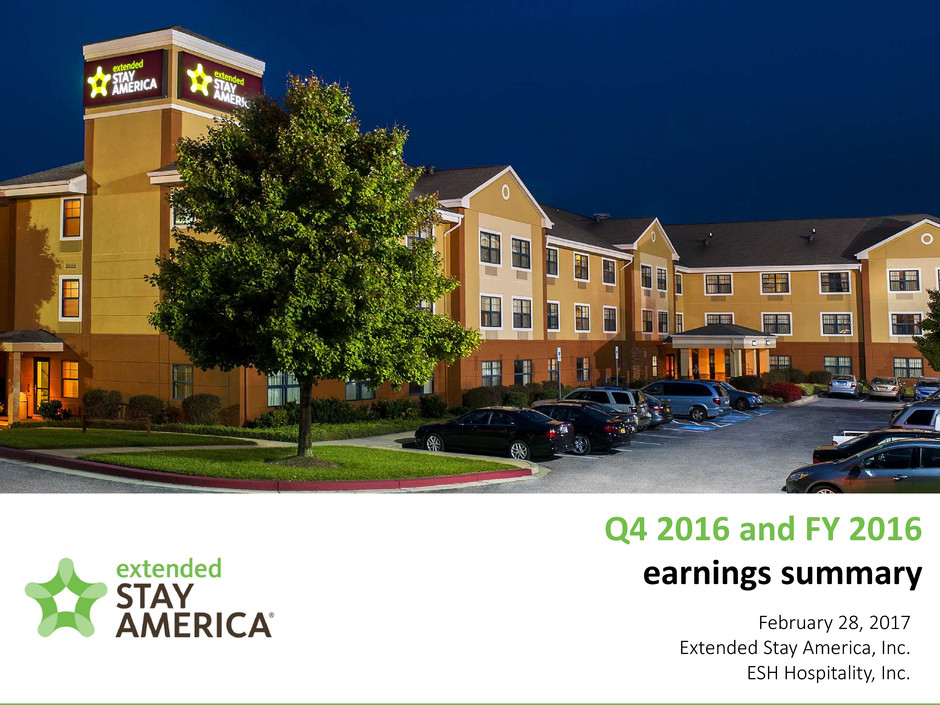
February 28, 2017 Extended Stay America, Inc. ESH Hospitality, Inc. Q4 2016 and FY 2016 earnings summary
2 important disclosure information This presentation contains forward-looking statements within the meaning of the federal securities laws. Statements related to, among other things, future financial performance, including our 2017 outlook, the expected timing, completion and effects of any proposed asset disposals, expected performance, free cash flow, debt reduction, distribution growth and other growth opportunities, as such, involve known and unknown risks, uncertainties and other factors that may cause the Company’s actual results or performance to differ from those projected in the forward-looking statements, possibly materially. For a description of factors that may cause the Company’s actual results or performance to differ from future results or performance implied by forward-looking statements, please review the information under the headings “Cautionary Note Regarding Forward-Looking Statements” and “Risk Factors” included in the combined annual report on Form 10-K of Extended Stay America, Inc. and ESH Hospitality, Inc. (collectively, the “Company”) filed with the SEC on February 28, 2017 and other documents of the Company on file with or furnished to the SEC. Any forward-looking statements made in this presentation are qualified by these cautionary statements, and there can be no assurance that the actual results or developments anticipated by the Company will be realized or, even if substantially realized, will have the expected consequences to, or effects on, the Company, its business or operations. Except as required by law, the Company undertakes no obligation to update publicly or revise any forward-looking statement, whether as a result of new information, future developments or otherwise. We caution you that actual outcomes and results may differ materially from what is expressed, implied or forecasted by the Company’s forward-looking statements. This presentation includes certain non-GAAP financial measures, including Hotel Operating Profit, Hotel Operating Margin, EBITDA, Adjusted EBITDA, Funds From Operations (“FFO”), Adjusted Funds From Operations (“Adjusted FFO”), Adjusted FFO per Paired Share, Paired Share Income, Adjusted Paired Share Income and Adjusted Paired Share Income per Paired Share. These non- GAAP financial measures should be considered only as supplemental to, and not as superior to, financial measures prepared in accordance with U.S. GAAP. Please refer to the Appendix of this presentation for a reconciliation of these non-GAAP financial measures to the most directly comparable financial measures prepared in accordance with U.S. GAAP and to the Company’s Combined annual report on Form 10-K filed with the SEC on February 28, 2017 for definitions of these non-GAAP measures.
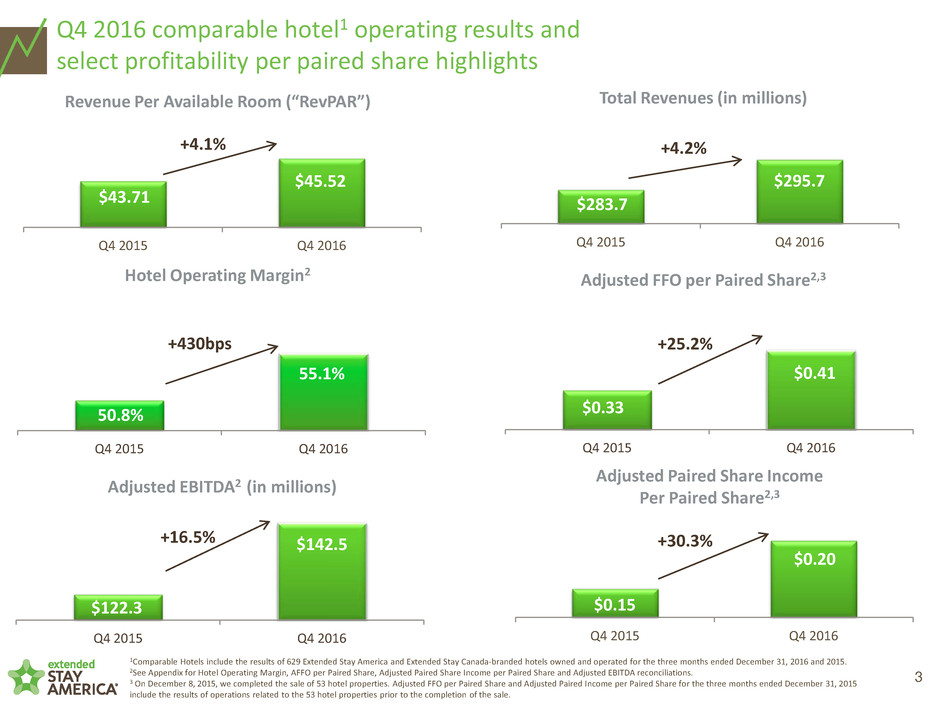
3 1Comparable Hotels include the results of 629 Extended Stay America and Extended Stay Canada-branded hotels owned and operated for the three months ended December 31, 2016 and 2015. 2See Appendix for Hotel Operating Margin, AFFO per Paired Share, Adjusted Paired Share Income per Paired Share and Adjusted EBITDA reconciliations. 3 On December 8, 2015, we completed the sale of 53 hotel properties. Adjusted FFO per Paired Share and Adjusted Paired Income per Paired Share for the three months ended December 31, 2015 include the results of operations related to the 53 hotel properties prior to the completion of the sale. Q4 2016 comparable hotel1 operating results and select profitability per paired share highlights $43.71 $45.52 Q4 2015 Q4 2016 Revenue Per Available Room (“RevPAR”) $0.33 $0.41 Q4 2015 Q4 2016 Adjusted FFO per Paired Share2,3 +4.1% +25.2% $283.7 $295.7 Q4 2015 Q4 2016 Total Revenues (in millions) $122.3 $142.5 Q4 2015 Q4 2016 Hotel Operating Margin2 50.8% 55.1% Q4 2015 Q4 2016 Adjusted EBITDA2 (in millions) +4.2% +430bps +16.5% $0.15 $0.20 Q4 2015 Q4 2016 Adjusted Paired Share Income Per Paired Share2,3 +30.3%
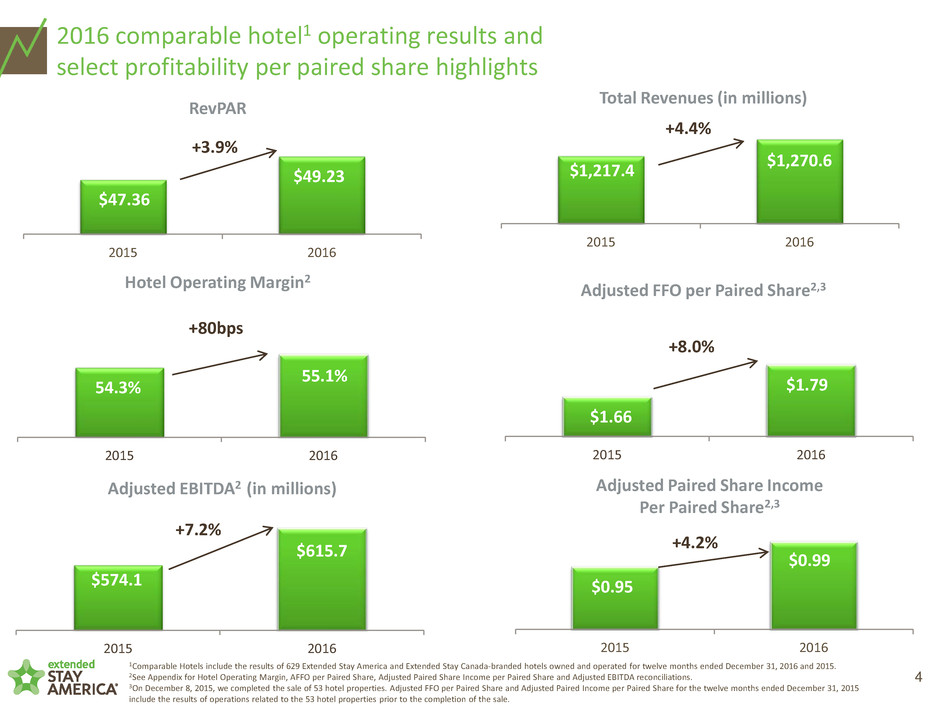
4 $47.36 $49.23 2015 2016 RevPAR $1.66 $1.79 2015 2016 Adjusted FFO per Paired Share2,3 +3.9% +8.0% $574.1 $615.7 2015 2016 Hotel Operating Margin2 54.3% 55.1% 2015 2016 Adjusted EBITDA2 (in millions) +4.4% +80bps +7.2% $0.95 $0.99 2015 2016 Adjusted Paired Share Income Per Paired Share2,3 +4.2% 1Comparable Hotels include the results of 629 Extended Stay America and Extended Stay Canada-branded hotels owned and operated for twelve months ended December 31, 2016 and 2015. 2See Appendix for Hotel Operating Margin, AFFO per Paired Share, Adjusted Paired Share Income per Paired Share and Adjusted EBITDA reconciliations. 3On December 8, 2015, we completed the sale of 53 hotel properties. Adjusted FFO per Paired Share and Adjusted Paired Income per Paired Share for the twelve months ended December 31, 2015 include the results of operations related to the 53 hotel properties prior to the completion of the sale. 2016 comparable hotel1 operating results and select profitability per paired share highlights $1,217.4 $1,270.6 2015 2016 Total Revenues (in millions) +4.4%
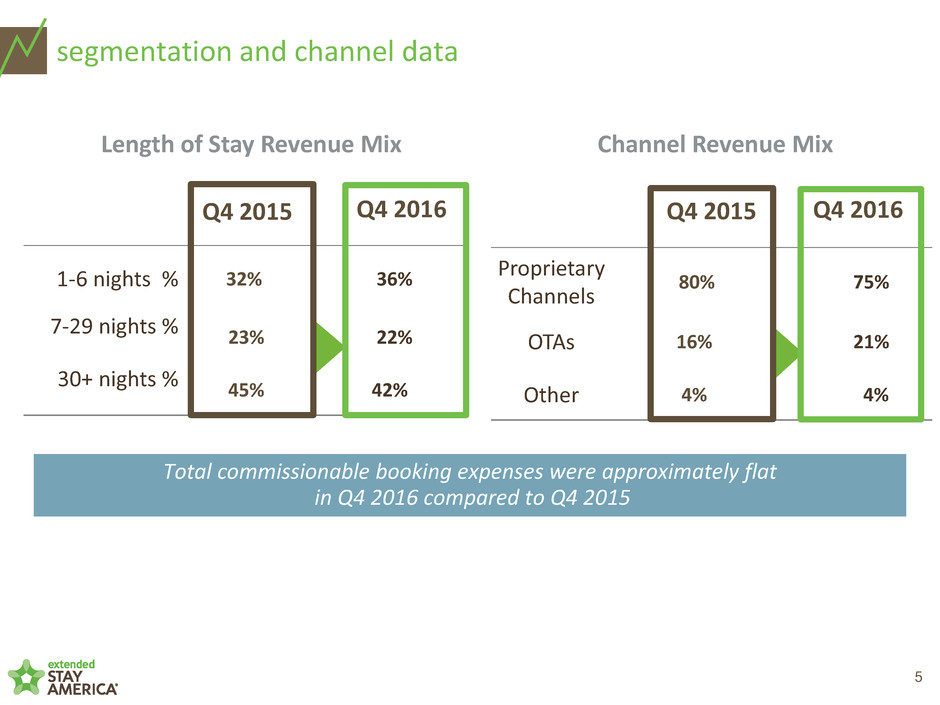
5 Q4 2016 segmentation and channel data Length of Stay Revenue Mix Channel Revenue Mix 1-6 nights % 32% 36% 7-29 nights % 23% 22% 30+ nights % 45% 42% Q4 2016 Q4 2015 Proprietary Channels 80% 75% OTAs 16% 21% Other 4% 4% Q4 2015 Total commissionable booking expenses were approximately flat in Q4 2016 compared to Q4 2015
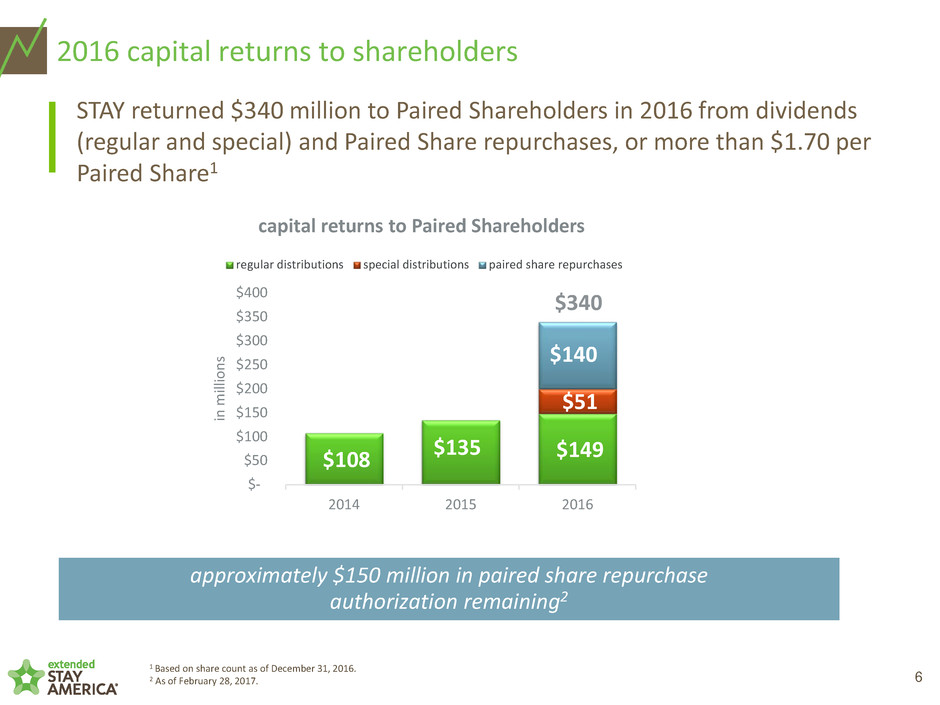
6 1 Based on share count as of December 31, 2016. 2 As of February 28, 2017. 2016 capital returns to shareholders STAY returned $340 million to Paired Shareholders in 2016 from dividends (regular and special) and Paired Share repurchases, or more than $1.70 per Paired Share1 capital returns to Paired Shareholders approximately $150 million in paired share repurchase authorization remaining2 $108 $135 $149 $51 $140 $- $50 $100 $150 $200 $250 $300 $350 $400 2014 2015 2016 in m ill io ns regular distributions special distributions paired share repurchases $340
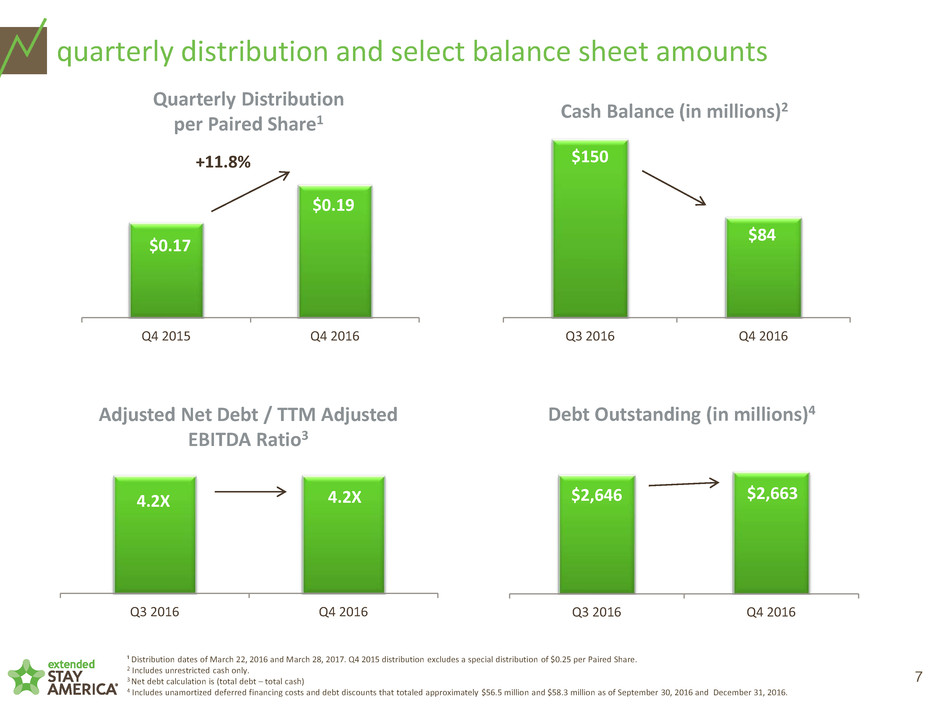
7 quarterly distribution and select balance sheet amounts Quarterly Distribution per Paired Share1 $0.17 $0.19 Q4 2015 Q4 2016 +11.8% Adjusted Net Debt / TTM Adjusted EBITDA Ratio3 4.2X 4.2X Q3 2016 Q4 2016 ¹ Distribution dates of March 22, 2016 and March 28, 2017. Q4 2015 distribution excludes a special distribution of $0.25 per Paired Share. 2 Includes unrestricted cash only. 3 Net debt calculation is (total debt – total cash) 4 Includes unamortized deferred financing costs and debt discounts that totaled approximately $56.5 million and $58.3 million as of September 30, 2016 and December 31, 2016. Cash Balance (in millions)2 $150 $84 Q3 2016 Q4 2016 Debt Outstanding (in millions)4 $2,646 $2,663 Q3 2016 Q4 2016
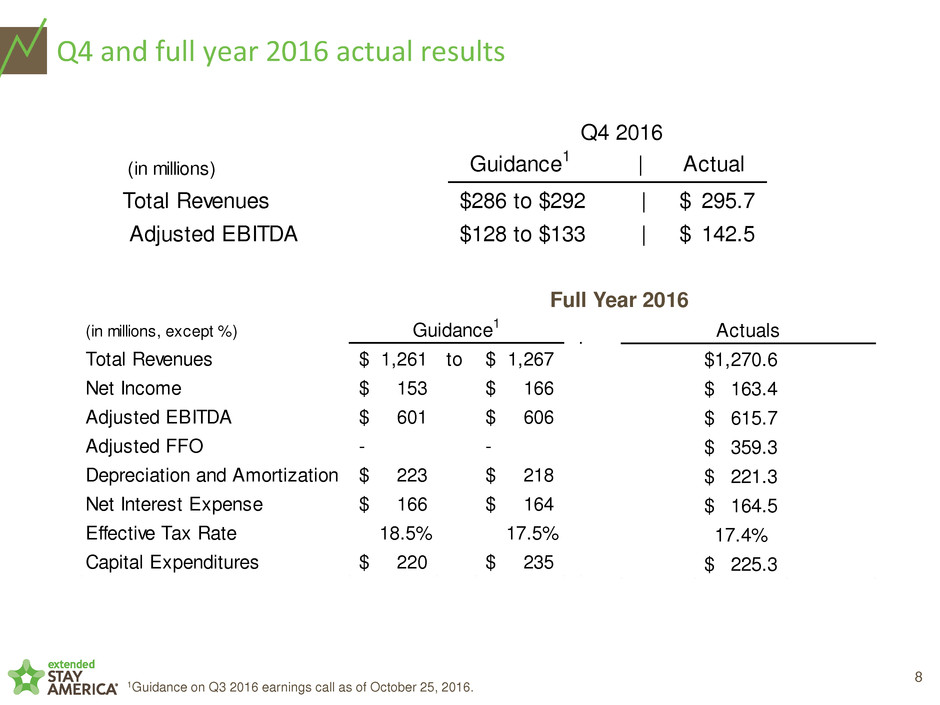
8 Q4 and full year 2016 actual results 1,270.6$ 163.4$ 615.7$ 359.3$ 221.3$ 164.5$ 17.4% 225.3$ Actuals 1Guidance on Q3 2016 earnings call as of October 25, 2016. (in millions, except %) Total Revenues 1,261$ to 1,267$ Net Income 153$ 166$ Adjusted EBITDA 601$ 606$ Adjusted FFO - - Depreciation and Amortization 223$ 218$ Net Interest Expense 166$ 164$ Effective Tax Rate 18.5% 17.5% Capital Expenditures 220$ 235$ Guidance1 (in millions) Total Revenues $286 to $292 | 295.7$ Adjusted EBITDA $128 to $133 | 142.5$ Q4 2016 Guidance1 | Actual Full Year 2016
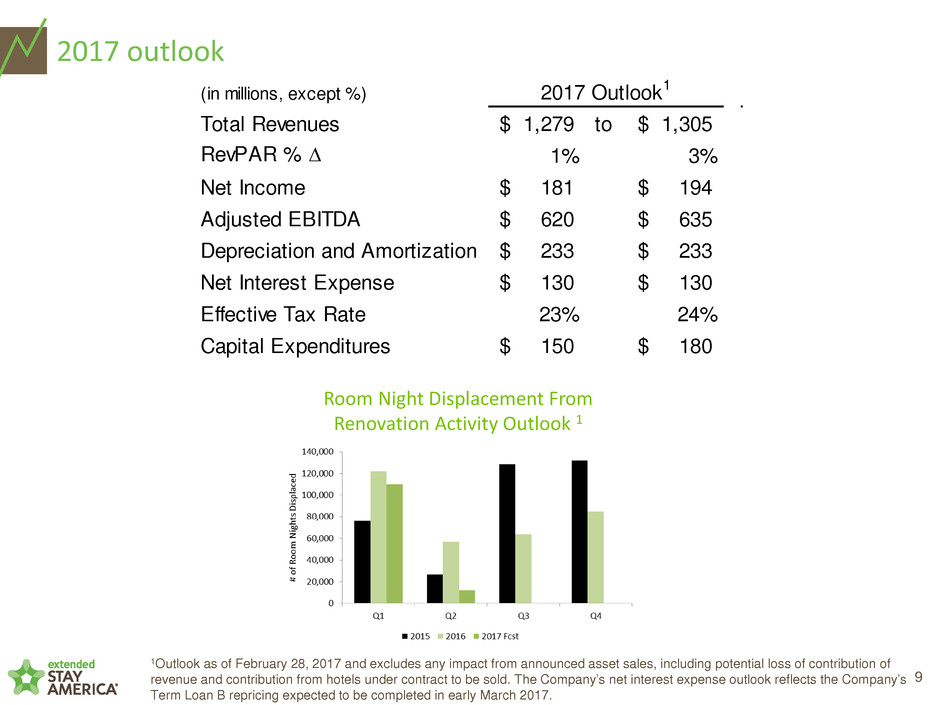
9 2017 outlook 1Outlook as of February 28, 2017 and excludes any impact from announced asset sales, including potential loss of contribution of revenue and contribution from hotels under contract to be sold. The Company’s net interest expense outlook reflects the Company’s Term Loan B repricing expected to be completed in early March 2017. (in millions, except %) Total Revenues 1,279$ to 1,305$ RevPAR % ∆ 1% 3% Net Income 181$ 194$ Adjusted EBITDA 620$ 635$ Depreciation and Amortization 233$ 233$ Net Interest Expense 130$ 130$ Effective Tax Rate 23% 24% Capital Expenditures 150$ 180$ 2017 Outlook1 Room Night Displacement From Renovation Activity Outlook 1

appendix

11 Non-GAAP Reconciliation of Net Income to EBITDA and Comparable Hotel Adjusted EBITDA1 For the Three and Twelve Months Ended December 31, 2016 and 2015 2016 2015 2016 2015 $ 30,148 132,132$ Net income $ 163,352 283,022$ 33,075 35,807 Interest expense, net 164,537 137,782 8,140 28,417 Income tax expense 34,351 76,536 57,035 51,917 Depreciation and amortization 221,309 203,897 128,398 248,273 EBITDA 583,549 701,237 - (4,757) Adjusted Property EBITDA of hotels not owned for entirety of periods presented - (28,948) 3,365 2,560 Non-cash equity-based compensation 12,000 10,500 (507) 697 Other non-operating (income) expense (1,576) 2,732 7,072 - Impairment of long-lived assets 9,828 9,011 - (130,894) Gain on sale of hotel properties - (130,894) 4,139 (2) 6,461 (3) Other expenses 11,857 (4) 10,495 (5) 142,467$ 122,340$ Comparable Hotel Adjusted EBITDA 615,658$ 574,133$ 16.5% % growth 7.2% (5) Includes loss on disposal of assets of approximately $9.3 million, costs incurred in connection with the preparation of the registration statement filed in June 2015 and the November 2015 secondary offering of approximately $0.9 million and transaction costs of approximately $0.3 million related to the sale of the 53 hotel properties. (1) Comparable Hotel Adjusted EBITDA includes the results of 629 Extended Stay America and Extended Stay Canada- branded hotels owned and operated for the three and twelve months ended December 31, 2016 and 2015. Three Months Ended Twelve Months Ended December 31, December 31, (2) Includes loss on disposal of assets of approximately $3.5 million and costs incurred in connection with the fourth quarter secondary offerings of approximately $0.7 million. (3) Includes loss on disposal of assets of approximately $6.0 million, transaction costs of approximately $0.3 million related to the sale of the 53 hotel properties and costs in connection with the November 2015 secondary offering of approximately $0.2 million. (In thousands) (Unaudited) (4) Includes loss on disposal of assets of approximately $10.7 million, costs incurred in connection with the fourth quarter 2016 secondary offerings of approximately $1.1 million and transaction costs of approximately $0.1 million due to the revision of an estimate related to the sale of the 53 hotel properties.
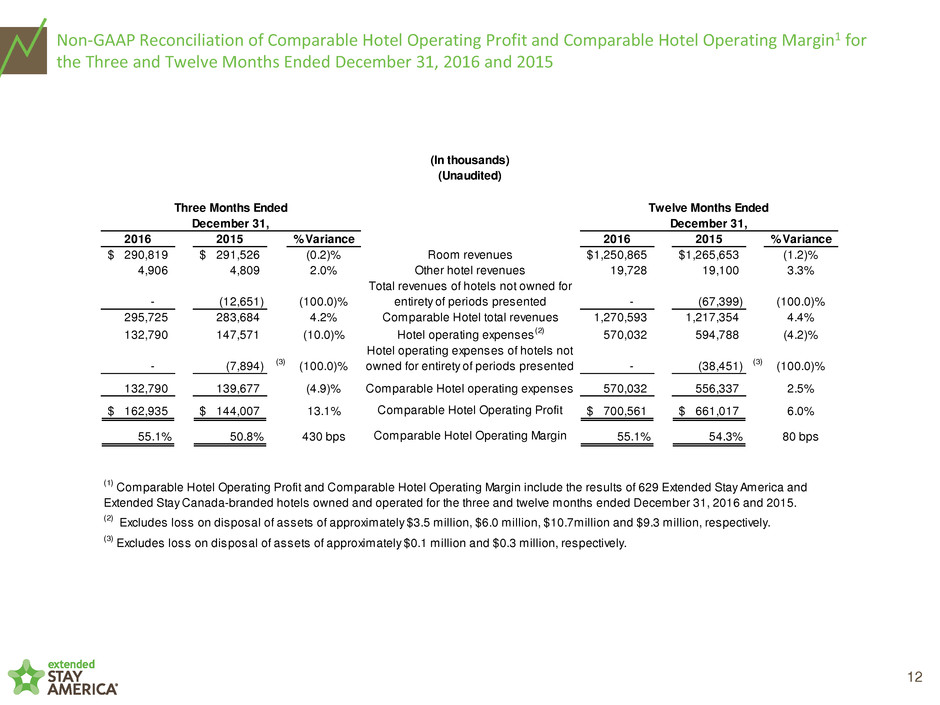
12 Non-GAAP Reconciliation of Comparable Hotel Operating Profit and Comparable Hotel Operating Margin1 for the Three and Twelve Months Ended December 31, 2016 and 2015 2016 2015 % Variance 2016 2015 % Variance 290,819$ 291,526$ (0.2)% Room revenues 1,250,865$ 1,265,653$ (1.2)% 4,906 4,809 2.0% Other hotel revenues 19,728 19,100 3.3% - (12,651) (100.0)% Total revenues of hotels not owned for entirety of periods presented - (67,399) (100.0)% 295,725 283,684 4.2% Comparable Hotel total revenues 1,270,593 1,217,354 4.4% 132,790 147,571 (10.0)% Hotel operating expenses(2) 570,032 594,788 (4.2)% - (7,894) (3) (100.0)% Hotel operating expenses of hotels not owned for entirety of periods presented - (38,451) (3) (100.0)% 132,790 139,677 (4.9)% Comparable Hotel operating expenses 570,032 556,337 2.5% 162,935$ 144,007$ 13.1% Comparable Hotel Operating Profit 700,561$ 661,017$ 6.0% 55.1% 50.8% 430 bps Comparable Hotel Operating Margin 55.1% 54.3% 80 bps December 31, December 31, (2) Excludes loss on disposal of assets of approximately $3.5 million, $6.0 million, $10.7million and $9.3 million, respectively. (3) Excludes loss on disposal of assets of approximately $0.1 million and $0.3 million, respectively. (1) Comparable Hotel Operating Profit and Comparable Hotel Operating Margin include the results of 629 Extended Stay America and Extended Stay Canada-branded hotels owned and operated for the three and twelve months ended December 31, 2016 and 2015. (In thousands) (Unaudited) Three Months Ended Twelve Months Ended
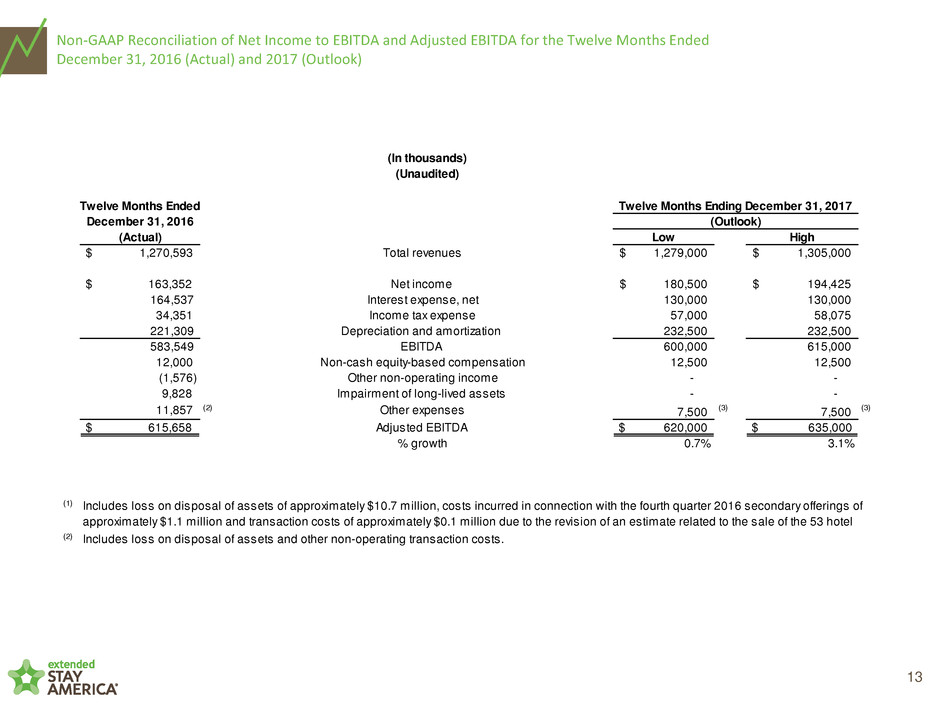
13 Non-GAAP Reconciliation of Net Income to EBITDA and Adjusted EBITDA for the Twelve Months Ended December 31, 2016 (Actual) and 2017 (Outlook) Twelve Months Ended December 31, 2016 (Actual) Low High $ 1,270,593 Total revenues 1,279,000$ 1,305,000$ $ 163,352 Net income 180,500$ 194,425$ 164,537 Interest expense, net 130,000 130,000 34,351 Income tax expense 57,000 58,075 221,309 Depreciation and amortization 232,500 232,500 583,549 EBITDA 600,000 615,000 12,000 Non-cash equity-based compensation 12,500 12,500 (1,576) Other non-operating income - - 9,828 Impairment of long-lived assets - - 11,857 (2) Other expenses 7,500 (3) 7,500 (3) $ 615,658 Adjusted EBITDA $ 620,000 $ 635,000 % growth 0.7% 3.1% (1) (In thousands) (Unaudited) Twelve Months Ending December 31, 2017 (Outlook) Includes loss on disposal of assets of approximately $10.7 million, costs incurred in connection with the fourth quarter 2016 secondary offerings of approximately $1.1 million and transaction costs of approximately $0.1 million due to the revision of an estimate related to the sale of the 53 hotel (2) Includes loss on disposal of assets and other non-operating transaction costs.
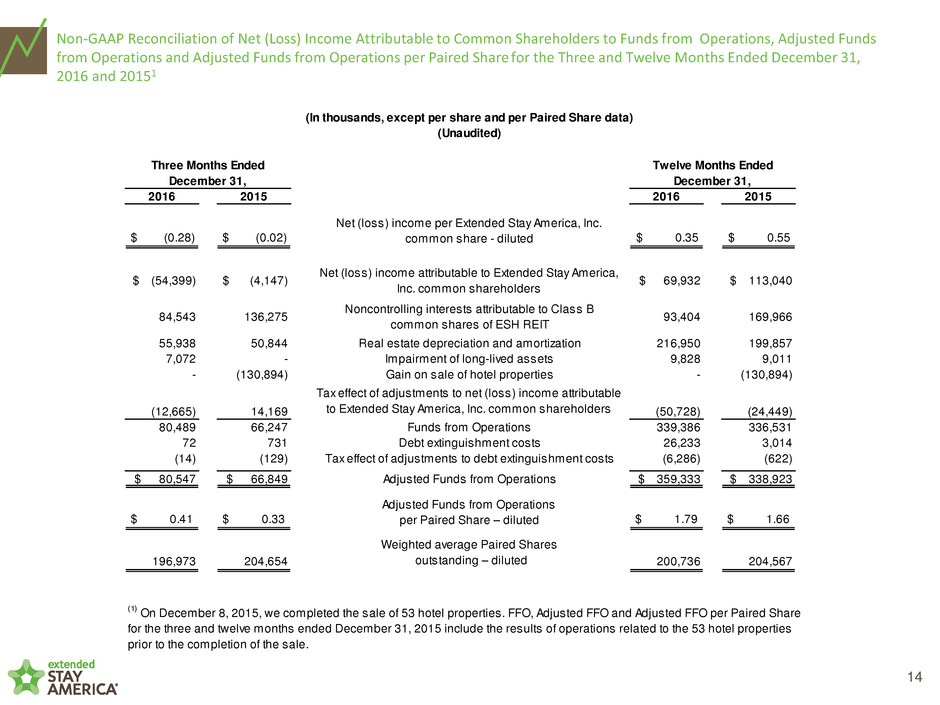
14 Non-GAAP Reconciliation of Net (Loss) Income Attributable to Common Shareholders to Funds from Operations, Adjusted Funds from Operations and Adjusted Funds from Operations per Paired Share for the Three and Twelve Months Ended December 31, 2016 and 20151 2016 2015 2016 2015 $ (0.28) $ (0.02) Net (loss) income per Extended Stay America, Inc. common share - diluted $ 0.35 $ 0.55 $ (54,399) $ (4,147) Net (loss) income attributable to Extended Stay America, Inc. common shareholders $ 69,932 $ 113,040 84,543 136,275 Noncontrolling interests attributable to Class B common shares of ESH REIT 93,404 169,966 55,938 50,844 Real estate depreciation and amortization 216,950 199,857 7,072 - Impairment of long-lived assets 9,828 9,011 - (130,894) Gain on sale of hotel properties - (130,894) (12,665) 14,169 Tax effect of adjustments to net (loss) income attributable to Extended Stay America, Inc. common shareholders (50,728) (24,449) 80,489 66,247 Funds from Operations 339,386 336,531 72 731 Debt extinguishment costs 26,233 3,014 (14) (129) Tax effect of adjustments to debt extinguishment costs (6,286) (622) $ 80,547 $ 66,849 Adjusted Funds from Operations $ 359,333 $ 338,923 $ 0.41 $ 0.33 Adjusted Funds from Operations per Paired Share – diluted $ 1.79 $ 1.66 196,973 204,654 Weighted average Paired Shares outstanding – diluted 200,736 204,567 (In thousands, except per share and per Paired Share data) (Unaudited) (1) On December 8, 2015, we completed the sale of 53 hotel properties. FFO, Adjusted FFO and Adjusted FFO per Paired Share for the three and twelve months ended December 31, 2015 include the results of operations related to the 53 hotel properties prior to the completion of the sale. Three Months Ended Twelve Months Ended December 31, December 31,
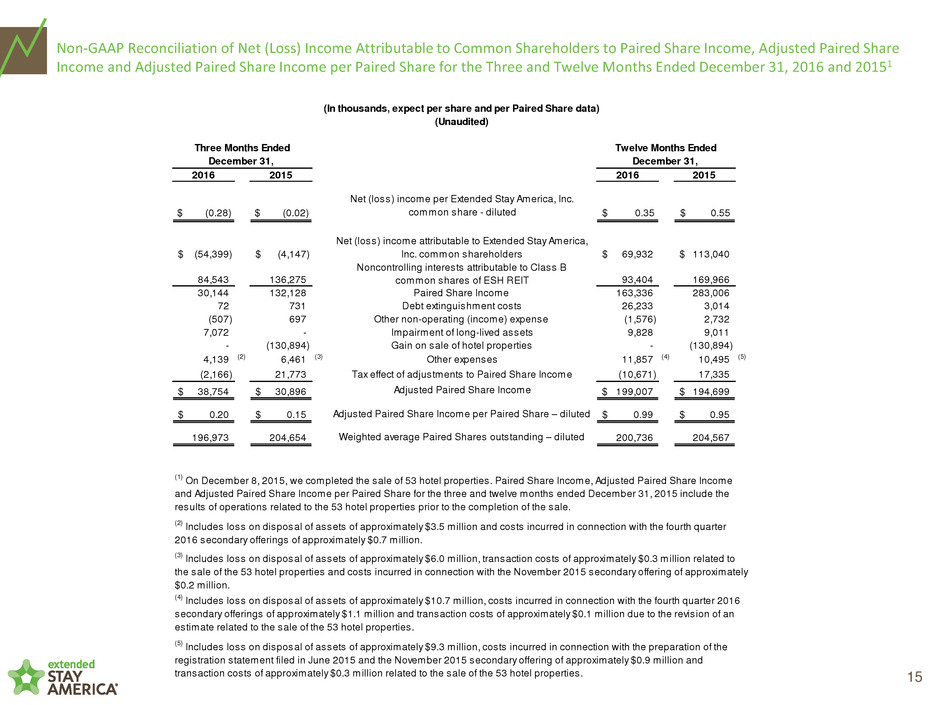
15 Non-GAAP Reconciliation of Net (Loss) Income Attributable to Common Shareholders to Paired Share Income, Adjusted Paired Share Income and Adjusted Paired Share Income per Paired Share for the Three and Twelve Months Ended December 31, 2016 and 20151 2016 2015 2016 2015 $ (0.28) $ (0.02) Net (loss) income per Extended Stay America, Inc. common share - diluted $ 0.35 $ 0.55 (54,399)$ (4,147)$ Net (loss) income attributable to Extended Stay America, Inc. common shareholders 69,932$ 113,040$ 84,543 136,275 Noncontrolling interests attributable to Class B common shares of ESH REIT 93,404 169,966 30,144 132,128 Paired Share Income 163,336 283,006 72 731 Debt extinguishment costs 26,233 3,014 (507) 697 Other non-operating (income) expense (1,576) 2,732 7,072 - Impairment of long-lived assets 9,828 9,011 - (130,894) Gain on sale of hotel properties - (130,894) 4,139 (2) 6,461 (3) Other expenses 11,857 (4) 10,495 (5) (2,166) 21,773 Tax effect of adjustments to Paired Share Income (10,671) 17,335 38,754$ 30,896$ Adjusted Paired Share Income 199,007$ 194,699$ 0.20$ 0.15$ Adjusted Paired Share Income per Paired Share – diluted 0.99$ 0.95$ 196,973 204,654 Weighted average Paired Shares outstanding – diluted 200,736 204,567 (In thousands, expect per share and per Paired Share data) (Unaudited) (4) Includes loss on disposal of assets of approximately $10.7 million, costs incurred in connection with the fourth quarter 2016 secondary offerings of approximately $1.1 million and transaction costs of approximately $0.1 million due to the revision of an estimate related to the sale of the 53 hotel properties. (5) Includes loss on disposal of assets of approximately $9.3 million, costs incurred in connection with the preparation of the registration statement filed in June 2015 and the November 2015 secondary offering of approximately $0.9 million and transaction costs of approximately $0.3 million related to the sale of the 53 hotel properties. Three Months Ended Twelve Months Ended December 31, December 31, (2) Includes loss on disposal of assets of approximately $3.5 million and costs incurred in connection with the fourth quarter 2016 secondary offerings of approximately $0.7 million. (3) Includes loss on disposal of assets of approximately $6.0 million, transaction costs of approximately $0.3 million related to the sale of the 53 hotel properties and costs incurred in connection with the November 2015 secondary offering of approximately $0.2 million. (1) On December 8, 2015, we completed the sale of 53 hotel properties. Paired Share Income, Adjusted Paired Share Income and Adjusted Paired Share Income per Paired Share for the three and twelve months ended December 31, 2015 include the results of operations related to the 53 hotel properties prior to the completion of the sale.