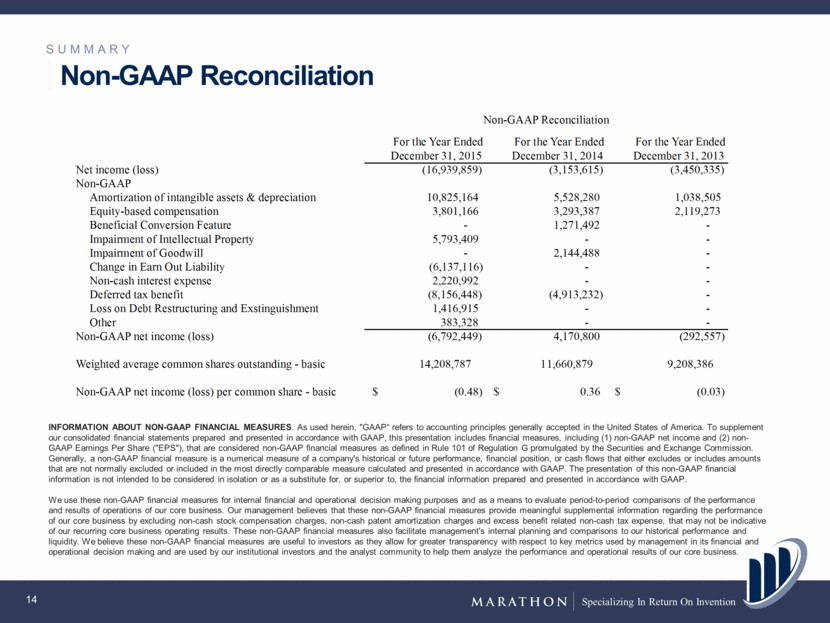
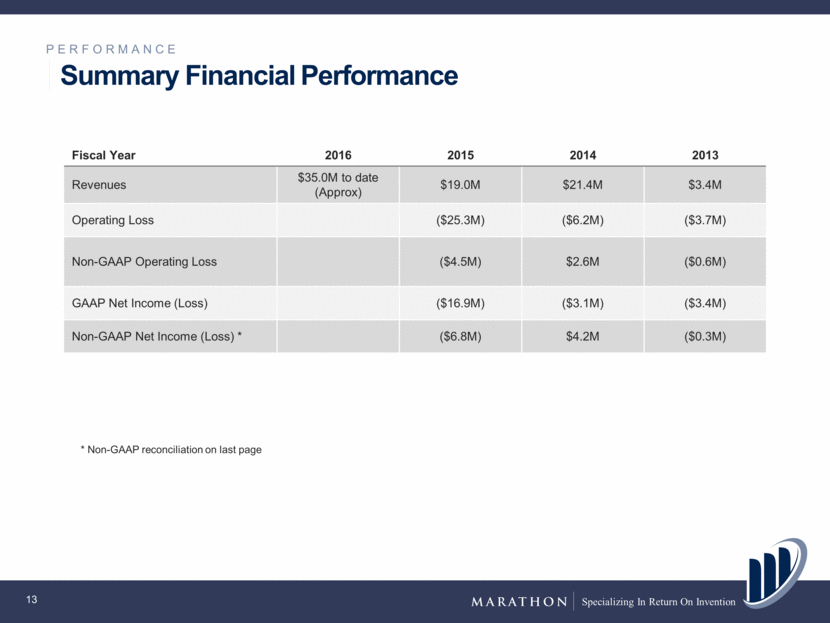
SUMMARY Non-GAAP Reconciliation 14 INFORMATION ABOUT NON-GAAP FINANCIAL MEASURES. As used herein, "GAAP“ refers to accounting principles generally accepted in the United States of America. To supplement our consolidated financial statements prepared and presented in accordance with GAAP, this presentation includes financial measures, including (1) non-GAAP net income and (2) non-GAAP Earnings Per Share ("EPS"), that are considered non-GAAP financial measures as defined in Rule 101 of Regulation G promulgated by the Securities and Exchange Commission. Generally, a non-GAAP financial measure is a numerical measure of a company's historical or future performance, financial position, or cash flows that either excludes or includes amounts that are not normally excluded or included in the most directly comparable measure calculated and presented in accordance with GAAP. The presentation of this non-GAAP financial information is not intended to be considered in isolation or as a substitute for, or superior to, the financial information prepared and presented in accordance with GAAP. We use these non-GAAP financial measures for internal financial and operational decision making purposes and as a means to evaluate period-to-period comparisons of the performance and results of operations of our core business. Our management believes that these non-GAAP financial measures provide meaningful supplemental information regarding the performance of our core business by excluding non-cash stock compensation charges, non-cash patent amortization charges and excess benefit related non-cash tax expense, that may not be indicative of our recurring core business operating results. These non-GAAP financial measures also facilitate management's internal planning and comparisons to our historical performance and liquidity. We believe these non-GAAP financial measures are useful to investors as they allow for greater transparency with respect to key metrics used by management in its financial and operational decision making and are used by our institutional investors and the analyst community to help them analyze the performance and operational results of our core business. F or t he Y e a r E nde d D e c e m be r 31, 2015 F or t he Y e a r E nde d D e c e m be r 31, 2014 F or t he Y e a r E nde d D e c e m be r 31, 2013 N e t i nc om e (l os s ) (16,939,859) (3,153,615) (3,450,335) N on-G A A P A m ort i z a t i on of i nt a ngi bl e a s s e t s & de pre c i a t i on 10,825,164 5,528,280 1,038,505 E qui t y-ba s e d c om pe ns a t i on 3,801,166 3,293,387 2,1 19,273 Be ne fi c i a l Conve rs i on F e a t ure - 1,271,492 - Im pa i rm e nt of Int e l l e c t ua l P rope rt y 5,793,409 - - Im pa i rm e nt of G oodw i l l - 2,144,488 - Cha nge i n E a rn O ut L i a bi l i t y (6,137,1 16) - - N on-c a s h i nt e re s t e xpe ns e 2,220,992 - - D e fe rre d t a x be ne fi t (8,156,448) (4,913,232) - L os s on D e bt Re s t ruc t uri ng a nd E xs t i ngui s hm e nt 1,416,915 - - O t he r 383,328 - - N on-G A A P ne t i nc om e (l os s ) (6,792,449) 4,170,800 (292,557) N on-G A A P Re c onc i l i a t i on W e i ght e d a ve ra ge c om m on s ha re s out s t a ndi ng - ba s i c 14,208,787 1 1,660,879 9,208,386 N on-G A A P ne t i nc om e (l os s ) pe r c om m on s ha re - ba s i c (0.48) $ 0.36 $ (0.03) $
