united states
securities and exchange commission
washington, d.c. 20549
form n-csr
certified shareholder report of registered management
investment companies
Investment Company Act file number 811-22512
Variable Insurance Trust
(Exact name of registrant as specified in charter)
17605 Wright Street Omaha, Nebraska 68130
(Address of principal executive offices) (Zip code)
James Ash, Gemini Fund Services, LLC.
80 Arkay Dr, Suite 110, Hauppauge, NY 11788
(Name and address of agent for service)
Registrant's telephone number, including area code: 631-470-2619
Date of fiscal year end: 12/31
Date of reporting period: 12/31/2014
ITEM 1. REPORTS TO SHAREHOLDERS.
| Annual Report |
| |
| Barrier Fund Portfolio |
| |
| December 31, 2014 |
| |
| |
| |
| |
| |
| Mutuals Advisors, Inc. |
| 700 North Pearl St. |
| Suite 900 |
| Dallas, TX 75201 |
Dear Shareholder:
Financial Conditions During Fiscal Year. The US Fiscal Deficit has continued to decline for the third year in a row, yet the 2014 deficit of $492 billion it is still more than triple the deficit posted before the “financial crisis” (2007 deficit $161 billion). During the fourth quarter of 2014, The Federal Reserve ended its asset purchases called “quantitative easing.” During the three implementations of Federal Reserve quantitative easing, the balance sheet of the Federal Reserve increased from $891 billion in 2007 to $4.238 trillion in December 2014. Essentially the Federal Reserve has financed the overspending of the US Government by purchasing Treasuries and supported the housing market by purchasing mortgage securities. With the unprecedented amount of stimulus, the US economy has had the worst recovery from recession since the Great Depression.
During the fiscal year ended on December 31, 2014, the stated household unemployment rate decreased from 6.7% to 5.6% as the Labor Force Participation rate decline has stabilized. The Labor Force Participation rate remains at a level that is the lowest it has been in 40 years. More than half of the decline has been attributed to retiring “Baby Boomers”, a trend that will increase stress on the Medicare and Social Security systems.
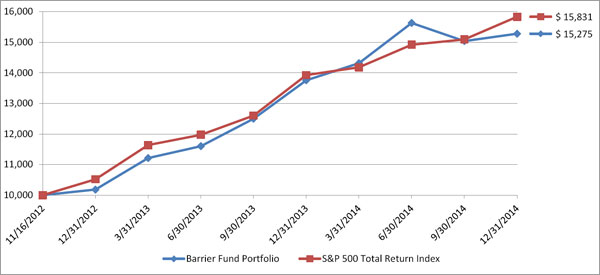
Historical Market Performance of the Barrier Fund Portfolio
During the fiscal year ended December 31, 2014, The Barrier Fund Portfolio (the “Fund”) returned 11.08% with the S&P 500 Index returning 13.69%. From the inception date to December 31, 2014, the Fund had an average annual return of 22.08% and the S&P 500 increased by 24.16%. The Fund’s best performing investments were as follows: in the Alcohol sector, Constellation Brands, Inc. increased 39.5%; in the Defense sector, General Dynamics Corp. increased by 47.0%; in the Gaming sector, Boyd Gaming Corp. increased 13.5%; and in the Tobacco sector, Reynolds American Inc. increased 34.5%. The Fund’s weakest holdings by sector were as follows: in the Alcohol sector, Diageo plc decreased 11.4%; in the Defense sector, Sturm Ruger & Company Inc. decreased 51.2%; in the Gaming sector Caesars Entertainment Corp. decreased by 27.2%; and in the Tobacco sector, Phillip Morris International. Inc. decreased by 2.0%.
Outlook
US interest rates are at historical lows and the Federal Reserve is indicating that it will increase short term interest rates from near 0% sometime in 2015. Congress has reached a record of tax receipts in 2014, yet has continued to spend more than it received. Economic uncertainty will continue to shake the markets at times and the equity markets will undoubtedly have a tougher year than 2014. With that in mind, the defensive growth strategy deployed by The Barrier Fund Portfolio should provide diversification to your portfolio.
Gerald P. Sullivan
Portfolio Manager
Barrier Fund Portfolio
PORTFOLIO REVIEW (Unaudited)
December 31, 2014
The Fund’s performance figures* for the periods ended December 31, 2014, as compared to its benchmark:
| | One Year | Since Inception** |
| Barrier Fund Portfolio | 11.08% | 22.08% |
| S&P 500 Total Return Index*** | 13.69% | 24.16% |
| * | The performance data quoted is historical. Past performance is no guarantee of future results. Current performance may be higher or lower than the performance data quoted. The principal value and investment return of an investment will fluctuate so that your shares, when redeemed, may be worth more or less than their original cost. The returns shown do not reflect the deduction of taxes that a shareholder would pay on Portfolio distributions or on the redemptions of Portfolio shares as well as other charges and expenses of the insurance contract or separate account. The Portfolio’s investment advisor has contractually agreed to reduce its fees and/or absorb expenses of the Portoflio, at least until April 30, 2015, to ensure that the net annual Portfolio operating expenses, will not exceed 1.75% subject to possible recoupment from the Portfolio in future years. Without these waivers, the Portfolio’s total annual operating expenses, including underlying funds, would have been 1.87%, per the most recent prospectus. For performance information current to the most recent month-end, please call 1-866-447-4228. |
| ** | Inception date is November 16, 2012. |
| *** | The Standard & Poor’s (S&P) 500 Total Return Index tracks the performance of 500 widely held, large-capitalization U.S. stocks. Index returns assume reinvestment of dividends. Investors may not invest in the Index directly; unlike the Fund’s returns, the Index does not reflect any fees or expenses. |
| Holdings By Sector | | % of Net Assets | |
| Agriculture | | | 22.8 | % |
| Beverages | | | 22.3 | % |
| Aerospace/Defense | | | 18.0 | % |
| Lodging | | | 16.1 | % |
| Entertainment | | | 4.2 | % |
| Electronics | | | 3.9 | % |
| Miscellaneous Manufacturing | | | 1.0 | % |
| Investment Companies | | | 0.3 | % |
| Other, Cash & Cash Equivalents | | | 11.4 | % |
| | | | 100.0 | % |
Please refer to the Schedule of Investments in this annual report for a detailed analysis of the Portfolio’s holdings.
Barrier Fund Portfolio
SCHEDULE OF INVESTMENTS
December 31, 2014
| Shares | | | | | Value | |
| | | | | | | | | |
| | | | | COMMON STOCKS - 88.6% | | | | |
| | | | | AEROSPACE/DEFENSE - 18.0% | | | | |
| | 150 | | | Boeing Co. | | $ | 19,497 | |
| | 75 | | | General Dynamics Corp. | | | 10,321 | |
| | 75 | | | Northrop Grumman Corp. | | | 11,054 | |
| | 150 | | | Raytheon Company | | | 16,226 | |
| | 100 | | | United Technologies Corp. | | | 11,500 | |
| | | | | | | | 68,598 | |
| | | | | AGRICULTURE - 22.8% | | | | |
| | 400 | | | Altria Group, Inc. | | | 19,708 | |
| | 350 | | | Lorillard, Inc. | | | 22,029 | |
| | 200 | | | Philip Morris International, Inc. | | | 16,290 | |
| | 450 | | | Reynolds American, Inc. | | | 28,921 | |
| | | | | | | | 86,948 | |
| | | | | BEVERAGES - 22.3% | | | | |
| | 850 | | | Ambev SA | | | 5,287 | |
| | 150 | | | Anheuser-Busch InBev | | | 16,848 | |
| | 250 | | | Brown-Forman Group | | | 21,960 | |
| | 150 | | | Constellation Brands, Inc. Class A * | | | 14,726 | |
| | 130 | | | Diageo PLC | | | 14,832 | |
| | 150 | | | Molson Coors Brewing Co. Class B | | | 11,178 | |
| | | | | | | | 84,831 | |
| | | | | ELECTRONICS - 3.9% | | | | |
| | 150 | | | Honeywell International, Inc. | | | 14,988 | |
| | | | | | | | | |
| | | | | ENTERTAINMENT - 4.2% | | | | |
| | 100 | | | Churchill Downs, Inc. | | | 9,530 | |
| | 300 | | | International Game Technology | | | 5,175 | |
| | 100 | | | Penn National Gaming, Inc. * | | | 1,373 | |
| | | | | | | | 16,078 | |
| | | | | INVESTMENT COMPANIES - 0.3% | | | | |
| | 100 | | | Ceasars Acquisition Co. * | | | 1,031 | |
| | | | | | | | | |
| | | | | LODGING - 16.1% | | | | |
| | 350 | | | Boyd Gaming * | | | 4,473 | |
| | 250 | | | Caesars Entertainment Corp. * | | | 3,923 | |
| | 300 | | | Las Vegas Sands Corp. | | | 17,448 | |
| | 800 | | | MGM Resorts International * | | | 17,104 | |
| | 125 | | | Wynn Resorts, Ltd. | | | 18,595 | |
| | | | | | | | 61,543 | |
| | | | | MISCELLANEOUS MANUFACTURING - 1.0% | | | | |
| | 400 | | | Smith & Wesson Holding Corp. * | | | 3,788 | |
| | | | | | | | | |
| | | | | | | | | |
| | | | | TOTAL COMMON STOCKS (Cost $338,074) | | | 337,805 | |
The accompanying notes are an integral part of these financial statements.
Barrier Fund Portfolio
SCHEDULE OF INVESTMENTS (Continued)
December 31, 2014
| Shares | | | | | Value | |
| | | | | | | | | |
| | | | | SHORT-TERMINVESTMENTS - 3.5% | | | | |
| | 13,240 | | | Fidelity Government Insitutional Money Market Fund - Class I, 0.07%** | | $ | 13,240 | |
| | | | | (Cost $13,240) | | | | |
| | | | | | | | | |
| | | | | TOTAL INVESTMENTS IN SECURITIES - 92.1 % (Cost $351,314) (a) | | $ | 351,045 | |
| | | | | OTHER ASSETS IN EXCESS OF LIABILITIES - 7.9 % | | | 30,154 | |
| | | | | TOTAL NET ASSETS - 100.0% | | $ | 381,199 | |
| * | Non-Income producing security. |
| ** | Interest rate reflects seven-day effective yield on December 31, 2014. |
| (a) | Represents cost for financial reporting purposes. Aggregate cost for federal tax purposes is $355,889 and differs from fair value by net unrealized appreciation (depreciation) of securities as follows: |
| Unrealized appreciation | | $ | 16,830 | |
| Unrealized depreciation | | | (21,674 | ) |
| Net unrealized depreciation | | $ | (4,844 | ) |
The accompanying notes are an integral part of these financial statements.
BARRIER FUND PORTFOLIO
STATEMENT OF ASSETS AND LIABILITIES
December 31, 2014
| Assets: | | | | |
| Investments securities | | | | |
| At cost | | $ | 351,314 | |
| At value | | $ | 351,045 | |
| Due from Advisor | | | 29,396 | |
| Dividends and interest receivable | | | 851 | |
| Receivable for Portfolio shares sold | | | 3,583 | |
| Prepaid expenses and other assets | | | 20 | |
| Total Assets | | | 384,895 | |
| | | | | |
| Liabilities: | | | | |
| Distribution (12b-1) fees payable | | | 90 | |
| Fees payable to other affiliates | | | 1,288 | |
| Accrued expenses and other liabilities | | | 2,318 | |
| Total Liabilities | | | 3,696 | |
| | | | | |
| Net Assets | | $ | 381,199 | |
| | | | | |
| Composition of Net Assets: | | | | |
| Paid in capital | | $ | 253,040 | |
| Undistributed net investment income | | | 10,536 | |
| Accumulated net realized gain from investment transactions and options written | | | 117,892 | |
| Net unrealized depreciation on investment transactions | | | (269 | ) |
| | | | | |
| Net Assets | | $ | 381,199 | |
| | | | | |
| Shares outstanding (unlimited number of shares authorized without par value) | | | 26,185 | |
| | | | | |
| Net asset value (net assets ÷ shares outstanding), offering price and redemption price per share | | $ | 14.56 | |
The accompanying notes are an integral part of these financial statements.
BARRIER FUND PORTFOLIO
STATEMENT OF OPERATIONS
For the Year Ended December 31, 2014
| Investment Income: | | | | |
| Dividends (Net of foreign tax withheld $109) | | $ | 22,023 | |
| Interest | | | 11 | |
| Total Investment Income | | | 22,034 | |
| | | | | |
| Expenses: | | | | |
| Advisory fees | | | 5,847 | |
| Distribution (12b-1) fees | | | 878 | |
| Professional Fees | | | 15,001 | |
| Legal fees | | | 12,295 | |
| Transfer agent fees | | | 12,270 | |
| Audit fees | | | 11,993 | |
| Custody fees | | | 6,048 | |
| MFund service fees | | | 5,635 | |
| Printing expense | | | 4,321 | |
| Trustees’ fees | | | 3,942 | |
| Administration fees | | | 1,715 | |
| Fund accounting fees | | | 345 | |
| Other expenses | | | 125 | |
| Total expenses | | | 80,415 | |
| | | | | |
| Less: Fees waived and expenses reimbursed by the Advisor | | | (69,663 | ) |
| Net expenses | | | 10,752 | |
| | | | | |
| Net Investment Income | | | 11,282 | |
| | | | | |
| Realized and Unrealized Gain (Loss): | | | | |
| Net realized gain from: | | | | |
| Investment transactions | | | 115,820 | |
| Options written | | | 4,140 | |
| | | | 119,960 | |
| Net change in unrealized depreciation on: | | | | |
| Investment transactions | | | (78,607 | ) |
| Options written | | | (112 | ) |
| | | | (78,719 | ) |
| | | | | |
| Net Realized and Unrealized Gain | | | 41,241 | |
| | | | | |
| Net Increase in Net Assets Resulting From Operations | | $ | 52,523 | |
The accompanying notes are an integral part of these financial statements.
BARRIER FUND PORTFOLIO
STATEMENTS OF CHANGES IN NET ASSETS
| | | For the | | | For the | |
| | | Year Ended | | | Year Ended | |
| | | December 31, 2014 | | | December 31, 2013 | |
| Net Increase (Decrease) in Net Assets Resulting From Operations: | | | | | | | | |
| Net investment income | | $ | 11,282 | | | $ | 3,038 | |
| Net realized gain from investment transactions and options written | | | 119,960 | | | | 11,253 | |
| Net change in unrealized appreciation (depreciation) on investment transactions and options written | | | (78,719 | ) | | | 78,991 | |
| | | | | | | | | |
| Net increase in net assets resulting from operations | | | 52,523 | | | | 93,282 | |
| | | | | | | | | |
| Distributions: | | | | | | | | |
| From net investment income | | | (3,040 | ) | | | (1,554 | ) |
| From net realized gains | | | (13,956 | ) | | | (773 | ) |
| Net decrease in net assets from distributions | | | (16,996 | ) | | | (2,327 | ) |
| | | | | | | | | |
| From Shares of Beneficial Interest: | | | | | | | | |
| Proceeds from shares sold | | | 772,906 | | | | 1,620,795 | |
| Reinvestment of dividends | | | 16,996 | | | | 2,327 | |
| Payments for shares redeemed | | | (1,565,112 | ) | | | (716,439 | ) |
| Net increase (decrease) in net assets from shares of beneficial interest | | | (775,210 | ) | | | 906,683 | |
| | | | | | | | | |
| Net Increase (Decrease) in Net Assets | | | (739,683 | ) | | | 997,638 | |
| | | | | | | | | |
| Net Assets: | | | | | | | | |
| Beginning of Year | | | 1,120,882 | | | | 123,244 | |
| End of Year* | | $ | 381,199 | | | $ | 1,120,882 | |
| * Includes undistributed net investment income of: | | $ | 10,536 | | | $ | 3,038 | |
| | | | | | | | | |
| Share Activity: | | | | | | | | |
| Shares sold | | | 51,873 | | | | 133,842 | |
| Shares reinvested | | | 1,193 | | | | 186 | |
| Shares redeemed | | | (108,594 | ) | | | (64,432 | ) |
| Net Increase (Decrease) in Shares | | | (55,528 | ) | | | 69,596 | |
The accompanying notes are an integral part of these financial statements.
BARRIER FUND PORTFOLIO
FINANCIAL HIGHLIGHTS
(For a share outstanding throughout each period presented)
| | | For the | | | For the | | | For the | |
| | | Year Ended | | | Year Ended | | | Period Ended | |
| | | December 31, | | | December 31, | | | December 31, | |
| | | 2014 | | | 2013 | | | 2012 (1) | |
| Net Asset Value, Beginning of Period | | $ | 13.72 | | | $ | 10.17 | | | $ | 10.00 | |
| Income From Investment Operations: | | | | | | | | | | | | |
| Net investment income (2) | | | 0.26 | | | | 0.08 | | | | 0.14 | |
| Net realized and unrealized gain from investment transactions and options written | | | 1.25 | | | | 3.50 | | | | 0.03 | |
| Total from investment operations | | | 1.51 | | | | 3.58 | | | | 0.17 | |
| | | | | | | | | | | | | |
| Less Distributions: | | | | | | | | | | | | |
| | | | | | | | | | | | | |
| From net investment income | | | (0.12 | ) | | | (0.02 | ) | | | — | |
| From net realized gains | | | (0.55 | ) | | | (0.01 | ) | | | — | |
| Total distributions | | | (0.67 | ) | | | (0.03 | ) | | | — | |
| | | | | | | | | | | | | |
| Net Asset Value, End of Period | | $ | 14.56 | | | $ | 13.72 | | | $ | 10.17 | |
| | | | | | | | | | | | | |
| Total Return (3) | | | 11.08 | % | | | 35.21 | % | | | 1.70 | % (5) |
| | | | | | | | | | | | | |
| Ratios/Supplemental Data: | | | | | | | | | | | | |
| Net assets, end of period (000s) | | $ | 381 | | | $ | 1,121 | | | $ | 123 | |
| Ratio of gross expenses to average net assets (4)(7) | | | 13.10 | % | | | 17.47 | % | | | 90.81 | % (6) |
| Ratio of net expenses to average net assets (7) | | | 1.75 | % | | | 1.75 | % | | | 1.75 | % (6) |
| Ratio of net investment income to average net assets (7)(8) | | | 1.84 | % | | | 0.65 | % | | | 12.00 | % (6) |
| Portfolio Turnover Rate | | | 120 | % | | | 157 | % | | | 62 | % (5) |
| (1) | The Barrier Fund Portfolio commenced operations on November 16, 2012. |
| (2) | Per share amounts calculated using the average shares method. |
| (3) | Total return in the above table represents the rate that the investor would have earned or lost in an investment in the Portfolio. Had the Advisor not waived or reimbursed a portion of the Portfolio’s expenses, total return would have been lower. |
| (4) | Represents the ratio of expenses to average net assets absent fee waivers and/or expense reimbursements by the Advisor. |
| (7) | The ratios of expenses to average net assets and net investment income to average net assets do not reflect the expenses of the underlying investment companies in which the Portfolio invests. |
| (8) | Recognition of net investment income is affected by the timing and declaration of dividends by the underlying investment companies in which the Portfolio invests. |
The accompanying notes are an integral part of these financial statements.
| BARRIER FUND PORTFOLIO |
| |
| NOTES TO FINANCIAL STATEMENTS |
| |
| December 31, 2014 |
| |
| (1) | ORGANIZATION AND SIGNIFICANT ACCOUNTING POLICIES |
Variable Insurance Trust (the “Trust”), was organized as an Ohio business trust on December 8, 2010. The Trust is registered as an open-end management investment company under the Investment Company Act of 1940, as amended, (“1940 Act”). These financial statements include only the Barrier Fund Portfolio (the “Portfolio”), formerly known as the Vice Fund Portfolio, a series of the Trust. The Portfolio is registered as non-diversified. The Portfolio’s investment advisor is Mutuals Advisors, Inc. (the “Advisor”).
Barrier Fund Portfolio commenced operations on November 16, 2012. The Portfolio’s objective is to achieve long-term growth of capital.
The following is a summary of significant accounting policies consistently followed by the Portfolio which are in accordance with accounting principles generally accepted in the United States of America (“GAAP”).
a) Securities Valuation - Securities listed on an exchange are valued at the last reported sale price at the close of the regular trading session of the exchange on the business day the value is being determined, or in the case of securities listed on NASDAQ, at the NASDAQ Official Closing Price (“NOCP”). In the absence of a sale, such securities shall be valued at the last bid price on the day of valuation. Debt securities (other than short-term obligations) are valued each day by an independent pricing service approved by the Board of Trustees (the “Board”) using methods which include current market quotations from a major market maker in the securities and based on methods which include the consideration of yields or prices of securities of comparable quality, coupon, maturity and type. The Portfolio may invest in portfolios of open-end or closed-end investment companies and exchange-traded funds (the “underlying funds”). Open-end funds are valued at their respective net asset values as reported by such investment companies. The underlying funds value securities in their portfolios for which market quotations are readily available at their market values (generally the last reported sale price) and all other securities and assets at their fair value by the methods established by the Boards of the underlying funds. The shares of many closed-end investment companies and exchange-traded funds, after their initial public offering, frequently trade at a price per share, which is different than the net asset value per share. The difference represents a market premium or market discount of such shares. There can be no assurances that the market discount or market premium on shares of any closed-end investment company or exchange-traded fund purchased by the Portfolio will not change. Short- term debt obligations having 60 days or less remaining until maturity, at time of purchase, may be valued at amortized cost, provided such valuations represent fair value.
In unusual circumstances, instead of valuing securities in the usual manner, the Portfolio may value securities at “fair value” as determined in good faith by the Portfolio’s Board, pursuant to the procedures (the “Procedures”) approved by the Board. The Procedures consider, among others, the following factors to determine a security’s fair value: the nature and pricing history (if any) of the security; whether any dealer quotations for the security are available; and possible valuation methodologies that could be used to determine the fair value of the security. Fair value may also be used by the Board if extraordinary events occur after the close of the relevant world market but prior to the New York Stock Exchange close.
The Portfolio utilizes various methods to measure the fair value of most of its investments on a recurring basis. GAAP establishes a hierarchy that prioritizes inputs to valuation methods. The three levels of input are:
Level 1 – Unadjusted quoted prices in active markets for identical assets and liabilities that the Portfolio has the ability to access.
Level 2 – Observable inputs other than quoted prices included in Level 1 that are observable for the asset or liability, either directly or indirectly. These inputs may include quoted prices for the identical instrument in an inactive market, prices for similar instruments, interest rates, prepayment speeds, credit risk, yield curves, default rates and similar data.
| BARRIER FUND PORTFOLIO |
| |
| NOTES TO FINANCIAL STATEMENTS (Continued) |
| |
| December 31, 2014 |
| |
Level 3 – Unobservable inputs for the asset or liability, to the extent relevant observable inputs are not available; representing the Portfolio’s own assumptions about the assumptions a market participant would use in valuing the asset or liability, and would be based on the best information available.
The availability of observable inputs can vary from security to security and is affected by a wide variety of factors, including, for example, the type of security, whether the security is new and not yet established in the marketplace, the liquidity of markets, and other characteristics particular to the security. To the extent that valuation is based on models or inputs that are less observable or unobservable in the market, the determination of fair value requires more judgment. Accordingly, the degree of judgment exercised in determining fair value is greatest for instruments categorized in Level 3.
The inputs used to measure fair value may fall into different levels of the fair value hierarchy. In such cases, for disclosure purposes, the level in the fair value hierarchy within which the fair value measurement falls in its entirety, is determined based on the lowest level input that is significant to the fair value measurement in its entirety.
The inputs or methodology used for valuing securities are not necessarily an indication of the risk associated with investing in those securities. The following tables summarize the inputs used as of December 31, 2014 for the Portfolio’s assets and liabilities measured at fair value:
| Assets | | | | | | | | | |
| | | | | | | | | | |
| | | | | | Level 2 | | | | |
| | | Level 1 | | | (Other Significant | | | | |
| Security Classifications (a) | | (Quoted Prices) | | | Observable Inputs) | | | Total | |
| Common Stocks (b) | | $ | 337,805 | | | $ | — | | | $ | 337,805 | |
| Short-Term Investments | | | 13,240 | | | | — | | | | 13,240 | |
| Total | | $ | 351,045 | | | $ | — | | | $ | 351,045 | |
| | | | | | | | | | | | | |
| (a) | As of and during the year ended December 31, 2014, the Portfolio held no securities that were considered to be “Level 3” securities (those valued using significant unobservable inputs). Therefore, a reconciliation of assets in which significant unobservable inputs (Level 3) were used in determining fair value is not applicable. There were no transfers into and out of Level 1 and 2 during the current period presented. It is the Portfolio’s policy to recognize transfers into and out of Level 1 and 2 at the end of the reporting period. |
| (b) | All common stock held by the Portfolio are Level 1 securities. For a detailed break-out by major industry classification, please refer to the Schedule of Investments. |
b) Accounting for Options - The Portfolio is subject to equity price risk in the normal course of pursuing its investment objective and may purchase or sell options to help hedge against risk. When the Portfolio writes a call option, an amount equal to the premium received is included in the statement of assets and liabilities as a liability. The amount of liability is subsequently marked-to-market to reflect the current market value of the option. If an option expires on its stipulated expiration date or if the Portfolio enters into a closing purchase transaction, a gain or loss is realized. If a written call option is exercised, a gain or loss is realized for the sale of the underlying security and the proceeds from the sale are increased by the premium originally received. As a writer of an option, the Portfolio has no control over whether the option will be exercised and, as a result, retains the market risk of an unfavorable change in the price of the security underlying the written option.
| BARRIER FUND PORTFOLIO |
| |
| NOTES TO FINANCIAL STATEMENTS (Continued) |
| |
| December 31, 2014 |
| |
The effect of derivative instruments on the Statement of Operations for the year ended December 31, 2014 was as follows:
| Derivatives | | | | | | | |
| Not | | | | | | | |
| Accounted for | | | | | | Realized and Unrealized | |
| as Hedging | | Primary | | | | Gain (Loss) on Liability | |
| Instruments | | Risk | | Location of Gain on Derivatives | | Derivatives Recognized | |
| under GAAP | | Exposure | | Recognized in Income | | in Income | |
| | | | | | | | | |
| Options written | | Equity Risk | | Net realized gain from options written | | $ | 4,140 | |
| | | | | | | | | |
| Options written | | Equity Risk | | Net change in unrealized depreciation on options written | | | (112 | ) |
| Total | | | | | | $ | 4,028 | |
The contracts in the table in Note 3 are an indication of volume in the Portfolio’s derivative activity.
c) Federal Income Tax - The Portfolio has qualified and intends to continue to qualify as a regulated investment company and to comply with the applicable provisions of the Internal Revenue Code of 1986, as amended, and to distribute substantially all of its taxable income to its shareholders. Therefore, no federal income tax provisions are required.
As of and during the year ended December 31, 2014, the Portfolio did not have a liability for any unrecognized tax expense. The Portfolio recognizes interest and penalties, if any, related to unrecognized tax expense as income tax expense in the Statement of Operations. During the year ended December 31, 2014, the Portfolio did not incur any interest or penalties. Management has analyzed the Portfolio’s tax positions, and has concluded that no liability for unrecognized tax benefits should be recorded related to uncertain tax positions taken on returns filed for open tax years (2012 and 2013), or expected to be taken in the Portfolio’s 2014 tax return. The tax filings are open for examination by applicable taxing authorities, U.S. Federal, Nebraska, and foreign jurisdictions. No examination of the Portfolio’s tax returns is presently in progress.
d) Distribution to Shareholders - Distributions to shareholders, which are determined in accordance with income tax regulations and may differ from GAAP are recorded on the ex-dividend date. Dividends from net investment income, if any, are declared and paid at least annually. Distributable net realized gains, if any, are declared and distributed annually.
e) Other - Investment and shareholder transactions are recorded on trade date. The Portfolio determines the gain or loss realized from the investment transactions by comparing the original cost of the security lot sold with the net sales proceeds. Dividend income is recognized on the ex-dividend date or as soon as information is available to the Portfolio and interest income is recognized on an accrual basis. Discounts and premiums on debt securities are amortized over their respective lives using the effective interest method. Withholding taxes on foreign dividends have been provided for in accordance with the Portfolio’s understanding of the applicable country’s tax rules and rates.
f) Use of Estimates - The preparation of financial statements in conformity with GAAP requires management to make estimates and assumptions that affect the reported amounts of assets and liabilities and disclosure of contingent assets and liabilities at the date of the financial statements and the reported amounts of revenues and expenses during the reporting period. Actual results could differ from those estimates.
| BARRIER FUND PORTFOLIO |
| |
| NOTES TO FINANCIAL STATEMENTS (Continued) |
| |
| December 31, 2014 |
| |
g) Commitments and Contingencies - In the normal course of business, the Trust may enter into contracts that contain a variety of representations and warranties and provide general indemnifications. The Portfolio’s maximum exposure under these arrangements is dependent on future claims that may be made against the Portfolio and, therefore, cannot be estimated; however, management considers the risk of loss from such claims to be remote.
| (2) | INVESTMENT TRANSACTIONS |
For the year ended December 31, 2014, aggregate purchases and proceeds from sales of investment securities (excluding short-term investments) for the Portfolio were as follows:
| Purchases | | | Sales | |
| $ | 685,171 | | | $ | 1,477,348 | |
| | | | | | | |
There were no government securities purchased or sold during the period.
A summary of option contracts written by the Portfolio during the year ended December 31, 2014, were as follows:
| | | Call Options | |
| | | Number of Options* | | | Option Premiums | |
| Options outstanding at beginning of year | | | 37 | | | | 3,724 | |
| Options written | | | 19 | | | | 3,022 | |
| Options exercised | | | (13 | ) | | | (2,145 | ) |
| Options expired | | | (31 | ) | | | (2,211 | ) |
| Options closed | | | (12 | ) | | | (2,390 | ) |
| Options outstanding at the end of year | | | 0 | | | | 0 | |
| | | | | | | | | |
| * | One option contract is equivalent to one hundred shares of common stock. |
| (4) | ADVISORY AGREEMENT AND OTHER RELATED PARTY TRANSACTIONS |
Mutuals Advisors, Inc. is the Advisor to the Portfolio pursuant to the terms of the Investment Advisory Agreement (the “Advisory Agreement”). Under the terms of the Advisory Agreement, the Advisor manages the investment operations of the Portfolio in accordance with the Portfolio’s investment policies and restrictions. The Advisor provides the Portfolio with investment advice and supervision and furnishes an investment program for the Portfolio. For its services under the Investment Advisory Agreement, the Advisor is paid a monthly management fee at the annual rate of 0.95% of the average daily net assets of the Portfolio. The Advisor pays expenses incurred by it in connection with acting as advisor, other than costs (including taxes and brokerage commissions, borrowing costs, costs of investing in underlying funds and extraordinary expenses, if any) of securities purchased for the Portfolio and other expenses paid by the Portfolio as detailed in the Advisory Agreement. The Advisor pays for all employees, office space and facilities required by it to provide services under the Advisory Agreement, with the exception of specific items of expense (as detailed in the Advisory Agreement). For the year ended December 31, 2014, advisory fees of $5,847 were incurred by the Portfolio, before the waiver and reimbursement described below. As of December 31, 2014 the Advisor owed the Fund $29,396, of which $24,096 has since been collected.
The Advisor and the Portfolio have entered into an Expense Limitation Agreement under which the Advisor has contractually agreed to waive fees and/or reimburse expenses but only to the extent necessary to maintain total annual operating expenses (excluding 12b-1 fees, brokerage costs; borrowing costs, such as (a)
| BARRIER FUND PORTFOLIO |
| |
| NOTES TO FINANCIAL STATEMENTS (Continued) |
| |
| December 31, 2014 |
| |
interest and (b) dividends on securities sold short; taxes; costs of investing in acquired funds and extraordinary expenses) at 1.25% for the Portfolio’s shares through April 30, 2015. Each waiver or reimbursement by the Advisor is subject to repayment by the Portfolio within the three fiscal years following the fiscal year in which that particular expense is incurred, if the Portfolio is able to make the repayment without exceeding the expense limitation in effect at that time and the repayment is approved by the Board of Trustees.
For the year ended December 31, 2014, the Advisor waived advisory fees and reimbursed expenses of $69,663. For the year ended December 31, 2014, the Advisor may recapture $11,530 of waived advisory fees no later than December 31, 2015, $73,475 no later than December 31, 2016 and $69,663 no later than December 31, 2017.
The Trust has entered into a Management Services Agreement with MFund Services, LLC (“MFund”). Pursuant to the Management Services Agreement, MFund provides sponsorship, management and supervisory services. For MFund’s services to the Portfolio, the Portfolio pays MFund a base fee of $5,000 annually, an annualized asset based fee of 0.10% of average daily net assets up to $50 million, with lower fees at higher asset levels, plus reimbursement of out of pocket expenses. For the year ended December 31, 2014, the Portfolio incurred $5,635 for such fees.
A Trustee and Officer of the Trust is also the controlling member of MFund Services and is not paid any fees directly by the Trust for serving in such capacities.
Gemini Fund Services, LLC (“GFS”) provides administrative, fund accounting, and transfer agency services to the Portfolio pursuant to agreements with the Trust, for which it receives from the Portfolio: (i) basis points in decreasing amounts as assets reach certain breakpoints; and (ii) any related out-of-pocket expenses.
An officer of the Trust is also an employee of GFS, and is not paid any fees directly by the Trust for serving in such capacity.
Effective April 1, 2014 Trustees who are not “interested persons” as that term is defined in the 1940 Act of the Portfolio, will be paid a quarterly retainer of $350 and will receive, at the discretion of the Chairman, $500 per Valuation Committee meeting attended, $500 per special telephonic board meeting attended and $2,000 per special in-person meeting attended. Prior to April 1, 2014 Trustees received a quarterly retainer of $250. The fees paid to the Independent Trustees for their attendance at a meeting will be shared equally by the funds of the Trust and Mutual Fund Series Trust in which the meeting relates. The Chairman of the Trust’s Audit Committee receives an additional fee of $400 per fund in the Trusts per year. The “interested persons” of the Trusts receive no compensation from the Portfolio. The Trusts reimburse each Trustee and Officer for his or her travel and other expenses related to attendance at such meetings.
The Trust has adopted a Distribution Plan pursuant to Rule 12b-1 under the 1940 Act, that allows the Portfolio to pay distribution and shareholder servicing expenses of up to 0.50% per annum for the Class A shares based on average daily net assets of each class. The fee may be used for a variety of purposes, including compensating dealers and other financial service organizations for eligible services provided by those parties to the Portfolio and its shareholders and to reimburse Northern Lights Distributors, LLC. (the “Distributor”) and the Manager for distribution related expenses.
| BARRIER FUND PORTFOLIO |
| |
| NOTES TO FINANCIAL STATEMENTS (Continued) |
| |
| December 31, 2014 |
| |
| (5) | TAX COMPONENTS OF CAPITAL AND DISTRIBUTIONS |
The tax character of portfolio distributions paid for the year ended December 31, 2014 and December 31, 2013 was as follows:
| | | Fiscal Year Ended | | | Fiscal Year Ended | |
| | | December 31, 2014 | | | December 31, 2013 | |
| Ordinary Income | | $ | 16,996 | | | $ | 2,327 | |
| | | $ | 16,996 | | | $ | 2,327 | |
| | | | | | | | | |
As of December 31, 2014, the components of accumulated earnings/(deficit) on a tax basis were as follows:
| Undistributed | | | Undistributed | | | Capital Loss | | | | | | Unrealized | | | Total | |
| Ordinary | | | Long-Term | | | Carry | | | Post October | | | Appreciation/ | | | Accumulated | |
| Income | | | Gains | | | Forwards | | | Losses | | | (Depreciation) | | | Earnings/(Deficits) | |
| $ | 132,515 | | | $ | 488 | | | $ | — | | | $ | — | | | $ | (4,844 | ) | | $ | 128,159 | |
| | | | | | | | | | | | | | | | | | | | | | | |
The difference between book basis and tax basis undistributed net investment income, unrealized depreciation, and accumulated net realized gain from investments is primarily attributable to the tax deferral of losses on wash sales and adjustments related to return of capital distributions from C corporations.
Permanent book and tax differences, primarily attributable to tax adjustments relating to real estate investment trusts and return of capital distributions from C corporations, resulted in reclassifications for the year ended December 31, 2014 as follows:
| Undistributed | | | Accumulated | |
| Net Investment | | | Net Realized | |
| Income (Loss) | | | Gains (Loss) | |
| $ | (744 | ) | | $ | 744 | |
| | | | | | | |
There are risks associated with the sale and purchase of call and put options. The seller (writer) of a call option which is covered (e.g., the writer holds the underlying security) assumes the risk of a decline in the market price of an underlying security below the purchase price of an underlying security less the premium received, and gives up the opportunity for gain on the underlying security above the exercise price of the option. The seller of an uncovered call option assumes the risk of a theoretical unlimited increase in the market price of an underlying security above the exercise price of the option. The securities necessary to satisfy the exercise of the call option may be unavailable for purchase except at much higher prices. Purchasing securities to satisfy the exercise of the call option can itself cause the price of securities to rise further, sometimes by a significant amount, thereby exacerbating the loss. The buyer of a call option assumes the risk of losing its entire premium invested in the call option. The seller (writer) of a put option which is covered (e.g., the writer has a short position in the underlying security) assumes the risk of an increase in the market price of the underlying security above the sales price (in establishing the short position) of the underlying security plus the premium received, and gives up the opportunity for gain on the underlying security below the exercise price of the option. The seller of an uncovered put option assumes the risk of a decline in the market price of the underlying security below the exercise price of the option. The buyer of a put option assumes the risk of losing his entire premium invested in the put option.
| BARRIER FUND PORTFOLIO |
| |
| NOTES TO FINANCIAL STATEMENTS (Continued) |
| |
| December 31, 2014 |
| |
The beneficial ownership, either directly or indirectly, of more than 25% of the voting securities of a portfolio creates a presumption of control of the portfolio, under Section 2(a)(9) of the 1940 Act. As of December 31, 2014, Jefferson National Life Insurance held 59.94% and Mutuals Advisors, Inc. held 40.06% of the Portfolio and may be deemed to control the Portfolio.
Subsequent events after the date of the Statement of Assets and Liabilities have been evaluated through the date the financial statements were issued. Management has concluded that there is no impact requiring adjustment or disclosure in the financial statements.
REPORT OF INDEPENDENT REGISTERED PUBLIC ACCOUNTING FIRM
To the Board of Trustees of Variable Insurance Trust
and the Shareholders of Barrier Fund Portfolio
We have audited the accompanying statement of assets and liabilities of Barrier Fund Portfolio (formerly, Vice Fund Portfolio), a series of shares of beneficial interest in Variable Insurance Trust (the “Portfolio”), including the schedule of investments, as of December 31, 2014, and the related statement of operations for the year then ended, the statements of changes in net assets for each of the years in the two-year period then ended, and the financial highlights for each of the years in the two-year period then ended and for the period November 16, 2012 (commencement of operations) through December 31, 2012. These financial statements and financial highlights are the responsibility of the Portfolio’s management. Our responsibility is to express an opinion on these financial statements and financial highlights based on our audits.
We conducted our audits in accordance with the standards of the Public Company Accounting Oversight Board (United States). Those standards require that we plan and perform the audits to obtain reasonable assurance about whether the financial statements and financial highlights are free of material misstatement. An audit includes examining, on a test basis, evidence supporting the amounts and disclosures in the financial statements. Our procedures included confirmation of securities owned as of December 31, 2014 by correspondence with the custodian. An audit also includes assessing the accounting principles used and significant estimates made by management, as well as evaluating the overall financial statement presentation. We believe that our audits provide a reasonable basis for our opinion.
In our opinion, the financial statements and financial highlights referred to above present fairly, in all material respects, the financial position of Barrier Fund Portfolio as of December 31, 2014, and the results of its operations for the year then ended, the changes in its net assets for each of the years in the two-year period then ended, and its financial highlights for each of the years in the two-year period then ended and for the period November 16, 2012 through December 31, 2012, in conformity with accounting principles generally accepted in the United States of America.
| |  |
| | |
| | BBD, LLP |
| | |
| Philadelphia, Pennsylvania | |
| March 2, 2015 | |
| Barrier Fund Portfolio |
| EXPENSE EXAMPLES (Unaudited) |
| December 31, 2014 |
| |
As a shareholder of the Barrier Fund Portfolio, you incur ongoing costs, including management fees; distribution and/or service (12b-1) fees; and other Portfolio expenses. This example is intended to help you understand your ongoing costs (in dollars) of investing in the Barrier Fund Portfolio and to compare these costs with the ongoing costs of investing in other mutual funds.
The example is based on an investment of $1,000 invested at the beginning of the period and held for the entire period from July 1, 2014 through December 31, 2014.
Actual Expenses
The “Actual Expenses” line in the table below provides information about actual account values and actual expenses. You may use the information below together with the amount you invested, to estimate the expenses that you paid over the period. Simply divide your account value by $1,000 (for example, an $8,600 account value divided by $1,000 = 8.6), then multiply the result by the number in the table under the heading entitled “Expenses Paid During Period” to estimate the expenses you paid on your account during this period.
Hypothetical Example for Comparison Purposes
The “Hypothetical” line in the table below provides information about hypothetical account values and hypothetical expenses based on the Barrier Fund Portfolio’s actual expense ratio and an assumed rate of return of 5% per year before expenses, which is not the Portfolio’s actual return. The hypothetical account values and expenses may not be used to estimate the actual ending account balances or expenses you paid for the period. You may use this information to compare this 5% hypothetical example with the 5% hypothetical examples that appear in the shareholder reports of other funds.
Please note that the expenses shown in the table are meant to highlight your ongoing costs only and do not reflect any transactional costs. Therefore, the table is useful in comparing ongoing costs only, and will not help you determine the relative total costs of owning different funds. In addition, if these transactional costs were included, your costs would have been higher.
| | | Beginning | | Ending | | Expenses Paid | | Expense Ratio |
| | | Account Value | | Account Value | | During Period* | | During Period** |
| Actual Expenses | | 7/1/14 | | 12/31/14 | | 7/1/14 – 12/31/14 | | 7/1/14 – 12/31/14 |
| Barrier Fund Portfolio | | $1,000.00 | | $977.80 | | $8.72 | | 1.75% |
| | | | | | | | | |
| Hypothetical Expenses | | Beginning | | Ending | | Expenses Paid | | Expense Ratio |
| (5% return before | | Account Value | | Account Value | | During Period* | | During Period** |
| expenses) | | 7/1/14 | | 12/31/14 | | 7/1/14 – 12/31/14 | | 7/1/14 – 12/31/14 |
| Barrier Fund Portfolio | | $1,000.00 | | $1,016.38 | | $8.89 | | 1.75% |
| | | | | | | | | |
| * | Expenses are equal to the average account value over the period, multiplied by the Portfolio’s annualized expense ratio, multiplied by the number of days in the period (184) divided by the number of days in the fiscal year (365). |
| BARRIER FUND PORTFOLIO |
| |
| SUPPLEMENTAL INFORMATION (Unaudited) |
| |
| December 31, 2014 |
| |
Board Deliberations Regarding Approvalof the Management Agreement with respect to the Barrier Fund Portfolio
The Board of Trustees of Variable Insurance Trust (the “Trust”), including the Independent Trustees, unanimously approved the Management Agreement between the Trust, on behalf of the Barrier Fund Portfolio (the “Fund”), and USA Mutuals, Inc. (“USA Mutuals” or the “Adviser”) at a meeting of the Board of Trustees held on August 26, 2014.
In connection with their deliberations regarding approval of the Management Agreement, the Trustees reviewed the Adviser’s responses to a series of questions regarding, among other things, the investment performance of the Fund for the one-year, year-to-date and since inception periods ended June 30, 2014, the Adviser’s services to the Fund, comparative fee and expense information, and the Adviser’s profitability from managing the Fund (“Adviser 15(c) Response”).
Nature, Extent and Quality of the Services. The Trustees noted that the Adviser serves as adviser to two mutual funds in addition to the Fund. They considered the background and qualifications of the Adviser’s key personnel responsible for servicing the Fund noting their many years of experience and expertise in the Fund’s areas of investment focus. The Trustees considered the Adviser’s compliance program designed to monitor and review investment decisions, and to prevent and detect violations of the Fund’s investment policies and limitations, as well as federal securities laws. They reviewed the services provided to the Fund by the Adviser noting that in addition to portfolio management and compliance, the Adviser provides risk monitoring, marketing and promotional support, and some administrative services. After discussion, the Trustees concluded that they were satisfied with the level of services provided by the Adviser.
Performance. The Trustees reviewed the Fund’s performance for the year-to-date, one year, and since inception periods noting the Fund returned 13.63%, 34.70%, and 31.74%, respectively. They considered favorably that the Fund outperformed the S&P 500 Index and Morningstar Large Blend Category average for each period shown. The Trustees discussed the reasons for the Fund’s outperformance with a representative of the Adviser. After discussion, the Trustees concluded that performance has been strong and that they are satisfied with the Fund’s returns.
Fees and Expenses. The Trustees noted the contractual advisory fee is 0.95%, but the Advisor received 0.00% after waiver. They compared the advisory fee to that charged by funds in the Fund’s peer group and Morningstar category. The Trustees considered that the contractual advisory fee was higher than the peer group and Morningstar category averages of 0.84% and 0.60%, respectively, but within the range of fees charged by both benchmark groups. They further considered that the Adviser earns 0.00% after waiver. After further discussion, the Trustees concluded that the advisory fee is reasonable.
| BARRIER FUND PORTFOLIO |
| |
| SUPPLEMENTAL INFORMATION (Unaudited)(Continued) |
| |
| December 31, 2014 |
| |
Profitability. The Trustees reviewed the profitability analysis provided by the Advisor and noted the Advisor realized a net loss in connection with its relationship with the Fund. A representative of the Adviser noted that, with the Fund’s strong performance, the Advisor is optimistic that the Fund will attract assets, thereby improving its future profitability.
Economies of Scale. The Trustees discussed whether the institution of breakpoints in the Management Agreement would be appropriate way to share economies of scale with the Fund’s shareholders, and if such economies had been reached in connection with the Fund. The Board noted that the Fund’s current asset levels do not support the imposition of breakpoints at this time, and that it will likely be several years before the Adviser can recapture previously waived fees and achieve any economies. After discussion, it was the consensus of the Trustees that economies of scale would be revisited at the next renewal of the agreement and as the Fund size materially increases.
Conclusion. Having requested and received such information from the Advisor as the Trustees believed to be reasonably necessary to evaluate the terms of the Management Agreement, and as assisted by the advice of legal counsel, the Trustees concluded that the fee structure is reasonable and that renewal of the Management Agreement was in the best interests of the Fund and its shareholders.
| BARRIER FUND PORTFOLIO |
| |
| SUPPLEMENTAL INFORMATION (Unaudited)(Continued) |
| |
| December 31, 2014 |
| |
Independent Trustees
Name, Address,
Year of Birth | | Position(s)
Held
with
Registrant | | Term
and
Length
Served* | | Principal
Occupation(s)
During Past 5 Years | | Number of
Portfolios
Overseen
In The
Fund
Complex** | | Other Directorships
Held During Past 5
Years |
Tobias Caldwell
c/o Variable Insurance Trust
17605 Wright Street,
Omaha NE 68130
Year of Birth: 1967 | | Trustee | | Since 2010 | | Manager of Genovese Family Enterprises, a real estate firm, since 1999. Managing Member of PTL Real Estate LLC, a real estate/investment firm, since 2000. Managing Member of Bear Properties, LLC, a real estate firm, since 2006. President of Genovese Imports, an importer/ distributor of wine, from 2005 to 2011. | | 40 | | Mutual Fund Series Trust since 2006 |
| | | | | | | | | | | |
Tiberiu Weisz
c/o Variable Insurance Trust
17605 Wright Street,
Omaha NE 68130
Year of Birth: 1949 | | Trustee | | Since 2010 | | Attorney with and shareholder of Gottlieb, Rackman & Reisman, P.C., since 1994. | | 40 | | Mutual Fund Series Trust since 2006 |
| | | | | | | | | | | |
Dr. Bert Pariser
c/o MITCU Corporation
860 East Broadway, Suite
2D, Long Beach,
NY 11561
Year of Birth: 1940 | | Trustee | | Since 2010 | | Managing Partner of The MITCU Corporation, a technology consulting firm since 2004. Faculty Member Technical Career Institutes, since 1991 | | 40 | | Mutual Fund Series Trust since 2007 |
| BARRIER FUND PORTFOLIO |
| |
| SUPPLEMENTAL INFORMATION (Unaudited)(Continued) |
| |
| December 31, 2014 |
| |
Interested Trustee ** and Officers
Name, Address,
Year of Birth | | Position(s)
Held
with
Registrant | | Term
and
Length
Served* | | Principal
Occupation(s)
During Past 5 Years | | Number of
Portfolios
Overseen In
The Fund
Complex** | | Other Directorships
Held During Past 5
Years |
| | | | | | | | | | | |
Jerry Szilagyi
22 High Street
Huntington, NY 11743
Year of Birth: 1962 | | Trustee and President | | Trustee since 2010; President since 2010 | | President, USA Mutuals, Inc., 3/2011 to present; Managing Member and Chief Compliance Officer, Catalyst Capital Advisors LLC, 1/2006- present; Member and Chief Compliance Officer, AlphaCentric Advisors LLC, 2/2014 to Present; Member, Catalyst Mutuals Fund Distributors LLC 12/2014- present; President, MFund Distributors LLC, 10/12- present; President, MFund Services LLC, 1/2012 - Present; President, Abbington Capital Group LLC, 1998- present; President, Cross Sound Capital LLC, 6/2011 to 10/2013; CEO, ThomasLloyd Global Asset Management (Americas) LLC, 9/2006 to 2010. | | 40 | | Mutual Fund Series Trust since 2006 |
| | | | | | | | | | | |
Erik Naviloff
80 Arkay Drive
Hauppauge, New York 11788
Year of Birth: 1968 | | Treasurer | | Since 4/2012 | | Vice President – Fund Administration, Gemini Fund Services, LLC, since 2011; Assistant Vice President, Gemini Fund Services, 2007 – 2012. | | N/A | | N/A |
| | | | | | | | | | | |
Steve Troche
80 Arkay Drive
Hauppauge, New York 11788
Year of Birth: 1984 | | Assistant Secretary | | Since 2/2013 | | Junior Paralegal, Gemini Fund Services, LLC, since 2012; Legal Assistant, Gemini Fund Services, 2011 to 2012; MetLife, Financial Services Representative, 2008-2010. | | N/A | | N/A |
| | | | | | | | | | | |
Mark Marrone
80 Arkay Drive
Hauppauge, New York 11788
Year of Birth: 1968 | | Chief Compliance Officer | | Since 2/2011 | | Compliance Officer of Northern Lights Compliance Services, LLC (since 2009); Chief Financial Officer/Treasurer (2003–2009) and Chief Compliance Officer (2004–2009), Saratoga Capital Management, LLC. | | N/A | | N/A |
| | | | | | | | | | | |
Jennifer A. Bailey
22 High Street
Huntington, NY 11743
Year of Birth: 1968 | | Secretary | | Since 4/2014 | | Director of Legal Services, MFund Services LLC, 2/2012 to present; Attorney, Weiss & Associates, 12/2008 to 6/2010. | | N/A | | N/A |
| | | | | | | | | | | |
| * | The term of each Trustee is indefinite. |
| ** | The Trustee who is an “interested person” of the Trust as defined in the 1940 Act is an interested person by virtue of being an officer of the advisor of the Fund. |
| *** | The ‘Fund Complex’ includes the Trust and Mutual Series Trust, a registered open-end investment company. |
| BARRIER FUND PORTFOLIO |
| |
| SUPPLEMENTAL INFORMATION (Unaudited)(Continued) |
| |
| December 31, 2014 |
| |
Reference is made to the Prospectus and the Statement of Additional Information for more detailed descriptions of the Management Agreement, Services Agreement and Distribution and/or Service (12b-1) Plan, tax aspects of the Portfolio and the calculation of the net asset value of shares of the Portfolio.
The Portfolio files its complete schedule of portfolio holdings with the Securities and Exchange Commission (the “Commission”) for the first and third quarters of each fiscal year on Form N-Q. The Portfolio’s Forms N-Q are available on the Commission’s website at http://www.sec.gov. The Portfolio’s Forms N-Q may be reviewed and copied at the Commission’s Public Reference Room in Washington, DC. Information on the operation of the Commission’s Public Reference Room may be obtained by calling 1-800-SEC-0330.
A description of the policies and procedures that the Portfolio uses to determine how to vote proxies relating to portfolio securities is available without charge, upon request, by calling 1-866-447-4228; and on the Commission’s website at http://www.sec.gov.
Information regarding how the Portfolio voted proxies relating to portfolio securities during the most recent 12-month period ended June 30 is available without charge, upon request, by calling 1-866-447-4228; and on the Commission’s website at http://www.sec.gov.
PRIVACY NOTICE
VARIABLE INSURANCE TRUST
Rev. June 2011
| FACTS | WHAT DOES VARIABLE INSURANCE TRUST DO WITH YOUR PERSONAL INFORMATION? |
| Why? | Financial companies choose how they share your personal information. Federal law gives consumers the right to limit some, but not all sharing. Federal law also requires us to tell you how we collect, share, and protect your personal information. Please read this notice carefully to understand what we do. |
| What? | The types of personal information we collect and share depends on the product or service that you have with us. This information can include: ● Social Security number and wire transfer instructions ● account transactions and transaction history ● investment experience and purchase history When you are no longer our customer, we continue to share your information as described in this notice. |
| How? | All financial companies need to share customers’ personal information to run their everyday business. In the section below, we list the reasons financial companies can share their customers’ personal information; the reasons Variable Trust chooses to share; and whether you can limit this sharing. |
Reasons we can share your
personal information: | Does Variable Insurance
Trust share information? | Can you limit this
sharing? |
| For our everyday business purposes - such as to process your transactions, maintain your account(s), respond to court orders and legal investigations, or report to credit bureaus. | YES | NO |
| For our marketing purposes - to offer our products and services to you. | NO | We don’t share |
| For joint marketing with other financial companies. | NO | We don’t share |
| For our affiliates’ everyday business purposes - information about your transactions and records. | NO | We don’t share |
| For our affiliates’ everyday business purposes - information about your credit worthiness. | NO | We don’t share |
| For our affiliates to market to you | NO | We don’t share |
| For non-affiliates to market to you | NO | We don’t share |
| QUESTIONS? | Call 1-866-447-4228 |
PRIVACY NOTICE
VARIABLE INSURANCE TRUST
| What we do: |
How does Variable Insurance Trust protect my personal information? | To protect your personal information from unauthorized access and use, we use security measures that comply with federal law. These measures include computer safeguards and secured files and buildings. Our service providers are held accountable for adhering to strict policies and procedures to prevent any misuse of your nonpublic personal information. |
How does Variable Insurance Trust collect my personal information? | We collect your personal information, for example, when you ● open an account or deposit money ● direct us to buy securities or direct us to sell your securities ● seek advice about your investments We also collect your personal information from others, such as credit bureaus, affiliates, or other companies. |
Why can’t I limit all sharing? | Federal law gives you the right to limit only: ● sharing for affiliates’ everyday business purposes – information about your creditworthiness. ● affiliates from using your information to market to you. ● sharing for non-affiliates to market to you. State laws and individual companies may give you additional rights to limit sharing. |
| Definitions |
| Affiliates | Companies related by common ownership or control. They can be financial and non-financial companies. ● Variable Insurance Trust has no affiliates. |
| Non-affiliates | Companies not related by common ownership or control. They can be financial and non-financial companies. ● Variable Insurance Trust does not share with non-affiliates so they can market to you. |
| Joint marketing | A formal agreement between nonaffiliated financial companies that together market financial products or services to you. ● Variable Insurance Trust does not jointly market. |
Variable Insurance Trust
80 Arkay Dr., Suite 110
Hauppauge, NY 11788
MANAGER
Mutuals Advisors, Inc.
700 North Pearl St.
Suite 900
Dallas, TX 75201
ADMINISTRATOR
Gemini Fund Services, LLC
80 Arkay Dr., Suite 110
Hauppauge, NY 11788
TRANSFER AGENT
Gemini Fund Services, LLC
17605 Wright Street
Omaha, NE 68130
INDEPENDENT REGISTERED PUBLIC ACCOUNTING FIRM
BBD, LLP
1835 Market Street
26th Floor
Philadelphia, PA 19103
LEGAL COUNSEL
Thompson Hine LLP
41 South High Street
Suite 1700
Columbus, OH 43215
CUSTODIAN BANK
US Bank Trust Services
1555 N. RiverCenter Dr. Suite 300
Milwaukee, WI 53212
ITEM 2. CODE OF ETHICS.
| (a) | The registrant has, as of the end of the period covered by this report, adopted a code of ethics that applies to the registrant's principal executive officer, principal financial officer, and principal accounting officer or controller, or persons performing similar functions, regardless of whether these individuals are employed by the registrant or a third party. |
| (b) | During the period covered by this report, there were no amendments to any provision of the code of ethics. |
| (c) | During the period covered by this report, there were no waivers or implicit waivers of a provision of the code of ethics. |
ITEM 3. AUDIT COMMITTEE FINANCIAL EXPERT.
| | The registrant’s Board of Trustees has determined that it does not have an audit committee financial expert serving on its audit committee. At this time, the registrant believes that the experience provided by each member of the audit committee together offer the registrant adequate oversight for the registrant’s level of financial complexity. |
ITEM 4. PRINCIPAL ACCOUNTANT FEES AND SERVICES.
| (a) | Audit Fees. The aggregate fees billed for each of the last two fiscal years for professional services rendered by the registrant's principal accountant for the audit of the registrant's annual financial statements or services that are normally provided by the accountant in connection with statutory and regulatory filings or engagements for those fiscal years are as follows: |
| Trust Series | 2013 | 2014 | |
| Barrier Fund Portfolio | 10,000 | 10,000 | |
| | | | | |
| (b) | Audit-Related Fees. There were no fees billed in each of the last two fiscal years for assurances and related services by the principal accountant that are reasonably related to the performance of the audit of the registrant’s financial statements and are not reported under paragraph (a) of this item. |
| (c) | Tax Fees. The aggregate fees billed in each of the last two fiscal years for professional services rendered by the principal accountant for tax compliance are as follows: |
| Trust Series | 2013 | 2014 |
| Barrier Fund Portfolio | 2,000 | 2,000 |
| (d) | All Other Fees. The aggregate fees billed in each of the last two fiscal years for products and services provided by the registrant’s principal accountant, other than the services reported in paragraphs (a) through (c) of this item were $0 and $0 for the fiscal years ended December 31, 2014. |
| (e)(1) | The audit committee does not have pre-approval policies and procedures. Instead, the audit committee or audit committee chairman approves on a case-by-case basis each audit or non-audit service before the principal accountant is engaged by the registrant. |
| (e)(2) | There were no services described in each of paragraphs (b) through (d) of this Item that were approved by the audit committee pursuant to paragraph (c)(7)(i)(C) of Rule 2-01 of Regulation S-X. |
| (f) | Not applicable. The percentage of hours expended on the principal accountant's engagement to audit the registrant's financial statements for the most recent fiscal year that were attributed to work performed by persons other than the principal accountant's full-time, permanent employees was zero percent (0%). |
| (g) | All non-audit fees billed by the registrant's principal accountant for services rendered to the registrant for the fiscal years ended December 31, 2013 are disclosed in (b)-(d) above. There were no audit or non-audit services performed by the registrant's principal accountant for the registrant's adviser. |
ITEM 5. AUDIT COMMITTEE OF LISTED REGISTRANTS.
Not applicable
ITEM 6. SCHEDULE OF INVESTMENT
Included in annual report to shareholders filed under item 1 of this form.
ITEM 7. DISCLOSURE OF PROXY VOTING POLICIES AND PROCEDURES FOR CLOSED-END MANAGEMENT INVESTMENT COMPANIES.
Not applicable Portfolio is an open-end management investment company
ITEM 8. PORTFOLIO MANAGERS OF CLOSED-END MANAGEMENT INVESTMENT COMPANIES
Not applicable Portfolio is an open-end management investment company
ITEM 9. PURCHASES OF EQUITY SECURITIES BY CLOSED-END MANAGEMENT INVESTMENT COMPANY AND AFFILIATED PURCHASERS.
Not applicable Portfolio is an open-end management investment company
ITEM 10. SUBMISSION OF MATTERS TO A VOTE OF SECURITY HOLDERS.
Not applicable at this time.
ITEM 11. CONTROLS AND PROCEDURES.
| (a) | The registrant's principal executive and principal financial officers, or persons performing similar functions, have concluded that the registrant's disclosure controls and procedures (as defined in Rule 30a-3(c) under the 1940 Act, are effective, as of a date within 90 days of the filing date of this report, based on the evaluation of these controls and procedures required by Rule 30a-3(b) under the 1940 Act and Rule 15d-15(b) under the Securities Exchange Act of 1934, as amended. |
| (b) | There were no changes in the registrant's internal control over financial reporting (as defined in Rule 30a-3(d) under the 1940 Act) that occurred during the period covered by this report that have materially affected, or are reasonably likely to materially affect, the registrant's internal control over financial reporting. |
ITEM 12. EXHIBITS
| (1) | Code of Ethics for Principal Executive and Senior Financial Officers is attached hereto. |
| (2) | Certifications pursuant to Section 302 of the Sarbanes-Oxley Act of 2002 are filed herewith. |
| (3) | Certifications pursuant to Section 906 of the Sarbanes-Oxley Act of 2002 are filed herewith. |
SIGNATURES
Pursuant to the requirements of the Securities Exchange Act of 1934 and the Investment Company Act of 1940, the registrant has duly caused this report to be signed on its behalf by the undersigned, thereunto duly authorized.
Variable Insurance Trust
| By Jerry Szilagyi | /s/ Jerry Szilagyi |
| President, |
| Date: March 4, 2015 | |
Pursuant to the requirements of the Securities Exchange Act of 1934 and the Investment Company Act of 1940, this report has been signed below by the following person on behalf of the registrant and in the capacities and on the date indicated.
| By Jerry Szilagyi | /s/ Jerry Szilagyi ___________ |
| President |
| Date: March 4, 2015 | |
Pursuant to the requirements of the Securities Exchange Act of 1934 and the Investment Company Act of 1940, this report has been signed below by the following person on behalf of the registrant and in the capacities and on the date indicated.
| By Erik Naviloff | /s/ Erik Naviloff_____________ |
| Treasurer |
| Date: March 4, 2015 | |