 Q1 2012 Earnings Presentation Three Months Ended March 31, 2012 May 15, 2012 Exhibit 99.3 |
 Forward Looking Statements 1 Any statements in this presentation that are not historical or current facts are forward-looking statements. Forward-looking statements include, without limitation, statements concerning plans, objectives, goals, projections, strategies, future events or performance, and underlying assumptions and other statements, which are not statements of historical facts. Forward-looking statements convey the Company’s current expectations or forecasts of future events. When used in this presentation, the words “anticipate,” “appears,” “foresee,” “intend,” “should,” “expect,” “estimate,” “target,” “project,” “plan,” “may,” “could,” “will,” “are likely” and similar expressions are intended to identify forward-looking statements. These statements involve predictions of our future financial condition, performance, plans and strategies, and are thus dependent on a number of factors including, without limitation, assumptions and data that may be imprecise or incorrect. Specific factors that may impact performance or other predictions of future actions have, in many but not all cases, been identified in connection with specific forward-looking statements. Forward-looking statements involve known and unknown risks, uncertainties and other factors that may cause the Company’s actual results, performance or achievements to be materially different from any future results, performances or achievements expressed or implied by the forward-looking statements. Certain of these risks and uncertainties are described in the “Risk Factors” section of Nationstar Mortgage LLC’s Annual Report on Form 10-K for the year ended December 31, 2011, and other required reports, as filed with the SEC, which are available at the SEC’s website at http://www.sec.gov. We caution you not to place undue reliance on these forward-looking statements that speak only as of the date they were made. Unless required by law, the Company undertakes no obligation to publicly update or revise any forward-looking statements to reflect circumstances or events after the date of this presentation. |
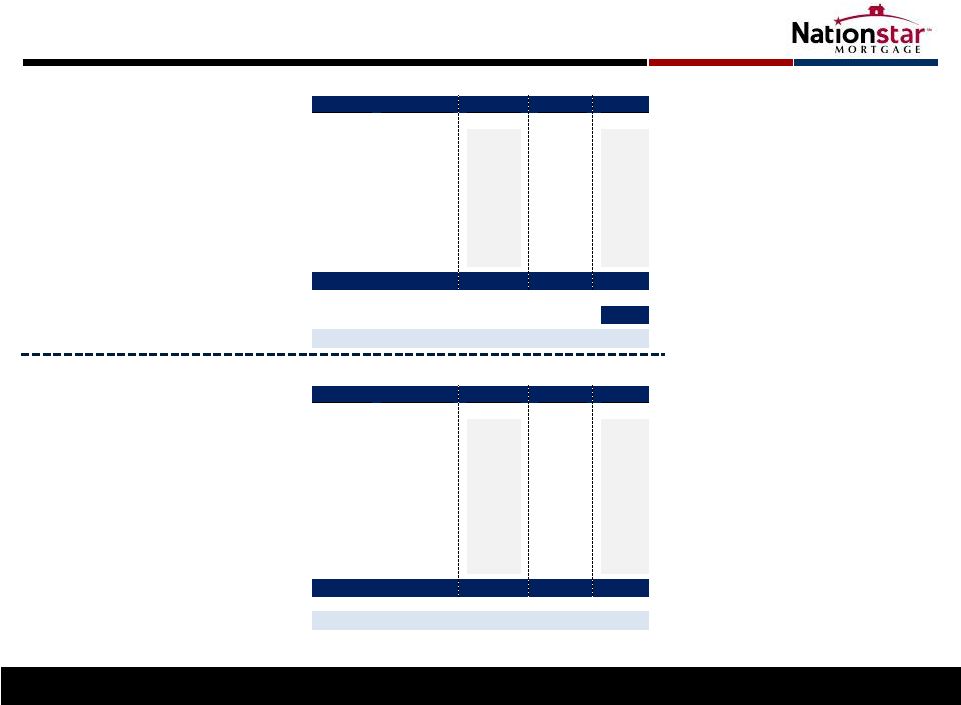
 $22 $46 $65 $136 Q1 $77 $300 0 50 100 150 200 250 300 350 2008 2009 2010 2011 2012 Estimate Q1 2012 Highlights AEBITDA up 63% to $77 million; Net Income up 237% to $50 million Servicing book grew by nearly $60 billion of UPB – committed to purchase Aurora Bank (1) Strongest quarter for loan originations in history – originated $1.2 billion of loans $516 million raised through IPO and post-Q1 debt offering provides ample liquidity for growth 1) Pro forma for Aurora acquisition expected to close in May’12 2) Please see endnotes for AEBITDA reconciliation $21 $34 $64 $107 $166 0 40 80 120 160 200 2008 2009 2010 2011 Q1 2012 Pro-Forma 2 Servicing Growth (1) ($bn of UPB) AEBITDA Growth (2) Strong first quarter as a public company – momentum going forward ($mm) |
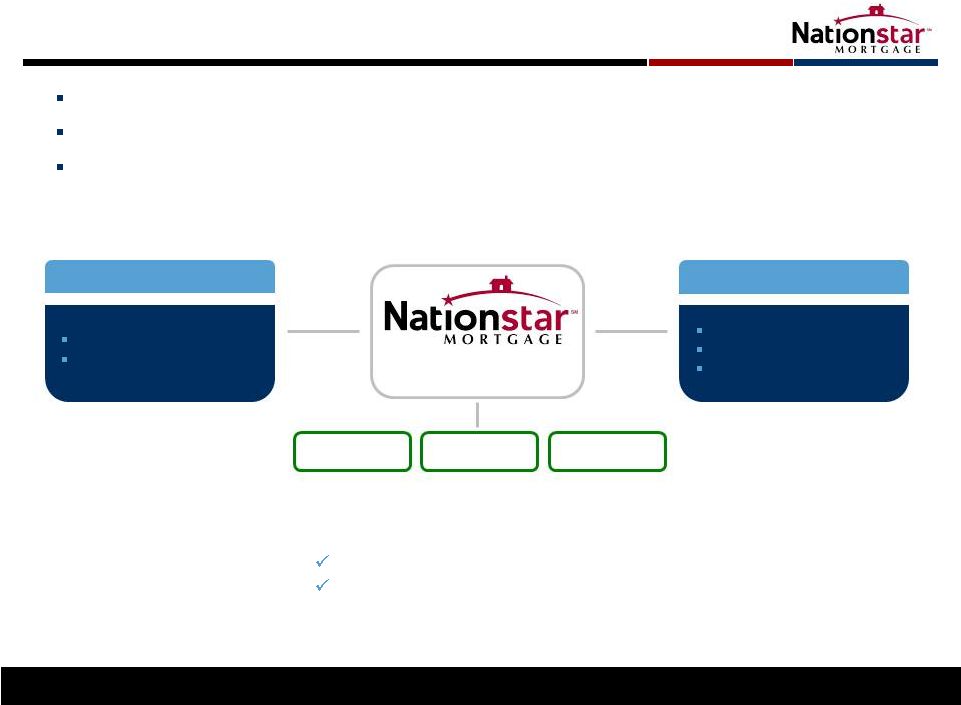 Fee-Based Business Model with Strong Cash Flow 1) Pro forma for Aurora acquisition assuming $63 billion of UPB 3 $166 billion of UPB (1) GSEs / Government Financial Institutions Private Investors Service +1 million customers Majority are current (85%+) Borrowers Mortgage Owners Originations Servicing Adjacent Svcs. Earn stable contractual fee for servicing residential customers Make money based on volume and effectiveness Originate or refinance loans – predominantly based on existing relationships Addressable Market: $10+ trillion in servicing UPB 60 million customers |
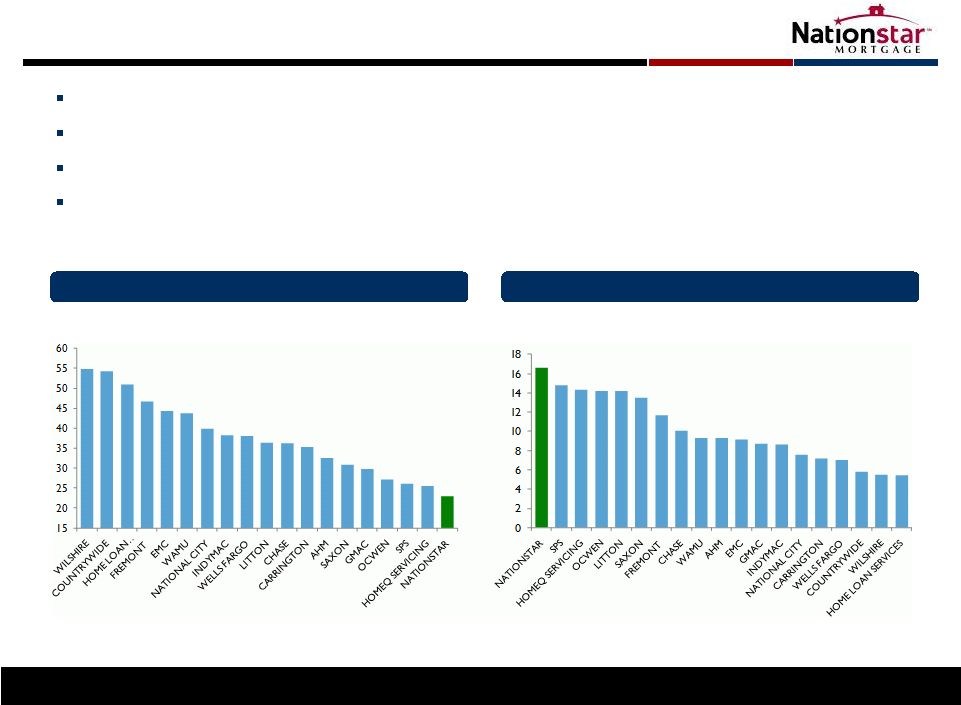 Servicing: Performance Drives Earnings Primary driver of profitability is servicing performance – ability to drive down defaults and delinquencies Best-in-class in delinquencies and roll rates Our heritage is servicing credit-challenged loans and preserving home ownership Track record of making loans affordable 1) Loan Performance, Subprime, 2004- 2007 origination years. Data as of 4/25/12 4 Delinquency Rate (1) Positive Roll Rates (1) (60+ DQ as % of UPB) (% of delinquent UPB that improve) |
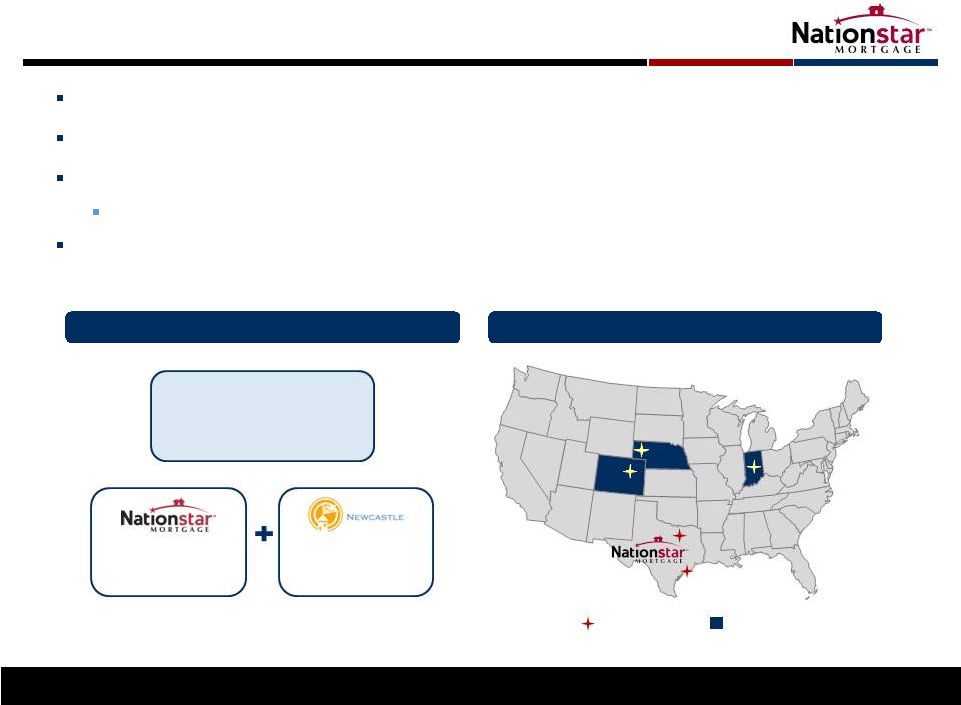 Announced March 6 th agreement to purchase $63 billion (1) in servicing assets from Aurora Bank Total equity investment of $286 million from Nationstar with an internally projected IRR of 20%+ Expect the transaction to close in the second quarter Proceeding with all regulatory approvals and integration plan Capacity additions to ensure portfolio continuity Aurora Transaction 5 Summary of Aurora Transaction Servicing Locations 1) Estimated Q2 2012 balances; 75% non-agency, 25% agency Receive base servicing fees + 35% interest in Excess MSRs Purchase 65% interest in Excess MSRs Nationstar Aurora $63 billion of servicing assets 284,625 loans 25% Agency & 75% Non-Agency |
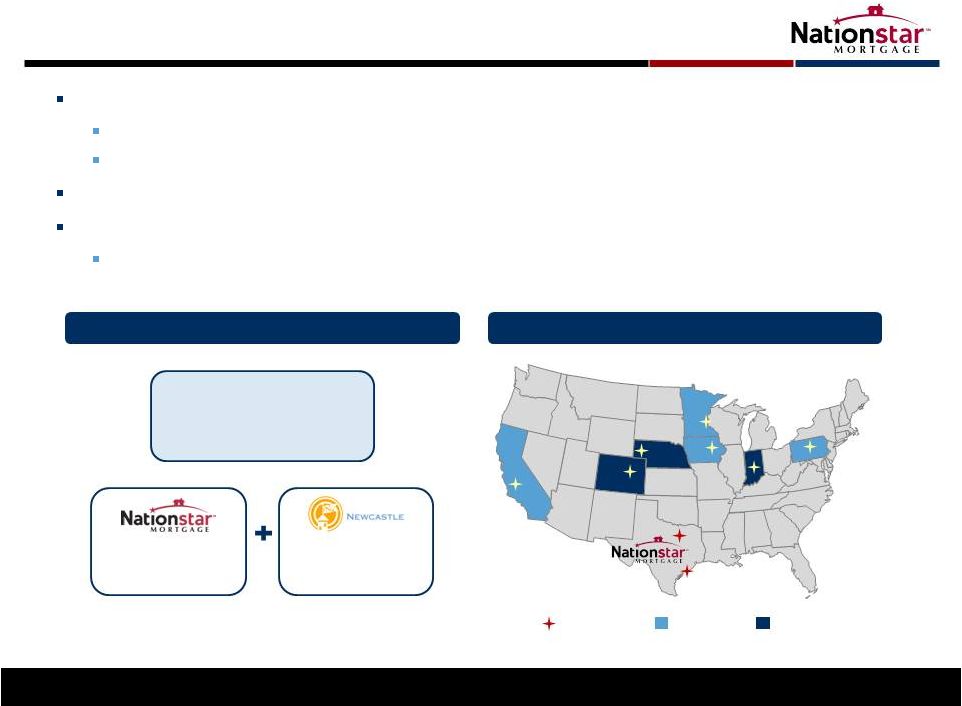 ResCap Transaction 6 Announced May 14 th agreement to purchase $374 billion in servicing assets through 363 (“stalking horse”) bid $201 billion in primary servicing rights $173 billion in sub-servicing contracts Pro forma $550 billion UPB – would make Nationstar largest non-bank mortgage servicer Anticipate closing in late 2012, subject to auction process as well as court and other regulatory approvals Entitled to breakup fee of $72 million and up to $10 million of expense reimbursement $374 billion of servicing assets 2.4 million customers 68% Agency & 32% Non-Agency Summary of Rescap Transaction Receive base servicing fees + 35% interest in Excess MSRs Purchase up to 65% interest in Excess MSRs alongside Fortress affiliates Servicing Locations ResCap Nationstar Aurora |
 Approximately $350 billion has transferred from banks to non-banks over the past 2 years (1) Limited number of qualified buyers / subservicers High barriers to entry Must have strong agency relationships Transformational shift Basel III capital requirements Regulatory and headline risk Focus on core customer wallet share Servicing: Strong Pipeline of Growth Opportunities 1) Bank transactions June 2010 through April 2012. Ocwen 8-K, September 2010; National Mortgage News, November 2010; Bloomberg, June 2011; Bloomberg, October 2011; SEC S-4/A Filing, filed by Nationstar Mortgage LLC, June 2011; Wall Street Journal, August 2011; Nationstar, 2011; National Mortgage News, November 2011; Reverse Mortgage Daily, December 2011; 8-K Filing, filed by Nationstar Mortgage LLC, March 2012 7 Favorable Supply - Demand Dynamics |
 28% 33% 36% 38% 20% 25% 30% 35% 40% Q2 '11 Q3 '11 Q4 '11 Q1 '12 $1.5 $2.8 $3.4 $4.8 $- $1.0 $2.0 $3.0 $4.0 $5.0 $6.0 2009 2010 2011 Q1 '12 Ann. Originations: Enhances Core Servicing Platform 8 Origination Volume Recapture Rate ($bn of UPB) Originations supplements core servicing operations Most cost effective way to create servicing Extends life of servicing cash flows Enables refinancing as loss mitigation tool Cash flow positive and profitable |
 $60 million in total cash / near-cash revenue Originations: Cash-Driven Economics 1) Includes mark to market on loans held for sale and derivative/hedges 2) As of 4-30-12. ($mm) Cash – Points, Fees, Gain on Sale $43.9 Pipeline Value (1) (Converts to cash in 90 days) 16.5 Subtotal Cash / Near Cash Revenue $60.4 Servicing Asset (Cash value realized over time) 13.0 Other (2.9) Total Originations Revenue $70.5 Originations Volume $1,190 Application Pipeline (2) $1,937 Q1 2012 Unit Economics 9 Cash / near cash is 86% of total revenue |
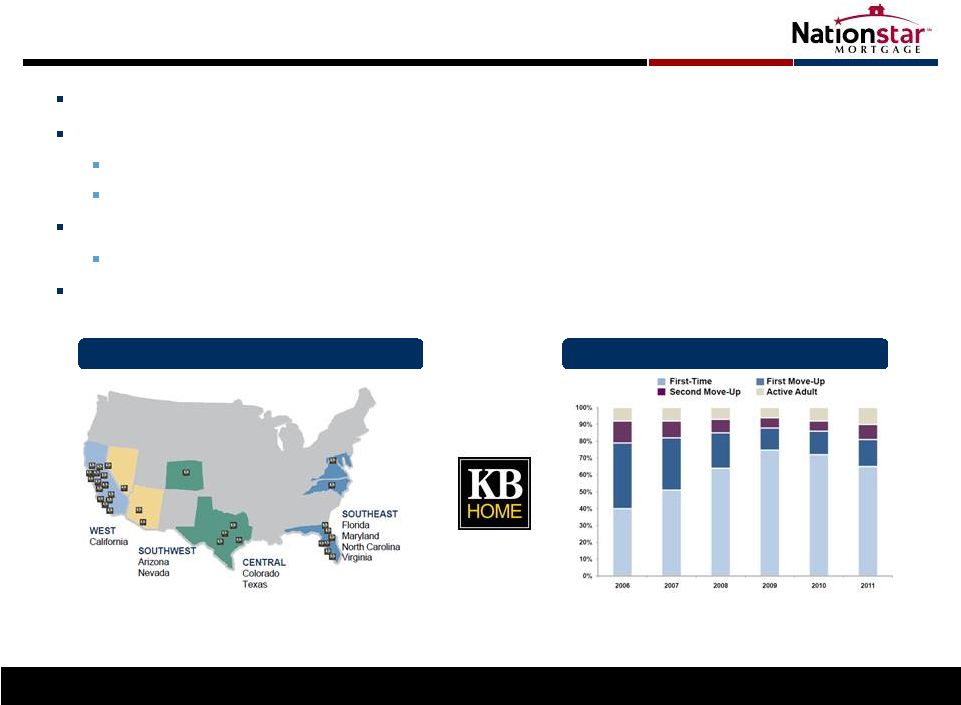 Originations: Creating New Customer Relationships with KB 10 1) Source: Housing Zone 2) Source: February 2012 KB Home Investor Presentation On March 12 th , KB Home named Nationstar as its preferred mortgage lender KB Home is the 5 largest homebuilder in US (1) Nearly $1.6 billion in home sales in 2011 (1) Less interest rate-sensitive profile Loan originations expected to begin this month (May’12) $125 million application pipeline expected Hired approximately 150 dedicated employees KB Home Geographic Footprint KB Home Buyer Mix (2) (2) th |
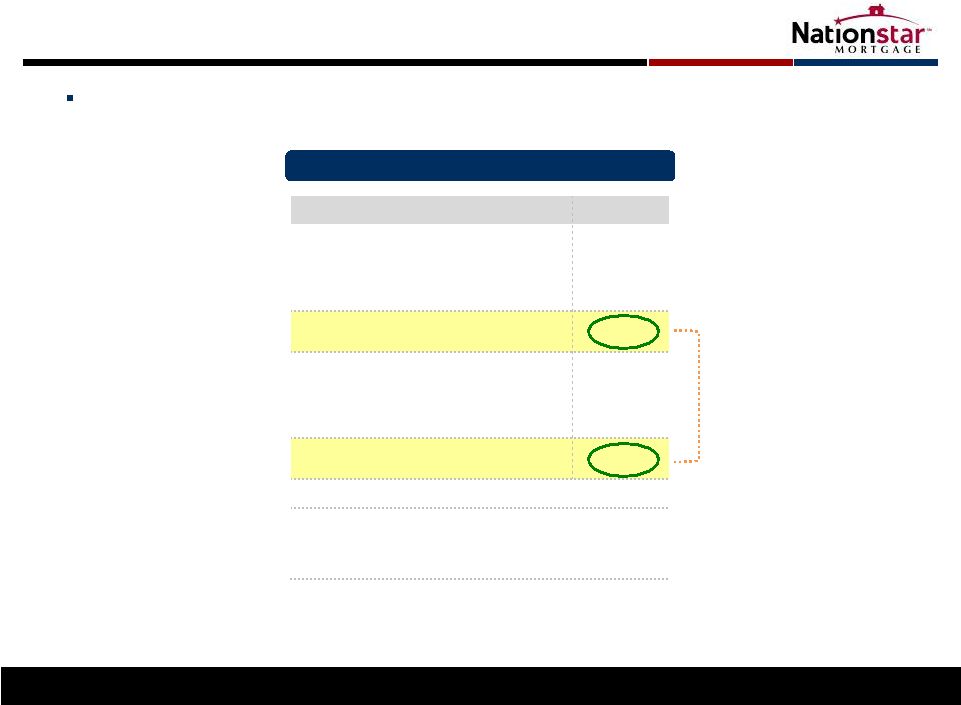
 Consolidated Performance 1) Adjusted EBITDA, refer to Endnotes disclaimer and reconciliation to net income slide 2) Includes Legacy Segment 11 Operating Segment Revenue of $161.6 million and Operating Segment AEBITDA of $77.2 million Total GAAP Net Income of $50.2 million Operating Segment AEBITDA per share of $1.04 and Total GAAP EPS of $0.67 Q4'11 ($ millions except where noted) Servicing Originations Operating Total (2) Total Revenue $91.1 $70.5 $161.6 $161.7 $119.4 Expense $59.2 $28.5 $87.7 $96.6 $86.5 AEBITDA (1) $34.8 $42.4 $69.8 $39.7 margin% 38% 60% 48% Pre-Tax Income $61.4 $53.3 $14.9 Net Income - GAAP $50.2 $14.9 Per Share Data: AEBITDA $0.47 $0.57 $0.94 $0.57 Pre-Tax Income $0.83 $0.72 $0.21 Net Income - GAAP $0.67 $0.21 Q1 '12 $1.04 $77.2 |
 Balance Sheet 12 Significant cash for investment with the proceeds from the IPO Strong operating cash flow for the quarter 1) Includes receivables from affiliates 2) Includes mortgage loans for sale and mortgage loans held for investment subject to nonrecourse debt (legacy assets) 3) Notes payable includes servicing advance facilities and origination warehouse facilities $ millions Q1 '12 Q4 '11 $ millions Q1 '12 Q4 '11 Assets: Liabilities: Cash and cash equivalents $356 $62 Notes payable (3) $768 $873 Restricted cash 109 71 Senior unsecured notes 281 280 Accounts receivable (1) 535 567 Payables and accrued liabilities 241 184 Mortgage loans held for sale (2) 620 702 Nonrecourse debt - Legacy assets 110 112 Mortgage servicing rights - fair value 266 251 Excess spread financing at fair value 47 45 Property and equipment, net 25 24 Participating interest financing 114 - Other assets 268 111 Other liabilities 25 13 Total Liabilities $1,586 $1,507 Shareholders Equity $593 $281 Total Assets $2,179 $1,788 Total Liabilities and Shareholders Equity $2,179 $1,788 |
 Appendix 13 |
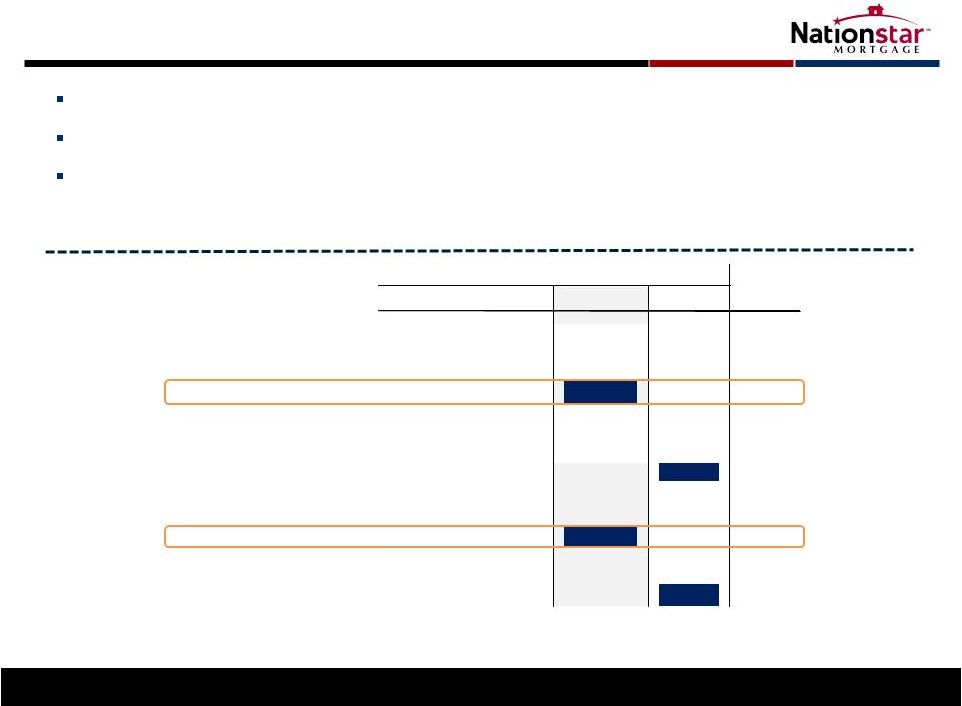
 AEBITDA Reconciliation 14 For Quarter Ended March 31, 2012 For Quarter Ended December 31, 2011 $ Millions Servicing Originations Operating Legacy Total Adjusted EBITDA $34.8 $42.4 $77.2 ($7.5) $69.8 Interest expense on corporate notes (8.5) - (8.5) - (8.5) MSR valuation adjustment 0.5 - 0.5 - 0.5 Excess spread adjustment (4.9) - (4.9) - (4.9) Amortization of mort. serv. obligations 0.6 - 0.6 - 0.6 Depreciation & amortization (0.9) (0.4) (1.2) (0.3) (1.5) Stock-based compensation (2.2) (0.2) (2.4) - (2.4) Fair value adjustment for derivatives 0.0 - 0.0 (0.3) (0.3) Pre-Tax Income $19.6 $41.8 $61.4 ($8.0) $53.3 Income taxes (3.1) Net Income $50.2 AEBITDA per Share (1) $0.47 $0.57 $1.04 ($0.10) $0.94 $ Millions Servicing Originations Operating Legacy Total Adjusted EBITDA $35.6 $11.7 $47.3 ($7.6) $39.7 Interest expense on corporate notes (7.8) - (7.8) - (7.8) MSR valuation adjustment (8.2) - (8.2) - (8.2) Excess spread adjustment (3.1) - (3.1) - (3.1) Amortization of mort. serv. obligations - - - - - Depreciation & amortization (0.8) (0.4) (1.2) (0.3) (1.5) Restructuring charges - (1.8) (1.8) - (1.8) Stock-based compensation (2.4) (0.3) (2.7) - (2.7) Fair value adjustment for derivatives 0.3 - 0.3 - 0.3 Net Income $13.6 $9.2 $22.8 ($7.9) $14.9 AEBITDA per Share (2) $0.51 $0.17 $0.68 ($0.11) $0.57 1) Calculated using a fully diluted average share count of 74.561 million shares 2) Calculated using a fully diluted average share count of 70.000 million shares |
 AEBITDA Reconciliation (continued) 15 For Quarter Ended March 31, 2011 1) Calculated using a fully diluted average share count of 70.000 million shares $ Millions Servicing Originations Operating Legacy Total Adjusted EBITDA $23.7 $4.3 $28.0 ($4.1) $23.8 Interest expense on corporate notes (7.5) (0.1) (7.5) - (7.5) MSR valuation adjustment (3.8) - (3.8) - (3.8) Excess spread adjustment - - - - - Amortization of mort. serv. obligations - - - - - Depreciation & amortization (0.4) (0.3) (0.6) (0.1) (0.8) Stock-based compensation (4.7) (0.5) (5.2) (0.0) (5.3) Fair value adjustment for derivatives 0.9 - 0.9 - 0.9 Net Income $8.2 $3.4 $11.6 ($4.3) $7.4 AEBITDA per Share (1) $0.34 $0.06 $0.40 ($0.06) $0.34 |
 AEBITDA Reconciliation (continued) 16 1) Calculated using a fully diluted average share count of 70.000 million shares FY 2008 FY 2009 FY 2010 FY 2011 Net income (loss) (157,610) $ (80,877) $ (9,914) $ 20,887 $ Adjust for: Net loss from Legacy Portfolio and Other 164,738 97,263 24,806 24,892 Interest expense from unsecured senior notes – – 24,628 30,464 Depreciation and amortization 1,172 1,542 1,873 3,395 Change in fair value of MSRs 11,701 27,915 6,043 39,000 Fair value changes on excess spread financing – – – 3,060 Share-based compensation 1,633 579 8,999 14,764 Exit costs – – – 1,836 Fair value changes on interest rate swaps – – 9,801 (298) Ineffective portion of cash flow hedge – – (930) (2,032) Adjusted EBITDA (1) 21,634 $ 46,422 $ 65,306 $ 135,968 $ |
 Endnote Adjusted EBITDA (“AEBITDA”) 17 This disclaimer applies to every usage of “Adjusted EBITDA” or “AEBITDA” in this presentation. Adjusted EBITDA is a key performance metric used by management in evaluating the performance of our segments. Adjusted EBITDA represents our Operating Segments' income (loss), and excludes income and expenses that relate to the financing of our senior notes, depreciable (or amortizable) asset base of the business, income taxes (if any), exit costs from our restructuring and certain non-cash items. Adjusted EBITDA also excludes results from our legacy asset portfolio and certain securitization trusts that were consolidated upon adoption of the new accounting guidance eliminating the concept of a qualifying special purpose entity ("QSPE“). |