Exhibit 99.1

k
full year and fourth Quarter 2023 Earnings Results
Sixth Street Specialty Lending, Inc. Reports Full Year and Fourth Quarter Earnings Results; Declares a First Quarter Base Dividend Per Share of $0.46, and a Fourth Quarter Supplemental Dividend Per Share of $0.08.

| | | |
NEW YORK—February 15, 2024— Sixth Street Specialty Lending, Inc. (NYSE: TSLX, or the “Company”) today reported net investment income of $2.31 per share and net income of $2.61 per share, for the year ended December 31, 2023. For the quarter ended December 31, 2023 net investment income and net income per share were $0.62 and $0.58, respectively. The Company’s net investment income in the fourth quarter was largely driven by a robust level of interest income from the strength of the core earnings power of the portfolio. Return on equity (ROE) for the full year 2023 was 14.1% and 15.9% on a net investment income and a net income basis, respectively. Annualized ROE for the fourth quarter 2023 was 14.7% and 13.8% on a net investment income and a net income basis, respectively. Both net investment income per share and net income per share for the year include approximately $0.05 per share of capital gains incentive fee expenses that were accrued, but not paid or payable, related to cumulative unrealized capital gains in excess of cumulative net realized capital gains less any cumulative unrealized losses and capital gains incentive fees paid inception-to-date. Excluding the impact of the accrued capital gains incentive fee expenses, the Company’s adjusted net investment income and adjusted net income for the year ended December 31, 2023 were $2.36 per share and $2.66 per share, respectively. For the quarter ended December 31, 2023, adjusted net investment income per share was $0.62 and adjusted net income per share was $0.58. Return on equity (ROE) for the full year 2023 was 14.4% and 16.2% on an adjusted net investment income and an adjusted net income basis, respectively. Annualized ROE for the fourth quarter 2023 was 14.5% and 13.6% on an adjusted net investment income and an adjusted net income basis, respectively. Reported net asset value (NAV) per share was $17.04 at December 31, 2023 as compared to $16.97 at September 30, 2023. The Company announced that its Board of Directors has declared a first quarter 2024 base dividend of $0.46 per share to shareholders of record as of March 15, 2024 and payable on March 28, 2024. The Board also announced a fourth quarter supplemental dividend of $0.08 per share to shareholders of record as of February 29, 2024, payable on March 20, 2024. Adjusted for the impact of the supplemental dividend related to this quarter’s earnings, the Company’s Q4 adjusted NAV per share was $16.96. The primary drivers of this year’s NAV per share growth were the over-earning of our base dividend through net investment income, accretive capital markets transactions, and realized and unrealized gains on investments. Post-quarter end, the Company issued $350.0 million aggregate principal amount of unsecured notes that mature on March 1, 2029 (the "2029 Notes"). The 2029 Notes bear interest at a rate of 6.125% per year. The Company used the net proceeds of the 2029 Notes to repay outstanding indebtedness under the Revolving Credit Facility. In connection with the offering, the Company entered into an interest rate swap to better align the interest rate of its liabilities with the Company's investment portfolio, which consists of predominately floating rate loans. As a result of the swap, the Company's effective interest rate on the 2029 Notes is SOFR plus 243 basis points. | | Net Investment Income Per Share |
2023: Q4 2023: | $2.31 $0.62 |
2023 (adjusted): Q4 2023 (adjusted): | $2.36 $0.62 |
| |
Net Income Per Share |
2023: Q4 2023: | $2.61 $0.58 |
2023 (adjusted): Q4 2023 (adjusted): | $2.66 $0.58 |
| |
Return on Equity |
2023 (NII): Q4 2023 (NII): | 14.1% 14.7% |
2023 (NI): Q4 2023 (NI): | 15.9% 13.8% |
2023 (Adj. NII): Q4 2023 (Adj. NII): | 14.4% 14.5% |
2023 (Adj. NI): Q4 2023 (Adj. NI): | 16.2% 13.6% |
| |
NAV |
Q4 2023 ($MM): | $1,496.4 |
Q4 2023 (per share): | $17.04 |
Q4 2023 (per share, adj): | $16.96 |
| |
Dividends Declared (per share) |
Q4 2023 (Base): | $0.46 |
2023 (Base): | $1.84 |
2023 (Supplemental): | $0.26 |
2023 (Total): | $2.10 |
| | |
Portfolio and Investment Activity
| | | |
For the year ended December 31, 2023, new investment commitments totaled $958.6 million. This compares to $1,084.2 million for the year ended December 31, 2022. For the year ended December 31, 2023, the principal amount of new investments funded was $808.4 million in 29 new portfolio companies, 16 existing portfolio companies and 1 structured credit investment. For this period, the Company had $469.1 million aggregate principal amount in exits and repayments. For the year ended December 31, 2022, the principal amount of new investments funded was $864.0 million in 24 new portfolio companies, 20 existing portfolio companies and 41 structured credit investments. For this period, the Company had $653.8 million aggregate principal amount in exits and repayments. Fourth Quarter For the quarter ended December 31, 2023, new investment commitments totaled $316.4 million. This compares to $205.8 million for the quarter ended September 30, 2023. For the quarter ended December 31, 2023, the principal amount of new investments funded was $277.9 million across 9 new portfolio companies and 5 upsizes to existing portfolio companies. For this period, the Company had $145.4 million aggregate principal amount in exits and repayments. For the quarter ended September 30, 2023, the principal amount of new investments funded was $151.6 million across 8 new portfolio companies and 2 upsizes to existing portfolio companies. For this period, the Company had $158.9 million aggregate principal amount in exits and repayments. As of December 31, 2023 and September 30, 2023, the Company had investments in 941 and 892 portfolio companies, respectively, with an aggregate fair value of $3,283.1 million and $3,113.3 million, respectively. As of December 31, 2023, the average investment size in each portfolio company was $34.31 million based on fair value. As of December 31, 2023, the Company’s portfolio based on fair value consisted of 91.3% first-lien debt investments, 1.1% second-lien debt investments, 1.7% structured credit investments, 1.2% mezzanine debt investments, and 4.7% equity and other investments. As of September 30, 2023, the Company’s portfolio based on fair value consisted of 91.0% first-lien debt investments, 1.3% second-lien debt investments, 1.7% structured credit investments, 1.2% mezzanine investments, and 4.8% equity and other investments. As of December 31, 2023, 99.7% of debt investments based on fair value in the portfolio bore interest at floating rates, with 100.0% of these subject to reference rate floors. The Company’s credit facilities also bear interest at floating rates. In connection with the Company’s Unsecured Notes, which bear interest at fixed rates, the Company has entered into fixed-to-floating interest rate swaps in order to align the nature of the interest rates of its liabilities with its investment portfolio. For the period ended December 31, 2023 and September 30, 2023, the weighted average total yield of debt and income-producing securities at fair value (which includes interest income and amortization of fees and discounts) was 14.1% and 14.2%, respectively, and the weighted average total yield of debt and income-producing securities at amortized cost (which includes interest income and amortization of fees and discounts) was 14.2% and 14.3%, respectively. As of December 31, 2023, non-accrual investments represented 0.62% of the portfolio at fair value. No new investments were added to non-accrual status during the quarter. | | 2023 Origination Activity |
| Commitments: | $958.6MM |
| Fundings: | $808.4MM |
| Net Fundings: | $339.2MM |
| | |
| Q4 2023 Origination Activity |
| Commitments: | $316.4MM |
| Fundings: | $277.9MM |
| Net Fundings: | $132.5MM |
| | |
| Average Investment Size1 |
| $34.3MM |
| (1.0% of the portfolio at fair value) |
| | |
| | |
| First Lien Debt Investments (% FV) |
| 91.3% |
| |
| | |
| Floating Rate Debt Investments3 |
| (% FV) |
| 99.7% |
| | |
| Weighted Average Yield of Debt and Incoming-Producing Securities |
| Yield at Fair Value: | 14.1% |
| Yield at Amortized Cost: | 14.2% |
| | |
| 1.As of December 31, 2023, excludes 42 structured credit investments with a total fair value of $55.8 million. 2.As of September, 30 2023, excludes 42 structured credit investments with a total fair value of $54.0 million. 3.Calculation includes income earning debt investments only. |
Results of Operations for the Full year and Three Months Ended December 31, 2023
| | | |
Full Year | | |
| | 2023 |
For the years ended December 31, 2023 and 2022, investment income totaled $438.1 million and $309.3 million, respectively. The increase in investment income was primarily the result of higher interest from investments driven by increased all-in yields. Net expenses totaled $239.3 million and $140.4 million for the years ended December 31, 2023 and 2022, respectively. The increase in net expenses was primarily due to the upward movement in reference rates which increased the Company’s weighted average interest rate on average debt outstanding. | |
| Investment Income: | $438.1MM |
| Net Expenses: | $239.3MM |
| | |
Fourth Quarter | | |
| | Q4 2023 |
For the three months ended December 31, 2023 and 2022, total investment income was $119.5 million and $100.1 million, respectively. The increase in total investment income was primarily the result of higher interest from investments driven by increased all-in yields. Net expenses totaled $64.3 million and $46.4 million for the three months ended December 31, 2023 and 2022, respectively. The increase in expenses was primarily driven by higher interest expense resulting from the upward movement in reference rates which increased the Company’s weighted average interest rate on average debt outstanding. | |
| Investment Income: | $119.5MM |
| Net Expenses: | $64.3MM |
| | |
Debt and Capital Resources | | |
| | |
As of December 31, 2023, the Company had $25.2 million in cash and cash equivalents (including $24.0 million of restricted cash), total principal value of debt outstanding of $1,837.2 million, and $820.2 million of undrawn capacity on its revolving credit facility, subject to borrowing base and other limitations. At year end, aggregate commitments under the Company’s revolving credit facility were $1.710 billion, in accordance with the accordion feature. The Company’s weighted average interest rate on debt outstanding was 7.8% and 7.5% for the three months ended December 31, 2023 and September 30, 2023, respectively. At December 31, 2023, the Company’s debt to equity ratio was 1.23x, compared to 1.15x at September 30, 2023. Average debt to equity was 1.22x and 1.18x during the three months ended December 31, 2023 and September 30, 2023, respectively. | | Total Principal Debt Outstanding |
| $1,837.2MM |
| | |
| Debt-to-Equity Ratio |
| Q4 2023 Quarter End: | 1.23x |
| 2023 Average1: | 1.20x |
| Q4 2023 Average1: | 1.22x |
1.Daily average debt outstanding during the quarter divided by the daily average net assets during the quarter. Daily average net assets is calculated by starting with the prior quarter end net asset value and adjusting for capital activity during the quarter (adding common stock offerings / DRIP contributions). | | | |
LIQUIDITY AND FUNDING PROFILE
Liquidity
The following tables summarize the Company’s liquidity at December 31, 2023 and changes to unfunded commitments since September 30, 2023.
$ Millions
| | | | |
Revolving Credit Facility | | Unfunded Commitment Activity |
Revolver Capacity | $1,710 | | Unfunded Commitments (See Note 8 in 9/30/23 10-Q) | $327 |
Drawn on Revolver | ($890) | | Extinguished Unfunded Commitments | ($25) |
Unrestricted Cash Balance | $1 | | New Unfunded Commitments | $73 |
Total Liquidity (Pre-Unfunded Commitments) | $821 | | Net Drawdown of Unfunded Commitments | ($59) |
Available Unfunded Commitments1 | ($226) | | Total Unfunded Commitments | $316 |
Total Liquidity (Burdened for Unfunded Commitments) | $595 | | Unavailable Unfunded Commitments1 | ($90) |
| | | Available Unfunded Commitments1 | $226 |
1.Commitments may be subject to limitations on borrowings set forth in the agreements between the Company and the applicable portfolio company. As a result, portfolio companies may not be eligible to borrow the full commitment amount on such date.
Note: May not sum due to rounding
Funding Profile
At December 31, 2023, the Company’s funding mix was comprised of 70% unsecured and 30% secured debt*. As illustrated below, the Company’s weighted average remaining life of investments funded with debt was ~2.7 years, compared to a weighted average remaining maturity on debt of ~3.8 years*.
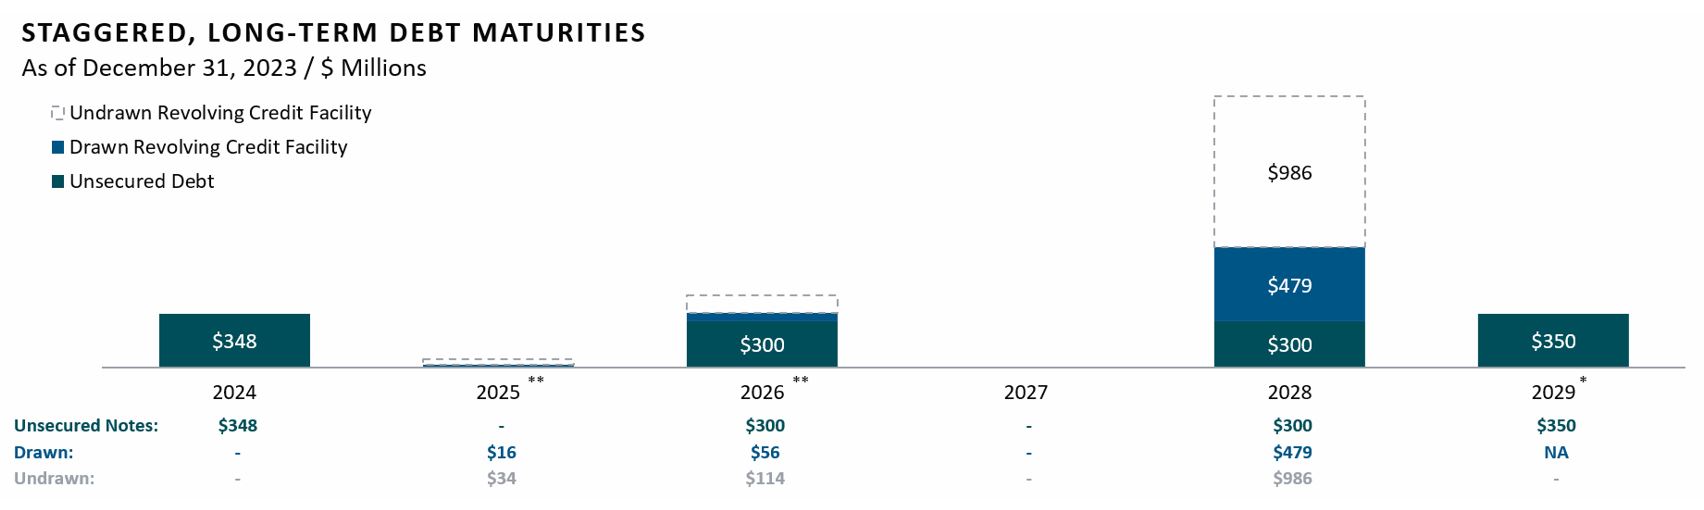
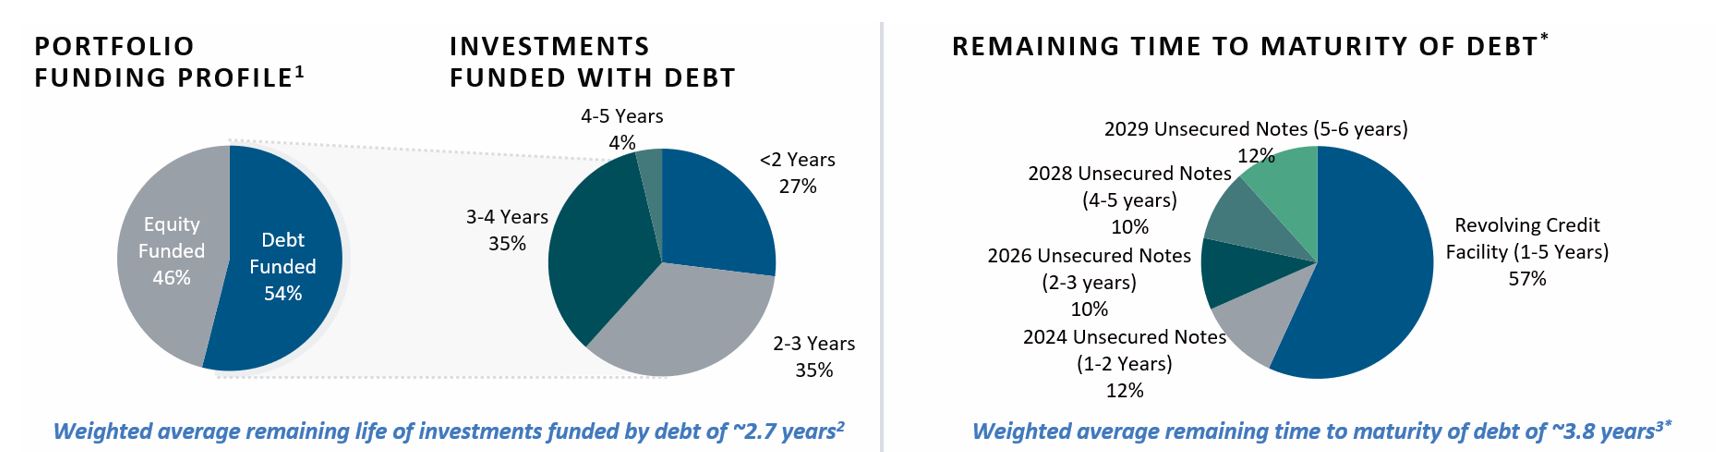
*Adjusted to reflect the $350 million of 2029 unsecured notes that closed in January 2024, the net proceeds of which were used to pay down a portion of the outstanding borrowings on the revolving credit facility.
**Includes $50 million of non-extending commitments with a maturity of February 4, 2026 and a revolving period ending February 4, 2025 and $170 million of non-extending commitments with a maturity of April 23, 2027 and a revolving period ending April 24, 2026. Adjusted for $25 million of non-extending commitments with a maturity of January 31, 2025 that was terminated on January 31, 2024.
1.Net of Deferred Financing Costs and Interest Rate Fair Value Hedging. Deferred Financing Costs total $21.9M at 12/31/23. Fair value hedge on interest rate swaps related to the unsecured notes total $31.8M at 12/31/23.
2.Weighted by amortized cost of debt investments. Investments are financed by debt and equity capital. This analysis assumes longer-dated investments are currently funded by equity capital (46% of investments) and the remaining (shorter-dated) investments (54% of investments) are currently funded by debt financing. Investments for purposes of this analysis exclude unfunded commitments, and equity capital is defined as 12/31/23 net assets.
3.Weighted by gross commitment amount.
Note: Numbers may not sum due to rounding.
Conference Call and Webcast
Conference Call Information:
A conference call to discuss the Company’s financial results will be held at 8:30 a.m. Eastern Time on February 16, 2024. The conference call will be broadcast live in listen-only mode on the Investor Resources section of TSLX’s website at https://sixthstreetspecialtylending.gcs-web.com/events-and-presentations. The Events & Presentations page of the Investor Resources section of TSLX’s website also includes a slide presentation that complements the Earnings Conference Call. Please visit the website to test your connection before the webcast.
Research analysts who wish to participate in the conference call must first register at https://register.vevent.com/register/BI126013289d0d4b7e8eca53b37c50ebe9. Upon registration, all telephone participants will receive a confirmation email detailing how to join the conference call, including the dial-in number along with a unique passcode and registrant ID that can be used to access the call.
Replay Information:
A recorded version will be available under the same webcast link (https://sixthstreetspecialtylending.gcs-web.com/events-and-presentations) following the conclusion of the conference call.
Financial Highlights
(Amounts in millions, except per share amounts)
| | | | | | | | | | | | | | | |
| | | | | | Three Months Ended | | | | | |
| | | | | | (unaudited) | | | | | |
| | December 31, 2023 | | | September 30, 2023 | | | December 31, 2022 | |
Investments at Fair Value | | $ | | 3,283.1 | | | $ | | 3,113.3 | | | $ | | 2,787.9 | |
Total Assets | | $ | | 3,343.8 | | | $ | | 3,174.1 | | | $ | | 2,836.9 | |
Net Asset Value Per Share | | $ | | 17.04 | | | $ | | 16.97 | | | $ | | 16.48 | |
Supplemental Dividend Per Share | | $ | | 0.08 | | | $ | | 0.07 | | | $ | | 0.09 | |
Adjusted Net Asset Value Per Share (1) | | $ | | 16.96 | | | $ | | 16.90 | | | $ | | 16.39 | |
| | | | | | | | | | | | |
Investment Income | | $ | | 119.5 | | | $ | | 114.4 | | | $ | | 100.1 | |
Net Investment Income | | $ | | 54.7 | | | $ | | 50.0 | | | $ | | 52.6 | |
Net Income | | $ | | 51.2 | | | $ | | 64.8 | | | $ | | 46.3 | |
Accrued Capital Gains Incentive Fee Expense | | $ | | (0.7 | ) | | $ | | 2.6 | | | $ | | (1.1 | ) |
Adjusted Net Investment Income (2) | | $ | | 54.0 | | | $ | 52.6 | | | $ | | 51.5 | |
Adjusted Net Income (2) | | $ | | 50.5 | | | $ | | 67.4 | | | $ | | 45.1 | |
| | | | | | | | | | | | |
Net Investment Income Per Share | | $ | 0.62 | | | $ | 0.57 | | | $ | | 0.65 | |
Net Income Per Share | | $ | 0.58 | | | $ | 0.74 | | | $ | | 0.57 | |
Accrued Capital Gains Incentive Fee Expense Per Share | | $ | | (0.01 | ) | | $ | | 0.03 | | | $ | | (0.01 | ) |
Adjusted Net Investment Income Per Share (2) | | $ | | 0.62 | | | $ | | 0.60 | | | $ | | 0.64 | |
Adjusted Net Income Per Share (2) | | $ | | 0.58 | | | $ | 0.77 | | | $ | | 0.56 | |
| | | | | | | | | | | | |
Annualized Return on Equity (Net Investment Income) (3) | | | | 14.7 | % | | | | 13.7 | % | | | | 15.9 | % |
Annualized Return on Equity (Net Income) (3) | | | | 13.8 | % | | | | 17.8 | % | | | | 14.0 | % |
Annualized Return on Equity (Adjusted Net Investment Income) (2)(3) | | | | 14.5 | % | | | | 14.4 | % | | | | 15.5 | % |
Annualized Return on Equity (Adjusted Net Income) (2)(3) | | | | 13.6 | % | | | | 18.5 | % | | | | 13.6 | % |
| | | | | | | | | | | | |
Weighted Average Yield of Debt and Income Producing Securities at Fair Value | | | | 14.1 | % | | | | 14.2 | % | | | | 13.5 | % |
Weighted Average Yield of Debt and Income Producing Securities at Amortized Cost | | | | 14.2 | % | | | | 14.3 | % | | | | 13.4 | % |
Percentage of Debt Investment Commitments at Floating Rates (4) | | | | 99.7 | % | | | | 99.7 | % | | | | 98.9 | % |
1.Adjusted net asset value per share gives effect to the supplemental dividend declared related to earnings or special dividend in the applicable period.
2.Adjusted to exclude the capital gains incentive fee that was accrued, but not paid, related to cumulative unrealized capital gains in excess of cumulative net realized capital gains less any cumulative unrealized losses and capital gains incentive fees paid inception to date.
3.Return on equity is calculated using prior period’s ending net asset value per share.
4.Includes one or more fixed rate investments for which the Company entered into an interest rate swap agreement to swap to floating rate. Calculation includes income earning debt investments only.
Financial Statements and Tables
Sixth Street Specialty Lending, Inc.
Consolidated Balance Sheets
(Amounts in thousands, except share and per share amounts)
| | | | | | | | |
| | December 31, | | | December 31, | |
| | 2023 | | | 2022 | |
Assets | | | | | | |
Investments at fair value | | | | | | |
Non-controlled, non-affiliated investments (amortized cost of $3,172,853 and $2,707,442, respectively) | | $ | 3,223,152 | | | $ | 2,717,170 | |
Controlled, affiliated investments (amortized cost of $78,159 and $67,284, respectively) | | | 59,913 | | | | 70,755 | |
Total investments at fair value (amortized cost of $3,251,012 and $2,774,726, respectively) | | | 3,283,065 | | | | 2,787,925 | |
Cash and cash equivalents (restricted cash of $23,979 and $15,437, respectively) | | | 25,196 | | | | 25,647 | |
Interest receivable | | | 27,969 | | | | 18,846 | |
Prepaid expenses and other assets | | | 7,578 | | | | 4,529 | |
Total Assets | | $ | 3,343,808 | | | $ | 2,836,947 | |
Liabilities | | | | | | |
Debt (net of deferred financing costs of $21,930 and $17,760, respectively) | | $ | 1,780,307 | | | $ | 1,441,796 | |
Management fees payable to affiliate | | | 11,962 | | | | 10,526 | |
Incentive fees on net investment income payable to affiliate | | | 11,451 | | | | 10,918 | |
Incentive fees on net capital gains accrued to affiliate | | | 10,446 | | | | 6,064 | |
Other payables to affiliate | | | 2,802 | | | | 3,265 | |
Other liabilities | | | 30,465 | | | | 22,809 | |
Total Liabilities | | | 1,847,433 | | | | 1,495,378 | |
Commitments and contingencies (Note 8) | | | | | | |
Net Assets | | | | | | |
Preferred stock, $0.01 par value; 100,000,000 shares authorized; no shares
issued and outstanding | | | — | | | | — | |
Common stock, $0.01 par value; 400,000,000 shares authorized, 88,493,749
and 82,053,537 shares issued, respectively; and 87,829,499 and 81,389,287
shares outstanding, respectively | | | 885 | | | | 821 | |
Additional paid-in capital | | | 1,405,173 | | | | 1,294,751 | |
Treasury stock at cost; 664,250 and 664,250 shares held, respectively | | | (10,459 | ) | | | (10,459 | ) |
Distributable earnings | | | 100,776 | | | | 56,456 | |
Total Net Assets | | | 1,496,375 | | | | 1,341,569 | |
Total Liabilities and Net Assets | | $ | 3,343,808 | | | $ | 2,836,947 | |
Net Asset Value Per Share | | $ | 17.04 | | | $ | 16.48 | |
Sixth Street Specialty Lending, Inc.
Consolidated Statements of Operations
(Amounts in thousands, except share and per share amounts)
| | | | | | | | | | | | |
| | Year Ended | | | Year Ended | | | Year Ended | |
| | December 31, 2023 | | | December 31, 2022 | | | December 31, 2021 | |
Income | | | | | | | | | |
Investment income from non-controlled, non-affiliated investments: | | | | | | | | | |
Interest from investments | | $ | 411,022 | | | $ | 292,442 | | | $ | 261,782 | |
Dividend income | | | 4,181 | | | | 2,159 | | | | 3,426 | |
Other income | | | 15,122 | | | | 9,502 | | | | 7,751 | |
Total investment income from non-controlled, non-affiliated investments | | | 430,325 | | | | 304,103 | | | | 272,959 | |
Investment income from non-controlled, affiliated investments: | | | | | | | | | |
Interest from investments | | — | | | | 133 | | | | 838 | |
Dividend income | | — | | | — | | | | 740 | |
Other income | | — | | | — | | | — | |
Total investment income from non-controlled, affiliated investments | | — | | | | 133 | | | | 1,578 | |
Investment income from controlled, affiliated investments: | | | | | | | | | |
Interest from investments | | | 7,756 | | | | 5,064 | | | | 4,039 | |
Other income | | | 6 | | | | 5 | | | | 17 | |
Total investment income from controlled, affiliated investments | | | 7,762 | | | | 5,069 | | | | 4,056 | |
Total Investment Income | | | 438,087 | | | | 309,305 | | | | 278,593 | |
Expenses | | | | | | | | | |
Interest | | | 133,731 | | | | 62,991 | | | | 38,825 | |
Management fees | | | 46,382 | | | | 39,900 | | | | 37,081 | |
Incentive fees on net investment income | | | 42,590 | | | | 33,401 | | | | 33,062 | |
Incentive fees on net capital gains | | | 4,382 | | | | (8,864 | ) | | | 13,507 | |
Professional fees | | | 7,323 | | | | 7,192 | | | | 6,586 | |
Directors’ fees | | | 806 | | | | 736 | | | | 743 | |
Other general and administrative | | | 5,280 | | | | 5,427 | | | | 6,236 | |
Total expenses | | | 240,494 | | | | 140,783 | | | | 136,040 | |
Management and incentive fees waived (Note 3) | | | (1,171 | ) | | | (427 | ) | | | (190 | ) |
Net Expenses | | | 239,323 | | | | 140,356 | | | | 135,850 | |
Net Investment Income Before Income Taxes | | | 198,764 | | | | 168,949 | | | | 142,743 | |
Income taxes, including excise taxes | | | 2,365 | | | | 2,622 | | | | 384 | |
Net Investment Income | | | 196,399 | | | | 166,327 | | | | 142,359 | |
Unrealized and Realized Gains (Losses) | | | | | | | | | |
Net change in unrealized gains (losses): | | | | | | | | | |
Non-controlled, non-affiliated investments | | | 40,571 | | | | (70,085 | ) | | | 17,938 | |
Non-controlled, affiliated investments | | — | | | | (14,350 | ) | | | 14,350 | |
Controlled, affiliated investments | | | (21,717 | ) | | | 8,054 | | | | 17,450 | |
Translation of other assets and liabilities in foreign currencies | | | (6,393 | ) | | | 8,721 | | | | (591 | ) |
Interest rate swaps | | | 174 | | | | (6,748 | ) | | | (6,699 | ) |
Income tax provision | | | 556 | | | | (561 | ) | | | (1,902 | ) |
Total net change in unrealized gains (losses) | | | 13,191 | | | | (74,969 | ) | | | 40,546 | |
Realized gains (losses): | | | | | | | | | |
Non-controlled, non-affiliated investments | | | 12,095 | | | | 1,072 | | | | 28,849 | |
Non-controlled, affiliated investments | | | 158 | | | | 13,608 | | | | (33 | ) |
Controlled, affiliated investments | | — | | | | 55 | | | — | |
Interest rate swaps | | — | | | | 2,251 | | | — | |
Foreign currency transactions | | | 180 | | | | (291 | ) | | | 59 | |
Total net realized gains (losses) | | | 12,433 | | | | 16,695 | | | | 28,875 | |
Total Net Unrealized and Realized Gains (Losses) | | | 25,624 | | | | (58,274 | ) | | | 69,421 | |
Increase (Decrease) in Net Assets Resulting from Operations | | $ | 222,023 | | | $ | 108,053 | | | $ | 211,780 | |
Earnings per common share—basic | | $ | 2.61 | | | $ | 1.38 | | | $ | 2.93 | |
Weighted average shares of common stock outstanding—basic | | | 85,131,264 | | | | 78,197,826 | | | | 72,169,488 | |
Earnings per common share—diluted | | $ | 2.61 | | | $ | 1.38 | | | $ | 2.79 | |
Weighted average shares of common stock outstanding—diluted | | | 85,131,264 | | | | 78,197,826 | | | | 77,702,258 | |
The Company’s investment activity for the year ended December 31, 2023, 2022 and 2021 is presented below (information presented herein is at par value unless otherwise indicated).
| | | | | | | | | | | | |
| | Year Ended | |
($ in millions) | | December 31, 2023 | | | December 31, 2022 | | | December 31, 2021 | |
New investment commitments: | | | | | | | | | |
Gross originations (1) | | $ | 6,516.6 | | | $ | 4,240.9 | | | $ | 4,269.9 | |
Less: Syndications/sell downs (1) | | | 5,558.0 | | | | 3,156.7 | | | | 3,152.5 | |
Total new investment commitments | | $ | 958.6 | | | $ | 1,084.2 | | | $ | 1,117.4 | |
Principal amount of investments funded: | | | | | | | | | |
First-lien | | $ | 753.4 | | | $ | 761.7 | | | $ | 1,022.1 | |
Second-lien | | | 8.4 | | | | — | | | | 43.5 | |
Mezzanine | | | 32.2 | | | | — | | | | 6.1 | |
Equity and other | | | 12.8 | | | | 44.8 | | | | — | |
Structured Credit | | | 1.6 | | | | 57.5 | | | | 45.7 | |
Total | | $ | 808.4 | | | $ | 864.0 | | | $ | 1,117.4 | |
Principal amount of investments sold or repaid: | | | | | | | | | |
First-lien | | $ | 460.3 | | | $ | 645.4 | | | $ | 962.6 | |
Second-lien | | | — | | | | — | | | | 5.8 | |
Mezzanine | | | — | | | | — | | | | — | |
Equity and other | | | 6.0 | | | | 4.3 | | | | 31.7 | |
Structured Credit | | | 2.8 | | | | 4.1 | | | | 4.4 | |
Total | | $ | 469.1 | | | $ | 653.8 | | | $ | 1,004.5 | |
Number of new investment commitments in
new portfolio companies | | | 30 | | | | 65 | | | | 25 | |
Average new investment commitment amount in
new portfolio companies | | $ | 29.2 | | | $ | 14.6 | | | $ | 47.5 | |
Weighted average term for new investment
commitments in new portfolio companies
(in years) | | | 6.0 | | | | 6.1 | | | | 5.3 | |
Percentage of new debt investment commitments
at floating rates | | | 99.5 | % | | | 98.9 | % | | | 99.5 | % |
Weighted average interest rate of new
investment commitments | | | 12.9 | % | | | 11.9 | % | | | 9.2 | % |
Weighted average spread over reference rate of new
floating rate investment commitments | | | 7.6 | % | | | 7.8 | % | | | 9.0 | % |
Weighted average interest rate on investments
fully sold or paid down | | | 13.7 | % | | | 9.9 | % | | | 9.1 | % |
1.Includes affiliates of Sixth Street.
About Sixth Street Specialty Lending
Sixth Street Specialty Lending is a specialty finance company focused on lending to middle-market companies. The Company seeks to generate current income primarily in U.S.-domiciled middle-market companies through direct originations of senior secured loans and, to a lesser extent, originations of mezzanine loans and investments in corporate bonds and equity securities. The Company has elected to be regulated as a business development company, or a BDC, under the Investment Company Act of 1940 and the rules and regulations promulgated thereunder. The Company is externally managed by Sixth Street Specialty Lending Advisers, LLC, an affiliate of Sixth Street and a Securities and Exchange Commission (“SEC”) registered investment adviser. The Company leverages the deep investment, sector, and operating resources of Sixth Street, a global investment firm with over $75 billion in assets under management and committed capital. For more information, visit the Company’s website at https://sixthstreetspecialtylending.com.
About Sixth Street
Sixth Street is a global investment firm with over $75 billion in assets under management and committed capital. The firm uses its long-term flexible capital, data-enabled capabilities, and One Team culture to develop themes and offer solutions to companies across all stages of growth. Founded in 2009, Sixth Street has more than 550 team members including over 200 investment professionals around the world. For more information, visit https://sixthstreet.com or follow Sixth Street on LinkedIn.
Forward-Looking Statements
Statements included herein may constitute “forward-looking statements,” within the meaning of the federal securities laws and the Private Securities Litigation Reform Act of 1995, which relate to future events or the Company’s future performance or financial condition. These forward-looking statements can be identified by the use of forward-looking terminology, such as “outlook,” “indicator,” “believes,” “expects,” “potential,” “continues,” “may,” “can,” “will,” “should,” “seeks,” “approximately,” “predicts,” “intends,” “plans,” “estimates,” “anticipates”, “confident,” “conviction,” “identified” or the negative versions of these words or other comparable words thereof. These statements are not guarantees of future performance, conditions or results and involve a number of risks and uncertainties. Actual results may differ materially from those in the forward-looking statements as a result of a number of factors, including those described from time to time in the Company’s filings with the SEC, which are accessible on the SEC’s website at www.sec.gov. Except as otherwise required by federal securities laws, the Company assumes no obligation to update any such forward-looking statements, whether as a result of new information, future developments or otherwise.
Non-GAAP Financial Measures
Adjusted net investment income and adjusted net income are each non-GAAP financial measures, which represent net investment income and net income, respectively, in each case less the impact of accrued capital gains incentive fee expenses. The Company believes that adjusted net investment income and adjusted net income provide useful information to investors regarding the fundamental earnings power of the business, and these figures are used by the Company to measure its financial condition and results of operations. The presentation of this additional information is not meant to be considered in isolation or as a substitute for financial results prepared in accordance with GAAP.
Investors:
Cami VanHorn, 469-621-2033
Sixth Street Specialty Lending
IRTSLX@sixthstreet.com
Media:
Patrick Clifford, 617-793-2004
Sixth Street
PClifford@sixthstreet.com