Exhibit 99.1

third Quarter 2020 Earnings Results
Sixth Street Specialty Lending, Inc. Reports Third Quarter Net Investment Income Per Share of $0.61 and NAV Per Share of $16.87; Declares a Fourth Quarter Base Dividend Per Share of $0.41 and a Third Quarter Supplemental Dividend Per Share of $0.10
NEW YORK—November 4, 2020— Sixth Street Specialty Lending, Inc. (NYSE: TSLX, or the “Company”) today reported net investment income of $41.1 million, or $0.61 per share, and net income of $81.9 million, or $1.21 per share, for the third quarter ended September 30, 2020. These results correspond to an annualized return on equity (ROE) on net investment income and net income of 15.1% and 30.1%, respectively, and an annualized year-to-date ROE on net investment income and net income of 13.5% and 14.7%, respectively. The Company’s strong net investment income this quarter was a function of both robust interest and fee income, as well as lower interest expense attributed to the 100% floating rate nature of the Company’s liability structure. The Company’s net income this quarter was supported by unrealized gains related to portfolio company-specific events, spread-related unrealized gains from the continued tightening of credit risk premiums during Q3, and realized gains from the sale of its AFS equity position at a price of $16.2 million, compared to a prior quarter fair value of $7.3 million.
Reported net asset value (NAV) per share was $16.87 at September 30, 2020 as compared to reported NAV per share of $16.08 at June 30, 2020. As mentioned, the drivers of this quarter’s NAV per share growth were the Company’s continued overearning of its base quarterly dividend, net realized and unrealized gains related to portfolio-company specific events, and unrealized gains from the impact of Q3 credit spread tightening on the valuation of the Company’s investments.
The Company announced that its Board of Directors has declared a fourth quarter 2020 base dividend of $0.41 per share to shareholders of record as of December 15, 2020, payable on January 15, 2021, and a third quarter supplemental dividend of $0.10 per share to shareholders of record as of November 30, 2020, payable on December 31, 2020. Adjusted for the impact of the supplemental dividend related to this quarter’s earnings, the Company’s Q3 pro forma NAV per share was $16.77.
As of September 30, 2020, 99.1% of the portfolio at fair value was meeting all payment and covenant requirements. The slight increase in this quarter’s non-accruals was driven by the addition of the Company’s 1st lien loan in MD America, partially offset by the removal of its Neiman Marcus prepetition term loan and the partial roll-up of its J.C. Penney prepetition 1st lien term loan into the DIP loan. On MD America, the Company received its regularly scheduled cash interest payment during the quarter but applied those proceeds to the amortized cost of the position given the Company’s view of an imminent reorganization of the company’s capital structure. Post quarter end, MD America made a voluntary paydown of $1.4 million and subsequently filed for protection under Chapter 11. In Q4, the Company expects to put $9 million of its loan, or ~70% of its remaining prepetition loan at 9/30/20 fair value, back on accrual status upon MD America’s emergence from Chapter 11. The Company’s remaining investment will be restructured into an equity position.
Net Investment Income |
Q3 2020 ($MM): | $41.1 |
Q3 2020 (per share): | $0.61 |
Net Income |
Q3 2020 ($MM): | $81.9 |
Q3 2020 (per share): | $1.21 |
NAV |
Q3 2020 ($MM): | $1,141 |
Q3 2020 (per share): | $16.87 |
PF Q3 2020 (per share): | $16.77 |
Dividends (per share) |
Q3 2020 (Base): | $0.41 |
LTM Q3’20 (Base): | $1.62 |
LTM Q3’20 (Supp/Special): | $0.66 |
LTM Q3’20 (Total): | $2.28 |
1
Portfolio and Investment Activity
For the quarter ended September 30, 2020, new investment commitments totaled $435.5 million. This compares to $89.2 million for the quarter ended June 30, 2020.
For the quarter ended September 30, 2020, the principal amount of new investments funded was $332.3 million in twelve new portfolio companies and four existing portfolio companies. For this period, the Company had $253.1 million aggregate principal amount in exits and repayments. For the quarter ended June 30, 2020, the principal amount of new investments funded was $76.5 million in six new portfolio companies and six existing portfolio companies. For this period, the Company had $210.7 million aggregate principal amount in exits and repayments.
As of September 30, 2020 and June 30, 2020, the Company had investments in 70 and 65 portfolio companies, respectively, with an aggregate fair value of $2,100.8 million and $1,983.8 million, respectively. As of September 30, 2020, the average investment size in each portfolio company was $30.0 million based on fair value.
As of September 30, 2020, the Company’s portfolio based on fair value consisted of 95.0% first-lien debt investments, 0.4% second-lien debt investments, 0.5% mezzanine investments, and 4.1% equity and other investments. As of June 30, 2020, the Company’s portfolio based on fair value consisted of 95.7% first-lien debt investments, 0.4% second-lien debt investments, 0.4% mezzanine investments, and 3.5% equity and other investments.
As of September 30, 2020 and June 30, 2020 approximately 95.4% and 96.1% of the portfolio was invested in secured debt, respectively.
As of September 30, 2020, 98.9% of debt investments based on fair value in the portfolio bore interest at floating rates (when including investment specific hedges), with 98.8% of these subject to a weighted average LIBOR floor of approximately 1.1%. The Company’s credit facilities also bear interest at floating rates. In connection with the Company’s Convertible Notes and other Notes, which bear interest at fixed rates, the Company entered into fixed-to-floating interest rate swaps in order to align the nature of the interest rates of its liabilities with its investment portfolio.
As of September 30, 2020 and June 30, 2020, the weighted average total yield
of debt and income-producing securities at fair value (which includes interest income and amortization of fees and discounts) was 10.1% and 10.0%, respectively, and the weighted average total yield of debt and income-producing securities at amortized cost (which includes interest income and amortization of fees and discounts) was 10.2% and 10.0%, respectively.
Fundings / Net Fundings |
$332.3MM / $79.2MM |
Average Investment Size |
$30.0MM
(1.4% of the portfolio at fair value) |
First Lien Debt Investments (% FV) |
95.0% |
Secured Debt Investments (% FV) |
95.4% |
Floating Rate Debt Investments (% FV) |
98.9% |
Weighted Average Yield of Debt and Incoming-Producing Securities |
Yield at Fair Value: | 10.1% |
Yield at Amortized Cost: | 10.2% |
2
Results of Operations for the Three Months Ended SEPTEMBER 30, 2020
Total Investment Income
For the three months ended September 30, 2020 and 2019, investment income totaled $71.3 million and $70.1 million, respectively. The increase in total investment income primarily resulted from an increase in other income, primarily due to higher amendment and other fees.
Net Expenses
Net expenses totaled $28.2 million and $31.8 million for the three months ended September 30, 2020 and 2019, respectively. The decrease in expenses was primarily driven by lower interest expense resulting from a decrease in the average interest rate on debt outstanding.
Debt and Capital Resources
As of September 30, 2020, the Company had $15.7 million in cash and cash equivalents (including $11.8 million of restricted cash), total principal value of debt outstanding of $931.6 million, and $1,023.7 million of undrawn capacity on its revolving credit facility, subject to borrowing base and other limitations. The Company’s weighted average interest rate on debt outstanding was 2.4% and 3.3% for the three months ended September 30, 2020 and June 30, 2020, respectively. At September 30, 2020, the Company’s debt to equity ratio was 0.81x, stable from the prior quarter. Average debt to equity was 0.93x and 0.87x during the three months ended September 30, 2020 and June 30, 2020, respectively.
1. Daily average debt outstanding during the quarter divided by the daily average net assets during the quarter. Daily average net assets is calculated by starting with the prior quarter end net asset value and adjusting for capital activity during the quarter (adding common stock offerings / DRIP contributions).
Total Investment Income |
$71.3MM |
Total Principal Debt Outstanding |
$931.6MM |
Debt-to-Equity Ratio |
Q3 2020 Quarter End: | 0.81x |
Q3 2020 Average1: | 0.93x |
3
LIQUIDITY AND FUNDING PROFILE
Liquidity
The following tables summarizes the Company’s liquidity at September 30, 2020 and changes to unfunded commitments since June 30, 2020.
Revolving Credit Facility1 | | Unfunded Commitment Activity |
Revolver Capacity | $1,315 | | Unfunded Commitments (See Note 8 in 6/30/20 10-Q) | $152 |
Drawn on Revolver | ($291) | | Extinguished Unfunded Commitments | ($12) |
Unrestricted Cash Balance | $4 | | New Unfunded Commitments | $184 |
Total Liquidity (Pre-Unfunded Commitments) | $1,028 | | Net Drawdown of Unfunded Commitments | ($74) |
Available Unfunded Commitments | ($83) | | Total Unfunded Commitments | $250 |
Total Liquidity (Burdened for Unfunded Commitments) | $945 | | Unavailable Unfunded Commitments1 | ($167) |
| | | Available Unfunded Commitments | $83 |
1. Commitments may be subject to limitations on borrowings set forth in the agreements between the Company and the applicable portfolio company. As a result, portfolio companies may not be eligible to borrow the full commitment amount on such date.
Note: May not sum due to rounding.
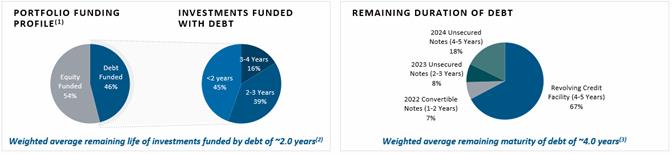
Funding Profile
At September 30, 2020, the Company’s funding mix was comprised of 69% unsecured and 31% secured debt. As illustrated below, the Company’s nearest debt maturity is in August 2022 at $143 million, and the weighted average remaining life of investments funded with debt was ~2.0 years, compared to a weighted average remaining maturity on debt of ~4.0 years.
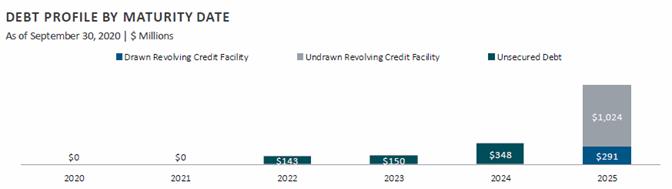
1. Net of Deferred Financing Costs and Interest Rate Fair Value Hedging. Deferred Financing Costs total $15.6M at 9/30/19, $18.5M at 12/31/19, $21.4M at 3/31/20, $19.7M at 6/30/20 and $18.4M at 9/30/20. Fair value hedge on interest rate swaps related to the 2024 notes total ($1.7) M at 12/31/19, $17.0M at 3/31/20, $19.3M at 6/30/20 and $18.1M at 9/30/20.
2. Weighted by amortized cost of debt investments. Investments are financed by debt and permanent equity capital. This analysis assumes longer-dated investments are currently funded by permanent equity capital (54% of investments) and the remaining (shorter-dated) investments (46% of investments) are currently funded by debt financing. Investments for purposes of this analysis exclude unfunded commitments, and permanent equity capital is defined as 9/30/20 net assets.
3. Weighted by gross commitment amount.
Note: Numbers may not sum to 100% due to rounding.
4
Conference Call and Webcast
Conference Call Information:
A conference call to discuss the Company’s financial results will be held live at 8:30 a.m. Eastern Time on November 5, 2020. Please visit TSLX’s webcast link located on the Events & Presentations page of the Investor Resources section of TSLX’s website http://www.sixthstreetspecialtylending.com for a slide presentation that complements the Earnings Conference Call. Please visit the website to test your connection before the webcast.
Participants are also invited to access the conference call by dialing one of the following numbers:
Domestic: (877) 359-9508
International: +1 (253) 237-1122
Conference ID: 1686272
All callers will need to enter the Conference ID followed by the # sign and reference “Sixth Street Specialty Lending” once connected with the operator. All callers are asked to dial in 10-15 minutes prior to the call so that name and company information can be collected.
Replay Information:
An archived replay will be available from approximately 12:00 p.m. Eastern Time on November 5 through November 12 via a webcast link located on the Investor Resources section of TSLX’s website, and via the dial-in numbers listed below:
Domestic: (855) 859-2056
International: +1 (404) 537-3406
Conference ID: 1686272
5
Financial Highlights
(Amounts in millions, except per share amounts)
| | | | | | | Three Months Ended | | | | | | |
| | | | | | | (unaudited) | | | | | | |
| | September 30, 2020 | | | June 30, 2020 | | | September 30, 2019 | |
| | | | | | | | | | | | | | | |
Investments at Fair Value | | $ | | 2,100.8 | | | $ | | 1,983.8 | | | $ | | 2,047.5 | |
Total Assets | | $ | | 2,136.6 | | | $ | | 2,018.6 | | | $ | | 2,073.3 | |
Net Asset Value Per Share | | $ | | 16.87 | | | $ | 16.08 | | | $ | 16.72 | |
Supplemental Dividend Per Share | | $ | | 0.10 | | | $ | | 0.00 | | | $ | | 0.08 | |
Pro Forma Net Asset Value Per Share (1) | | $ | | 16.77 | | | $ | | 16.08 | | | $ | | 16.64 | |
| | | | | | | | | | | | | | | |
Investment Income | | $ | 71.3 | | | $ | 70.3 | | | $ | | 70.1 | |
Net Investment Income | | $ | 41.1 | | | $ | 39.5 | | | $ | 36.7 | |
Net Income | | $ | 81.9 | | | $ | | 95.9 | | | $ | 30.3 | |
| | | | | | | | | | | | | | | |
Net Investment Income Per Share | | $ | 0.61 | | | $ | 0.59 | | | $ | 0.55 | |
Net Realized and Unrealized Gains (and Losses) Per Share | | $ | | 0.60 | | | $ | | 0.84 | | | $ | | (0.09 | ) |
Net Income Per Share | | $ | | 1.21 | | | $ | | 1.43 | | | $ | | 0.46 | |
Annualized Return on Equity (Net Investment Income) (2) | | | | 15.1 | % | | | | 15.6 | % | | | | 13.3 | % |
Annualized Return on Equity (Net Income) (2) | | | | 30.1 | % | | | | 38.0 | % | | | | 11.0 | % |
| | | | | | | | | | | | | | | |
Weighted Average Yield of Debt and Income Producing Securities at Fair Value | | | | 10.1 | % | | | | 10.0 | % | | | | 10.7 | % |
Weighted Average Yield of Debt and Income Producing Securities at Amortized Cost | | | | 10.2 | % | | | | 10.0 | % | | | | 10.8 | % |
Percentage of Debt Investment Commitments at Floating Rates (3) | | | | 98.9 | % | | | | 98.8 | % | | | | 99.1 | % |
1. Pro forma net asset value per share gives effect to the supplemental dividend declared related to earnings in the applicable period.
2. Return on equity is calculated using prior period’s ending net asset value per share.
3. Includes one or more fixed rate investments for which the Company entered into an interest rate swap agreement to swap to floating rate.
6
Financial Statements and Tables
Sixth Street Specialty Lending, Inc.
Consolidated Balance Sheets
(Amounts in thousands, except share and per share amounts)
(Unaudited)
| | September 30, | | | December 31, | |
| | 2020 | | | 2019 | |
Assets | | | | | | | | |
Investments at fair value | | | | | | | | |
Non-controlled, non-affiliated investments (amortized cost of $2,010,422 and $2,099,781, respectively) | | $ | 2,066,866 | | | $ | 2,147,876 | |
Non-controlled, affiliated investments (amortized cost of $0 and $49,445, respectively) | | | — | | | | 50,136 | |
Controlled, affiliated investments (amortized cost of $89,185 and $88,811, respectively) | | | 33,899 | | | | 47,916 | |
Total investments at fair value (amortized cost of $2,099,607 and $2,238,037, respectively) | | | 2,100,765 | | | | 2,245,928 | |
Cash and cash equivalents (restricted cash of $11,815 and $9,315, respectively) | | | 15,660 | | | | 14,143 | |
Interest receivable | | | 9,952 | | | | 13,055 | |
Prepaid expenses and other assets | | | 10,272 | | | | 7,805 | |
Total Assets | | $ | 2,136,649 | | | $ | 2,280,931 | |
Liabilities | | | | | | | | |
Debt (net of deferred financing costs of $18,438 and $18,471, respectively) | | $ | 929,380 | | | $ | 1,094,467 | |
Management fees payable to affiliate | | | 7,839 | | | | 8,234 | |
Incentive fees payable to affiliate | | | 8,719 | | | | 7,161 | |
Dividends payable | | | 27,728 | | | | 25,927 | |
Other payables to affiliate | | | 3,166 | | | | 1,948 | |
Other liabilities | | | 18,597 | | | | 23,897 | |
Total Liabilities | | | 995,429 | | | | 1,161,634 | |
Commitments and contingencies | | | | | | | | |
Net Assets | | | | | | | | |
Preferred stock, $0.01 par value; 100,000,000 shares authorized; no shares issued and outstanding | | | — | | | | — | |
Common stock, $0.01 par value; 400,000,000 shares authorized, 67,924,184 and 66,613,671 shares issued, respectively; and 67,628,140 and 66,524,591 shares outstanding, respectively | | | 679 | | | | 666 | |
Additional paid-in capital | | | 1,028,532 | | | | 1,009,270 | |
Treasury stock at cost; 296,044 and 89,080 shares held, respectively | | | (4,291 | ) | | | (1,359 | ) |
Distributable earnings | | | 116,300 | | | | 110,720 | |
Total Net Assets | | | 1,141,220 | | | | 1,119,297 | |
Total Liabilities and Net Assets | | $ | 2,136,649 | | | $ | 2,280,931 | |
Net Asset Value Per Share | | $ | 16.87 | | | $ | 16.83 | |
7
Sixth Street Specialty Lending, Inc.
Consolidated Statements of Operations
(Amounts in thousands, except share and per share amounts)
(Unaudited)
| | Three Months Ended | | | Nine Months Ended | |
| | September 30, 2020 | | | September 30, 2019 | | | September 30, 2020 | | | September 30, 2019 | |
Income | | | | | | | | | | | | | | | | |
Investment income from non-controlled, non-affiliated investments: | | | | | | | | | | | | | | | | |
Interest from investments | | $ | 59,786 | | | $ | 64,451 | | | $ | 181,667 | | | $ | 168,606 | |
Dividend income | | | 463 | | | — | | | | 1,339 | | | | 1 | |
Other income | | | 8,080 | | | | 2,712 | | | | 17,306 | | | | 6,730 | |
Total investment income from non-controlled, non-affiliated investments | | | 68,329 | | | | 67,163 | | | | 200,312 | | | | 175,337 | |
Investment income from non-controlled, affiliated investments: | | | | | | | | | | | | | | | | |
Interest from investments | | | 2,069 | | | | 1,332 | | | | 4,551 | | | | 5,093 | |
Other income | | | 22 | | | | 19 | | | | 59 | | | | 69 | |
Total investment income from non-controlled, affiliated investments | | | 2,091 | | | | 1,351 | | | | 4,610 | | | | 5,162 | |
Investment income from controlled, affiliated investments: | | | | | | | | | | | | | | | | |
Interest from investments | | | 895 | | | | 1,535 | | | | 2,893 | | | | 4,454 | |
Other income | | | 1 | | | | 1 | | | | 4 | | | | 10 | |
Total investment income from controlled, affiliated investments | | | 896 | | | | 1,536 | | | | 2,897 | | | | 4,464 | |
Total Investment Income | | | 71,316 | | | | 70,050 | | | | 207,819 | | | | 184,963 | |
Expenses | | | | | | | | | | | | | | | | |
Interest | | | 8,399 | | | | 12,570 | | | | 31,159 | | | | 35,664 | |
Management fees | | | 7,839 | | | | 7,875 | | | | 23,670 | | | | 21,870 | |
Incentive fees | | | 8,719 | | | | 7,794 | | | | 24,232 | | | | 20,050 | |
Professional fees | | | 1,562 | | | | 1,760 | | | | 5,186 | | | | 4,951 | |
Directors’ fees | | | 188 | | | | 139 | | | | 611 | | | | 403 | |
Other general and administrative | | | 1,505 | | | | 1,619 | | | | 4,717 | | | | 4,652 | |
Total expenses | | | 28,212 | | | | 31,757 | | | | 89,575 | | | | 87,590 | |
Management and incentive fees waived | | | — | | | | — | | | | — | | | | — | |
Net Expenses | | | 28,212 | | | | 31,757 | | | | 89,575 | | | | 87,590 | |
Net Investment Income Before Income Taxes | | | 43,104 | | | | 38,293 | | | | 118,244 | | | | 97,373 | |
Income taxes, including excise taxes | | | 2,000 | | | | 1,550 | | | | 4,010 | | | | 2,850 | |
Net Investment Income | | | 41,104 | | | | 36,743 | | | | 114,234 | | | | 94,523 | |
Unrealized and Realized Gains (Losses) | | | | | | | | | | | | | | | | |
Net change in unrealized gains (losses): | | | | | | | | | | | | | | | | |
Non-controlled, non-affiliated investments | | | 39,106 | | | | (11,589 | ) | | | 8,349 | | | | 16,478 | |
Non-controlled, affiliated investments | | | (3,607 | ) | | | 84 | | | | (691 | ) | | | 620 | |
Controlled, affiliated investments | | | 331 | | | | (4,399 | ) | | | (14,392 | ) | | | (12,365 | ) |
Translation of other assets and liabilities in foreign currencies | | | (4,557 | ) | | | 2,962 | | | | 863 | | | | 765 | |
Interest rate swaps | | | (1,498 | ) | | | 1,464 | | | | 8,200 | | | | 10,908 | |
Total net change in unrealized gains (losses) | | | 29,775 | | | | (11,478 | ) | | | 2,329 | | | | 16,406 | |
Realized gains (losses): | | | | | | | | | | | | | | | | |
Non-controlled, non-affiliated investments | | | (265 | ) | | | 4,868 | | | | (190 | ) | | | 5,323 | |
Non-controlled, affiliated investments | | | 11,819 | | | | — | | | | 11,819 | | | | — | |
Controlled, affiliated investments | | | (498 | ) | | | — | | | | (4,133 | ) | | | 570 | |
Extinguishment of debt | | | — | | | | — | | | | 739 | | | | — | |
Interest rate swaps | | | — | | | | 41 | | | | — | | | | 41 | |
Foreign currency transactions | | | (78 | ) | | | 167 | | | | (170 | ) | | | 18 | |
Total net realized gains (losses) | | | 10,978 | | | | 5,076 | | | | 8,065 | | | | 5,952 | |
Total Net Unrealized and Realized Gains (Losses) | | | 40,753 | | | | (6,402 | ) | | | 10,394 | | | | 22,358 | |
Increase in Net Assets Resulting from Operations | | $ | 81,857 | | | $ | 30,341 | | | $ | 124,628 | | | $ | 116,881 | |
Earnings per common share—basic and diluted | | $ | 1.21 | | | $ | 0.46 | | | $ | 1.86 | | | $ | 1.77 | |
Weighted average shares of common stock outstanding—basic and diluted | | | 67,584,660 | | | | 66,235,594 | | | | 67,068,166 | | | | 65,940,148 | |
8
The Company’s investment activity for quarter ended September 30, 2020 and 2019 is presented below (information presented herein is at par value unless otherwise indicated).
| | Three Months Ended | |
($ in millions) | | September 30, 2020 | | | September 30, 2019 | |
New investment commitments: | | | | | | | | |
Gross originations | | $ | 1,385.3 | | | $ | 616.5 | |
Less: Syndications/sell downs | | | 949.8 | | | | 260.9 | |
Total new investment commitments | | $ | 435.5 | | | $ | 355.6 | |
Principal amount of investments funded: | | | | | | | | |
First-lien | | $ | 324.2 | | | $ | 298.9 | |
Second-lien | | | — | | | | 8.7 | |
Mezzanine | | | — | | | | — | |
Equity and other | | | 8.1 | | | | 1.5 | |
Total | | $ | 332.3 | | | $ | 309.1 | |
Principal amount of investments sold or repaid: | | | | | | | | |
First-lien | | $ | 247.6 | | | $ | 305.8 | |
Second-lien | | | — | | | | — | |
Mezzanine | | | — | | | | — | |
Equity and other | | | 5.5 | | | | 4.1 | |
Total | | $ | 253.1 | | | $ | 309.9 | |
Number of new investment commitments in new portfolio companies | | | 12 | | | | 7 | |
Average new investment commitment amount in new portfolio companies | | $ | 34.8 | | | $ | 43.6 | |
Weighted average term for new investment commitments in new portfolio companies (in years) | | | 3.8 | | | | 4.5 | |
Percentage of new debt investment commitments at floating rates (1) | | | 100.0 | % | | | 100.0 | % |
Percentage of new debt investment commitments at fixed rates | | | 0.0 | % | | | 0.0 | % |
Weighted average interest rate of new investment commitments | | | 10.3 | % | | | 9.5 | % |
Weighted average spread over LIBOR of new floating rate investment commitments (1) | | | 10.1 | % | | | 7.6 | % |
Weighted average interest rate on investments fully sold or paid down | | | 9.6 | % | | | 12.2 | % |
1. Includes two fixed rate investments for the three months ended September 30, 2019, for which the Company entered into an interest rate swap agreement to swap to floating rates.
9
About Sixth Street Specialty Lending
Sixth Street Specialty Lending is a specialty finance company focused on lending to middle-market companies. The Company seeks to generate current income primarily in U.S.-domiciled middle-market companies through direct originations of senior secured loans and, to a lesser extent, originations of mezzanine loans and investments in corporate bonds and equity securities. The Company has elected to be regulated as a business development company, or a BDC, under the Investment Company Act of 1940 and the rules and regulations promulgated thereunder. The Company is externally managed by Sixth Street Specialty Lending Advisers, LLC, an affiliate of Sixth Street and a Securities and Exchange Commission (“SEC”) registered investment adviser. The Company leverages the deep investment, sector, and operating resources of Sixth Street, a global investment firm with approximately $48 billion of assets under management.* For more information, visit the Company’s website at www.sixthstreetspecialtylending.com.
About Sixth Street
Sixth Street is a global investment firm with approximately $48 billion in assets under management.* Sixth Street operates eight diversified, collaborative investment platforms across our growth investing, adjacencies, direct lending, fundamental public strategies, infrastructure, special situations, agriculture and par liquid credit businesses. Our long-term oriented, highly flexible capital base and “One Team” cultural philosophy allow us to invest thematically across sectors, geographies and asset classes. Founded in 2009, Sixth Street has more than 275 team members including over 140 investment professionals operating from nine locations around the world. For more information, visit www.sixthstreet.com.
Forward-Looking Statements
Statements included herein may constitute “forward-looking statements,” which relate to future events or the Company’s future performance or financial condition, including expectations with respect to the Company’s portfolio companies. These statements are not guarantees of future performance, conditions or results and involve a number of risks and uncertainties. Actual results may differ materially from those in the forward-looking statements as a result of a number of factors, including those described from time to time in the Company’s filings with the Securities and Exchange Commission. The Company assumes no obligation to update any such forward-looking statements.
* AUM presented as of 6/30/2020 plus additional capital commitments closed through 10/31/2020.
Investors:
Lucy Lu, 212–601-4753
Sixth Street Specialty Lending
IRTSLX@sixthstreet.com
Media:
Patrick Clifford, 617-793-2004
Sixth Street
PClifford@sixthstreet.com
10