Exhibit 99.1

k
THIRd Quarter 2021 Earnings Results
Sixth Street Specialty Lending, Inc. Reports Third Quarter Adjusted Net Investment Income Per Share of $0.55 and NAV Per Share of $17.18; Declares a Fourth Quarter Base Dividend Per Share of $0.41, a Third Quarter Supplemental Dividend Per Share of $0.07, and a Special Dividend Per Share of $0.50
NEW YORK—November 2, 2021— Sixth Street Specialty Lending, Inc. (NYSE: TSLX, or the “Company”) today reported adjusted net investment income of $0.55 per share and adjusted net income of $0.80 per share for the third quarter ended September 30, 2021. These results correspond to an annualized return on equity (ROE) on adjusted net investment income and adjusted net income of 13.0% and 19.0%, respectively.
Both adjusted net investment income per share and adjusted net income per share exclude approximately $0.05 per share of capital gains incentive fee expenses that were accrued, but not paid or payable, related to cumulative gains in excess of cumulative losses less capital gains incentive fees paid inception-to-date. Including the impact of the accrued capital gains incentive fee expenses, the Company’s net investment income and net income for the quarter ended September 30, 2021 were $36.5 million, or $0.50 per share, and $55.0 million, or $0.75 per share, respectively. The Company’s net investment income in the third quarter was driven by higher fees from elevated repayment activity, as well as a robust level of interest income from the strength in the core earnings power of the portfolio. The difference between this quarter’s net investment income and net income was due to net unrealized and realized gains from portfolio company-specific events.
Reported net asset value (NAV) per share was $17.18 at September 30, 2021 as compared to $16.85 at June 30, 2021. The primary drivers of this quarter’s NAV per share growth were the net realized and unrealized gains related to portfolio-company specific events, overearning of the base dividend, and net unrealized gains from the impact of credit spread tightening on the valuation of the Company’s investments.
The Company announced that its Board of Directors has declared a fourth quarter 2021 base dividend of $0.41 per share to shareholders of record as of December 15, 2021, payable on January 14, 2022, a third quarter supplemental dividend of $0.07 per share to shareholders of record as of November 30, 2021, payable on December 31, 2021, and a special dividend of $0.50 per share to shareholders of record as of December 7, 2021, payable on December 20, 2021. Adjusted for the impact of the supplemental and special dividends, the Company’s third quarter pro forma NAV per share was $16.61.
The Company has extended and amended its existing $50 million stock repurchase program to begin purchasing shares automatically when its stock trades at prices starting at $0.01 below 1.05x its most recently reported pro forma net asset value per share, instead of below 1.0x. The Company believes that given the strength in the earnings power of its portfolio, the ongoing cadence of supplemental and special dividends, and expectations for operating in its targeted debt-to-equity range, reinvesting in its existing portfolio at prices starting below 1.05x book would be highly ROE-accretive with a short payback period compared to any dilution in net asset value per share.
Net Investment Income Per Share |
Q3 2021 (adjusted): | $0.55 |
Q3 2021: | $0.50 |
Net Income Per Share |
Q3 2021 (adjusted): | $0.80 |
Q3 2021: | $0.75 |
Annualized ROE |
Q3 2021 (Adj NII): | 13.0% |
Q3 2021 (Adj NI): | 19.0% |
Q3 2021 (NII): | 11.9% |
Q3 2021 (NI): | 17.9% |
NAV |
Q3 2021 ($MM): | $1,251.8 |
Q3 2021 (per share) | $17.18 |
Q3 2021 (per share, PF): | $16.61 |
Dividends (per share) |
Q3 2021 (Base): | $0.41 |
LTM Q3’21 (Base): | $1.64 |
LTM Q3’21 (Supp/Special): | $1.95 |
LTM Q3’21 (Total): | $3.59 |
1
Portfolio and Investment Activity
For the quarter ended September 30, 2021, new investment commitments totaled $105.4 million. This compares to $303.1 million for the quarter ended June 30, 2021.
For the quarter ended September 30, 2021, the principal amount of new investments funded was $65.4 million across five portfolio companies. For this period, the Company had $283.7 million aggregate principal amount in exits and repayments. For the quarter ended June 30, 2021, the principal amount of new investments funded was $265.2 million across 15 portfolio companies. For this period, the Company had $107.8 million aggregate principal amount in exits and repayments.
As of September 30, 2021 and June 30, 2021, the Company had investments in 67 and 72 portfolio companies, respectively, with an aggregate fair value of $2,406.5 million and $2,570.0 million, respectively. As of September 30, 2021, the average investment size in each portfolio company was $35.9 million based on fair value.
As of September 30, 2021, the Company’s portfolio based on fair value consisted of 92.5% first-lien debt investments, 0.7% mezzanine debt investments, and 6.8% equity and other investments. As of June 30, 2021, the Company’s portfolio based on fair value consisted of 93.6% first-lien debt investments, 0.2% second-lien debt investments, 0.7% mezzanine investments, and 5.5% equity and other investments.
As of September 30, 2021, 98.9% of debt investments based on fair value in the portfolio bore interest at floating rates (when including investment specific hedges), with 99.4% of these subject to LIBOR floors. The Company’s credit facilities also bear interest at floating rates. In connection with the Company’s Convertible Notes and other Notes, which bear interest at fixed rates, the Company has entered into fixed-to-floating interest rate swaps in order to align the nature of the interest rates of its liabilities with its investment portfolio.
For the period ended September 30, 2021 and June 30, 2021, the weighted average total yield of debt and income-producing securities at fair value (which includes interest income and amortization of fees and discounts) was 9.9% and 9.8%, respectively, and the weighted average total yield of debt and income-producing securities at amortized cost (which includes interest income and amortization of fees and discounts) was 10.2% and 10.1%, respectively.
As of September 30, 2021, 100.0% of the portfolio at fair value was meeting all payment and covenant requirements.
1. | Calculation includes income earning debt investments only. |
Origination Activity |
Commitments: | $105.4MM |
Fundings: | $65.4MM |
Net Fundings/(Payoffs): | $(218.3)MM |
Average Investment Size |
$35.9MM
(1.5% of the portfolio at fair value) |
First Lien Debt Investments (% FV) |
92.5% |
Floating Rate Debt Investments1 (% FV) |
98.9% |
Weighted Average Yield of Debt and Incoming-Producing Securities |
Yield at Fair Value: | 9.9% |
Yield at Amortized Cost: | 10.2% |
2
Results of Operations for the Three Months Ended September 30, 2021
Total Investment Income
For the three months ended September 30, 2021 and 2020, total investment income was $71.2 million and $71.3 million, respectively.
Net Expenses
Net expenses totaled $34.6 million and $28.2 million for the three months ended September 30, 2021 and 2020, respectively. The increase in expenses was primarily driven by accrued capital gains incentive fees related to the Company’s cumulative gains in excess of cumulative losses less capital gains incentive fees paid inception‐to-date. It was also driven by higher interest expense primarily due to an increase in the average debt outstanding and higher management fees due to an increase in average assets.
Debt and Capital Resources
As of September 30, 2021, the Company had $18.3 million in cash and cash equivalents (including $12.8 million of restricted cash), total principal value of debt outstanding of $1,124.5 million, and $1,325.8 million of undrawn capacity on its revolving credit facility, subject to borrowing base and other limitations. During the quarter, aggregate commitments under the Company’s revolving credit facility were increased to $1.51 billion, in accordance with the accordion feature.
The Company’s weighted average interest rate on debt outstanding was 2.3% for both the three-month periods ended September 30, 2021 and June 30, 2021. At September 30, 2021, the Company’s debt to equity ratio was 0.90x, compared to 1.08x at June 30, 2021. Average debt to equity was 1.01x for the three-month period ended September 30, 2021, compared to 1.07x for the three-month period ended June 30, 2021.
On September 30, 2021, the Company notified the trustee and holders of the 2022 Convertible Notes that the terms of one of the conversion features had been met and the notes were eligible for conversion at the option of the holders. The notes remained convertible until October 12, 2021. During this period $42.8 million aggregate principal amount of notes were surrendered for conversion and the Company elected combination settlement that will be in nearly all stock. The settlement of the converted notes is expected to occur after the 40 day observation period described in the notes indenture.
1. | Daily average debt outstanding during the quarter divided by the daily average net assets during the quarter. Daily average net assets is calculated by starting with the prior quarter end net asset value and adjusting for capital activity during the quarter (adding common stock offerings / DRIP contributions). |
Total Investment Income |
$71.2MM |
Total Principal Debt Outstanding |
$1,124.5MM |
Debt-to-Equity Ratio |
Q3 2021 Quarter End: | 0.90x |
Q3 2021 Average1: | 1.01x |
3
LIQUIDITY AND FUNDING PROFILE
Liquidity
The following tables summarize the Company’s liquidity at September 30, 2021 and changes to unfunded commitments since June 30, 2021.
$ Millions
Revolving Credit Facility | | Unfunded Commitment Activity |
Revolver Capacity | $1,510 | | Unfunded Commitments (See Note 8 in 6/30/21 10-Q) | $191 |
Drawn on Revolver | ($184) | | Extinguished Unfunded Commitments | ($14) |
Unrestricted Cash Balance | $6 | | New Unfunded Commitments | $40 |
Total Liquidity (Pre-Unfunded Commitments) | $1,332 | | Net Drawdown of Unfunded Commitments | $(26) |
Available Unfunded Commitments1 | ($122) | | Total Unfunded Commitments | $191 |
Total Liquidity (Burdened for Unfunded Commitments) | $1,210 | | Unavailable Unfunded Commitments1 | ($69) |
| | | Available Unfunded Commitments1 | $122 |
1. | Commitments may be subject to limitations on borrowings set forth in the agreements between the Company and the applicable portfolio company. As a result, portfolio companies may not be eligible to borrow the full commitment amount on such date. |
Note: May not sum due to rounding.
Funding Profile
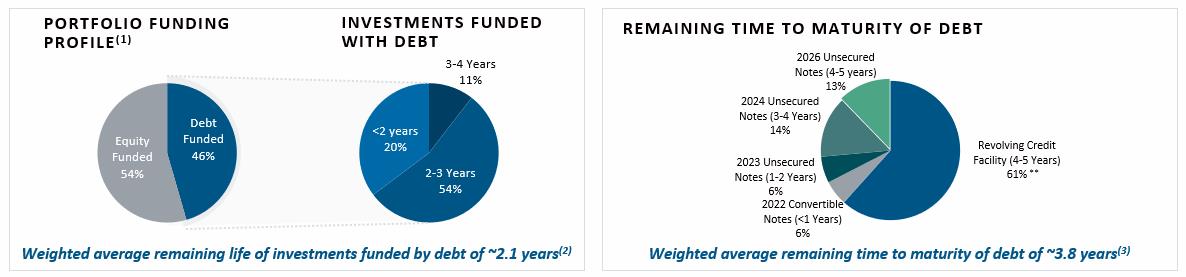
At September 30, 2021, the Company’s funding mix was comprised of 58% unsecured and 42% secured debt. As illustrated below, the Company’s nearest debt maturity is in August 2022 at $143 million, and the weighted average remaining life of investments funded with debt was ~2.1 years, compared to a weighted average remaining maturity on debt of ~3.8 years.
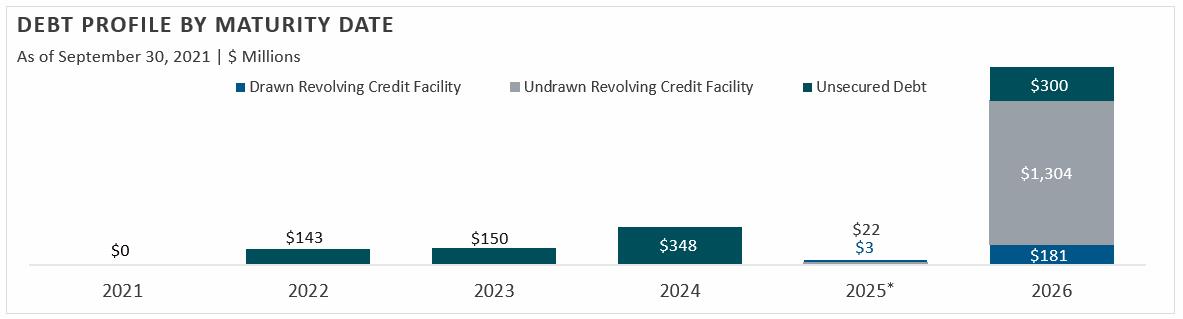
*Includes $25 million of non-extending commitments with a maturity of January 31, 2025 and a revolving period ending January 31, 2024.
1. | Net of Deferred Financing Costs and Interest Rate Fair Value Hedging. Deferred Financing Costs total $18.4M at 9/30/20, $17.2M at 12/31/20, $23.7M at 3/31/21, $22.3M at 6/30/21 and $20.8M at 9/30/21. Fair value hedge on interest rate swaps related to the 2024 and 2026 notes total $18.1M at 9/30/20, $16.8M at 12/31/20, $2.2M at 3/31/21 and $4.5M at 6/30/21 and $2.5M at 9/30/21. |
2. | Weighted by amortized cost of debt investments. Investments are financed by debt and equity capital. This analysis assumes longer-dated investments are currently funded by equity capital (54% of investments) and the remaining (shorter-dated) investments (46% of investments) are currently funded by debt financing. Investments for purposes of this analysis exclude unfunded commitments, and equity capital is defined as 9/30/21 net assets. |
3. | Weighted by gross commitment amount. |
Note: Numbers may not sum due to rounding.
4
Conference Call and Webcast
Conference Call Information:
A conference call to discuss the Company’s financial results will be held live at 8:30 a.m. Eastern Time on November 3, 2021. Please visit TSLX’s webcast link located on the Events & Presentations page of the Investor Resources section of TSLX’s website http://www.sixthstreetspecialtylending.com for a slide presentation that complements the Earnings Conference Call. Please visit the website to test your connection before the webcast.
Participants are also invited to access the conference call by dialing one of the following numbers:
Domestic: (877) 359-9508
International: +1 (253) 237-1122
Conference ID: 8554469
All callers will need to enter the Conference ID followed by the # sign and reference “Sixth Street Specialty Lending” once connected with the operator. All callers are asked to dial in 10-15 minutes prior to the call so that name and company information can be collected.
Replay Information:
An archived replay will be available from approximately 12:00 p.m. Eastern Time on November 3 through November 10 via a webcast link located on the Investor Resources section of TSLX’s website, and via the dial-in numbers listed below:
Domestic: (855) 859-2056
International: +1 (404) 537-3406
Conference ID: 8554469
5
Financial Highlights
(Amounts in millions, except per share amounts)
| | | | | | | | Three Months Ended | | | | | | | | |
| | | | | | | | (unaudited) | | | | | | | | |
| | September 30, 2021 | | | | June 30, 2021 | | | | September 30, 2020 | | |
| | | | | | | | | | | | | | | | | | |
Investments at Fair Value | | $ | | 2,406.5 | | | | $ | | 2,570.0 | | | | $ | | 2,100.8 | | |
Total Assets | | $ | | 2,438.5 | | | | $ | | 2,608.4 | | | | $ | | 2,136.6 | | |
Net Asset Value Per Share | | $ | | 17.18 | | | | $ | 16.85 | | | | $ | 16.87 | | |
Supplemental Dividend Per Share | | $ | | 0.07 | | | | $ | | 0.02 | | | | $ | | 0.10 | | |
Special Dividend Per Share | | $ | | 0.50 | | | | $ | 0.00 | | | | $ | | 0.00 | | |
Pro Forma Net Asset Value Per Share (1) | | $ | | 16.61 | | | | $ | 16.83 | | | | $ | | 16.77 | | |
| | | | | | | | | | | | | | | | | | |
Investment Income | | $ | 71.2 | | | | $ | 62.8 | | | | $ | | 71.3 | | |
Adjusted Net Investment Income(2) | | $ | 39.9 | | | | $ | 33.0 | | | | $ | 41.1 | | |
Adjusted Net Income (2) | | $ | 58.4 | | | | $ | 64.0 | | | | $ | 81.9 | | |
Accrued Capital Gains Incentive Fee Expense | | $ | 3.4 | | | | $ | 5.6 | | | | $ | 0.0 | | |
Net Investment Income | | $ | 36.5 | | | | $ | 27.4 | | | | $ | 41.1 | | |
Net Income | | $ | 55.0 | | | | $ | 58.4 | | | | $ | 81.9 | | |
| | | | | | | | | | | | | | | | | | |
Adjusted Net Investment Income Per Share(2) | | $ | 0.55 | | | | $ | 0.46 | | | | $ | 0.61 | | |
Adjusted Net Income Per Share(2) | | $ | | 0.80 | | | | $ | | 0.88 | | | | $ | 1.21 | | |
Accrued Capital Gains Incentive Fee Expense Per Share | | $ | 0.05 | | | | $ | 0.08 | | | | $ | 0.00 | | |
Net Investment Income Per Share | | $ | 0.50 | | | | $ | 0.38 | | | | $ | 0.61 | | |
Net Income Per Share | | $ | 0.75 | | | | $ | 0.80 | | | | $ | 1.21 | | |
| | | | | | | | | | | | | | | |
Annualized Return on Equity (Adjusted Net Investment Income) (2) (3) | | | | 13.0 | | % | | | | 11.0 | | % | | | | 15.1 | | % |
Annualized Return on Equity (Adjusted Net Income) (2) (3) | | | 19.0 | | % | | | | 21.4 | | % | | | 30.1 | | % |
Annualized Return on Equity (Net Investment Income)(3) | | | | 11.9 | | % | | | | 9.2 | | % | | | | 15.1 | | % |
Annualized Return on Equity (Net Income)(3) | | | | 17.9 | | % | | | | 19.5 | | % | | | | 30.1 | | % |
| | | | | | | | | | | | | | | | | | |
Weighted Average Yield of Debt and Income Producing Securities at Fair Value | | | | 9.9 | | % | | | 9.8 | | % | | | 10.1 | | % |
Weighted Average Yield of Debt and Income Producing Securities at Amortized Cost | | | 10.2 | | % | | | 10.1 | | % | | | 10.2 | | % |
Percentage of Debt Investment Commitments at Floating Rates (4) | | | | 98.9 | | % | | | | 98.9 | | % | | | | 98.9 | | % |
1. | Pro forma net asset value per share gives effect to the supplemental dividend declared related to earnings or special dividend in the applicable period. |
2. | Adjusted to exclude the capital gains incentive fee that was accrued, but not paid, related to cumulative unrealized capital gains in excess of cumulative net realized capital gains less any cumulative unrealized losses and capital gains incentive fees paid inception to date. |
3. | Return on equity is calculated using prior period’s ending net asset value per share. |
4. | Includes one or more fixed rate investments for which the Company entered into an interest rate swap agreement to swap to floating rate. Calculation includes income earning debt investments only. |
6
Financial Statements and Tables
Sixth Street Specialty Lending, Inc.
Consolidated Balance Sheets
(Amounts in thousands, except share and per share amounts)
(Unaudited)
| | September 30, | | | December 31, | |
| | 2021 | | | 2020 | |
Assets | | | | | | | | |
Investments at fair value | | | | | | | | |
Non-controlled, non-affiliated investments (amortized cost of $2,222,335 and $2,187,427, respectively) | | $ | 2,327,321 | | | $ | 2,249,302 | |
Non-controlled, affiliated investments (amortized cost of $12,723 and $12,892, respectively) | | | 22,929 | | | | 12,892 | |
Controlled, affiliated investments (amortized cost of $63,332 and $58,709, respectively) | | | 56,215 | | | | 36,676 | |
Total investments at fair value (amortized cost of $2,298,390 and $2,259,028, respectively) | | | 2,406,465 | | | | 2,298,870 | |
Cash and cash equivalents (restricted cash of $12,815 and $10,815, respectively) | | | 18,262 | | | | 13,274 | |
Interest receivable | | | 9,401 | | | | 8,583 | |
Prepaid expenses and other assets | | | 4,346 | | | | 17,866 | |
Total Assets | | $ | 2,438,474 | | | $ | 2,338,593 | |
Liabilities | | | | | | | | |
Debt (net of deferred financing costs of $20,813 and $17,246, respectively) | | $ | 1,103,114 | | | $ | 1,110,363 | |
Management fees payable to affiliate | | | 9,485 | | | | 8,435 | |
Incentive fees on net investment income payable to affiliate | | | 8,466 | | | | 7,252 | |
Incentive fees on net capital gains accrued to affiliate | | | 14,969 | | | | 1,421 | |
Dividends payable | | | 29,863 | | | | 27,728 | |
Other payables to affiliate | �� | | 3,279 | | | | 2,632 | |
Other liabilities | | | 17,453 | | | | 19,447 | |
Total Liabilities | | | 1,186,629 | | | | 1,177,278 | |
Commitments and contingencies | | | | | | | | |
Net Assets | | | | | | | | |
Preferred stock, $0.01 par value; 100,000,000 shares authorized; no shares issued and outstanding | | | — | | | | — | |
Common stock, $0.01 par value; 400,000,000 shares authorized, 73,145,021 and 67,980,253 shares issued, respectively; and 72,848,977 and 67,684,209 shares outstanding, respectively | | | 731 | | | | 680 | |
Additional paid-in capital | | | 1,134,015 | | | | 1,025,676 | |
Treasury stock at cost; 296,044 and 296,044 shares held, respectively | | | (4,291 | ) | | | (4,291 | ) |
Distributable earnings | | | 121,390 | | | | 139,250 | |
Total Net Assets | | | 1,251,845 | | | | 1,161,315 | |
Total Liabilities and Net Assets | | $ | 2,438,474 | | | $ | 2,338,593 | |
Net Asset Value Per Share | | $ | 17.18 | | | $ | 17.16 | |
7
Sixth Street Specialty Lending, Inc.
Consolidated Statements of Operations
(Amounts in thousands, except share and per share amounts)
(Unaudited)
| | Three Months Ended | | | Nine Months Ended | |
| | September 30, 2021 | | | September 30, 2020 | | | September 30, 2021 | | | September 30, 2020 | |
Income | | | | | | | | | | | | | | | | |
Investment income from non-controlled, non-affiliated investments: | | | | | | | | | | | | | | | | |
Interest from investments | | $ | 67,369 | | | $ | 59,786 | | | $ | 188,852 | | | $ | 181,667 | |
Dividend income | | | 804 | | | | 463 | | | | 2,081 | | | | 1,339 | |
Other income | | | 1,777 | | | | 8,080 | | | | 5,191 | | | | 17,306 | |
Total investment income from non-controlled, non-affiliated investments | | | 69,950 | | | | 68,329 | | | | 196,124 | | | | 200,312 | |
Investment income from non-controlled, affiliated investments: | | | | | | | | | | | | | | | | |
Interest from investments | | | 210 | | | | 2,069 | | | | 630 | | | | 4,551 | |
Dividend income | | | — | | | | — | | | | 545 | | | | — | |
Other income | | | — | | | | 22 | | | | — | | | | 59 | |
Total investment income from non-controlled, affiliated investments | | | 210 | | | | 2,091 | | | | 1,175 | | | | 4,610 | |
Investment income from controlled, affiliated investments: | | | | | | | | | | | | | | | | |
Interest from investments | | | 1,038 | | | | 895 | | | | 2,963 | | | | 2,893 | |
Other income | | | 2 | | | | 1 | | | | 7 | | | | 4 | |
Total investment income from controlled, affiliated investments | | | 1,040 | | | | 896 | | | | 2,970 | | | | 2,897 | |
Total Investment Income | | | 71,200 | | | | 71,316 | | | | 200,269 | | | | 207,819 | |
Expenses | | | | | | | | | | | | | | | | |
Interest | | | 9,856 | | | | 8,399 | | | | 28,999 | | | | 31,159 | |
Management fees | | | 9,545 | | | | 7,839 | | | | 27,701 | | | | 23,670 | |
Incentive fees on net investment income | | | 8,466 | | | | 8,719 | | | | 23,273 | | | | 24,232 | |
Incentive fees on net capital gains | | | 3,444 | | | | — | | | | 13,548 | | | | — | |
Professional fees | | | 1,626 | | | | 1,562 | | | | 4,806 | | | | 5,186 | |
Directors’ fees | | | 180 | | | | 188 | | | | 548 | | | | 611 | |
Other general and administrative | | | 1,569 | | | | 1,505 | | | | 4,688 | | | | 4,717 | |
Total expenses | | | 34,686 | | | | 28,212 | | | | 103,563 | | | | 89,575 | |
Management fees waived | | | (60 | ) | | | — | | | | (190 | ) | | | — | |
Net Expenses | | | 34,626 | | | | 28,212 | | | | 103,373 | | | | 89,575 | |
Net Investment Income Before Income Taxes | | | 36,574 | | | | 43,104 | | | | 96,896 | | | | 118,244 | |
Income taxes, including excise taxes | | | 104 | | | | 2,000 | | | | 729 | | | | 4,010 | |
Net Investment Income | | | 36,470 | | | | 41,104 | | | | 96,167 | | | | 114,234 | |
Unrealized and Realized Gains (Losses) | | | | | | | | | | | | | | | | |
Net change in unrealized gains (losses): | | | | | | | | | | | | | | | | |
Non-controlled, non-affiliated investments | | | 7,674 | | | | 39,106 | | | | 43,111 | | | | 8,349 | |
Non-controlled, affiliated investments | | | 4,115 | | | | (3,607 | ) | | | 10,206 | | | | (691 | ) |
Controlled, affiliated investments | | | 15,048 | | | | 331 | | | | 14,916 | | | | (14,392 | ) |
Translation of other assets and liabilities in foreign currencies | | | 3,711 | | | | (4,557 | ) | | | 4,289 | | | | 863 | |
Interest rate swaps | | | (1,502 | ) | | | (1,498 | ) | | | (4,775 | ) | | | 8,200 | |
Total net change in unrealized gains (losses) | | | 29,046 | | | | 29,775 | | | | 67,747 | | | | 2,329 | |
Realized gains (losses): | | | | | | | | | | | | | | | | |
Non-controlled, non-affiliated investments | | | (10,512 | ) | | | (265 | ) | | | 6,129 | | | | (190 | ) |
Non-controlled, affiliated investments | | | — | | | | 11,819 | | | | (33 | ) | | | 11,819 | |
Controlled, affiliated investments | | | — | | | | (498 | ) | | | — | | | | (4,133 | ) |
Extinguishment of debt | | | — | | | | — | | | | — | | | | 739 | |
Foreign currency transactions | | | (48 | ) | | | (78 | ) | | | (48 | ) | | | (170 | ) |
Total net realized gains (losses) | | | (10,560 | ) | | | 10,978 | | | | 6,048 | | | | 8,065 | |
Total Net Unrealized and Realized Gains (Losses) | | | 18,486 | | | | 40,753 | | | | 73,795 | | | | 10,394 | |
Increase in Net Assets Resulting from Operations | | $ | 54,956 | | | $ | 81,857 | | | $ | 169,962 | | | $ | 124,628 | |
Earnings per common share—basic | | $ | 0.75 | | | $ | 1.21 | | | $ | 2.37 | | | $ | 1.86 | |
Weighted average shares of common stock outstanding—basic | | | 72,808,730 | | | | 67,584,660 | | | | 71,696,874 | | | | 67,068,166 | |
Earnings per common share—diluted | | $ | 0.70 | | | $ | 1.21 | | | $ | 2.19 | | | $ | 1.86 | |
Weighted average shares of common stock outstanding—diluted | | | 80,515,411 | | | | 67,584,660 | | | | 79,403,555 | | | | 67,068,166 | |
8
The Company’s investment activity for quarter ended September 30, 2021 and 2020 is presented below (information presented herein is at par value unless otherwise indicated).
| | Three Months Ended | |
($ in millions) | | September 30, 2021 | | | September 30, 2020 | |
New investment commitments: | | | | | | | | |
Gross originations | | $ | 572.4 | | | $ | 1,385.3 | |
Less: Syndications/sell downs | | | 467.0 | | | | 949.8 | |
Total new investment commitments | | $ | 105.4 | | | $ | 435.5 | |
Principal amount of investments funded: | | | | | | | | |
First-lien | | $ | 65.1 | | | $ | 324.2 | |
Second-lien | | | — | | | | — | |
Mezzanine | | | — | | | | — | |
Equity and other | | | 0.3 | | | | 8.1 | |
Total | | $ | 65.4 | | | $ | 332.3 | |
Principal amount of investments sold or repaid: | | | | | | | | |
First-lien | | $ | 277.6 | | | $ | 247.6 | |
Second-lien | | | 5.8 | | | | — | |
Mezzanine | | | — | | | | — | |
Equity and other | | | 0.3 | | | | 5.5 | |
Total | | $ | 283.7 | | | $ | 253.1 | |
Number of new investment commitments in new portfolio companies | | | 1 | | | | 12 | |
Average new investment commitment amount in new portfolio companies | | $ | 75.0 | | | $ | 34.8 | |
Weighted average term for new investment commitments in new portfolio companies (in years) | | | 6.0 | | | | 3.8 | |
Percentage of new debt investment commitments at floating rates | | | 100.0 | % | | | 100.0 | % |
Percentage of new debt investment commitments at fixed rates | | | — | | | | — | |
Weighted average interest rate of new investment commitments | | | 10.7 | % | | | 10.3 | % |
Weighted average spread over LIBOR of new floating rate investment commitments | | | 10.6 | % | | | 10.1 | % |
Weighted average interest rate on investments fully sold or paid down | | | 9.0 | % | | | 9.6 | % |
9
About Sixth Street Specialty Lending
Sixth Street Specialty Lending is a specialty finance company focused on lending to middle-market companies. The Company seeks to generate current income primarily in U.S.-domiciled middle-market companies through direct originations of senior secured loans and, to a lesser extent, originations of mezzanine loans and investments in corporate bonds and equity securities. The Company has elected to be regulated as a business development company, or a BDC, under the Investment Company Act of 1940 and the rules and regulations promulgated thereunder. The Company is externally managed by Sixth Street Specialty Lending Advisers, LLC, an affiliate of Sixth Street and a Securities and Exchange Commission (“SEC”) registered investment adviser. The Company leverages the deep investment, sector, and operating resources of Sixth Street, a global investment firm with over $50 billion of assets under management. For more information, visit the Company’s website at www.sixthstreetspecialtylending.com.
About Sixth Street
Sixth Street is a global investment firm with over $50 billion in assets under management and committed capital. Sixth Street uses its long-term flexible capital, cross-platform approach, and data-enabled capabilities to develop themes and offer solutions to companies across all stages of growth. Sixth Street operates nine diversified, collaborative investment platforms: TAO, Growth, Direct Lending, Fundamental Strategies, Infrastructure, Opportunities, Insurance, Agriculture, and Credit Market Strategies. Founded in 2009, Sixth Street has more than 320 team members including over 145 investment professionals operating from nine locations around the world. For more information, visit www.sixthstreet.com.
Forward-Looking Statements
Statements included herein may constitute “forward-looking statements,” which relate to future events or the Company’s future performance or financial condition, including expectations with respect to the Company’s portfolio companies. These statements are not guarantees of future performance, conditions or results and involve a number of risks and uncertainties. Actual results may differ materially from those in the forward-looking statements as a result of a number of factors, including those described from time to time in the Company’s filings with the Securities and Exchange Commission. The Company assumes no obligation to update any such forward-looking statements.
Non-GAAP Financial Measures
Adjusted net investment income and adjusted net income are each non-GAAP financial measures, which represent net investment income and net income, respectively, in each case less the impact of accrued capital gains incentive fee expenses. The Company believes that adjusted net investment income and adjusted net income provide useful information to investors regarding the fundamental earnings power of the business, and these figures are used by the Company to measure its financial condition and results of operations. The presentation of this additional information is not meant to be considered in isolation or as a substitute for financial results prepared in accordance with GAAP.
Investors:
Lucy Lu, 212-601-4753
Sixth Street Specialty Lending
IRTSLX@sixthstreet.com
Media:
Patrick Clifford, 617-793-2004
Sixth Street
PClifford@sixthstreet.com
10