 Stephens Fall Investment Conference November 11, 2014 © C&J Energy Services, Inc. 2014 Exhibit 99.1 |
 Disclaimer © C&J Energy Services, Inc. 2014 2 Important Information for Investors and Stockholders This communication does not constitute an offer to sell or the solicitation of an offer to buy any securities or a solicitation of any vote or approval. In connection with the proposed merger between C&J Energy Services, Inc. (“C&J”) and the Completion and Production Services business of Nabors Industries Ltd. (“Nabors”), Nabors Red Lion Limited (“Red Lion”), a subsidiary of Nabors, has filed with the U.S. Securities and Exchange Commission (“SEC”) a registration statement on Form S-4, which includes a preliminary prospectus of Red Lion and a preliminary proxy statement of C&J. Nabors, Red Lion and C&J also plan to file other documents with the SEC regarding the proposed merger. After the registration statement has been declared effective by the SEC, a definitive proxy statement/prospectus will be mailed to the stockholders of C&J. INVESTORS AND SECURITY HOLDERS OF C&J ARE URGED TO READ THE PROXY STATEMENT/PROSPECTUS (INCLUDING ALL AMENDMENTS AND SUPPLEMENTS THERETO) AND OTHER DOCUMENTS RELATING TO THE PROPOSED MERGER THAT WILL BE FILED WITH THE SEC CAREFULLY AND IN THEIR ENTIRETY WHEN THEY BECOME AVAILABLE BECAUSE THEY WILL CONTAIN IMPORTANT INFORMATION ABOUT THE PROPOSED MERGER. Investors and stockholders will be able to obtain free copies of the proxy statement/prospectus and other documents containing important information about Nabors, Red Lion and C&J, once such documents are filed with the SEC, through the website maintained by the SEC at http://www.sec.gov. Copies of the documents filed with the SEC by Nabors and Red Lion will be available free of charge on Nabors’s internet website at www.nabors.com under the tab “Investor Relations” and then under the tab “SEC Filings” or by contacting Nabors’s Investor Relations Department at 281-775-8038. Copies of the documents filed with the SEC by C&J will be available free of charge on C&J’s internet website at www.cjenergy.com under the tab “Investor Relations” and then under the tab “SEC Filings” or by contacting C&J’s Investor Relations Department at 713-260-9986. Participants in the Solicitation C&J, Red Lion, Nabors and their respective directors and certain executive officers may be deemed to be participants in the solicitation of proxies from the stockholders of C&J in connection with the proposed merger. Information about the directors and executive officers of C&J is set forth in C&J’s proxy statement for its 2014 annual meeting of stockholders, which was filed with the SEC on April 10, 2014. Other information regarding the participants in the proxy solicitation and a description of their direct and indirect interests, by security holdings or otherwise, will be contained in the proxy statement/prospectus and other relevant materials filed with the SEC in connection with the proposed merger when they become available. Free copies of these documents can be obtained using the contact information above. |
 Disclaimer © C&J Energy Services, Inc. 2014 3 Cautionary Statement Regarding Forward-Looking Statements This communication contains “forward-looking statements” within the meaning of Section 27A of the Securities Act of 1933 and Section 21E of the Securities and Exchange Act of 1934. These include statements regarding the effects of the proposed merger, estimates, expectations, projections, goals, forecasts, assumptions, risks and uncertainties and are typically identified by words or phrases such as “may,” “will,” “anticipate,” “estimate,” “expect,” “project,” “intend,” “plan,” “believe,” “target,” “forecast,” and other words and terms of similar meaning. For example, statements regarding future financial performance, future competitive positioning and business synergies, future acquisition cost savings, future accretion to earnings per share, future market demand, future benefits to stockholders, future economic and industry conditions, the proposed merger (including its benefits, results, effects and timing), the attributes of C&J as a subsidiary of Red Lion and whether and when the transactions contemplated by the merger agreement will be consummated, are forward-looking statements within the meaning of federal securities laws. These forward-looking statements are subject to numerous risks and uncertainties, many of which are beyond the companies’ control, which could cause actual benefits, results, effects and timing to differ materially from the results predicted or implied by the statements. These risks and uncertainties include, but are not limited to: the failure of the stockholders of C&J to approve the proposed merger; the risk that the conditions to the closing of the proposed merger are not satisfied; the risk that regulatory approvals required for the proposed merger are not obtained or are obtained subject to conditions that are not anticipated; potential adverse reactions or changes to business relationships resulting from the announcement or completion of the proposed merger; uncertainties as to the timing of the proposed merger; competitive responses to the proposed merger; costs and difficulties related to the integration of C&J’s business and operations with Red Lion’s business and operations; the inability to obtain or delay in obtaining cost savings and synergies from the proposed merger; unexpected costs, charges or expenses resulting from the proposed merger; the outcome of pending or potential litigation; the inability to retain key personnel; uncertainty of the expected financial performance of C&J following completion of the proposed merger; and any changes in general economic and/or industry specific conditions. Nabors and C&J caution that the foregoing list of factors is not exclusive. Additional information concerning these and other risk factors is contained in Nabors’s and C&J’s most recently filed Annual Reports on Form 10-K, subsequent Quarterly Reports on Form 10-Q, recent Current Reports on Form 8-K, and other SEC filings, which are available at the SEC’s website, http://www.sec.gov. All subsequent written and oral forward-looking statements concerning Nabors, C&J, the proposed transaction or other matters attributable to Nabors and C&J or any person acting on their behalf are expressly qualified in their entirety by the cautionary statements above. Each forward looking statement speaks only as of the date of the particular statement, and neither Nabors nor C&J undertakes any obligation to publicly update any of these forward-looking statements to reflect events or circumstances that may arise after the date hereof. |
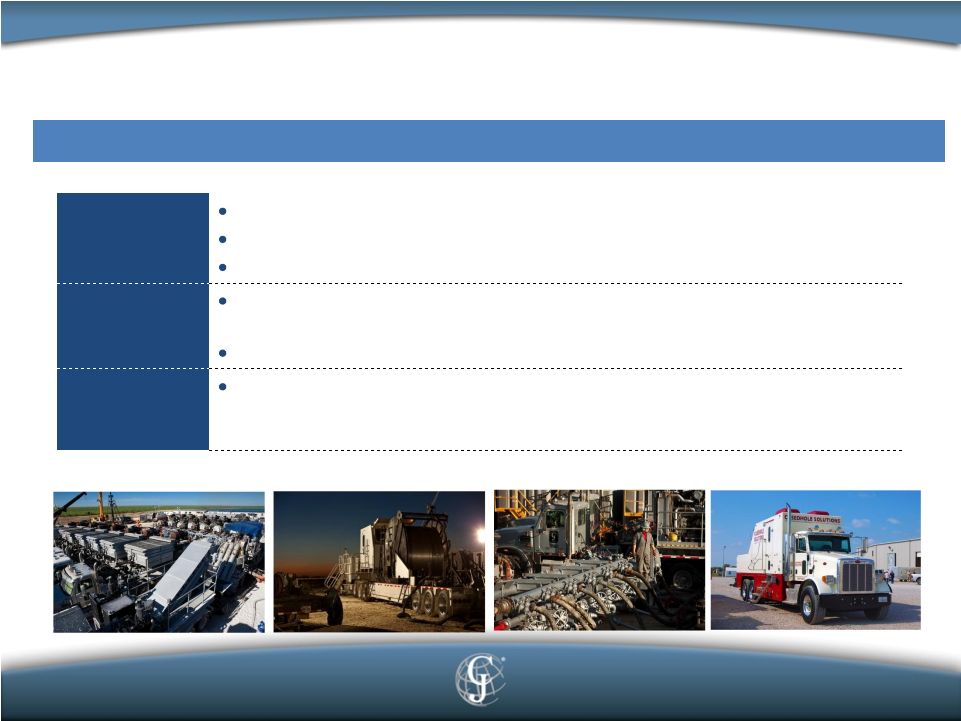 C&J Energy Services © C&J Energy Services, Inc. 2014 Diversified provider of premium, technologically-advanced completion services 4 Hydraulic Fracturing Fracturing fleets provide customized stimulation services Engineering teams offer extensive front-end technical evaluation Demonstrated operating efficiencies and superior execution Coiled Tubing Coiled tubing division consists of large dimension coiled tubing units and pumpdown equipment Ability to handle heavy-duty jobs across a wide spectrum of environments Wireline and Related Services Wireline services segment provides cased-hole wireline, pumpdown and other complementary services, including logging, perforating, pipe recovery and pressure testing services |
 Operational Model Drives Best-In-Class Performance • Target high volume, high efficiency customers who recognize that the value that C&J provides through efficiency gains results in significant cost savings to them • Focused on complex, service intensive wells with 24-hour operations and multi- well pad drilling – Demonstrated shorter time per completion – More frac stages per well keep fleets onsite longer, allowing more pumping hours per month © C&J Energy Services, Inc. 2014 5 Operating efficiencies capitalize on targeted opportunities |
 Operational Model Driving Significant Growth and Margin Expansion • C&J is well-positioned to capitalize on growth in high service intensity jobs and high efficiency work – Highly active core customer base focused on maximizing equipment utilization – Differentiated by highest quality service and equipment, coupled with superior execution and operating efficiency – Strong presence in Eagle Ford, Permian and Bakken • Q3 execution generated a notably positive impact on margins and revenue growth: – Strong logistical management enabled C&J to avoid headwinds and increase Adjusted EBITDA margin by 270 basis points – margins benefited from stabilization of input costs and strong utilization – New equipment was met with solid demand and assets were immediately deployed at high utilization levels © C&J Energy Services, Inc. 2014 6 Gaining market share with targeted customer base |
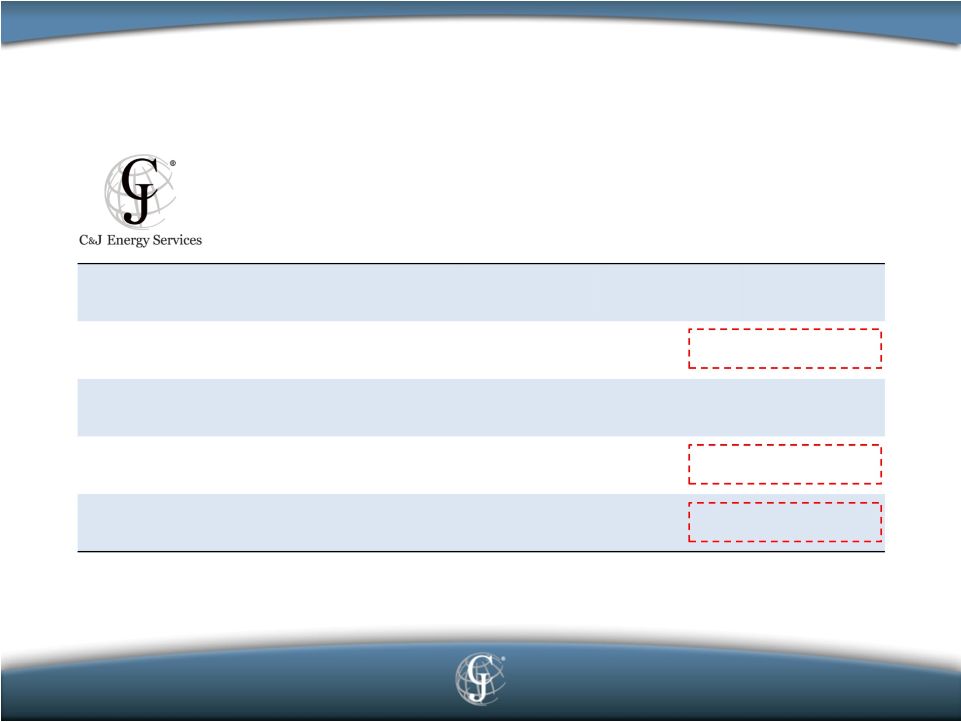 (1) See page 27 for C&J’s definition of Adjusted EBITDA, a non-GAAP financial measure, and required reconciliation to GAAP financial measures. Adjusted EBITDA includes costs from strategic initiatives of $8.1 million , $9.5 million and $9.9 million for Q1, Q2 and Q3, respectively. Operational Model Driving Significant Growth and Margin Expansion © C&J Energy Services, Inc. 2014 Q1 2014 Q2 2014 Q3 2014 Revenue ($mm) $317 $368 $440 % Revenue Growth (Sequential) 20% 16% 20% Adjusted EBITDA ($mm) (1) $43 $53 $75 % Adjusted EBITDA Margin 14% 14% 17% % Adjusted EBITDA Growth (Seq.) 18% 23% 42% 7 Source: Public filings |
 Overview of Nabors Transaction © C&J Energy Services, Inc. 2014 |
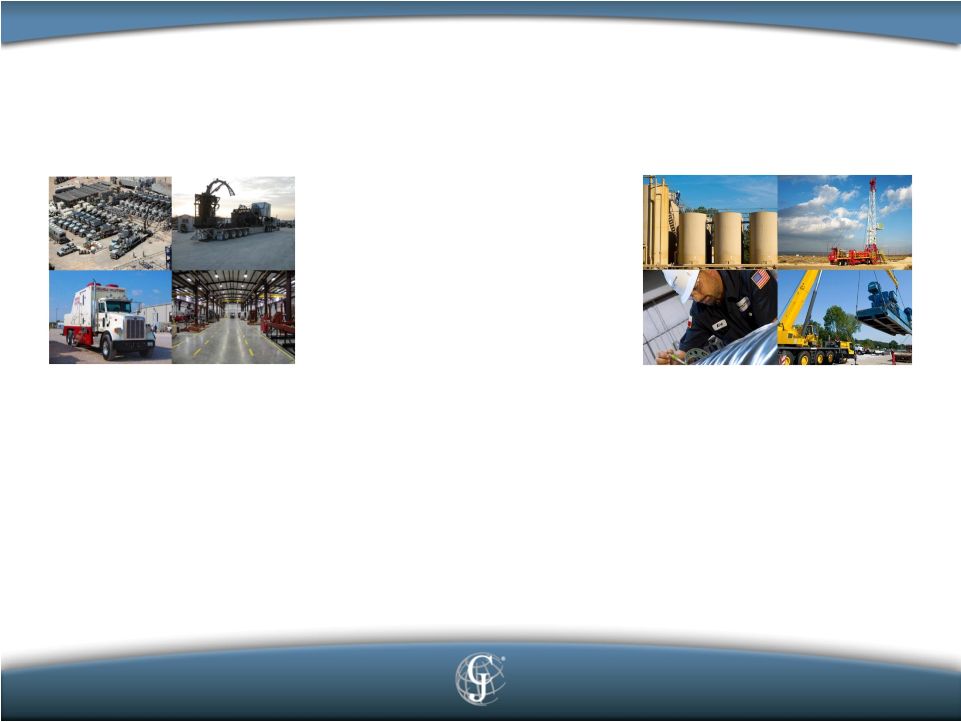 The Combined Company © C&J Energy Services, Inc. 2014 Production Services Completion Services 9 Vertically Integrated & Other Services • Hydraulic Fracturing • Coiled Tubing • Wireline • Cementing • Equipment Manufacturing • Specialty Chemicals • Downhole Tools & Directional Drilling • Data Control Systems • Research & Technology • Fluids Management • Workover & Well Servicing • Special Services |
 A Powerful Combination of Complementary Businesses © C&J Energy Services, Inc. 2014 • The combination of C&J Energy and Nabors Completion & Production Services Business creates the 5 largest completion and production services provider, positioned to capitalize on opportunities through its greater scale, enhanced offerings and significant operating efficiencies – Over 1.1 million HHP of pressure pumping capacity across the US – Over 650 workover rigs in the US and Canada – ~1,500 fluid management trucks – Over 10,000 employees Completion & Production Services Pro Forma 10 th |
 Compelling Financial Benefits for Shareholders of Both Companies © C&J Energy Services, Inc. 2014 11 • Transaction expected to be accretive to C&J Energy's cash earnings for the first full year of combined operations • Annual run-rate synergies of more than $100 million are expected to be fully realized by 2017 • Combined company retains strong balance sheet and preserves leverage capacity for further expansion • Transaction enhances financial flexibility as the combined company becomes a more global enterprise |
 Strategic Rationale © C&J Energy Services, Inc. 2014 Source: C&J Energy Services and Nabors managements. Creates Leading Diversified Services Provider Creates a leading diversified completion and production service provider – – Largest fluid services fleet with ~1,500 fluid trucks – Over 650 workover rigs Combines Complementary Completion Businesses Creates immediate opportunity to capitalize on attractive market dynamics and improved activity levels in completions – – Provides additional assets within existing C&J Energy Services markets such as Eagle Ford and Permian – Adds cementing, which is complementary to C&J Energy Services' existing completion services Diversifies Operations with New Service Lines Expands service line into fluid management and workover services, an estimated $6 billion per year business – Unconventional plays requires greater production services – Growing population of mature wells Increases Scale to Drive Ongoing Growth Initiatives Broadens geographic reach across all major US basins, adding complementary positions that have limited overlap with current operating areas Accelerates international expansion Accelerates current growth initiatives through Nabors' established platform Potential Cost Savings Consolidates manufacturing of fluid ends and componentry Reduces duplicative field and operational resources Improves cost structure through leveraging existing C&J Energy Services supply chain Replaces planned growth capex with immediate capacity Revenue Enhancements Anticipated improvement in utilization of combined fleet Improves customer base due to increased size with very limited customer overlap 12 • • • • • • • • • • • • Provides access to attractive new regions, including the Rockies and Marcellus Fifth largest completion services provider with over 1.1 million HHP, over 30 coiled tubing units and over 100 wireline trucks |
 Acceleration of Long-Term Growth Strategy © C&J Energy Services, Inc. 2014 13 • Ability to implement C&J’s targeted approach across larger asset base by deploying completion equipment to highly active customers to maximize utilization and profitability • Diversifies product and service offerings to serve customers better • Strengthens presence in all major domestic basins • Improved scale further harnesses vertical integration and technological advancement • Enhances ability to capitalize on international growth opportunities • Opportunity to leverage complementary strengths of each company |
 A Combination of Two Premium Oilfield Service Providers © C&J Energy Services, Inc. 2014 • Premium, best-in-class completion services provider • Superior track record and execution across most of the major plays, including the Eagle Ford and Permian basins • Vertically integrated with in-house manufacturing capabilities • Rapidly expanding capacity and geographic reach in response to robust customer demand • Diversified provider of completion and production services • Broad footprint and significant presence in all basins across the US and Western Canada • Over 800,000 HHP pressure pumping capacity • Over 650 workover rigs • Largest fluids management fleet in the US, with ~1,500 trucks 14 Completion & Production Services |
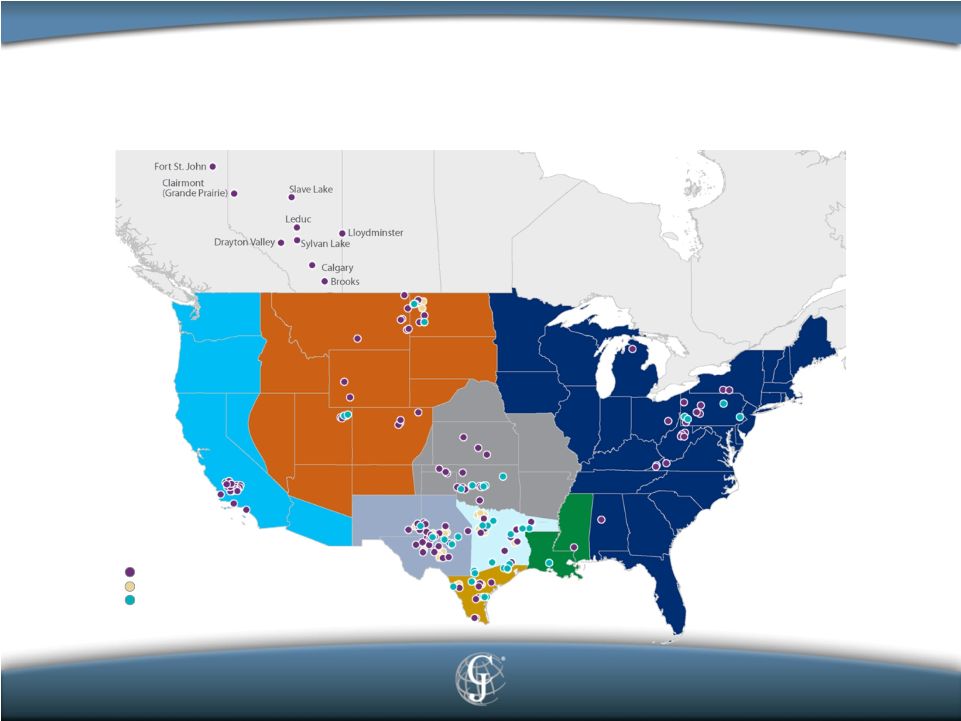 Combination Broadens Reach to Most of the Major US Basins and Canada © C&J Energy Services, Inc. 2014 15 Nabors Completion & Production Facilities Nabors Completion & Production SWDs C&J Facilities |
 Transaction Overview © C&J Energy Services, Inc. 2014 16 Transaction Overview • C&J Energy to combine with Nabors Completion & Production Services business in US and Canada in stock-for-stock transaction (creating New C&J) • C&J Energy stockholders to receive one share of New C&J common stock for each share of C&J Energy common stock • Total consideration of ~$2.14 billion (as of October 31, 2014), including the value of shares to be issued to Nabors and ~$938 million cash payment • New C&J will retain C&J Energy Services name and will be headquartered in Bermuda with corporate offices remaining in Houston Pro Forma Ownership • Nabors: ~53% • C&J Energy stockholders: ~47% Board of Directors and Management • C&J Energy executive team to lead the Company – Josh Comstock to continue as Chairman of the Board and CEO – Randy McMullen to continue as President and CFO • New C&J Energy Board will consist of seven members Closing Conditions and Timing • C&J Energy shareholder vote • Customary closing conditions, including regulatory approvals • Closing expected by year-end (subject to timely completion of SEC review of S-4) |
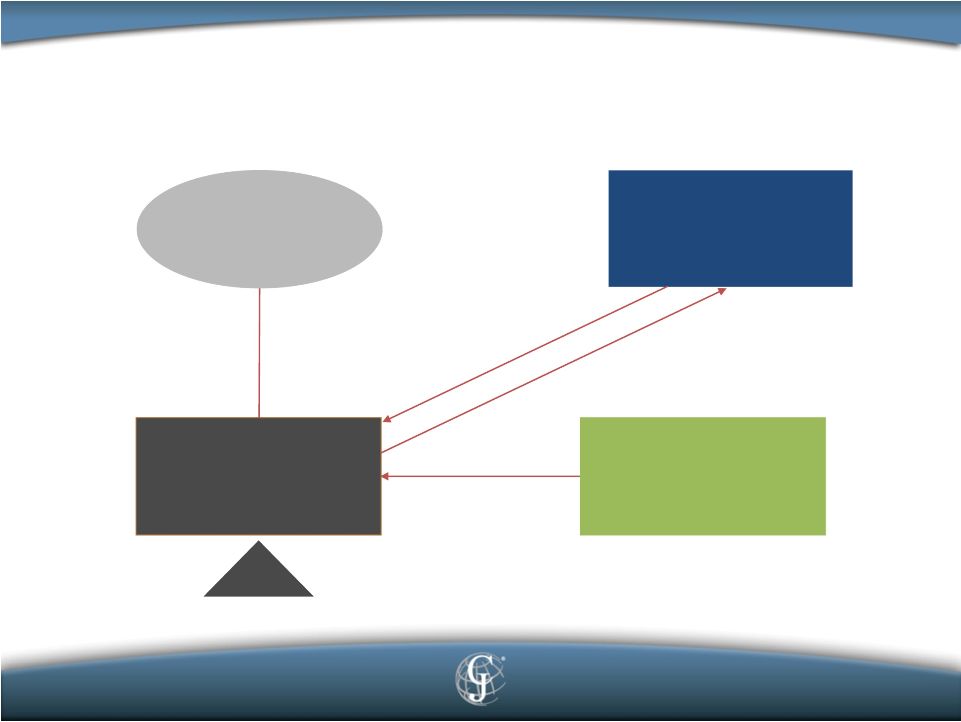 Transaction Structure ~53% Ownership C&J Shareholders Nabors 3 rd Party Debt ~$1.3 Billion ~47% Ownership Lenders Merger C&J + Nabors Completion & Production © C&J Energy Services, Inc. 2014 17 ~$938 Million Cash |
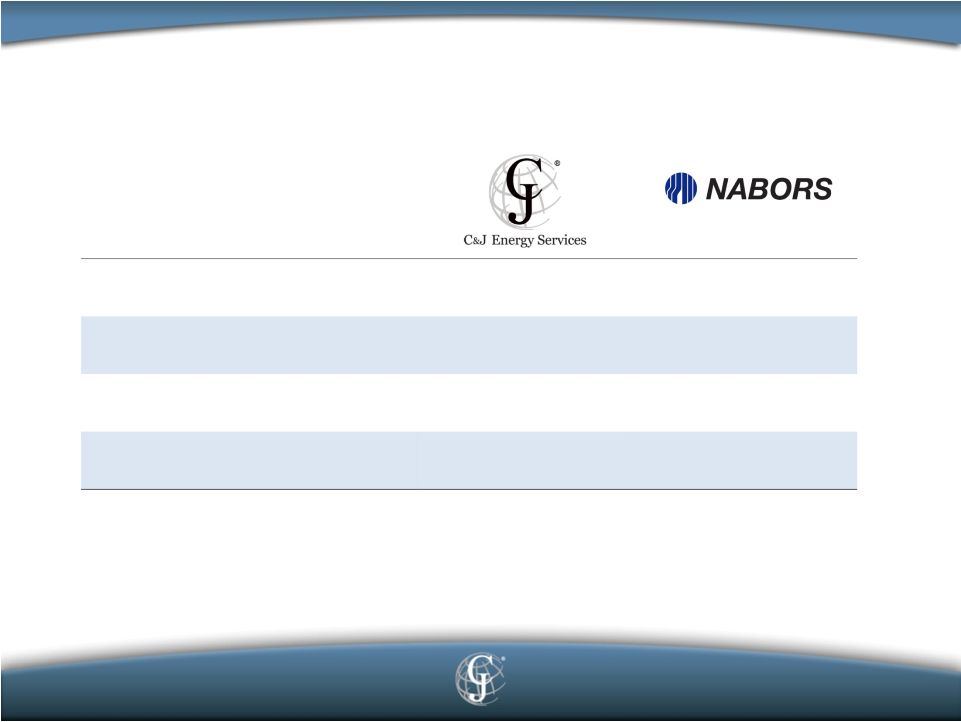 Financial Profile Comparison © C&J Energy Services, Inc. 2014 Revenue $1,390 $2,209 Adjusted EBITDA $208 (1) $326 (2) % Adjusted EBITDA Margin 14.9% 14.8% Total Assets $1,520 $2,319 (3) Completion & Production Services LTM as of 9/30/14 ($mm) 18 Source: Public filings (1) See page 26 for C&J’s definition of Adjusted EBITDA, a non-GAAP financial measure, and required reconciliation to GAAP financial measures. Adjusted EBITDA includes $34.5 million of costs from strategic initiatives. (2) Nabors Completion & Production Services Adjusted EBITDA per Nabors 8-K filings on 2/18/2014 and 10/21/2014. (3) Nabors Completion & Production assets as of 6/30/2014 per Nabors 10-Q filing on 08/06/2014. |
 Pro Forma C&J Energy Outlook © C&J Energy Services, Inc. 2014 • 2015E Revenue – $4.1 - $4.5 billion • 2015E Adjusted EBITDA (1) margin of ~19% • Long term Adjusted EBITDA (1) margin of 20%+ with full run rate synergies • Anticipating reduction in capex during initial phases of integration 19 (1) Adjusted EBITDA is defined as earnings before net interest, income taxes, depreciation and amortization, net gain or loss on disposal of assets, transaction costs and certain non-routine items. Adjusted EBITDA is a non-GAAP financial measure and should not be considered as an alternative to net income (loss) or cash flow data prepared in accordance with U.S. GAAP. |
 Capital Structure and Liquidity © C&J Energy Services, Inc. 2014 • Estimated Total Debt at Closing ~$1.3 billion • Estimated Debt/TTM Adjusted EBITDA (1) at Closing ~2.3x • Generation of free cash flow will allow C&J Energy to de-lever its balance sheet following closing of the transaction based on projections for: – Cost synergies – Utilization improvement – Capex reductions • Significant Liquidity including Revolver Availability of $600 Million 20 (1) Adjusted EBITDA is defined as earnings before net interest, income taxes, depreciation and amortization, net gain or loss on disposal of assets, transaction costs and certain non-routine items. Adjusted EBITDA is a non-GAAP financial measure and should not be considered as an alternative to net income (loss) or cash flow data prepared in accordance with U.S. GAAP. |
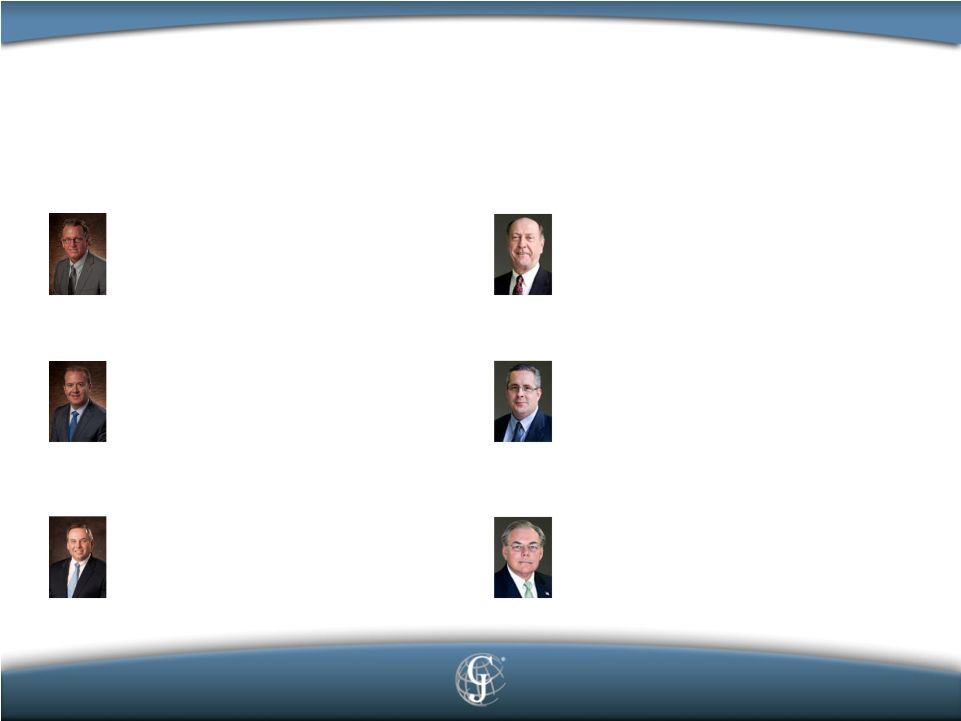 Experienced and Proven Leadership © C&J Energy Services, Inc. 2014 Larry Heidt, President, Production Services Ronnie Witherspoon, Executive Vice President, Nabors Completion Services Steve Johnson, Executive Vice President, Nabors Production Services Josh Comstock, Chairman and Chief Executive Officer, C&J Energy Services Randy McMullen, President and Chief Financial Officer, C&J Energy Services Don Gawick, Chief Operating Officer, C&J Energy Services 21 |
 Appendix © C&J Energy Services, Inc. 2014 |
  C&J Financials – 5 Year Income Statement © C&J Energy Services, Inc. 2014 23 ($ in thousands, except per share amounts) 2010 2011 2012 2013 YTD 9/30/14 Statement of Operations Data (Unaudited) Revenue $244,157 $758,454 $1,111,501 $1,070,322 $1,124,436 Cost of sales 145,093 425,014 686,811 738,947 813,989 Gross profit 99,064 333,440 424,690 331,375 310,447 Selling, general and admin. expenses 16,491 48,360 94,556 136,910 141,902 Research and Development 5,020 9,808 Depreciation and amortization 10,711 22,919 46,912 74,703 75,743 Loss (gain) on disposal of assets 1,571 (25) 692 527 15 Operating income 70,291 262,186 282,530 114,215 82,979 Other income (expense): Interest expense, net (17,341) (4,221) (4,996) (6,550) (6,722) Loss on early extinguishment of debt – (7,605) – – – Other income (expense) (309) (40) (105) 53 584 Total other expense (17,650) (11,866) (5,101) (6,497) (6,138) Income (loss) before income tax 52,641 250,320 277,429 107,718 76,841 Provision (benefit) for income tax 20,369 88,341 95,079 41,313 30,329 Net income (loss) $32,272 $161,979 $182,350 $66,405 $46,512 Basic net income (loss) per share $0.70 $3.28 $3.51 $1.25 $0.86 Diluted net income (loss) per share $0.67 $3.19 $3.37 $1.20 $0.82 Year Ended December 31, |
  C&J Financials – 5 Year Cash Flow Statement © C&J Energy Services, Inc. 2014 24 ($ in thousands) 2010 2011 2012 2013 YTD 9/30/14 Cash Flow Data (Unaudited) Capital expenditures $44,473 $140,723 $182,179 $157,987 $222,379 Cash flow provided by (used in) Operating activities 44,723 171,702 254,683 187,278 112,678 Investing activities (43,818) (165,545) (458,146) (171,472) (257,950) Financing activities $734 $37,806 $171,125 ($15,834) $151,153 Year Ended December 31, |
  C&J Financials – 5 Year Balance Sheet © C&J Energy Services, Inc. 2014 25 ($ in thousands) 2010 2011 2012 2013 9/30/2014 (Unaudited) Cash and Cash Equivalents $2,817 $46,780 $14,442 $14,414 $20,295 Accounts Receivable, Net 44,354 122,169 166,517 152,696 283,283 Inventories, Net 8,182 45,440 60,659 70,946 92,629 Property Plant and Equipment, Net 88,395 213,697 433,727 535,574 730,957 Total Assets $226,088 $537,849 $1,012,757 $1,132,300 $1,520,086 Accounts Payable 13,084 57,564 69,617 88,576 196,694 Long-term Debt and Capital Lease Obligations 44,817 – 173,705 164,205 341,814 Total Stockholders’ Equity $109,446 $395,055 $599,891 $696,151 $755,899 Year Ended December 31, |
 C&J Financials – EBITDA and Adjusted EBITDA (1) Reconciliation © C&J Energy Services, Inc. 2014 26 ($ in thousands) 2010 2011 2012 2013 (Unaudited) (Unaudited) Net income (loss) $32,272 $161,979 $182,350 $66,405 $46,512 $53,800 Interest expense, net 17,341 4,221 4,996 6,550 6,722 $8,355 Provision (benefit) for income tax 20,369 88,341 95,079 41,313 30,329 $36,776 Depreciation and amortization 10,711 22,919 46,912 74,703 75,743 $96,751 EBITDA (1) $80,693 $277,460 $329,337 $188,971 $159,306 $195,682 Adjustments to EBITDA Loss on early extinguishment of debt – 7,605 – – – – Loss (gain) on disposal of assets 1,571 (25) 692 527 15 26 Legal Settlement – – 5,850 – – – Inventory write-down – – – 870 – – Transaction costs – 348 833 306 11,841 11,971 Adjusted EBITDA $82,264 $285,388 $336,712 $190,674 $171,162 $207,679 Year Ended December 31, YTD 9/30/14 LTM 9/30/14 (1) EBITDA is defined as earnings before net interest, income taxes, depreciation and amortization. Adjusted EBITDA is defined as earnings before net interest, Income taxes, depreciation and amortization, net gain or loss on disposal of assets, transaction costs and certain non-routine items. EBITDA and Adjusted EBITDA are non-GAAP financial measures, and when analyzing C&J’s operating performance, investors should use EBITDA and Adjusted EBITDA in addition to, and not as an alternative for, operating income and net income (loss) (each as determined in accordance with U.S. GAAP). C&J Management uses EBITDA and Adjusted EBITDA as supplemental financial measures because we believe they are useful indicators of our performance. (1) |
 C&J Financials – EBITDA and Adjusted EBITDA (1) Reconciliation - Quarterly © C&J Energy Services, Inc. 2014 27 (1) ($ in thousands) Net income (loss) Interest expense, net Provision (benefit) for income tax Depreciation and amortization EBITDA (1) Adjustments to EBITDA Loss on early extinguishment of debt – – – Loss (gain) on disposal of assets 38 (39) 16 Legal Settlement – – – Inventory write-down – – – Transaction costs – 7,414 4,427 Adjusted EBITDA (1) $42,982 $53,021 $75,159 Q1 2014 Q2 2014 Q3 2014 $11,588 $11,108 $23,816 1,749 2,195 2,778 7,737 6,969 15,623 21,870 25,374 28,499 $42,944 $45,646 $70,716 Year Ended December 31, EBITDA is defined as earnings before net interest, income taxes, depreciation and amortization. Adjusted EBITDA is defined as earnings before net interest, Income taxes, depreciation and amortization, net gain or loss on disposal of assets, transaction costs and certain non-routine items. EBITDA and Adjusted EBITDA are non-GAAP financial measures, and when analyzing C&J’s operating performance, investors should use EBITDA and Adjusted EBITDA in addition to, and not as an alternative for, operating income and net income (loss) (each as determined in accordance with U.S. GAAP). C&J Management uses EBITDA and Adjusted EBITDA as supplemental financial measures because we believe they are useful indicators of our performance. |