Exhibit 99.2

Q2 2019 Earnings Call August 7, 2019

2 Forward Looking Statements This presentation contains forward - looking statements that involve substantial risks and uncertainties . All forward - looking statements included in this presentation are made only as of the date hereof and are subject to change without notice . Actual outcomes and results could differ materially from those suggested by this presentation due to the impact of many factors beyond the control of Sutter Rock Capital Corp . (“SSSS”), including those listed in the "Risk Factors" sections of our filings with the Securities and Exchange Commission (“SEC”) . SSSS assumes no obligation to update or revise any such forward - looking statements unless required to do so by law . Certain information discussed in this presentation (including information relating to portfolio companies) was derived from third - party sources and has not been independently verified . SSSS makes no representation or warranty with respect to this information . The following slides contain summaries of certain financial and statistical information about SSSS . The information contained in this presentation is summary information intended to be considered in connection with review of our SEC filings and other public announcements we may make, by press release or otherwise, from time to time . We undertake no duty or obligation to publicly update or revise the information contained in this presentation unless required to do so by law . In addition, information related to past performance, while it may be helpful as an evaluative tool, is not indicative of future results, the achievement of which cannot be assured . You should not view the past performance of SSSS or any of its portfolio companies, or information about the market, as indicative of SSSS’ or any of its portfolio companies’ future results . The performance data stated herein may have been due to extraordinary market or other conditions, which may not be duplicated in the future . Current performance may be lower or higher than the performance data quoted . This presentation does not constitute an offer to sell or the solicitation of an offer to buy any securities of SSSS . Second Quarter 2019
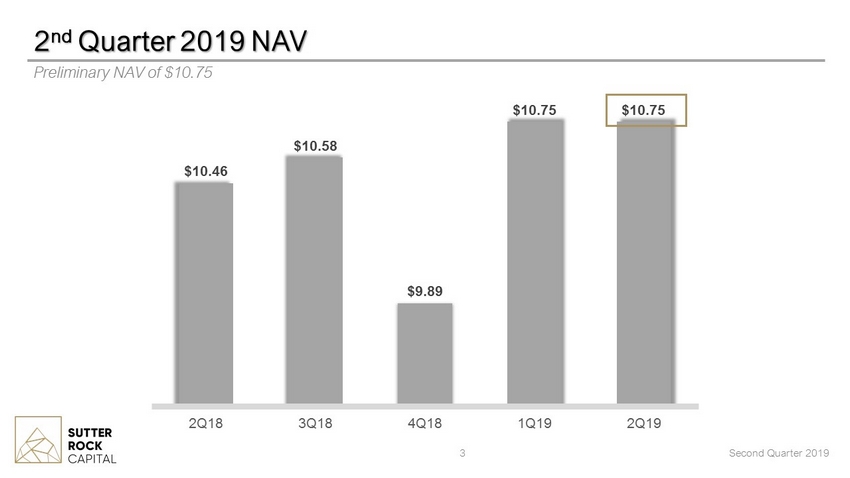
3 2 nd Quarter 2019 NAV Second Quarter 2019 Preliminary NAV of $10.75 $10.46 $10.58 $9.89 $10.75 $10.75 2Q18 3Q18 4Q18 1Q19 2Q19
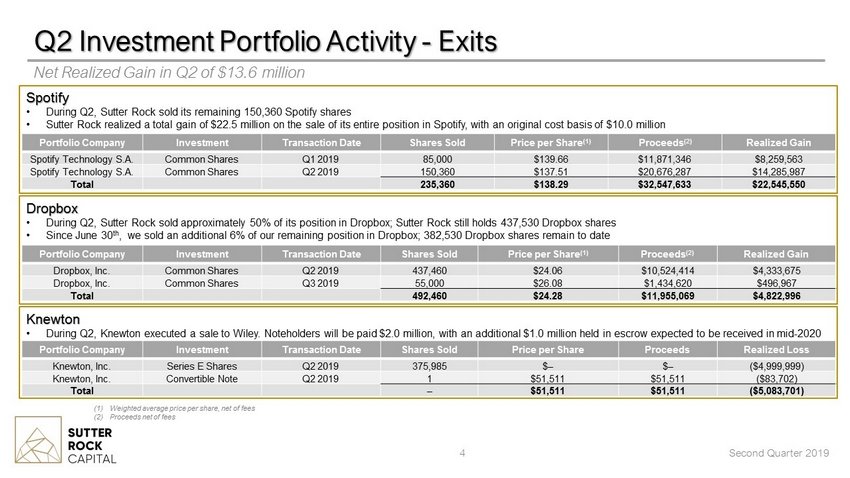
4 Q2 Investment Portfolio Activity - Exits Net Realized Gain in Q2 of $13.6 million Second Quarter 2019 Dropbox • During Q2, Sutter Rock sold approximately 50% of its position in Dropbox; Sutter Rock still holds 437,530 Dropbox shares • Since June 30 th , we sold an additional 6% of our remaining position in Dropbox; 382,530 Dropbox shares remain to date Spotify • During Q2, Sutter Rock sold its remaining 150,360 Spotify shares • Sutter Rock realized a total gain of $22.5 million on the sale of its entire position in Spotify, with an original cost basis of $10.0 million Knewton • During Q2, Knewton executed a sale to Wiley. Noteholders will be paid $2.0 million, with an additional $1.0 million held in escrow expected to b e received in mid - 2020 Portfolio Company Investment Transaction Date Shares Sold Price per Share (1) Proceeds (2) Realized Gain Spotify Technology S.A. Common Shares Q1 2019 85,000 $139.66 $11,871,346 $8,259,563 Spotify Technology S.A. Common Shares Q2 2019 150,360 $137.51 $20,676,287 $14,285,987 Total 235,360 $138.29 $32,547,633 $22,545,550 Portfolio Company Investment Transaction Date Shares Sold Price per Share Proceeds Realized Loss Knewton , Inc. Series E Shares Q2 2019 375,985 $ – $ – ($4,999,999) Knewton , Inc. Convertible Note Q2 2019 1 $51,511 $ 51,511 ($83,702) Total – $51,511 $51,511 ($5,083,701) Portfolio Company Investment Transaction Date Shares Sold Price per Share (1) Proceeds (2) Realized Gain Dropbox, Inc. Common Shares Q2 2019 437,460 $24.06 $10,524,414 $4,333,675 Dropbox, Inc. Common Shares Q3 2019 55,000 $26.08 $1,434,620 $496,967 Total 492,460 $24.28 $11,955,069 $4,822,996 (1) Weighted average price per share, net of fees (2) Proceeds net of fees

5 Investment Activity (Committed): GreenAcreage Second Quarter 2019 • Newly formed real estate investment trust which holds industrial and retail cannabis - related facilities currently operated by Acreage Holdings Description • Cannabis operators have a significant need for capital • Sutter Rock is entering at discount to where Innovative Industrial Properties Inc. (IIPR) is trading based on a multiple of funds from operations Opportunity • Led by Gordon DuGan , who most recently served as CEO of Gramercy Property Trust, which he sold to Blackstone in 2018 for $7.6B Management • Primary tenant is Acreage, one of the largest vertically integrated, multi - state operators of cannabis in the United States Tenant Subsequent to Quarter End
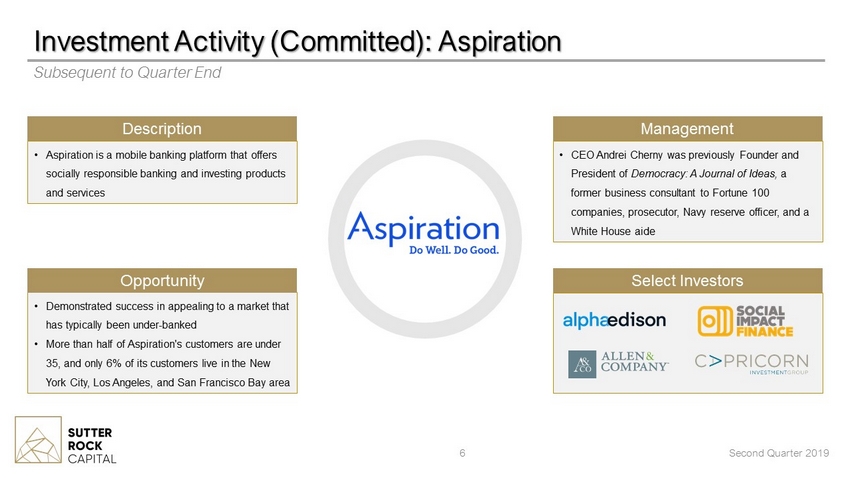
6 Investment Activity (Committed): Aspiration Second Quarter 2019 • Aspiration is a mobile banking platform that offers socially responsible banking and investing products and services Description • Demonstrated success in appealing to a market that has typically been under - banked • More than half of Aspiration's customers are under 35, and only 6% of its customers live in the New York City, Los Angeles, and San Francisco Bay area Opportunity • CEO Andrei Cherny was previously Founder and President of Democracy: A Journal of Ideas, a former business consultant to Fortune 100 companies, prosecutor, Navy reserve officer, and a White House aide Management Select Investors Subsequent to Q uarter End
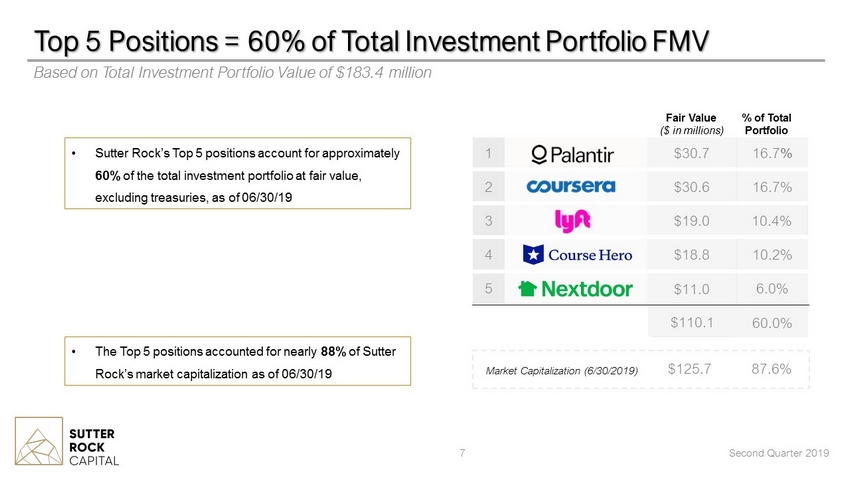
7 Top 5 Positions = 60% of Total Investment Portfolio FMV Based on Total Investment Portfolio Value of $183.4 million Fair Value ($ in millions) % of Total Portfolio 5 $11.0 6.0% 4 $18.8 10.2% 3 $19.0 10.4% 2 $30.6 16.7% 1 $30.7 16.7 % $110.1 60.0% $125.7 87.6% Market Capitalization (6/30/2019) • Sutter Rock’s Top 5 positions account for approximately 60% of the total investment portfolio at fair value, excluding treasuries, as of 06/30/19 • The Top 5 positions accounted for nearly 88% of Sutter Rock’s market capitalization as of 06/30/19 Second Quarter 2019
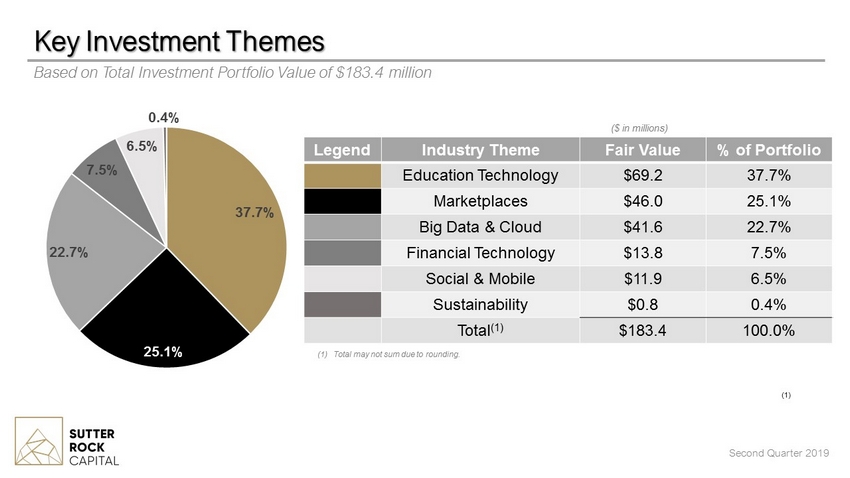
Key Investment Themes Based on Total Investment Portfolio Value of $183.4 million Second Quarter 2019 ($ in millions) (1) Total may not sum due to rounding. (1) 37.7% 25.1% 22.7% 7.5% 6.5% 0.4% Legend Industry Theme Fair Value % of Portfolio Education Technology $69.2 37.7% Marketplaces $46.0 25.1% Big Data & Cloud $41.6 22.7% Financial Technology $13.8 7.5% Social & Mobile $11.9 6.5% Sustainability $0.8 0.4% Total (1) $183.4 100.0%

Dollars Per Share Net Assets at Beginning of Period $212.5 $10.75 Net Investment Loss ($2.8) ($0.14) Net Realized Gain on Investments $13.6 $0.69 Net Change in Unrealized Depreciation of Investments ($12.4) ($0.63) Benefit from Taxes on Unrealized Depreciation of Investments $1.0 $0.05 Repurchase of Common Stock (1) ($0.7) $0.03 Net Assets at June 30, 2019 (2) $211.1 $10.75 9 Financial Highlights For the Quarter Ended June 30, 2019 Second Quarter 2019 (1) During the quarter ended June 30, 2019, the Company repurchased 115,801 shares of Sutter Rock Capital Corp. common stock for app roximately $0.7 million in cash. The use of cash in connection with the repurchases decreased net asset value as of period end; however, the reduction in shares outstanding as of period end resulte d i n no change in the net asset value per share. (2) May not tie due to rounding ($ in millions)
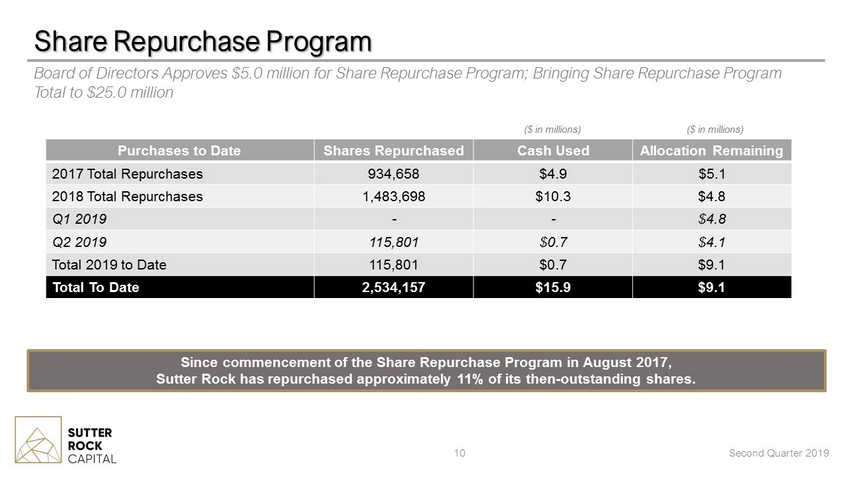
Since commencement of the Share Repurchase Program in August 2017, Sutter Rock has repurchased approximately 11% of its then - outstanding shares. 10 Share Repurchase Program Second Quarter 2019 Board of Directors Approves $5.0 million for Share Repurchase Program; Bringing Share Repurchase Program Total to $25.0 million Purchases to Date Shares Repurchased Cash Used Allocation Remaining 2017 Total Repurchases 934,658 $4.9 $5.1 2018 Total Repurchases 1,483,698 $10.3 $4.8 Q1 2019 - - $4.8 Q2 2019 115,801 $0.7 $4.1 Total 2019 to Date 115,801 $0.7 $9.1 Total To Date 2,534,157 $15.9 $9.1 ($ in millions) ($ in millions)

Q2 2019 Earnings Call August 7, 2019