Third Quarter 2016 Earnings Conference Call and Webcast as supplemented on October 31, 2016
Forward‐Looking Statements This press release contains forward-looking statements within the meaning of federal securities laws regarding Marathon Petroleum Corporation ("MPC") and MPLX LP ("MPLX"). These forward-looking statements relate to, among other things, expectations, estimates and projections concerning the business and operations of MPC and MPLX, including proposed strategic initiatives. You can identify forward-looking statements by words such as "anticipate," "believe," "design," "estimate," "expect," "forecast," "goal," "guidance," "imply," "intend," "objective," "opportunity," "outlook," "plan," "position," "pursue," "prospective," "predict," "project," "potential," "seek," "strategy," "target," "could," "may," "should," "would," "will" or other similar expressions that convey the uncertainty of future events or outcomes. Such forward-looking statements are not guarantees of future performance and are subject to risks, uncertainties and other factors, some of which are beyond the companies' control and are difficult to predict. Factors that could cause MPC's actual results to differ materially from those implied in the forward-looking statements include: the time, costs and ability to obtain regulatory or other approvals and consents and otherwise consummate the strategic initiatives discussed herein; the satisfaction or waiver of conditions in the agreements governing the strategic initiatives discussed herein; our ability to achieve the strategic and other objectives related to the strategic initiatives discussed herein; adverse changes in laws including with respect to tax and regulatory matters; inability to agree with the MPLX conflicts committee with respect to the timing of and value attributed to assets identified for dropdown; risks described below relating to MPLX and the MPLX/MarkWest Energy Partners, L.P. ("MarkWest") merger; changes to the expected construction costs and timing of projects; continued/further volatility in and/or degradation of market and industry conditions; the availability and pricing of crude oil and other feedstocks; slower growth in domestic and Canadian crude supply; the effects of the lifting of the U.S. crude oil export ban; completion of pipeline capacity to areas outside the U.S. Midwest; consumer demand for refined products; transportation logistics; the reliability of processing units and other equipment; MPC's ability to successfully implement growth opportunities; modifications to MPLX earnings and distribution growth objectives; compliance with federal and state environmental, economic, health and safety, energy and other policies and regulations, including the cost of compliance with the Renewable Fuel Standard, and/or enforcement actions initiated thereunder; changes to MPC's capital budget; other risk factors inherent to MPC's industry; and the factors set forth under the heading "Risk Factors" in MPC's Annual Report on Form 10-K for the year ended Dec. 31, 2015, filed with Securities and Exchange Commission (SEC). Factors that could cause MPLX's actual results to differ materially from those implied in the forward-looking statements include: negative capital market conditions, including a persistence or increase of the current yield on common units, which is higher than historical yields, adversely affecting MPLX's ability to meet its distribution growth guidance; risk that the synergies from the acquisition of MarkWest by MPLX may not be fully realized or may take longer to realize than expected; disruption from the MPLX/MarkWest merger making it more difficult to maintain relationships with customers, employees or suppliers; risks relating to any unforeseen liabilities of MarkWest; the time, costs and ability to obtain regulatory or other approvals and consents and otherwise consummate the strategic initiatives discussed herein and other proposed transactions; the satisfaction or waiver of conditions in the agreements governing the strategic initiatives discussed herein and other proposed transactions; our ability to achieve the strategic and other objectives related to the strategic initiatives discussed herein and other proposed transactions; adverse changes in laws including with respect to tax and regulatory matters; inability to agree with respect to the timing of and value attributed to assets identified for dropdown; the adequacy of MPLX's capital resources and liquidity, including, but not limited to, availability of sufficient cash flow to pay distributions, and the ability to successfully execute its business plans and growth strategy; the timing and extent of changes in commodity prices and demand for crude oil, refined products, feedstocks or other hydrocarbon-based products; continued/further volatility in and/or degradation of market and industry conditions; changes to the expected construction costs and timing of projects; completion of midstream infrastructure by competitors; disruptions due to equipment interruption or failure, including electrical shortages and power grid failures; the suspension, reduction or termination of MPC's obligations under MPLX's commercial agreements; modifications to earnings and distribution growth objectives; the level of support from MPC, including dropdowns, alternative financing arrangements, taking equity units, and other methods of sponsor support, as a result of the capital allocation needs of the enterprise as a whole and its ability to provide support on commercially reasonable terms; compliance with federal and state environmental, economic, health and safety, energy and other policies and regulations and/or enforcement actions initiated thereunder; changes to MPLX's capital budget; other risk factors inherent to MPLX's industry; and the factors set forth under the heading "Risk Factors" in MPLX's Annual Report on Form 10-K for the year ended Dec. 31, 2015, and Quarterly Report on Form 10-Q for the quarter ended March 31, 2016, filed with the SEC. In addition, the forward-looking statements included herein could be affected by general domestic and international economic and political conditions. Unpredictable or unknown factors not discussed here, in MPC's Form 10-K or in MPLX's Form 10-K or Form 10-Q could also have material adverse effects on forward-looking statements. Copies of MPC's Form 10-K are available on the SEC website, MPC's website at http://ir.marathonpetroleum.com or by contacting MPC's Investor Relations office. Copies of MPLX's Form 10-K and Form 10-Q are available on the SEC website, MPLX's website at http://ir.mplx.com or by contacting MPLX's Investor Relations office. Non-GAAP Financial Measures Adjusted EBITDA and cash provided from operations before changes in working capital are non-GAAP financial measures provided in this presentation. Adjusted EBITDA and cash provided from operations before changes in working capital reconciliations to the nearest GAAP financial measures are included in the Appendix to this presentation. Adjusted EBITDA and cash provided from operations before changes in working capital are not defined by GAAP and should not be considered in isolation or as an alternative to net income attributable to MPC, net cash provided by (used in) operating, investing and financing activities or other financial measures prepared in accordance with GAAP. 2
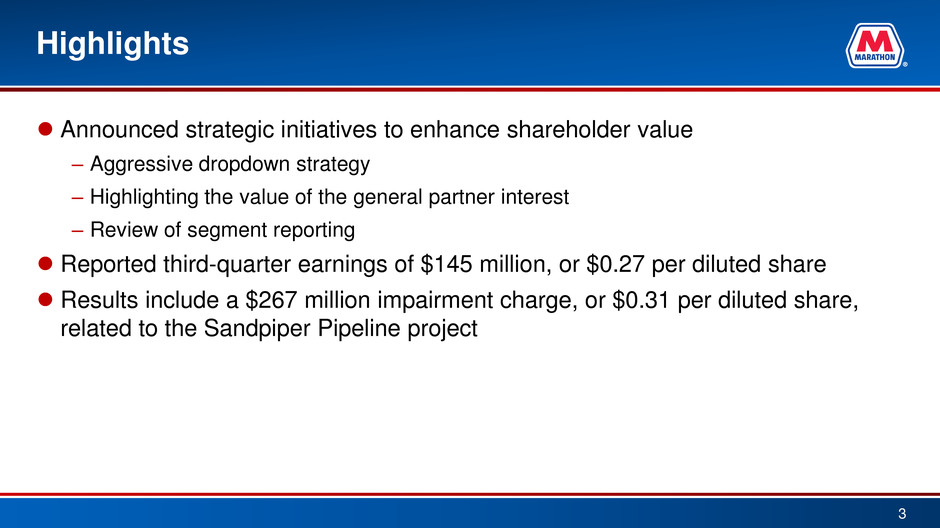
Highlights Announced strategic initiatives to enhance shareholder value – Aggressive dropdown strategy – Highlighting the value of the general partner interest – Review of segment reporting Reported third-quarter earnings of $145 million, or $0.27 per diluted share Results include a $267 million impairment charge, or $0.31 per diluted share, related to the Sandpiper Pipeline project 3

3Q 2016 Earnings* 4 *Earnings refer to Net Income attributable to MPC. Earnings include pretax impairment charges of $267 MM, $90 MM, $129 MM and $144 MM in 3Q 2016, 2Q 2016, 1Q 2016 and 3Q 2015, respectively. They also include pretax lower-of-cost or market inventory benefits / (charges) of $385 MM, ($15 MM) and ($370 MM) in 2Q 2016, 1Q 2016 and 4Q 2015, respectively. **All historical share and per share data are retroactively restated on a post-split basis to reflect the two-for-one split in June 2015 3Q 2016 3Q 2015 Earnings* $145 MM $948 MM Earnings per Diluted Share** $0.27 $1.76 Earnings* 891 826 801 948 145 187 0 500 1,000 1,500 2,000 2,500 3,000 2015 2016 $ M M 1Q 2Q 3Q 4Q $2,852 Earnings per Diluted Share** 1.62 1.51 1.51 1.76 0.27 0.35 0 1 2 3 4 5 6 2015 2016 $ /Shar e $1.78 $5.26 $947
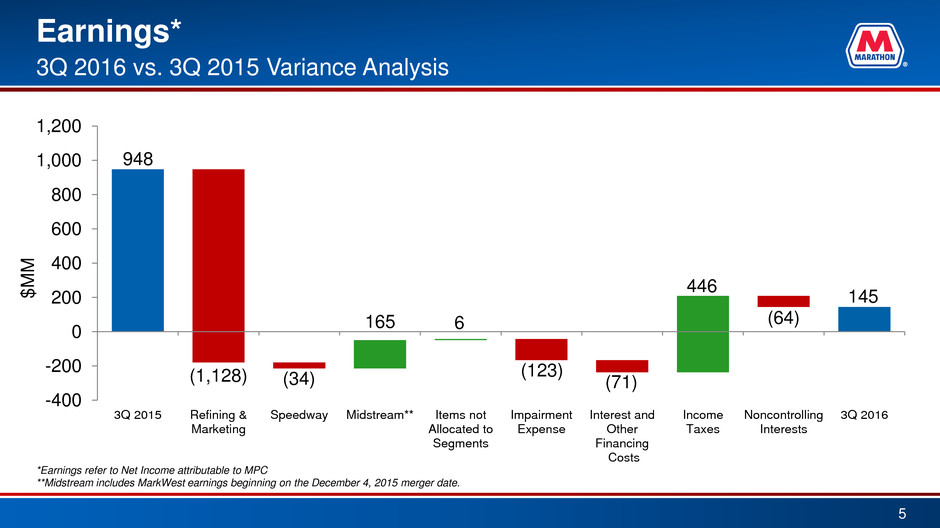
Earnings* 5 3Q 2016 vs. 3Q 2015 Variance Analysis 948 (1,128) (34) 165 6 446 (123) (71) (64) 145 -400 -200 0 200 400 600 800 1,000 1,200 3Q 2015 Refining & Marketing Speedway Midstream** Items not Allocated to Segments Impairment Expense Interest and Other Financing Costs Income Taxes Noncontrolling Interests 3Q 2016 $M M *Earnings refer to Net Income attributable to MPC **Midstream includes MarkWest earnings beginning on the December 4, 2015 merger date.
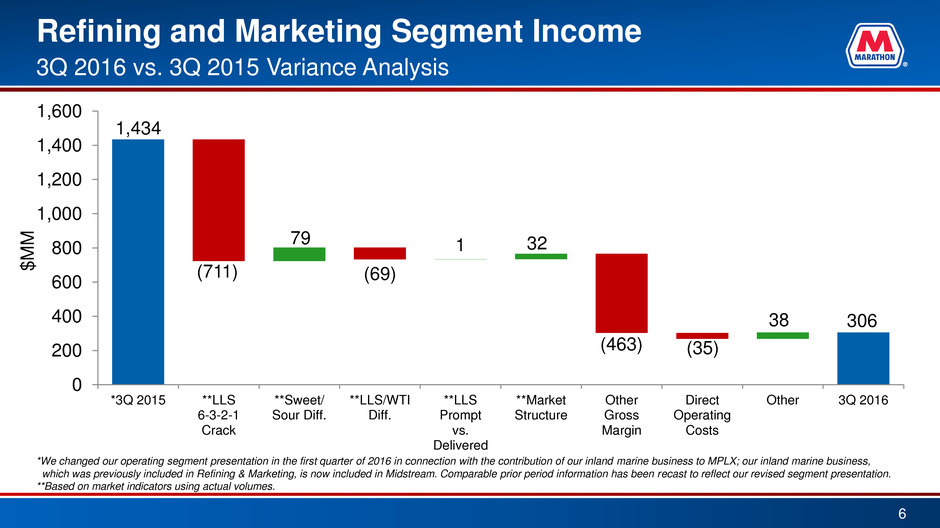
Refining and Marketing Segment Income 6 3Q 2016 vs. 3Q 2015 Variance Analysis 1,434 (711) 79 (69) 1 (35) 32 (463) 38 306 0 200 400 600 800 1,000 1,200 1,400 1,600 *3Q 2015 **LLS 6-3-2-1 Crack **Sweet/ Sour Diff. **LLS/WTI Diff. **LLS Prompt vs. Delivered **Market Structure Other Gross Margin Direct Operating Costs Other 3Q 2016 $ M M *We changed our operating segment presentation in the first quarter of 2016 in connection with the contribution of our inland marine business to MPLX; our inland marine business, which was previously included in Refining & Marketing, is now included in Midstream. Comparable prior period information has been recast to reflect our revised segment presentation. **Based on market indicators using actual volumes.
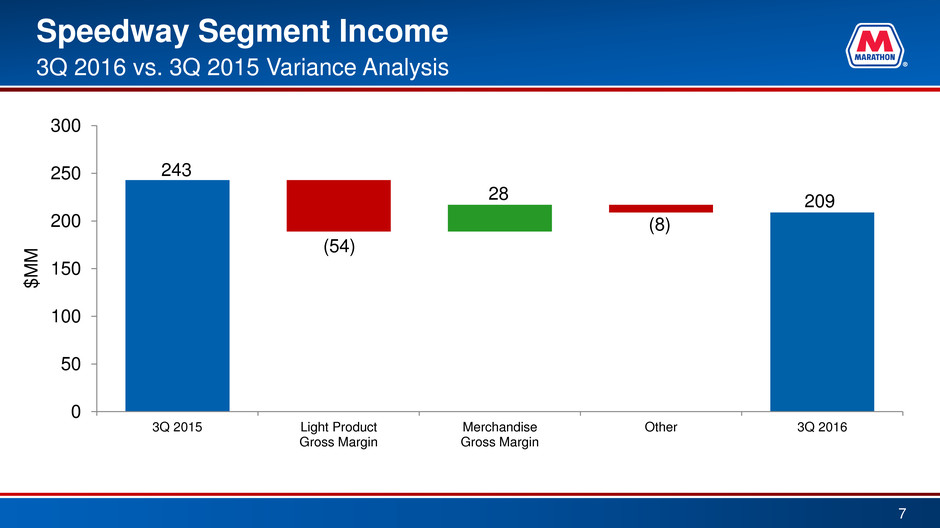
Speedway Segment Income 7 3Q 2016 vs. 3Q 2015 Variance Analysis 243 (54) 28 (8) 209 0 50 100 150 200 250 300 3Q 2015 Light Product Gross Margin Merchandise Gross Margin Other 3Q 2016 $ M M
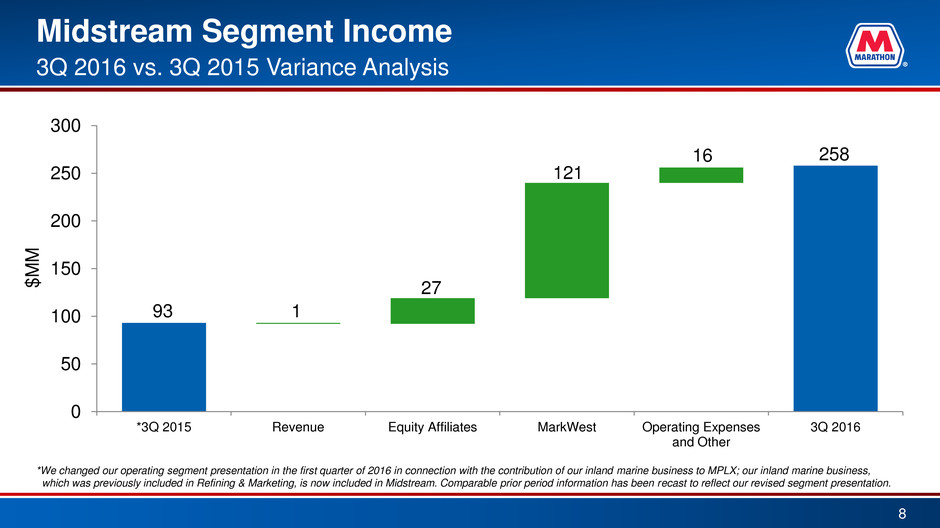
Midstream Segment Income 8 3Q 2016 vs. 3Q 2015 Variance Analysis 93 1 27 121 16 258 0 50 100 150 200 250 300 *3Q 2015 Revenue Equity Affiliates MarkWest Operating Expenses and Other 3Q 2016 $ M M *We changed our operating segment presentation in the first quarter of 2016 in connection with the contribution of our inland marine business to MPLX; our inland marine business, which was previously included in Refining & Marketing, is now included in Midstream. Comparable prior period information has been recast to reflect our revised segment presentation.
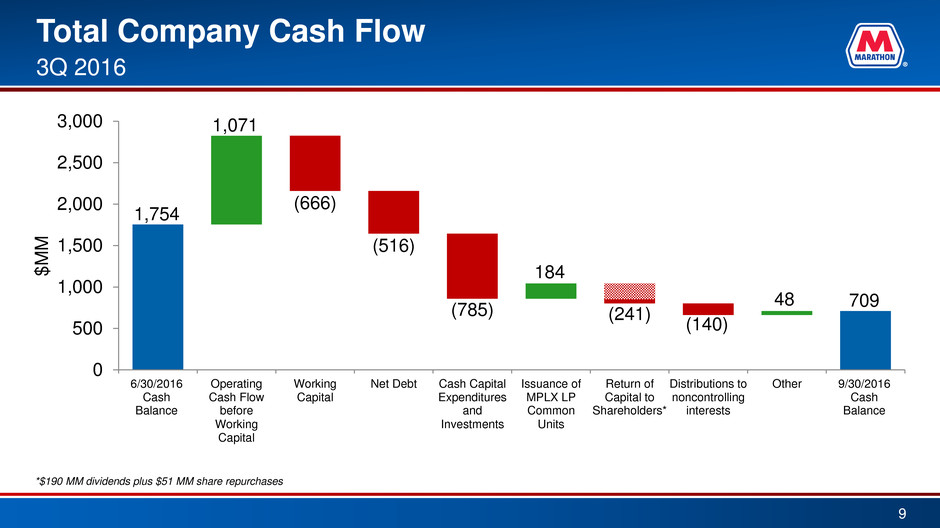
Total Company Cash Flow 9 3Q 2016 1,754 1,071 (666) (516) (785) 184 (140) 48 709 (241) 0 500 1,000 1,500 2,000 2,500 3,000 6/30/2016 Cash Balance Operating Cash Flow before Working Capital Working Capital Net Debt Cash Capital Expenditures and Investments Issuance of MPLX LP Common Units Return of Capital to Shareholders* Distributions to noncontrolling interests Other 9/30/2016 Cash Balance $ M M *$190 MM dividends plus $51 MM share repurchases
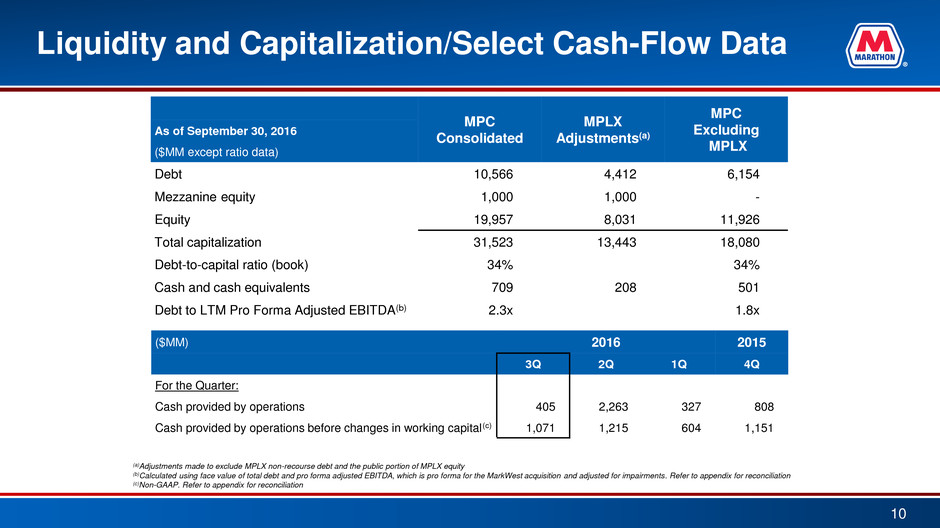
Liquidity and Capitalization/Select Cash-Flow Data 10 ($MM) 2016 2015 3Q 2Q 1Q 4Q For the Quarter: Cash provided by operations 405 2,263 327 808 Cash provided by operations before changes in working capital(c) 1,071 1,215 604 1,151 (a)Adjustments made to exclude MPLX non-recourse debt and the public portion of MPLX equity (b)Calculated using face value of total debt and pro forma adjusted EBITDA, which is pro forma for the MarkWest acquisition and adjusted for impairments. Refer to appendix for reconciliation (c)Non-GAAP. Refer to appendix for reconciliation MPC Consolidated MPLX Adjustments(a) MPC Excluding MPLX As of September 30, 2016 ($MM except ratio data) Debt 10,566 4,412 6,154 Mezzanine equity 1,000 1,000 - Equity 19,957 8,031 11,926 Total capitalization 31,523 13,443 18,080 Debt-to-capital ratio (book) 34% 34% Cash and cash equivalents 709 208 501 Debt to LTM Pro Forma Adjusted EBITDA(b) 2.3x 1.8x

4Q 2016 Outlook 11 *Region throughput data includes inter-refinery transfers, but MPC totals exclude transfers **Includes utilities, labor, routine maintenance and other operating costs ***$/barrel throughput Crude Throughput* Other Charge/ Feedstocks Throughput* Total Throughput* Sour Crude Oil Throughput Percentage Turnaround and Major Maintenance Depreciation and Amortization Other Manufacturing Cost** Total Direct Operating Costs Corporate and Other Unallocated Items in MBD Refinery Direct Operating Costs*** P ro je c te d 4 Q 2 0 1 6 Gulf Coast Region 1,025 200 1,225 70% $2.65 $1.20 $3.90 $7.75 Midwest Region 650 50 700 40% $1.05 $1.85 $4.55 $7.45 MPC Total 1,675 150 1,825 58% $2.20 $1.50 $4.35 $8.05 $75 MM 4 Q 2 0 1 5 Gulf Coast Region 1,043 206 1,249 69% $1.12 $1.08 $3.78 $5.98 Midwest Region 595 56 651 31% $2.69 $1.97 $4.72 $9.38 MPC Total 1,638 201 1,839 55% $1.71 $1.43 $4.25 $7.39 $70 MM

12 Appendix
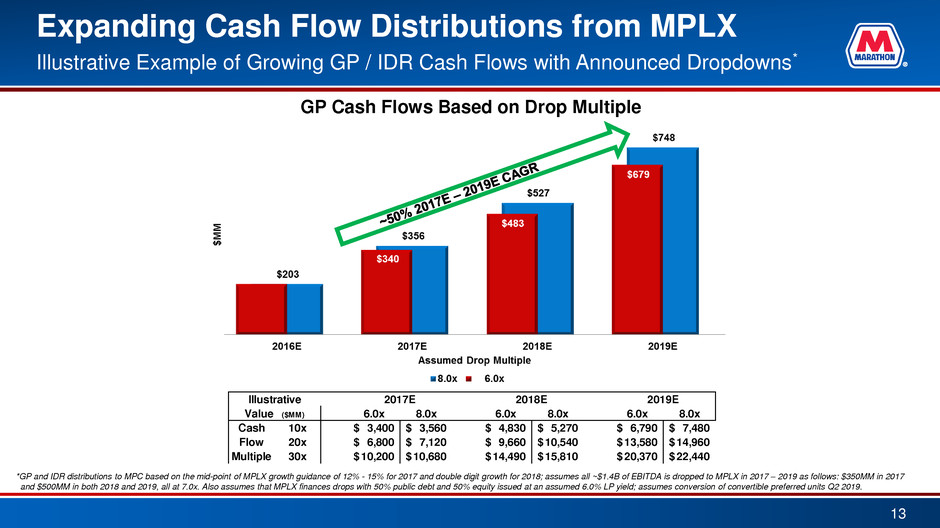
Expanding Cash Flow Distributions from MPLX Illustrative Example of Growing GP / IDR Cash Flows with Announced Dropdowns* *GP and IDR distributions to MPC based on the mid-point of MPLX growth guidance of 12% - 15% for 2017 and double digit growth for 2018; assumes all ~$1.4B of EBITDA is dropped to MPLX in 2017 – 2019 as follows: $350MM in 2017 and $500MM in both 2018 and 2019, all at 7.0x. Also assumes that MPLX finances drops with 50% public debt and 50% equity issued at an assumed 6.0% LP yield; assumes conversion of convertible preferred units Q2 2019. GP Cash Flows Based on Drop Multiple 13 6.0x 8.0x 6.0x 8.0x 6.0x 8.0x 10x 3,400$ 3,560$ 4,830$ 5,270$ 6,790$ 7,480$ 20x 6,800$ 7,120$ 9,660$ 10,540$ 13,580$ 14,960$ 30x 10,200$ 10,680$ 14,490$ 15,810$ 20,370$ 22,440$ 2017E 2018E 2019EIllustrative Value ($MM) Cash Flow Multiple
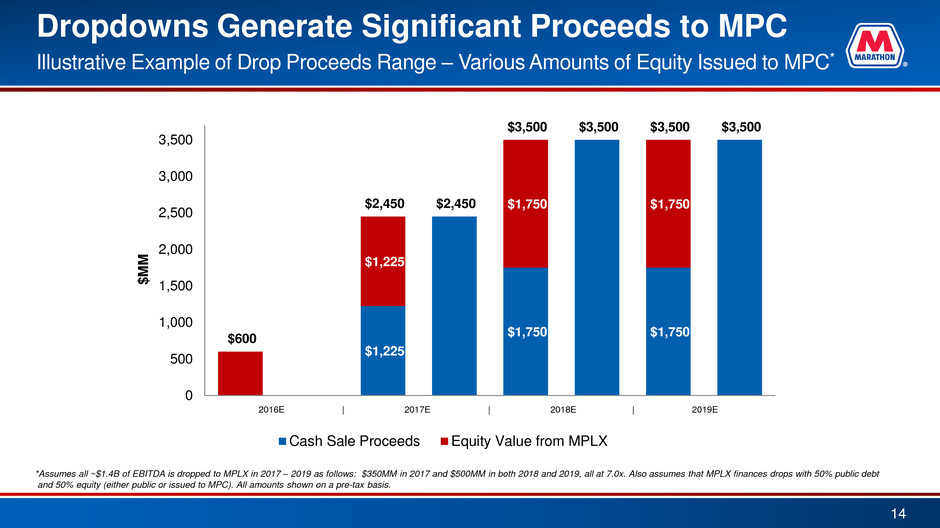
$1,225 $1,750 $1,750 $1,225 $1,750 $1,750 $600 $2,450 $2,450 $3,500 $3,500 $3,500 $3,500 0 500 1,000 1,500 2,000 2,500 3,000 3,500 2016E 2017E 2018E 2019E $ M M Cash Sale Proceeds Equity Value from MPLX *Assumes all ~$1.4B of EBITDA is dropped to MPLX in 2017 – 2019 as follows: $350MM in 2017 and $500MM in both 2018 and 2019, all at 7.0x. Also assumes that MPLX finances drops with 50% public debt and 50% equity (either public or issued to MPC). All amounts shown on a pre-tax basis. Dropdowns Generate Significant Proceeds to MPC Illustrative Example of Drop Proceeds Range – Various Amounts of Equity Issued to MPC* 2016E | 2017E | 2018E | 2019E 14
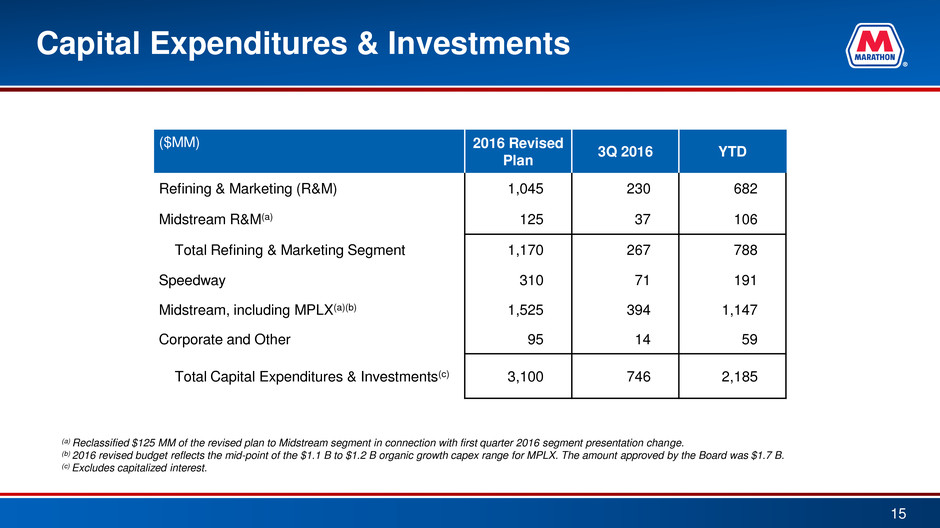
Capital Expenditures & Investments 15 ($MM) 2016 Revised Plan 3Q 2016 YTD Refining & Marketing (R&M) 1,045 230 682 Midstream R&M(a) 125 37 106 Total Refining & Marketing Segment 1,170 267 788 Speedway 310 71 191 Midstream, including MPLX(a)(b) 1,525 394 1,147 Corporate and Other 95 14 59 Total Capital Expenditures & Investments(c) 3,100 746 2,185 (a) Reclassified $125 MM of the revised plan to Midstream segment in connection with first quarter 2016 segment presentation change. (b) 2016 revised budget reflects the mid-point of the $1.1 B to $1.2 B organic growth capex range for MPLX. The amount approved by the Board was $1.7 B. (c) Excludes capitalized interest.
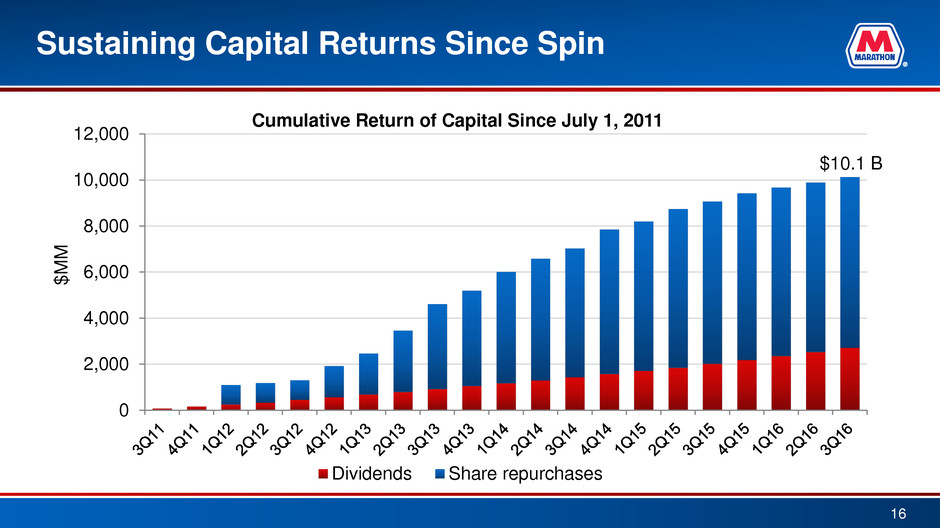
Sustaining Capital Returns Since Spin 0 2,000 4,000 6,000 8,000 10,000 12,000 $ M M Cumulative Return of Capital Since July 1, 2011 Dividends Share repurchases $10.1 B 16
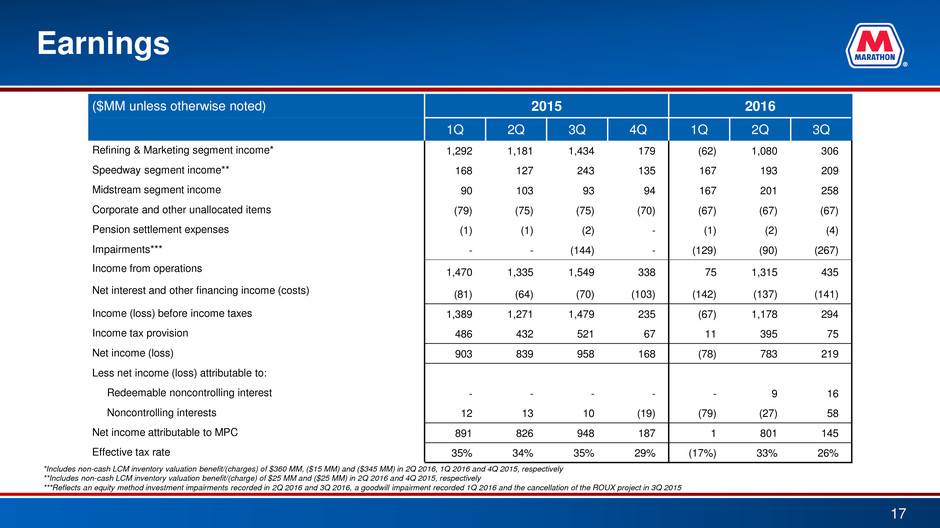
Earnings 17 ($MM unless otherwise noted) 2015 2016 1Q 2Q 3Q 4Q 1Q 2Q 3Q Refining & Marketing segment income* 1,292 1,181 1,434 179 (62) 1,080 306 Speedway segment income** 168 127 243 135 167 193 209 Midstream segment income 90 103 93 94 167 201 258 Corporate and other unallocated items (79) (75) (75) (70) (67) (67) (67) Pension settlement expenses (1) (1) (2) - (1) (2) (4) Impairments*** - - (144) - (129) (90) (267) Income from operations 1,470 1,335 1,549 338 75 1,315 435 Net interest and other financing income (costs) (81) (64) (70) (103) (142) (137) (141) Income (loss) before income taxes 1,389 1,271 1,479 235 (67) 1,178 294 Income tax provision 486 432 521 67 11 395 75 Net income (loss) 903 839 958 168 (78) 783 219 Less net income (loss) attributable to: Redeemable noncontrolling interest - - - - - 9 16 Noncontrolling interests 12 13 10 (19) (79) (27) 58 Net income attributable to MPC 891 826 948 187 1 801 145 Effective tax rate 35% 34% 35% 29% (17%) 33% 26% *Includes non-cash LCM inventory valuation benefit/(charges) of $360 MM, ($15 MM) and ($345 MM) in 2Q 2016, 1Q 2016 and 4Q 2015, respectively **Includes non-cash LCM inventory valuation benefit/(charge) of $25 MM and ($25 MM) in 2Q 2016 and 4Q 2015, respectively ***Reflects an equity method investment impairments recorded in 2Q 2016 and 3Q 2016, a goodwill impairment recorded 1Q 2016 and the cancellation of the ROUX project in 3Q 2015
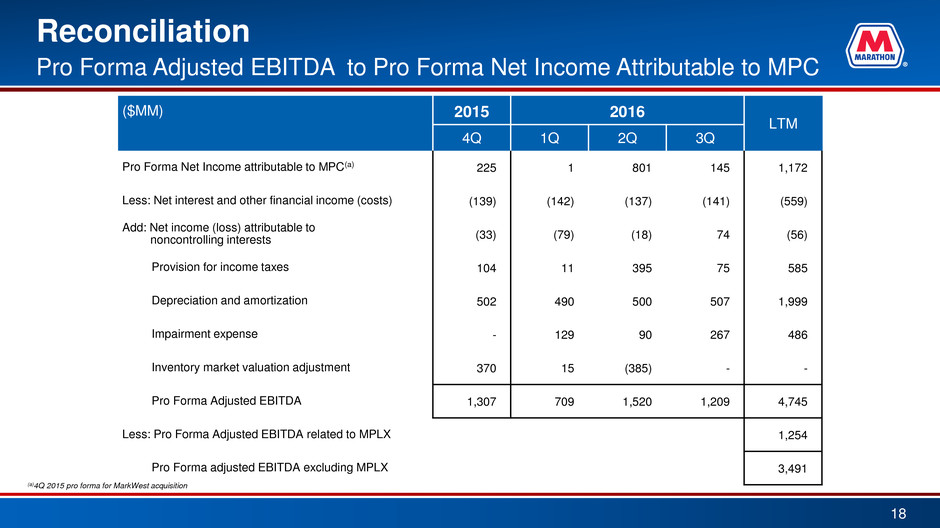
Reconciliation 18 Pro Forma Adjusted EBITDA to Pro Forma Net Income Attributable to MPC ($MM) 2015 2016 LTM 4Q 1Q 2Q 3Q Pro Forma Net Income attributable to MPC(a) 225 1 801 145 1,172 Less: Net interest and other financial income (costs) (139) (142) (137) (141) (559) Add: Net income (loss) attributable to inco noncontrolling interests (33) (79) (18) 74 (56) Provision for income taxes 104 11 395 75 585 Depreciation and amortization 502 490 500 507 1,999 Impairment expense - 129 90 267 486 Inventory market valuation adjustment 370 15 (385) - - Pro Forma Adjusted EBITDA 1,307 709 1,520 1,209 4,745 Less: Pro Forma Adjusted EBITDA related to MPLX 1,254 Pro Forma adjusted EBITDA excluding MPLX 3,491 (a)4Q 2015 pro forma for MarkWest acquisition
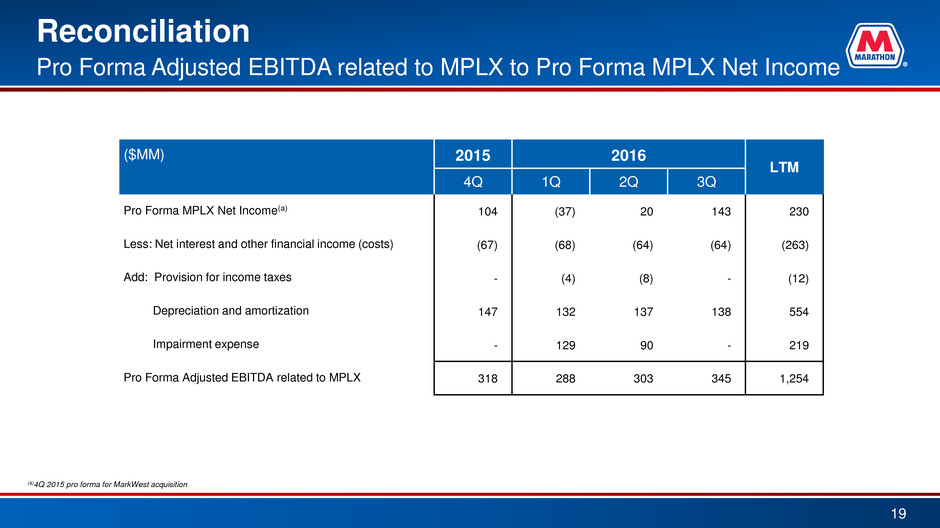
Reconciliation 19 Pro Forma Adjusted EBITDA related to MPLX to Pro Forma MPLX Net Income ($MM) 2015 2016 LTM 4Q 1Q 2Q 3Q Pro Forma MPLX Net Income(a) 104 (37) 20 143 230 Less: Net interest and other financial income (costs) (67) (68) (64) (64) (263) Add: Provision for income taxes - (4) (8) - (12) Depreciation and amortization 147 132 137 138 554 Impairment expense - 129 90 - 219 Pro Forma Adjusted EBITDA related to MPLX 318 288 303 345 1,254 (a)4Q 2015 pro forma for MarkWest acquisition
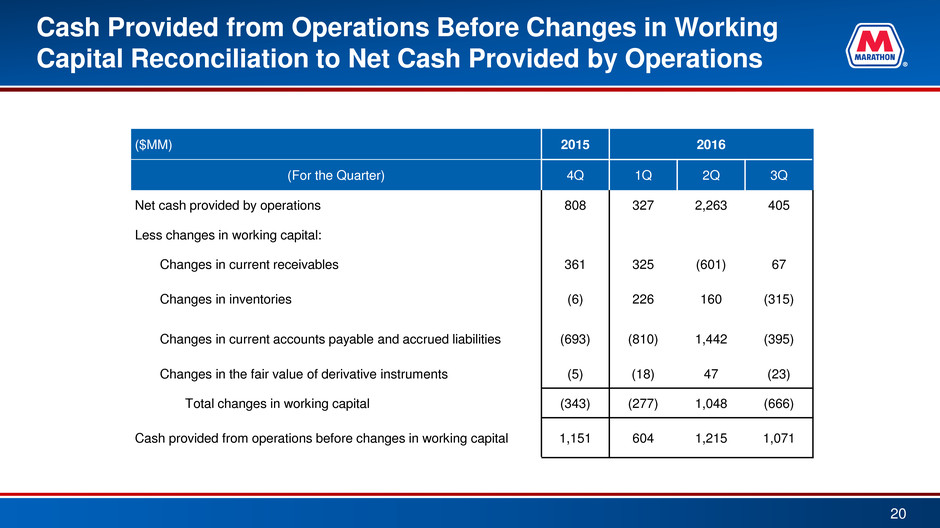
Cash Provided from Operations Before Changes in Working Capital Reconciliation to Net Cash Provided by Operations 20 ($MM) 2015 2016 (For the Quarter) 4Q 1Q 2Q 3Q Net cash provided by operations 808 327 2,263 405 Less changes in working capital: Changes in current receivables 361 325 (601) 67 Changes in inventories (6) 226 160 (315) Changes in current accounts payable and accrued liabilities (693) (810) 1,442 (395) Changes in the fair value of derivative instruments (5) (18) 47 (23) Total changes in working capital (343) (277) 1,048 (666) Cash provided from operations before changes in working capital 1,151 604 1,215 1,071
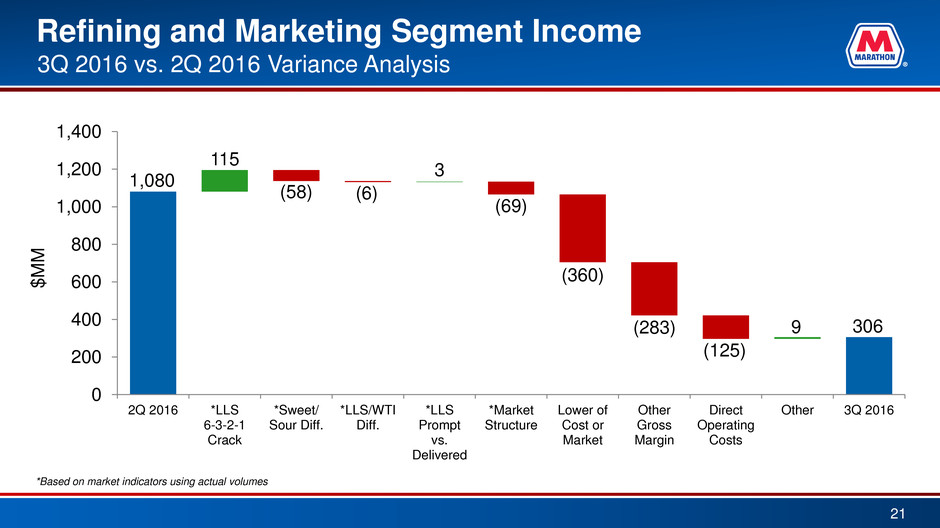
Refining and Marketing Segment Income 21 3Q 2016 vs. 2Q 2016 Variance Analysis 1,080 (125) 115 (58) (6) 3 (283) (69) (360) 9 306 0 200 400 600 800 1,000 1,200 1,400 2Q 2016 *LLS 6-3-2-1 Crack *Sweet/ Sour Diff. *LLS/WTI Diff. *LLS Prompt vs. Delivered *Market Structure Lower of Cost or Market Other Gross Margin Direct Operating Costs Other 3Q 2016 $ M M *Based on market indicators using actual volumes
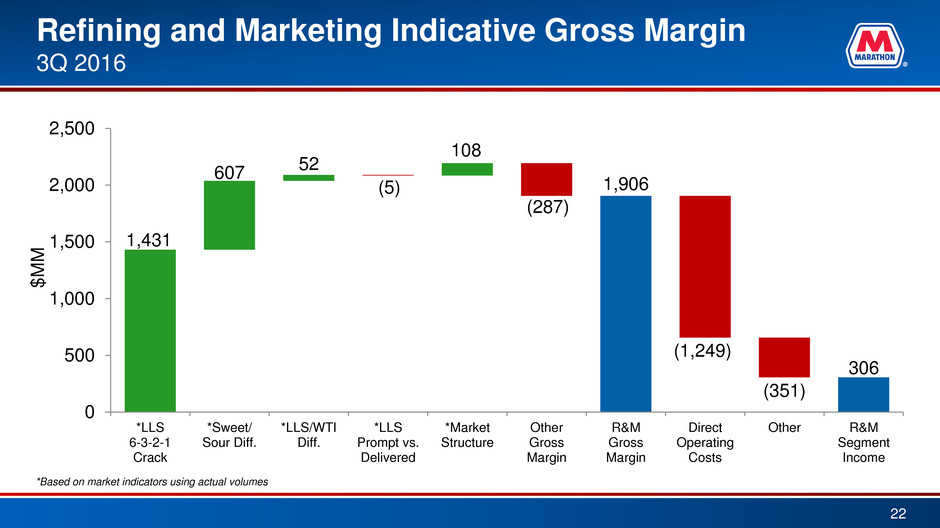
Refining and Marketing Indicative Gross Margin 3Q 2016 22 1,431 1,906 607 52 (5) 108 (287) (1,249) (351) 306 0 500 1,000 1,500 2,000 2,500 *LLS 6-3-2-1 Crack *Sweet/ Sour Diff. *LLS/WTI Diff. *LLS Prompt vs. Delivered *Market Structure Other Gross Margin R&M Gross Margin Direct Operating Costs Other R&M Segment Income $ M M *Based on market indicators using actual volumes
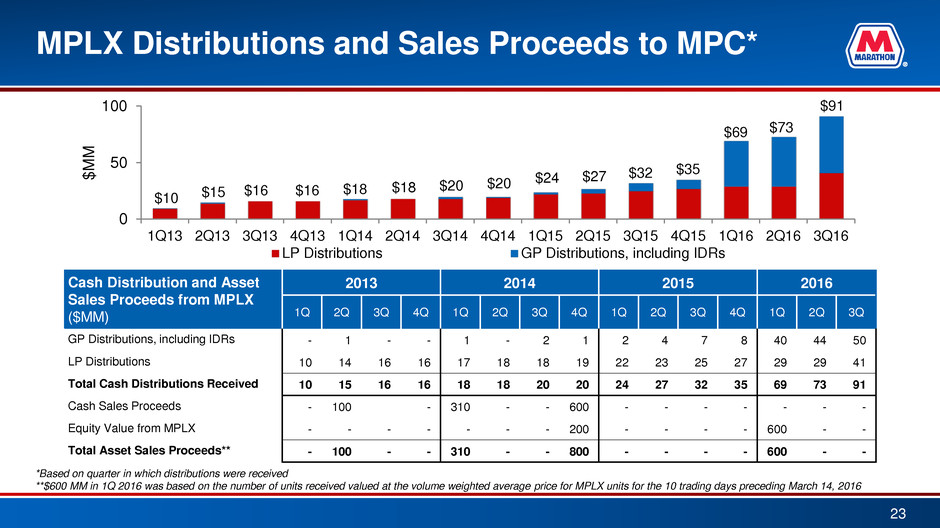
MPLX Distributions and Sales Proceeds to MPC* 23 $10 $15 $16 $16 $18 $18 $20 $20 $24 $27 $32 $35 $69 $73 $91 0 50 100 1Q13 2Q13 3Q13 4Q13 1Q14 2Q14 3Q14 4Q14 1Q15 2Q15 3Q15 4Q15 1Q16 2Q16 3Q16 $ M M LP Distributions GP Distributions, including IDRs Cash Distribution and Asset Sales Proceeds from MPLX ($MM) 2013 2014 2015 2016 1Q 2Q 3Q 4Q 1Q 2Q 3Q 4Q 1Q 2Q 3Q 4Q 1Q 2Q 3Q GP Distributions, including IDRs - 1 - - 1 - 2 1 2 4 7 8 40 44 50 LP Distributions 10 14 16 16 17 18 18 19 22 23 25 27 29 29 41 Total Cash Distributions Received 10 15 16 16 18 18 20 20 24 27 32 35 69 73 91 Cash Sales Proceeds - 100 - 310 - - 600 - - - - - - - Equity Value from MPLX - - - - - - - 200 - - - - 600 - - Total Asset Sales Proceeds** - 100 - - 310 - - 800 - - - - 600 - - *Based on quarter in which distributions were received **$600 MM in 1Q 2016 was based on the number of units received valued at the volume weighted average price for MPLX units for the 10 trading days preceding March 14, 2016


