Market Data Update March 1, 2017

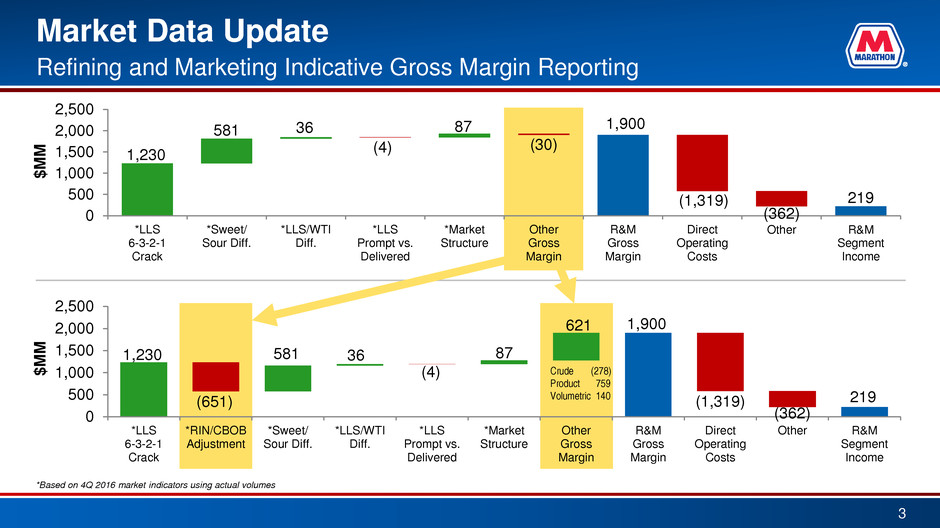
Refining and Marketing - Market Data Update 2 Effective March 1, 2017 RIN/CBOB crack adjustment included in R&M Gross Margin Indicator – Previously part of Other Gross Margin – Adjusts the LLS 6-3-2-1 crack spread to an ex-RIN basis – Adjusts the LLS 6-3-2-1 crack spread to an 84 octane CBOB basis (i.e., the product produced and blended with ethanol) Other Gross Margin now categorized into crude, products and volumetric gain Report enhancements – Hypothetical gross margin indicator calculated based on guidance – Historical data shown in new format including other gross margin breakout between crude, products and volumetric gain Note: The information presented in MPC’s Market Data is for informational purposes only. This information is not intended to be an indicator of MPC’s past or future financial results. Some of the information is compiled from sources outside MPC. MPC does not make any representation as to the accuracy of the data and does not undertake any obligation to update, revise or continue to provide the data. MPC, its information providers, and other third parties involved in or related to the making or compiling of any of the information listed above make no representations or warranties of any kind, either express or implied, with respect to the information (or the results to be obtained by the use thereof) and expressly disclaim all warranties and representations as to the information or use thereof.

1,230 1,900 (651) 581 36 (4) 87 621 (1,319) (362) 219 0 500 1,000 1,500 2,000 2,500 *LLS 6-3-2-1 Crack *RIN/CBOB Adjustment *Sweet/ Sour Diff. *LLS/WTI Diff. *LLS Prompt vs. Delivered *Market Structure Other Gross Margin R&M Gross Margin Direct Operating Costs Other R&M Segment Income $M M Market Data Update 3 Refining and Marketing Indicative Gross Margin Reporting *Based on 4Q 2016 market indicators using actual volumes Crude (278) Product 759 Volumetric 140 1,230 1,900 581 36 (4) 87 (30) (1,319) (362) 219 0 500 1,000 1,500 2,000 2,500 *LLS 6-3-2-1 Crack *Sweet/ Sour Diff. *LLS/WTI Diff. *LLS Prompt vs. Delivered *Market Structure Other Gross Margin R&M Gross Margin Direct Operating Costs Other R&M Segment Income $M M

Refining and Marketing - Other Gross Margin 4 Crude, Product and Volumetric Gain Examples* Crude – Actual crude and other feedstocks versus the seven crudes included in market data – Hedging gains and losses – Crude transportation to refinery, historically ~$2 per barrel of crude throughput Products – Product realizations versus spot market metric price – Variances due to actual yield versus 6-3-2-1 proxy – Variances due to actual distribution versus 60% USGC and 40% Chicago proxy – Variance due to actual sales volumes versus throughput volumes Volumetric gain – Volume gain inherent in refining process – Volume varies based on units in turnaround and capital improvements – Historically ~1.5% – 2.0% of total throughput – Value varies with refined product prices *illustrative subset of items included in crude, products and volumetric gain

Other Components of R&M Segment Income 5 Direct Operating Costs – Guidance provided at earnings call for upcoming quarter – Comprised of three expense classes • Major maintenance and turnaround • Depreciation and amortization • Other Manufacturing Other – Guidance not provided – Includes terminaling and transportation costs from refinery gate forward and associated marketing and supply, distribution and planning expenses – Equity method income for ethanol and biofuel investments

Marathon Petroleum Corporation Market Data - Current Quarter Price information through 12/31/2016 1 2 3 4 5 6 7 8 9 10 11 12 13 14 (1) - (6) (6) + (8) (1) - (9) (6) + (11) (1) - (12) 2016 LLS Prompt Chicago USGC Blended RIN/CBOB Crack WTI Prompt LLS Prompt vs. LLS Delivered LLS Delivered LLS Prompt vs. Sour Delivered Sour Delivered LLS Prompt Market Structure Price (a) 6-3-2-1 Crack (b) 6-3-2-1 Crack (b) 6-3-2-1 Crack (c) Adjustment (d) Price (a) WTI Prompt Diff. (e) Cost (g) LLS Delivered Diff. (f) Cost (g) Sweet/Sour Diff. (h) Oct 51.35 6.56 8.03 7.44 (3.79) 49.94 1.41 1.65 51.59 (0.24) (5.01) 44.93 6.42 (0.84) Nov 46.72 5.08 6.91 6.18 (3.83) 45.76 0.95 1.50 47.26 (0.54) (4.92) 40.85 5.87 (0.66) Dec 53.53 7.25 9.30 8.48 (4.10) 52.17 1.36 1.12 53.29 0.24 (4.87) 47.29 6.23 (0.84) 4th Qtr 50.59 6.32 8.10 7.39 (3.91) 49.29 1.30 1.42 50.71 (0.12) (4.93) 44.36 6.24 (0.78) (A) (B) (C) (D) (E) (F) (G) (H) (I) (J) (K) (L) (M) (N) Crude Non-Crude Total LLS 6-3-2-1 RIN/CBOB Sweet/Sour LLS Prompt LLS Prompt Market Gross Margin Crude Other Charge/ Sour Crude Oil WTI- Priced Crude Throughput Throughput Throughput Crack Spread Crack Adjustment Differential vs WTI Prompt vs Delivered Structure Indicator Throughput Feedstocks Throughput Oil Throughput (mmbbls) (mmbbls) (mmbbls) ($MM) ($MM) ($MM) ($MM) ($MM) ($MM) ($MM) (MBD) (MBD) Percentage Percentage (K) x Days in Qtr (L) x Days in Qtr (A) + (B) (C) x Col 4 (C) x Col 5 (A) x Col 13 x (M) (A) x Col 7 x (N) (A) x Col 10 x [1-(M)-(N)] (A) x Col 14 x 65% Sum of (D) thru (I) 4Q16 Est. 154 14 168 1,240 (656) 557 50 (3) 78 1,266 1,675 150 58% 25% (a) Prompt Price represents calendar workday average of prices quoted that month for crude delivered in immediately following month(s). All prices and differentials listed are in Dollars per Barrel (b) Crack Spread Calculation: Chicago = ((Chicago 87 Octane Gasoline x 3 + Chicago Ultra Low Sulfur Distillate x 2+ USGC 3% Residual Fuel Oil)/6) - LLS Prompt Price Data Sources: NYMEX, Argus, and MPC Estimate USGC = ((U.S. Gulf Coast (USGC) 87 Octane Gasoline x 3 + USGC Ultra Low Sulfur Distillate x 2+ USGC 3% Residual Fuel Oil)/6) - LLS Prompt Price (c) Blended Chicago/USGC crack spread was 38%/62% for 2015, and is 40%/60% in 2016 based on MPC's refining capacity by PADD in each period. (d) Represents the market cost of Renewable Identification Numbers (RINs)(credits needed to meet an EPA-specific Renewable Volume Obligation) for attributable products and the difference between 87 Octane Gasoline and 84 Octane CBOB Gasoline. (e) Represents differential (versus Prompt WTI) for the trade month period beginning with the 26th calendar day two months prior to the prompt month through the 25th day one month prior to the prompt month (see next page for Prompt LLS versus LLS Delivered Cost calculation). (f) Delivered differentials per footnote (e), with the exception of the Maya delivered differential which is calculated on a prompt calendar month basis. MPC's typical sour crude oil basket consists of the following crudes: Arab Light, Kuwait, Maya, Western Canadian Select, Mars. (g) Delivered Cost is based on WTI Prompt Price plus each respective grade's delivered differential and does NOT include market structure or other expenses such as transportation, demurrage, etc. Market structure effects are calculated as a separate adjustment (see column 14 and (I) above). (h) Delivered month market structure (roll). Negative values represent contango and positive values represent backwardation. For 2017 approximately 65% of MPC's crude oil acquisition volume uses market structure in its acquisition price formula. Hypothetical Gross Margin Indicator Calculation Based on Guidance Provided Outlook Revised Market Data Sheet – Current Quarter 6 RIN/CBOB Crack Adjustment (d) (3.79) (3.83) (4 10) (3.91) Hypothetical Gross Margin Indicator Calculation Based on Guidance

Marathon Petroleum Corporation Market Data - Historical Price information through 12/31/2016 1 2 3 4 5 6 7 8 9 10 11 12 13 14 (1) - (6) (6) + (8) (1) - (9) (6) + (11) (1) - (12) 2016 LLS Prompt Chicago USGC Blended RIN/CBOB Crack WTI Prompt LLS Prompt vs. LLS Delivered LLS Delivered LLS Prompt vs. Sour Delivered Sour Delivered LLS Prompt Market Structure Price (a) 6-3-2-1 Crack (b) 6-3-2-1 Crack (b) 6-3-2-1 Crack (c) Adjustment (d) Price (a) WTI Prompt Diff. (e) Cost (g) LLS Delivered Diff. (f) Cost (g) Sweet/Sour Diff. (h) Jan 32.83 2.91 5.16 4.26 (2.80) 31.78 1.05 1.69 33.47 (0.64) (4.98) 26.80 6.03 (1.81) Feb 32.37 2.72 4.56 3.82 (3.23) 30.62 1.75 1.30 31.92 0.45 (4.84) 25.78 6.59 (1.35) Mar 40.06 6.42 5.17 5.67 (2.97) 37.96 2.10 1.80 39.76 0.30 (5.46) 32.50 7.56 (2.33) 1st Qtr 35.29 4.11 4.97 4.62 (3.00) 33.63 1.66 1.60 35.23 0.06 (5.11) 28.52 6.77 (1.84) Apr 42.69 8.58 6.45 7.30 (3.09) 41.12 1.57 2.40 43.52 (0.83) (5.00) 36.12 6.57 (2.08) May 48.69 9.32 5.92 7.28 (3.03) 46.80 1.89 1.70 48.50 0.19 (5.94) 40.86 7.83 (1.52) Jun 50.60 10.47 6.94 8.35 (3.75) 48.85 1.75 2.01 50.86 (0.26) (4.61) 44.24 6.36 (0.87) 2nd Qtr 47.38 9.47 6.44 7.66 (3.30) 45.64 1.74 2.04 47.68 (0.30) (5.17) 40.47 6.91 (1.49) Jul 46.42 6.15 6.20 6.18 (4.03) 44.80 1.62 1.84 46.64 (0.22) (4.55) 40.25 6.17 (0.70) Aug 46.33 10.33 8.58 9.28 (3.67) 44.80 1.53 1.76 46.56 (0.23) (4.65) 40.15 6.18 (0.89) Sep 46.83 9.35 8.04 8.57 (3.65) 45.23 1.60 1.59 46.81 0.01 (4.89) 40.34 6.49 (0.98) 3rd Qtr 46.52 8.70 7.66 8.08 (3.78) 44.94 1.58 1.73 46.67 (0.15) (4.70) 40.24 6.28 (0.86) Oct 51.35 6.56 8.03 7.44 (3.79) 49.94 1.41 1.65 51.59 (0.24) (5.01) 44.93 6.42 (0.84) Nov 46.72 5.08 6.91 6.18 (3.83) 45.76 0.95 1.50 47.26 (0.54) (4.92) 40.85 5.87 (0.66) Dec 53.53 7.25 9.30 8.48 (4.10) 52.17 1.36 1.12 53.29 0.24 (4.87) 47.29 6.23 (0.84) 4th Qtr 50.59 6.32 8.10 7.39 (3.91) 49.29 1.30 1.42 50.71 (0.12) (4.93) 44.36 6.24 (0.78) YTD 45.01 7.19 6.80 6.96 (3.50) 43.47 1.55 1.70 45.17 (0.15) (4.98) 38.49 6.52 (1.24) (A) (B) (C) (D) (E) (F) (G) (H) (I) (J) (K) (L) (M) (N) Crude Non-Crude Total LLS 6-3-2-1 RIN/CBOB Sweet/Sour LLS Prompt LLS Prompt Market Gross Margin Reported Reported vs. Sour Crude Oil WTI- Priced Crude Throughput Throughput Throughput Crack Spread Crack Adjustment Differential vs WTI Prompt vs Delivered Structure Indicator Gross Margin* Indicator Throughput Oil Throughput (mmbbls) (mmbbls) (mmbbls) ($MM) ($MM) ($MM) ($MM) ($MM) ($MM) ($MM) ($MM) Other Gross Margin Percentage Percentage (A) + (B) (C) x Col 4 (C) x Col 5 (A) x Col 13 x (M) (A) x Col 7 x (N) (A) x Col 10 x [1-(M)-(N)] (A) x Col 14 x 75% Sum of (D) thru (I) ($MM) (K) - (J) (Detail Below) 1Q15 150 16 167 1,615 (439) 596 126 58 82 2,038 2,691 653 56% 20% 2Q15 163 15 178 1,819 (453) 438 158 (54) 255 2,163 2,635 472 55% 19% 3Q15 160 15 176 2,142 (423) 527 122 (6) 76 2,438 3,037 599 56% 20% 4Q15 151 18 169 1,124 (336) 534 40 (30) 112 1,444 2,148 704 55% 20% 1Q16 146 16 161 747 (485) 604 44 2 199 1,111 1,611 500 61% 18% 2Q16 157 15 172 1,316 (567) 665 58 (8) 177 1,641 2,204 563 61% 21% 3Q16 165 12 177 1,431 (669) 607 52 (5) 108 1,524 1,906 382 59% 20% 4Q16 154 13 167 1,230 (651) 581 36 (4) 87 1,279 1,900 621 61% 18% Reported vs. Crude Related Product Related Volumetric Gains Indicator ($MM) ($MM) ($MM) ($MM) 1Q15 653 (303) 813 143 2Q15 472 (371) 640 203 3Q15 599 (391) 798 192 4Q15 704 (266) 822 148 1Q16 500 (493) 864 129 2Q16 563 (320) 697 186 3Q16 382 (403) 624 161 4Q16 621 (278) 759 140 Gross Margin Indicator Calculation Based on Actuals Reported vs. Indicator Variance Explanation | Other Gross Margin Historical Data Tab 7 RIN/CBOB Crack Adjustment (d) (2.80) (3.23) (2.97) (3.00) (3.09) (3.03) (3.75) (3.30) (4.0 ) (3.67) (3.65) (3.78) (3.79) (3.83) (4.10) (3.9 ) (3.50) Reported vs. Crude Related Product Related Volumetric Gains Indicator ($MM) ($MM) ($MM) ($MM) 1Q15 653 (303) 813 143 2Q15 472 (371) 640 203 3Q15 599 (391) 798 192 4Q15 704 (266) 822 148 1Q16 500 (493) 864 129 2Q16 563 (320) 697 186 3Q16 382 (403) 624 161 4Q16 621 (278) 759 140 Reported vs. Indicator Variance Explanation | Other Gross Margin


