UNITED STATES
SECURITIES AND EXCHANGE COMMISSION
Washington, D.C. 20549
FORM N-CSR
CERTIFIED SHAREHOLDER REPORT OF REGISTERED MANAGEMENT INVESTMENT COMPANIES
Investment Company Act file number 811-22519
First Trust Exchange-Traded AlphaDEX® Fund II
(Exact name of registrant as specified in charter)
120 East Liberty Drive, Suite 400
Wheaton, IL 60187
(Address of principal executive offices) (Zip code)
W. Scott Jardine, Esq.
First Trust Portfolios L.P.
120 East Liberty Drive, Suite 400
Wheaton, IL 60187
(Name and address of agent for service)
Registrant's telephone number, including area code: (630) 765-8000
Date of fiscal year end:December 31
Date of reporting period:December 31, 2018
Form N-CSR is to be used by management investment companies to file reports with the Commission not later than 10 days after the transmission to stockholders of any report that is required to be transmitted to stockholders under Rule 30e-1 under the Investment Company Act of 1940 (17 CFR 270.30e-1). The Commission may use the information provided on Form N-CSR in its regulatory, disclosure review, inspection, and policymaking roles.
A registrant is required to disclose the information specified by Form N-CSR, and the Commission will make this information public. A registrant is not required to respond to the collection of information contained in Form N-CSR unless the Form displays a currently valid Office of Management and Budget (“OMB”) control number. Please direct comments concerning the accuracy of the information collection burden estimate and any suggestions for reducing the burden to Secretary, Securities and Exchange Commission, 100 F Street, NE, Washington, DC 20549-0609. The OMB has reviewed this collection of information under the clearance requirements of 44 U.S.C. § 3507.
Item 1. Report to Stockholders.
The registrant's annual report transmitted to shareholders pursuant to Rule 30e-1 under the Investment Company Act of 1940 is as follows:
First Trust Exchange-Traded AlphaDEX® Fund II
First Trust Asia Pacific ex-Japan AlphaDEX®Fund (FPA)
First Trust Europe AlphaDEX®Fund (FEP)
First Trust Latin America AlphaDEX®Fund (FLN)
First Trust Brazil AlphaDEX®Fund (FBZ)
First Trust China AlphaDEX®Fund (FCA)
First Trust Japan AlphaDEX®Fund (FJP)
First Trust South Korea AlphaDEX®Fund (FKO)
First Trust Developed Markets ex-US AlphaDEX®Fund (FDT)
First Trust Emerging Markets AlphaDEX®Fund (FEM)
First Trust Germany AlphaDEX®Fund (FGM)
First Trust Canada AlphaDEX®Fund (FCAN)
First Trust Australia AlphaDEX®Fund (FAUS)
First Trust United Kingdom AlphaDEX®Fund (FKU)
First Trust India NIFTY 50 Equal Weight ETF (NFTY) (formerly known as First Trust Taiwan AlphaDEX®Fund)
First Trust Hong Kong AlphaDEX®Fund (FHK)
First Trust Switzerland AlphaDEX®Fund (FSZ)
First Trust Developed Markets ex-US Small Cap AlphaDEX®Fund (FDTS)
First Trust Emerging Markets Small Cap AlphaDEX®Fund (FEMS)
First Trust Eurozone AlphaDEX®ETF (FEUZ)
AlphaDEX® is a registered trademark of First Trust Portfolios L.P.
First Trust Exchange-Traded AlphaDEX® Fund II
Annual Report
December 31, 2018
Caution Regarding Forward-Looking Statements
This report contains certain forward-looking statements within the meaning of the Securities Act of 1933, as amended, and the Securities Exchange Act of 1934, as amended. Forward-looking statements include statements regarding the goals, beliefs, plans or current expectations of First Trust Advisors L.P. (“First Trust” or the “Advisor”) and its representatives, taking into account the information currently available to them. Forward-looking statements include all statements that do not relate solely to current or historical fact. For example, forward-looking statements include the use of words such as “anticipate,” “estimate,” “intend,” “expect,” “believe,” “plan,” “may,” “should,” “would” or other words that convey uncertainty of future events or outcomes.
Forward-looking statements involve known and unknown risks, uncertainties and other factors that may cause the actual results, performance or achievements of any series of First Trust Exchange-Traded AlphaDEX® Fund II (the “Trust”) described in this report (each such series is referred to as a “Fund” and collectively, the “Funds”) to be materially different from any future results, performance or achievements expressed or implied by the forward-looking statements. When evaluating the information included in this report, you are cautioned not to place undue reliance on these forward-looking statements, which reflect the judgment of the Advisor and its representatives only as of the date hereof. We undertake no obligation to publicly revise or update these forward-looking statements to reflect events and circumstances that arise after the date hereof.
Performance and Risk Disclosure
There is no assurance that any Fund described in this report will achieve its investment objective. Each Fund is subject to market risk, which is the possibility that the market values of securities owned by the Fund will decline and that the value of the Fund shares may therefore be less than what you paid for them. Accordingly, you can lose money by investing in a Fund. See “Risk Considerations” in the Additional Information section of this report for a discussion of certain other risks of investing in the Funds.
Performance data quoted represents past performance, which is no guarantee of future results, and current performance may be lower or higher than the figures shown. For the most recent month-end performance figures, please visitwww.ftportfolios.comor speak with your financial advisor. Investment returns, net asset value and share price will fluctuate and Fund shares, when sold, may be worth more or less than their original cost.
The Advisor may also periodically provide additional information on Fund performance on each Fund’s web page atwww.ftportfolios.com.
How to Read This Report
This report contains information that may help you evaluate your investment. It includes details about each Fund and presents data and analysis that provide insight into each Fund’s performance and investment approach.
By reading the market overview by Robert F. Carey, Chief Market Strategist of the Advisor, you may obtain an understanding of how the market environment affected the performance of each Fund. The statistical information that follows may help you understand each Fund’s performance compared to that of relevant market benchmarks.
It is important to keep in mind that the opinions expressed by personnel of the Advisor are just that: informed opinions. They should not be considered to be promises or advice. The opinions, like the statistics, cover the period through the date on the cover of this report. The material risks of investing in each Fund are spelled out in the prospectus, the statement of additional information, and other Fund regulatory filings.
First Trust Exchange-Traded AlphaDEX® Fund II
Annual Letter from the Chairman and CEO
December 31, 2018
Dear Shareholders,
First Trust is pleased to provide you with the annual report for the First Trust Exchange-Traded AlphaDEX®Fund II (the “Funds”), which contains detailed information about the Funds for the twelve months ended December 31, 2018, including a market overview and performance analyses. We encourage you to read this report carefully and discuss it with your financial advisor.
As I wrote in my June 2018 letter, investors were hoping for another strong year in the markets for 2018. For the entire year, however, increased market volatility was the norm for U.S. and global markets. Despite the volatility, August was a strong month for stocks, and the Dow Jones Industrial Average (“DJIA”) finished the month just under its previous high in January 2018. At the close of the third quarter in September, the markets had moved higher into positive territory. In fact, all three major U.S. indices (the Nasdaq Composite Index, the DJIA and the S&P 500® Index) hit record levels during the third quarter. Yet, in October, markets were again very volatile, surprising analysts and investors alike. Both global markets and U.S. markets fell on fears of slowing growth, trade wars and higher interest rates. The DJIA was down 5% for October and the MSCI EAFE Index, an index of stocks in 21 developed markets (excluding the U.S. and Canada), was down 9% for the month. However, investors cheered as November ended, and the DJIA climbed 617 points (2.5%) to its biggest one-day gain in eight months. The MSCI EAFE Index ended November down slightly. December held its own shocks as it became the worst December for stocks since the Great Depression. The DJIA and the MSCI EAFE Index ended December with year-to-date returns of -3.48% and-13.79%, respectively.
Based on continued strong job growth and the economic outlook in the U.S., the Federal Reserve (the “Fed”) raised interest rates in March, June and September. At their September meeting, the Fed indicated the possibility of one additional rate hike in 2018 and three more in 2019. At their November meeting, the Fed did not raise interest rates. However, at their December 19th meeting, the Fed did raise interest rates by 25 basis points. Analysts and investors will be watching to see what the Fed does with rates in 2019.
While trade tensions have had an impact on markets around the world and could continue to do so in the future, our First Trust economists believe that the long-term impact of U.S. tariffs will be to encourage countries to come back to the table and talk about more equal trade. Despite market volatility, we continue to believe that the combination of low interest rates, low inflation and strong corporate earnings still point to a positive economic environment and further growth, though we understand that past performance can never guarantee future performance.
We continue to believe that you should invest for the long term and be prepared for market movements, which can happen at any time. You can do this by keeping current on your portfolio and by speaking regularly with your investment professional. Markets go up and they also go down, but savvy investors are prepared for either through careful attention to investment goals.
Thank you for giving First Trust the opportunity to be a part of your financial plan. We value our relationship with you and will report on the Funds again in six months.
Sincerely,
James A. Bowen
Chairman of the Board of Trustees
Chief Executive Officer of First Trust Advisors L.P.
First Trust Exchange-Traded AlphaDEX® Fund II
Annual Report
December 31, 2018
Robert F. Carey, CFA
Senior Vice President and Chief Market Strategist
First Trust Advisors L.P.
Mr. Carey is responsible for the overall management of research and analysis of the First Trust product line. Mr. Carey has over 25 years of experience as an Equity and Fixed-Income Analyst and is a recipient of the Chartered Financial Analyst (“CFA”) designation. He is a graduate of the University of Illinois at Champaign- Urbana with a B.S. in Physics. He is also a member of the Investment Analysts Society of Chicago and the CFA Institute. Mr. Carey has appeared as a guest on such programs as Bloomberg TV, CNBC, and WBBM Radio, and has been quoted by several publications, including The Wall Street Journal, The Wall Street Reporter, Bloomberg News Service, and Registered Rep.
State of the Global Economy
In its latest forecast, the International Monetary Fund (“IMF”) is calling for the world real gross domestic product (“GDP”) growth rate to dip from an estimated 3.7% in 2018 to an estimated 3.5% in 2019, according to its own release. The IMF cited the ongoing trade dispute between the U.S. and China as being partly responsible for the small downward revision in growth. The U.S. real GDP growth rate is expected to decrease from an estimated 2.9% in 2018 to an estimated 2.5% in 2019. The growth rate for Emerging Market and Developing Economies is expected to dip from an estimated 4.6% in 2018 to an estimated 4.5% in 2019. As indicated by the growth forecasts, we believe there is no imminent threat of a global economic recession.
We believe that concerns over the extent to which interest rates could trend higher in 2019 and the potential for trade tariffs escalating to an all-out trade war were largely behind the spikes in volatility in the stock market in 2018. For those investors who fear that higher interest rates could dampen the prospects for stocks in 2019, Federal Reserve (the “Fed”) Chairman Jerome Powell announced on January 4, 2019 that the Fed will be adopting a “patient” approach to tightening monetary policy. With respect to trade, the Trump Administration sent trade representatives to China on January 7, 2019 to set up future trade policy talks. The two countries also agreed to a 90-day truce freezing tariffs until March 1, 2019. We believe stock prices would move higher on a U.S.-China trade deal.
ETFGI, an independent research and consultancy firm, reported that total assets invested in exchange-traded funds (“ETFs”) and other exchange-traded products (“ETPs”) listed globally stood at $4.79 trillion at the close of 2018, down from $4.84 trillion the previous year, according to its own release. The dip in assets under management was due to performance rather than capital flows. December 2018 marked the 59th consecutive month of net inflows into ETFs/ETPs listed globally. The U.S.’s share of the global market was approximately 70% at year-end.
U.S. Stocks and Bonds
The three major Standard & Poor’s stock indices finished 2018 in the red. The S&P 500® Index, S&P MidCap 400® Index and S&P SmallCap 600® Index posted total returns of -4.38%, -11.08%, and -8.48%, respectively, according to Bloomberg. Only three of the 11 major S&P 500® Index sectors posted positive total returns. The top-performing sectors were Health Care, Utilities and Consumer Discretionary, up 6.47%, 4.11% and 0.82%, respectively, on a total return basis. The sectors that posted the biggest losses were Energy, Materials and Industrials, down 18.10%, 14.70% and 13.32%, respectively. We believe that some of the downside in stock prices late in the year could be attributed to profit taking and tax selling. Keep in mind, the S&P 500® Index posted a total return of 21.83% in 2017, more than double its 9.98% average annual total return from 1926-2018, according to Ibbotson Associates/Morningstar.
Dividend growth has historically been a barometer of strength for Corporate America. The S&P Dow Jones Indices announced that total dividend distributions for U.S. common stocks increased by a net (increases less decreases) $7.4 billion in the third quarter of 2018, up from $4.5 billion from the third quarter of 2017, according to its own release. Net dividend increases totaled a record $58.4 billion in 2018, up from $37.1 billion in 2017. Currently, 82.2% of the companies in the S&P 500® Index pay a dividend, compared to 69.8% of the companies in the S&P MidCap 400® Index and 51.9% of the companies in the S&P SmallCap 600® Index. Total global dividend payouts are expected to rise 6.0% year-over-year to a record $1.81 trillion in 2019, according to business information provider IHS Markit, a London-based global information provider. Dividend-paying companies in the U.S. are expected to increase distributions by 8.1% according to IHS Markit.
In the U.S. bond market, the top-performing major debt group we track was intermediate-term Treasuries. The Bloomberg Barclays U.S. Treasury: Intermediate Index posted a total return of 1.41% in 2018. The worst-performing debt group that we track was high yield corporates. The Bloomberg Barclays U.S. Corporate High Yield Index posted a total return of -2.08%. The yield on the benchmark 10-Year Treasury note (T-note) rose by 28 basis points to 2.69% in 2018, according to Bloomberg. For comparative purposes, the average yield on the 10-year T-note was 2.51% for the 10-year period ended December 31, 2018.
Foreign Stocks and Bonds
The U.S. dollar registered a gain of 4.40% against a basket of major currencies in 2018, as measured by the U.S. Dollar Index (DXY). With respect to U.S. investors, a stronger U.S. dollar can negatively impact returns on unhedged foreign securities. We believe the dollar strengthened due to the escalating trade/tariff battle between the U.S. and its major trading partners, particularly China.
Both foreign stocks and bonds succumbed to selling pressure in 2018. The Bloomberg Barclays Global Aggregate Index of higher quality debt posted a total return of -1.20% (USD), while the Bloomberg Barclays EM Hard Currency Aggregate Index of emerging markets debt fell 3.02%, according to Bloomberg Barclays. With respect to equities, the MSCI Daily Total Return Net World Index (excluding the U.S.) posted a total return of -14.09% (USD), compared to -14.58% (USD) for the MSCI Daily Total Return Net Emerging Markets Index.
Fund Performance Overview (Unaudited)
First Trust Asia Pacific ex-Japan AlphaDEX® Fund (FPA)
The First Trust Asia Pacific ex-Japan AlphaDEX® Fund (the “Fund”) seeks investment results that correspond generally to the price and yield (before the Fund’s fees and expenses) of an equity index called the NASDAQ AlphaDEX® Asia Pacific Ex-Japan Index (the “Index”). The Fund will normally invest at least 90% of its net assets (including investment borrowings) in common stocks and/or depositary receipts that comprise the Index. The shares of the Fund are listed and trade on The Nasdaq Stock Market LLC (the “Nasdaq”) under the ticker symbol “FPA.” The Fund commenced trading on April 19, 2011.
The Index employs the AlphaDEX® stock selection methodology which uses fundamental growth and value factors to objectively select stocks from the NASDAQ DM Asia Pacific Ex-Japan Index which may generate positive alpha relative to traditional passive indices. The Index is a modified equal-dollar weighted index where higher ranked stocks receive a higher weight within the Index.
| Performance | | | | | | |
| | | Average Annual Total Returns | | Cumulative Total Returns |
| | 1 Year
Ended
12/31/18 | 5 Years
Ended
12/31/18 | Inception
(4/18/11)
to 12/31/18 | | 5 Years
Ended
12/31/18 | Inception
(4/18/11)
to 12/31/18 |
| Fund Performance | | | | | | |
| NAV | -20.71% | 2.61% | 1.62% | | 13.77% | 13.22% |
| Market Price | -20.57% | 2.27% | 1.54% | | 11.86% | 12.53% |
| Index Performance | | | | | | |
| NASDAQ AlphaDEX® Asia Pacific Ex-Japan Index(1) | -19.58% | N/A | N/A | | N/A | N/A |
| NASDAQ DM Asia Pacific Ex-Japan Index(1) | -14.20% | N/A | N/A | | N/A | N/A |
| MSCI Pacific ex-Japan Index | -10.30% | 2.10% | 2.53% | | 10.93% | 21.20% |
(See Notes to Fund Performance Overview Page 43.)
Performance Review
The Fund generated a net asset value (“NAV”) return of -20.71% during the 12-month period covered by this report. During the same period, the MSCI Pacific ex-Japan Index (“benchmark”) generated a return of -10.30%. South Korea had the greatest weight (37%), worst total return (-25%), and the most negative contribution to the Fund’s total return (-9.8%) over the period. No country had a positive return, but New Zealand securities, at a 1.6% weight, had the least-negative return of -8.8% return and, factoring in currency effect, only a -0.02% contribution to the Fund’s total return. The total currency effect to the Fund over the period covered in this report totaled -3.4%. On a relative basis, the Fund underperformed the benchmark. The most substantial underperformance comes from the heavily-weighted South Korea, which caused -3.3% underperformance against the benchmark. The Fund saw 1.2% outperformance over the benchmark by simply not investing in Chinese securities, which were an 8% weight in the benchmark.
| (1) | Performance data is not available for all the periods shown in the table for the index because performance data does not exist for some of the entire periods. |
Fund Performance Overview (Unaudited) (Continued)
First Trust Asia Pacific ex-Japan AlphaDEX® Fund (FPA) (Continued)
| Sector Allocation | % of Total
Long-Term
Investments |
| Real Estate | 31.4% |
| Industrials | 15.9 |
| Materials | 13.3 |
| Energy | 8.8 |
| Information Technology | 7.1 |
| Consumer Discretionary | 6.4 |
| Communication Services | 4.0 |
| Consumer Staples | 3.7 |
| Financials | 3.4 |
| Utilities | 3.1 |
| Health Care | 2.9 |
| Total | 100.0% |
| Top Ten Holdings | % of Total
Long-Term
Investments |
| Link REIT | 1.9% |
| Lotte Chemical Corp. | 1.9 |
| Champion REIT | 1.8 |
| CK Asset Holdings Ltd. | 1.8 |
| Swire Pacific Ltd., Class A | 1.8 |
| LG Uplus Corp. | 1.8 |
| LG Corp. | 1.8 |
| Hongkong Land Holdings Ltd. | 1.8 |
| Washington H Soul Pattinson & Co., Ltd. | 1.8 |
| Vitasoy International Holdings Ltd. | 1.7 |
| Total | 18.1% |

Performance figures assume reinvestment of all distributions and do not reflect the deduction of taxes that a shareholder would pay on Fund distributions or the redemption or sale of Fund shares. An index is a statistical composite that tracks a specified financial market or sector. Unlike the Fund, the index does not actually hold a portfolio of securities and therefore does not incur the expenses incurred by the Fund. These expenses negatively impact the performance of the Fund. The Fund’s past performance does not predict future performance.
Frequency Distribution of Discounts and Premiums
Bid/Ask Midpoint vs. NAV through December 31, 2018
The following Frequency Distribution of Discounts and Premiums charts are provided to show the frequency at which the bid/ask midpoint price for the Fund was at a discount or premium to the daily NAV. The following tables are for comparative purposes only and represent the period January 1, 2014 through December 31, 2018. Shareholders may pay more than NAV when they buy Fund shares and receive less than NAV when they sell those shares because shares are bought and sold at current market price. Data presented represents past performance and cannot be used to predict future results.
| Number of Days Bid/Ask Midpoint At/Above NAV |
| For the Period | 0.00%–0.49% | 0.50%–0.99% | 1.00%–1.99% | >=2.00% |
| 1/1/14 – 12/31/14 | 98 | 36 | 0 | 0 |
| 1/1/15 – 12/31/15 | 71 | 40 | 4 | 0 |
| 1/1/16 – 12/31/16 | 73 | 34 | 4 | 0 |
| 1/1/17 – 12/31/17 | 102 | 47 | 5 | 0 |
| 1/1/18 – 12/31/18 | 51 | 10 | 1 | 0 |
| Number of Days Bid/Ask Midpoint Below NAV |
| For the Period | 0.00%–0.49% | 0.50%–0.99% | 1.00%–1.99% | >=2.00% |
| 1/1/14 – 12/31/14 | 83 | 32 | 3 | 0 |
| 1/1/15 – 12/31/15 | 76 | 52 | 9 | 0 |
| 1/1/16 – 12/31/16 | 81 | 52 | 7 | 1 |
| 1/1/17 – 12/31/17 | 69 | 28 | 0 | 0 |
| 1/1/18 – 12/31/18 | 104 | 71 | 13 | 1 |
Fund Performance Overview (Unaudited) (Continued)
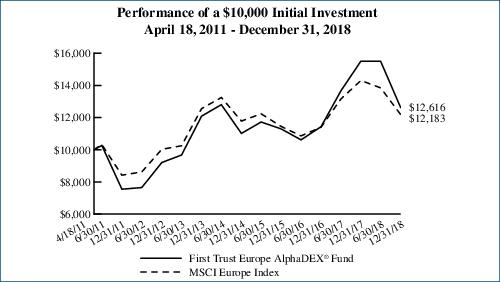
First Trust Europe AlphaDEX® Fund (FEP)
The First Trust Europe AlphaDEX® Fund (the “Fund”) seeks investment results that correspond generally to the price and yield (before the Fund’s fees and expenses) of an equity index called the NASDAQ AlphaDEX® Europe Index (the “Index”). The Fund will normally invest at least 90% of its net assets (including investment borrowings) in common stocks and/or depositary receipts that comprise the Index. The shares of the Fund are listed and trade on the Nasdaq under the ticker symbol “FEP.” The Fund commenced trading on April 19, 2011.
The Index employs the AlphaDEX® stock selection methodology which uses fundamental growth and value factors to objectively select stocks from the NASDAQ DM Europe Index which may generate positive alpha relative to traditional passive indices. The Index is a modified equal-dollar weighted index where higher ranked stocks receive a higher weight within the Index.
| Performance | | | | | | |
| | | Average Annual Total Returns | | Cumulative Total Returns |
| | 1 Year
Ended
12/31/18 | 5 Years
Ended
12/31/18 | Inception
(4/18/11)
to 12/31/18 | | 5 Years
Ended
12/31/18 | Inception
(4/18/11)
to 12/31/18 |
| Fund Performance | | | | | | |
| NAV | -18.67% | 0.86% | 3.06% | | 4.35% | 26.16% |
| Market Price | -18.75% | 0.62% | 3.02% | | 3.11% | 25.78% |
| Index Performance | | | | | | |
| NASDAQ AlphaDEX® Europe Index(1) | -18.30% | N/A | N/A | | N/A | N/A |
| NASDAQ DM Europe Index(1) | -15.73% | N/A | N/A | | N/A | N/A |
| MSCI Europe Index | -14.86% | -0.61% | 2.60% | | -2.99% | 21.82% |
(See Notes to Fund Performance Overview Page 43.)
Performance Review
The Fund generated a NAV return of -18.67% during the 12-month period covered by this report. During the same period, the MSCI Europe Index (“benchmark”) generated a return of -14.86%. United Kingdom securities carried the highest allocation in the Fund over the period with a 26.1% weighting. These securities returned -19.11%, causing a -5.1% return in the Fund. Securities in Norway showed the greatest return in the Fund. At 0.72%, Norway was the only country in the Fund with a positive return. However, due to negative impact from currency return, these investments, at a 5.1% weight in the Fund, contributed -0.55% to the Fund’s total return. The total currency effect to the Fund over the period covered in this report totaled -4.7%. On a relative basis, the Fund underperformed the benchmark. United Kingdom securities created -1.4% of relative underperformance. Swedish securities created the greatest amount of outperformance for the Fund, earning 0.6% performance over the benchmark.
| (1) | Performance data is not available for all the periods shown in the table for the index because performance data does not exist for some of the entire periods. |
Fund Performance Overview (Unaudited) (Continued)
First Trust Europe AlphaDEX® Fund (FEP) (Continued)
| Sector Allocation | % of Total
Long-Term
Investments |
| Industrials | 16.8% |
| Consumer Discretionary | 15.6 |
| Materials | 13.5 |
| Real Estate | 11.9 |
| Energy | 9.1 |
| Financials | 8.9 |
| Communication Services | 5.6 |
| Consumer Staples | 5.6 |
| Information Technology | 5.0 |
| Health Care | 4.9 |
| Utilities | 3.1 |
| Total | 100.0% |
| Top Ten Holdings | % of Total
Long-Term
Investments |
| Polymetal International PLC | 1.1% |
| Hufvudstaden AB, Class A | 1.0 |
| Fabege AB | 1.0 |
| Acciona S.A. | 0.9 |
| Neste OYJ | 0.9 |
| Berkeley Group Holdings PLC | 0.9 |
| Deutsche Lufthansa AG | 0.9 |
| International Consolidated Airlines Group S.A. | 0.9 |
| Merlin Properties Socimi S.A. | 0.9 |
| Segro PLC | 0.9 |
| Total | 9.4% |
Performance figures assume reinvestment of all distributions and do not reflect the deduction of taxes that a shareholder would pay on Fund distributions or the redemption or sale of Fund shares. An index is a statistical composite that tracks a specified financial market or sector. Unlike the Fund, the index does not actually hold a portfolio of securities and therefore does not incur the expenses incurred by the Fund. These expenses negatively impact the performance of the Fund. The Fund’s past performance does not predict future performance.
Frequency Distribution of Discounts and Premiums
Bid/Ask Midpoint vs. NAV through December 31, 2018
The following Frequency Distribution of Discounts and Premiums charts are provided to show the frequency at which the bid/ask midpoint price for the Fund was at a discount or premium to the daily NAV. The following tables are for comparative purposes only and represent the period January 1, 2014 through December 31, 2018. Shareholders may pay more than NAV when they buy Fund shares and receive less than NAV when they sell those shares because shares are bought and sold at current market price. Data presented represents past performance and cannot be used to predict future results.
| Number of Days Bid/Ask Midpoint At/Above NAV |
| For the Period | 0.00%–0.49% | 0.50%–0.99% | 1.00%–1.99% | >=2.00% |
| 1/1/14 – 12/31/14 | 147 | 25 | 1 | 0 |
| 1/1/15 – 12/31/15 | 144 | 46 | 5 | 0 |
| 1/1/16 – 12/31/16 | 46 | 4 | 0 | 0 |
| 1/1/17 – 12/31/17 | 177 | 28 | 0 | 0 |
| 1/1/18 – 12/31/18 | 139 | 17 | 1 | 0 |
| Number of Days Bid/Ask Midpoint Below NAV |
| For the Period | 0.00%–0.49% | 0.50%–0.99% | 1.00%–1.99% | >=2.00% |
| 1/1/14 – 12/31/14 | 69 | 9 | 1 | 0 |
| 1/1/15 – 12/31/15 | 51 | 6 | 0 | 0 |
| 1/1/16 – 12/31/16 | 170 | 29 | 3 | 0 |
| 1/1/17 – 12/31/17 | 46 | 0 | 0 | 0 |
| 1/1/18 – 12/31/18 | 89 | 3 | 1 | 1 |
Fund Performance Overview (Unaudited) (Continued)
First Trust Latin America AlphaDEX® Fund (FLN)
The First Trust Latin America AlphaDEX® Fund (the “Fund”) seeks investment results that correspond generally to the price and yield (before the Fund’s fees and expenses) of an equity index called the NASDAQ AlphaDEX® Latin America Index (the “Index”). The Fund will normally invest at least 90% of its net assets (including investment borrowings) in common stocks and/or depositary receipts that comprise the Index. The shares of the Fund are listed and trade on the Nasdaq under the ticker symbol “FLN.” The Fund commenced trading on April 19, 2011.
The Index employs the AlphaDEX® stock selection methodology which uses fundamental growth and value factors to objectively select stocks from the NASDAQ Latin America Index which may generate positive alpha relative to traditional passive indices. The Index is a modified equal-dollar weighted index where higher ranked stocks receive a higher weight within the Index.
| Performance | | | | | | |
| | | Average Annual Total Returns | | Cumulative Total Returns |
| | 1 Year
Ended
12/31/18 | 5 Years
Ended
12/31/18 | Inception
(4/18/11)
to 12/31/18 | | 5 Years
Ended
12/31/18 | Inception
(4/18/11)
to 12/31/18 |
| Fund Performance | | | | | | |
| NAV | -7.50% | -1.01% | -2.71% | | -4.94% | -19.09% |
| Market Price | -7.71% | -1.11% | -2.76% | | -5.42% | -19.39% |
| Index Performance | | | | | | |
| NASDAQ AlphaDEX® Latin America Index(1) | -6.42% | N/A | N/A | | N/A | N/A |
| NASDAQ Latin America Index(1) | -5.91% | -1.65% | N/A | | -7.98% | N/A |
| MSCI EM Latin America Index | -6.57% | -1.73% | -4.34% | | -8.37% | -28.95% |
(See Notes to Fund Performance Overview Page 43.)
Performance Review
The Fund generated a NAV return of -7.50% during the 12-month period covered by this report. During the same period, the MSCI EM Latin America Index (“benchmark”) generated a return of -6.57%. Brazilian securities carried the greatest weight and also had the greatest contribution to the Fund’s return during the period. Brazil was weighted at 58% and the total contribution to return was 0.9%. The total currency effect to the Fund over the period covered in this report totaled -11.2%. On a relative basis, the Fund underperformed the benchmark. Securities in Colombia and Chile caused the most underperformance, each with -0.4% contribution to underperformance against the benchmark. The most outperformance was earned from investments in Brazil and Mexico, as each garnered 0.4% outperformance against the index.
| (1) | Performance data is not available for all the periods shown in the table for the index because performance data does not exist for some of the entire periods. |
Fund Performance Overview (Unaudited) (Continued)
First Trust Latin America AlphaDEX® Fund (FLN) (Continued)
| Sector Allocation | % of Total
Long-Term
Investments |
| Financials | 24.8% |
| Materials | 16.7 |
| Utilities | 13.9 |
| Industrials | 12.9 |
| Consumer Staples | 11.8 |
| Communication Services | 7.5 |
| Consumer Discretionary | 6.0 |
| Energy | 4.7 |
| Real Estate | 1.7 |
| Total | 100.0% |
| Top Ten Holdings | % of Total
Long-Term
Investments |
| Cia de Saneamento Basico do Estado de Sao Paulo | 4.7% |
| IRB Brasil Resseguros S.A. | 4.4 |
| Itausa - Investimentos Itau S.A. (Preference Shares) | 4.2 |
| Telefonica Brasil S.A. (Preference Shares) | 4.2 |
| Banco do Brasil S.A. | 3.3 |
| Enel Americas S.A. | 3.1 |
| Porto Seguro S.A. | 3.1 |
| Gerdau S.A. (Preference Shares) | 3.0 |
| Petroleo Brasileiro S.A. (Preference Shares) | 3.0 |
| Grupo Elektra S.A.B. de C.V. | 2.9 |
| Total | 35.9% |

Performance figures assume reinvestment of all distributions and do not reflect the deduction of taxes that a shareholder would pay on Fund distributions or the redemption or sale of Fund shares. An index is a statistical composite that tracks a specified financial market or sector. Unlike the Fund, the index does not actually hold a portfolio of securities and therefore does not incur the expenses incurred by the Fund. These expenses negatively impact the performance of the Fund. The Fund’s past performance does not predict future performance.
Frequency Distribution of Discounts and Premiums
Bid/Ask Midpoint vs. NAV through December 31, 2018
The following Frequency Distribution of Discounts and Premiums charts are provided to show the frequency at which the bid/ask midpoint price for the Fund was at a discount or premium to the daily NAV. The following tables are for comparative purposes only and represent the period January 1, 2014 through December 31, 2018. Shareholders may pay more than NAV when they buy Fund shares and receive less than NAV when they sell those shares because shares are bought and sold at current market price. Data presented represents past performance and cannot be used to predict future results.
| Number of Days Bid/Ask Midpoint At/Above NAV |
| For the Period | 0.00%–0.49% | 0.50%–0.99% | 1.00%–1.99% | >=2.00% |
| 1/1/14 – 12/31/14 | 79 | 0 | 0 | 0 |
| 1/1/15 – 12/31/15 | 83 | 36 | 1 | 0 |
| 1/1/16 – 12/31/16 | 83 | 14 | 6 | 1 |
| 1/1/17 – 12/31/17 | 46 | 37 | 2 | 0 |
| 1/1/18 – 12/31/18 | 69 | 11 | 1 | 1 |
| Number of Days Bid/Ask Midpoint Below NAV |
| For the Period | 0.00%–0.49% | 0.50%–0.99% | 1.00%–1.99% | >=2.00% |
| 1/1/14 – 12/31/14 | 146 | 24 | 3 | 0 |
| 1/1/15 – 12/31/15 | 110 | 21 | 1 | 0 |
| 1/1/16 – 12/31/16 | 88 | 56 | 2 | 2 |
| 1/1/17 – 12/31/17 | 113 | 53 | 0 | 0 |
| 1/1/18 – 12/31/18 | 120 | 48 | 1 | 0 |
Fund Performance Overview (Unaudited) (Continued)
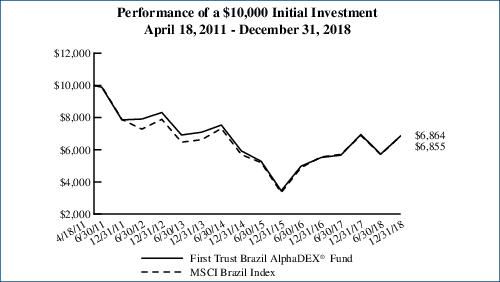
First Trust Brazil AlphaDEX® Fund (FBZ)
The First Trust Brazil AlphaDEX® Fund (the “Fund”) seeks investment results that correspond generally to the price and yield (before the Fund’s fees and expenses) of an equity index called the NASDAQ AlphaDEX® Brazil Index (the “Index”). The Fund will normally invest at least 90% of its net assets (including investment borrowings) in common stocks and/or depositary receipts that comprise the Index. The shares of the Fund are listed and trade on the Nasdaq under the ticker symbol “FBZ.” The Fund commenced trading on April 19, 2011.
The Index employs the AlphaDEX® stock selection methodology which uses fundamental growth and value factors to objectively select stocks from the NASDAQ Brazil Index which may generate positive alpha relative to traditional passive indices. The Index is a modified equal-dollar weighted index where higher ranked stocks receive a higher weight within the Index.
| Performance | | | | | | |
| | | Average Annual Total Returns | | Cumulative Total Returns |
| | 1 Year
Ended
12/31/18 | 5 Years
Ended
12/31/18 | Inception
(4/18/11)
to 12/31/18 | | 5 Years
Ended
12/31/18 | Inception
(4/18/11)
to 12/31/18 |
| Fund Performance | | | | | | |
| NAV | -1.17% | -0.64% | -4.77% | | -3.18% | -31.36% |
| Market Price | -1.89% | -0.98% | -4.86% | | -4.79% | -31.89% |
| Index Performance | | | | | | |
| NASDAQ AlphaDEX® Brazil Index(1) | 0.45% | N/A | N/A | | N/A | N/A |
| NASDAQ Brazil Index(1) | 0.74% | 1.81% | N/A | | 9.40% | N/A |
| MSCI Brazil Index | -0.49% | 0.69% | -4.78% | | 3.47% | -31.45% |
(See Notes to Fund Performance Overview Page 43.)
Performance Review
The Fund generated a NAV return of -1.17% during the 12-month period covered by this report. During the same period, the MSCI Brazil Index (“benchmark”) generated a return of -0.49%. The Utilities sector received the greatest allocation during the period, with a 19.4% weight in the Fund. These securities produced a slightly positive return, with total contribution to the Fund’s total return of 1.4%. Financials were the sector with the greatest performance and contribution to the Fund’s return. With a 12.4% weight and 26% return, the total contribution to the Fund’s return from the investments in Financials equaled 3.8%. In contrast, the Communication Services sector was the greatest drag on the Fund with a total contribution to the Fund’s return of -1.6%. The total currency effect to the Fund over the period covered in this report totaled -15.2%. On a relative basis, the Fund underperformed the benchmark. The largest underperformance came from the Materials sector, which generated -3.2% underperformance against the benchmark. The largest outperformance came simply from having a lesser allocation to the ill-performing Consumer Staples sector. This sector caused 4.16% outperformance against the benchmark.
| (1) | Performance data is not available for all the periods shown in the table for the index because performance data does not exist for some of the entire periods. |
Fund Performance Overview (Unaudited) (Continued)
First Trust Brazil AlphaDEX® Fund (FBZ) (Continued)
| Sector Allocation | % of Total
Long-Term
Investments |
| Utilities | 22.7% |
| Materials | 19.4 |
| Consumer Discretionary | 17.0 |
| Financials | 13.3 |
| Consumer Staples | 9.3 |
| Industrials | 9.3 |
| Communication Services | 4.2 |
| Energy | 3.8 |
| Health Care | 1.0 |
| Total | 100.0% |
| Top Ten Holdings | % of Total
Long-Term
Investments |
| Cia Energetica de Minas Gerais (Preference Shares) | 4.2% |
| Magazine Luiza S.A. | 3.9 |
| Cia Paranaense de Energia, Class B (Preference Shares) | 3.9 |
| Guararapes Confeccoes S.A. | 3.8 |
| Cia de Saneamento Basico do Estado de Sao Paulo | 3.8 |
| Rumo S.A. | 3.4 |
| Banco do Estado do Rio Grande do Sul S.A., Class B (Preference Shares) | 3.3 |
| Cia de Transmissao de Energia Electrica Paulista (Preference Shares) | 3.3 |
| Bradespar S.A. (Preference Shares) | 3.0 |
| Gerdau S.A. (Preference Shares) | 3.0 |
| Total | 35.6% |
Performance figures assume reinvestment of all distributions and do not reflect the deduction of taxes that a shareholder would pay on Fund distributions or the redemption or sale of Fund shares. An index is a statistical composite that tracks a specified financial market or sector. Unlike the Fund, the index does not actually hold a portfolio of securities and therefore does not incur the expenses incurred by the Fund. These expenses negatively impact the performance of the Fund. The Fund’s past performance does not predict future performance.
Frequency Distribution of Discounts and Premiums
Bid/Ask Midpoint vs. NAV through December 31, 2018
The following Frequency Distribution of Discounts and Premiums charts are provided to show the frequency at which the bid/ask midpoint price for the Fund was at a discount or premium to the daily NAV. The following tables are for comparative purposes only and represent the period January 1, 2014 through December 31, 2018. Shareholders may pay more than NAV when they buy Fund shares and receive less than NAV when they sell those shares because shares are bought and sold at current market price. Data presented represents past performance and cannot be used to predict future results.
| Number of Days Bid/Ask Midpoint At/Above NAV |
| For the Period | 0.00%–0.49% | 0.50%–0.99% | 1.00%–1.99% | >=2.00% |
| 1/1/14 – 12/31/14 | 119 | 16 | 3 | 0 |
| 1/1/15 – 12/31/15 | 32 | 7 | 5 | 0 |
| 1/1/16 – 12/31/16 | 88 | 14 | 3 | 2 |
| 1/1/17 – 12/31/17 | 71 | 21 | 2 | 0 |
| 1/1/18 – 12/31/18 | 104 | 13 | 2 | 4 |
| Number of Days Bid/Ask Midpoint Below NAV |
| For the Period | 0.00%–0.49% | 0.50%–0.99% | 1.00%–1.99% | >=2.00% |
| 1/1/14 – 12/31/14 | 98 | 10 | 5 | 1 |
| 1/1/15 – 12/31/15 | 78 | 123 | 6 | 1 |
| 1/1/16 – 12/31/16 | 101 | 39 | 4 | 1 |
| 1/1/17 – 12/31/17 | 122 | 34 | 1 | 0 |
| 1/1/18 – 12/31/18 | 112 | 14 | 2 | 0 |
Fund Performance Overview (Unaudited) (Continued)
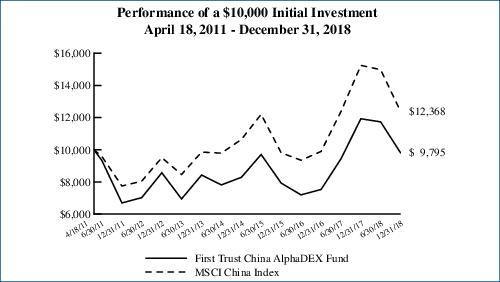
First Trust China AlphaDEX® Fund (FCA)
The First Trust China AlphaDEX® Fund (the “Fund”) seeks investment results that correspond generally to the price and yield (before the Fund’s fees and expenses) of an equity index called the NASDAQ AlphaDEX® China Index (the “Index”). The Fund will normally invest at least 90% of its net assets (including investment borrowings) in common stocks and/or depositary receipts that comprise the Index. The shares of the Fund are listed and trade on the Nasdaq under the ticker symbol “FCA.” The Fund commenced trading on April 19, 2011.
The Index employs the AlphaDEX® stock selection methodology which uses fundamental growth and value factors to objectively select stocks from the NASDAQ China Index which may generate positive alpha relative to traditional passive indices. The Index is a modified equal-dollar weighted index where higher ranked stocks receive a higher weight within the Index.
| Performance | | | | | | |
| | | Average Annual Total Returns | | Cumulative Total Returns |
| | 1 Year
Ended
12/31/18 | 5 Years
Ended
12/31/18 | Inception
(4/18/11)
to 12/31/18 | | 5 Years
Ended
12/31/18 | Inception
(4/18/11)
to 12/31/18 |
| Fund Performance | | | | | | |
| NAV | -17.87% | 3.05% | -0.27% | | 16.22% | -2.03% |
| Market Price | -18.15% | 2.67% | -0.42% | | 14.06% | -3.17% |
| Index Performance | | | | | | |
| NASDAQ AlphaDEX® China Index(1) | -16.88% | N/A | N/A | | N/A | N/A |
| NASDAQ China Index(1) | -15.94% | 5.35% | N/A | | 29.76% | N/A |
| MSCI China Index | -18.88% | 4.65% | 2.80% | | 25.50% | 23.67% |
(See Notes to Fund Performance Overview Page 43.)
Performance Review
The Fund generated a NAV return of -17.87% during the 12-month period covered by this report. During the same period, the MSCI China Index (“benchmark”) generated a return of -18.88%. The Materials sector received the greatest allocation during the period, with a 17.7% weight in the Fund. These securities contributed -4.1% to the Fund’s total return. These investments were not the worst sector, however, as the Consumer Discretionary sector, with a 12.9% allocation, contributed -5.0% to the Fund’s performance. The best sector for the Fund during the period were the investments in Real Estate. These investments carried a weight of 12.9% and contributed 0.9% to the Fund’s total return. The total currency effect to the Fund over the period covered in this report totaled -0.1%. On a relative basis, the Fund outperformed the benchmark. Investments in Communication Services contributed most to this outperformance, with 1.9% outperformance against the benchmark coming from this sector. The Financials and Information Technology sectors dampened the effect of the Communication Services sector with -2.2% and -2.0% underperformance, respectively.
| (1) | Performance data is not available for all the periods shown in the table for the index because performance data does not exist for some of the entire periods. |
Fund Performance Overview (Unaudited) (Continued)
First Trust China AlphaDEX® Fund (FCA) (Continued)
| Sector Allocation | % of Total
Long-Term
Investments |
| Materials | 20.1% |
| Utilities | 14.0 |
| Energy | 12.2 |
| Industrials | 12.0 |
| Consumer Discretionary | 10.0 |
| Real Estate | 7.9 |
| Communication Services | 7.0 |
| Health Care | 7.0 |
| Financials | 6.5 |
| Information Technology | 2.8 |
| Consumer Staples | 0.5 |
| Total | 100.0% |
| Top Ten Holdings | % of Total
Long-Term
Investments |
| Maanshan Iron & Steel Co., Ltd., Class H | 4.0% |
| Sinotruk Hong Kong Ltd. | 3.7 |
| ENN Energy Holdings Ltd. | 3.6 |
| China Telecom Corp., Ltd., Class H | 3.5 |
| China Mobile Ltd. | 3.5 |
| Beijing Enterprises Holdings Ltd. | 3.5 |
| Inner Mongolia Yitai Coal Co., Ltd., Class B | 3.5 |
| Dongfeng Motor Group Co., Ltd., Class H | 3.5 |
| Weichai Power Co., Ltd., Class H | 3.3 |
| Angang Steel Co., Ltd., Class H | 3.1 |
| Total | 35.2% |
Performance figures assume reinvestment of all distributions and do not reflect the deduction of taxes that a shareholder would pay on Fund distributions or the redemption or sale of Fund shares. An index is a statistical composite that tracks a specified financial market or sector. Unlike the Fund, the index does not actually hold a portfolio of securities and therefore does not incur the expenses incurred by the Fund. These expenses negatively impact the performance of the Fund. The Fund’s past performance does not predict future performance.
Frequency Distribution of Discounts and Premiums
Bid/Ask Midpoint vs. NAV through December 31, 2018
The following Frequency Distribution of Discounts and Premiums charts are provided to show the frequency at which the bid/ask midpoint price for the Fund was at a discount or premium to the daily NAV. The following tables are for comparative purposes only and represent the period January 1, 2014 through December 31, 2018. Shareholders may pay more than NAV when they buy Fund shares and receive less than NAV when they sell those shares because shares are bought and sold at current market price. Data presented represents past performance and cannot be used to predict future results.
| Number of Days Bid/Ask Midpoint At/Above NAV |
| For the Period | 0.00%–0.49% | 0.50%–0.99% | 1.00%–1.99% | >=2.00% |
| 1/1/14 – 12/31/14 | 76 | 56 | 8 | 2 |
| 1/1/15 – 12/31/15 | 58 | 35 | 19 | 6 |
| 1/1/16 – 12/31/16 | 42 | 14 | 2 | 0 |
| 1/1/17 – 12/31/17 | 24 | 12 | 0 | 0 |
| 1/1/18 – 12/31/18 | 78 | 76 | 26 | 3 |
| Number of Days Bid/Ask Midpoint Below NAV |
| For the Period | 0.00%–0.49% | 0.50%–0.99% | 1.00%–1.99% | >=2.00% |
| 1/1/14 – 12/31/14 | 72 | 31 | 7 | 0 |
| 1/1/15 – 12/31/15 | 69 | 44 | 19 | 2 |
| 1/1/16 – 12/31/16 | 65 | 91 | 36 | 2 |
| 1/1/17 – 12/31/17 | 100 | 96 | 18 | 1 |
| 1/1/18 – 12/31/18 | 47 | 17 | 3 | 1 |
Fund Performance Overview (Unaudited) (Continued)
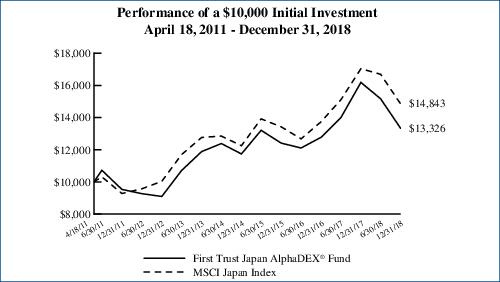
First Trust Japan AlphaDEX® Fund (FJP)
The First Trust Japan AlphaDEX® Fund (the “Fund”) seeks investment results that correspond generally to the price and yield (before the Fund’s fees and expenses) of an equity index called the NASDAQ AlphaDEX® Japan Index (the “Index”). The Fund will normally invest at least 90% of its net assets (including investment borrowings) in common stocks and/or depositary receipts that comprise the Index. The shares of the Fund are listed and trade on the Nasdaq under the ticker symbol “FJP.” The Fund commenced trading on April 19, 2011.
The Index employs the AlphaDEX® stock selection methodology which uses fundamental growth and value factors to objectively select stocks from the NASDAQ Japan Index which may generate positive alpha relative to traditional passive indices. The Index is a modified equal-dollar weighted index where higher ranked stocks receive a higher weight within the Index.
| Performance | | | | | | |
| | | Average Annual Total Returns | | Cumulative Total Returns |
| | 1 Year
Ended
12/31/18 | 5 Years
Ended
12/31/18 | Inception
(4/18/11)
to 12/31/18 | | 5 Years
Ended
12/31/18 | Inception
(4/18/11)
to 12/31/18 |
| Fund Performance | | | | | | |
| NAV | -17.66% | 2.32% | 3.80% | | 12.14% | 33.26% |
| Market Price | -18.48% | 1.85% | 3.66% | | 9.59% | 31.89% |
| Index Performance | | | | | | |
| NASDAQ AlphaDEX® Japan Index(1) | -17.29% | N/A | N/A | | N/A | N/A |
| NASDAQ Japan Index(1) | -13.25% | 3.73% | N/A | | 20.10% | N/A |
| MSCI Japan Index | -12.88% | 3.06% | 5.26% | | 16.29% | 48.43% |
(See Notes to Fund Performance Overview Page 43.)
Performance Review
The Fund generated a NAV return of -17.66% during the 12-month period covered by this report. During the same period, the MSCI Japan Index (“benchmark”) generated a return of -12.88%. The Industrials sector received the greatest allocation during the period, with a 24.5% weight in the Fund. These contributed -3.7% to the Fund’s total return. The Health Care sector garnered the best returns to the Fund, but due to having only 2.9% weight, the impact of these were limited to 1.1% of the Fund’s total return. The most negative investments were those in the Materials sector, which contributed -6.1% to the Fund’s total return. The total currency effect to the Fund over the period covered in this report totaled 2.2%. On a relative basis, the Fund underperformed the benchmark. This underperformance came substantially from the Materials and Consumer Discretionary sectors, which contributed -2.9% and -2.8% to underperformance, respectively. Utilities garnered 1% of outperformance and Health Care garnered 0.9% outperformance against the benchmark.
| (1) | Performance data is not available for all the periods shown in the table for the index because performance data does not exist for some of the entire periods. |
Fund Performance Overview (Unaudited) (Continued)
First Trust Japan AlphaDEX® Fund (FJP) (Continued)
| Sector Allocation | % of Total
Long-Term
Investments |
| Consumer Discretionary | 25.7% |
| Industrials | 20.9 |
| Materials | 17.3 |
| Consumer Staples | 10.4 |
| Information Technology | 6.7 |
| Utilities | 6.1 |
| Health Care | 4.6 |
| Communication Services | 3.3 |
| Energy | 3.2 |
| Financials | 1.4 |
| Real Estate | 0.4 |
| Total | 100.0% |
| Top Ten Holdings | % of Total
Long-Term
Investments |
| Sumitomo Dainippon Pharma Co., Ltd. | 2.9% |
| Tokyo Electric Power Co., Holdings, Inc. | 2.4 |
| FamilyMart UNY Holdings Co., Ltd. | 2.3 |
| Kuraray Co., Ltd. | 2.0 |
| Japan Airlines Co., Ltd. | 1.9 |
| Sojitz Corp. | 1.8 |
| Idemitsu Kosan Co., Ltd. | 1.8 |
| Honda Motor Co., Ltd. | 1.7 |
| MonotaRO Co., Ltd. | 1.7 |
| Welcia Holdings Co., Ltd. | 1.6 |
| Total | 20.1% |
Performance figures assume reinvestment of all distributions and do not reflect the deduction of taxes that a shareholder would pay on Fund distributions or the redemption or sale of Fund shares. An index is a statistical composite that tracks a specified financial market or sector. Unlike the Fund, the index does not actually hold a portfolio of securities and therefore does not incur the expenses incurred by the Fund. These expenses negatively impact the performance of the Fund. The Fund’s past performance does not predict future performance.
Frequency Distribution of Discounts and Premiums
Bid/Ask Midpoint vs. NAV through December 31, 2018
The following Frequency Distribution of Discounts and Premiums charts are provided to show the frequency at which the bid/ask midpoint price for the Fund was at a discount or premium to the daily NAV. The following tables are for comparative purposes only and represent the period January 1, 2014 through December 31, 2018. Shareholders may pay more than NAV when they buy Fund shares and receive less than NAV when they sell those shares because shares are bought and sold at current market price. Data presented represents past performance and cannot be used to predict future results.
| Number of Days Bid/Ask Midpoint At/Above NAV |
| For the Period | 0.00%–0.49% | 0.50%–0.99% | 1.00%–1.99% | >=2.00% |
| 1/1/14 – 12/31/14 | 84 | 54 | 4 | 3 |
| 1/1/15 – 12/31/15 | 96 | 29 | 9 | 1 |
| 1/1/16 – 12/31/16 | 61 | 28 | 10 | 2 |
| 1/1/17 – 12/31/17 | 113 | 39 | 5 | 0 |
| 1/1/18 – 12/31/18 | 104 | 32 | 9 | 0 |
| Number of Days Bid/Ask Midpoint Below NAV |
| For the Period | 0.00%–0.49% | 0.50%–0.99% | 1.00%–1.99% | >=2.00% |
| 1/1/14 – 12/31/14 | 69 | 32 | 5 | 1 |
| 1/1/15 – 12/31/15 | 83 | 30 | 3 | 1 |
| 1/1/16 – 12/31/16 | 88 | 48 | 12 | 3 |
| 1/1/17 – 12/31/17 | 76 | 17 | 1 | 0 |
| 1/1/18 – 12/31/18 | 82 | 22 | 2 | 0 |
Fund Performance Overview (Unaudited) (Continued)
First Trust South Korea AlphaDEX® Fund (FKO)
The First Trust South Korea AlphaDEX® Fund (the “Fund”) seeks investment results that correspond generally to the price and yield (before the Fund’s fees and expenses) of an equity index called the NASDAQ AlphaDEX® South Korea Index (the “Index”). The Fund will normally invest at least 90% of its net assets (including investment borrowings) in common stocks and/or depositary receipts that comprise the Index. The shares of the Fund are listed and trade on the Nasdaq under the ticker symbol “FKO.” The Fund commenced trading on April 19, 2011.
The Index employs the AlphaDEX® stock selection methodology which uses fundamental growth and value factors to objectively select stocks from the NASDAQ South Korea Index which may generate positive alpha relative to traditional passive indices. The Index is a modified equal-dollar weighted index where higher ranked stocks receive a higher weight within the Index.
| Performance | | | | | | |
| | | Average Annual Total Returns | | Cumulative Total Returns |
| | 1 Year
Ended
12/31/18 | 5 Years
Ended
12/31/18 | Inception
(4/18/11)
to 12/31/18 | | 5 Years
Ended
12/31/18 | Inception
(4/18/11)
to 12/31/18 |
| Fund Performance | | | | | | |
| NAV | -20.98% | -2.72% | -2.21% | | -12.89% | -15.84% |
| Market Price | -21.37% | -3.33% | -2.34% | | -15.57% | -16.65% |
| Index Performance | | | | | | |
| NASDAQ AlphaDEX® South Korea Index(1) | -19.49% | N/A | N/A | | N/A | N/A |
| NASDAQ South Korea Index(1) | -20.58% | 1.01% | N/A | | 5.15% | N/A |
| MSCI South Korea Index | -20.94% | 0.99% | 0.85% | | 5.06% | 6.72% |
(See Notes to Fund Performance Overview Page 43.)
Performance Review
The Fund generated a NAV return of -20.98% during the 12-month period covered by this report. During the same period, the MSCI South Korea Index (“benchmark”) generated a return of -20.94%. The Consumer Discretionary sector received the greatest allocation during the period and was also the most substantial contributor to the negative performance of the Fund. Consumer Discretionary investments received a weighting of 14.4% and contributed -4.4% to the Fund’s total return. The best, and only positive, sector in the Fund was the Communication Services sector. These received an allocation of 6.9% and contributed 0.4% to the Fund’s total return. The total currency effect to the Fund over the period covered in this report totaled -3.4%. On a relative basis, the Fund underperformed the benchmark, although the underperformance totaled less than -0.1%. The Health Care sector contributed more than any other sector to the underperformance of the Fund against the benchmark with -1.1% underperformance. Meanwhile, investments in Communication Services caused 1.8% of outperformance, more than any other sector.
| (1) | Performance data is not available for all the periods shown in the table for the index because performance data does not exist for some of the entire periods. |
Fund Performance Overview (Unaudited) (Continued)
First Trust South Korea AlphaDEX® Fund (FKO) (Continued)
| Sector Allocation | % of Total
Long-Term
Investments |
| Consumer Discretionary | 16.1% |
| Industrials | 15.4 |
| Information Technology | 14.1 |
| Financials | 12.5 |
| Materials | 10.2 |
| Energy | 8.2 |
| Communication Services | 8.1 |
| Consumer Staples | 5.5 |
| Utilities | 5.1 |
| Health Care | 4.8 |
| Total | 100.0% |
| Top Ten Holdings | % of Total
Long-Term
Investments |
| SK Telecom Co., Ltd. | 4.3% |
| LG Uplus Corp. | 3.8 |
| CJ Logistics Corp. | 3.7 |
| LG Display Co., Ltd. | 3.7 |
| LG Corp. | 3.6 |
| GS Holdings Corp. | 3.5 |
| Samsung SDI Co., Ltd. | 3.1 |
| Lotte Chemical Corp. | 3.0 |
| Hankook Tire Co., Ltd. | 2.9 |
| Hyundai Engineering & Construction Co., Ltd. | 2.8 |
| Total | 34.4% |

Performance figures assume reinvestment of all distributions and do not reflect the deduction of taxes that a shareholder would pay on Fund distributions or the redemption or sale of Fund shares. An index is a statistical composite that tracks a specified financial market or sector. Unlike the Fund, the index does not actually hold a portfolio of securities and therefore does not incur the expenses incurred by the Fund. These expenses negatively impact the performance of the Fund. The Fund’s past performance does not predict future performance.
Frequency Distribution of Discounts and Premiums
Bid/Ask Midpoint vs. NAV through December 31, 2018
The following Frequency Distribution of Discounts and Premiums charts are provided to show the frequency at which the bid/ask midpoint price for the Fund was at a discount or premium to the daily NAV. The following tables are for comparative purposes only and represent the period January 1, 2014 through December 31, 2018. Shareholders may pay more than NAV when they buy Fund shares and receive less than NAV when they sell those shares because shares are bought and sold at current market price. Data presented represents past performance and cannot be used to predict future results.
| Number of Days Bid/Ask Midpoint At/Above NAV |
| For the Period | 0.00%–0.49% | 0.50%–0.99% | 1.00%–1.99% | >=2.00% |
| 1/1/14 – 12/31/14 | 78 | 23 | 2 | 0 |
| 1/1/15 – 12/31/15 | 27 | 18 | 2 | 18 |
| 1/1/16 – 12/31/16 | 49 | 28 | 7 | 1 |
| 1/1/17 – 12/31/17 | 49 | 32 | 6 | 0 |
| 1/1/18 – 12/31/18 | 52 | 50 | 7 | 2 |
| Number of Days Bid/Ask Midpoint Below NAV |
| For the Period | 0.00%–0.49% | 0.50%–0.99% | 1.00%–1.99% | >=2.00% |
| 1/1/14 – 12/31/14 | 104 | 36 | 9 | 0 |
| 1/1/15 – 12/31/15 | 57 | 66 | 40 | 24 |
| 1/1/16 – 12/31/16 | 72 | 64 | 23 | 8 |
| 1/1/17 – 12/31/17 | 85 | 63 | 16 | 0 |
| 1/1/18 – 12/31/18 | 59 | 58 | 23 | 0 |
Fund Performance Overview (Unaudited) (Continued)
First Trust Developed Markets ex-US AlphaDEX® Fund (FDT)
The First Trust Developed Markets ex-US AlphaDEX® Fund (the “Fund”) seeks investment results that correspond generally to the price and yield (before the Fund’s fees and expenses) of an equity index called the NASDAQ AlphaDEX® Developed Markets Ex-US Index (the “Index”). The Fund will normally invest at least 90% of its net assets (including investment borrowings) in common stocks and/or depositary receipts that comprise the Index. The shares of the Fund are listed and trade on the Nasdaq under the ticker symbol “FDT.” The Fund commenced trading on April 19, 2011.
The Index employs the AlphaDEX® stock selection methodology which uses fundamental growth and value factors to objectively select stocks from the NASDAQ Developed Markets Ex-US Index which may generate positive alpha relative to traditional passive indices. The Index is a modified equal-dollar weighted index where higher ranked stocks receive a higher weight within the Index.
| Performance | | | | | | |
| | | Average Annual Total Returns | | Cumulative Total Returns |
| | 1 Year
Ended
12/31/18 | 5 Years
Ended
12/31/18 | Inception
(4/18/11)
to 12/31/18 | | 5 Years
Ended
12/31/18 | Inception
(4/18/11)
to 12/31/18 |
| Fund Performance | | | | | | |
| NAV | -19.52% | 1.05% | 1.87% | | 5.35% | 15.38% |
| Market Price | -20.08% | 0.76% | 1.80% | | 3.86% | 14.75% |
| Index Performance | | | | | | |
| NASDAQ AlphaDEX® Developed Markets Ex-US Index(1) | -18.81% | N/A | N/A | | N/A | N/A |
| NASDAQ Developed Markets Ex-US Index(1) | -15.04% | 0.59% | N/A | | 2.99% | N/A |
| MSCI World ex USA Index | -14.09% | 0.34% | 2.66% | | 1.71% | 22.45% |
(See Notes to Fund Performance Overview Page 43.)
Performance Review
The Fund generated a NAV return of -19.52% during the 12-month period covered by this report. During the same period, the MSCI World ex USA Index (“benchmark”) generated a return of -14.09%. The heaviest allocated country in the Fund was Japan, with a 26.7% allocation. The investments in Japan had a return of -18.4% during the period, explaining -6.0% of the Fund’s return. Japan’s contribution of -6.0% return was the worst of any country in the Fund. The best contributing country was New Zealand, with a contribution to the Fund’s return of 0.08%. This is the only country whose investments in the Fund generated a positive return. The total currency effect to the Fund over the period covered in this report totaled -2.05%. On a relative basis, the Fund underperformed the benchmark. The primary cause of the underperformance is that the Fund was overweight Japan, in comparison to the benchmark, by 4.5% and that the Japanese investments in the Fund had a more negative return. In total, Japan caused -2.0% underperformance against the benchmark. South Korea was another outlier in contributing to underperformance, causing -1.5% performance in comparison to the benchmark. The greatest area of outperformance for the Fund came in the German investments which caused 0.54% of outperformance against the benchmark. German investments saw a negative return but had a smaller weight in the Fund than the benchmark.
| (1) | Performance data is not available for all the periods shown in the table for the index because performance data does not exist for some of the entire periods. |
Fund Performance Overview (Unaudited) (Continued)
First Trust Developed Markets ex-US AlphaDEX® Fund (FDT) (Continued)
| Sector Allocation | % of Total
Long-Term
Investments |
| Industrials | 17.6% |
| Materials | 17.0 |
| Real Estate | 16.8 |
| Consumer Discretionary | 12.5 |
| Energy | 7.8 |
| Information Technology | 6.7 |
| Consumer Staples | 5.7 |
| Financials | 4.9 |
| Health Care | 4.5 |
| Utilities | 3.6 |
| Communication Services | 2.9 |
| Total | 100.0% |
| Top Ten Holdings | % of Total
Long-Term
Investments |
| Tokyo Electric Power Co., Holdings, Inc. | 0.8% |
| Sumitomo Dainippon Pharma Co., Ltd. | 0.7 |
| Link REIT | 0.7 |
| Kerry Properties Ltd. | 0.7 |
| Lotte Chemical Corp. | 0.7 |
| Sino Land Co., Ltd. | 0.7 |
| Alimentation Couche-Tard, Inc., Class B | 0.7 |
| Henderson Land Development Co., Ltd. | 0.6 |
| Dexus | 0.6 |
| Champion REIT | 0.6 |
| Total | 6.8% |

Performance figures assume reinvestment of all distributions and do not reflect the deduction of taxes that a shareholder would pay on Fund distributions or the redemption or sale of Fund shares. An index is a statistical composite that tracks a specified financial market or sector. Unlike the Fund, the index does not actually hold a portfolio of securities and therefore does not incur the expenses incurred by the Fund. These expenses negatively impact the performance of the Fund. The Fund’s past performance does not predict future performance.
Frequency Distribution of Discounts and Premiums
Bid/Ask Midpoint vs. NAV through December 31, 2018
The following Frequency Distribution of Discounts and Premiums charts are provided to show the frequency at which the bid/ask midpoint price for the Fund was at a discount or premium to the daily NAV. The following tables are for comparative purposes only and represent the period January 1, 2014 through December 31, 2018. Shareholders may pay more than NAV when they buy Fund shares and receive less than NAV when they sell those shares because shares are bought and sold at current market price. Data presented represents past performance and cannot be used to predict future results.
| Number of Days Bid/Ask Midpoint At/Above NAV |
| For the Period | 0.00%–0.49% | 0.50%–0.99% | 1.00%–1.99% | >=2.00% |
| 1/1/14 – 12/31/14 | 103 | 59 | 3 | 0 |
| 1/1/15 – 12/31/15 | 132 | 45 | 2 | 0 |
| 1/1/16 – 12/31/16 | 99 | 15 | 1 | 0 |
| 1/1/17 – 12/31/17 | 193 | 35 | 0 | 0 |
| 1/1/18 – 12/31/18 | 123 | 13 | 0 | 0 |
| Number of Days Bid/Ask Midpoint Below NAV |
| For the Period | 0.00%–0.49% | 0.50%–0.99% | 1.00%–1.99% | >=2.00% |
| 1/1/14 – 12/31/14 | 70 | 17 | 0 | 0 |
| 1/1/15 – 12/31/15 | 61 | 11 | 1 | 0 |
| 1/1/16 – 12/31/16 | 109 | 26 | 2 | 0 |
| 1/1/17 – 12/31/17 | 23 | 0 | 0 | 0 |
| 1/1/18 – 12/31/18 | 99 | 16 | 0 | 0 |
Fund Performance Overview (Unaudited) (Continued)
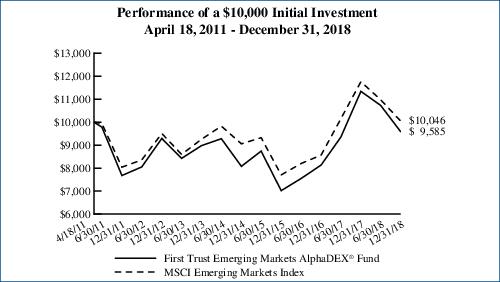
First Trust Emerging Markets AlphaDEX® Fund (FEM)
The First Trust Emerging Markets AlphaDEX® Fund (the “Fund”) seeks investment results that correspond generally to the price and yield (before the Fund’s fees and expenses) of an equity index called the NASDAQ AlphaDEX® Emerging Markets Index (the “Index”). The Fund will normally invest at least 90% of its net assets (including investment borrowings) in common stocks and/or depositary receipts that comprise the Index. The shares of the Fund are listed and trade on the Nasdaq under the ticker symbol “FEM.” The Fund commenced trading on April 19, 2011.
The Index employs the AlphaDEX® stock selection methodology which uses fundamental growth and value factors to objectively select stocks from the NASDAQ Emerging Markets Index which may generate positive alpha relative to traditional passive indices. The Index is a modified equal-dollar weighted index where higher ranked stocks receive a higher weight within the Index.
| Performance | | | | | | |
| | | Average Annual Total Returns | | Cumulative Total Returns |
| | 1 Year
Ended
12/31/18 | 5 Years
Ended
12/31/18 | Inception
(4/18/11)
to 12/31/18 | | 5 Years
Ended
12/31/18 | Inception
(4/18/11)
to 12/31/18 |
| Fund Performance | | | | | | |
| NAV | -15.48% | 1.31% | -0.55% | | 6.72% | -4.16% |
| Market Price | -15.53% | 1.13% | -0.53% | | 5.80% | -3.98% |
| Index Performance | | | | | | |
| NASDAQ AlphaDEX® Emerging Markets Index(1) | -14.64% | N/A | N/A | | N/A | N/A |
| NASDAQ Emerging Markets Index(1) | -11.23% | 2.97% | N/A | | 15.75% | N/A |
| MSCI Emerging Markets Index | -14.58% | 1.65% | 0.06% | | 8.51% | 0.48% |
(See Notes to Fund Performance Overview Page 43.)
Performance Review
The Fund generated a NAV return of -15.48% during the 12-month period covered by this report. During the same period, the MSCI Emerging Markets Index (“benchmark”) generated a return of -14.58%. Hong Kong securities carried the highest allocation in the Fund over the period with a 35% weighting. These securities returned -15% over the period and contributed -6.1% to overall Fund return. The allocation to Indonesia showed the greatest return with 17.5%. However, the Fund allocated only 1.7% to Indonesia over the period, so the contribution to the Fund’s return from these securities was 0.3%. The total currency effect to the Fund over the period covered in this report totaled -5.53%. On a relative basis, the Fund underperformed the benchmark. Hong Kong securities dominated the returns with 35% allocation but also carried significant weight in the benchmark and created only -0.18% underperformance. The most significant underperformance was created by the Fund’s investments in Turkey, which created -1.56% underperformance against the benchmark. The greatest area of outperformance for the Fund was in simply not investing in South Korea, creating 1.05% outperformance against the benchmark.
| (1) | Performance data is not available for all the periods shown in the table for the index because performance data does not exist for some of the entire periods. |
Fund Performance Overview (Unaudited) (Continued)
First Trust Emerging Markets AlphaDEX® Fund (FEM) (Continued)
| Sector Allocation | % of Total
Long-Term
Investments |
| Energy | 24.7% |
| Materials | 19.3 |
| Industrials | 9.5 |
| Financials | 9.1 |
| Utilities | 8.2 |
| Information Technology | 7.4 |
| Consumer Discretionary | 6.1 |
| Real Estate | 4.6 |
| Consumer Staples | 4.5 |
| Communication Services | 4.5 |
| Health Care | 2.1 |
| Total | 100.0% |
| Top Ten Holdings | % of Total
Long-Term
Investments |
| IRB Brasil Resseguros S.A. | 1.6% |
| Telefonica Brasil S.A. (Preference Shares) | 1.5 |
| Charoen Pokphand Indonesia Tbk PT | 1.4 |
| Grupa Lotos S.A. | 1.4 |
| Cia de Saneamento Basico do Estado de Sao Paulo | 1.3 |
| Electricity Generating PCL | 1.3 |
| Tupras Turkiye Petrol Rafinerileri A.S. | 1.2 |
| Inner Mongolia Yitai Coal Co., Ltd., Class B | 1.2 |
| Transneft PJSC (Preference Shares) | 1.2 |
| Surgutneftegas PJSC (Preference Shares) | 1.2 |
| Total | 13.3% |
Performance figures assume reinvestment of all distributions and do not reflect the deduction of taxes that a shareholder would pay on Fund distributions or the redemption or sale of Fund shares. An index is a statistical composite that tracks a specified financial market or sector. Unlike the Fund, the index does not actually hold a portfolio of securities and therefore does not incur the expenses incurred by the Fund. These expenses negatively impact the performance of the Fund. The Fund’s past performance does not predict future performance.
Frequency Distribution of Discounts and Premiums
Bid/Ask Midpoint vs. NAV through December 31, 2018
The following Frequency Distribution of Discounts and Premiums charts are provided to show the frequency at which the bid/ask midpoint price for the Fund was at a discount or premium to the daily NAV. The following tables are for comparative purposes only and represent the period January 1, 2014 through December 31, 2018. Shareholders may pay more than NAV when they buy Fund shares and receive less than NAV when they sell those shares because shares are bought and sold at current market price. Data presented represents past performance and cannot be used to predict future results.
| Number of Days Bid/Ask Midpoint At/Above NAV |
| For the Period | 0.00%–0.49% | 0.50%–0.99% | 1.00%–1.99% | >=2.00% |
| 1/1/14 – 12/31/14 | 95 | 57 | 4 | 0 |
| 1/1/15 – 12/31/15 | 34 | 12 | 4 | 0 |
| 1/1/16 – 12/31/16 | 93 | 46 | 8 | 0 |
| 1/1/17 – 12/31/17 | 149 | 69 | 2 | 0 |
| 1/1/18 – 12/31/18 | 72 | 49 | 7 | 0 |
| Number of Days Bid/Ask Midpoint Below NAV |
| For the Period | 0.00%–0.49% | 0.50%–0.99% | 1.00%–1.99% | >=2.00% |
| 1/1/14 – 12/31/14 | 61 | 33 | 2 | 0 |
| 1/1/15 – 12/31/15 | 98 | 88 | 16 | 0 |
| 1/1/16 – 12/31/16 | 69 | 27 | 8 | 1 |
| 1/1/17 – 12/31/17 | 30 | 1 | 0 | 0 |
| 1/1/18 – 12/31/18 | 64 | 45 | 14 | 0 |
Fund Performance Overview (Unaudited) (Continued)
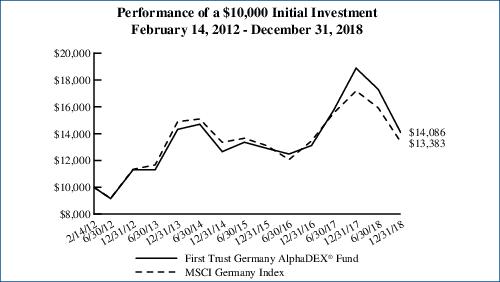
First Trust Germany AlphaDEX® Fund (FGM)
The First Trust Germany AlphaDEX® Fund (the “Fund”) seeks investment results that correspond generally to the price and yield (before the Fund’s fees and expenses) of an equity index called the NASDAQ AlphaDEX® Germany Index (the “Index”). The Fund will normally invest at least 90% of its net assets (including investment borrowings) in common stocks and/or depositary receipts that comprise the Index. The shares of the Fund are listed and trade on the Nasdaq under the ticker symbol “FGM.” The Fund commenced trading on February 15, 2012.
The Index employs the AlphaDEX® stock selection methodology which uses fundamental growth and value factors to objectively select stocks from the NASDAQ Germany Index which may generate positive alpha relative to traditional passive indices. The Index is a modified equal-dollar weighted index where higher ranked stocks receive a higher weight within the Index.
| Performance | | | | | | |
| | | Average Annual Total Returns | | Cumulative Total Returns |
| | 1 Year
Ended
12/31/18 | 5 Years
Ended
12/31/18 | Inception
(2/14/12)
to 12/31/18 | | 5 Years
Ended
12/31/18 | Inception
(2/14/12)
to 12/31/18 |
| Fund Performance | | | | | | |
| NAV | -25.40% | -0.32% | 5.11% | | -1.61% | 40.89% |
| Market Price | -25.02% | -0.55% | 5.15% | | -2.73% | 41.24% |
| Index Performance | | | | | | |
| NASDAQ AlphaDEX® Germany Index(1) | -25.36% | N/A | N/A | | N/A | N/A |
| NASDAQ Germany Index(1) | -23.57% | -2.17% | N/A | | -10.40% | N/A |
| MSCI Germany Index | -22.17% | -2.13% | 4.33% | | -10.19% | 33.81% |
(See Notes to Fund Performance Overview Page 43.)
Performance Review
The Fund generated a NAV return of -25.40% during the 12-month period covered by this report. During the same period, the MSCI Germany Index (“benchmark”) generated a return of -22.17%. The Consumer Discretionary sector received the greatest allocation during the period, with a 26.4% weight in the Fund. These were also the greatest drag on the portfolio, with contribution to the Fund’s total return of -7.6%. The best and only non-negative sector were the investments in Information Technology with a contribution to total return of 0.0%. The total currency effect to the Fund over the period covered in this report totaled -3.8%. On a relative basis, the Fund underperformed the benchmark. The Consumer Discretionary sector had the most negative impact on underperformance returning -2.4% against the benchmark during the period. Real Estate was the best sector, with regards to outperformance, creating 2.2% outperformance against the benchmark during the period.
| (1) | Performance data is not available for all the periods shown in the table for the index because performance data does not exist for some of the entire periods. |
Fund Performance Overview (Unaudited) (Continued)
First Trust Germany AlphaDEX® Fund (FGM) (Continued)
| Sector Allocation | % of Total
Long-Term
Investments |
| Consumer Discretionary | 22.6% |
| Industrials | 18.2 |
| Real Estate | 15.9 |
| Health Care | 11.9 |
| Materials | 10.3 |
| Information Technology | 9.4 |
| Financials | 4.0 |
| Communication Services | 3.9 |
| Utilities | 3.8 |
| Total | 100.0% |
| Top Ten Holdings | % of Total
Long-Term
Investments |
| LEG Immobilien AG | 4.9% |
| Wirecard AG | 4.8 |
| Deutsche Lufthansa AG | 4.8 |
| Porsche Automobil Holding SE (Preference Shares) | 4.7 |
| Grand City Properties S.A. | 4.3 |
| MorphoSys AG | 4.2 |
| Volkswagen AG (Preference Shares) | 3.9 |
| Deutsche Wohnen SE | 3.9 |
| MTU Aero Engines AG | 3.9 |
| Nemetschek SE | 3.7 |
| Total | 43.1% |
Performance figures assume reinvestment of all distributions and do not reflect the deduction of taxes that a shareholder would pay on Fund distributions or the redemption or sale of Fund shares. An index is a statistical composite that tracks a specified financial market or sector. Unlike the Fund, the index does not actually hold a portfolio of securities and therefore does not incur the expenses incurred by the Fund. These expenses negatively impact the performance of the Fund. The Fund’s past performance does not predict future performance.
Frequency Distribution of Discounts and Premiums
Bid/Ask Midpoint vs. NAV through December 31, 2018
The following Frequency Distribution of Discounts and Premiums charts are provided to show the frequency at which the bid/ask midpoint price for the Fund was at a discount or premium to the daily NAV. The following tables are for comparative purposes only and represent the period January 1, 2014 through December 31, 2018. Shareholders may pay more than NAV when they buy Fund shares and receive less than NAV when they sell those shares because shares are bought and sold at current market price. Data presented represents past performance and cannot be used to predict future results.
| Number of Days Bid/Ask Midpoint At/Above NAV |
| For the Period | 0.00%–0.49% | 0.50%–0.99% | 1.00%–1.99% | >=2.00% |
| 1/1/14 – 12/31/14 | 130 | 9 | 0 | 0 |
| 1/1/15 – 12/31/15 | 137 | 13 | 4 | 0 |
| 1/1/16 – 12/31/16 | 80 | 10 | 0 | 0 |
| 1/1/17 – 12/31/17 | 157 | 5 | 0 | 0 |
| 1/1/18 – 12/31/18 | 100 | 18 | 1 | 0 |
| Number of Days Bid/Ask Midpoint Below NAV |
| For the Period | 0.00%–0.49% | 0.50%–0.99% | 1.00%–1.99% | >=2.00% |
| 1/1/14 – 12/31/14 | 106 | 7 | 0 | 0 |
| 1/1/15 – 12/31/15 | 88 | 10 | 0 | 0 |
| 1/1/16 – 12/31/16 | 150 | 11 | 1 | 0 |
| 1/1/17 – 12/31/17 | 88 | 1 | 0 | 0 |
| 1/1/18 – 12/31/18 | 125 | 6 | 1 | 0 |
Fund Performance Overview (Unaudited) (Continued)
First Trust Canada AlphaDEX® Fund (FCAN)
The First Trust Canada AlphaDEX® Fund (the “Fund”) seeks investment results that correspond generally to the price and yield (before the Fund’s fees and expenses) of an equity index called the NASDAQ AlphaDEX® Canada Index (the “Index”). The Fund will normally invest at least 90% of its net assets (including investment borrowings) in common stocks and/or depositary receipts that comprise the Index. The shares of the Fund are listed and trade on the Nasdaq under the ticker symbol “FCAN.” The Fund commenced trading on February 15, 2012.
The Index employs the AlphaDEX® stock selection methodology which uses fundamental growth and value factors to objectively select stocks from the NASDAQ Canada Index which may generate positive alpha relative to traditional passive indices. The Index is a modified equal-dollar weighted index where higher ranked stocks receive a higher weight within the Index.
| Performance | | | | | | |
| | | Average Annual Total Returns | | Cumulative Total Returns |
| | 1 Year
Ended
12/31/18 | 5 Years
Ended
12/31/18 | Inception
(2/14/12)
to 12/31/18 | | 5 Years
Ended
12/31/18 | Inception
(2/14/12)
to 12/31/18 |
| Fund Performance | | | | | | |
| NAV | -21.94% | -9.66% | -4.15% | | -39.82% | -25.28% |
| Market Price | -22.02% | -9.72% | -4.16% | | -40.04% | -25.35% |
| Index Performance | | | | | | |
| NASDAQ AlphaDEX® Canada Index(1) | -21.81% | N/A | N/A | | N/A | N/A |
| NASDAQ Canada Index(1) | -17.86% | -2.04% | N/A | | -9.79% | N/A |
| MSCI Canada Index | -17.20% | -1.62% | 0.11% | | -7.84% | 0.77% |
(See Notes to Fund Performance Overview Page 43.)
Performance Review
The Fund generated a NAV return of -21.94% during the 12-month period covered by this report. During the same period, the MSCI Canada Index (“benchmark”) generated a return of -17.20%. The Materials sector received the greatest allocation during the period, with a 26.4% weight in the Fund. These contributed -3.6% to the Fund’s total return. The Energy sector was the biggest drag on the portfolio, contributing -10.2% to the Fund’s total return. No sector had a positive contribution to the Fund, but the ‘best’ sector – the least negative, in this case, was Real Estate. Investments in the Real Estate sector received an allocation during the period of 9.7% and contributed 0.0% to the Fund’s total return. The total currency effect to the Fund over the period covered in this report totaled -3.5%. On a relative basis, the Fund underperformed the benchmark. Underperformance of -3.8% came from the Energy sector, the worst sector both with regard to total Fund performance as well as with regard to underperformance against the benchmark. During the period, the investments in Real Estate contributed 1.8% to Fund outperformance against the benchmark.
| (1) | Performance data is not available for all the periods shown in the table for the index because performance data does not exist for some of the entire periods. |
Fund Performance Overview (Unaudited) (Continued)
First Trust Canada AlphaDEX® Fund (FCAN) (Continued)
| Sector Allocation | % of Total
Long-Term
Investments |
| Materials | 29.4% |
| Energy | 23.0 |
| Industrials | 12.8 |
| Real Estate | 12.2 |
| Information Technology | 6.8 |
| Consumer Discretionary | 4.4 |
| Financials | 4.3 |
| Consumer Staples | 2.2 |
| Utilities | 2.1 |
| Health Care | 1.7 |
| Communication Services | 1.1 |
| Total | 100.0% |
| Top Ten Holdings | % of Total
Long-Term
Investments |
| Kirkland Lake Gold Ltd. | 6.5% |
| Air Canada | 5.0 |
| Kinross Gold Corp. | 4.5 |
| Teck Resources Ltd., Class B | 4.5 |
| Canadian Apartment Properties REIT | 4.2 |
| Lundin Mining Corp. | 3.9 |
| Seven Generations Energy Ltd., Class A | 3.9 |
| Methanex Corp. | 3.6 |
| Husky Energy, Inc. | 3.5 |
| WSP Global, Inc. | 3.5 |
| Total | 43.1% |
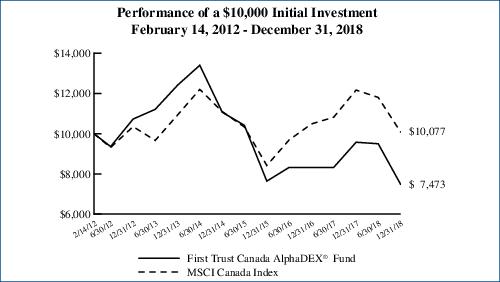
Performance figures assume reinvestment of all distributions and do not reflect the deduction of taxes that a shareholder would pay on Fund distributions or the redemption or sale of Fund shares. An index is a statistical composite that tracks a specified financial market or sector. Unlike the Fund, the index does not actually hold a portfolio of securities and therefore does not incur the expenses incurred by the Fund. These expenses negatively impact the performance of the Fund. The Fund’s past performance does not predict future performance.
Frequency Distribution of Discounts and Premiums
Bid/Ask Midpoint vs. NAV through December 31, 2018
The following Frequency Distribution of Discounts and Premiums charts are provided to show the frequency at which the bid/ask midpoint price for the Fund was at a discount or premium to the daily NAV. The following tables are for comparative purposes only and represent the period January 1, 2014 through December 31, 2018. Shareholders may pay more than NAV when they buy Fund shares and receive less than NAV when they sell those shares because shares are bought and sold at current market price. Data presented represents past performance and cannot be used to predict future results.
| Number of Days Bid/Ask Midpoint At/Above NAV |
| For the Period | 0.00%–0.49% | 0.50%–0.99% | 1.00%–1.99% | >=2.00% |
| 1/1/14 – 12/31/14 | 159 | 4 | 0 | 0 |
| 1/1/15 – 12/31/15 | 94 | 0 | 0 | 0 |
| 1/1/16 – 12/31/16 | 67 | 0 | 0 | 0 |
| 1/1/17 – 12/31/17 | 68 | 1 | 0 | 0 |
| 1/1/18 – 12/31/18 | 111 | 4 | 0 | 1 |
| Number of Days Bid/Ask Midpoint Below NAV |
| For the Period | 0.00%–0.49% | 0.50%–0.99% | 1.00%–1.99% | >=2.00% |
| 1/1/14 – 12/31/14 | 88 | 0 | 1 | 0 |
| 1/1/15 – 12/31/15 | 156 | 1 | 1 | 0 |
| 1/1/16 – 12/31/16 | 184 | 1 | 0 | 0 |
| 1/1/17 – 12/31/17 | 181 | 1 | 0 | 0 |
| 1/1/18 – 12/31/18 | 129 | 6 | 0 | 0 |
Fund Performance Overview (Unaudited) (Continued)
First Trust Australia AlphaDEX® Fund (FAUS)
The First Trust Australia AlphaDEX® Fund (the “Fund”) seeks investment results that correspond generally to the price and yield (before the Fund’s fees and expenses) of an equity index called the NASDAQ AlphaDEX® Australia Index (the “Index”). The Fund will normally invest at least 90% of its net assets (including investment borrowings) in common stocks and/or depositary receipts that comprise the Index. The shares of the Fund are listed and trade on the NYSE Arca under the ticker symbol “FAUS.” The Fund commenced trading on February 15, 2012.
The Index employs the AlphaDEX® stock selection methodology which uses fundamental growth and value factors to objectively select stocks from the NASDAQ Australia Index which may generate positive alpha relative to traditional passive indices. The Index is a modified equal-dollar weighted index where higher ranked stocks receive a higher weight within the Index.
| Performance | | | | | | |
| | | Average Annual Total Returns | | Cumulative Total Returns |
| | 1 Year
Ended
12/31/18 | 5 Years
Ended
12/31/18 | Inception
(2/14/12)
to 12/31/18 | | 5 Years
Ended
12/31/18 | Inception
(2/14/12)
to 12/31/18 |
| Fund Performance | | | | | | |
| NAV | -15.48% | 2.91% | 3.39% | | 15.43% | 25.73% |
| Market Price | -15.86% | 2.83% | 3.36% | | 14.99% | 25.50% |
| Index Performance | | | | | | |
| NASDAQ AlphaDEX® Australia Index(1) | -15.42% | N/A | N/A | | N/A | N/A |
| NASDAQ Australia Index(1) | -12.65% | -0.15% | N/A | | -0.75% | N/A |
| MSCI Australia Index | -11.99% | 0.46% | 2.66% | | 2.31% | 19.81% |
(See Notes to Fund Performance Overview Page 43.)
Performance Review
The Fund generated a NAV return of -15.48% during the 12-month period covered by this report. During the same period, the MSCI Australia Index (“benchmark”) generated a return of -11.99%. The Real Estate sector received the greatest allocation during the period, with a 23.9% weight in the Fund. These contributed -3.3% to the Fund’s total return. The Energy sector was the biggest drag on the portfolio, contributing -4.3% to the Fund’s total return. No sector had a positive contribution to the Fund, but the ‘best’ sector – the least negative, in this case – was Consumer Staples. Consumer Staples received an allocation during the period of 2.7% and contributed -0.1% to the Fund’s total return. The total currency effect to the Fund over the period covered in this report totaled -9.5%. On a relative basis, the Fund underperformed the benchmark. The Consumer Discretionary sector caused -2.2% of underperformance, more than any other sector, while the most outperformance came from the allocation to the Financials sector on the order of 1.8% outperformance against the benchmark.
| (1) | Performance data is not available for all the periods shown in the table for the index because performance data does not exist for some of the entire periods. |
Fund Performance Overview (Unaudited) (Continued)
First Trust Australia AlphaDEX® Fund (FAUS) (Continued)
| Sector Allocation | % of Total
Long-Term
Investments |
| Real Estate | 28.3% |
| Energy | 18.0 |
| Materials | 17.0 |
| Industrials | 8.6 |
| Consumer Discretionary | 7.8 |
| Communication Services | 6.6 |
| Financials | 5.8 |
| Utilities | 3.4 |
| Consumer Staples | 2.7 |
| Health Care | 1.8 |
| Total | 100.0% |
| Top Ten Holdings | % of Total
Long-Term
Investments |
| Dexus | 5.1% |
| GPT (The) Group | 4.9 |
| Vicinity Centres | 4.7 |
| Scentre Group | 4.2 |
| Santos Ltd. | 4.1 |
| Mirvac Group | 3.9 |
| Whitehaven Coal Ltd. | 3.6 |
| Fortescue Metals Group Ltd. | 3.6 |
| TPG Telecom Ltd. | 3.5 |
| South32 Ltd. | 3.5 |
| Total | 41.1% |
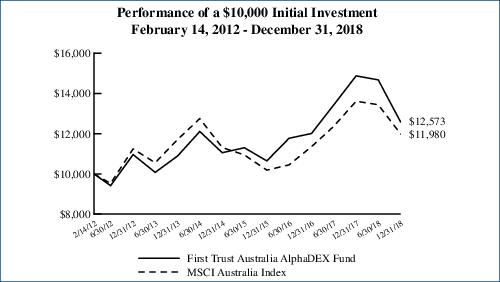
Performance figures assume reinvestment of all distributions and do not reflect the deduction of taxes that a shareholder would pay on Fund distributions or the redemption or sale of Fund shares. An index is a statistical composite that tracks a specified financial market or sector. Unlike the Fund, the index does not actually hold a portfolio of securities and therefore does not incur the expenses incurred by the Fund. These expenses negatively impact the performance of the Fund. The Fund’s past performance does not predict future performance.
Frequency Distribution of Discounts and Premiums
Bid/Ask Midpoint vs. NAV through December 31, 2018
The following Frequency Distribution of Discounts and Premiums charts are provided to show the frequency at which the bid/ask midpoint price for the Fund was at a discount or premium to the daily NAV. The following tables are for comparative purposes only and represent the period January 1, 2014 through December 31, 2018. Shareholders may pay more than NAV when they buy Fund shares and receive less than NAV when they sell those shares because shares are bought and sold at current market price. Data presented represents past performance and cannot be used to predict future results.
| Number of Days Bid/Ask Midpoint At/Above NAV |
| For the Period | 0.00%–0.49% | 0.50%–0.99% | 1.00%–1.99% | >=2.00% |
| 1/1/14 – 12/31/14 | 131 | 15 | 0 | 0 |
| 1/1/15 – 12/31/15 | 104 | 20 | 3 | 4 |
| 1/1/16 – 12/31/16 | 67 | 90 | 30 | 10 |
| 1/1/17 – 12/31/17 | 53 | 16 | 1 | 0 |
| 1/1/18 – 12/31/18 | 127 | 37 | 1 | 0 |
| Number of Days Bid/Ask Midpoint Below NAV |
| For the Period | 0.00%–0.49% | 0.50%–0.99% | 1.00%–1.99% | >=2.00% |
| 1/1/14 – 12/31/14 | 96 | 9 | 1 | 0 |
| 1/1/15 – 12/31/15 | 99 | 21 | 0 | 1 |
| 1/1/16 – 12/31/16 | 21 | 22 | 10 | 2 |
| 1/1/17 – 12/31/17 | 116 | 64 | 1 | 0 |
| 1/1/18 – 12/31/18 | 72 | 11 | 3 | 0 |
Fund Performance Overview (Unaudited) (Continued)
First Trust United Kingdom AlphaDEX® Fund (FKU)
The First Trust United Kingdom AlphaDEX® Fund (the “Fund”) seeks investment results that correspond generally to the price and yield (before the Fund’s fees and expenses) of an equity index called the NASDAQ AlphaDEX® United Kingdom Index (the “Index”). The Fund will normally invest at least 90% of its net assets (including investment borrowings) in common stocks and/or depositary receipts that comprise the Index. The shares of the Fund are listed and trade on the Nasdaq under the ticker symbol “FKU.” The Fund commenced trading on February 15, 2012.
The Index employs the AlphaDEX® stock selection methodology which uses fundamental growth and value factors to objectively select stocks from the NASDAQ United Kingdom Index which may generate positive alpha relative to traditional passive indices. The Index is a modified equal-dollar weighted index where higher ranked stocks receive a higher weight within the Index.
| Performance | | | | | | |
| | | Average Annual Total Returns | | Cumulative Total Returns |
| | 1 Year
Ended
12/31/18 | 5 Years
Ended
12/31/18 | Inception
(2/14/12)
to 12/31/18 | | 5 Years
Ended
12/31/18 | Inception
(2/14/12)
to 12/31/18 |
| Fund Performance | | | | | | |
| NAV | -16.16% | -2.45% | 4.07% | | -11.67% | 31.53% |
| Market Price | -15.60% | -2.73% | 4.03% | | -12.92% | 31.22% |
| Index Performance | | | | | | |
| NASDAQ AlphaDEX® United Kingdom Index(1) | -15.32% | N/A | N/A | | N/A | N/A |
| NASDAQ United Kingdom Index(1) | -15.17% | -1.56% | N/A | | -7.54% | N/A |
| MSCI United Kingdom Index | -14.15% | -1.71% | 2.62% | | -8.27% | 19.45% |
(See Notes to Fund Performance Overview Page 43.)
Performance Review
The Fund generated a NAV return of -16.16% during the 12-month period covered by this report. During the same period, the MSCI United Kingdom Index (“benchmark”) generated a return of -14.15%. The Consumer Discretionary sector carried the greatest weight in the Fund during the period, with a 23% allocation. This sector had the most negative contribution to the Fund’s total return of -4.1%. No sector generated a positive return for the Fund, but the ‘best’ – least negative – came from the Health Care sector, which contributed -0.1% to the Fund’s total return. The total currency effect to the Fund over the period covered in this report totaled -5.2%. On a relative basis, the Fund underperformed the benchmark. The Financials sector contributed most to the underperformance of the Fund against the benchmark, causing -1.7% underperformance during the period. The Consumer Staples sector found the most outperformance with 1.2% outperformance against the benchmark.
| (1) | Performance data is not available for all the periods shown in the table for the index because performance data does not exist for some of the entire periods. |
Fund Performance Overview (Unaudited) (Continued)
First Trust United Kingdom AlphaDEX® Fund (FKU) (Continued)
| Sector Allocation | % of Total
Long-Term
Investments |
| Industrials | 22.6% |
| Consumer Discretionary | 19.2 |
| Materials | 15.2 |
| Consumer Staples | 9.9 |
| Communication Services | 8.0 |
| Energy | 6.2 |
| Real Estate | 6.0 |
| Financials | 5.0 |
| Information Technology | 4.6 |
| Utilities | 2.5 |
| Health Care | 0.8 |
| Total | 100.0% |
| Top Ten Holdings | % of Total
Long-Term
Investments |
| Anglo American PLC | 2.8% |
| Evraz PLC | 2.5 |
| Berkeley Group Holdings PLC | 2.5 |
| Shaftesbury PLC | 2.4 |
| Segro PLC | 2.4 |
| Royal Dutch Shell PLC, Class B | 2.3 |
| 3i Group PLC | 2.3 |
| BP PLC | 2.3 |
| Rolls-Royce Holdings PLC | 2.2 |
| Bellway PLC | 2.2 |
| Total | 23.9% |
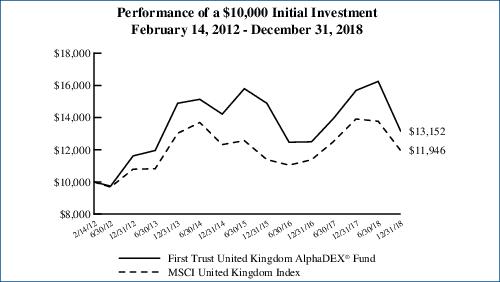
Performance figures assume reinvestment of all distributions and do not reflect the deduction of taxes that a shareholder would pay on Fund distributions or the redemption or sale of Fund shares. An index is a statistical composite that tracks a specified financial market or sector. Unlike the Fund, the index does not actually hold a portfolio of securities and therefore does not incur the expenses incurred by the Fund. These expenses negatively impact the performance of the Fund. The Fund’s past performance does not predict future performance.
Frequency Distribution of Discounts and Premiums
Bid/Ask Midpoint vs. NAV through December 31, 2018
The following Frequency Distribution of Discounts and Premiums charts are provided to show the frequency at which the bid/ask midpoint price for the Fund was at a discount or premium to the daily NAV. The following tables are for comparative purposes only and represent the period January 1, 2014 through December 31, 2018. Shareholders may pay more than NAV when they buy Fund shares and receive less than NAV when they sell those shares because shares are bought and sold at current market price. Data presented represents past performance and cannot be used to predict future results.
| Number of Days Bid/Ask Midpoint At/Above NAV |
| For the Period | 0.00%–0.49% | 0.50%–0.99% | 1.00%–1.99% | >=2.00% |
| 1/1/14 – 12/31/14 | 118 | 102 | 5 | 0 |
| 1/1/15 – 12/31/15 | 115 | 58 | 4 | 0 |
| 1/1/16 – 12/31/16 | 111 | 11 | 0 | 0 |
| 1/1/17 – 12/31/17 | 92 | 1 | 0 | 0 |
| 1/1/18 – 12/31/18 | 105 | 18 | 1 | 1 |
| Number of Days Bid/Ask Midpoint Below NAV |
| For the Period | 0.00%–0.49% | 0.50%–0.99% | 1.00%–1.99% | >=2.00% |
| 1/1/14 – 12/31/14 | 25 | 2 | 0 | 0 |
| 1/1/15 – 12/31/15 | 66 | 9 | 0 | 0 |
| 1/1/16 – 12/31/16 | 121 | 9 | 0 | 0 |
| 1/1/17 – 12/31/17 | 148 | 10 | 0 | 0 |
| 1/1/18 – 12/31/18 | 111 | 14 | 1 | 0 |
Fund Performance Overview (Unaudited) (Continued)
First Trust India NIFTY 50 Equal Weight ETF (NFTY)
From the beginning of the period covered by this report until April 17, 2018, the First Trust India NIFTY 50 Equal Weight ETF (the “Fund”), formerly the First Trust Taiwan AlphaDEX® Fund, sought investment results that corresponded generally to the price and yield (before the Fund’s fees and expenses) of an equity index called the NASDAQ AlphaDEX® Taiwan Index. Effective April 17, 2018, the Fund changed its investment objective to seek investment results that correspond generally to the price and yield (before the Fund’s fees and expenses) of an equity index called the NIFTY 50 Equal Weight Index (the “Index”). The Fund will normally invest at least 90% of its net assets (including investment borrowings) in common stocks that comprise the Index. The shares of the Fund are listed and trade on the Nasdaq under the ticker symbol “NFTY.” The Fund commenced trading on February 15, 2012.
The Index is an equally weighted total return index designed to provide diversified exposure to the NIFTY 50 Index, the main index for Indian equity securities. The NIFTY 50 Index is a market capitalization-weighted index comprising the 50 largest and most liquid Indian equity securities. All constituents of the NIFTY 50 Index will be included in the Index, but will be equally weighted.
| Performance | | | | | | |
| | | Average Annual Total Returns | | Cumulative Total Returns |
| | 1 Year
Ended
12/31/18 | 5 Years
Ended
12/31/18 | Inception
(2/14/12)
to 12/31/18 | | 5 Years
Ended
12/31/18 | Inception
(2/14/12)
to 12/31/18 |
| Fund Performance | | | | | | |
| NAV | -2.67% | 4.54% | 4.80% | | 24.88% | 38.09% |
| Market Price | -1.58% | 4.45% | 4.87% | | 24.32% | 38.66% |
| Index Performance | | | | | | |
| NIFTY 50 Equal Weight Index(1)(2) | -12.78% | N/A | N/A | | N/A | N/A |
| NIFTY 50 Index | -3.76% | 10.23% | 6.55% | | 62.72% | 54.72% |
| NASDAQ Taiwan Index(2) | -8.33% | 5.59% | N/A | | 31.25% | N/A |
| NASDAQ AlphaDEX® Taiwan Index(1)(2) | N/A | N/A | N/A | | N/A | N/A |
| MSCI Taiwan Index | -8.93% | 5.86% | 6.08% | | 32.92% | 50.06% |
(See Notes to Fund Performance Overview Page 43.)
Performance Review
The Fund generated a NAV return of -2.67% during the 12-month period covered by this report. During the same period, the NIFTY 50 Index (“benchmark”) generated a return of -3.76%. The heaviest allocated sector in the Fund was the Financials sector, with a 23.4% allocation. The investments in the Financials sector had a return of 6.9% during the period, explaining 2.3% of the Fund’s return. The best contributing sector was the Information Technology sector with a 5.4% contribution, stemming from its 20.3% allocation and 20.1% return. The Fund’s least contributing sector was the Consumer Discretionary sector with a -3.2% contribution, stemming from its 10.4% allocation and -24.7% return. The total currency effect to the Fund over the period covered in this report totaled -5.6%. On a relative basis, the Fund outperformed the benchmark. The primary cause of the outperformance is due to the Fund over allocating the benchmark amongst the well performing Information Technology securities by 7.0%, creating 4.2% of relative outperformance. The Fund underperformed the benchmark amongst Energy securities by -10.1%, creating -1.4% of relative underperformance.
| (1) | On April 17, 2018, the Fund’s underlying index changed from the NASDAQ AlphaDEX® Taiwan Index to the Index. On July 14, 2015, the Fund’s underlying index changed from the Defined Taiwan Index to the NASDAQ AlphaDEX® Taiwan Index. Therefore, the Fund’s performance and total returns shown for the periods prior to April 17, 2018, are not necessarily indicative of the performance that the Fund, based on the current index, would have generated. |
| (2) | Performance data is not available for all the periods shown in the table for the index because performance data does not exist for some of the entire periods. |
Fund Performance Overview (Unaudited) (Continued)
First Trust India NIFTY 50 Equal Weight ETF (NFTY) (Continued)
| Sector Allocation | % of Total
Long-Term
Investments |
| Financials | 22.2% |
| Materials | 16.0 |
| Consumer Discretionary | 13.6 |
| Energy | 11.9 |
| Information Technology | 10.0 |
| Utilities | 6.1 |
| Communication Services | 6.1 |
| Health Care | 6.0 |
| Industrials | 4.1 |
| Consumer Staples | 4.0 |
| Total | 100.0% |
| Top Ten Holdings | % of Total
Long-Term
Investments |
| Hindustan Petroleum Corp., Ltd. | 2.1% |
| Zee Entertainment Enterprises Ltd. | 2.1 |
| Adani Ports & Special Economic Zone Ltd. | 2.1 |
| Tech Mahindra Ltd. | 2.1 |
| Bajaj Finance Ltd. | 2.1 |
| GAIL India Ltd. | 2.1 |
| Kotak Mahindra Bank Ltd. | 2.0 |
| Mahindra & Mahindra Ltd. | 2.0 |
| Bajaj Finserv Ltd. | 2.0 |
| Indiabulls Housing Finance Ltd. | 2.0 |
| Total | 20.6% |

Performance figures assume reinvestment of all distributions and do not reflect the deduction of taxes that a shareholder would pay on Fund distributions or the redemption or sale of Fund shares. An index is a statistical composite that tracks a specified financial market or sector. Unlike the Fund, the indices do not actually hold a portfolio of securities and therefore do not incur the expenses incurred by the Fund. These expenses negatively impact the performance of the Fund. The Fund’s past performance does not predict future performance.
Frequency Distribution of Discounts and Premiums
Bid/Ask Midpoint vs. NAV through December 31, 2018
The following Frequency Distribution of Discounts and Premiums charts are provided to show the frequency at which the bid/ask midpoint price for the Fund was at a discount or premium to the daily NAV. The following tables are for comparative purposes only and represent the period January 1, 2014 through December 31, 2018. Shareholders may pay more than NAV when they buy Fund shares and receive less than NAV when they sell those shares because shares are bought and sold at current market price. Data presented represents past performance and cannot be used to predict future results.
| Number of Days Bid/Ask Midpoint At/Above NAV |
| For the Period | 0.00%–0.49% | 0.50%–0.99% | 1.00%–1.99% | >=2.00% |
| 1/1/14 – 12/31/14 | 88 | 27 | 3 | 0 |
| 1/1/15 – 12/31/15 | 51 | 23 | 2 | 1 |
| 1/1/16 – 12/31/16 | 56 | 17 | 10 | 1 |
| 1/1/17 – 12/31/17 | 31 | 7 | 5 | 0 |
| 1/1/18 – 12/31/18 | 59 | 52 | 29 | 4 |
| Number of Days Bid/Ask Midpoint Below NAV |
| For the Period | 0.00%–0.49% | 0.50%–0.99% | 1.00%–1.99% | >=2.00% |
| 1/1/14 – 12/31/14 | 87 | 37 | 7 | 3 |
| 1/1/15 – 12/31/15 | 73 | 76 | 23 | 3 |
| 1/1/16 – 12/31/16 | 77 | 63 | 25 | 3 |
| 1/1/17 – 12/31/17 | 88 | 109 | 11 | 0 |
| 1/1/18 – 12/31/18 | 66 | 33 | 8 | 0 |
Fund Performance Overview (Unaudited) (Continued)
First Trust Hong Kong AlphaDEX® Fund (FHK)
The First Trust Hong Kong AlphaDEX® Fund (the “Fund”) seeks investment results that correspond generally to the price and yield (before the Fund’s fees and expenses) of an equity index called the NASDAQ AlphaDEX® Hong Kong Index (the “Index”). The Fund will normally invest at least 90% of its net assets (including investment borrowings) in common stocks and/or depositary receipts that comprise the Index. The shares of the Fund are listed and trade on the Nasdaq under the ticker symbol “FHK.” The Fund commenced trading on February 15, 2012.
The Index employs the AlphaDEX® stock selection methodology which uses fundamental growth and value factors to objectively select stocks from the NASDAQ Hong Kong Index which may generate positive alpha relative to traditional passive indices. The Index is a modified equal-dollar weighted index where higher ranked stocks receive a higher weight within the Index.
| Performance | | | | | | |
| | | Average Annual Total Returns | | Cumulative Total Returns |
| | 1 Year
Ended
12/31/18 | 5 Years
Ended
12/31/18 | Inception
(2/14/12)
to 12/31/18 | | 5 Years
Ended
12/31/18 | Inception
(2/14/12)
to 12/31/18 |
| Fund Performance | | | | | | |
| NAV | -17.84% | 1.28% | 5.38% | | 6.59% | 43.43% |
| Market Price | -18.09% | 0.96% | 5.27% | | 4.91% | 42.35% |
| Index Performance | | | | | | |
| NASDAQ AlphaDEX® Hong Kong Index(1) | -16.78% | N/A | N/A | | N/A | N/A |
| NASDAQ Hong Kong Index(1) | -10.85% | 3.64% | N/A | | 19.58% | N/A |
| MSCI Hong Kong Index | -7.83% | 6.05% | 7.87% | | 34.13% | 68.38% |
(See Notes to Fund Performance Overview Page 43.)
Performance Review
The Fund generated a NAV return of -17.84% during the 12-month period covered by this report. During the same period, the MSCI Hong Kong Index (“benchmark”) generated a return of -7.83%. The Real Estate sector received the greatest allocation during the period, with a 43.5% weight in the Fund. These contributed -1.5% to the Fund’s total return during the period. The Information Technology sector with the worst contribution to returns of -4.5%. Utilities had the best contribution to the Fund’s total returns with 0.8% contribution to total return. The total currency effect to the Fund over the period covered in this report totaled -0.1%. On a relative basis, the Fund underperformed the benchmark. Much of this underperformance comes from the investments in Information Technology, which earned -3.8% underperformance against the benchmark. With regard to performance against the benchmark, the Real Estate sector was the lone boon for the Fund with a 1.7% contribution to Fund outperformance during the period.
| (1) | Performance data is not available for all the periods shown in the table for the index because performance data does not exist for some of the entire periods. |
Fund Performance Overview (Unaudited) (Continued)
First Trust Hong Kong AlphaDEX® Fund (FHK) (Continued)
| Sector Allocation | % of Total
Long-Term
Investments |
| Real Estate | 50.0% |
| Consumer Discretionary | 12.6 |
| Utilities | 8.3 |
| Consumer Staples | 8.1 |
| Materials | 5.1 |
| Information Technology | 4.7 |
| Health Care | 4.4 |
| Financials | 3.5 |
| Industrials | 3.3 |
| Total | 100.0% |
| Top Ten Holdings | % of Total
Long-Term
Investments |
| Link REIT | 5.3% |
| Jiayuan International Group Ltd. | 5.1 |
| Sino Land Co., Ltd. | 5.0 |
| Champion REIT | 4.9 |
| Swire Pacific Ltd., Class A | 4.7 |
| China Gas Holdings Ltd. | 4.2 |
| Shimao Property Holdings Ltd. | 3.8 |
| Sun Hung Kai Properties Ltd. | 3.6 |
| Henderson Land Development Co., Ltd. | 3.5 |
| Kerry Properties Ltd. | 3.4 |
| Total | 43.5% |
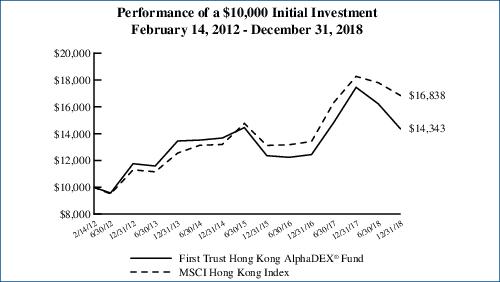
Performance figures assume reinvestment of all distributions and do not reflect the deduction of taxes that a shareholder would pay on Fund distributions or the redemption or sale of Fund shares. An index is a statistical composite that tracks a specified financial market or sector. Unlike the Fund, the index does not actually hold a portfolio of securities and therefore does not incur the expenses incurred by the Fund. These expenses negatively impact the performance of the Fund. The Fund’s past performance does not predict future performance.
Frequency Distribution of Discounts and Premiums
Bid/Ask Midpoint vs. NAV through December 31, 2018
The following Frequency Distribution of Discounts and Premiums charts are provided to show the frequency at which the bid/ask midpoint price for the Fund was at a discount or premium to the daily NAV. The following tables are for comparative purposes only and represent the period January 1, 2014 through December 31, 2018. Shareholders may pay more than NAV when they buy Fund shares and receive less than NAV when they sell those shares because shares are bought and sold at current market price. Data presented represents past performance and cannot be used to predict future results.
| Number of Days Bid/Ask Midpoint At/Above NAV |
| For the Period | 0.00%–0.49% | 0.50%–0.99% | 1.00%–1.99% | >=2.00% |
| 1/1/14 – 12/31/14 | 76 | 81 | 24 | 1 |
| 1/1/15 – 12/31/15 | 72 | 67 | 12 | 2 |
| 1/1/16 – 12/31/16 | 48 | 4 | 1 | 0 |
| 1/1/17 – 12/31/17 | 43 | 4 | 0 | 0 |
| 1/1/18 – 12/31/18 | 69 | 19 | 2 | 0 |
| Number of Days Bid/Ask Midpoint Below NAV |
| For the Period | 0.00%–0.49% | 0.50%–0.99% | 1.00%–1.99% | >=2.00% |
| 1/1/14 – 12/31/14 | 45 | 19 | 6 | 0 |
| 1/1/15 – 12/31/15 | 47 | 35 | 16 | 1 |
| 1/1/16 – 12/31/16 | 95 | 87 | 15 | 2 |
| 1/1/17 – 12/31/17 | 138 | 66 | 0 | 0 |
| 1/1/18 – 12/31/18 | 107 | 49 | 4 | 1 |
Fund Performance Overview (Unaudited) (Continued)
First Trust Switzerland AlphaDEX® Fund (FSZ)
The First Trust Switzerland AlphaDEX® Fund (the “Fund”) seeks investment results that correspond generally to the price and yield (before the Fund’s fees and expenses) of an equity index called the NASDAQ AlphaDEX® Switzerland Index (the “Index”). The Fund will normally invest at least 90% of its net assets (including investment borrowings) in common stocks and/or depositary receipts that comprise the Index. The shares of the Fund are listed and trade on the Nasdaq under the ticker symbol “FSZ.” The Fund commenced trading on February 15, 2012.
The Index employs the AlphaDEX® stock selection methodology which uses fundamental growth and value factors to objectively select stocks from the NASDAQ Switzerland Index which may generate positive alpha relative to traditional passive indices. The Index is a modified equal-dollar weighted index where higher ranked stocks receive a higher weight within the Index.
| Performance | | | | | | |
| | | Average Annual Total Returns | | Cumulative Total Returns |
| | 1 Year
Ended
12/31/18 | 5 Years
Ended
12/31/18 | Inception
(2/14/12)
to 12/31/18 | | 5 Years
Ended
12/31/18 | Inception
(2/14/12)
to 12/31/18 |
| Fund Performance | | | | | | |
| NAV | -15.11% | 3.18% | 7.63% | | 16.92% | 65.83% |
| Market Price | -15.12% | 3.03% | 7.66% | | 16.09% | 66.15% |
| Index Performance | | | | | | |
| NASDAQ AlphaDEX® Switzerland Index(1) | -15.28% | N/A | N/A | | N/A | N/A |
| NASDAQ Switzerland Index(1) | -9.86% | 1.16% | N/A | | 5.92% | N/A |
| MSCI Switzerland Index | -9.08% | 1.23% | 6.39% | | 6.32% | 53.12% |
(See Notes to Fund Performance Overview Page 43.)
Performance Review
The Fund generated a NAV return of -15.11% during the 12-month period covered by this report. During the same period, the MSCI Switzerland Index (“benchmark”) generated a return of -9.08%. The Financials sector received the greatest allocation during the period, with a 23.8% weight in the Fund. These contributed -1.6% to the Fund’s total return. The Industrials sector has the most negative impact to the Fund’s total return of -7.2%. Health Care was the most positive sector for the Fund’s return, with 0.5% total contribution to the Fund’s return. The total currency effect to the Fund over the period covered in this report totaled 0.0%. On a relative basis, the Fund underperformed the benchmark. This underperformance came largely due to investments in the Industrials sector, which caused -4.3% underperformance against the benchmark. The Financials sector achieved outperformance against the benchmark of 1.9%, the most of any sector during the period.
| (1) | Performance data is not available for all the periods shown in the table for the index because performance data does not exist for some of the entire periods. |
Fund Performance Overview (Unaudited) (Continued)
First Trust Switzerland AlphaDEX® Fund (FSZ) (Continued)
| Sector Allocation | % of Total
Long-Term
Investments |
| Financials | 21.7% |
| Industrials | 20.6 |
| Health Care | 14.4 |
| Communication Services | 10.3 |
| Materials | 9.3 |
| Information Technology | 7.2 |
| Consumer Discretionary | 4.4 |
| Utilities | 4.1 |
| Consumer Staples | 4.1 |
| Real Estate | 3.9 |
| Total | 100.0% |
| Top Ten Holdings | % of Total
Long-Term
Investments |
| Sunrise Communications Group AG | 5.2% |
| Swisscom AG | 5.1 |
| Swiss Life Holding AG | 4.2 |
| BKW AG | 4.1 |
| Pargesa Holding S.A. | 4.1 |
| Straumann Holding AG | 4.0 |
| Temenos Group AG | 3.8 |
| Adecco Group AG | 3.8 |
| Sika AG | 3.5 |
| Sonova Holding AG | 3.5 |
| Total | 41.3% |

Performance figures assume reinvestment of all distributions and do not reflect the deduction of taxes that a shareholder would pay on Fund distributions or the redemption or sale of Fund shares. An index is a statistical composite that tracks a specified financial market or sector. Unlike the Fund, the index does not actually hold a portfolio of securities and therefore does not incur the expenses incurred by the Fund. These expenses negatively impact the performance of the Fund. The Fund’s past performance does not predict future performance.
Frequency Distribution of Discounts and Premiums
Bid/Ask Midpoint vs. NAV through December 31, 2018
The following Frequency Distribution of Discounts and Premiums charts are provided to show the frequency at which the bid/ask midpoint price for the Fund was at a discount or premium to the daily NAV. The following tables are for comparative purposes only and represent the period January 1, 2014 through December 31, 2018. Shareholders may pay more than NAV when they buy Fund shares and receive less than NAV when they sell those shares because shares are bought and sold at current market price. Data presented represents past performance and cannot be used to predict future results.
| Number of Days Bid/Ask Midpoint At/Above NAV |
| For the Period | 0.00%–0.49% | 0.50%–0.99% | 1.00%–1.99% | >=2.00% |
| 1/1/14 – 12/31/14 | 152 | 30 | 0 | 0 |
| 1/1/15 – 12/31/15 | 135 | 20 | 1 | 0 |
| 1/1/16 – 12/31/16 | 78 | 6 | 0 | 0 |
| 1/1/17 – 12/31/17 | 171 | 5 | 0 | 0 |
| 1/1/18 – 12/31/18 | 116 | 17 | 2 | 0 |
| Number of Days Bid/Ask Midpoint Below NAV |
| For the Period | 0.00%–0.49% | 0.50%–0.99% | 1.00%–1.99% | >=2.00% |
| 1/1/14 – 12/31/14 | 66 | 3 | 1 | 0 |
| 1/1/15 – 12/31/15 | 78 | 17 | 1 | 0 |
| 1/1/16 – 12/31/16 | 155 | 12 | 1 | 0 |
| 1/1/17 – 12/31/17 | 74 | 1 | 0 | 0 |
| 1/1/18 – 12/31/18 | 104 | 12 | 0 | 0 |
Fund Performance Overview (Unaudited) (Continued)
First Trust Developed Markets ex-US Small Cap AlphaDEX® Fund (FDTS)
The First Trust Developed Markets ex-US Small Cap AlphaDEX® Fund (the “Fund”) seeks investment results that correspond generally to the price and yield (before the Fund’s fees and expenses) of an equity index called the NASDAQ AlphaDEX® Developed Markets Ex-US Small Cap Index (the “Index”). The Fund will normally invest at least 90% of its net assets (including investment borrowings) in common stocks and/or depositary receipts that comprise the Index. The shares of the Fund are listed and trade on the Nasdaq under the ticker symbol “FDTS.” The Fund commenced trading on February 16, 2012.
The Index employs the AlphaDEX® stock selection methodology which uses fundamental growth and value factors to objectively select stocks from the NASDAQ Developed Markets Ex-US Small Cap Index which may generate positive alpha relative to traditional passive indices. The Index is a modified equal-dollar weighted index where higher ranked stocks receive a higher weight within the Index.
| Performance | | | | | | |
| | | Average Annual Total Returns | | Cumulative Total Returns |
| | 1 Year
Ended
12/31/18 | 5 Years
Ended
12/31/18 | Inception
(2/15/12)
to 12/31/18 | | 5 Years
Ended
12/31/18 | Inception
(2/15/12)
to 12/31/18 |
| Fund Performance | | | | | | |
| NAV | -24.03% | 0.18% | 3.66% | | 0.92% | 28.05% |
| Market Price | -23.99% | -0.11% | 3.59% | | -0.53% | 27.40% |
| Index Performance | | | | | | |
| NASDAQ AlphaDEX® Developed Markets Ex-US Small Cap Index(1) | -23.58% | N/A | N/A | | N/A | N/A |
| NASDAQ Developed Markets Ex-US Small Cap Index(1)(2) | -18.34% | 2.03% | N/A | | 10.60% | N/A |
| MSCI World ex-US Small Cap Index(2) | -18.07% | 2.25% | 5.86% | | 11.79% | 47.91% |
(See Notes to Fund Performance Overview Page 43.)
Performance Review
The Fund generated a NAV return of -24.03% during the 12-month period covered by this report. During the same period, the benchmark NASDAQ Developed Markets Ex-US Small Cap Index generated a return of -18.34%. Japan was the most heavily weighted country in the Fund during the period and generated a -10.8% contribution to the Fund’s total return. The country with the best performance in the Fund was Israel, but, due to an allocation of only 1.9% in the Fund, garnered only 0.1% total contribution to the Fund’s total return. The total currency effect to the Fund over the period covered in this report totaled -1.1%. On a relative basis, the Fund underperformed the benchmark. This came most noticeably from the Japanese investments, which caused -4.1% underperformance against the benchmark. Small cases of outperformance against the benchmark came from Israel (0.4%), France (0.4%), and Germany (0.3%).
| (1) | Performance data is not available for all the periods shown in the table for the index because performance data does not exist for some of the entire periods. |
| (2) | Beginning with this Annual Report, the NASDAQ Developed Markets Ex-US Small Cap Index will be used as the Fund’s benchmark for performance attribution purposes. The MSCI World ex-US Small Cap Index was previously used as the Fund’s benchmark for performance attribution purposes. However, the constituents of the MSCI World ex-US Small Cap Index are not readily available to First Trust for attribution analysis. The Fund seeks to track the NASDAQ AlphaDEX® Developed Markets Ex-US Small Cap Index, which is an “enhanced” index created and administered by Nasdaq, Inc. (“Nasdaq”) that employs the AlphaDEX® stock selection methodology to select stocks from the NASDAQ Developed Markets Ex-US Index that meet certain criteria. First Trust believes performance attribution against the NASDAQ Developed Market Ex-US Small Cap index is suitable for analytical purposes. The MSCI World ex-US Small Cap Index will continue to be used as the Fund’s benchmark for other performance comparison purposes. |
Fund Performance Overview (Unaudited) (Continued)
First Trust Developed Markets ex-US Small Cap AlphaDEX® Fund (FDTS) (Continued)
| Sector Allocation | % of Total
Long-Term
Investments |
| Industrials | 23.6% |
| Materials | 18.1 |
| Consumer Discretionary | 16.9 |
| Real Estate | 10.9 |
| Information Technology | 9.3 |
| Energy | 4.9 |
| Health Care | 4.7 |
| Consumer Staples | 4.3 |
| Communication Services | 3.5 |
| Financials | 2.2 |
| Utilities | 1.6 |
| Total | 100.0% |
| Top Ten Holdings | % of Total
Long-Term
Investments |
| Hopewell Holdings Ltd. | 0.7% |
| Daelim Industrial Co., Ltd. | 0.6 |
| OceanGold Corp. | 0.6 |
| Fila Korea Ltd. | 0.6 |
| Centerra Gold, Inc. | 0.6 |
| Hanwha Chemical Corp. | 0.5 |
| John Laing Group PLC | 0.5 |
| Mapletree North Asia Commercial Trust | 0.5 |
| Korea Real Estate Investment & Trust Co., Ltd. | 0.5 |
| Oil Refineries Ltd. | 0.5 |
| Total | 5.6% |
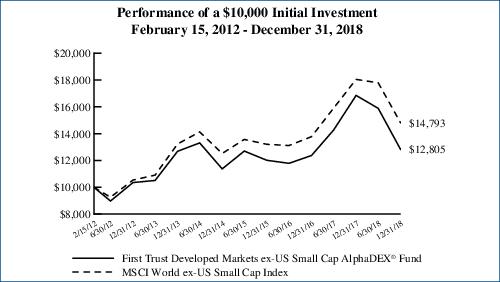
Performance figures assume reinvestment of all distributions and do not reflect the deduction of taxes that a shareholder would pay on Fund distributions or the redemption or sale of Fund shares. An index is a statistical composite that tracks a specified financial market or sector. Unlike the Fund, the index does not actually hold a portfolio of securities and therefore does not incur the expenses incurred by the Fund. These expenses negatively impact the performance of the Fund. The Fund’s past performance does not predict future performance.
Frequency Distribution of Discounts and Premiums
Bid/Ask Midpoint vs. NAV through December 31, 2018
The following Frequency Distribution of Discounts and Premiums charts are provided to show the frequency at which the bid/ask midpoint price for the Fund was at a discount or premium to the daily NAV. The following tables are for comparative purposes only and represent the period January 1, 2014 through December 31, 2018. Shareholders may pay more than NAV when they buy Fund shares and receive less than NAV when they sell those shares because shares are bought and sold at current market price. Data presented represents past performance and cannot be used to predict future results.
| Number of Days Bid/Ask Midpoint At/Above NAV |
| For the Period | 0.00%–0.49% | 0.50%–0.99% | 1.00%–1.99% | >=2.00% |
| 1/1/14 – 12/31/14 | 107 | 105 | 4 | 1 |
| 1/1/15 – 12/31/15 | 42 | 23 | 7 | 7 |
| 1/1/16 – 12/31/16 | 16 | 1 | 0 | 0 |
| 1/1/17 – 12/31/17 | 10 | 4 | 0 | 0 |
| 1/1/18 – 12/31/18 | 92 | 23 | 2 | 0 |
| Number of Days Bid/Ask Midpoint Below NAV |
| For the Period | 0.00%–0.49% | 0.50%–0.99% | 1.00%–1.99% | >=2.00% |
| 1/1/14 – 12/31/14 | 29 | 5 | 1 | 0 |
| 1/1/15 – 12/31/15 | 125 | 44 | 3 | 1 |
| 1/1/16 – 12/31/16 | 58 | 137 | 38 | 2 |
| 1/1/17 – 12/31/17 | 44 | 171 | 22 | 0 |
| 1/1/18 – 12/31/18 | 92 | 37 | 5 | 0 |
Fund Performance Overview (Unaudited) (Continued)
First Trust Emerging Markets Small Cap AlphaDEX® Fund (FEMS)
The First Trust Emerging Markets Small Cap AlphaDEX® Fund (the “Fund”) seeks investment results that correspond generally to the price and yield (before the Fund’s fees and expenses) of an equity index called the NASDAQ AlphaDEX® Emerging Markets Small Cap Index (the “Index”). The Fund will normally invest at least 90% of its net assets (including investment borrowings) in common stocks and/or depositary receipts that comprise the Index. The shares of the Fund are listed and trade on the Nasdaq under the ticker symbol “FEMS.” The Fund commenced trading on Febraury 16, 2012.
The Index employs the AlphaDEX® stock selection methodology which uses fundamental growth and value factors to objectively select stocks from the NASDAQ Emerging Markets Small Cap Index which may generate positive alpha relative to traditional passive indices. The Index is a modified equal-dollar weighted index where higher ranked stocks receive a higher weight within the Index.
| Performance | | | | | | |
| | | Average Annual Total Returns | | Cumulative Total Returns |
| | 1 Year
Ended
12/31/18 | 5 Years
Ended
12/31/18 | Inception
(2/15/12)
to 12/31/18 | | 5 Years
Ended
12/31/18 | Inception
(2/15/12)
to 12/31/18 |
| Fund Performance | | | | | | |
| NAV | -21.42% | 1.50% | 4.06% | | 7.71% | 31.50% |
| Market Price | -22.45% | 1.04% | 3.94% | | 5.29% | 30.44% |
| Index Performance | | | | | | |
| NASDAQ AlphaDEX® Emerging Markets Small Cap Index(1) | -19.99% | N/A | N/A | | N/A | N/A |
| NASDAQ Emerging Markets Small Cap Index(1) | -16.51% | 2.46% | N/A | | 12.94% | N/A |
| MSCI Emerging Markets Small Cap Index(2) | -18.59% | 0.95% | 1.27% | | 4.86% | 9.09% |
(See Notes to Fund Performance Overview Page 43.)
Performance Review
The Fund generated a NAV return of -21.42% during the 12-month period covered by this report. During the same period, the NASDAQ Emerging Markets Small Cap Index (“benchmark”) generated a return of -16.51%. Hong Kong and Taiwan received the heaviest weighting during the period of 24.3% each. Hong Kong contributed -4.8% to the Fund’s return while Taiwan contributed -4.6%. The most positive-returning investments were those in Thailand, contributing 1.6% to the Fund’s total return. The total currency effect to the Fund over the period covered in this report totaled -5.9%. On a relative basis, the Fund underperformed the benchmark. The Fund’s holdings in Taiwan were the primary cause of the underperformance as the Fund underperformed the benchmark by -6.6% among these securities, creating -2.1% of relative drag. The Fund regained 2.3% of performance relative to the benchmark by outperforming among Thailand securities by 139.8%.
| (1) | Performance data is not available for all the periods shown in the table for the index because performance data does not exist for some of the entire periods. |
| (2) | Beginning with this Annual Report, the NASDAQ Emerging Markets Small Cap Index will be used as the Fund’s benchmark for performance attribution purposes. The MSCI Emerging Markets Small Cap Index was previously used as the Fund’s benchmark for performance attribution purposes. However, the constituents of the MSCI Emerging Markets Small Cap Index are not readily available to First Trust for attribution analysis. The Fund seeks to track the NASDAQ AlphaDEX® Emerging Markets Small Cap Index, which is an “enhanced” index created and administered by Nasdaq, Inc. (“Nasdaq”) that employs the AlphaDEX® stock selection methodology to select stocks from the NASDAQ Emerging Markets Small Cap Index that meet certain criteria. First Trust believes performance attribution against the NASDAQ Emerging Markets Small Cap Index is suitable for analytical purposes. The MSCI Emerging Markets Small Cap Index will continue to be used as the Fund’s benchmark for other performance comparison purposes. |
Fund Performance Overview (Unaudited) (Continued)
First Trust Emerging Markets Small Cap AlphaDEX® Fund (FEMS) (Continued)
| Sector Allocation | % of Total
Long-Term
Investments |
| Materials | 17.5% |
| Industrials | 13.6 |
| Information Technology | 12.8 |
| Real Estate | 12.1 |
| Utilities | 9.9 |
| Financials | 9.4 |
| Consumer Discretionary | 9.0 |
| Energy | 6.9 |
| Communication Services | 3.5 |
| Consumer Staples | 3.2 |
| Health Care | 2.1 |
| Total | 100.0% |
| Top Ten Holdings | % of Total
Long-Term
Investments |
| Cia de Saneamento de Minas Gerais-Copasa | 1.2% |
| Adani Enterprises Ltd. | 1.2 |
| Cia Paranaense de Energia, Class B (Preference Shares) | 1.1 |
| Soda Sanayii A.S. | 1.1 |
| Sul America S.A. | 1.0 |
| Energa S.A. | 1.0 |
| Turkiye Sise ve Cam Fabrikalari A.S. | 1.0 |
| African Rainbow Minerals Ltd. | 1.0 |
| Tekfen Holding A.S. | 1.0 |
| Bosideng International Holdings Ltd. | 1.0 |
| Total | 10.6% |

Performance figures assume reinvestment of all distributions and do not reflect the deduction of taxes that a shareholder would pay on Fund distributions or the redemption or sale of Fund shares. An index is a statistical composite that tracks a specified financial market or sector. Unlike the Fund, the index does not actually hold a portfolio of securities and therefore does not incur the expenses incurred by the Fund. These expenses negatively impact the performance of the Fund. The Fund’s past performance does not predict future performance.
Frequency Distribution of Discounts and Premiums
Bid/Ask Midpoint vs. NAV through December 31, 2018
The following Frequency Distribution of Discounts and Premiums charts are provided to show the frequency at which the bid/ask midpoint price for the Fund was at a discount or premium to the daily NAV. The following tables are for comparative purposes only and represent the period January 1, 2014 through December 31, 2018. Shareholders may pay more than NAV when they buy Fund shares and receive less than NAV when they sell those shares because shares are bought and sold at current market price. Data presented represents past performance and cannot be used to predict future results.
| Number of Days Bid/Ask Midpoint At/Above NAV |
| For the Period | 0.00%–0.49% | 0.50%–0.99% | 1.00%–1.99% | >=2.00% |
| 1/1/14 – 12/31/14 | 71 | 69 | 21 | 0 |
| 1/1/15 – 12/31/15 | 40 | 20 | 1 | 0 |
| 1/1/16 – 12/31/16 | 63 | 81 | 40 | 1 |
| 1/1/17 – 12/31/17 | 86 | 100 | 3 | 1 |
| 1/1/18 – 12/31/18 | 50 | 35 | 3 | 0 |
| Number of Days Bid/Ask Midpoint Below NAV |
| For the Period | 0.00%–0.49% | 0.50%–0.99% | 1.00%–1.99% | >=2.00% |
| 1/1/14 – 12/31/14 | 41 | 38 | 12 | 0 |
| 1/1/15 – 12/31/15 | 89 | 74 | 28 | 0 |
| 1/1/16 – 12/31/16 | 35 | 21 | 10 | 1 |
| 1/1/17 – 12/31/17 | 54 | 7 | 0 | 0 |
| 1/1/18 – 12/31/18 | 65 | 72 | 26 | 0 |
Fund Performance Overview (Unaudited) (Continued)
First Trust Eurozone AlphaDEX® ETF (FEUZ)
The First Trust Eurozone AlphaDEX® ETF (the “Fund”) seeks investment results that correspond generally to the price and yield (before the Fund’s fees and expenses) of an equity index called the NASDAQ AlphaDEX® Eurozone Index (the “Index”). The Fund will normally invest at least 90% of its net assets (including investment borrowings) in common stocks and/or depositary receipts that comprise the Index. The shares of the Fund are listed and trade on the Nasdaq under the ticker symbol “FEUZ.” The Fund commenced trading on October 22, 2014.
The Index employs the AlphaDEX® stock selection methodology which uses fundamental growth and value factors to objectively select stocks from the NASDAQ Eurozone Index which may generate positive alpha relative to traditional passive indices. The Index is a modified equal-dollar weighted index where higher ranked stocks receive a higher weight within the Index.
| Performance | | | |
| | | Average Annual
Total Returns | Cumulative
Total Returns |
| | 1 Year Ended
12/31/18 | Inception (10/21/14)
to 12/31/18 | Inception (10/21/14)
to 12/31/18 |
| Fund Performance(1) | | | |
| NAV | -19.82% | 4.57% | 20.63% |
| Market Price | -19.87% | 4.58% | 20.66% |
| Index Performance | | | |
| NASDAQ AlphaDEX® Eurozone Index | -19.66% | 5.06% | 23.00% |
| NASDAQ Eurozone Index | -17.87% | 1.95% | 8.46% |
| MSCI EMU Index | -16.90% | 1.79% | 7.70% |
(See Notes to Fund Performance Overview Page 43.)
Performance Review
The Fund generated a NAV return of -19.82% during the 12-month period covered by this report. During the same period, the MSCI EMU Index (“benchmark”) generated a return of -16.90%. Germany and France were the greatest weights in the Fund at 27.4% and 25.6%, respectively, generating -5.6% and -5.1% return for the Fund, respectively. The best performing investments were those in Spain and Finland, as each had a -6.9% total return over the period and, after accounting for weight in the Fund and currency return, generated -0.7% and -0.3% total return to the Fund, respectively. The total currency effect to the Fund over the period covered in this report totaled -4.06%. On a relative basis, the Fund underperformed the benchmark. France generated the most substantial underperformance, causing -2.42% underperformance against the benchmark. Belgium, meanwhile, created the most outperformance against the benchmark earning 0.70% outperformance.
Fund Performance Overview (Unaudited) (Continued)
First Trust Eurozone AlphaDEX® ETF (FEUZ) (Continued)
| Sector Allocation | % of Total
Long-Term
Investments |
| Industrials | 16.9% |
| Consumer Discretionary | 16.8 |
| Financials | 13.4 |
| Materials | 10.8 |
| Real Estate | 9.6 |
| Utilities | 7.2 |
| Communication Services | 6.4 |
| Energy | 6.2 |
| Health Care | 6.0 |
| Information Technology | 4.8 |
| Consumer Staples | 1.9 |
| Total | 100.0% |
| Top Ten Holdings | % of Total
Long-Term
Investments |
| SCOR SE | 1.3% |
| TAG Immobilien AG | 1.3 |
| Hannover Rueck SE | 1.3 |
| Acciona S.A. | 1.2 |
| Neste OYJ | 1.2 |
| Societa Iniziative Autostradali e Servizi S.p.A. | 1.2 |
| Deutsche Lufthansa AG | 1.2 |
| Telecom Italia S.p.A. | 1.2 |
| Merlin Properties Socimi S.A. | 1.2 |
| ACS Actividades de Construccion y Servicios S.A. | 1.2 |
| Total | 12.3% |
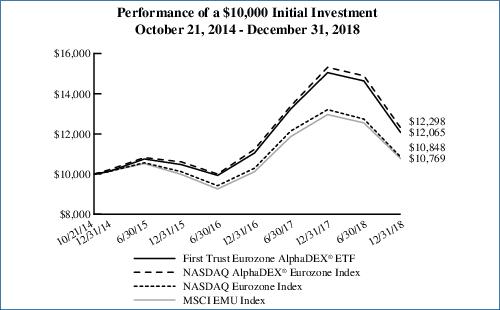
Performance figures assume reinvestment of all distributions and do not reflect the deduction of taxes that a shareholder would pay on Fund distributions or the redemption or sale of Fund shares. An index is a statistical composite that tracks a specified financial market or sector. Unlike the Fund, the indices do not actually hold a portfolio of securities and therefore do not incur the expenses incurred by the Fund. These expenses negatively impact the performance of the Fund. The Fund’s past performance does not predict future performance.
Frequency Distribution of Discounts and Premiums
Bid/Ask Midpoint vs. NAV through December 31, 2018
The following Frequency Distribution of Discounts and Premiums charts are provided to show the frequency at which the bid/ask midpoint price for the Fund was at a discount or premium to the daily NAV. The following tables are for comparative purposes only and represent the period October 22, 2014 (commencement of trading) through December 31, 2018. Shareholders may pay more than NAV when they buy Fund shares and receive less than NAV when they sell those shares because shares are bought and sold at current market price. Data presented represents past performance and cannot be used to predict future results.
| Number of Days Bid/Ask Midpoint At/Above NAV |
| For the Period | 0.00%–0.49% | 0.50%–0.99% | 1.00%–1.99% | >=2.00% |
| 10/22/14 – 12/31/14 | 18 | 19 | 0 | 0 |
| 1/1/15 – 12/31/15 | 74 | 7 | 0 | 1 |
| 1/1/16 – 12/31/16 | 38 | 1 | 0 | 0 |
| 1/1/17 – 12/31/17 | 126 | 71 | 2 | 0 |
| 1/1/18 – 12/31/18 | 150 | 25 | 1 | 1 |
| Number of Days Bid/Ask Midpoint Below NAV |
| For the Period | 0.00%–0.49% | 0.50%–0.99% | 1.00%–1.99% | >=2.00% |
| 10/22/14 – 12/31/14 | 8 | 4 | 0 | 0 |
| 1/1/15 – 12/31/15 | 130 | 36 | 4 | 0 |
| 1/1/16 – 12/31/16 | 159 | 49 | 5 | 0 |
| 1/1/17 – 12/31/17 | 51 | 1 | 0 | 0 |
| 1/1/18 – 12/31/18 | 68 | 4 | 2 | 0 |
Notes to Fund Performance Overview (Unaudited)
Total returns for the periods since inception are calculated from the inception date of each Fund. “Average Annual Total Returns” represent the average annual change in value of an investment over the periods indicated. “Cumulative Total Returns” represent the total change in value of an investment over the periods indicated.
Each Fund’s per share net asset value (“NAV”) is the value of one share of the Fund and is computed by dividing the value of all assets of the Fund (including accrued interest and dividends), less all liabilities (including accrued expenses and dividends declared but unpaid), by the total number of outstanding shares. The price used to calculate market return (“Market Price”) is determined by using the midpoint between the highest bid and the lowest offer on the stock exchange on which shares of the Fund are listed for trading as of the time that the Fund’s NAV is calculated. Since shares of each Fund did not trade in the secondary market until after the Fund’s inception, for the period from inception to the first day of secondary market trading in shares of the Fund, the NAV of each Fund is used as a proxy for the secondary market trading price to calculate market returns. NAV and market returns assume that all distributions have been reinvested in each Fund at NAV and Market Price, respectively.
An index is a statistical composite that tracks a specified financial market or sector. Unlike each Fund, the indices do not actually hold a portfolio of securities and therefore do not incur the expenses incurred by each Fund. These expenses negatively impact the performance of each Fund. Also, market returns do not include brokerage commissions that may be payable on secondary market transactions. If brokerage commissions were included, market returns would be lower. The total returns presented reflect the reinvestment of dividends on securities in the indices. The returns presented do not reflect the deduction of taxes that a shareholder would pay on Fund distributions or the redemption or sale of Fund shares. The investment return and principal value of shares of each Fund will vary with changes in market conditions. Shares of each Fund may be worth more or less than their original cost when they are redeemed or sold in the market. Each Fund’s past performance is no guarantee of future performance.
First Trust Exchange-Traded AlphaDEX® Fund II
Understanding Your Fund Expenses
December 31, 2018 (Unaudited)
As a shareholder of First Trust Asia Pacific ex-Japan AlphaDEX® Fund, First Trust Europe AlphaDEX® Fund, First Trust Latin America AlphaDEX® Fund, First Trust Brazil AlphaDEX® Fund, First Trust China AlphaDEX® Fund, First Trust Japan AlphaDEX® Fund, First Trust South Korea AlphaDEX® Fund, First Trust Developed Markets ex-US AlphaDEX® Fund, First Trust Emerging Markets AlphaDEX® Fund, First Trust Germany AlphaDEX® Fund, First Trust Canada AlphaDEX® Fund, First Trust Australia AlphaDEX® Fund, First Trust United Kingdom AlphaDEX® Fund, First Trust India NIFTY 50 Equal Weight ETF, First Trust Hong Kong AlphaDEX® Fund, First Trust Switzerland AlphaDEX® Fund, First Trust Developed Markets ex-US Small Cap AlphaDEX® Fund, First Trust Emerging Markets Small Cap AlphaDEX® Fund or First Trust Eurozone AlphaDEX® ETF (each a “Fund” and collectively, the “Funds”), you incur two types of costs: (1) transaction costs; and (2) ongoing costs, including management fees, distribution and/or service (12b-1) fees, if any, and other Fund expenses. This Example is intended to help you understand your ongoing costs of investing in the Funds and to compare these costs with the ongoing costs (in U.S. dollars) of investing in other funds.
The Example is based on an investment of $1,000 invested at the beginning of the period and held through the six-month period ended December 31, 2018.
Actual Expenses
The first line in the following table provides information about actual account values and actual expenses. You may use the information in this line, together with the amount you invested, to estimate the expenses that you paid over the period. Simply divide your account value by $1,000 (for example, an $8,600 account value divided by $1,000 = 8.6), then multiply the result by the number in the first line under the heading entitled “Expenses Paid During the Six-Month Period” to estimate the expenses you paid on your account during this six-month period.
Hypothetical Example for Comparison Purposes
The second line in the following table provides information about hypothetical account values and hypothetical expenses based on each Fund’s actual expense ratio and an assumed rate of return of 5% per year before expenses, which is not each Fund’s actual return. The hypothetical account values and expenses may not be used to estimate the actual ending account balance or expenses you paid for the period. You may use this information to compare the ongoing costs of investing in the Funds and other funds. To do so, compare this 5% hypothetical example with the 5% hypothetical examples that appear in the shareholder reports of the other funds.
Please note that the expenses shown in the table are meant to highlight your ongoing costs only and do not reflect any transactional costs such as brokerage commissions. Therefore, the second line in the table is useful in comparing ongoing costs only, and will not help you determine the relative total costs of owning different funds. In addition, if these transactional costs were included, your costs would have been higher.
| | Beginning
Account Value
July 1, 2018 | Ending
Account Value
December 31, 2018 | Annualized
Expense Ratio
Based on the
Six-Month
Period | Expenses Paid
During the
Six-Month
Period (a) |
| First Trust Asia Pacific ex-Japan AlphaDEX® Fund (FPA) |
| Actual | $1,000.00 | $853.50 | 0.80% | $3.74 |
| Hypothetical (5% return before expenses) | $1,000.00 | $1,021.17 | 0.80% | $4.08 |
| First Trust Europe AlphaDEX® Fund (FEP) |
| Actual | $1,000.00 | $813.90 | 0.80% | $3.66 |
| Hypothetical (5% return before expenses) | $1,000.00 | $1,021.17 | 0.80% | $4.08 |
| First Trust Latin America AlphaDEX® Fund (FLN) |
| Actual | $1,000.00 | $1,039.60 | 0.80% | $4.11 |
| Hypothetical (5% return before expenses) | $1,000.00 | $1,021.17 | 0.80% | $4.08 |
| First Trust Brazil AlphaDEX® Fund (FBZ) |
| Actual | $1,000.00 | $1,199.10 | 0.80% | $4.43 |
| Hypothetical (5% return before expenses) | $1,000.00 | $1,021.17 | 0.80% | $4.08 |
| First Trust China AlphaDEX® Fund (FCA) |
| Actual | $1,000.00 | $834.80 | 0.80% | $3.70 |
| Hypothetical (5% return before expenses) | $1,000.00 | $1,021.17 | 0.80% | $4.08 |
First Trust Exchange-Traded AlphaDEX® Fund II
Understanding Your Fund Expenses (Continued)
December 31, 2018 (Unaudited)
| | Beginning
Account Value
July 1, 2018 | Ending
Account Value
December 31, 2018 | Annualized
Expense Ratio
Based on the
Six-Month
Period | Expenses Paid
During the
Six-Month
Period (a) |
| First Trust Japan AlphaDEX® Fund (FJP) |
| Actual | $1,000.00 | $878.70 | 0.80% | $3.79 |
| Hypothetical (5% return before expenses) | $1,000.00 | $1,021.17 | 0.80% | $4.08 |
| First Trust South Korea AlphaDEX® Fund (FKO) |
| Actual | $1,000.00 | $892.80 | 0.80% | $3.82 |
| Hypothetical (5% return before expenses) | $1,000.00 | $1,021.17 | 0.80% | $4.08 |
| First Trust Developed Markets ex-US AlphaDEX® Fund (FDT) |
| Actual | $1,000.00 | $827.20 | 0.80% | $3.68 |
| Hypothetical (5% return before expenses) | $1,000.00 | $1,021.17 | 0.80% | $4.08 |
| First Trust Emerging Markets AlphaDEX® Fund (FEM) |
| Actual | $1,000.00 | $893.20 | 0.80% | $3.82 |
| Hypothetical (5% return before expenses) | $1,000.00 | $1,021.17 | 0.80% | $4.08 |
| First Trust Germany AlphaDEX® Fund (FGM) |
| Actual | $1,000.00 | $814.00 | 0.80% | $3.66 |
| Hypothetical (5% return before expenses) | $1,000.00 | $1,021.17 | 0.80% | $4.08 |
| First Trust Canada AlphaDEX® Fund (FCAN) |
| Actual | $1,000.00 | $786.80 | 0.80% | $3.60 |
| Hypothetical (5% return before expenses) | $1,000.00 | $1,021.17 | 0.80% | $4.08 |
| First Trust Australia AlphaDEX® Fund (FAUS) |
| Actual | $1,000.00 | $856.70 | 0.80% | $3.74 |
| Hypothetical (5% return before expenses) | $1,000.00 | $1,021.17 | 0.80% | $4.08 |
| First Trust United Kingdom AlphaDEX® Fund (FKU) |
| Actual | $1,000.00 | $809.30 | 0.80% | $3.65 |
| Hypothetical (5% return before expenses) | $1,000.00 | $1,021.17 | 0.80% | $4.08 |
| First Trust India NIFTY 50 Equal Weight ETF (NFTY) |
| Actual | $1,000.00 | $969.80 | 0.80% | $3.97 |
| Hypothetical (5% return before expenses) | $1,000.00 | $1,021.17 | 0.80% | $4.08 |
| First Trust Hong Kong AlphaDEX® Fund (FHK) |
| Actual | $1,000.00 | $883.70 | 0.80% | $3.80 |
| Hypothetical (5% return before expenses) | $1,000.00 | $1,021.17 | 0.80% | $4.08 |
| First Trust Switzerland AlphaDEX® Fund (FSZ) |
| Actual | $1,000.00 | $868.20 | 0.80% | $3.77 |
| Hypothetical (5% return before expenses) | $1,000.00 | $1,021.17 | 0.80% | $4.08 |
| First Trust Developed Markets ex-US Small Cap AlphaDEX® Fund (FDTS) |
| Actual | $1,000.00 | $805.80 | 0.80% | $3.64 |
| Hypothetical (5% return before expenses) | $1,000.00 | $1,021.17 | 0.80% | $4.08 |
| First Trust Emerging Markets Small Cap AlphaDEX® Fund (FEMS) |
| Actual | $1,000.00 | $862.20 | 0.80% | $3.76 |
| Hypothetical (5% return before expenses) | $1,000.00 | $1,021.17 | 0.80% | $4.08 |
| First Trust Eurozone AlphaDEX® ETF (FEUZ) |
| Actual | $1,000.00 | $824.40 | 0.80% | $3.68 |
| Hypothetical (5% return before expenses) | $1,000.00 | $1,021.17 | 0.80% | $4.08 |
| (a) | Expenses are equal to the annualized expense ratios as indicated in the table multiplied by the average account value over the period (July 1, 2018 through December 31, 2018), multiplied by 184/365 (to reflect the six-month period). |
First Trust Asia Pacific ex-Japan AlphaDEX® Fund (FPA)
Portfolio of Investments
December 31, 2018
| Shares | | Description | | Value |
| COMMON STOCKS (a) – 89.6% |
| | | Australia – 20.0% | | |
| 16,099 | | AGL Energy Ltd. | | $233,590 |
| 67,464 | | Atlas Arteria Ltd. | | 297,464 |
| 366,745 | | Beach Energy Ltd. | | 347,436 |
| 9,065 | | BHP Group Ltd. | | 218,556 |
| 36,977 | | BlueScope Steel Ltd. | | 285,450 |
| 43,202 | | Brambles Ltd. | | 308,858 |
| 15,281 | | CIMIC Group Ltd. | | 467,229 |
| 7,868 | | Computershare Ltd. | | 95,264 |
| 1,561 | | CSL Ltd. | | 203,582 |
| 99,472 | | Downer EDI Ltd. | | 473,627 |
| 80,085 | | Fortescue Metals Group Ltd. | | 236,349 |
| 39,439 | | Incitec Pivot Ltd. | | 91,115 |
| 11,338 | | Magellan Financial Group Ltd. | | 187,989 |
| 75,647 | | Northern Star Resources Ltd. | | 492,325 |
| 42,347 | | QBE Insurance Group Ltd. | | 301,254 |
| 86,483 | | Santos Ltd. | | 333,810 |
| 34,682 | | Seven Group Holdings Ltd. | | 346,393 |
| 120,128 | | South32 Ltd. | | 283,451 |
| 30,233 | | Washington H Soul Pattinson & Co., Ltd. | | 530,023 |
| 57,708 | | Whitehaven Coal Ltd. | | 175,593 |
| 23,049 | | WorleyParsons Ltd. | | 185,399 |
| | | | | 6,094,757 |
| | | Bermuda – 5.7% | | |
| 85,800 | | Hongkong Land Holdings Ltd. | | 540,540 |
| 133,674 | | Kerry Properties Ltd. | | 456,648 |
| 525,671 | | Nine Dragons Paper Holdings Ltd. | | 486,701 |
| 115,289 | | NWS Holdings Ltd. | | 236,452 |
| | | | | 1,720,341 |
| | | Cayman Islands – 8.0% | | |
| 75,675 | | CK Asset Holdings Ltd. | | 553,755 |
| 9,838 | | CK Hutchison Holdings Ltd. | | 94,479 |
| 199,692 | | Jiayuan International Group Ltd. | | 369,266 |
| 174,755 | | Kingboard Holdings Ltd. | | 466,430 |
| 367,201 | | Lee & Man Paper Manufacturing Ltd. | | 311,374 |
| 217,195 | | NagaCorp Ltd. | | 233,546 |
| 52,373 | | Wharf Real Estate Investment Co., Ltd. | | 313,348 |
| 89,244 | | Xinyi Glass Holdings Ltd. | | 98,698 |
| | | | | 2,440,896 |
| | | Hong Kong – 17.6% | | |
| 12,714 | | AIA Group Ltd. | | 105,537 |
| 19,460 | | CLP Holdings Ltd. | | 219,936 |
| 128,496 | | Hang Lung Group Ltd. | | 327,209 |
| 115,812 | | Hang Lung Properties Ltd. | | 220,665 |
| 4,136 | | Hang Seng Bank Ltd. | | 92,856 |
| 90,130 | | Henderson Land Development Co., Ltd. | | 448,895 |
| 67,692 | | Hysan Development Co., Ltd. | | 322,014 |
| 332,898 | | New World Development Co., Ltd. | | 440,435 |
| Shares | | Description | | Value |
|
| | | Hong Kong (Continued) | | |
| 265,692 | | Sino Land Co., Ltd. | | $455,346 |
| 87,319 | | Sun Art Retail Group Ltd. | | 88,986 |
| 31,032 | | Sun Hung Kai Properties Ltd. | | 442,267 |
| 51,971 | | Swire Pacific Ltd., Class A | | 548,880 |
| 71,022 | | Techtronic Industries Co., Ltd. | | 377,309 |
| 133,692 | | Vitasoy International Holdings Ltd. | | 509,636 |
| 167,176 | | Wharf Holdings (The) Ltd. | | 435,526 |
| 56,821 | | Wheelock & Co., Ltd. | | 324,722 |
| | | | | 5,360,219 |
| | | New Zealand – 1.2% | | |
| 48,947 | | Ryman Healthcare Ltd. | | 352,844 |
| | | Singapore – 3.4% | | |
| 150,700 | | Sembcorp Industries Ltd. | | 280,845 |
| 16,000 | | Singapore Airlines Ltd. | | 110,584 |
| 47,900 | | Singapore Telecommunications Ltd. | | 102,973 |
| 67,500 | | UOL Group Ltd. | | 306,559 |
| 250,300 | | Yangzijiang Shipbuilding Holdings Ltd. | | 229,557 |
| | | | | 1,030,518 |
| | | South Korea – 33.7% | | |
| 1,133 | | CJ CheilJedang Corp. | | 335,595 |
| 934 | | CJ Corp. | | 101,704 |
| 140 | | CJ Corp. (Preference Shares) (b) (c) | | 4,642 |
| 1,730 | | DB Insurance Co., Ltd. | | 109,152 |
| 3,118 | | Doosan Bobcat, Inc. | | 88,024 |
| 1,214 | | E-MART, Inc. | | 198,562 |
| 12,045 | | GS Engineering & Construction Corp. | | 472,279 |
| 6,859 | | GS Holdings Corp. | | 317,193 |
| 5,029 | | Hankook Tire Co., Ltd. | | 180,959 |
| 2,098 | | HLB, Inc. (c) | | 150,233 |
| 2,322 | | Hotel Shilla Co., Ltd. | | 159,198 |
| 7,466 | | Hyundai Engineering & Construction Co., Ltd. | | 365,338 |
| 311 | | Hyundai Heavy Industries Holdings Co., Ltd. (c) | | 96,438 |
| 3,003 | | Hyundai Marine & Fire Insurance Co., Ltd. | | 110,480 |
| 973 | | Hyundai Motor Co. | | 103,334 |
| 6,689 | | Hyundai Steel Co. | | 271,265 |
| 8,261 | | Industrial Bank of Korea | | 104,021 |
| 14,356 | | Kia Motors Corp. | | 433,588 |
| 4,292 | | Korea Electric Power Corp. | | 127,321 |
| 8,302 | | Korea Gas Corp. (c) | | 358,627 |
| 8,677 | | LG Corp. | | 543,576 |
| 6,596 | | LG Display Co., Ltd. | | 106,702 |
| 3,549 | | LG Electronics, Inc. | | 198,156 |
| 34,421 | | LG Uplus Corp. | | 544,480 |
| 2,266 | | Lotte Chemical Corp. | | 562,540 |
| 285 | | NCSoft Corp. | | 119,154 |
Page 46
See Notes to Financial Statements
First Trust Asia Pacific ex-Japan AlphaDEX® Fund (FPA)
Portfolio of Investments (Continued)
December 31, 2018
| Shares | | Description | | Value |
| COMMON STOCKS (a) (Continued) |
| | | South Korea (Continued) | | |
| 390 | | Neoplux Co., Ltd. (c) | | $1,748 |
| 1,284 | | POSCO | | 279,631 |
| 8,629 | | POSCO Chemtech Co., Ltd. | | 492,622 |
| 944 | | Samsung Biologics Co., Ltd. (c) (d) | | 326,991 |
| 2,719 | | Samsung Electro-Mechanics Co., Ltd. | | 252,211 |
| 8,136 | | Samsung Electronics Co., Ltd. | | 282,186 |
| 13,055 | | Samsung Engineering Co., Ltd. (c) | | 205,922 |
| 2,437 | | Samsung SDI Co., Ltd. | | 478,314 |
| 439 | | SK Holdings Co., Ltd. | | 102,294 |
| 8,617 | | SK Hynix, Inc. | | 467,224 |
| 2,343 | | SK Innovation Co., Ltd. | | 376,921 |
| 1,787 | | SK Telecom Co., Ltd. | | 431,615 |
| 4,598 | | S-Oil Corp. | | 402,603 |
| | | | | 10,262,843 |
| | | Total Common Stocks | | 27,262,418 |
| | | (Cost $29,006,213) | | |
| REAL ESTATE INVESTMENT TRUSTS (a) – 9.9% |
| | | Australia – 5.4% | | |
| 59,457 | | Dexus | | 444,750 |
| 90,384 | | GPT (The) Group | | 339,955 |
| 130,263 | | Mirvac Group | | 205,522 |
| 158,153 | | Scentre Group | | 434,441 |
| 119,822 | | Vicinity Centres | | 219,431 |
| | | | | 1,644,099 |
| | | Hong Kong – 3.7% | | |
| 810,440 | | Champion REIT | | 554,749 |
| 57,497 | | Link REIT | | 582,276 |
| | | | | 1,137,025 |
| | | Singapore – 0.8% | | |
| 192,700 | | Mapletree Commercial Trust | | 233,284 |
| | | Total Real Estate Investment Trusts | | 3,014,408 |
| | | (Cost $2,971,158) | | |
| | | Total Investments – 99.5% | | 30,276,826 |
| | | (Cost $31,977,371) (e) | | |
| | | Net Other Assets and Liabilities – 0.5% | | 141,731 |
| | | Net Assets – 100.0% | | $30,418,557 |
|
| (a) | Portfolio securities are categorized based upon their country of incorporation, which can be different from the country categorization of the Fund’s underlying index. For a breakdown of the portfolio securities by sector, please see the Fund Performance Overview. |
| (b) | This security is fair valued by the Advisor’s Pricing Committee in accordance with procedures adopted by the Trust’s Board of Trustees, and in accordance with the provisions of the Investment Company Act of 1940, as amended. At December 31, 2018, securities noted as such are valued at $4,642 or 0.0% of net assets. |
| (c) | Non-income producing security. |
| (d) | This security is restricted in the U.S. and cannot be offered for public sale without first being registered under the Securities Act of 1933, as amended. This security is not restricted on the foreign exchange where it trades freely without any additional registration. As such, it does not require the additional disclosure required of restricted securities. |
| (e) | Aggregate cost for federal income tax purposes was $32,341,809. As of December 31, 2018, the aggregate gross unrealized appreciation for all investments in which there was an excess of value over tax cost was $1,129,955 and the aggregate gross unrealized depreciation for all investments in which there was an excess of tax cost over value was $3,194,938. The net unrealized depreciation was $2,064,983. |
Valuation Inputs
A summary of the inputs used to value the Fund’s investments as of December 31, 2018 is as follows (see Note 2A - Portfolio Valuation in the Notes to Financial Statements):
| | Total
Value at
12/31/2018 | Level 1
Quoted
Prices | Level 2
Significant
Observable
Inputs | Level 3
Significant
Unobservable
Inputs |
| Common Stocks: | | | | |
| South Korea | $ 10,262,843 | $ 10,258,201 | $ 4,642 | $ — |
| Other Country Categories* | 16,999,575 | 16,999,575 | — | — |
| Real Estate Investment Trusts* | 3,014,408 | 3,014,408 | — | — |
| Total Investments | $ 30,276,826 | $ 30,272,184 | $ 4,642 | $— |
| * | See Portfolio of Investments for country breakout. |
See Notes to Financial Statements
Page 47
First Trust Asia Pacific ex-Japan AlphaDEX® Fund (FPA)
Portfolio of Investments (Continued)
December 31, 2018
Currency Exposure
Diversification | % of Total
Investments |
| KRW | 33.9% |
| HKD | 33.4 |
| AUD | 25.5 |
| SGD | 4.2 |
| USD | 1.8 |
| NZD | 1.2 |
| Total | 100.0% |
| Currency Abbreviations |
| AUD | Australian Dollar |
| HKD | Hong Kong Dollar |
| KRW | South Korean Won |
| NZD | New Zealand Dollar |
| SGD | Singapore Dollar |
| USD | United States Dollar |
Page 48
See Notes to Financial Statements
First Trust Europe AlphaDEX® Fund (FEP)
Portfolio of Investments
December 31, 2018
| Shares | | Description | | Value |
| COMMON STOCKS (a) – 94.8% |
| | | Austria – 1.2% | | |
| 42,581 | | OMV AG | | $1,866,109 |
| 83,110 | | Raiffeisen Bank International AG | | 2,113,957 |
| 104,594 | | voestalpine AG | | 3,127,787 |
| | | | | 7,107,853 |
| | | Belgium – 1.2% | | |
| 100,136 | | Proximus S.A.D.P. | | 2,709,942 |
| 18,009 | | Sofina S.A. | | 3,421,086 |
| 13,311 | | UCB S.A. | | 1,087,402 |
| | | | | 7,218,430 |
| | | Bermuda – 0.2% | | |
| 55,820 | | Hiscox Ltd. | | 1,153,312 |
| | | Denmark – 2.9% | | |
| 1,719 | | AP Moller - Maersk A.S., Class B | | 2,158,873 |
| 52,640 | | DSV A.S. | | 3,467,059 |
| 73,699 | | GN Store Nord A.S. | | 2,751,625 |
| 17,628 | | Orsted A.S. (b) | | 1,178,627 |
| 11,198 | | Rockwool International A.S., Class B | | 2,921,292 |
| 29,064 | | Royal Unibrew A.S. | | 2,002,568 |
| 41,456 | | SimCorp A.S. | | 2,834,772 |
| | | | | 17,314,816 |
| | | Finland – 2.4% | | |
| 117,123 | | Amer Sports OYJ | | 5,149,011 |
| 95,438 | | Fortum OYJ | | 2,088,549 |
| 72,360 | | Neste OYJ | | 5,584,580 |
| 60,976 | | UPM-Kymmene OYJ | | 1,547,471 |
| | | | | 14,369,611 |
| | | France – 10.3% | | |
| 116,509 | | Accor S.A. | | 4,953,821 |
| 11,625 | | Alten S.A. | | 968,316 |
| 19,298 | | Arkema S.A. | | 1,657,417 |
| 27,659 | | Bouygues S.A. | | 993,174 |
| 28,433 | | Casino Guichard Perrachon S.A. | | 1,183,852 |
| 83,252 | | Cie de Saint-Gobain | | 2,781,932 |
| 40,046 | | Cie Generale des Etablissements Michelin SCA | | 3,978,030 |
| 31,408 | | Edenred | | 1,155,501 |
| 81,344 | | Engie S.A. | | 1,167,329 |
| 45,542 | | Eurazeo SE | | 3,224,708 |
| 19,890 | | Faurecia S.A. | | 753,631 |
| 9,163 | | Iliad S.A. | | 1,287,642 |
| 16,197 | | Imerys S.A. | | 779,053 |
| 14,255 | | Ipsen S.A. | | 1,843,141 |
| 6,752 | | LVMH Moet Hennessy Louis Vuitton SE | | 1,997,462 |
| 75,020 | | Orange S.A. | | 1,216,681 |
| 221,812 | | Peugeot S.A. | | 4,738,461 |
| 69,158 | | Renault S.A. | | 4,322,421 |
| 34,130 | | Safran S.A. | | 4,121,609 |
| 17,372 | | Sartorius Stedim Biotech | | 1,738,612 |
| Shares | | Description | | Value |
|
| | | France (Continued) | | |
| 103,055 | | SCOR SE | | $4,652,165 |
| 27,885 | | Societe Generale S.A. | | 888,828 |
| 6,320 | | Teleperformance | | 1,010,863 |
| 25,282 | | Thales S.A. | | 2,954,619 |
| 73,806 | | TOTAL S.A. | | 3,905,130 |
| 11,029 | | Ubisoft Entertainment S.A. (c) | | 890,619 |
| 55,088 | | Valeo S.A. | | 1,610,116 |
| | | | | 60,775,133 |
| | | Germany – 15.2% | | |
| 73,765 | | 1&1 Drillisch AG | | 3,760,973 |
| 26,905 | | BASF SE | | 1,861,915 |
| 40,411 | | Bayer AG | | 2,803,983 |
| 53,053 | | Bayerische Motoren Werke AG | | 4,297,533 |
| 58,901 | | Bechtle AG | | 4,578,913 |
| 58,136 | | Brenntag AG | | 2,511,171 |
| 14,233 | | Carl Zeiss Meditec AG | | 1,113,799 |
| 27,499 | | Continental AG | | 3,804,468 |
| 73,733 | | Covestro AG (b) | | 3,647,828 |
| 75,843 | | Daimler AG | | 3,989,447 |
| 243,508 | | Deutsche Lufthansa AG | | 5,496,286 |
| 74,838 | | Deutsche Wohnen SE | | 3,429,826 |
| 33,866 | | Hannover Rueck SE | | 4,566,992 |
| 30,632 | | HeidelbergCement AG | | 1,873,457 |
| 42,880 | | Hella GmbH & Co., KGaA | | 1,709,716 |
| 40,303 | | LEG Immobilien AG | | 4,207,663 |
| 5,306 | | MTU Aero Engines AG | | 962,969 |
| 32,707 | | Nemetschek SE | | 3,588,140 |
| 88,845 | | Porsche Automobil Holding SE (Preference Shares) | | 5,256,650 |
| 7,392 | | Sartorius AG (Preference Shares) | | 922,316 |
| 280,784 | | Schaeffler AG (Preference Shares) | | 2,399,300 |
| 9,752 | | Siltronic AG | | 806,716 |
| 48,070 | | Sixt SE | | 3,811,273 |
| 201,056 | | TAG Immobilien AG | | 4,586,466 |
| 50,564 | | United Internet AG | | 2,213,067 |
| 27,207 | | Volkswagen AG (Preference Shares) | | 4,330,473 |
| 73,454 | | Vonovia SE | | 3,331,891 |
| 27,619 | | Wirecard AG | | 4,202,385 |
| | | | | 90,065,616 |
| | | Ireland – 0.2% | | |
| 78,551 | | Ryanair Holdings PLC (c) | | 967,498 |
| | | Italy – 4.7% | | |
| 689,298 | | A2A S.p.A. | | 1,241,903 |
| 107,657 | | Amplifon S.p.A. | | 1,733,039 |
| 288,188 | | Buzzi Unicem S.p.A | | 4,961,126 |
| 233,569 | | Enel S.p.A. | | 1,349,833 |
| 189,890 | | Eni S.p.A. | | 2,991,104 |
| 178,972 | | FinecoBank Banca Fineco S.p.A. | | 1,799,992 |
| 776,565 | | Saipem S.p.A. (c) | | 2,905,031 |
| 323,285 | | Societa Iniziative Autostradali e Servizi S.p.A. | | 4,467,070 |
See Notes to Financial Statements
Page 49
First Trust Europe AlphaDEX® Fund (FEP)
Portfolio of Investments (Continued)
December 31, 2018
| Shares | | Description | | Value |
| COMMON STOCKS (a) (Continued) |
| | | Italy (Continued) | | |
| 7,881,377 | | Telecom Italia S.p.A. (c) | | $4,364,241 |
| 158,990 | | UniCredit S.p.A. | | 1,802,319 |
| | | | | 27,615,658 |
| | | Jersey – 2.8% | | |
| 1,567,630 | | boohoo Group PLC (c) | | 3,226,934 |
| 46,591 | | Experian PLC | | 1,131,282 |
| 830,115 | | Glencore PLC | | 3,082,671 |
| 597,576 | | Polymetal International PLC | | 6,260,930 |
| 244,851 | | WPP PLC | | 2,642,129 |
| | | | | 16,343,946 |
| | | Luxembourg – 2.2% | | |
| 104,378 | | APERAM S.A. | | 2,756,575 |
| 192,237 | | ArcelorMittal | | 3,995,435 |
| 230,839 | | Grand City Properties S.A. | | 5,011,968 |
| 161,908 | | Subsea 7 S.A. | | 1,578,165 |
| | | | | 13,342,143 |
| | | Netherlands – 4.1% | | |
| 553,239 | | Aegon N.V. | | 2,585,570 |
| 75,273 | | ASR Nederland N.V. | | 2,982,319 |
| 17,810 | | EXOR N.V. | | 964,378 |
| 76,831 | | IMCD Group N.V. | | 4,929,631 |
| 104,347 | | Koninklijke Ahold Delhaize N.V. | | 2,639,189 |
| 22,607 | | Koninklijke DSM N.V. | | 1,850,437 |
| 107,257 | | NN Group N.V. | | 4,276,562 |
| 187,170 | | OCI N.V. (c) | | 3,819,355 |
| | | | | 24,047,441 |
| | | Norway – 5.9% | | |
| 39,813 | | Aker ASA, Class A | | 2,127,289 |
| 141,110 | | Aker BP ASA | | 3,557,738 |
| 212,370 | | Equinor ASA | | 4,513,154 |
| 293,509 | | Leroy Seafood Group ASA | | 2,238,360 |
| 797,957 | | Norsk Hydro ASA | | 3,618,562 |
| 71,980 | | Salmar ASA | | 3,562,996 |
| 63,811 | | Schibsted ASA, Class A | | 2,140,194 |
| 402,192 | | Storebrand ASA | | 2,867,185 |
| 88,175 | | TGS NOPEC Geophysical Co., ASA | | 2,129,294 |
| 192,060 | | Tomra Systems ASA | | 4,326,986 |
| 97,542 | | Yara International ASA | | 3,762,246 |
| | | | | 34,844,004 |
| | | Portugal – 0.3% | | |
| 1,811,371 | | Banco Espirito Santo S.A. (c) (d) (e) (f) | | 0 |
| 120,582 | | Galp Energia SGPS S.A. | | 1,905,873 |
| | | | | 1,905,873 |
| | | Spain – 3.5% | | |
| 66,019 | | Acciona S.A. | | 5,589,890 |
| 83,637 | | Acerinox S.A. | | 830,054 |
| 84,293 | | ACS Actividades de Construccion y Servicios S.A. | | 3,267,258 |
| Shares | | Description | | Value |
|
| | | Spain (Continued) | | |
| 12,867 | | Amadeus IT Group S.A. | | $896,925 |
| 38,238 | | CIE Automotive S.A. | | 939,312 |
| 695,130 | | International Consolidated Airlines Group S.A. | | 5,475,558 |
| 240,150 | | Repsol S.A. | | 3,874,138 |
| | | | | 20,873,135 |
| | | Sweden – 10.4% | | |
| 276,392 | | AAK AB | | 3,826,412 |
| 88,326 | | Alfa Laval AB | | 1,890,006 |
| 214,700 | | Boliden AB | | 4,650,608 |
| 200,700 | | Castellum AB | | 3,699,033 |
| 89,018 | | Elekta AB, Class B | | 1,058,118 |
| 432,234 | | Fabege AB | | 5,762,502 |
| 172,668 | | Fastighets AB Balder, Class B (c) | | 4,909,464 |
| 393,667 | | Hufvudstaden AB, Class A | | 6,080,708 |
| 197,784 | | Kinnevik AB, Class B | | 4,768,891 |
| 133,547 | | Lifco AB, Class B | | 4,934,772 |
| 156,423 | | Lundin Petroleum AB | | 3,907,508 |
| 399,809 | | Nibe Industrier AB, Class B | | 4,101,415 |
| 51,619 | | Saab AB, Class B | | 1,792,668 |
| 714,704 | | SSAB AB, Class A | | 2,458,699 |
| 204,717 | | Swedish Orphan Biovitrum AB (c) | | 4,457,927 |
| 269,909 | | Telefonaktiebolaget LM Ericsson, Class B | | 2,372,947 |
| 67,750 | | Volvo AB, Class B | | 886,343 |
| | | | | 61,558,021 |
| | | Switzerland – 4.0% | | |
| 18,812 | | BKW AG | | 1,314,869 |
| 91,571 | | Clariant AG | | 1,685,339 |
| 26,656 | | Logitech International S.A. | | 838,543 |
| 17,439 | | Lonza Group AG | | 4,518,988 |
| 24,546 | | Panalpina Welttransport Holding AG | | 3,271,468 |
| 9,566 | | Schindler Holding AG | | 1,894,903 |
| 8,196 | | Sika AG | | 1,038,988 |
| 11,993 | | Sonova Holding AG | | 1,959,585 |
| 52,640 | | Sunrise Communications Group AG (b) | | 4,629,899 |
| 22,022 | | Temenos Group AG | | 2,641,564 |
| | | | | 23,794,146 |
| | | United Kingdom – 23.3% | | |
| 487,583 | | 3i Group PLC | | 4,806,474 |
| 213,097 | | Anglo American PLC | | 4,747,260 |
| 112,962 | | Ashtead Group PLC | | 2,356,975 |
| 380,828 | | Babcock International Group PLC | | 2,375,079 |
| 668,346 | | Barratt Developments PLC | | 3,942,472 |
| 152,244 | | Bellway PLC | | 4,880,363 |
| 124,760 | | Berkeley Group Holdings PLC | | 5,532,274 |
| 778,759 | | BP PLC | | 4,922,830 |
| 128,033 | | British American Tobacco PLC | | 4,079,771 |
Page 50
See Notes to Financial Statements
First Trust Europe AlphaDEX® Fund (FEP)
Portfolio of Investments (Continued)
December 31, 2018
| Shares | | Description | | Value |
| COMMON STOCKS (a) (Continued) |
| | | United Kingdom (Continued) | | |
| 407,402 | | BT Group PLC | | $1,236,393 |
| 76,060 | | Bunzl PLC | | 2,296,653 |
| 19,242 | | Carnival PLC | | 922,908 |
| 2,358,496 | | Cobham PLC (c) | | 2,937,599 |
| 69,870 | | easyJet PLC | | 984,072 |
| 809,948 | | Evraz PLC | | 4,960,488 |
| 76,335 | | Fevertree Drinks PLC | | 2,139,552 |
| 63,505 | | Halma PLC | | 1,104,069 |
| 123,217 | | Hargreaves Lansdown PLC | | 2,903,899 |
| 1,799,671 | | Hays PLC | | 3,211,405 |
| 148,822 | | Hikma Pharmaceuticals PLC | | 3,255,055 |
| 268,639 | | HomeServe PLC | | 2,963,535 |
| 1,426,111 | | J Sainsbury PLC | | 4,816,961 |
| 999,594 | | JD Sports Fashion PLC | | 4,444,000 |
| 594,768 | | John Wood Group PLC | | 3,837,458 |
| 51,548 | | Johnson Matthey PLC | | 1,839,029 |
| 711,512 | | Kingfisher PLC | | 1,881,803 |
| 520,299 | | Man Group PLC | | 882,020 |
| 463,888 | | National Grid PLC | | 4,518,498 |
| 206,278 | | Pearson PLC | | 2,467,259 |
| 77,607 | | Persimmon PLC | | 1,909,115 |
| 13,103 | | Reckitt Benckiser Group PLC | | 1,004,236 |
| 94,644 | | Rio Tinto PLC | | 4,499,620 |
| 102,386 | | Royal Dutch Shell PLC, Class B | | 3,053,728 |
| 192,375 | | Royal Mail PLC | | 667,192 |
| 115,454 | | RPC Group PLC | | 959,468 |
| 154,716 | | Spectris PLC | | 4,494,211 |
| 50,296 | | Spirax-Sarco Engineering PLC | | 4,000,294 |
| 633,263 | | SSP Group PLC | | 5,225,534 |
| 403,297 | | Tate & Lyle PLC | | 3,392,679 |
| 1,602,737 | | Taylor Wimpey PLC | | 2,783,381 |
| 1,394,356 | | Tullow Oil PLC (c) | | 3,183,048 |
| 109,913 | | Victrex PLC | | 3,205,376 |
| 1,673,902 | | Vodafone Group PLC | | 3,262,206 |
| 58,385 | | Whitbread PLC | | 3,407,578 |
| 707,688 | | Wm Morrison Supermarkets PLC | | 1,923,556 |
| | | | | 138,217,376 |
| | | Total Common Stocks | | 561,514,012 |
| | | (Cost $634,366,594) | | |
| REAL ESTATE INVESTMENT TRUSTS (a) – 4.9% |
| | | France – 1.2% | | |
| 22,981 | | Covivio | | 2,217,027 |
| 14,310 | | Gecina S.A. | | 1,852,712 |
| 101,247 | | Klepierre S.A. | | 3,127,461 |
| | | | | 7,197,200 |
| | | Spain – 1.3% | | |
| 230,296 | | Inmobiliaria Colonial Socimi S.A. | | 2,146,514 |
| 440,961 | | Merlin Properties Socimi S.A. | | 5,448,917 |
| | | | | 7,595,431 |
| | | United Kingdom – 2.4% | | |
| 96,376 | | Derwent London PLC | | 3,504,649 |
| Shares | | Description | | Value |
|
| | | United Kingdom (Continued) | | |
| 719,517 | | Segro PLC | | $5,398,029 |
| 506,828 | | Shaftesbury PLC | | 5,365,055 |
| | | | | 14,267,733 |
| | | Total Real Estate Investment Trusts | | 29,060,364 |
| | | (Cost $31,685,704) | | |
| RIGHTS (a) – 0.0% |
| | | Spain – 0.0% | | |
| 244,560 | | Repsol S.A., expiring 01/09/19 (c) | | 112,082 |
| | | (Cost $112,433) | | |
| | | Total Investments – 99.7% | | 590,686,458 |
| | | (Cost $666,164,731) (g) | | |
| | | Net Other Assets and Liabilities – 0.3% | | 1,899,215 |
| | | Net Assets – 100.0% | | $592,585,673 |
|
| (a) | Portfolio securities are categorized based upon their country of incorporation, which can be different from the country categorization of the Fund’s underlying index. For a breakdown of the portfolio securities by sector, please see the Fund Performance Overview. |
| (b) | This security is restricted in the U.S. and cannot be offered for public sale without first being registered under the Securities Act of 1933, as amended. This security is not restricted on the foreign exchange where it trades freely without any additional registration. As such, it does not require the additional disclosure required of restricted securities. |
| (c) | Non-income producing security. |
| (d) | This security is fair valued by the Advisor’s Pricing Committee in accordance with procedures adopted by the Trust’s Board of Trustees, and in accordance with the provisions of the Investment Company Act of 1940, as amended. At December 31, 2018, securities noted as such are valued at $0 or 0.0% of net assets. |
| (e) | This issuer has filed for protection in bankruptcy court. |
| (f) | This security’s value was determined using significant unobservable inputs (see Note 2A – Portfolio Valuation in the Notes to Financial Statements). |
| (g) | Aggregate cost for federal income tax purposes was $668,001,466. As of December 31, 2018, the aggregate gross unrealized appreciation for all investments in which there was an excess of value over tax cost was $21,131,921 and the aggregate gross unrealized depreciation for all investments in which there was an excess of tax cost over value was $98,446,929. The net unrealized depreciation was $77,315,008. |
See Notes to Financial Statements
Page 51
First Trust Europe AlphaDEX® Fund (FEP)
Portfolio of Investments (Continued)
December 31, 2018
Valuation Inputs
A summary of the inputs used to value the Fund’s investments as of December 31, 2018 is as follows (see Note 2A - Portfolio Valuation in the Notes to Financial Statements):
| | Total
Value at
12/31/2018 | Level 1
Quoted
Prices | Level 2
Significant
Observable
Inputs | Level 3
Significant
Unobservable
Inputs |
| Common Stocks: | | | | |
| Portugal | $ 1,905,873 | $ 1,905,873 | $ — | $ —** |
| Other Country Categories* | 559,608,139 | 559,608,139 | — | — |
| Real Estate Investment Trusts* | 29,060,364 | 29,060,364 | — | — |
| Rights* | 112,082 | 112,082 | — | — |
| Total Investments | $ 590,686,458 | $ 590,686,458 | $— | $—** |
| * | See Portfolio of Investments for country breakout. |
| ** | Investment is valued at $0. |
Currency Exposure
Diversification | % of Total
Investments |
| EUR | 46.8% |
| GBP | 29.7 |
| SEK | 10.4 |
| NOK | 6.2 |
| CHF | 4.0 |
| DKK | 2.9 |
| Total | 100.0% |
| Currency Abbreviations |
| CHF | Swiss Franc |
| DKK | Danish Krone |
| EUR | Euro |
| GBP | British Pound Sterling |
| NOK | Norwegian Krone |
| SEK | Swedish Krona |
Page 52
See Notes to Financial Statements
First Trust Latin America AlphaDEX® Fund (FLN)
Portfolio of Investments
December 31, 2018
| Shares | | Description | | Value |
| COMMON STOCKS (a) – 97.9% |
| | | Brazil – 52.4% | | |
| 48,369 | | Banco do Brasil S.A. | | $580,191 |
| 40,625 | | Braskem S.A., Class A (Preference Shares) | | 496,630 |
| 168,377 | | CCR S.A. | | 486,570 |
| 21,704 | | Cia Brasileira de Distribuicao (Preference Shares) | | 453,484 |
| 100,641 | | Cia de Saneamento Basico do Estado de Sao Paulo | | 817,956 |
| 16,737 | | Engie Brasil Energia S.A. | | 142,593 |
| 138,110 | | Gerdau S.A. (Preference Shares) | | 528,102 |
| 35,728 | | IRB Brasil Resseguros S.A. | | 769,363 |
| 235,061 | | Itausa - Investimentos Itau S.A. (Preference Shares) | | 732,642 |
| 101,242 | | JBS S.A. | | 302,753 |
| 208,256 | | Kroton Educacional S.A. | | 476,612 |
| 7,753 | | Magazine Luiza S.A. | | 362,210 |
| 90,057 | | Petroleo Brasileiro S.A. (Preference Shares) | | 526,993 |
| 40,042 | | Porto Seguro S.A. | | 538,783 |
| 6,559 | | Raia Drogasil S.A. | | 96,716 |
| 63,394 | | Rumo S.A. (b) | | 278,062 |
| 60,564 | | Telefonica Brasil S.A. (Preference Shares) | | 722,408 |
| 161,918 | | TIM Participacoes S.A. | | 495,060 |
| 72,125 | | WEG S.A. | | 326,407 |
| | | | | 9,133,535 |
| | | Chile – 15.0% | | |
| 1,928 | | Banco de Credito e Inversiones S.A. | | 125,181 |
| 1,492,883 | | Banco Santander Chile | | 110,783 |
| 150,326 | | Cencosud S.A. | | 270,760 |
| 2,219,939 | | Colbun S.A. | | 447,826 |
| 118,377 | | Empresas CMPC S.A. | | 375,702 |
| 23,180 | | Empresas COPEC S.A. | | 278,093 |
| 3,099,798 | | Enel Americas S.A. | | 544,921 |
| 2,381,925 | | Enel Chile S.A. | | 229,441 |
| 11,612,539 | | Itau CorpBanca | | 108,730 |
| 12,551 | | Latam Airlines Group S.A. | | 125,011 |
| | | | | 2,616,448 |
| | | Colombia – 4.9% | | |
| 43,319 | | Grupo Argos S.A. | | 225,432 |
| 40,627 | | Grupo de Inversiones Suramericana S.A. | | 401,829 |
| 53,152 | | Interconexion Electrica S.A. ESP | | 228,811 |
| | | | | 856,072 |
| | | Mexico – 25.6% | | |
| 276,415 | | Alfa S.A.B. de C.V., Class A | | 328,996 |
| 18,402 | | Arca Continental S.A.B. de C.V. | | 102,911 |
| 507,602 | | Cemex S.A.B. de C.V. (b) | | 245,384 |
| 31,662 | | El Puerto de Liverpool S.A.B. de C.V. | | 203,295 |
| 48,025 | | Fomento Economico Mexicano S.A.B. de C.V. | | 412,954 |
| Shares | | Description | | Value |
|
| | | Mexico (Continued) | | |
| 21,747 | | Grupo Aeroportuario del Pacifico S.A.B. de C.V., Class B | | $177,214 |
| 17,432 | | Grupo Aeroportuario del Sureste S.A.B. de C.V., Class B | | 262,938 |
| 55,737 | | Grupo Bimbo S.A.B. de C.V., Series A | | 111,180 |
| 71,638 | | Grupo Carso S.A.B. de C.V., Series A1 | | 256,598 |
| 10,421 | | Grupo Elektra S.A.B. de C.V. | | 502,417 |
| 65,729 | | Grupo Financiero Banorte, S.A.B. de C.V., Class O | | 320,856 |
| 75,765 | | Grupo Financiero Inbursa S.A.B. de C.V., Class O | | 109,377 |
| 82,464 | | Grupo Mexico S.A.B. de C.V., Series B | | 170,243 |
| 33,430 | | Grupo Televisa S.A.B., Series CPO | | 84,052 |
| 34,484 | | Industrias Penoles S.A.B. de C.V. | | 421,141 |
| 172,723 | | Mexichem S.A.B. de C.V. | | 438,669 |
| 117,999 | | Wal-Mart de Mexico S.A.B. de C.V. | | 300,105 |
| | | | | 4,448,330 |
| | | Total Common Stocks | | 17,054,385 |
| | | (Cost $17,245,041) | | |
| REAL ESTATE INVESTMENT TRUSTS (a) – 1.7% |
| | | Mexico – 1.7% | | |
| 271,024 | | Fibra Uno Administracion S.A. de C.V. | | 301,341 |
| | | (Cost $454,474) | | |
| | | Total Investments – 99.6% | | 17,355,726 |
| | | (Cost $17,699,515) (c) | | |
| | | Net Other Assets and Liabilities – 0.4% | | 62,551 |
| | | Net Assets – 100.0% | | $17,418,277 |
|
| (a) | Portfolio securities are categorized based upon their country of incorporation, which can be different from the country categorization of the Fund’s underlying index. For a breakdown of the portfolio securities by sector, please see the Fund Performance Overview. |
| (b) | Non-income producing security. |
| (c) | Aggregate cost for federal income tax purposes was $18,139,214. As of December 31, 2018, the aggregate gross unrealized appreciation for all investments in which there was an excess of value over tax cost was $1,489,075 and the aggregate gross unrealized depreciation for all investments in which there was an excess of tax cost over value was $2,272,563. The net unrealized depreciation was $783,488. |
See Notes to Financial Statements
Page 53
First Trust Latin America AlphaDEX® Fund (FLN)
Portfolio of Investments (Continued)
December 31, 2018
Valuation Inputs
A summary of the inputs used to value the Fund’s investments as of December 31, 2018 is as follows (see Note 2A - Portfolio Valuation in the Notes to Financial Statements):
| | Total
Value at
12/31/2018 | Level 1
Quoted
Prices | Level 2
Significant
Observable
Inputs | Level 3
Significant
Unobservable
Inputs |
| Common Stocks* | $ 17,054,385 | $ 17,054,385 | $ — | $ — |
| Real Estate Investment Trusts* | 301,341 | 301,341 | — | — |
| Total Investments | $ 17,355,726 | $ 17,355,726 | $— | $— |
| * | See Portfolio of Investments for country breakout. |
Page 54
See Notes to Financial Statements
First Trust Brazil AlphaDEX® Fund (FBZ)
Portfolio of Investments
December 31, 2018
| Shares | | Description | | Value |
| COMMON STOCKS – 99.4% |
| | | Aerospace & Defense – 2.0% | | |
| 456,787 | | Embraer S.A. | | $2,555,155 |
| | | Banks – 8.0% | | |
| 193,399 | | Banco do Brasil S.A. | | 2,319,840 |
| 751,300 | | Banco do Estado do Rio Grande do Sul S.A., Class B (Preference Shares) | | 4,299,512 |
| 1,207,155 | | Itausa - Investimentos Itau S.A. (Preference Shares) | | 3,762,480 |
| | | | | 10,381,832 |
| | | Chemicals – 2.6% | | |
| 272,895 | | Braskem S.A., Class A (Preference Shares) | | 3,336,068 |
| | | Containers & Packaging – 1.3% | | |
| 424,047 | | Klabin S.A. | | 1,737,436 |
| | | Diversified Consumer
Services – 3.2% | | |
| 114,260 | | Estacio Participacoes S.A. | | 700,462 |
| 1,486,281 | | Kroton Educacional S.A. | | 3,401,487 |
| | | | | 4,101,949 |
| | | Diversified Telecommunication
Services – 2.2% | | |
| 242,280 | | Telefonica Brasil S.A. (Preference Shares) | | 2,889,919 |
| | | Electric Utilities – 15.9% | | |
| 238,836 | | Cia de Transmissao de Energia Electrica Paulista (Preference Shares) | | 4,263,091 |
| 1,518,045 | | Cia Energetica de Minas Gerais (Preference Shares) | | 5,428,653 |
| 631,945 | | Cia Paranaense de Energia, Class B (Preference Shares) | | 4,981,209 |
| 798,967 | | EDP - Energias do Brasil S.A. | | 3,040,641 |
| 49,026 | | Equatorial Energia S.A. | | 943,141 |
| 296,306 | | Transmissora Alianca de Energia Eletrica S.A. | | 1,804,250 |
| | | | | 20,460,985 |
| | | Food & Staples Retailing – 1.7% | | |
| 106,704 | | Cia Brasileira de Distribuicao (Preference Shares) | | 2,229,476 |
| | | Food Products – 5.1% | | |
| 1,191,583 | | JBS S.A. | | 3,563,297 |
| 74,499 | | M. Dias Branco S.A. | | 822,694 |
| 465,612 | | Sao Martinho S.A. | | 2,185,250 |
| | | | | 6,571,241 |
| Shares | | Description | | Value |
|
| | | Gas Utilities – 1.6% | | |
| 140,109 | | Cia de Gas de Sao Paulo - COMGAS, Class A (Preference Shares) | | $2,123,822 |
| | | Health Care Providers &
Services – 0.4% | | |
| 105,377 | | Fleury S.A. | | 537,794 |
| | | Independent Power and
Renewable Electricity Producers – 1.3% | | |
| 202,344 | | Engie Brasil Energia S.A. | | 1,723,898 |
| | | Insurance – 5.2% | | |
| 113,874 | | BB Seguridade Participacoes S.A. | | 810,626 |
| 272,418 | | Porto Seguro S.A. | | 3,665,510 |
| 303,104 | | Sul America S.A. | | 2,236,670 |
| | | | | 6,712,806 |
| | | Internet & Direct Marketing
Retail – 2.6% | | |
| 308,968 | | B2W Cia Digital (a) | | 3,349,761 |
| | | Machinery – 0.6% | | |
| 171,572 | | WEG S.A. | | 776,462 |
| | | Media – 0.9% | | |
| 106,556 | | Smiles Fidelidade S.A. | | 1,203,369 |
| | | Metals & Mining – 14.6% | | |
| 473,908 | | Bradespar S.A. (Preference Shares) | | 3,874,900 |
| 1,057,414 | | Cia Siderurgica Nacional S.A. (a) | | 2,411,802 |
| 995,839 | | Gerdau S.A. (Preference Shares) | | 3,807,865 |
| 1,793,158 | | Metalurgica Gerdau S.A. (Preference Shares) | | 3,210,867 |
| 756,948 | | Usinas Siderurgicas de Minas Gerais S.A., Class A (Preference Shares) | | 1,800,699 |
| 279,338 | | Vale S.A. | | 3,675,737 |
| | | | | 18,781,870 |
| | | Multiline Retail – 5.4% | | |
| 167,141 | | Lojas Americanas S.A. (Preference Shares) | | 849,559 |
| 94,325 | | Lojas Renner S.A. | | 1,031,898 |
| 108,225 | | Magazine Luiza S.A. | | 5,056,131 |
| | | | | 6,937,588 |
| | | Oil, Gas & Consumable Fuels – 3.8% | | |
| 236,252 | | Cosan S.A. | | 2,039,603 |
| 483,498 | | Petroleo Brasileiro S.A. (Preference Shares) | | 2,829,319 |
| | | | | 4,868,922 |
See Notes to Financial Statements
Page 55
First Trust Brazil AlphaDEX® Fund (FBZ)
Portfolio of Investments (Continued)
December 31, 2018
| Shares | | Description | | Value |
| COMMON STOCKS (Continued) |
| | | Paper & Forest Products – 0.8% | | |
| 320,377 | | Duratex S.A. | | $977,891 |
| | | Personal Products – 2.5% | | |
| 274,567 | | Natura Cosmeticos S.A. | | 3,187,903 |
| | | Pharmaceuticals – 0.6% | | |
| 100,939 | | Hypera S.A. | | 786,521 |
| | | Road & Rail – 5.4% | | |
| 350,241 | | Localiza Rent a Car S.A. | | 2,688,427 |
| 982,425 | | Rumo S.A. (a) | | 4,309,159 |
| | | | | 6,997,586 |
| | | Specialty Retail – 0.8% | | |
| 893,207 | | Via Varejo S.A. | | 1,011,721 |
| | | Textiles, Apparel & Luxury
Goods – 5.0% | | |
| 699,602 | | Grendene S.A. | | 1,480,162 |
| 117,381 | | Guararapes Confeccoes S.A. | | 4,923,899 |
| | | | | 6,404,061 |
| | | Transportation Infrastructure – 1.2% | | |
| 547,514 | | CCR S.A. | | 1,582,186 |
| | | Water Utilities – 3.7% | | |
| 594,764 | | Cia de Saneamento Basico do Estado de Sao Paulo | | 4,833,920 |
| | | Wireless Telecommunication
Services – 1.0% | | |
| 420,402 | | TIM Participacoes S.A. | | 1,285,368 |
| | | Total Investments – 99.4% | | 128,347,510 |
| | | (Cost $127,998,641) (b) | | |
| | | Net Other Assets and Liabilities – 0.6% | | 733,666 |
| | | Net Assets – 100.0% | | $129,081,176 |
|
| (a) | Non-income producing security. |
| (b) | Aggregate cost for federal income tax purposes was $130,085,295. As of December 31, 2018, the aggregate gross unrealized appreciation for all investments in which there was an excess of value over tax cost was $6,240,923 and the aggregate gross unrealized depreciation for all investments in which there was an excess of tax cost over value was $7,978,708. The net unrealized depreciation was $1,737,785. |
Valuation Inputs
A summary of the inputs used to value the Fund’s investments as of December 31, 2018 is as follows (see Note 2A - Portfolio Valuation in the Notes to Financial Statements):
| | Total
Value at
12/31/2018 | Level 1
Quoted
Prices | Level 2
Significant
Observable
Inputs | Level 3
Significant
Unobservable
Inputs |
| Common Stocks* | $ 128,347,510 | $ 128,347,510 | $ — | $ — |
| * | See Portfolio of Investments for industry breakout. |
| Country Allocation† | % of Net
Assets |
| Brazil | 99.4% |
| Total Investments | 99.4 |
| Net Other Assets and Liabilities | 0.6 |
| Total | 100.0% |
† Portfolio securities are categorized based upon their country of incorporation, which can be different from the country categorization of the Fund’s underlying index.
Page 56
See Notes to Financial Statements
First Trust China AlphaDEX® Fund (FCA)
Portfolio of Investments
December 31, 2018
| Shares | | Description | | Value |
| COMMON STOCKS – 100.0% |
| | | Automobiles – 4.9% | | |
| 228,484 | | Chongqing Changan Automobile Co., Ltd., Class B | | $101,834 |
| 272,589 | | Dongfeng Motor Group Co., Ltd., Class H | | 247,159 |
| | | | | 348,993 |
| | | Banks – 1.5% | | |
| 193,657 | | Chongqing Rural Commercial Bank Co., Ltd., Class H | | 103,871 |
| | | Capital Markets – 2.8% | | |
| 359,415 | | China Cinda Asset Management Co., Ltd., Class H | | 87,209 |
| 598,715 | | China Huarong Asset Management Co., Ltd., Class H (a) | | 109,337 |
| | | | | 196,546 |
| | | Construction & Engineering – 2.8% | | |
| 113,929 | | China Railway Construction Corp., Ltd., Class H | | 158,006 |
| 56,571 | | China State Construction International Holdings Ltd. | | 44,936 |
| | | | | 202,942 |
| | | Construction Materials – 7.3% | | |
| 40,457 | | Anhui Conch Cement Co., Ltd., Class H | | 196,330 |
| 174,857 | | China National Building Material Co., Ltd., Class H | | 119,690 |
| 227,715 | | China Resources Cement Holdings Ltd. | | 205,018 |
| | | | | 521,038 |
| | | Diversified Telecommunication
Services – 3.5% | | |
| 493,171 | | China Telecom Corp., Ltd., Class H | | 251,923 |
| | | Electronic Equipment,
Instruments & Components – 0.8% | | |
| 6,157 | | Sunny Optical Technology Group Co., Ltd. | | 54,725 |
| | | Food Products – 0.5% | | |
| 24,686 | | Tingyi Cayman Islands Holding Corp. | | 32,976 |
| | | Gas Utilities – 8.7% | | |
| 47,363 | | Beijing Enterprises Holdings Ltd. | | 251,014 |
| 27,429 | | China Resources Gas Group Ltd. | | 108,588 |
| 29,386 | | ENN Energy Holdings Ltd. | | 260,629 |
| | | | | 620,231 |
| Shares | | Description | | Value |
|
| | | Health Care Technology – 2.7% | | |
| 240,000 | | Alibaba Health Information Technology Ltd. (b) | | $194,624 |
| | | Household Durables – 1.7% | | |
| 50,571 | | Haier Electronics Group Co., Ltd. | | 124,385 |
| | | Independent Power and
Renewable Electricity Producers – 5.3% | | |
| 71,979 | | China Longyuan Power Group Corp., Ltd., Class H | | 48,994 |
| 65,700 | | China Resources Power Holdings Co., Ltd. | | 126,357 |
| 145,429 | | Huadian Power International Corp., Ltd., Class H | | 65,560 |
| 520,294 | | Huaneng Renewables Corp., Ltd., Class H | | 139,534 |
| | | | | 380,445 |
| | | Insurance – 2.3% | | |
| 161,143 | | PICC Property & Casualty Co., Ltd., Class H | | 164,837 |
| | | Machinery – 7.0% | | |
| 175,143 | | Sinotruk Hong Kong Ltd. | | 263,928 |
| 208,936 | | Weichai Power Co., Ltd., Class H | | 238,807 |
| | | | | 502,735 |
| | | Metals & Mining – 12.8% | | |
| 319,986 | | Angang Steel Co., Ltd., Class H | | 220,666 |
| 61,286 | | China Hongqiao Group Ltd. | | 34,828 |
| 436,583 | | China Zhongwang Holdings Ltd. | | 193,467 |
| 649,941 | | Maanshan Iron & Steel Co., Ltd., Class H | | 286,354 |
| 412,799 | | MMG Ltd. (b) | | 177,656 |
| | | | | 912,971 |
| | | Oil, Gas & Consumable Fuels – 12.2% | | |
| 193,086 | | China Petroleum & Chemical Corp., Class H | | 137,839 |
| 100,143 | | CNOOC Ltd. | | 154,745 |
| 212,111 | | Inner Mongolia Yitai Coal Co., Ltd., Class B | | 250,715 |
| 66,171 | | Kunlun Energy Co., Ltd. | | 70,139 |
| 304,857 | | PetroChina Co., Ltd., Class H | | 189,988 |
| 87,400 | | Yanzhou Coal Mining Co., Ltd., Class H | | 70,541 |
| | | | | 873,967 |
| | | Pharmaceuticals – 4.2% | | |
| 267,429 | | China Traditional Chinese Medicine Holdings Co., Ltd. | | 155,734 |
See Notes to Financial Statements
Page 57
First Trust China AlphaDEX® Fund (FCA)
Portfolio of Investments (Continued)
December 31, 2018
| Shares | | Description | | Value |
| COMMON STOCKS (Continued) |
| | | Pharmaceuticals (Continued) | | |
| 37,714 | | CSPC Pharmaceutical Group Ltd. | | $54,424 |
| 25,714 | | Guangzhou Baiyunshan Pharmaceutical Holdings Co., Ltd., Class H | | 92,112 |
| | | | | 302,270 |
| | | Real Estate Management &
Development – 7.9% | | |
| 35,229 | | China Overseas Land & Investment Ltd. | | 121,022 |
| 33,155 | | Country Garden Holdings Co., Ltd. | | 40,351 |
| 143,166 | | Guangzhou R&F Properties Co., Ltd., Class H | | 216,472 |
| 43,714 | | Logan Property Holdings Co., Ltd. | | 54,764 |
| 297,933 | | Sino-Ocean Group Holding Ltd. | | 131,265 |
| | | | | 563,874 |
| | | Semiconductors &
Semiconductor Equipment – 1.3% | | |
| 50,571 | | Hua Hong Semiconductor Ltd. (a) | | 93,644 |
| | | Specialty Retail – 2.7% | | |
| 96,420 | | Zhongsheng Group Holdings Ltd. | | 191,104 |
| | | Technology Hardware,
Storage & Peripherals – 0.7% | | |
| 18,929 | | Legend Holdings Corp., Class H (a) | | 49,555 |
| | | Textiles, Apparel & Luxury
Goods – 0.7% | | |
| 4,286 | | Shenzhou International Group Holdings Ltd. | | 48,577 |
| | | Transportation Infrastructure – 2.2% | | |
| 85,029 | | China Merchants Port Holdings Co., Ltd. | | 153,107 |
| | | Wireless Telecommunication
Services – 3.5% | | |
| 26,143 | | China Mobile Ltd. | | 251,564 |
| | | Total Investments – 100.0% | | 7,140,904 |
| | | (Cost $8,646,068) (c) | | |
| | | Net Other Assets and Liabilities – 0.0% | | 827 |
| | | Net Assets – 100.0% | | $7,141,731 |
|
| (a) | This security is restricted in the U.S. and cannot be offered for public sale without first being registered under the Securities Act of 1933, as amended. This security is not restricted on the foreign exchange where it trades freely without any additional registration. As such, it does not require the additional disclosure required of restricted securities. |
| (b) | Non-income producing security. |
| (c) | Aggregate cost for federal income tax purposes was $8,712,037. As of December 31, 2018, the aggregate gross unrealized appreciation for all investments in which there was an excess of value over tax cost was $111,688 and the aggregate gross unrealized depreciation for all investments in which there was an excess of tax cost over value was $1,682,821. The net unrealized depreciation was $1,571,133. |
Valuation Inputs
A summary of the inputs used to value the Fund’s investments as of December 31, 2018 is as follows (see Note 2A - Portfolio Valuation in the Notes to Financial Statements):
| | Total
Value at
12/31/2018 | Level 1
Quoted
Prices | Level 2
Significant
Observable
Inputs | Level 3
Significant
Unobservable
Inputs |
| Common Stocks* | $ 7,140,904 | $ 7,140,904 | $ — | $ — |
| * | See Portfolio of Investments for industry breakout. |
Level 3 Common Stocks, if any, are fair valued by the Advisor’s Pricing Committee and are footnoted in the Portfolio of Investments. The Level 3 Common Stocks values are based on unobservable and non-quantitative inputs.
The following table presents the activity of the Fund’s investments measured at fair value on a recurring basis using significant unobservable inputs (Level 3) for the period presented.
| Beginning Balance at December 31, 2017 | |
| Common Stocks | $—** |
| Net Realized Gain (Loss) | (484,155) |
Net Change in Unrealized
Appreciation/Depreciation | 484,866 |
| Purchases | — |
| Sales | — |
| Common Stocks | (711) |
| Transfers In | — |
| Transfers Out | — |
| Ending Balance at December 31, 2018 | |
| Common Stocks | — |
| Total Level 3 holdings | $— |
| **Investment is valued at $0. | |
Page 58
See Notes to Financial Statements
First Trust China AlphaDEX® Fund (FCA)
Portfolio of Investments (Continued)
December 31, 2018
| Country Allocation† | % of Net
Assets |
| China | 49.7% |
| Hong Kong | 27.1 |
| Cayman Islands | 16.2 |
| Bermuda | 7.0 |
| Total Investments | 100.0 |
| Net Other Assets and Liabilities | 0.0 |
| Total | 100.0% |
† Portfolio securities are categorized based upon their country of incorporation, which can be different from the country categorization of the Fund’s underlying index.
See Notes to Financial Statements
Page 59
First Trust Japan AlphaDEX® Fund (FJP)
Portfolio of Investments
December 31, 2018
| Shares | | Description | | Value |
| COMMON STOCKS – 99.8% |
| | | Air Freight & Logistics – 1.4% | | |
| 79,200 | | Yamato Holdings Co., Ltd. | | $2,185,127 |
| | | Airlines – 3.0% | | |
| 47,700 | | ANA Holdings, Inc. | | 1,715,120 |
| 82,100 | | Japan Airlines Co., Ltd. | | 2,914,567 |
| | | | | 4,629,687 |
| | | Auto Components – 8.7% | | |
| 25,500 | | Aisin Seiki Co., Ltd. | | 888,737 |
| 44,600 | | Bridgestone Corp. | | 1,723,695 |
| 11,900 | | Denso Corp. | | 531,241 |
| 61,300 | | NGK Spark Plug Co., Ltd. | | 1,225,944 |
| 150,400 | | NOK Corp. (a) | | 2,107,699 |
| 156,400 | | Sumitomo Electric Industries Ltd. | | 2,086,190 |
| 146,500 | | Sumitomo Rubber Industries Ltd. | | 1,737,603 |
| 95,000 | | Toyota Boshoku Corp. | | 1,422,335 |
| 10,400 | | Toyota Industries Corp. | | 482,971 |
| 56,100 | | Yokohama Rubber (The) Co., Ltd. | | 1,056,945 |
| | | | | 13,263,360 |
| | | Automobiles – 7.4% | | |
| 99,200 | | Honda Motor Co., Ltd. | | 2,619,720 |
| 237,400 | | Mazda Motor Corp. | | 2,458,364 |
| 365,200 | | Mitsubishi Motors Corp. | | 2,005,843 |
| 299,000 | | Nissan Motor Co., Ltd. | | 2,401,439 |
| 19,900 | | Subaru Corp. | | 428,484 |
| 8,900 | | Toyota Motor Corp. | | 520,171 |
| 46,300 | | Yamaha Motor Co., Ltd. | | 912,018 |
| | | | | 11,346,039 |
| | | Beverages – 0.7% | | |
| 14,500 | | Coca-Cola Bottlers Japan Holdings, Inc. | | 434,583 |
| 12,600 | | Ito En Ltd. | | 566,170 |
| | | | | 1,000,753 |
| | | Building Products – 0.6% | | |
| 30,000 | | AGC, Inc. | | 938,826 |
| | | Capital Markets – 0.3% | | |
| 22,700 | | SBI Holdings, Inc. | | 447,145 |
| | | Chemicals – 13.8% | | |
| 45,800 | | Asahi Kasei Corp. | | 472,186 |
| 210,300 | | Daicel Corp. | | 2,170,059 |
| 57,800 | | Hitachi Chemical Co., Ltd. | | 875,398 |
| 34,200 | | JSR Corp. | | 516,409 |
| 211,400 | | Kuraray Co., Ltd. | | 2,989,553 |
| 278,100 | | Mitsubishi Chemical Holdings Corp. | | 2,112,550 |
| 102,700 | | Mitsubishi Gas Chemical Co., Inc. | | 1,550,737 |
| 65,500 | | Mitsui Chemicals, Inc. | | 1,484,440 |
| 39,200 | | Showa Denko KK (a) | | 1,169,509 |
| 307,800 | | Sumitomo Chemical Co., Ltd. | | 1,496,806 |
| Shares | | Description | | Value |
|
| | | Chemicals (Continued) | | |
| 126,900 | | Teijin Ltd. | | $2,034,244 |
| 162,000 | | Tokai Carbon Co., Ltd. (a) | | 1,844,587 |
| 187,800 | | Tosoh Corp. | | 2,453,625 |
| | | | | 21,170,103 |
| | | Construction & Engineering – 1.0% | | |
| 74,900 | | Kajima Corp. | | 1,010,010 |
| 10,600 | | Taisei Corp. | | 455,025 |
| | | | | 1,465,035 |
| | | Distributors – 1.2% | | |
| 40,300 | | PALTAC CORPORATION | | 1,908,280 |
| | | Diversified Financial Services – 0.7% | | |
| 73,700 | | ORIX Corp. | | 1,079,562 |
| | | Diversified Telecommunication
Services – 0.7% | | |
| 25,600 | | Nippon Telegraph & Telephone Corp. | | 1,046,843 |
| | | Electric Utilities – 5.1% | | |
| 116,400 | | Chubu Electric Power Co., Inc. | | 1,659,367 |
| 180,400 | | Chugoku Electric Power (The) Co., Inc. | | 2,350,360 |
| 624,800 | | Tokyo Electric Power Co., Holdings, Inc. (b) | | 3,722,407 |
| | | | | 7,732,134 |
| | | Electrical Equipment – 0.3% | | |
| 15,200 | | Fuji Electric Co., Ltd. | | 450,016 |
| | | Electronic Equipment,
Instruments & Components – 2.8% | | |
| 27,000 | | Hamamatsu Photonics K.K. | | 910,223 |
| 6,900 | | Murata Manufacturing Co., Ltd. | | 941,467 |
| 38,500 | | Shimadzu Corp. | | 763,642 |
| 22,900 | | TDK Corp. | | 1,612,956 |
| | | | | 4,228,288 |
| | | Food & Staples Retailing – 5.3% | | |
| 108,800 | | Aeon Co., Ltd. | | 2,133,713 |
| 27,500 | | FamilyMart UNY Holdings Co., Ltd. | | 3,490,032 |
| 54,800 | | Welcia Holdings Co., Ltd. | | 2,479,887 |
| | | | | 8,103,632 |
| | | Food Products – 2.4% | | |
| 23,100 | | Kikkoman Corp. | | 1,245,573 |
| 14,400 | | NH Foods Ltd. | | 543,260 |
| 88,900 | | Yamazaki Baking Co., Ltd. | | 1,870,383 |
| | | | | 3,659,216 |
Page 60
See Notes to Financial Statements
First Trust Japan AlphaDEX® Fund (FJP)
Portfolio of Investments (Continued)
December 31, 2018
| Shares | | Description | | Value |
| COMMON STOCKS (Continued) |
| | | Health Care Equipment &
Supplies – 0.7% | | |
| 20,200 | | Terumo Corp. | | $1,147,072 |
| | | Hotels, Restaurants &
Leisure – 1.5% | | |
| 91,900 | | Zensho Holdings Co., Ltd. | | 2,230,318 |
| | | Household Durables – 3.2% | | |
| 210,500 | | Haseko Corp. | | 2,218,215 |
| 60,500 | | Iida Group Holdings Co., Ltd. | | 1,049,318 |
| 34,000 | | Sony Corp. | | 1,652,151 |
| | | | | 4,919,684 |
| | | Independent Power and
Renewable Electricity Producers – 1.0% | | |
| 67,700 | | Electric Power Development Co., Ltd. | | 1,609,655 |
| | | Industrial Conglomerates – 1.4% | | |
| 77,400 | | Toshiba Corp. | | 2,189,134 |
| | | Insurance – 0.4% | | |
| 30,500 | | Sony Financial Holdings, Inc. | | 571,849 |
| | | Internet & Direct Marketing
Retail – 0.8% | | |
| 64,200 | | ZOZO, Inc. | | 1,177,337 |
| | | IT Services – 3.7% | | |
| 38,400 | | Fujitsu Ltd. | | 2,398,840 |
| 40,200 | | GMO Payment Gateway, Inc. | | 1,716,491 |
| 37,900 | | TIS, Inc. | | 1,495,529 |
| | | | | 5,610,860 |
| | | Leisure Products – 1.8% | | |
| 28,100 | | Bandai Namco Holdings, Inc. | | 1,262,648 |
| 33,500 | | Yamaha Corp. | | 1,430,409 |
| | | | | 2,693,057 |
| | | Machinery – 2.5% | | |
| 128,200 | | JTEKT Corp. | | 1,433,997 |
| 282,200 | | NSK Ltd. | | 2,443,390 |
| | | | | 3,877,387 |
| | | Marine – 0.3% | | |
| 29,400 | | Nippon Yusen KK | | 453,587 |
| | | Media – 2.6% | | |
| 48,500 | | CyberAgent, Inc. | | 1,878,404 |
| 145,100 | | Hakuhodo DY Holdings, Inc. | | 2,085,056 |
| | | | | 3,963,460 |
| | | Metals & Mining – 3.4% | | |
| 112,300 | | Hitachi Metals Ltd. | | 1,178,276 |
| 123,300 | | JFE Holdings, Inc. | | 1,976,535 |
| 21,100 | | Mitsubishi Materials Corp. | | 557,315 |
| Shares | | Description | | Value |
|
| | | Metals & Mining (Continued) | | |
| 89,000 | | Nippon Steel & Sumitomo Metal Corp. | | $1,536,723 |
| | | | | 5,248,849 |
| | | Multiline Retail – 0.2% | | |
| 1,600 | | Ryohin Keikaku Co., Ltd. | | 387,573 |
| | | Oil, Gas & Consumable Fuels – 3.2% | | |
| 81,600 | | Idemitsu Kosan Co., Ltd. | | 2,687,615 |
| 418,500 | | JXTG Holdings, Inc. | | 2,201,988 |
| | | | | 4,889,603 |
| | | Personal Products – 2.0% | | |
| 2,600 | | Kose Corp. | | 409,434 |
| 13,200 | | Pola Orbis Holdings, Inc. | | 357,564 |
| 36,700 | | Shiseido Co., Ltd. | | 2,307,708 |
| | | | | 3,074,706 |
| | | Pharmaceuticals – 3.8% | | |
| 54,500 | | Rohto Pharmaceutical Co., Ltd. | | 1,491,720 |
| 137,700 | | Sumitomo Dainippon Pharma Co., Ltd. | | 4,390,872 |
| | | | | 5,882,592 |
| | | Professional Services – 1.0% | | |
| 63,100 | | Recruit Holdings Co., Ltd. | | 1,532,811 |
| | | Real Estate Management &
Development – 0.4% | | |
| 19,600 | | Open House Co., Ltd. | | 663,437 |
| | | Road & Rail – 1.6% | | |
| 16,100 | | Nippon Express Co., Ltd. | | 898,973 |
| 33,200 | | Sankyu, Inc. | | 1,506,957 |
| | | | | 2,405,930 |
| | | Specialty Retail – 0.9% | | |
| 2,600 | | Fast Retailing Co., Ltd. | | 1,337,183 |
| | | Technology Hardware,
Storage & Peripherals – 0.3% | | |
| 29,500 | | Brother Industries Ltd. | | 438,981 |
| | | Trading Companies &
Distributors – 7.1% | | |
| 76,400 | | Marubeni Corp. | | 538,400 |
| 62,900 | | Mitsubishi Corp. | | 1,733,114 |
| 104,900 | | Mitsui & Co., Ltd. | | 1,617,932 |
| 105,200 | | MonotaRO Co., Ltd. | | 2,608,764 |
| 802,000 | | Sojitz Corp. | | 2,795,165 |
| 106,300 | | Sumitomo Corp. | | 1,514,415 |
| | | | | 10,807,790 |
See Notes to Financial Statements
Page 61
First Trust Japan AlphaDEX® Fund (FJP)
Portfolio of Investments (Continued)
December 31, 2018
| Shares | | Description | | Value |
| COMMON STOCKS (Continued) |
| | | Transportation Infrastructure – 0.6% | | |
| 24,900 | | Japan Airport Terminal Co., Ltd. | | $865,554 |
| | | Total Common Stocks | | 152,632,455 |
| | | (Cost $174,934,566) | | |
| MONEY MARKET FUNDS – 0.8% |
| 1,268,225 | | Goldman Sachs Financial Square Treasury Obligations Fund - Institutional Class - 2.61% (c) (d) | | 1,268,225 |
| | | (Cost $1,268,225) | | |
Principal
Value | | Description | | Value |
| REPURCHASE AGREEMENTS – 1.7% |
| $559,582 | | BNP Paribas S.A., 2.95% (c), dated 12/31/18, due 1/2/19, with a maturity value of $559,674. Collateralized by U.S. Treasury Note, interest rate of 2.375%, due 4/30/20. The value of the collateral including accrued interest is $573,037. (d) | | 559,582 |
| 2,013,952 | | JPMorgan Chase & Co., 2.85% (c), dated 12/31/18, due 1/2/19, with a maturity value of $2,014,271. Collateralized by U.S. Treasury Bill, interest rate of 0.000%, due 5/9/19. The value of the collateral including accrued interest is $2,054,191. (d) | | 2,013,952 |
| | | Total Repurchase Agreements | | 2,573,534 |
| | | (Cost $2,573,534) | | |
| | | Total Investments – 102.3% | | 156,474,214 |
| | | (Cost $178,776,325) (e) | | |
| | | Net Other Assets and Liabilities – (2.3)% | | (3,540,511) |
| | | Net Assets – 100.0% | | $152,933,703 |
|
| (a) | All or a portion of this security is on loan (see Note 2D - Securities Lending in the Notes to Financial Statements). The aggregate value of such securities is $3,680,850 and the total value of the collateral held by the Fund is $3,837,219. |
| (b) | Non-income producing security. |
| (c) | Rate shown reflects yield as of December 31, 2018. |
| (d) | This security serves as collateral for securities on loan. |
| (e) | Aggregate cost for federal income tax purposes was $179,427,525. As of December 31, 2018, the aggregate gross unrealized appreciation for all investments in which there was an excess of value over tax cost was $5,210,387 and the aggregate gross unrealized depreciation for all investments in which there was an excess of tax cost over value was $28,163,698. The net unrealized depreciation was $22,953,311. |
Valuation Inputs
A summary of the inputs used to value the Fund’s investments as of December 31, 2018 is as follows (see Note 2A - Portfolio Valuation in the Notes to Financial Statements):
| | Total
Value at
12/31/2018 | Level 1
Quoted
Prices | Level 2
Significant
Observable
Inputs | Level 3
Significant
Unobservable
Inputs |
| Common Stocks* | $ 152,632,455 | $ 152,632,455 | $ — | $ — |
| Money Market Funds | 1,268,225 | 1,268,225 | — | — |
| Repurchase Agreements | 2,573,534 | — | 2,573,534 | — |
| Total Investments | $ 156,474,214 | $ 153,900,680 | $ 2,573,534 | $— |
| * | See Portfolio of Investments for industry breakout. |
Offsetting Assets and Liabilities
Offsetting assets and liabilities requires entities to disclose both gross and net information about instruments and transactions eligible for offset, and to disclose instruments and transactions subject to master netting or similar agreements (see Note 2I – Offsetting on the Statements of Assets and Liabilities in the Notes to Financial Statements).
The Fund’s loaned securities were all subject to an enforceable Securities Lending Agency Agreement. Securities lent in accordance with the Securities Lending Agency Agreement on a gross basis were as follows:
| Security Lending Agency Agreement | |
| Total gross amount presented on the Statements of Assets and Liabilities(1) | $3,680,850 |
| Non-cash Collateral(2) | (3,680,850) |
| Net Amount | $— |
| (1) | The amount presented on the Statements of Assets and Liabilities, which is included in “Investments, at value”, is not offset and is shown on a gross basis. |
| (2) | At December 31, 2018, the value of the collateral received from each borrower exceeded the value of the related securities loaned. This amount is disclosed on the Portfolio of Investments. |
Page 62
See Notes to Financial Statements
First Trust Japan AlphaDEX® Fund (FJP)
Portfolio of Investments (Continued)
December 31, 2018
The Fund’s investments in repurchase agreements were all subject to an enforceable Master Repurchase Agreement. Repurchase Agreements on a gross basis were as follows:
| Repurchase Agreements | |
| Total gross amount presented on the Statements of Assets and Liabilities(3) | $2,573,534 |
| Non-cash Collateral(4) | (2,573,534) |
| Net Amount | $— |
| (3) | The amount is included in “Investments, at value” on the Statements of Assets and Liabilities. |
| (4) | At December 31, 2018, the value of the collateral received from each seller exceeded the value of the repurchase agreements. |
| Country Allocation† | % of Net
Assets |
| Japan | 99.8% |
| United States | 2.5 |
| Total Investments | 102.3 |
| Net Other Assets and Liabilities | (2.3) |
| Total | 100.0% |
† Portfolio securities are categorized based upon their country of incorporation, which can be different from the country categorization of the Fund’s underlying index.
See Notes to Financial Statements
Page 63
First Trust South Korea AlphaDEX® Fund (FKO)
Portfolio of Investments
December 31, 2018
| Shares | | Description | | Value |
| COMMON STOCKS – 99.2% |
| | | Air Freight & Logistics – 1.7% | | |
| 325 | | Hyundai Glovis Co., Ltd. | | $37,574 |
| | | Auto Components – 3.5% | | |
| 1,781 | | Hankook Tire Co., Ltd. | | 64,086 |
| 88 | | Hyundai Mobis Co., Ltd. | | 14,985 |
| | | | | 79,071 |
| | | Automobiles – 5.2% | | |
| 598 | | Hyundai Motor Co. | | 63,509 |
| 1,823 | | Kia Motors Corp. | | 55,059 |
| | | | | 118,568 |
| | | Banks – 6.7% | | |
| 875 | | Hana Financial Group, Inc. | | 28,427 |
| 3,652 | | Industrial Bank of Korea | | 45,986 |
| 710 | | KB Financial Group, Inc. | | 29,589 |
| 433 | | Shinhan Financial Group Co., Ltd. | | 15,367 |
| 2,300 | | Woori Bank | | 32,156 |
| | | | | 151,525 |
| | | Biotechnology – 3.4% | | |
| 188 | | Celltrion, Inc. (a) | | 37,489 |
| 75 | | Medy-Tox, Inc. | | 38,837 |
| | | | | 76,326 |
| | | Capital Markets – 2.1% | | |
| 892 | | Korea Investment Holdings Co., Ltd. | | 47,566 |
| | | Chemicals – 3.7% | | |
| 56 | | LG Chem Ltd. | | 17,415 |
| 269 | | Lotte Chemical Corp. | | 66,780 |
| | | | | 84,195 |
| | | Commercial Services &
Supplies – 0.8% | | |
| 194 | | S-1 Corp. | | 17,474 |
| | | Construction & Engineering – 2.8% | | |
| 1,304 | | Hyundai Engineering & Construction Co., Ltd. | | 63,809 |
| | | Consumer Finance – 1.3% | | |
| 979 | | Samsung Card Co., Ltd. | | 30,314 |
| | | Diversified Financial Services – 0.0% | | |
| 215 | | Neoplux Co., Ltd. (b) | | 963 |
| | | Diversified Telecommunication
Services – 3.7% | | |
| 5,357 | | LG Uplus Corp. | | 84,738 |
| | | Electric Utilities – 2.3% | | |
| 1,758 | | Korea Electric Power Corp. | | 52,151 |
| Shares | | Description | | Value |
|
| | | Electronic Equipment,
Instruments & Components – 9.3% | | |
| 5,123 | | LG Display Co., Ltd. | | $82,873 |
| 631 | | Samsung Electro-Mechanics Co., Ltd. | | 58,531 |
| 350 | | Samsung SDI Co., Ltd. | | 68,695 |
| | | | | 210,099 |
| | | Food & Staples Retailing – 1.6% | | |
| 221 | | E-MART, Inc. | | 36,147 |
| | | Food Products – 1.4% | | |
| 106 | | CJ CheilJedang Corp. | | 31,397 |
| | | Gas Utilities – 2.8% | | |
| 1,460 | | Korea Gas Corp. (b) | | 63,069 |
| | | Hotels, Restaurants &
Leisure – 0.9% | | |
| 717 | | Kangwon Land, Inc. | | 20,563 |
| | | Household Durables – 1.7% | | |
| 678 | | LG Electronics, Inc. | | 37,856 |
| | | Industrial Conglomerates – 6.4% | | |
| 264 | | CJ Corp. | | 28,747 |
| 39 | | CJ Corp. (Preference Shares) (b) (c) | | 1,293 |
| 1,300 | | LG Corp. | | 81,439 |
| 145 | | SK Holdings Co., Ltd. | | 33,788 |
| | | | | 145,267 |
| | | Insurance – 2.2% | | |
| 318 | | DB Insurance Co., Ltd. | | 20,063 |
| 3,538 | | Hanwha Life Insurance Co., Ltd. | | 13,381 |
| 71 | | Samsung Fire & Marine Insurance Co., Ltd. | | 17,117 |
| | | | | 50,561 |
| | | IT Services – 0.8% | | |
| 94 | | Samsung SDS Co., Ltd. | | 17,186 |
| | | Life Sciences Tools &
Services – 1.4% | | |
| 90 | | Samsung Biologics Co., Ltd. (b) (d) | | 31,175 |
| | | Metals & Mining – 6.4% | | |
| 1,426 | | Hyundai Steel Co. | | 57,830 |
| 97 | | Korea Zinc Co., Ltd. | | 37,598 |
| 228 | | POSCO | | 49,654 |
| | | | | 145,082 |
| | | Multiline Retail – 2.4% | | |
| 233 | | Shinsegae, Inc. | | 53,458 |
Page 64
See Notes to Financial Statements
First Trust South Korea AlphaDEX® Fund (FKO)
Portfolio of Investments (Continued)
December 31, 2018
| Shares | | Description | | Value |
| COMMON STOCKS (Continued) |
| | | Oil, Gas & Consumable Fuels – 8.1% | | |
| 1,723 | | GS Holdings Corp. | | $79,680 |
| 371 | | SK Innovation Co., Ltd. | | 59,683 |
| 514 | | S-Oil Corp. | | 45,006 |
| | | | | 184,369 |
| | | Personal Products – 1.7% | | |
| 40 | | LG Household & Health Care, Ltd. | | 39,469 |
| | | Road & Rail – 3.7% | | |
| 558 | | CJ Logistics Corp. (b) | | 83,515 |
| | | Semiconductors &
Semiconductor Equipment – 2.1% | | |
| 875 | | SK Hynix, Inc. | | 47,444 |
| | | Specialty Retail – 2.3% | | |
| 759 | | Hotel Shilla Co., Ltd. | | 52,038 |
| | | Technology Hardware,
Storage & Peripherals – 1.8% | | |
| 1,206 | | Samsung Electronics Co., Ltd. | | 41,828 |
| | | Tobacco – 0.7% | | |
| 175 | | KT&G Corp. | | 15,919 |
| | | Wireless Telecommunication
Services – 4.3% | | |
| 402 | | SK Telecom Co., Ltd. | | 97,095 |
| | | Total Investments – 99.2% | | 2,247,811 |
| | | (Cost $2,192,680) (e) | | |
| | | Net Other Assets and Liabilities – 0.8% | | 19,015 |
| | | Net Assets – 100.0% | | $2,266,826 |
|
| (a) | Non-income producing security that makes payment-in-kind (“PIK”) distributions. For the fiscal year ended December 31, 2018, the Fund received 3 PIK shares of Celltrion, Inc. |
| (b) | Non-income producing security. |
| (c) | This security is fair valued by the Advisor’s Pricing Committee in accordance with procedures adopted by the Trust’s Board of Trustees, and in accordance with the provisions of the Investment Company Act of 1940, as amended. At December 31, 2018, securities noted as such are valued at $1,293 or 0.1% of net assets. |
| (d) | This security is restricted in the U.S. and cannot be offered for public sale without first being registered under the Securities Act of 1933, as amended. This security is not restricted on the foreign exchange where it trades freely without any additional registration. As such, it does not require the additional disclosure required of restricted securities. |
| (e) | Aggregate cost for federal income tax purposes was $2,232,877. As of December 31, 2018, the aggregate gross unrealized appreciation for all investments in which there was an excess of value over tax cost was $208,975 and the aggregate gross unrealized depreciation for all investments in which there was an excess of tax cost over value was $194,041. The net unrealized appreciation was $14,934. |
Valuation Inputs
A summary of the inputs used to value the Fund’s investments as of December 31, 2018 is as follows (see Note 2A - Portfolio Valuation in the Notes to Financial Statements):
| | Total
Value at
12/31/2018 | Level 1
Quoted
Prices | Level 2
Significant
Observable
Inputs | Level 3
Significant
Unobservable
Inputs |
| Common Stocks: | | | | |
| Industrial Conglomerates | $ 145,267 | $ 143,974 | $ 1,293 | $ — |
| Other industry categories* | 2,102,544 | 2,102,544 | — | — |
| Total Investments | $ 2,247,811 | $ 2,246,518 | $ 1,293 | $— |
| * | See Portfolio of Investments for industry breakout. |
| Country Allocation† | % of Net
Assets |
| South Korea | 99.2% |
| Total Investments | 99.2 |
| Net Other Assets and Liabilities | 0.8 |
| Total | 100.0% |
† Portfolio securities are categorized based upon their country of incorporation, which can be different from the country categorization of the Fund’s underlying index.
See Notes to Financial Statements
Page 65
First Trust Developed Markets ex-US AlphaDEX® Fund (FDT)
Portfolio of Investments
December 31, 2018
| Shares | | Description | | Value |
| COMMON STOCKS (a) – 93.4% |
| | | Australia – 4.6% | | |
| 348,613 | | AGL Energy Ltd. | | $5,058,238 |
| 3,970,732 | | Beach Energy Ltd. | | 3,761,676 |
| 500,434 | | BlueScope Steel Ltd. | | 3,863,188 |
| 99,263 | | CIMIC Group Ltd. | | 3,035,049 |
| 1,076,976 | | Downer EDI Ltd. | | 5,127,920 |
| 1,300,618 | | Fortescue Metals Group Ltd. | | 3,838,418 |
| 204,758 | | Northern Star Resources Ltd. | | 1,332,605 |
| 43,156 | | Rio Tinto Ltd. | | 2,385,247 |
| 468,180 | | Santos Ltd. | | 1,807,099 |
| 375,492 | | Seven Group Holdings Ltd. | | 3,750,295 |
| 1,300,618 | | South32 Ltd. | | 3,068,902 |
| 261,868 | | Washington H Soul Pattinson & Co., Ltd. | | 4,590,879 |
| 624,812 | | Whitehaven Coal Ltd. | | 1,901,173 |
| | | | | 43,520,689 |
| | | Austria – 0.3% | | |
| 80,607 | | voestalpine AG | | 2,410,478 |
| | | Belgium – 0.2% | | |
| 12,330 | | Sofina S.A. | | 2,342,273 |
| | | Bermuda – 2.4% | | |
| 929,500 | | Hongkong Land Holdings Ltd. | | 5,855,850 |
| 1,812,179 | | Kerry Properties Ltd. | | 6,190,638 |
| 5,686,520 | | Nine Dragons Paper Holdings Ltd. | | 5,264,960 |
| 1,242,696 | | NWS Holdings Ltd. | | 2,548,713 |
| 884,686 | | Yue Yuen Industrial Holdings Ltd. | | 2,830,136 |
| | | | | 22,690,297 |
| | | Canada – 7.3% | | |
| 172,772 | | Air Canada (b) | | 3,285,351 |
| 123,002 | | Alimentation Couche-Tard, Inc., Class B | | 6,118,566 |
| 512,309 | | Aurora Cannabis, Inc. (b) (c) | | 2,544,283 |
| 82,942 | | Brookfield Asset Management, Inc., Class A | | 3,178,674 |
| 38,210 | | Canada Goose Holdings, Inc. (b) | | 1,670,358 |
| 101,322 | | Canopy Growth Corp. (b) (c) | | 2,717,110 |
| 350,408 | | Husky Energy, Inc. | | 3,621,635 |
| 1,806,190 | | Kinross Gold Corp. (b) | | 5,821,298 |
| 929,499 | | Lundin Mining Corp. | | 3,840,005 |
| 93,707 | | Magna International, Inc. | | 4,253,606 |
| 77,943 | | Methanex Corp. (c) | | 3,748,709 |
| 158,238 | | Metro, Inc. | | 5,487,098 |
| 183,080 | | Parkland Fuel Corp. | | 4,739,267 |
| 14,978 | | Shopify, Inc., Class A (b) | | 2,071,269 |
| 255,976 | | Teck Resources Ltd., Class B | | 5,510,646 |
| 95,223 | | Toromont Industries Ltd. | | 3,784,647 |
| 577,979 | | Turquoise Hill Resources Ltd. (b) | | 952,573 |
| 86,495 | | West Fraser Timber Co., Ltd. | | 4,272,797 |
| 22,482 | | WSP Global, Inc. | | 966,173 |
| | | | | 68,584,065 |
| Shares | | Description | | Value |
|
| | | Cayman Islands – 2.8% | | |
| 819,117 | | CK Asset Holdings Ltd. | | $5,993,922 |
| 106,874 | | CK Hutchison Holdings Ltd. | | 1,026,362 |
| 1,887,998 | | Kingboard Holdings Ltd. | | 5,039,162 |
| 6,626,857 | | Lee & Man Paper Manufacturing Ltd. | | 5,619,351 |
| 3,492,304 | | WH Group Ltd. (d) | | 2,689,304 |
| 762,604 | | Wharf Real Estate Investment Co., Ltd. | | 4,562,671 |
| 973,838 | | Xinyi Glass Holdings Ltd. | | 1,076,998 |
| | | | | 26,007,770 |
| | | Denmark – 0.3% | | |
| 13,527 | | DSV A.S. | | 890,937 |
| 5,742 | | Rockwool International A.S., Class B | | 1,497,951 |
| | | | | 2,388,888 |
| | | Finland – 0.6% | | |
| 60,158 | | Amer Sports OYJ | | 2,644,692 |
| 44,604 | | Neste OYJ | | 3,442,435 |
| | | | | 6,087,127 |
| | | France – 2.3% | | |
| 95,762 | | Accor S.A. | | 4,071,684 |
| 28,494 | | Cie de Saint-Gobain | | 952,150 |
| 10,282 | | Cie Generale des Etablissements Michelin SCA | | 1,021,378 |
| 227,875 | | Peugeot S.A. | | 4,867,982 |
| 56,839 | | Renault S.A. | | 3,552,475 |
| 17,541 | | Safran S.A. | | 2,118,287 |
| 52,926 | | SCOR SE | | 2,389,214 |
| 56,877 | | TOTAL S.A. | | 3,009,404 |
| | | | | 21,982,574 |
| | | Germany – 4.5% | | |
| 40,871 | | Bayerische Motoren Werke AG | | 3,310,736 |
| 60,536 | | Bechtle AG | | 4,706,016 |
| 14,120 | | Continental AG | | 1,953,492 |
| 45,465 | | Covestro AG (d) | | 2,249,312 |
| 58,438 | | Daimler AG | | 3,073,920 |
| 200,127 | | Deutsche Lufthansa AG | | 4,517,121 |
| 17,389 | | Hannover Rueck SE | | 2,344,990 |
| 10,357 | | LEG Immobilien AG | | 1,081,278 |
| 16,804 | | Nemetschek SE | | 1,843,492 |
| 91,261 | | Porsche Automobil Holding SE (Preference Shares) | | 5,399,597 |
| 29,618 | | Sixt SE | | 2,348,290 |
| 103,292 | | TAG Immobilien AG | | 2,356,285 |
| 13,957 | | Volkswagen AG (Preference Shares) | | 2,221,502 |
| 25,156 | | Vonovia SE | | 1,141,082 |
| 22,685 | | Wirecard AG | | 3,451,650 |
| | | | | 41,998,763 |
| | | Hong Kong – 5.4% | | |
| 1,387,428 | | Hang Lung Group Ltd. | | 3,533,020 |
Page 66
See Notes to Financial Statements
First Trust Developed Markets ex-US AlphaDEX® Fund (FDT)
Portfolio of Investments (Continued)
December 31, 2018
| Shares | | Description | | Value |
| COMMON STOCKS (a) (Continued) |
| | | Hong Kong (Continued) | | |
| 1,257,329 | | Hang Lung Properties Ltd. | | $2,395,677 |
| 1,223,019 | | Henderson Land Development Co., Ltd. | | 6,091,277 |
| 972,968 | | Hysan Development Co., Ltd. | | 4,628,447 |
| 3,603,658 | | New World Development Co., Ltd. | | 4,767,754 |
| 3,584,972 | | Sino Land Co., Ltd. | | 6,143,966 |
| 337,853 | | Sun Hung Kai Properties Ltd. | | 4,815,069 |
| 560,950 | | Swire Pacific Ltd., Class A | | 5,924,343 |
| 192,359 | | Techtronic Industries Co., Ltd. | | 1,021,919 |
| 360,594 | | Vitasoy International Holdings Ltd. | | 1,374,590 |
| 2,258,810 | | Wharf Holdings (The) Ltd. | | 5,884,646 |
| 819,433 | | Wheelock & Co., Ltd. | | 4,682,923 |
| | | | | 51,263,631 |
| | | Israel – 0.6% | | |
| 805,631 | | Israel Chemicals Ltd. | | 4,567,656 |
| 10,870 | | Nice, Ltd. (b) | | 1,169,211 |
| | | | | 5,736,867 |
| | | Italy – 1.0% | | |
| 236,836 | | Buzzi Unicem S.p.A | | 4,077,106 |
| 598,352 | | Saipem S.p.A. (b) | | 2,238,359 |
| 83,039 | | Societa Iniziative Autostradali e Servizi S.p.A. | | 1,147,412 |
| 4,048,477 | | Telecom Italia S.p.A. (b) | | 2,241,808 |
| | | | | 9,704,685 |
| | | Japan – 33.4% | | |
| 254,400 | | Aeon Co., Ltd. | | 4,989,123 |
| 29,130 | | AGC, Inc. | | 911,600 |
| 24,500 | | Aisin Seiki Co., Ltd. | | 853,884 |
| 229,800 | | Alfresa Holdings Corp. | | 5,876,825 |
| 27,600 | | Asahi Intecc Co., Ltd. | | 1,168,414 |
| 324,750 | | Asahi Kasei Corp. | | 3,348,091 |
| 64,400 | | Bridgestone Corp. | | 2,488,923 |
| 125,100 | | Brother Industries Ltd. | | 1,861,577 |
| 81,600 | | Chubu Electric Power Co., Inc. | | 1,163,268 |
| 38,300 | | Chugai Pharmaceutical Co., Ltd. | | 2,229,406 |
| 125,100 | | COMSYS Holdings Corp. | | 3,062,299 |
| 149,400 | | Cosmo Energy Holdings Co., Ltd. | | 3,086,005 |
| 5,800 | | Cosmos Pharmaceutical Corp. | | 971,032 |
| 210,600 | | Daicel Corp. | | 2,173,155 |
| 236,600 | | Dai-ichi Life Holdings, Inc. | | 3,708,579 |
| 27,100 | | Daikin Industries Ltd. | | 2,891,606 |
| 33,900 | | DIC Corp. | | 1,042,316 |
| 37,900 | | Eisai Co., Ltd. | | 2,939,882 |
| 133,900 | | Electric Power Development Co., Ltd. | | 3,183,645 |
| 35,300 | | FamilyMart UNY Holdings Co., Ltd. | | 4,479,932 |
| 7,700 | | Fast Retailing Co., Ltd. | | 3,960,120 |
| 123,300 | | Fuji Electric Co., Ltd. | | 3,650,458 |
| 26,700 | | FUJIFILM Holdings Corp. | | 1,040,181 |
| Shares | | Description | | Value |
|
| | | Japan (Continued) | | |
| 68,600 | | Fujitsu Ltd. | | $4,285,427 |
| 39,800 | | GMO Payment Gateway, Inc. (c) | | 1,699,412 |
| 281,100 | | Hakuhodo DY Holdings, Inc. | | 4,039,346 |
| 378,600 | | Haseko Corp. | | 3,989,626 |
| 133,400 | | Hitachi Capital Corp. | | 2,816,364 |
| 36,100 | | Hitachi Ltd. | | 966,850 |
| 163,060 | | Honda Motor Co., Ltd. | | 4,306,165 |
| 93,900 | | Idemitsu Kosan Co., Ltd. | | 3,092,733 |
| 137,386 | | Iida Group Holdings Co., Ltd. | | 2,382,836 |
| 156,200 | | Isuzu Motors Ltd. | | 2,206,794 |
| 101,916 | | Japan Airlines Co., Ltd. | | 3,618,039 |
| 267,900 | | JFE Holdings, Inc. | | 4,294,515 |
| 106,800 | | JGC Corp. | | 1,507,409 |
| 168,900 | | JTEKT Corp. | | 1,889,251 |
| 814,300 | | JXTG Holdings, Inc. | | 4,284,538 |
| 170,100 | | Kajima Corp. | | 2,293,762 |
| 81,800 | | Kansai Electric Power (The) Co., Inc. | | 1,231,422 |
| 95,500 | | Keihan Holdings Co., Ltd. | | 3,899,115 |
| 45,300 | | Keio Corp. | | 2,641,002 |
| 61,200 | | Kikkoman Corp. | | 3,299,959 |
| 578,400 | | Konica Minolta, Inc. | | 5,240,192 |
| 246,300 | | Kuraray Co., Ltd. | | 3,483,098 |
| 42,200 | | Kyowa Exeo Corp. | | 992,579 |
| 101,100 | | Kyushu Electric Power Co., Inc. | | 1,207,426 |
| 670,600 | | Marubeni Corp. | | 4,725,801 |
| 98,800 | | Marui Group Co., Ltd. | | 1,922,726 |
| 307,340 | | Mazda Motor Corp. | | 3,182,618 |
| 256,300 | | Mitsubishi Chemical Holdings Corp. | | 1,946,949 |
| 200,000 | | Mitsubishi Corp. | | 5,510,698 |
| 231,100 | | Mitsubishi Gas Chemical Co., Inc. | | 3,489,535 |
| 41,300 | | Mitsubishi Materials Corp. | | 1,090,858 |
| 277,000 | | Mitsui & Co., Ltd. | | 4,272,328 |
| 147,200 | | Mitsui Chemicals, Inc. | | 3,336,023 |
| 39,800 | | Miura Co., Ltd. | | 909,621 |
| 173,400 | | MonotaRO Co., Ltd. | | 4,299,997 |
| 84,900 | | NGK Spark Plug Co., Ltd. | | 1,697,923 |
| 116,300 | | Nippon Steel & Sumitomo Metal Corp. | | 2,008,100 |
| 55,358 | | Nippon Telegraph & Telephone Corp. | | 2,263,716 |
| 22,300 | | Nissan Chemical Corp. | | 1,171,917 |
| 394,700 | | Nissan Motor Co., Ltd. | | 3,170,060 |
| 213,700 | | NSK Ltd. | | 1,850,292 |
| 443,100 | | NTT Data Corp. | | 4,871,452 |
| 676,600 | | Oji Holdings Corp. | | 3,487,788 |
| 75,800 | | ORIX Corp. | | 1,110,323 |
| 122,400 | | Park24 Co., Ltd. | | 2,694,687 |
| 20,800 | | Pigeon Corp. | | 891,930 |
| 147,000 | | Recruit Holdings Co., Ltd. | | 3,570,891 |
| 197,100 | | Renesas Electronics Corp. (b) | | 899,138 |
| 114,500 | | Ricoh Co., Ltd. | | 1,125,099 |
| 102,900 | | Rohto Pharmaceutical Co., Ltd. | | 2,816,477 |
| 65,100 | | Sankyu, Inc. | | 2,954,906 |
See Notes to Financial Statements
Page 67
First Trust Developed Markets ex-US AlphaDEX® Fund (FDT)
Portfolio of Investments (Continued)
December 31, 2018
| Shares | | Description | | Value |
| COMMON STOCKS (a) (Continued) |
| | | Japan (Continued) | | |
| 198,200 | | SBI Holdings, Inc. | | $3,904,145 |
| 80,900 | | Sekisui House Ltd. | | 1,194,992 |
| 111,200 | | Showa Denko KK (c) | | 3,317,586 |
| 23,500 | | SoftBank Group Corp. | | 1,566,238 |
| 1,362,000 | | Sojitz Corp. | | 4,746,900 |
| 57,500 | | Sompo Holdings, Inc. | | 1,957,849 |
| 99,400 | | Sony Corp. | | 4,830,112 |
| 222,800 | | Sony Financial Holdings, Inc. | | 4,177,309 |
| 85,200 | | SUMCO Corp. | | 953,792 |
| 420,100 | | Sumitomo Chemical Co., Ltd. | | 2,042,911 |
| 147,100 | | Sumitomo Corp. | | 2,095,677 |
| 213,300 | | Sumitomo Dainippon Pharma Co., Ltd. | | 6,801,546 |
| 157,000 | | Sumitomo Electric Industries Ltd. | | 2,094,193 |
| 246,750 | | Sumitomo Rubber Industries Ltd. | | 2,926,646 |
| 77,800 | | Suzuken Co., Ltd. | | 3,967,903 |
| 43,200 | | Suzuki Motor Corp. | | 2,194,192 |
| 148,800 | | T&D Holdings, Inc. | | 1,736,373 |
| 33,600 | | TDK Corp. | | 2,366,607 |
| 192,400 | | Teijin Ltd. | | 3,084,228 |
| 95,600 | | THK Co., Ltd. | | 1,798,524 |
| 73,600 | | TIS, Inc. | | 2,904,247 |
| 130,300 | | Toho Gas Co., Ltd. | | 5,510,155 |
| 249,400 | | Tokai Carbon Co., Ltd. (c) | | 2,839,754 |
| 50,200 | | Tokio Marine Holdings, Inc. | | 2,398,131 |
| 1,251,000 | | Tokyo Electric Power Co., Holdings, Inc. (b) | | 7,453,155 |
| 211,600 | | Toshiba Corp. | | 5,984,763 |
| 400,080 | | Tosoh Corp. | | 5,227,084 |
| 237,500 | | Toyo Seikan Group Holdings Ltd. | | 5,464,851 |
| 19,200 | | Toyota Motor Corp. | | 1,122,168 |
| 163,400 | | Toyota Tsusho Corp. | | 4,837,672 |
| 108,100 | | Welcia Holdings Co., Ltd. | | 4,891,894 |
| 120,500 | | Yamato Holdings Co., Ltd. | | 3,324,593 |
| 114,000 | | Yokohama Rubber (The) Co., Ltd. | | 2,147,803 |
| | | | | 313,884,027 |
| | | Jersey – 0.4% | | |
| 1,207,871 | | boohoo Group PLC (b) | | 2,486,377 |
| 153,469 | | Polymetal International PLC | | 1,607,927 |
| | | | | 4,094,304 |
| | | Luxembourg – 0.8% | | |
| 26,813 | | APERAM S.A. | | 708,119 |
| 158,004 | | ArcelorMittal | | 3,283,940 |
| 142,306 | | Grand City Properties S.A. | | 3,089,743 |
| | | | | 7,081,802 |
| | | Netherlands – 1.1% | | |
| 78,942 | | IMCD Group N.V. | | 5,065,076 |
| 55,097 | | NN Group N.V. | | 2,196,833 |
| Shares | | Description | | Value |
|
| | | Netherlands (Continued) | | |
| 153,814 | | OCI N.V. (b) | | $3,138,699 |
| | | | | 10,400,608 |
| | | New Zealand – 0.2% | | |
| 264,970 | | Ryman Healthcare Ltd. | | 1,910,086 |
| | | Norway – 1.7% | | |
| 13,636 | | Aker ASA, Class A | | 728,599 |
| 115,958 | | Aker BP ASA | | 2,923,593 |
| 174,523 | | Equinor ASA | | 3,708,854 |
| 614,826 | | Norsk Hydro ASA | | 2,788,102 |
| 24,642 | | Salmar ASA | | 1,219,774 |
| 30,190 | | TGS NOPEC Geophysical Co., ASA | | 729,043 |
| 98,658 | | Tomra Systems ASA | | 2,222,700 |
| 50,105 | | Yara International ASA | | 1,932,576 |
| | | | | 16,253,241 |
| | | Portugal – 0.0% | | |
| 81,454 | | Banco Espirito Santo S.A. (b) (e) (f) (g) | | 0 |
| | | Singapore – 1.4% | | |
| 171,800 | | Singapore Airlines Ltd. | | 1,187,392 |
| 1,037,500 | | Singapore Telecommunications Ltd. | | 2,230,364 |
| 974,400 | | UOL Group Ltd. | | 4,425,354 |
| 5,419,700 | | Yangzijiang Shipbuilding Holdings Ltd. | | 4,970,560 |
| | | | | 12,813,670 |
| | | South Korea – 9.8% | | |
| 16,529 | | CJ CheilJedang Corp. | | 4,895,890 |
| 10,212 | | CJ Corp. | | 1,111,990 |
| 1,547 | | CJ Corp. (Preference Shares) (b) (e) | | 51,299 |
| 19,920 | | E-MART, Inc. | | 3,258,111 |
| 131,772 | | GS Engineering & Construction Corp. | | 5,166,719 |
| 100,058 | | GS Holdings Corp. | | 4,627,167 |
| 110,041 | | Hankook Tire Co., Ltd. | | 3,959,622 |
| 61,254 | | Hyundai Engineering & Construction Co., Ltd. | | 2,997,373 |
| 10,605 | | Hyundai Glovis Co., Ltd. | | 1,226,066 |
| 10,212 | | Hyundai Heavy Industries Holdings Co., Ltd. (b) | | 3,166,654 |
| 10,635 | | Hyundai Motor Co. | | 1,129,456 |
| 48,791 | | Hyundai Steel Co. | | 1,978,664 |
| 68,124 | | Korea Gas Corp. (b) | | 2,942,800 |
| 94,918 | | LG Corp. | | 5,946,198 |
| 58,236 | | LG Electronics, Inc. | | 3,251,571 |
| 376,584 | | LG Uplus Corp. | | 5,956,899 |
| 24,794 | | Lotte Chemical Corp. | | 6,155,169 |
| 14,047 | | POSCO | | 3,059,169 |
| 75,518 | | POSCO Chemtech Co., Ltd. | | 4,311,253 |
| 2,568 | | Samsung Biologics Co., Ltd. (b) (d) | | 889,525 |
Page 68
See Notes to Financial Statements
First Trust Developed Markets ex-US AlphaDEX® Fund (FDT)
Portfolio of Investments (Continued)
December 31, 2018
| Shares | | Description | | Value |
| COMMON STOCKS (a) (Continued) |
| | | South Korea (Continued) | | |
| 148,367 | | Samsung Electronics Co., Ltd. | | $5,145,907 |
| 26,661 | | Samsung SDI Co., Ltd. | | 5,232,801 |
| 94,274 | | SK Hynix, Inc. | | 5,111,648 |
| 6,404 | | SK Innovation Co., Ltd. | | 1,030,219 |
| 24,444 | | SK Telecom Co., Ltd. | | 5,903,977 |
| 40,241 | | S-Oil Corp. | | 3,523,522 |
| | | | | 92,029,669 |
| | | Spain – 1.2% | | |
| 54,252 | | Acciona S.A. | | 4,593,567 |
| 28,854 | | ACS Actividades de Construccion y Servicios S.A. | | 1,118,402 |
| 428,473 | | International Consolidated Airlines Group S.A. | | 3,375,093 |
| 123,349 | | Repsol S.A. | | 1,989,886 |
| | | | | 11,076,948 |
| | | Sweden – 4.0% | | |
| 70,981 | | AAK AB | | 982,672 |
| 176,450 | | Boliden AB | | 3,822,076 |
| 68,735 | | Castellum AB | | 1,266,831 |
| 444,037 | | Fabege AB | | 5,919,859 |
| 133,040 | | Fastighets AB Balder, Class B (b) | | 3,782,723 |
| 242,655 | | Hufvudstaden AB, Class A | | 3,748,128 |
| 203,188 | | Kinnevik AB, Class B | | 4,899,190 |
| 82,330 | | Lifco AB, Class B | | 3,042,224 |
| 128,574 | | Lundin Petroleum AB | | 3,211,829 |
| 205,356 | | Nibe Industrier AB, Class B | | 2,106,631 |
| 244,750 | | SSAB AB, Class A | | 841,980 |
| 168,243 | | Swedish Orphan Biovitrum AB (b) | | 3,663,667 |
| | | | | 37,287,810 |
| | | Switzerland – 0.6% | | |
| 14,332 | | Lonza Group AG | | 3,713,867 |
| 27,034 | | Sunrise Communications Group AG (d) | | 2,377,749 |
| | | | | 6,091,616 |
| | | United Kingdom – 6.5% | | |
| 500,930 | | 3i Group PLC | | 4,938,046 |
| 54,729 | | Anglo American PLC | | 1,219,223 |
| 38,695 | | Ashtead Group PLC | | 807,379 |
| 514,956 | | Barratt Developments PLC | | 3,037,647 |
| 93,854 | | Bellway PLC | | 3,008,602 |
| 102,528 | | Berkeley Group Holdings PLC | | 4,546,433 |
| 640,051 | | BP PLC | | 4,046,005 |
| 131,537 | | British American Tobacco PLC | | 4,191,426 |
| 832,112 | | Evraz PLC | | 5,096,231 |
| 26,138 | | Fevertree Drinks PLC | | 732,608 |
| 42,196 | | Hargreaves Lansdown PLC | | 994,448 |
| 924,458 | | Hays PLC | | 1,649,640 |
| 50,976 | | Hikma Pharmaceuticals PLC | | 1,114,954 |
| 879,070 | | J Sainsbury PLC | | 2,969,226 |
| 616,171 | | JD Sports Fashion PLC | | 2,739,376 |
| Shares | | Description | | Value |
|
| | | United Kingdom (Continued) | | |
| 611,040 | | John Wood Group PLC | | $3,942,445 |
| 119,146 | | National Grid PLC | | 1,160,541 |
| 48,607 | | Rio Tinto PLC | | 2,310,902 |
| 35,063 | | Royal Dutch Shell PLC, Class B | | 1,045,776 |
| 39,739 | | Spectris PLC | | 1,154,344 |
| 25,827 | | Spirax-Sarco Engineering PLC | | 2,054,151 |
| 390,346 | | SSP Group PLC | | 3,221,041 |
| 1,074,384 | | Tullow Oil PLC (b) | | 2,452,613 |
| 56,462 | | Victrex PLC | | 1,646,593 |
| 573,230 | | Vodafone Group PLC | | 1,117,147 |
| | | | | 61,196,797 |
| | | Total Common Stocks | | 878,838,685 |
| | | (Cost $1,012,073,379) | | |
| REAL ESTATE INVESTMENT TRUSTS (a) – 6.4% |
| | | Australia – 2.5% | | |
| 804,677 | | Dexus | | 6,019,142 |
| 1,304,783 | | GPT (The) Group | | 4,907,588 |
| 2,115,533 | | Mirvac Group | | 3,337,769 |
| 2,140,381 | | Scentre Group | | 5,879,551 |
| 1,945,954 | | Vicinity Centres | | 3,563,645 |
| | | | | 23,707,695 |
| | | Canada – 0.5% | | |
| 133,313 | | Canadian Apartment Properties REIT | | 4,325,934 |
| | | France – 0.1% | | |
| 34,673 | | Klepierre S.A. | | 1,071,029 |
| | | Hong Kong – 1.3% | | |
| 8,779,146 | | Champion REIT | | 6,009,351 |
| 624,424 | | Link REIT | | 6,323,584 |
| | | | | 12,332,935 |
| | | Singapore – 0.4% | | |
| 3,130,700 | | Mapletree Commercial Trust | | 3,790,055 |
| | | Spain – 0.6% | | |
| 453,003 | | Merlin Properties Socimi S.A. | | 5,597,719 |
| | | United Kingdom – 1.0% | | |
| 739,219 | | Segro PLC | | 5,545,839 |
| 312,402 | | Shaftesbury PLC | | 3,306,948 |
| | | | | 8,852,787 |
| | | Total Real Estate Investment Trusts | | 59,678,154 |
| | | (Cost $60,661,598) | | |
| RIGHTS (a) – 0.0% |
| | | Spain – 0.0% | | |
| 125,933 | | Repsol S.A., expiring 01/09/19 (b) | | 57,715 |
| | | (Cost $57,896) | | |
See Notes to Financial Statements
Page 69
First Trust Developed Markets ex-US AlphaDEX® Fund (FDT)
Portfolio of Investments (Continued)
December 31, 2018
| Shares | | Description | | Value |
| MONEY MARKET FUNDS – 0.4% |
| 3,697,839 | | Goldman Sachs Financial Square Treasury Obligations Fund - Institutional Class - 2.61% (h) (i) | | $3,697,839 |
| | | (Cost $3,697,839) | | |
Principal
Value | | Description | | Value |
| REPURCHASE AGREEMENTS – 0.8% |
| $1,631,608 | | BNP Paribas S.A., 2.95% (h), dated 12/31/18, due 1/2/19, with a maturity value of $1,631,875. Collateralized by U.S. Treasury Note, interest rate of 2.375%, due 4/30/20. The value of the collateral including accrued interest is $1,670,838. (i) | | 1,631,608 |
| 5,872,198 | | JPMorgan Chase & Co., 2.85% (h), dated 12/31/18, due 1/2/19, with a maturity value of $5,873,128. Collateralized by U.S. Treasury Bill, interest rate of 0.000%, due 5/9/19. The value of the collateral including accrued interest is $5,989,527. (i) | | 5,872,198 |
| | | Total Repurchase Agreements | | 7,503,806 |
| | | (Cost $7,503,806) | | |
| | | Total Investments – 101.0% | | 949,776,199 |
| | | (Cost $1,083,994,518) (j) | | |
| | | Net Other Assets and Liabilities – (1.0)% | | (9,143,577) |
| | | Net Assets – 100.0% | | $940,632,622 |
|
| (a) | Portfolio securities are categorized based upon their country of incorporation, which can be different from the country categorization of the Fund’s underlying index. For a breakdown of the portfolio securities by sector, please see the Fund Performance Overview. |
| (b) | Non-income producing security. |
| (c) | All or a portion of this security is on loan (see Note 2D - Securities Lending in the Notes to Financial Statements). The aggregate value of such securities is $10,566,032 and the total value of the collateral held by the Fund is $11,188,407. |
| (d) | This security is restricted in the U.S. and cannot be offered for public sale without first being registered under the Securities Act of 1933, as amended. This security is not restricted on the foreign exchange where it trades freely without any additional registration. As such, it does not require the additional disclosure required of restricted securities. |
| (e) | This security is fair valued by the Advisor’s Pricing Committee in accordance with procedures adopted by the Trust’s Board of Trustees, and in accordance with the provisions of the Investment Company Act of 1940, as amended. At December 31, 2018, securities noted as such are valued at $51,299 or 0.0% of net assets. |
| (f) | This issuer has filed for protection in bankruptcy court. |
| (g) | This security’s value was determined using significant unobservable inputs (see Note 2A – Portfolio Valuation in the Notes to Financial Statements). |
| (h) | Rate shown reflects yield as of December 31, 2018. |
| (i) | This security serves as collateral for securities on loan. |
| (j) | Aggregate cost for federal income tax purposes was $1,089,171,139. As of December 31, 2018, the aggregate gross unrealized appreciation for all investments in which there was an excess of value over tax cost was $21,121,031 and the aggregate gross unrealized depreciation for all investments in which there was an excess of tax cost over value was $160,515,971. The net unrealized depreciation was $139,394,940. |
Valuation Inputs
A summary of the inputs used to value the Fund’s investments as of December 31, 2018 is as follows (see Note 2A - Portfolio Valuation in the Notes to Financial Statements):
| | Total
Value at
12/31/2018 | Level 1
Quoted
Prices | Level 2
Significant
Observable
Inputs | Level 3
Significant
Unobservable
Inputs |
| Common Stocks: | | | | |
| Portugal | $ —** | $ — | $ — | $ —** |
| South Korea | 92,029,669 | 91,978,370 | 51,299 | — |
| Other Country Categories* | 786,809,016 | 786,809,016 | — | — |
| Real Estate Investment Trusts* | 59,678,154 | 59,678,154 | — | — |
| Rights* | 57,715 | 57,715 | — | — |
| Money Market Funds | 3,697,839 | 3,697,839 | — | — |
| Repurchase Agreements | 7,503,806 | — | 7,503,806 | — |
| Total Investments | $ 949,776,199 | $ 942,221,094 | $ 7,555,105 | $—** |
| * | See Portfolio of Investments for country breakout. |
| ** | Investment is valued at $0. |
Offsetting Assets and Liabilities
Offsetting assets and liabilities requires entities to disclose both gross and net information about instruments and transactions eligible for offset, and to disclose instruments and transactions subject to master netting or similar agreements (see Note 2I – Offsetting on the Statements of Assets and Liabilities in the Notes to Financial Statements).
Page 70
See Notes to Financial Statements
First Trust Developed Markets ex-US AlphaDEX® Fund (FDT)
Portfolio of Investments (Continued)
December 31, 2018
The Fund’s loaned securities were all subject to an enforceable Securities Lending Agency Agreement. Securities lent in accordance with the Securities Lending Agency Agreement on a gross basis were as follows:
| Security Lending Agency Agreement | |
| Total gross amount presented on the Statements of Assets and Liabilities(1) | $10,566,032 |
| Non-cash Collateral(2) | (10,566,032) |
| Net Amount | $— |
| (1) | The amount presented on the Statements of Assets and Liabilities, which is included in “Investments, at value”, is not offset and is shown on a gross basis. |
| (2) | At December 31, 2018, the value of the collateral received from each borrower exceeded the value of the related securities loaned. This amount is disclosed on the Portfolio of Investments. |
The Fund’s investments in repurchase agreements were all subject to an enforceable Master Repurchase Agreement. Repurchase Agreements on a gross basis were as follows:
| Repurchase Agreements | |
| Total gross amount presented on the Statements of Assets and Liabilities(3) | $7,503,806 |
| Non-cash Collateral(4) | (7,503,806) |
| Net Amount | $— |
| (3) | The amount is included in “Investments, at value” on the Statements of Assets and Liabilities. |
| (4) | At December 31, 2018, the value of the collateral received from each seller exceeded the value of the repurchase agreements. |
Currency Exposure
Diversification | % of Total
Investments |
| JPY | 33.0% |
| EUR | 12.3 |
| HKD | 11.2 |
| KRW | 9.7 |
| GBP | 8.2 |
| CAD | 7.7 |
| AUD | 7.1 |
| SEK | 3.9 |
| USD | 1.8 |
| SGD | 1.7 |
| NOK | 1.7 |
| CHF | 0.6 |
| ILS | 0.6 |
| DKK | 0.3 |
| NZD | 0.2 |
| Total | 100.0% |
| Currency Abbreviations |
| AUD | Australian Dollar |
| CAD | Canadian Dollar |
| CHF | Swiss Franc |
| DKK | Danish Krone |
| EUR | Euro |
| GBP | British Pound Sterling |
| HKD | Hong Kong Dollar |
| ILS | Israeli Shekel |
| JPY | Japanese Yen |
| KRW | South Korean Won |
| NOK | Norwegian Krone |
| NZD | New Zealand Dollar |
| SEK | Swedish Krona |
| SGD | Singapore Dollar |
| USD | United States Dollar |
See Notes to Financial Statements
Page 71
First Trust Emerging Markets AlphaDEX® Fund (FEM)
Portfolio of Investments
December 31, 2018
| Shares | | Description | | Value |
| COMMON STOCKS (a) – 99.9% |
| | | Bermuda – 2.2% | | |
| 2,246,683 | | Alibaba Health Information Technology Ltd. (b) | | $1,821,906 |
| 2,001,619 | | COSCO SHIPPING Ports Ltd. | | 1,968,261 |
| 4,728,879 | | Kunlun Energy Co., Ltd. | | 5,012,412 |
| 533,244 | | Shenzhen International Holdings Ltd. | | 1,026,923 |
| | | | | 9,829,502 |
| | | Brazil – 9.5% | | |
| 225,712 | | Braskem S.A., Class A (Preference Shares) | | 2,759,268 |
| 100,490 | | Cia Brasileira de Distribuicao (Preference Shares) | | 2,099,640 |
| 745,556 | | Cia de Saneamento Basico do Estado de Sao Paulo | | 6,059,476 |
| 1,278,918 | | Gerdau S.A. (Preference Shares) | | 4,890,296 |
| 330,846 | | IRB Brasil Resseguros S.A. | | 7,124,404 |
| 870,677 | | Itausa - Investimentos Itau S.A. (Preference Shares) | | 2,713,740 |
| 771,389 | | Kroton Educacional S.A. | | 1,765,393 |
| 35,898 | | Magazine Luiza S.A. | | 1,677,108 |
| 416,968 | | Petroleo Brasileiro S.A. (Preference Shares) | | 2,440,001 |
| 296,639 | | Porto Seguro S.A. | | 3,991,414 |
| 560,829 | | Telefonica Brasil S.A. (Preference Shares) | | 6,689,576 |
| 222,628 | | WEG S.A. | | 1,007,520 |
| | | | | 43,217,836 |
| | | Cayman Islands – 4.1% | | |
| 3,115,096 | | Agile Group Holdings Ltd. | | 3,663,883 |
| 6,627,309 | | China Hongqiao Group Ltd. (c) | | 3,766,238 |
| 3,783,443 | | China Resources Cement Holdings Ltd. | | 3,406,331 |
| 1,040,994 | | China State Construction International Holdings Ltd. | | 826,892 |
| 6,748,323 | | China Zhongwang Holdings Ltd. (c) | | 2,990,445 |
| 7,180,317 | | CIFI Holdings Group Co., Ltd. | | 3,814,586 |
| | | | | 18,468,375 |
| | | Chile – 0.8% | | |
| 822,138 | | Empresas CMPC S.A. | | 2,609,281 |
| 71,550 | | Empresas COPEC S.A. | | 858,394 |
| | | | | 3,467,675 |
| | | China – 19.6% | | |
| 6,153,509 | | Angang Steel Co., Ltd., Class H | | 4,243,528 |
| 546,962 | | Anhui Conch Cement Co., Ltd., Class H | | 2,654,308 |
| 2,748,064 | | BAIC Motor Corp. Ltd., Class H (d) | | 1,449,397 |
| 3,214,157 | | BBMG Corp., Class H | | 1,013,852 |
| 4,631,567 | | CGN Power Co., Ltd., Class H (d) | | 1,100,149 |
| Shares | | Description | | Value |
|
| | | China (Continued) | | |
| 8,702,432 | | China Cinda Asset Management Co., Ltd., Class H | | $2,111,566 |
| 5,975,467 | | China Communications Services Corp., Ltd., Class H | | 4,944,898 |
| 2,618,183 | | China Longyuan Power Group Corp., Ltd., Class H | | 1,782,123 |
| 2,478,224 | | China National Building Material Co., Ltd., Class H | | 1,696,352 |
| 1,015,521 | | China Oilfield Services Ltd., Class H | | 872,800 |
| 4,394,632 | | China Petroleum & Chemical Corp., Class H | | 3,137,219 |
| 3,263,168 | | China Railway Construction Corp., Ltd., Class H | | 4,525,637 |
| 4,440,424 | | China Railway Group Ltd., Class H | | 4,043,193 |
| 1,445,582 | | China Shenhua Energy Co., Ltd., Class H | | 3,167,893 |
| 6,643,896 | | China Telecom Corp., Ltd., Class H | | 3,393,855 |
| 5,452,860 | | Chongqing Changan Automobile Co., Ltd., Class B | | 2,430,302 |
| 2,013,377 | | Chongqing Rural Commercial Bank Co., Ltd., Class H | | 1,079,903 |
| 5,344,498 | | Dongfeng Motor Group Co., Ltd., Class H | | 4,845,915 |
| 3,452,846 | | Great Wall Motor Co., Ltd., Class H (c) | | 1,979,858 |
| 2,981,852 | | Guangzhou Automobile Group Co., Ltd., Class H | | 2,974,046 |
| 2,995,572 | | Guangzhou R&F Properties Co., Ltd., Class H | | 4,529,414 |
| 2,853,691 | | Huaxin Cement Co., Ltd., Class B | | 4,865,543 |
| 4,586,493 | | Inner Mongolia Yitai Coal Co., Ltd., Class B | | 5,421,235 |
| 358,959 | | Legend Holdings Corp., Class H (d) | | 939,743 |
| 10,256,681 | | Maanshan Iron & Steel Co., Ltd., Class H (c) | | 4,518,939 |
| 4,075,782 | | PetroChina Co., Ltd., Class H | | 2,540,044 |
| 933,177 | | PICC Property & Casualty Co., Ltd., Class H | | 954,568 |
| 216,582 | | Ping An Insurance Group Co. of China Ltd., Class H | | 1,912,604 |
| 2,891,173 | | Sinopec Engineering Group Co., Ltd., Class H | | 2,374,081 |
| 3,604,872 | | Sinopec Shanghai Petrochemical Co., Ltd., Class H | | 1,579,045 |
| 225,061 | | Sinopharm Group Co., Ltd., Class H | | 945,598 |
| 2,849,939 | | Yanzhou Coal Mining Co., Ltd., Class H | | 2,300,187 |
| 2,646,593 | | Zhejiang Expressway Co., Ltd., Class H | | 2,294,920 |
| | | | | 88,622,715 |
Page 72
See Notes to Financial Statements
First Trust Emerging Markets AlphaDEX® Fund (FEM)
Portfolio of Investments (Continued)
December 31, 2018
| Shares | | Description | | Value |
| COMMON STOCKS (a) (Continued) |
| | | Hong Kong – 8.5% | | |
| 784,901 | | Beijing Enterprises Holdings Ltd. | | $4,159,810 |
| 2,875,682 | | China Merchants Port Holdings Co., Ltd. | | 5,178,101 |
| 334,941 | | China Mobile Ltd. | | 3,223,013 |
| 1,054,241 | | China Overseas Land & Investment Ltd. | | 3,621,618 |
| 2,774,754 | | China Resources Pharmaceutical Group, Ltd. (d) | | 3,621,478 |
| 1,867,705 | | China Resources Power Holdings Co., Ltd. | | 3,592,061 |
| 1,255,477 | | China Taiping Insurance Holdings Co., Ltd. | | 3,447,131 |
| 935,126 | | China Unicom Hong Kong Ltd. | | 998,359 |
| 1,667,764 | | CNOOC Ltd. | | 2,577,095 |
| 6,024,465 | | Lenovo Group Ltd. | | 4,069,909 |
| 2,527,932 | | Sinotruk Hong Kong Ltd. | | 3,809,412 |
| | | | | 38,297,987 |
| | | Hungary – 0.7% | | |
| 306,600 | | MOL Hungarian Oil & Gas PLC | | 3,367,995 |
| | | India – 8.8% | | |
| 214,419 | | Aurobindo Pharma Ltd. | | 2,250,916 |
| 13,290 | | Bajaj Finserv Ltd. | | 1,232,040 |
| 1,963,993 | | DLF Ltd. | | 4,983,476 |
| 73,369 | | HCL Technologies Ltd. | | 1,013,283 |
| 1,042,610 | | Hindalco Industries Ltd. | | 3,367,594 |
| 1,269,625 | | Hindustan Petroleum Corp., Ltd. | | 4,602,766 |
| 109,326 | | Infosys Ltd. | | 1,032,893 |
| 1,045,613 | | JSW Steel Ltd | | 4,605,400 |
| 317,230 | | Reliance Industries Ltd. | | 5,112,985 |
| 73,099 | | Tata Consultancy Services Ltd. | | 1,983,876 |
| 1,427,120 | | Tata Motors Ltd. (b) | | 3,537,393 |
| 686,554 | | Tata Steel Ltd. | | 5,123,464 |
| 107,057 | | Tech Mahindra Ltd. | | 1,106,606 |
| | | | | 39,952,692 |
| | | Indonesia – 2.5% | | |
| 35,762,308 | | Adaro Energy Tbk PT | | 3,021,641 |
| 12,930,806 | | Charoen Pokphand Indonesia Tbk PT | | 6,496,876 |
| 945,588 | | Indah Kiat Pulp & Paper Corp. Tbk PT | | 759,495 |
| 7,291,535 | | Perusahaan Gas Negara Persero Tbk | | 1,074,969 |
| | | | | 11,352,981 |
| | | Malaysia – 0.4% | | |
| 688,500 | | Hartalega Holdings Bhd | | 1,022,962 |
| 294,900 | | Tenaga Nasional Bhd | | 970,512 |
| | | | | 1,993,474 |
| | | Mexico – 2.9% | | |
| 111,178 | | Fomento Economico Mexicano S.A.B. de C.V. | | 955,989 |
| Shares | | Description | | Value |
|
| | | Mexico (Continued) | | |
| 107,613 | | Grupo Aeroportuario del Sureste S.A.B. de C.V., Class B | | $1,623,196 |
| 48,246 | | Grupo Elektra S.A.B. de C.V. | | 2,326,036 |
| 304,328 | | Grupo Financiero Banorte, S.A.B. de C.V., Class O | | 1,485,577 |
| 127,727 | | Industrias Penoles S.A.B. de C.V. | | 1,559,885 |
| 1,279,549 | | Mexichem S.A.B. de C.V. | | 3,249,700 |
| 722,002 | | Wal-Mart de Mexico S.A.B. de C.V. | | 1,836,257 |
| | | | | 13,036,640 |
| | | Poland – 4.7% | | |
| 182,481 | | Cyfrowy Polsat S.A. (b) | | 1,100,050 |
| 270,271 | | Grupa Lotos S.A. | | 6,391,434 |
| 45,548 | | KGHM Polska Miedz S.A. (b) | | 1,081,755 |
| 1,705,216 | | PGE Polska Grupa Energetyczna S.A. (b) | | 4,556,538 |
| 160,728 | | Polski Koncern Naftowy ORLEN S.A. | | 4,644,871 |
| 1,881,798 | | Polskie Gornictwo Naftowe i Gazownictwo S.A. | | 3,474,615 |
| | | | | 21,249,263 |
| | | Russia – 10.6% | | |
| 191,835 | | Bashneft PJSC (Preference Shares) | | 4,907,727 |
| 2,217,278 | | Gazprom PJSC | | 4,884,853 |
| 87,800,195 | | Inter RAO UES PJSC | | 4,888,710 |
| 71,794 | | LUKOIL PJSC | | 5,148,972 |
| 56,410 | | Magnit PJSC | | 2,842,967 |
| 185,185 | | Novatek PJSC | | 3,008,675 |
| 464,777,956 | | RusHydro PJSC | | 3,240,605 |
| 264,308 | | Severstal PJSC | | 3,576,835 |
| 9,470,750 | | Surgutneftegas PJSC (Preference Shares) | | 5,354,865 |
| 431,592 | | Tatneft PJSC | | 4,570,818 |
| 2,191 | | Transneft PJSC (Preference Shares) | | 5,377,266 |
| | | | | 47,802,293 |
| | | Singapore – 0.7% | | |
| 425,807 | | BOC Aviation Ltd. (d) | | 3,151,206 |
| | | South Africa – 3.0% | | |
| 134,896 | | Anglo American Platinum Ltd. | | 5,043,587 |
| 90,368 | | Assore Ltd. | | 1,821,492 |
| 91,650 | | Discovery Ltd. | | 1,017,880 |
| 428,744 | | Exxaro Resources Ltd. | | 4,108,493 |
| 56,914 | | Sasol Ltd. | | 1,681,213 |
| | | | | 13,672,665 |
| | | Taiwan – 9.9% | | |
| 902,469 | | ASE Technology Holding Co., Ltd. | | 1,711,746 |
| 4,050,235 | | Asia Cement Corp. | | 4,473,614 |
| 13,029,824 | | AU Optronics Corp. | | 5,214,134 |
| 300,151 | | Catcher Technology Co., Ltd. | | 2,197,156 |
See Notes to Financial Statements
Page 73
First Trust Emerging Markets AlphaDEX® Fund (FEM)
Portfolio of Investments (Continued)
December 31, 2018
| Shares | | Description | | Value |
| COMMON STOCKS (a) (Continued) |
| | | Taiwan (Continued) | | |
| 8,846,563 | | China Development Financial Holding Corp. | | $2,797,560 |
| 1,318,310 | | China Steel Corp. | | 1,040,083 |
| 1,461,605 | | CTBC Financial Holding Co., Ltd. | | 960,550 |
| 2,824,953 | | Far Eastern New Century Corp. | | 2,564,212 |
| 536,442 | | Feng TAY Enterprise Co., Ltd. | | 3,062,939 |
| 525,265 | | Formosa Chemicals & Fibre Corp. | | 1,794,346 |
| 902,469 | | Foxconn Technology Co., Ltd. | | 1,776,340 |
| 340,548 | | Hon Hai Precision Industry Co., Ltd. | | 784,423 |
| 12,685,640 | | Innolux Corp. | | 4,011,596 |
| 396,424 | | Nan Ya Plastics Corp. | | 973,745 |
| 2,893,026 | | Nanya Technology Corp. | | 5,176,707 |
| 93,772 | | President Chain Store Corp. | | 948,794 |
| 6,244,632 | | United Microelectronics Corp. | | 2,285,588 |
| 6,264,030 | | Yuanta Financial Holding Co., Ltd. | | 3,148,624 |
| | | | | 44,922,157 |
| | | Thailand – 4.3% | | |
| 754,400 | | Electricity Generating PCL | | 5,746,044 |
| 1,476,000 | | Energy Absolute PCL | | 1,926,597 |
| 15,708,600 | | IRPC PCL | | 2,774,092 |
| 1,753,000 | | PTT Global Chemical PCL | | 3,836,034 |
| 1,312,700 | | PTT PCL | | 1,854,552 |
| 1,609,100 | | Thai Oil PCL | | 3,274,044 |
| | | | | 19,411,363 |
| | | Turkey – 6.7% | | |
| 1,911,578 | | Akbank T.A.S. | | 2,477,737 |
| 325,216 | | BIM Birlesik Magazalar A.S. | | 5,346,016 |
| 1,798,930 | | Eregli Demir ve Celik Fabrikalari T.A.S. | | 2,454,091 |
| 402,069 | | Ford Otomotiv Sanayi A.S. | | 3,798,479 |
| 1,163,080 | | KOC Holding A.S. | | 3,120,592 |
| 246,424 | | Tupras Turkiye Petrol Rafinerileri A.S. | | 5,433,667 |
| 1,732,334 | | Turk Hava Yollari AO (b) | | 5,273,104 |
| 1,715,708 | | Turkiye Garanti Bankasi A.S. | | 2,580,451 |
| | | | | 30,484,137 |
| | | Total Common Stocks | | 452,300,956 |
| | | (Cost $478,118,768) | | |
| MONEY MARKET FUNDS – 0.5% |
| 2,307,004 | | Goldman Sachs Financial Square Treasury Obligations Fund - Institutional Class - 2.61% (e) (f) | | 2,307,004 |
| | | (Cost $2,307,004) | | |
Principal
Value | | Description | | Value |
| REPURCHASE AGREEMENTS – 1.1% |
| $1,017,925 | | BNP Paribas S.A., 2.95% (e), dated 12/31/18, due 1/2/19, with a maturity value of $1,018,092. Collateralized by U.S. Treasury Note, interest rate of 2.375%, due 4/30/20. The value of the collateral including accrued interest is $1,042,400. (f) | | $1,017,925 |
| 3,663,541 | | JPMorgan Chase & Co., 2.85% (e), dated 12/31/18, due 1/2/19, with a maturity value of $3,664,121. Collateralized by U.S. Treasury Bill, interest rate of 0.000%, due 5/9/19. The value of the collateral including accrued interest is $3,736,740. (f) | | 3,663,541 |
| | | Total Repurchase Agreements | | 4,681,466 |
| | | (Cost $4,681,466) | | |
| | | Total Investments – 101.5% | | 459,289,426 |
| | | (Cost $485,107,238) (g) | | |
| | | Net Other Assets and Liabilities – (1.5)% | | (6,682,430) |
| | | Net Assets – 100.0% | | $452,606,996 |
|
| (a) | Portfolio securities are categorized based upon their country of incorporation, which can be different from the country categorization of the Fund’s underlying index. For a breakdown of the portfolio securities by sector, please see the Fund Performance Overview. |
| (b) | Non-income producing security. |
| (c) | All or a portion of this security is on loan (see Note 2D - Securities Lending in the Notes to Financial Statements). The aggregate value of such securities is $6,576,493 and the total value of the collateral held by the Fund is $6,980,211. |
| (d) | This security is restricted in the U.S. and cannot be offered for public sale without first being registered under the Securities Act of 1933, as amended. This security is not restricted on the foreign exchange where it trades freely without any additional registration. As such, it does not require the additional disclosure required of restricted securities. |
| (e) | Rate shown reflects yield as of December 31, 2018. |
| (f) | This security serves as collateral for securities on loan. |
| (g) | Aggregate cost for federal income tax purposes was $489,508,833. As of December 31, 2018, the aggregate gross unrealized appreciation for all investments in which there was an excess of value over tax cost was $21,465,684 and the aggregate gross unrealized depreciation for all investments in which there was an excess of tax cost over value was $51,685,091. The net unrealized depreciation was $30,219,407. |
Page 74
See Notes to Financial Statements
First Trust Emerging Markets AlphaDEX® Fund (FEM)
Portfolio of Investments (Continued)
December 31, 2018
Valuation Inputs
A summary of the inputs used to value the Fund’s investments as of December 31, 2018 is as follows (see Note 2A - Portfolio Valuation in the Notes to Financial Statements):
| | Total
Value at
12/31/2018 | Level 1
Quoted
Prices | Level 2
Significant
Observable
Inputs | Level 3
Significant
Unobservable
Inputs |
| Common Stocks: | | | | |
| Thailand | $ 19,411,363 | $ — | $ 19,411,363 | $ — |
| Other Country Categories* | 432,889,593 | 432,889,593 | — | — |
| Money Market Funds | 2,307,004 | 2,307,004 | — | — |
| Repurchase Agreements | 4,681,466 | — | 4,681,466 | — |
| Total Investments | $ 459,289,426 | $ 435,196,597 | $ 24,092,829 | $— |
| * | See Portfolio of Investments for country breakout. |
Offsetting Assets and Liabilities
Offsetting assets and liabilities requires entities to disclose both gross and net information about instruments and transactions eligible for offset, and to disclose instruments and transactions subject to master netting or similar agreements (see Note 2I – Offsetting on the Statements of Assets and Liabilities in the Notes to Financial Statements).
The Fund’s loaned securities were all subject to an enforceable Securities Lending Agency Agreement. Securities lent in accordance with the Securities Lending Agency Agreement on a gross basis were as follows:
| Security Lending Agency Agreement | |
| Total gross amount presented on the Statements of Assets and Liabilities(1) | $6,576,493 |
| Non-cash Collateral(2) | (6,576,493) |
| Net Amount | $— |
| (1) | The amount presented on the Statements of Assets and Liabilities, which is included in “Investments, at value”, is not offset and is shown on a gross basis. |
| (2) | At December 31, 2018, the value of the collateral received from each borrower exceeded the value of the related securities loaned. This amount is disclosed on the Portfolio of Investments. |
The Fund’s investments in repurchase agreements were all subject to an enforceable Master Repurchase Agreement. Repurchase Agreements on a gross basis were as follows:
| Repurchase Agreements | |
| Total gross amount presented on the Statements of Assets and Liabilities(3) | $4,681,466 |
| Non-cash Collateral(4) | (4,681,466) |
| Net Amount | $— |
| (3) | The amount is included in “Investments, at value” on the Statements of Assets and Liabilities. |
| (4) | At December 31, 2018, the value of the collateral received from each seller exceeded the value of the repurchase agreements. |
See Notes to Financial Statements
Page 75
First Trust Germany AlphaDEX® Fund (FGM)
Portfolio of Investments
December 31, 2018
| Shares | | Description | | Value |
| COMMON STOCKS – 99.7% |
| | | Aerospace & Defense – 3.8% | | |
| 29,405 | | MTU Aero Engines AG | | $5,336,619 |
| | | Air Freight & Logistics – 0.8% | | |
| 43,262 | | Deutsche Post AG | | 1,185,157 |
| | | Airlines – 4.8% | | |
| 293,696 | | Deutsche Lufthansa AG | | 6,629,093 |
| | | Auto Components – 3.4% | | |
| 12,376 | | Continental AG | | 1,712,211 |
| 75,627 | | Hella GmbH & Co., KGaA | | 3,015,407 |
| | | | | 4,727,618 |
| | | Automobiles – 15.6% | | |
| 62,348 | | Bayerische Motoren Werke AG | | 5,050,470 |
| 87,794 | | Daimler AG | | 4,618,086 |
| 110,889 | | Porsche Automobil Holding SE (Preference Shares) | | 6,560,917 |
| 34,033 | | Volkswagen AG (Preference Shares) | | 5,416,951 |
| | | | | 21,646,424 |
| | | Capital Markets – 0.9% | | |
| 10,600 | | Deutsche Boerse AG | | 1,274,613 |
| | | Chemicals – 6.3% | | |
| 44,318 | | BASF SE | | 3,066,952 |
| 54,342 | | LANXESS AG | | 2,502,946 |
| 16,112 | | Symrise AG | | 1,190,691 |
| 21,579 | | Wacker Chemie AG | | 1,955,679 |
| | | | | 8,716,268 |
| | | Construction & Engineering – 2.3% | | |
| 23,450 | | HOCHTIEF AG | | 3,162,345 |
| | | Construction Materials – 0.7% | | |
| 16,787 | | HeidelbergCement AG | | 1,026,695 |
| | | Diversified Financial Services – 3.0% | | |
| 49,465 | | GRENKE AG | | 4,205,250 |
| | | Diversified Telecommunication
Services – 1.6% | | |
| 49,328 | | United Internet AG | | 2,158,971 |
| | | Electrical Equipment – 1.1% | | |
| 34,572 | | OSRAM Licht AG | | 1,502,044 |
| | | Entertainment – 2.3% | | |
| 86,062 | | CTS Eventim AG & Co., KGaA | | 3,212,568 |
| | | Health Care Equipment &
Supplies – 2.5% | | |
| 28,338 | | Sartorius AG (Preference Shares) | | 3,535,794 |
| | | Health Care Providers &
Services – 1.2% | | |
| 35,175 | | Fresenius SE & Co., KGaA | | 1,707,988 |
| Shares | | Description | | Value |
|
| | | Internet & Direct Marketing
Retail – 1.9% | | |
| 101,109 | | Zalando SE (a) (b) | | $2,599,576 |
| | | IT Services – 4.8% | | |
| 43,857 | | Wirecard AG | | 6,673,088 |
| | | Life Sciences Tools &
Services – 6.1% | | |
| 57,620 | | MorphoSys AG (a) | | 5,872,311 |
| 77,566 | | QIAGEN N.V. (a) | | 2,637,699 |
| | | | | 8,510,010 |
| | | Machinery – 1.8% | | |
| 4,329 | | Rational AG | | 2,460,136 |
| | | Metals & Mining – 3.3% | | |
| 92,368 | | Aurubis AG | | 4,574,000 |
| | | Multi-Utilities – 3.8% | | |
| 264,371 | | E.ON SE | | 2,613,145 |
| 123,946 | | RWE AG | | 2,693,241 |
| | | | | 5,306,386 |
| | | Pharmaceuticals – 1.9% | | |
| 38,475 | | Bayer AG | | 2,669,650 |
| | | Real Estate Management &
Development – 15.9% | | |
| 116,911 | | Deutsche Wohnen SE | | 5,358,031 |
| 272,038 | | Grand City Properties S.A. | | 5,906,479 |
| 64,999 | | LEG Immobilien AG | | 6,785,944 |
| 89,060 | | Vonovia SE | | 4,039,783 |
| | | | | 22,090,237 |
| | | Road & Rail – 3.6% | | |
| 63,055 | | Sixt SE | | 4,999,372 |
| | | Software – 4.6% | | |
| 46,946 | | Nemetschek SE | | 5,150,237 |
| 12,229 | | SAP SE | | 1,218,009 |
| | | | | 6,368,246 |
| | | Textiles, Apparel & Luxury
Goods – 1.7% | | |
| 6,472 | | adidas AG | | 1,352,550 |
| 15,561 | | HUGO BOSS AG | | 961,340 |
| | | | | 2,313,890 |
| | | Total Investments – 99.7% | | 138,592,038 |
| | | (Cost $164,698,088) (c) | | |
| | | Net Other Assets and Liabilities – 0.3% | | 429,969 |
| | | Net Assets – 100.0% | | $139,022,007 |
|
| (a) | Non-income producing security. |
Page 76
See Notes to Financial Statements
First Trust Germany AlphaDEX® Fund (FGM)
Portfolio of Investments (Continued)
December 31, 2018
| (b) | This security is restricted in the U.S. and cannot be offered for public sale without first being registered under the Securities Act of 1933, as amended. This security is not restricted on the foreign exchange where it trades freely without any additional registration. As such, it does not require the additional disclosure required of restricted securities. |
| (c) | Aggregate cost for federal income tax purposes was $166,360,666. As of December 31, 2018, the aggregate gross unrealized appreciation for all investments in which there was an excess of value over tax cost was $6,736,626 and the aggregate gross unrealized depreciation for all investments in which there was an excess of tax cost over value was $34,505,254. The net unrealized depreciation was $27,768,628. |
Valuation Inputs
A summary of the inputs used to value the Fund’s investments as of December 31, 2018 is as follows (see Note 2A - Portfolio Valuation in the Notes to Financial Statements):
| | Total
Value at
12/31/2018 | Level 1
Quoted
Prices | Level 2
Significant
Observable
Inputs | Level 3
Significant
Unobservable
Inputs |
| Common Stocks* | $ 138,592,038 | $ 138,592,038 | $ — | $ — |
| * | See Portfolio of Investments for industry breakout. |
| Country Allocation† | % of Net
Assets |
| Germany | 93.5% |
| Luxembourg | 4.3 |
| Netherlands | 1.9 |
| Total Investments | 99.7 |
| Net Other Assets and Liabilities | 0.3 |
| Total | 100.0% |
† Portfolio securities are categorized based upon their country of incorporation, which can be different from the country categorization of the Fund’s underlying index.
See Notes to Financial Statements
Page 77
First Trust Canada AlphaDEX® Fund (FCAN)
Portfolio of Investments
December 31, 2018
| Shares | | Description | | Value |
| COMMON STOCKS – 90.4% |
| | | Aerospace & Defense – 2.5% | | |
| 76,394 | | Bombardier, Inc., Class B (a) | | $113,595 |
| 3,636 | | CAE, Inc. | | 66,823 |
| | | | | 180,418 |
| | | Airlines – 5.0% | | |
| 18,694 | | Air Canada (a) | | 355,476 |
| | | Auto Components – 2.5% | | |
| 3,897 | | Magna International, Inc. | | 176,895 |
| | | Capital Markets – 1.0% | | |
| 1,862 | | Brookfield Asset Management, Inc., Class A | | 71,359 |
| | | Chemicals – 3.6% | | |
| 5,342 | | Methanex Corp. | | 256,926 |
| | | Commercial Services &
Supplies – 1.0% | | |
| 2,215 | | Ritchie Bros. Auctioneers, Inc. | | 72,460 |
| | | Construction & Engineering – 3.5% | | |
| 5,739 | | WSP Global, Inc. | | 246,636 |
| | | Electric Utilities – 2.1% | | |
| 2,363 | | Fortis, Inc. | | 78,773 |
| 4,956 | | Hydro One Ltd. (b) | | 73,512 |
| | | | | 152,285 |
| | | Food & Staples Retailing – 2.2% | | |
| 4,444 | | Metro, Inc. | | 154,101 |
| | | Hotels, Restaurants &
Leisure – 1.9% | | |
| 8,332 | | Stars (The) Group, Inc. (a) | | 137,565 |
| | | Insurance – 3.3% | | |
| 539 | | Fairfax Financial Holdings, Ltd. | | 237,275 |
| | | IT Services – 5.1% | | |
| 2,384 | | CGI Group, Inc., Class A (a) | | 145,813 |
| 1,554 | | Shopify, Inc., Class A (a) | | 214,899 |
| | | | | 360,712 |
| | | Media – 1.1% | | |
| 3,689 | | Quebecor, Inc., Class B | | 77,660 |
| | | Metals & Mining – 20.1% | | |
| 5,127 | | First Quantum Minerals Ltd. | | 41,461 |
| 100,315 | | Kinross Gold Corp. (a) | | 323,312 |
| 17,836 | | Kirkland Lake Gold Ltd. | | 465,105 |
| 67,929 | | Lundin Mining Corp. | | 280,633 |
| 14,877 | | Teck Resources Ltd., Class B | | 320,272 |
| | | | | 1,430,783 |
| | | Oil, Gas & Consumable Fuels – 22.9% | | |
| 21,939 | | ARC Resources Ltd. | | 130,168 |
| Shares | | Description | | Value |
|
| | | Oil, Gas & Consumable
Fuels (Continued) | | |
| 4,186 | | Canadian Natural Resources, Ltd. | | $101,001 |
| 29,102 | | Cenovus Energy, Inc. | | 204,644 |
| 20,561 | | Crescent Point Energy Corp. | | 62,352 |
| 11,568 | | Encana Corp. | | 66,771 |
| 24,234 | | Husky Energy, Inc. | | 250,470 |
| 6,818 | | Imperial Oil Ltd. | | 172,747 |
| 34,269 | | Seven Generations Energy Ltd., Class A (a) | | 279,634 |
| 5,569 | | Suncor Energy, Inc. | | 155,542 |
| 16,911 | | Tourmaline Oil Corp. | | 210,335 |
| | | | | 1,633,664 |
| | | Paper & Forest Products – 5.7% | | |
| 9,185 | | Norbord, Inc. | | 244,224 |
| 3,292 | | West Fraser Timber Co., Ltd. | | 162,623 |
| | | | | 406,847 |
| | | Pharmaceuticals – 1.7% | | |
| 6,491 | | Bausch Health Cos., Inc. (a) | | 120,054 |
| | | Real Estate Management &
Development – 2.8% | | |
| 14,421 | | First Capital Realty, Inc. | | 199,118 |
| | | Software – 1.7% | | |
| 195 | | Constellation Software, Inc. | | 124,819 |
| | | Trading Companies &
Distributors – 0.7% | | |
| 3,060 | | Finning International, Inc. | | 53,346 |
| | | Total Common Stocks | | 6,448,399 |
| | | (Cost $8,443,385) | | |
| REAL ESTATE INVESTMENT TRUSTS – 9.4% |
| | | Equity Real Estate Investment
Trusts – 9.4% | | |
| 9,319 | | Canadian Apartment Properties REIT | | 302,397 |
| 14,808 | | H&R Real Estate Investment Trust | | 223,986 |
| 8,225 | | RioCan Real Estate Investment Trust | | 143,389 |
| | | Total Real Estate Investment Trusts | | 669,772 |
| | | (Cost $694,095) | | |
| | | Total Investments – 99.8% | | 7,118,171 |
| | | (Cost $9,137,480) (c) | | |
| | | Net Other Assets and Liabilities – 0.2% | | 13,751 |
| | | Net Assets – 100.0% | | $7,131,922 |
|
| (a) | Non-income producing security. |
Page 78
See Notes to Financial Statements
First Trust Canada AlphaDEX® Fund (FCAN)
Portfolio of Investments (Continued)
December 31, 2018
| (b) | This security is restricted in the U.S. and cannot be offered for public sale without first being registered under the Securities Act of 1933, as amended. This security is not restricted on the foreign exchange where it trades freely without any additional registration. As such, it does not require the additional disclosure required of restricted securities. |
| (c) | Aggregate cost for federal income tax purposes was $9,194,973. As of December 31, 2018, the aggregate gross unrealized appreciation for all investments in which there was an excess of value over tax cost was $73,750 and the aggregate gross unrealized depreciation for all investments in which there was an excess of tax cost over value was $2,150,552. The net unrealized depreciation was $2,076,802. |
Valuation Inputs
A summary of the inputs used to value the Fund’s investments as of December 31, 2018 is as follows (see Note 2A - Portfolio Valuation in the Notes to Financial Statements):
| | Total
Value at
12/31/2018 | Level 1
Quoted
Prices | Level 2
Significant
Observable
Inputs | Level 3
Significant
Unobservable
Inputs |
| Common Stocks* | $ 6,448,399 | $ 6,448,399 | $ — | $ — |
| Real Estate Investment Trusts* | 669,772 | 669,772 | — | — |
| Total Investments | $ 7,118,171 | $ 7,118,171 | $— | $— |
| * | See Portfolio of Investments for industry breakout. |
| Country Allocation† | % of Net
Assets |
| Canada | 99.8% |
| Total Investments | 99.8 |
| Net Other Assets and Liabilities | 0.2 |
| Total | 100.0% |
† Portfolio securities are categorized based upon their country of incorporation, which can be different from the country categorization of the Fund’s underlying index.
See Notes to Financial Statements
Page 79
First Trust Australia AlphaDEX® Fund (FAUS)
Portfolio of Investments
December 31, 2018
| Shares | | Description | | Value |
| COMMON STOCKS – 73.5% |
| | | Airlines – 1.8% | | |
| 5,922 | | Qantas Airways Ltd. | | $24,151 |
| | | Banks – 0.9% | | |
| 1,683 | | Bendigo & Adelaide Bank Ltd. | | 12,791 |
| | | Biotechnology – 1.8% | | |
| 189 | | CSL Ltd. | | 24,649 |
| | | Capital Markets – 3.3% | | |
| 590 | | Macquarie Group Ltd. | | 45,151 |
| | | Commercial Services &
Supplies – 2.1% | | |
| 4,108 | | Brambles Ltd. | | 29,369 |
| | | Construction Materials – 0.7% | | |
| 2,793 | | Boral Ltd. | | 9,718 |
| | | Diversified Telecommunication
Services – 6.6% | | |
| 21,219 | | Telstra Corp., Ltd. | | 42,595 |
| 10,584 | | TPG Telecom Ltd. | | 48,009 |
| | | | | 90,604 |
| | | Electric Utilities – 0.9% | | |
| 11,364 | | AusNet Services | | 12,446 |
| | | Energy Equipment &
Services – 3.0% | | |
| 5,208 | | WorleyParsons Ltd. | | 41,891 |
| | | Food & Staples Retailing – 2.7% | | |
| 1,802 | | Woolworths Group Ltd. | | 37,341 |
| | | Gas Utilities – 0.8% | | |
| 1,852 | | APA Group | | 11,088 |
| | | Hotels, Restaurants &
Leisure – 5.2% | | |
| 2,361 | | Aristocrat Leisure Ltd. | | 36,319 |
| 1,146 | | Flight Centre Travel Group Ltd. | | 34,645 |
| | | | | 70,964 |
| | | Insurance – 1.6% | | |
| 4,343 | | Insurance Australia Group Ltd. | | 21,413 |
| | | Metals & Mining – 16.2% | | |
| 1,076 | | BHP Group Ltd. | | 25,942 |
| 3,170 | | BlueScope Steel Ltd. | | 24,471 |
| 15,589 | | Evolution Mining Ltd. | | 40,517 |
| 16,619 | | Fortescue Metals Group Ltd. | | 49,047 |
| 656 | | Rio Tinto Ltd. | | 36,257 |
| 20,210 | | South32 Ltd. | | 47,687 |
| | | | | 223,921 |
| | | Multiline Retail – 2.6% | | |
| 1,560 | | Wesfarmers Ltd. | | 35,403 |
| Shares | | Description | | Value |
|
| | | Multi-Utilities – 1.7% | | |
| 1,623 | | AGL Energy Ltd. | | $23,549 |
| | | Oil, Gas & Consumable Fuels – 14.8% | | |
| 1,121 | | Caltex Australia Ltd. | | 20,118 |
| 2,049 | | Oil Search Ltd. | | 10,333 |
| 9,092 | | Origin Energy Ltd. (a) | | 41,434 |
| 14,545 | | Santos Ltd. | | 56,141 |
| 882 | | Washington H Soul Pattinson & Co., Ltd. | | 15,463 |
| 16,189 | | Whitehaven Coal Ltd. | | 49,260 |
| 514 | | Woodside Petroleum Ltd. | | 11,339 |
| | | | | 204,088 |
| | | Professional Services – 0.7% | | |
| 836 | | SEEK Ltd. | | 9,963 |
| | | Real Estate Management &
Development – 2.2% | | |
| 3,683 | | LendLease Group | | 30,170 |
| | | Road & Rail – 1.8% | | |
| 8,425 | | Aurizon Holdings Ltd. | | 25,398 |
| | | Trading Companies &
Distributors – 2.1% | | |
| 2,875 | | Seven Group Holdings Ltd. | | 28,715 |
| | | Total Common Stocks | | 1,012,783 |
| | | (Cost $1,264,395) | | |
| REAL ESTATE INVESTMENT TRUSTS – 26.0% |
| | | Equity Real Estate Investment
Trusts – 26.0% | | |
| 9,392 | | Dexus | | 70,254 |
| 18,023 | | GPT (The) Group | | 67,789 |
| 33,621 | | Mirvac Group | | 53,045 |
| 20,774 | | Scentre Group | | 57,066 |
| 18,377 | | Stockland | | 45,562 |
| 35,211 | | Vicinity Centres | | 64,482 |
| | | Total Real Estate Investment Trusts | | 358,198 |
| | | (Cost $379,283) | | |
| | | Total Investments – 99.5% | | 1,370,981 |
| | | (Cost $1,643,678) (b) | | |
| | | Net Other Assets and Liabilities – 0.5% | | 7,332 |
| | | Net Assets – 100.0% | | $1,378,313 |
|
| (a) | Non-income producing security. |
| (b) | Aggregate cost for federal income tax purposes was $1,662,498. As of December 31, 2018, the aggregate gross unrealized appreciation for all investments in which there was an excess of value over tax cost was $6,691 and the aggregate gross unrealized depreciation for all investments in which there was an excess of tax cost over value was $298,208. The net unrealized depreciation was $291,517. |
Page 80
See Notes to Financial Statements
First Trust Australia AlphaDEX® Fund (FAUS)
Portfolio of Investments (Continued)
December 31, 2018
Valuation Inputs
A summary of the inputs used to value the Fund’s investments as of December 31, 2018 is as follows (see Note 2A - Portfolio Valuation in the Notes to Financial Statements):
| | Total
Value at
12/31/2018 | Level 1
Quoted
Prices | Level 2
Significant
Observable
Inputs | Level 3
Significant
Unobservable
Inputs |
| Common Stocks* | $ 1,012,783 | $ 1,012,783 | $ — | $ — |
| Real Estate Investment Trusts* | 358,198 | 358,198 | — | — |
| Total Investments | $ 1,370,981 | $ 1,370,981 | $— | $— |
| * | See Portfolio of Investments for industry breakout. |
| Country Allocation† | % of Net
Assets |
| Australia | 98.7% |
| Papua New Guinea | 0.8 |
| Total Investments | 99.5 |
| Net Other Assets and Liabilities | 0.5 |
| Total | 100.0% |
† Portfolio securities are categorized based upon their country of incorporation, which can be different from the country categorization of the Fund’s underlying index.
See Notes to Financial Statements
Page 81
First Trust United Kingdom AlphaDEX® Fund (FKU)
Portfolio of Investments
December 31, 2018
| Shares | | Description | | Value |
| COMMON STOCKS – 93.6% |
| | | Aerospace & Defense – 4.3% | | |
| 32,643 | | Meggitt PLC | | $195,968 |
| 20,369 | | Rolls-Royce Holdings PLC | | 215,487 |
| 783,150 | | Rolls-Royce Holdings PLC (a) (b) | | 998 |
| | | | | 412,453 |
| | | Air Freight & Logistics – 0.6% | | |
| 15,930 | | Royal Mail PLC | | 55,248 |
| | | Airlines – 4.4% | | |
| 4,812 | | easyJet PLC | | 67,774 |
| 24,251 | | International Consolidated Airlines Group S.A. | | 191,026 |
| 4,473 | | Wizz Air Holdings PLC (b) (c) | | 159,750 |
| | | | | 418,550 |
| | | Banks – 0.4% | | |
| 63,848 | | Lloyds Banking Group PLC | | 42,196 |
| | | Capital Markets – 4.0% | | |
| 22,350 | | 3i Group PLC | | 220,321 |
| 3,653 | | Intermediate Capital Group PLC | | 43,535 |
| 901 | | London Stock Exchange Group PLC | | 46,648 |
| 45,590 | | Man Group PLC | | 77,285 |
| | | | | 387,789 |
| | | Chemicals – 2.1% | | |
| 5,562 | | Johnson Matthey PLC | | 198,430 |
| | | Commercial Services &
Supplies – 4.6% | | |
| 14,768 | | Babcock International Group PLC | | 92,102 |
| 8,956 | | HomeServe PLC | | 98,800 |
| 37,788 | | IWG PLC | | 100,664 |
| 34,427 | | Rentokil Initial PLC | | 147,965 |
| | | | | 439,531 |
| | | Containers & Packaging – 1.7% | | |
| 7,724 | | DS Smith PLC | | 29,466 |
| 16,141 | | RPC Group PLC | | 134,138 |
| | | | | 163,604 |
| | | Distributors – 1.1% | | |
| 15,474 | | Inchcape PLC | | 108,773 |
| | | Diversified Telecommunication
Services – 1.5% | | |
| 36,967 | | BT Group PLC | | 112,188 |
| 7,320 | | Inmarsat PLC | | 35,389 |
| | | | | 147,577 |
| Shares | | Description | | Value |
|
| | | Electronic Equipment,
Instruments & Components – 2.9% | | |
| 21,243 | | Electrocomponents PLC | | $137,169 |
| 2,938 | | Halma PLC | | 51,079 |
| 3,085 | | Spectris PLC | | 89,613 |
| | | | | 277,861 |
| | | Food & Staples Retailing – 6.0% | | |
| 62,666 | | J Sainsbury PLC | | 211,666 |
| 78,411 | | Tesco PLC | | 189,991 |
| 64,392 | | Wm Morrison Supermarkets PLC | | 175,023 |
| | | | | 576,680 |
| | | Food Products – 2.2% | | |
| 24,896 | | Tate & Lyle PLC | | 209,434 |
| | | Health Care Providers &
Services – 0.8% | | |
| 2,248 | | NMC Health PLC | | 78,395 |
| | | Hotels, Restaurants &
Leisure – 0.9% | | |
| 1,853 | | Carnival PLC | | 88,876 |
| | | Household Durables – 9.5% | | |
| 32,248 | | Barratt Developments PLC | | 190,226 |
| 6,700 | | Bellway PLC | | 214,776 |
| 5,318 | | Berkeley Group Holdings PLC | | 235,818 |
| 6,357 | | Persimmon PLC | | 156,381 |
| 67,506 | | Taylor Wimpey PLC | | 117,234 |
| | | | | 914,435 |
| | | Insurance – 0.5% | | |
| 11,740 | | Direct Line Insurance Group PLC | | 47,690 |
| | | Interactive Media & Services – 1.4% | | |
| 9,452 | | Auto Trader Group PLC (c) | | 54,792 |
| 15,163 | | Rightmove PLC | | 83,540 |
| | | | | 138,332 |
| | | Internet & Direct Marketing
Retail – 1.6% | | |
| 15,672 | | Ocado Group PLC (b) | | 157,807 |
| | | Machinery – 2.2% | | |
| 36,083 | | Rotork PLC | | 113,875 |
| 1,234 | | Spirax-Sarco Engineering PLC | | 98,146 |
| | | | | 212,021 |
| | | Media – 3.6% | | |
| 9,642 | | Informa PLC | | 77,449 |
| 13,646 | | Pearson PLC | | 163,218 |
| 10,123 | | WPP PLC | | 109,235 |
| | | | | 349,902 |
Page 82
See Notes to Financial Statements
First Trust United Kingdom AlphaDEX® Fund (FKU)
Portfolio of Investments (Continued)
December 31, 2018
| Shares | | Description | | Value |
| COMMON STOCKS (Continued) |
| | | Metals & Mining – 11.4% | | |
| 11,876 | | Anglo American PLC | | $264,567 |
| 4,067 | | Antofagasta PLC | | 40,600 |
| 2,359 | | BHP Group PLC | | 49,660 |
| 39,591 | | Evraz PLC | | 242,473 |
| 33,362 | | Glencore PLC | | 123,891 |
| 18,025 | | Polymetal International PLC | | 188,852 |
| 3,833 | | Rio Tinto PLC | | 182,231 |
| | | | | 1,092,274 |
| | | Multiline Retail – 1.4% | | |
| 2,662 | | Next PLC | | 135,414 |
| | | Multi-Utilities – 2.0% | | |
| 19,207 | | National Grid PLC | | 187,086 |
| | | Oil, Gas & Consumable Fuels – 6.1% | | |
| 34,805 | | BP PLC | | 220,015 |
| 7,418 | | Royal Dutch Shell PLC, Class B | | 221,247 |
| 65,725 | | Tullow Oil PLC (b) | | 150,038 |
| | | | | 591,300 |
| | | Professional Services – 1.4% | | |
| 2,148 | | Experian PLC | | 52,156 |
| 1,408 | | Intertek Group PLC | | 86,142 |
| | | | | 138,298 |
| | | Software – 1.8% | | |
| 1,499 | | AVEVA Group PLC | | 46,237 |
| 25,200 | | Sophos Group PLC (c) | | 121,606 |
| | | | | 167,843 |
| | | Specialty Retail – 3.2% | | |
| 45,684 | | JD Sports Fashion PLC | | 203,102 |
| 40,663 | | Kingfisher PLC | | 107,545 |
| | | | | 310,647 |
| | | Textiles, Apparel & Luxury
Goods – 1.3% | | |
| 5,591 | | Burberry Group PLC | | 123,677 |
| | | Tobacco – 1.7% | | |
| 5,256 | | British American Tobacco PLC | | 167,482 |
| | | Trading Companies &
Distributors – 5.2% | | |
| 7,084 | | Ashtead Group PLC | | 147,809 |
| 3,508 | | Bunzl PLC | | 105,925 |
| 654 | | Ferguson PLC | | 41,821 |
| 22,523 | | Howden Joinery Group PLC | | 125,051 |
| 5,660 | | Travis Perkins PLC | | 77,193 |
| | | | | 497,799 |
| | | Water Utilities – 0.5% | | |
| 5,275 | | United Utilities Group PLC | | 49,499 |
| Shares | | Description | | Value |
|
| | | Wireless Telecommunication
Services – 1.3% | | |
| 65,700 | | Vodafone Group PLC | | $128,040 |
| | | Total Common Stocks | | 9,014,943 |
| | | (Cost $10,439,561) | | |
| REAL ESTATE INVESTMENT TRUSTS – 6.0% |
| | | Equity Real Estate Investment
Trusts – 6.0% | | |
| 2,592 | | Derwent London PLC | | 94,256 |
| 7,703 | | Hammerson PLC | | 32,341 |
| 30,069 | | Segro PLC | | 225,587 |
| 21,516 | | Shaftesbury PLC | | 227,759 |
| | | Total Real Estate Investment Trusts | | 579,943 |
| | | (Cost $642,857) | | |
| | | Total Investments – 99.6% | | 9,594,886 |
| | | (Cost $11,082,418) (d) | | |
| | | Net Other Assets and Liabilities – 0.4% | | 37,414 |
| | | Net Assets – 100.0% | | $9,632,300 |
|
| (a) | This security is fair valued by the Advisor’s Pricing Committee in accordance with procedures adopted by the Trust’s Board of Trustees, and in accordance with the provisions of the Investment Company Act of 1940, as amended. At December 31, 2018, securities noted as such are valued at $998 or 0.0% of net assets. |
| (b) | Non-income producing security. |
| (c) | This security is restricted in the U.S. and cannot be offered for public sale without first being registered under the Securities Act of 1933, as amended. This security is not restricted on the foreign exchange where it trades freely without any additional registration. As such, it does not require the additional disclosure required of restricted securities. |
| (d) | Aggregate cost for federal income tax purposes was $11,115,936. As of December 31, 2018, the aggregate gross unrealized appreciation for all investments in which there was an excess of value over tax cost was $281,458 and the aggregate gross unrealized depreciation for all investments in which there was an excess of tax cost over value was $1,802,508. The net unrealized depreciation was $1,521,050. |
See Notes to Financial Statements
Page 83
First Trust United Kingdom AlphaDEX® Fund (FKU)
Portfolio of Investments (Continued)
December 31, 2018
Valuation Inputs
A summary of the inputs used to value the Fund’s investments as of December 31, 2018 is as follows (see Note 2A - Portfolio Valuation in the Notes to Financial Statements):
| | Total
Value at
12/31/2018 | Level 1
Quoted
Prices | Level 2
Significant
Observable
Inputs | Level 3
Significant
Unobservable
Inputs |
| Common Stocks: | | | | |
| Aerospace & Defense | $ 412,453 | $ 411,455 | $ 998 | $ — |
| Other industry categories* | 8,602,490 | 8,602,490 | — | — |
| Real Estate Investment Trusts* | 579,943 | 579,943 | — | — |
| Total Investments | $ 9,594,886 | $ 9,593,888 | $ 998 | $— |
| * | See Portfolio of Investments for industry breakout. |
| Country Allocation† | % of Net
Assets |
| United Kingdom | 89.6% |
| Jersey | 8.0 |
| Spain | 2.0 |
| Total Investments | 99.6 |
| Net Other Assets and Liabilities | 0.4 |
| Total | 100.0% |
† Portfolio securities are categorized based upon their country of incorporation, which can be different from the country categorization of the Fund’s underlying index.
Page 84
See Notes to Financial Statements
First Trust India NIFTY 50 Equal Weight ETF (NFTY)
Portfolio of Investments
December 31, 2018
| Shares | | Description | | Value |
| COMMON STOCKS – 99.4% |
| | | Automobiles – 11.6% | | |
| 1,714 | | Bajaj Auto Ltd. | | $66,900 |
| 205 | | Eicher Motors Ltd. | | 67,785 |
| 1,472 | | Hero MotoCorp Ltd. | | 65,150 |
| 6,220 | | Mahindra & Mahindra Ltd. | | 71,702 |
| 634 | | Maruti Suzuki India Ltd. | | 67,673 |
| 28,047 | | Tata Motors Ltd. (a) | | 69,520 |
| | | | | 408,730 |
| | | Banks – 13.9% | | |
| 7,817 | | Axis Bank Ltd. (a) | | 69,409 |
| 2,315 | | HDFC Bank Ltd. | | 70,358 |
| 13,661 | | ICICI Bank Ltd. | | 70,599 |
| 3,068 | | IndusInd Bank Ltd. | | 70,305 |
| 4,002 | | Kotak Mahindra Bank Ltd. | | 71,826 |
| 16,825 | | State Bank of India (a) | | 71,250 |
| 26,492 | | Yes Bank Ltd. | | 69,024 |
| | | | | 492,771 |
| | | Chemicals – 3.9% | | |
| 3,470 | | Asian Paints Ltd. | | 68,043 |
| 6,425 | | UPL Ltd. | | 69,786 |
| | | | | 137,829 |
| | | Construction & Engineering – 2.0% | | |
| 3,410 | | Larsen & Toubro Ltd. | | 70,334 |
| | | Construction Materials – 4.0% | | |
| 5,972 | | Grasim Industries Ltd. | | 70,759 |
| 1,225 | | UltraTech Cement Ltd. | | 70,010 |
| | | | | 140,769 |
| | | Consumer Finance – 2.0% | | |
| 1,909 | | Bajaj Finance Ltd. | | 72,215 |
| | | Diversified Telecommunication
Services – 2.0% | | |
| 18,883 | | Bharti Infratel Ltd. | | 70,025 |
| | | Electric Utilities – 2.0% | | |
| 24,994 | | Power Grid Corp. of India Ltd. | | 70,562 |
| | | Gas Utilities – 2.0% | | |
| 14,010 | | GAIL India Ltd. | | 72,062 |
| | | Household Products – 2.0% | | |
| 2,697 | | Hindustan Unilever Ltd. | | 70,227 |
| | | Independent Power and
Renewable Electricity Producers – 2.0% | | |
| 33,138 | | NTPC Ltd. | | 70,581 |
| | | Insurance – 2.0% | | |
| 772 | | Bajaj Finserv Ltd. | | 71,568 |
| | | IT Services – 10.0% | | |
| 5,156 | | HCL Technologies Ltd. | | 71,208 |
| 7,417 | | Infosys Ltd. | | 70,075 |
| Shares | | Description | | Value |
|
| | | IT Services (Continued) | | |
| 2,532 | | Tata Consultancy Services Ltd. | | $68,717 |
| 6,990 | | Tech Mahindra Ltd. | | 72,253 |
| 14,846 | | Wipro Ltd. | | 70,312 |
| | | | | 352,565 |
| | | Media – 2.1% | | |
| 10,710 | | Zee Entertainment Enterprises Ltd. | | 73,067 |
| | | Metals & Mining – 8.0% | | |
| 22,097 | | Hindalco Industries Ltd. | | 71,372 |
| 16,027 | | JSW Steel Ltd | | 70,591 |
| 9,453 | | Tata Steel Ltd. | | 70,544 |
| 24,402 | | Vedanta Ltd. | | 70,656 |
| | | | | 283,163 |
| | | Oil, Gas & Consumable Fuels – 11.8% | | |
| 13,332 | | Bharat Petroleum Corp., Ltd. | | 69,319 |
| 19,746 | | Coal India Ltd. | | 68,092 |
| 20,239 | | Hindustan Petroleum Corp., Ltd. | | 73,372 |
| 33,463 | | Indian Oil Corp., Ltd. | | 65,761 |
| 33,294 | | Oil & Natural Gas Corp., Ltd. | | 71,438 |
| 4,384 | | Reliance Industries Ltd. | | 70,660 |
| | | | | 418,642 |
| | | Pharmaceuticals – 6.0% | | |
| 9,510 | | Cipla Ltd. | | 70,697 |
| 1,882 | | Dr Reddy’s Laboratories Ltd. | | 70,546 |
| 11,531 | | Sun Pharmaceutical Industries Ltd. | | 71,046 |
| | | | | 212,289 |
| | | Textiles, Apparel & Luxury
Goods – 2.0% | | |
| 5,339 | | Titan Co., Ltd. | | 70,941 |
| | | Thrifts & Mortgage Finance – 4.0% | | |
| 2,505 | | Housing Development Finance Corp., Ltd. | | 70,505 |
| 5,848 | | Indiabulls Housing Finance Ltd. | | 71,451 |
| | | | | 141,956 |
| | | Tobacco – 2.0% | | |
| 17,504 | | ITC Ltd. | | 70,603 |
| | | Transportation Infrastructure – 2.1% | | |
| 13,188 | | Adani Ports & Special Economic Zone Ltd. | | 72,972 |
See Notes to Financial Statements
Page 85
First Trust India NIFTY 50 Equal Weight ETF (NFTY)
Portfolio of Investments (Continued)
December 31, 2018
| Shares | | Description | | Value |
| COMMON STOCKS (Continued) |
| | | Wireless Telecommunication
Services – 2.0% | | |
| 15,629 | | Bharti Airtel Ltd. | | $69,912 |
| | | Total Investments – 99.4% | | 3,513,783 |
| | | (Cost $3,805,148) (b) | | |
| | | Net Other Assets and Liabilities – 0.6% | | 21,508 |
| | | Net Assets – 100.0% | | $3,535,291 |
|
| (a) | Non-income producing security. |
| (b) | Aggregate cost for federal income tax purposes was $3,806,428. As of December 31, 2018, the aggregate gross unrealized appreciation for all investments in which there was an excess of value over tax cost was $120,813 and the aggregate gross unrealized depreciation for all investments in which there was an excess of tax cost over value was $413,458. The net unrealized depreciation was $292,645. |
Valuation Inputs
A summary of the inputs used to value the Fund’s investments as of December 31, 2018 is as follows (see Note 2A - Portfolio Valuation in the Notes to Financial Statements):
| | Total
Value at
12/31/2018 | Level 1
Quoted
Prices | Level 2
Significant
Observable
Inputs | Level 3
Significant
Unobservable
Inputs |
| Common Stocks* | $ 3,513,783 | $ 3,513,783 | $ — | $ — |
| * | See Portfolio of Investments for industry breakout. |
| Country Allocation† | % of Net
Assets |
| India | 99.4% |
| Total Investments | 99.4 |
| Net Other Assets and Liabilities | 0.6 |
| Total | 100.0% |
† Portfolio securities are categorized based upon their country of incorporation, which can be different from the country categorization of the Fund’s underlying index.
Page 86
See Notes to Financial Statements
First Trust Hong Kong AlphaDEX® Fund (FHK)
Portfolio of Investments
December 31, 2018
| Shares | | Description | | Value |
| COMMON STOCKS – 89.5% |
| | | Auto Components – 1.7% | | |
| 52,201 | | Xinyi Glass Holdings Ltd. | | $57,731 |
| | | Banks – 0.9% | | |
| 1,300 | | Hang Seng Bank Ltd. | | 29,186 |
| | | Electric Utilities – 2.0% | | |
| 6,000 | | CLP Holdings Ltd. | | 67,812 |
| | | Electrical Equipment – 1.3% | | |
| 195,000 | | Fullshare Holdings Ltd. (a) | | 44,825 |
| | | Electronic Equipment,
Instruments & Components – 4.7% | | |
| 35,867 | | Kingboard Holdings Ltd. | | 95,731 |
| 78,500 | | Kingboard Laminates Holdings Ltd. | | 64,761 |
| | | | | 160,492 |
| | | Food & Staples Retailing – 2.9% | | |
| 99,000 | | Sun Art Retail Group Ltd. | | 100,890 |
| | | Food Products – 5.1% | | |
| 30,000 | | Vitasoy International Holdings Ltd. | | 114,360 |
| 79,228 | | WH Group Ltd. (b) | | 61,011 |
| | | | | 175,371 |
| | | Gas Utilities – 6.2% | | |
| 40,067 | | China Gas Holdings Ltd. | | 142,759 |
| 34,000 | | Hong Kong & China Gas Co., Ltd. | | 70,340 |
| | | | | 213,099 |
| | | Hotels, Restaurants &
Leisure – 7.9% | | |
| 42,500 | | Melco International Development Ltd. | | 86,623 |
| 36,000 | | NagaCorp Ltd. | | 38,710 |
| 6,000 | | Sands China Ltd. | | 26,282 |
| 78,000 | | SJM Holdings Ltd. | | 72,715 |
| 20,534 | | Wynn Macau Ltd. | | 44,789 |
| | | | | 269,119 |
| | | Household Durables – 0.9% | | |
| 5,667 | | Techtronic Industries Co., Ltd. | | 30,106 |
| | | Industrial Conglomerates – 1.9% | | |
| 3,005 | | CK Hutchison Holdings Ltd. | | 28,858 |
| 18,381 | | NWS Holdings Ltd. | | 37,699 |
| | | | | 66,557 |
| | | Insurance – 2.7% | | |
| 11,000 | | AIA Group Ltd. | | 91,310 |
| Shares | | Description | | Value |
|
| | | Paper & Forest Products – 5.1% | | |
| 95,301 | | Lee & Man Paper Manufacturing Ltd. | | $80,812 |
| 101,501 | | Nine Dragons Paper Holdings Ltd. | | 93,976 |
| | | | | 174,788 |
| | | Pharmaceuticals – 4.4% | | |
| 63,351 | | Sino Biopharmaceutical Ltd. | | 41,746 |
| 146,000 | | SSY Group Ltd. | | 108,141 |
| | | | | 149,887 |
| | | Real Estate Management &
Development – 39.7% | | |
| 7,883 | | CK Asset Holdings Ltd. | | 57,684 |
| 23,500 | | Hang Lung Group Ltd. | | 59,842 |
| 15,300 | | Hang Lung Properties Ltd. | | 29,152 |
| 24,131 | | Henderson Land Development Co., Ltd. | | 120,185 |
| 94,000 | | Jiayuan International Group Ltd. | | 173,823 |
| 33,942 | | Kerry Properties Ltd. | | 115,950 |
| 23,000 | | New World Development Co., Ltd. | | 30,430 |
| 48,934 | | Shimao Property Holdings Ltd. | | 130,607 |
| 98,478 | | Sino Land Co., Ltd. | | 168,773 |
| 8,601 | | Sun Hung Kai Properties Ltd. | | 122,581 |
| 15,317 | | Swire Pacific Ltd., Class A | | 161,767 |
| 39,899 | | Wharf Holdings (The) Ltd. | | 103,945 |
| 14,027 | | Wheelock & Co., Ltd. | | 80,162 |
| | | | | 1,354,901 |
| | | Textiles, Apparel & Luxury
Goods – 2.1% | | |
| 22,635 | | Yue Yuen Industrial Holdings Ltd. | | 72,410 |
| | | Total Common Stocks | | 3,058,484 |
| | | (Cost $3,313,053) | | |
| REAL ESTATE INVESTMENT TRUSTS – 10.2% |
| | | Equity Real Estate Investment
Trusts – 10.2% | | |
| 243,040 | | Champion REIT | | 166,361 |
| 17,894 | | Link REIT | | 181,214 |
| | | Total Real Estate Investment Trusts | | 347,575 |
| | | (Cost $268,339) | | |
| MONEY MARKET FUNDS – 0.4% |
| 12,080 | | Goldman Sachs Financial Square Treasury Obligations Fund - Institutional Class - 2.61% (c) (d) | | 12,080 |
| | | (Cost $12,080) | | |
See Notes to Financial Statements
Page 87
First Trust Hong Kong AlphaDEX® Fund (FHK)
Portfolio of Investments (Continued)
December 31, 2018
Principal
Value | | Description | | Value |
| REPURCHASE AGREEMENTS – 0.7% |
| $5,330 | | BNP Paribas S.A., 2.95% (c), dated 12/31/18, due 1/2/19, with a maturity value of $5,331. Collateralized by U.S. Treasury Note, interest rate of 2.375%, due 4/30/20. The value of the collateral including accrued interest is $5,458. (d) | | $5,330 |
| 19,183 | | JPMorgan Chase & Co., 2.85% (c), dated 12/31/18, due 1/2/19, with a maturity value of $19,186. Collateralized by U.S. Treasury Bill, interest rate of 0.000%, due 5/9/19. The value of the collateral including accrued interest is $19,566. (d) | | 19,183 |
| | | Total Repurchase Agreements | | 24,513 |
| | | (Cost $24,513) | | |
| | | Total Investments – 100.8% | | 3,442,652 |
| | | (Cost $3,617,985) (e) | | |
| | | Net Other Assets and Liabilities – (0.8)% | | (26,631) |
| | | Net Assets – 100.0% | | $3,416,021 |
|
| (a) | All or a portion of this security is on loan (see Note 2D - Securities Lending in the Notes to Financial Statements). The aggregate value of such securities is $33,607 and the total value of the collateral held by the Fund is $36,550. |
| (b) | This security is restricted in the U.S. and cannot be offered for public sale without first being registered under the Securities Act of 1933, as amended. This security is not restricted on the foreign exchange where it trades freely without any additional registration. As such, it does not require the additional disclosure required of restricted securities. |
| (c) | Rate shown reflects yield as of December 31, 2018. |
| (d) | This security serves as collateral for securities on loan. |
| (e) | Aggregate cost for federal income tax purposes was $3,641,536. As of December 31, 2018, the aggregate gross unrealized appreciation for all investments in which there was an excess of value over tax cost was $275,477 and the aggregate gross unrealized depreciation for all investments in which there was an excess of tax cost over value was $474,361. The net unrealized depreciation was $198,884. |
Valuation Inputs
A summary of the inputs used to value the Fund’s investments as of December 31, 2018 is as follows (see Note 2A - Portfolio Valuation in the Notes to Financial Statements):
| | Total
Value at
12/31/2018 | Level 1
Quoted
Prices | Level 2
Significant
Observable
Inputs | Level 3
Significant
Unobservable
Inputs |
| Common Stocks* | $ 3,058,484 | $ 3,058,484 | $ — | $ — |
| Real Estate Investment Trusts* | 347,575 | 347,575 | — | — |
| Money Market Funds | 12,080 | 12,080 | — | — |
| Repurchase Agreements | 24,513 | — | 24,513 | — |
| Total Investments | $ 3,442,652 | $ 3,418,139 | $ 24,513 | $— |
| * | See Portfolio of Investments for industry breakout. |
Offsetting Assets and Liabilities
Offsetting assets and liabilities requires entities to disclose both gross and net information about instruments and transactions eligible for offset, and to disclose instruments and transactions subject to master netting or similar agreements (see Note 2I – Offsetting on the Statements of Assets and Liabilities in the Notes to Financial Statements).
The Fund’s loaned securities were all subject to an enforceable Securities Lending Agency Agreement. Securities lent in accordance with the Securities Lending Agency Agreement on a gross basis were as follows:
| Security Lending Agency Agreement | |
| Total gross amount presented on the Statements of Assets and Liabilities(1) | $33,607 |
| Non-cash Collateral(2) | (33,607) |
| Net Amount | $— |
| (1) | The amount presented on the Statements of Assets and Liabilities, which is included in “Investments, at value”, is not offset and is shown on a gross basis. |
| (2) | At December 31, 2018, the value of the collateral received from each borrower exceeded the value of the related securities loaned. This amount is disclosed on the Portfolio of Investments. |
Page 88
See Notes to Financial Statements
First Trust Hong Kong AlphaDEX® Fund (FHK)
Portfolio of Investments (Continued)
December 31, 2018
The Fund’s investments in repurchase agreements were all subject to an enforceable Master Repurchase Agreement. Repurchase Agreements on a gross basis were as follows:
| Repurchase Agreements | |
| Total gross amount presented on the Statements of Assets and Liabilities(3) | $24,513 |
| Non-cash Collateral(4) | (24,513) |
| Net Amount | $— |
| (3) | The amount is included in “Investments, at value” on the Statements of Assets and Liabilities. |
| (4) | At December 31, 2018, the value of the collateral received from each seller exceeded the value of the repurchase agreements. |
| Country Allocation† | % of Net
Assets |
| Hong Kong | 55.3% |
| Cayman Islands | 30.9 |
| Bermuda | 13.5 |
| United States | 1.1 |
| Total Investments | 100.8 |
| Net Other Assets and Liabilities | (0.8) |
| Total | 100.0% |
† Portfolio securities are categorized based upon their country of incorporation, which can be different from the country categorization of the Fund’s underlying index.
See Notes to Financial Statements
Page 89
First Trust Switzerland AlphaDEX® Fund (FSZ)
Portfolio of Investments
December 31, 2018
| Shares | | Description | | Value |
| COMMON STOCKS – 98.5% |
| | | Air Freight & Logistics – 1.9% | | |
| 20,980 | | Panalpina Welttransport Holding AG | | $2,796,195 |
| | | Banks – 0.9% | | |
| 1,858 | | Banque Cantonale Vaudoise | | 1,400,731 |
| | | Capital Markets – 4.8% | | |
| 48,597 | | Julius Baer Group Ltd. | | 1,730,981 |
| 5,840 | | Partners Group Holding AG | | 3,541,194 |
| 39,364 | | Vontobel Holding AG | | 2,018,461 |
| | | | | 7,290,636 |
| | | Chemicals – 6.8% | | |
| 118,902 | | Clariant AG | | 2,188,358 |
| 1,258 | | Givaudan S.A. | | 2,913,021 |
| 41,226 | | Sika AG | | 5,226,126 |
| | | | | 10,327,505 |
| | | Construction Materials – 2.4% | | |
| 87,812 | | LafargeHolcim Ltd. | | 3,618,258 |
| | | Diversified Financial Services – 4.0% | | |
| 84,193 | | Pargesa Holding S.A. | | 6,068,851 |
| | | Diversified Telecommunication
Services – 10.1% | | |
| 87,631 | | Sunrise Communications Group AG (a) | | 7,707,498 |
| 15,976 | | Swisscom AG | | 7,634,477 |
| | | | | 15,341,975 |
| | | Electric Utilities – 4.1% | | |
| 88,508 | | BKW AG | | 6,186,285 |
| | | Food Products – 4.0% | | |
| 19 | | Chocoladefabriken Lindt & Spruengli AG | | 1,416,930 |
| 6,704 | | Emmi AG | | 4,648,261 |
| | | | | 6,065,191 |
| | | Health Care Equipment &
Supplies – 7.3% | | |
| 31,850 | | Sonova Holding AG | | 5,204,100 |
| 9,378 | | Straumann Holding AG | | 5,896,433 |
| | | | | 11,100,533 |
| | | Insurance – 11.7% | | |
| 29,441 | | Baloise Holding AG | | 4,055,663 |
| 7,499 | | Helvetia Holding AG | | 4,383,127 |
| 16,419 | | Swiss Life Holding AG | | 6,324,380 |
| 9,630 | | Zurich Insurance Group AG | | 2,871,659 |
| | | | | 17,634,829 |
| | | Life Sciences Tools &
Services – 0.9% | | |
| 5,374 | | Lonza Group AG | | 1,392,571 |
| Shares | | Description | | Value |
|
| | | Machinery – 9.3% | | |
| 17,041 | | Bucher Industries AG | | $4,584,027 |
| 22,266 | | Daetwyler Holding AG | | 2,827,141 |
| 4,457 | | Georg Fischer AG | | 3,566,416 |
| 93,227 | | OC Oerlikon Corp. AG | | 1,047,132 |
| 13,513 | | SFS Group AG | | 1,048,980 |
| 11,742 | | Sulzer AG | | 932,407 |
| | | | | 14,006,103 |
| | | Pharmaceuticals – 5.9% | | |
| 56,434 | | Novartis AG | | 4,825,225 |
| 12,842 | | Roche Holding AG | | 3,180,123 |
| 8,926 | | Vifor Pharma AG | | 970,790 |
| | | | | 8,976,138 |
| | | Professional Services – 6.1% | | |
| 120,500 | | Adecco Group AG | | 5,630,853 |
| 1,608 | | SGS S.A. | | 3,615,505 |
| | | | | 9,246,358 |
| | | Real Estate Management &
Development – 3.8% | | |
| 46,178 | | PSP Swiss Property AG | | 4,550,147 |
| 15,536 | | Swiss Prime Site AG | | 1,257,390 |
| | | | | 5,807,537 |
| | | Software – 3.7% | | |
| 47,204 | | Temenos Group AG | | 5,662,175 |
| | | Specialty Retail – 1.4% | | |
| 22,407 | | Dufry AG | | 2,122,840 |
| | | Technology Hardware,
Storage & Peripherals – 3.4% | | |
| 162,139 | | Logitech International S.A. | | 5,100,557 |
| | | Textiles, Apparel & Luxury
Goods – 2.9% | | |
| 15,030 | | Swatch Group (The) AG | | 4,384,069 |
| | | Transportation Infrastructure – 3.1% | | |
| 27,987 | | Flughafen Zurich AG | | 4,627,009 |
| | | Total Investments – 98.5% | | 149,156,346 |
| | | (Cost $163,222,280) (b) | | |
| | | Net Other Assets and Liabilities – 1.5% | | 2,252,947 |
| | | Net Assets – 100.0% | | $151,409,293 |
|
| (a) | This security is restricted in the U.S. and cannot be offered for public sale without first being registered under the Securities Act of 1933, as amended. This security is not restricted on the foreign exchange where it trades freely without any additional registration. As such, it does not require the additional disclosure required of restricted securities. |
Page 90
See Notes to Financial Statements
First Trust Switzerland AlphaDEX® Fund (FSZ)
Portfolio of Investments (Continued)
December 31, 2018
| (b) | Aggregate cost for federal income tax purposes was $164,325,710. As of December 31, 2018, the aggregate gross unrealized appreciation for all investments in which there was an excess of value over tax cost was $5,475,557 and the aggregate gross unrealized depreciation for all investments in which there was an excess of tax cost over value was $20,644,921. The net unrealized depreciation was $15,169,364. |
Valuation Inputs
A summary of the inputs used to value the Fund’s investments as of December 31, 2018 is as follows (see Note 2A - Portfolio Valuation in the Notes to Financial Statements):
| | Total
Value at
12/31/2018 | Level 1
Quoted
Prices | Level 2
Significant
Observable
Inputs | Level 3
Significant
Unobservable
Inputs |
| Common Stocks* | $ 149,156,346 | $ 149,156,346 | $ — | $ — |
| * | See Portfolio of Investments for industry breakout. |
| Country Allocation† | % of Net
Assets |
| Switzerland | 98.5% |
| Total Investments | 98.5 |
| Net Other Assets and Liabilities | 1.5 |
| Total | 100.0% |
† Portfolio securities are categorized based upon their country of incorporation, which can be different from the country categorization of the Fund’s underlying index.
See Notes to Financial Statements
Page 91
First Trust Developed Markets ex-US Small Cap AlphaDEX® Fund (FDTS)
Portfolio of Investments
December 31, 2018
| Shares | | Description | | Value |
| COMMON STOCKS (a) – 94.1% |
| | | Australia – 4.8% | | |
| 4,001 | | Afterpay Touch Group Ltd. (b) | | $34,944 |
| 1,576 | | Altium Ltd. | | 24,088 |
| 3,084 | | Appen Ltd. | | 27,870 |
| 35,552 | | Aveo Group | | 40,066 |
| 7,500 | | Bapcor Ltd. | | 31,115 |
| 9,148 | | Bingo Industries Ltd. | | 11,952 |
| 3,810 | | CSR Ltd. | | 7,541 |
| 1,129 | | HUB24 Ltd. | | 9,447 |
| 7,158 | | IPH Ltd. | | 27,276 |
| 570 | | JB Hi-Fi Ltd. | | 8,889 |
| 26,721 | | Mesoblast Ltd. (b) | | 21,832 |
| 33,305 | | nearmap Ltd. (b) | | 35,188 |
| 34,361 | | NRW Holdings Ltd. | | 39,086 |
| 7,697 | | OZ Minerals Ltd. | | 47,708 |
| 5,799 | | Sandfire Resources NL | | 27,285 |
| 14,458 | | Seven West Media Ltd. (b) | | 5,601 |
| 1,136 | | Sims Metal Management Ltd. | | 8,033 |
| 4,115 | | St. Barbara Ltd. | | 13,622 |
| 13,137 | | Vocus Group Ltd. (b) | | 29,610 |
| 4,654 | | Webjet Ltd. | | 35,993 |
| | | | | 487,146 |
| | | Austria – 0.2% | | |
| 899 | | AT&S Austria Technologie & Systemtechnik AG | | 15,862 |
| | | Belgium – 0.2% | | |
| 836 | | Bekaert S.A. | | 20,172 |
| | | Bermuda – 0.9% | | |
| 8,571 | | China Water Affairs Group Ltd. | | 9,172 |
| 3,188 | | Golden Ocean Group Ltd. | | 19,302 |
| 78,000 | | Huabao International Holdings Ltd. | | 33,170 |
| 65,679 | | K Wah International Holdings Ltd. | | 31,202 |
| | | | | 92,846 |
| | | Canada – 9.0% | | |
| 3,731 | | Advantage Oil & Gas Ltd. (b) | | 5,411 |
| 26,866 | | Alacer Gold Corp. (b) | | 49,592 |
| 2,239 | | Aphria, Inc. (b) | | 12,874 |
| 8,449 | | Athabasca Oil Corp. (b) | | 6,127 |
| 2,237 | | ATS Automation Tooling Systems, Inc. (b) | | 23,579 |
| 2,231 | | Canfor Corp. (b) | | 27,013 |
| 1,647 | | Canfor Pulp Products, Inc. | | 19,556 |
| 942 | | Capital Power Corp. | | 18,347 |
| 4,261 | | Cascades, Inc. | | 31,929 |
| 13,042 | | Centerra Gold, Inc. (b) | | 55,982 |
| 135 | | Colliers International Group, Inc. | | 7,445 |
| 1,287 | | Detour Gold Corp. (b) | | 10,870 |
| 123 | | FirstService Corp. | | 8,441 |
| 9,527 | | Fortuna Silver Mines, Inc. (b) | | 34,892 |
| 1,262 | | Genworth MI Canada, Inc. | | 37,161 |
| 3,289 | | Gibson Energy, Inc. | | 45,003 |
| Shares | | Description | | Value |
|
| | | Canada (Continued) | | |
| 10,270 | | Hudbay Minerals, Inc. | | $48,597 |
| 2,811 | | Interfor Corp. (b) | | 29,691 |
| 9,770 | | Ivanhoe Mines Ltd., Class A (b) | | 16,961 |
| 1,129 | | Linamar Corp. | | 37,462 |
| 5,092 | | Martinrea International, Inc. | | 40,506 |
| 941 | | Norbord, Inc. | | 25,021 |
| 17,222 | | OceanGold Corp. | | 62,823 |
| 1,224 | | Parex Resources, Inc. (b) | | 14,659 |
| 3,621 | | Peyto Exploration & Development Corp. | | 18,779 |
| 6,024 | | Precision Drilling Corp. (b) | | 10,458 |
| 2,016 | | Savaria Corp. | | 19,286 |
| 6,351 | | Secure Energy Services, Inc. | | 32,611 |
| 10,683 | | Tamarack Valley Energy Ltd. (b) | | 18,468 |
| 1,433 | | TFI International, Inc. | | 37,053 |
| 2,346 | | Transcontinental, Inc., Class A | | 33,166 |
| 6,173 | | Tricon Capital Group, Inc. | | 43,815 |
| 12,733 | | Western Forest Products, Inc. | | 17,628 |
| 655 | | WestJet Airlines Ltd. | | 8,636 |
| | | | | 909,842 |
| | | Cayman Islands – 1.3% | | |
| 12,000 | | HKBN Ltd. | | 18,206 |
| 58,714 | | Kingboard Laminates Holdings Ltd. | | 48,438 |
| 13,714 | | Texhong Textile Group Ltd. | | 15,675 |
| 351,429 | | Tongda Group Holdings Ltd. | | 35,006 |
| 61,714 | | Truly International Holdings Ltd. (b) | | 7,487 |
| 12,857 | | Value Partners Group Ltd. | | 8,915 |
| | | | | 133,727 |
| | | Denmark – 0.3% | | |
| 2,000 | | NKT A.S. (b) | | 27,300 |
| | | Finland – 0.7% | | |
| 921 | | Cramo OYJ | | 15,744 |
| 3,744 | | Finnair OYJ | | 30,393 |
| 1,397 | | Valmet OYJ | | 28,731 |
| | | | | 74,868 |
| | | France – 0.6% | | |
| 18,579 | | CGG S.A. (b) | | 24,607 |
| 1,367 | | Neopost S.A. | | 37,308 |
| | | | | 61,915 |
| | | Germany – 2.5% | | |
| 196 | | AURELIUS Equity Opportunities SE & Co., KGaA | | 7,123 |
| 594 | | Aurubis AG | | 29,414 |
| 3,497 | | Borussia Dortmund GmbH & Co. KGaA | | 31,913 |
| 4,666 | | Deutz AG | | 27,506 |
| 2,808 | | ElringKlinger AG | | 21,877 |
| 135 | | Hypoport AG (b) | | 22,923 |
| 898 | | Kloeckner & Co., SE | | 6,235 |
| 505 | | Leoni AG | | 17,520 |
Page 92
See Notes to Financial Statements
First Trust Developed Markets ex-US Small Cap AlphaDEX® Fund (FDTS)
Portfolio of Investments (Continued)
December 31, 2018
| Shares | | Description | | Value |
| COMMON STOCKS (a) (Continued) |
| | | Germany (Continued) | | |
| 416 | | Salzgitter AG | | $12,188 |
| 782 | | Suedzucker AG | | 10,120 |
| 660 | | Takkt AG | | 10,315 |
| 1,592 | | TLG Immobilien AG | | 44,178 |
| 405 | | Wacker Neuson SE | | 7,666 |
| | | | | 248,978 |
| | | Greece – 0.8% | | |
| 3,231 | | FF Group (b) (c) (d) | | 8,884 |
| 1,989 | | Motor Oil Hellas Corinth Refineries S.A. | | 47,857 |
| 3,140 | | Mytilineos Holdings S.A. | | 26,227 |
| | | | | 82,968 |
| | | Hong Kong – 0.9% | | |
| 15,857 | | Hopewell Holdings Ltd. | | 69,661 |
| 9,429 | | Shanghai Industrial Holdings Ltd. | | 19,074 |
| | | | | 88,735 |
| | | Ireland – 0.1% | | |
| 4,305 | | Greencore Group PLC | | 9,778 |
| | | Isle Of Man (U.K.) – 0.3% | | |
| 6,539 | | Playtech PLC | | 32,088 |
| | | Israel – 2.0% | | |
| 2,553 | | Airport City Ltd. (b) | | 31,359 |
| 162 | | Israel (The) Corp., Ltd. | | 43,000 |
| 18,726 | | Migdal Insruance & Financial Holding Ltd. | | 15,951 |
| 104,273 | | Oil Refineries Ltd. | | 49,722 |
| 199 | | Paz Oil Co., Ltd. | | 30,021 |
| 1,719 | | Phoenix Holdings (The) Ltd. | | 8,739 |
| 1,431 | | Tower Semiconductor Ltd. (b) | | 21,431 |
| | | | | 200,223 |
| | | Italy – 1.0% | | |
| 483 | | ASTM S.p.A. | | 9,673 |
| 32,001 | | Fincantieri S.p.A. | | 33,805 |
| 24,363 | | Juventus Football Club S.p.A. (b) | | 29,645 |
| 14,565 | | Saras S.p.A. | | 28,219 |
| | | | | 101,342 |
| | | Japan – 41.4% | | |
| 300 | | Aica Kogyo Co., Ltd. | | 10,073 |
| 500 | | Aichi Steel Corp. | | 15,670 |
| 1,500 | | Arcland Sakamoto Co., Ltd. | | 18,503 |
| 1,100 | | Asahi Holdings, Inc. | | 22,581 |
| 2,200 | | ASAHI YUKIZAI CORP. | | 29,406 |
| 300 | | BML, Inc. | | 7,724 |
| 5,700 | | Broadleaf Co., Ltd. | | 27,719 |
| 800 | | Central Glass Co., Ltd. | | 15,809 |
| 200 | | Central Security Patrols Co., Ltd. | | 8,996 |
| 3,200 | | Citizen Watch Co., Ltd. | | 15,824 |
| 800 | | CKD Corp. | | 6,817 |
| Shares | | Description | | Value |
|
| | | Japan (Continued) | | |
| 1,700 | | Computer Engineering & Consulting Ltd. | | $28,322 |
| 500 | | Comture Corp. | | 10,812 |
| 400 | | Daido Steel Co., Ltd. | | 15,784 |
| 300 | | Daiho Corp. | | 9,703 |
| 3,600 | | Daikyonishikawa Corp. | | 35,539 |
| 800 | | Daio Paper Corp. | | 9,248 |
| 800 | | Daiwabo Holdings Co., Ltd. | | 37,225 |
| 1,500 | | Descente Ltd. | | 24,716 |
| 900 | | Dowa Holdings Co., Ltd. | | 27,097 |
| 3,200 | | Eagle Industry Co., Ltd. | | 37,283 |
| 1,500 | | ES-Con Japan Ltd. | | 8,841 |
| 900 | | Exedy Corp. | | 22,097 |
| 700 | | FCC Co., Ltd | | 16,458 |
| 2,000 | | Fuji Corp. | | 23,539 |
| 1,000 | | Fuji Soft, Inc. | | 38,046 |
| 4,400 | | Fujikura Ltd. | | 17,543 |
| 400 | | Fukushima Industries Corp. | | 13,029 |
| 1,500 | | Futaba Industrial Co., Ltd. | | 7,541 |
| 2,100 | | Geo Holdings Corp. | | 31,978 |
| 3,200 | | G-Tekt Corp. | | 42,743 |
| 900 | | Hamakyorex Co., Ltd. | | 31,162 |
| 400 | | Heiwado Co., Ltd. | | 9,197 |
| 600 | | HIS Co., Ltd. | | 21,815 |
| 300 | | Hitachi Transport System Ltd. | | 8,540 |
| 3,900 | | Hokuetsu Corp. | | 17,756 |
| 3,100 | | Hokuriku Electric Power Co. | | 27,124 |
| 5,300 | | Hosiden Corp. | | 34,864 |
| 4,000 | | Iino Kaiun Kaisha Ltd. | | 14,634 |
| 2,100 | | Inabata & Co., Ltd. | | 26,843 |
| 900 | | Information Services International-Dentsu Ltd. | | 22,573 |
| 2,700 | | Ishihara Sangyo Kaisha
Ltd. (b) | | 26,481 |
| 1,000 | | Itochu Enex Co., Ltd. | | 8,777 |
| 600 | | Iwatani Corp. | | 20,090 |
| 400 | | JAC Recruitment Co., Ltd. | | 6,828 |
| 1,300 | | Jafco Co., Ltd. | | 41,453 |
| 1,200 | | Japan Aviation Electronics Industry Ltd. | | 13,926 |
| 1,900 | | Jeol Ltd. | | 28,724 |
| 2,100 | | Kanematsu Corp. | | 25,578 |
| 900 | | Kanto Denka Kogyo Co., Ltd. | | 6,544 |
| 2,500 | | Keihin Corp. | | 42,060 |
| 1,400 | | KH Neochem Co., Ltd. | | 29,404 |
| 500 | | Kintetsu World Express, Inc. | | 7,399 |
| 1,000 | | Kobe Bussan Co., Ltd. | | 29,606 |
| 3,500 | | Kobe Steel Ltd. | | 24,397 |
| 1,200 | | Kohnan Shoji Co., Ltd. | | 29,145 |
| 1,200 | | Konoike Transport Co., Ltd. | | 17,550 |
| 700 | | Krosaki Harima Corp. | | 42,343 |
| 500 | | Kusuri no Aoki Holdings Co., Ltd. | | 31,614 |
| 700 | | KYB Corp. | | 16,963 |
| 2,700 | | Kyoei Steel Ltd. | | 40,892 |
See Notes to Financial Statements
Page 93
First Trust Developed Markets ex-US Small Cap AlphaDEX® Fund (FDTS)
Portfolio of Investments (Continued)
December 31, 2018
| Shares | | Description | | Value |
| COMMON STOCKS (a) (Continued) |
| | | Japan (Continued) | | |
| 700 | | Kyokuto Kaihatsu Kogyo Co., Ltd. | | $8,999 |
| 800 | | LEC, Inc. | | 11,941 |
| 3,300 | | LIXIL VIVA Corp. | | 46,878 |
| 3,200 | | Maeda Corp. | | 29,984 |
| 500 | | Maeda Kosen Co., Ltd | | 12,052 |
| 900 | | Makino Milling Machine Co., Ltd. | | 31,942 |
| 200 | | Mani, Inc. | | 7,618 |
| 500 | | Maruwa Unyu Kikan Co., Ltd. | | 12,349 |
| 5,900 | | MCJ Co., Ltd. | | 35,689 |
| 2,400 | | Mirait Holdings Corp. | | 35,298 |
| 4,000 | | Mitsubishi Logisnext Co., Ltd. | | 38,757 |
| 1,700 | | Mitsui E&S Holdings Co., Ltd. | | 15,976 |
| 300 | | Mitsui Sugar Co., Ltd. | | 7,617 |
| 2,800 | | Mitsui-Soko Holdings Co., Ltd. | | 48,436 |
| 2,100 | | Mixi, Inc. | | 44,106 |
| 1,200 | | Nagase & Co., Ltd. | | 16,587 |
| 1,700 | | NET One Systems Co., Ltd. | | 29,997 |
| 800 | | Nichiha Corp. | | 20,174 |
| 3,000 | | Nihon Nohyaku Co., Ltd. | | 13,959 |
| 3,200 | | Nikkiso Co., Ltd. | | 26,948 |
| 1,700 | | Nippo Corp. | | 32,773 |
| 800 | | Nippon Carbon Co., Ltd. | | 29,378 |
| 300 | | Nippon Electric Glass Co., Ltd. | | 7,371 |
| 600 | | Nippon Flour Mills Co., Ltd. | | 10,051 |
| 14,000 | | Nippon Light Metal Holdings Co., Ltd. | | 28,484 |
| 4,800 | | Nippon Sheet Glass Co.,
Ltd. | | 36,611 |
| 100 | | Nippon Shokubai Co., Ltd. | | 6,396 |
| 700 | | Nippon Soda Co., Ltd. | | 17,180 |
| 8,000 | | Nippon Suisan Kaisha Ltd. | | 44,815 |
| 10,800 | | Nippon Yakin Kogyo Co., Ltd. | | 22,860 |
| 600 | | Nishio Rent All Co., Ltd. | | 18,037 |
| 400 | | Nohmi Bosai Ltd. | | 6,730 |
| 2,400 | | NOK Corp. | | 33,633 |
| 800 | | Noritake Co., Ltd. | | 33,137 |
| 1,900 | | Noritsu Koki Co., Ltd. | | 26,089 |
| 300 | | Ohsho Food Service Corp. | | 19,844 |
| 1,500 | | Open Door, Inc. (b) | | 34,583 |
| 1,700 | | OPT Holding, Inc. | | 22,381 |
| 3,200 | | Pacific Industrial Co., Ltd. | | 42,859 |
| 900 | | Piolax, Inc. | | 18,106 |
| 2,400 | | Poletowin Pitcrew Holdings, Inc. | | 20,298 |
| 3,900 | | Press Kogyo Co., Ltd. | | 19,214 |
| 4,100 | | Pressance Corp. | | 49,003 |
| 1,500 | | Raito Kogyo Co., Ltd. | | 20,022 |
| 2,000 | | Rakus Co., Ltd. | | 31,039 |
| 1,200 | | Rengo Co., Ltd. | | 9,503 |
| 4,200 | | RENOVA, Inc. (b) | | 30,579 |
| 1,300 | | Ryobi Ltd. | | 31,241 |
| 500 | | S Foods, Inc. | | 18,681 |
| 300 | | SanBio Co., Ltd. (b) | | 22,198 |
| 200 | | Sanyo Chemical Industries Ltd. | | 9,251 |
| Shares | | Description | | Value |
|
| | | Japan (Continued) | | |
| 700 | | Sanyo Denki Co., Ltd. | | $22,736 |
| 1,300 | | Sanyo Special Steel Co., Ltd. | | 27,600 |
| 3,700 | | SBS Holdings, Inc. | | 47,868 |
| 300 | | SEC Carbon Ltd. | | 24,470 |
| 1,100 | | Seiko Holdings Corp. | | 21,206 |
| 3,800 | | Senko Group Holdings Co., Ltd. | | 28,880 |
| 3,100 | | Shinmaywa Industries Ltd. | | 37,900 |
| 500 | | Ship Healthcare Holdings, Inc. | | 18,498 |
| 3,500 | | Shizuoka Gas Co., Ltd. | | 27,207 |
| 500 | | Shoei Co., Ltd. | | 17,084 |
| 1,400 | | Showa Corp. | | 16,541 |
| 2,100 | | SKY Perfect JSAT Holdings, Inc. | | 8,986 |
| 4,600 | | Sodick Co., Ltd. | | 28,917 |
| 3,200 | | Solasto Corp. | | 32,057 |
| 600 | | Sotetsu Holdings, Inc. | | 17,901 |
| 4,000 | | Sourcenext Corp. | | 19,853 |
| 1,800 | | Sumitomo Forestry Co., Ltd. | | 23,649 |
| 300 | | Sumitomo Osaka Cement Co., Ltd. | | 12,344 |
| 500 | | Sumitomo Seika Chemicals Co., Ltd. | | 19,251 |
| 3,600 | | Sun Frontier Fudousan Co., Ltd. | | 34,947 |
| 3,100 | | Systena Corp. | | 36,033 |
| 3,500 | | Tachi-S Co., Ltd. | | 45,824 |
| 900 | | Taikisha Ltd. | | 24,034 |
| 1,100 | | Takara Bio, Inc. | | 25,662 |
| 2,800 | | Takara Holdings, Inc. | | 34,181 |
| 1,500 | | Takeuchi Manufacturing Co., Ltd. | | 23,183 |
| 500 | | Tamron Co., Ltd. | | 7,162 |
| 1,200 | | Toho Holdings Co., Ltd. | | 29,429 |
| 3,400 | | Toho Titanium Co., Ltd. | | 31,238 |
| 1,300 | | Toho Zinc Co., Ltd. | | 39,793 |
| 2,000 | | Tokai Rika Co., Ltd. | | 33,283 |
| 300 | | Token Corp. | | 17,819 |
| 1,100 | | Tokuyama Corp. | | 24,297 |
| 800 | | Tokyo Seimitsu Co., Ltd. | | 20,240 |
| 1,500 | | Tokyo Steel Manufacturing Co., Ltd. | | 12,180 |
| 1,100 | | Tokyu Construction Co., Ltd. | | 10,006 |
| 1,600 | | Topre Corp. | | 31,984 |
| 600 | | Towa Pharmaceutical Co., Ltd. | | 41,987 |
| 1,200 | | TPR Co., Ltd. | | 24,546 |
| 800 | | Trusco Nakayama Corp. | | 21,138 |
| 1,300 | | Trust Tech, Inc. | | 32,795 |
| 1,200 | | TS Tech Co., Ltd. | | 33,064 |
| 700 | | Tsubakimoto Chain Co. | | 23,087 |
| 4,300 | | Tsukui Corp. | | 32,798 |
| 400 | | UACJ Corp. | | 7,857 |
| 800 | | Ube Industries Ltd. | | 16,306 |
| 1,100 | | Ulvac, Inc. | | 32,015 |
| 2,700 | | Unipres Corp. | | 45,844 |
| 200 | | United Arrows Ltd. | | 6,414 |
| 1,700 | | UNITED, Inc. | | 22,924 |
| 500 | | Unizo Holdings Co., Ltd. | | 9,320 |
| 1,900 | | ValueCommerce Co., Ltd. | | 21,253 |
Page 94
See Notes to Financial Statements
First Trust Developed Markets ex-US Small Cap AlphaDEX® Fund (FDTS)
Portfolio of Investments (Continued)
December 31, 2018
| Shares | | Description | | Value |
| COMMON STOCKS (a) (Continued) |
| | | Japan (Continued) | | |
| 900 | | Vector, Inc. | | $11,775 |
| 900 | | Vision, Inc. (b) | | 31,244 |
| 1,900 | | Vital KSK Holdings, Inc. | | 19,571 |
| 600 | | WDB Holdings Co., Ltd. | | 13,061 |
| 900 | | YAMABIKO Corp. | | 8,392 |
| 700 | | Yamato Kogyo Co., Ltd. | | 16,433 |
| 4,400 | | Yamazen Corp. | | 41,429 |
| 900 | | Yaoko Co., Ltd. | | 49,268 |
| 800 | | Yellow Hat Ltd. | | 19,131 |
| 300 | | Yuasa Trading Co., Ltd. | | 8,608 |
| 3,800 | | Yurtec Corp. | | 29,677 |
| 1,000 | | Zenrin Co., Ltd. | | 21,240 |
| | | | | 4,164,022 |
| | | Jersey – 1.3% | | |
| 22,512 | | Centamin PLC | | 31,219 |
| 16,067 | | Genel Energy PLC (b) | | 36,330 |
| 21,729 | | Highland Gold Mining Ltd. | | 39,272 |
| 554 | | Wizz Air Holdings PLC (b) (e) | | 19,786 |
| | | | | 126,607 |
| | | Luxembourg – 0.5% | | |
| 867 | | ADO Properties S.A. (e) | | 45,218 |
| | | Netherlands – 0.3% | | |
| 802 | | ASM International N.V. | | 33,264 |
| 1,590 | | SRH N.V. (b) (c) (d) | | 0 |
| | | | | 33,264 |
| | | Norway – 1.8% | | |
| 1,505 | | Aker Solutions ASA (b) | | 6,903 |
| 1,282 | | Atea ASA | | 16,458 |
| 754 | | Austevoll Seafood ASA | | 9,313 |
| 20,120 | | DNO ASA | | 29,203 |
| 2,893 | | Entra ASA (e) | | 38,545 |
| 787 | | Grieg Seafood ASA | | 9,311 |
| 16,858 | | Kvaerner ASA (b) | | 23,513 |
| 65,603 | | NEL ASA (b) | | 35,008 |
| 2,425 | | Wallenius Wilhelmsen ASA (b) | | 8,330 |
| | | | | 176,584 |
| | | Portugal – 0.2% | | |
| 20,050 | | Sonae SGPS S.A. | | 18,608 |
| | | Singapore – 0.9% | | |
| 42,200 | | Hi-P International Ltd. | | 27,402 |
| 21,900 | | Wing Tai Holdings Ltd. | | 31,011 |
| 38,400 | | Yanlord Land Group Ltd. | | 34,373 |
| | | | | 92,786 |
| | | South Korea – 14.9% | | |
| 377 | | AK Holdings, Inc. | | 18,245 |
| 832 | | Amicogen, Inc. (b) | | 25,427 |
| 2,658 | | Asiana Airlines, Inc. (b) | | 9,850 |
| 3,679 | | BGF Co., Ltd. | | 26,608 |
| 1,065 | | Cheil Worldwide, Inc. | | 21,476 |
| 698 | | Daelim Industrial Co., Ltd. | | 64,120 |
| Shares | | Description | | Value |
|
| | | South Korea (Continued) | | |
| 518 | | Daou Technology, Inc. | | $8,751 |
| 2,919 | | DB HiTek Co., Ltd. | | 28,384 |
| 230 | | Dentium Co., Ltd. | | 11,853 |
| 155 | | Dongwon F&B Co., Ltd. | | 39,938 |
| 154 | | Dongwon Industries Co., Ltd. | | 28,018 |
| 338 | | Doosan Corp. | | 33,776 |
| 2,353 | | Doosan Infracore Co., Ltd. (b) | | 16,006 |
| 810 | | Ecopro Co., Ltd. (b) | | 23,956 |
| 547 | | F&F Co., Ltd. | | 19,634 |
| 1,284 | | Fila Korea Ltd. | | 61,565 |
| 57 | | GS Home Shopping, Inc. | | 9,175 |
| 309 | | Handsome Co., Ltd. | | 10,039 |
| 1,024 | | Hanjin Kal Corp. | | 27,348 |
| 2,986 | | Hanwha Chemical Corp. | | 54,057 |
| 1,093 | | Harim Holdings Co., Ltd. | | 11,265 |
| 2,517 | | HDC Holdings Co., Ltd. | | 38,912 |
| 924 | | Huchems Fine Chemical Corp. | | 19,957 |
| 4,059 | | Hwaseung Enterprise Co., Ltd. | | 38,742 |
| 117 | | Hyundai Department Store Co., Ltd. | | 9,479 |
| 207 | | Hyundai Home Shopping Network Corp. | | 18,366 |
| 945 | | Hyundai Livart Furniture Co., Ltd. | | 16,981 |
| 892 | | Hyundai Mipo Dockyard (b) | | 47,966 |
| 2,253 | | Il Dong Pharmaceutical Co., Ltd. | | 41,292 |
| 1,495 | | IS Dongseo Co., Ltd. | | 41,066 |
| 1,911 | | JB Financial Group Co., Ltd. | | 9,762 |
| 261 | | JW Pharmaceutical Corp. | | 9,532 |
| 621 | | JYP Entertainment Corp. | | 16,836 |
| 1,910 | | Korea Line Corp. (b) | | 37,231 |
| 312 | | Korea Petro Chemical Ind. Co., Ltd. | | 42,922 |
| 20,659 | | Korea Real Estate Investment & Trust Co., Ltd. | | 49,990 |
| 468 | | Kumho Petrochemical Co., Ltd. | | 36,616 |
| 1,328 | | LF Corp. | | 29,576 |
| 1,111 | | LOTTE Fine Chemical Co., Ltd. | | 40,873 |
| 56 | | Lotte Food Co., Ltd. | | 35,583 |
| 345 | | LOTTE Himart Co., Ltd. | | 14,424 |
| 337 | | LS Corp. | | 14,829 |
| 507 | | Mezzion Pharma Co., Ltd. (b) | | 41,803 |
| 5,463 | | Moorim P&P Co., Ltd. | | 29,670 |
| 315 | | OCI Co., Ltd. | | 30,207 |
| 1,089 | | Poongsan Corp. | | 26,693 |
| 396 | | Samjin Pharmaceutical Co., Ltd. | | 14,249 |
| 630 | | SFA Engineering Corp. | | 19,536 |
| 253 | | Shinsegae International, Inc. | �� | 44,102 |
| 687 | | SK Discovery Co., Ltd. | | 16,070 |
| 685 | | SM Entertainment Co., Ltd. (b) | | 32,107 |
| 34 | | Taekwang Industrial Co., Ltd. | | 40,222 |
| 3,631 | | Taeyoung Engineering & Construction Co., Ltd. | | 36,935 |
| 291 | | Youngone Corp. | | 10,002 |
| | | | | 1,502,022 |
See Notes to Financial Statements
Page 95
First Trust Developed Markets ex-US Small Cap AlphaDEX® Fund (FDTS)
Portfolio of Investments (Continued)
December 31, 2018
| Shares | | Description | | Value |
| COMMON STOCKS (a) (Continued) |
| | | Spain – 0.6% | | |
| 4,090 | | Ence Energia y Celulosa S.A. | | $25,703 |
| 533 | | Let’s GOWEX S.A. (b) (c) (d) (f) | | 0 |
| 1,423 | | Mediaset Espana Comunicacion S.A. | | 8,951 |
| 10,630 | | Sacyr S.A. | | 21,241 |
| | | | | 55,895 |
| | | Sweden – 1.4% | | |
| 2,535 | | Bravida Holding AB (e) | | 17,533 |
| 147 | | Evolution Gaming Group AB (e) | | 8,450 |
| 754 | | Hemfosa Fastigheter AB | | 5,947 |
| 7,913 | | Klovern AB, B Shares | | 9,178 |
| 5,653 | | Kungsleden AB | | 40,119 |
| 2,777 | | Scandic Hotels Group AB (e) | | 24,471 |
| 2,593 | | Wihlborgs Fastigheter AB | | 29,959 |
| | | | | 135,657 |
| | | Switzerland – 0.7% | | |
| 5,826 | | GAM Holding AG | | 22,856 |
| 277 | | Huber + Suhner AG | | 18,459 |
| 5 | | Interroll Holding AG | | 7,387 |
| 569 | | Swissquote Group Holding S.A. | | 26,195 |
| | | | | 74,897 |
| | | United Kingdom – 4.3% | | |
| 1,342 | | Blue Prism Group PLC (b) | | 18,918 |
| 11,379 | | Crest Nicholson Holdings PLC | | 47,601 |
| 3,486 | | Dairy Crest Group PLC | | 18,760 |
| 4,273 | | Dart Group PLC | | 42,046 |
| 10,264 | | Drax Group PLC | | 46,940 |
| 96,364 | | EnQuest PLC (b) | | 26,960 |
| 15,922 | | Ferrexpo PLC | | 39,503 |
| 789 | | Galliford Try PLC | | 6,265 |
| 843 | | Games Workshop Group PLC | | 32,665 |
| 1,626 | | Greene King PLC | | 10,943 |
| 1,027 | | Hunting PLC | | 6,283 |
| 12,755 | | John Laing Group PLC (e) | | 53,975 |
| 1,569 | | Keller Group PLC | | 9,869 |
| 19,145 | | Learning Technologies Group PLC | | 16,935 |
| 20,024 | | Pets at Home Group PLC | | 29,555 |
| 4,097 | | Redrow PLC | | 25,661 |
| 3,320 | | Sole Realisation Co.,
PLC (b) (c) (d) | | 0 |
| | | | | 432,879 |
| | | United States – 0.2% | | |
| 10,921 | | Gran Tierra Energy, Inc. (b) | | 23,839 |
| | | Total Common Stocks | | 9,470,068 |
| | | (Cost $11,415,589) | | |
| REAL ESTATE INVESTMENT TRUSTS (a) – 5.6% |
| | | Australia – 1.1% | | |
| 12,636 | | Abacus Property Group | | 29,103 |
| Shares | | Description | | Value |
|
| | | Australia (Continued) | | |
| 11,077 | | Growthpoint Properties Australia Ltd. | | $29,180 |
| 17,201 | | National Storage REIT | | 21,263 |
| 19,586 | | Viva Energy REIT | | 31,040 |
| | | | | 110,586 |
| | | Canada – 1.0% | | |
| 2,287 | | Artis Real Estate Investment Trust | | 15,479 |
| 4,523 | | Dream Global Real Estate Investment Trust | | 39,425 |
| 1,211 | | Granite Real Estate Investment Trust | | 47,200 |
| | | | | 102,104 |
| | | Germany – 0.3% | | |
| 2,100 | | alstria Office REIT-AG | | 29,354 |
| | | Ireland – 0.7% | | |
| 29,627 | | Green REIT PLC | | 45,826 |
| 18,903 | | Hibernia REIT PLC | | 27,116 |
| | | | | 72,942 |
| | | Singapore – 0.5% | | |
| 62,300 | | Mapletree North Asia Commercial Trust | | 52,109 |
| | | Spain – 0.4% | | |
| 4,081 | | Lar Espana Real Estate Socimi S.A. | | 34,835 |
| | | United Kingdom – 1.6% | | |
| 41,079 | | Hansteen Holdings PLC | | 48,511 |
| 17,929 | | LondonMetric Property PLC | | 39,763 |
| 21,612 | | Tritax Big Box REIT PLC | | 36,169 |
| 2,677 | | UNITE Group (The) PLC | | 27,502 |
| 812 | | Workspace Group PLC | | 8,212 |
| | | | | 160,157 |
| | | Total Real Estate Investment Trusts | | 562,087 |
| | | (Cost $628,371) | | |
| | | Total Investments – 99.7% | | 10,032,155 |
| | | (Cost $12,043,960) (g) | | |
| | | Net Other Assets and Liabilities – 0.3% | | 31,025 |
| | | Net Assets – 100.0% | | $10,063,180 |
|
| (a) | Portfolio securities are categorized based upon their country of incorporation, which can be different from the country categorization of the Fund’s underlying index. For a breakdown of the portfolio securities by sector, please see the Fund Performance Overview. |
| (b) | Non-income producing security. |
Page 96
See Notes to Financial Statements
First Trust Developed Markets ex-US Small Cap AlphaDEX® Fund (FDTS)
Portfolio of Investments (Continued)
December 31, 2018
| (c) | This security is fair valued by the Advisor’s Pricing Committee in accordance with procedures adopted by the Trust’s Board of Trustees, and in accordance with the provisions of the Investment Company Act of 1940, as amended. At December 31, 2018, securities noted as such are valued at $8,884 or 0.1% of net assets. |
| (d) | This security’s value was determined using significant unobservable inputs (see Note 2A – Portfolio Valuation in the Notes to Financial Statements). |
| (e) | This security is restricted in the U.S. and cannot be offered for public sale without first being registered under the Securities Act of 1933, as amended. This security is not restricted on the foreign exchange where it trades freely without any additional registration. As such, it does not require the additional disclosure required of restricted securities. |
| (f) | This issuer has filed for protection in bankruptcy court. |
| (g) | Aggregate cost for federal income tax purposes was $12,135,502. As of December 31, 2018, the aggregate gross unrealized appreciation for all investments in which there was an excess of value over tax cost was $244,392 and the aggregate gross unrealized depreciation for all investments in which there was an excess of tax cost over value was $2,347,739. The net unrealized depreciation was $2,103,347. |
Valuation Inputs
A summary of the inputs used to value the Fund’s investments as of December 31, 2018 is as follows (see Note 2A - Portfolio Valuation in the Notes to Financial Statements):
| | Total
Value at
12/31/2018 | Level 1
Quoted
Prices | Level 2
Significant
Observable
Inputs | Level 3
Significant
Unobservable
Inputs |
| Common Stocks: | | | | |
| Greece | $ 82,968 | $ 74,084 | $ — | $ 8,884 |
| Netherlands | 33,264 | 33,264 | — | —** |
| Spain | 55,895 | 55,895 | — | —** |
| United Kingdom | 432,879 | 432,879 | — | —** |
| Other Country Categories* | 8,865,062 | 8,865,062 | — | — |
| Real Estate Investment Trusts* | 562,087 | 562,087 | — | — |
| Total Investments | $ 10,032,155 | $ 10,023,271 | $— | $ 8,884 |
| * | See Portfolio of Investments for country breakout. |
| ** | Investment is valued at $0. |
As of December 31, 2018, the Fund transferred a common stock valued at $8,884 from Level 1 to Level 3 of the fair value hierarchy. The common stock that transferred from Level 1 to Level 3 did so as a result of the security being halted on the primary exchange.
Level 3 Common Stocks are fair valued by the Advisor’s Pricing Committee and are footnoted in the Portfolio of Investments. The Level 3 Common Stocks values are based on unobservable and non-quantitative inputs.
Currency Exposure
Diversification | % of Total
Investments |
| JPY | 41.5% |
| KRW | 15.0 |
| CAD | 10.1 |
| EUR | 8.9 |
| GBP | 7.6 |
| AUD | 6.0 |
| HKD | 2.9 |
| ILS | 2.0 |
| NOK | 2.0 |
| SGD | 1.4 |
| SEK | 1.4 |
| CHF | 0.7 |
| DKK | 0.3 |
| USD | 0.2 |
| Total | 100.0% |
| Currency Abbreviations |
| AUD | Australian Dollar |
| CAD | Canadian Dollar |
| CHF | Swiss Franc |
| DKK | Danish Krone |
| EUR | Euro |
| GBP | British Pound Sterling |
| HKD | Hong Kong Dollar |
| ILS | Israeli Shekel |
| JPY | Japanese Yen |
| KRW | South Korean Won |
| NOK | Norwegian Krone |
| SEK | Swedish Krona |
| SGD | Singapore Dollar |
| USD | United States Dollar |
See Notes to Financial Statements
Page 97
First Trust Emerging Markets Small Cap AlphaDEX® Fund (FEMS)
Portfolio of Investments
December 31, 2018
| Shares | | Description | | Value |
| COMMON STOCKS (a) – 97.2% |
| | | Bermuda – 2.0% | | |
| 1,759,554 | | China Oriental Group Co., Ltd. | | $1,047,126 |
| 811,620 | | Haitong International Securities Group Ltd. | | 254,975 |
| 2,781,169 | | Sihuan Pharmaceutical Holdings Group Ltd. | | 486,585 |
| 2,550,326 | | Sinopec Kantons Holdings Ltd. | | 1,130,149 |
| 358,337 | | Yuexiu Transport Infrastructure Ltd. | | 271,825 |
| | | | | 3,190,660 |
| | | Brazil – 9.8% | | |
| 91,896 | | Bradespar S.A. (Preference Shares) | | 751,386 |
| 116,644 | | Cia de Saneamento de Minas Gerais-Copasa | | 1,851,798 |
| 212,149 | | Cia Paranaense de Energia, Class B (Preference Shares) | | 1,672,232 |
| 364,730 | | Cia Siderurgica Nacional S.A. (b) | | 831,894 |
| 135,182 | | Ez Tec Empreendimentos e Participacoes S.A. | | 872,671 |
| 168,726 | | Grendene S.A. | | 356,977 |
| 88,921 | | Light S.A. | | 378,558 |
| 711,483 | | Metalurgica Gerdau S.A. (Preference Shares) | | 1,273,996 |
| 3,381,239 | | Oi S.A. (b) | | 1,090,511 |
| 342,801 | | QGEP Participacoes S.A. | | 826,986 |
| 93,091 | | SLC Agricola S.A. | | 1,005,428 |
| 218,371 | | Sul America S.A. | | 1,611,407 |
| 224,080 | | Tupy S.A. | | 1,164,991 |
| 152,850 | | Unipar Carbocloro S.A. | | 1,453,667 |
| 136,482 | | Usinas Siderurgicas de Minas Gerais S.A., Class A (Preference Shares) | | 324,676 |
| | | | | 15,467,178 |
| | | Cayman Islands – 13.3% | | |
| 8,558,087 | | Anton Oilfield Services Group (b) | | 852,475 |
| 1,378,509 | | Asia Cement China Holdings Corp. | | 966,479 |
| 1,046,626 | | Ausnutria Dairy Corp Ltd. | | 1,176,210 |
| 8,091,605 | | Bosideng International Holdings Ltd. (c) | | 1,529,350 |
| 2,004,501 | | China Lesso Group Holdings Ltd. | | 1,003,466 |
| 11,550 | | China Metal Recycling Holdings Ltd. (b) (d) (e) | | 0 |
| 2,947,338 | | China SCE Group Holdings Ltd. | | 1,072,717 |
| 619,744 | | China Tian Lun Gas Holdings Ltd. | | 508,110 |
| 1,091,526 | | CIMC Enric Holdings Ltd. | | 834,971 |
| 2,059,950 | | Dongyue Group Ltd. | | 1,062,793 |
| 12,135,509 | | GCL-Poly Energy Holdings Ltd. (b) | | 736,143 |
| Shares | | Description | | Value |
|
| | | Cayman Islands (Continued) | | |
| 134,601 | | General Interface Solution Holding Ltd. | | $394,121 |
| 886,062 | | Kaisa Group Holdings Ltd. | | 282,888 |
| 1,963,264 | | Kasen International Holdings Ltd. | | 869,999 |
| 621,535 | | KWG Group Holdings Ltd. | | 550,059 |
| 2,638,639 | | Lonking Holdings Ltd. | | 684,048 |
| 643,939 | | Microport Scientific Corp. | | 633,207 |
| 18,640 | | Pharmally International Holding Co., Ltd. | | 92,178 |
| 2,680,547 | | Powerlong Real Estate Holdings Ltd. | | 1,054,350 |
| 965,965 | | Tianneng Power International Ltd. | | 805,536 |
| 532,776 | | Times China Holdings Ltd. | | 591,936 |
| 497,047 | | TPK Holding Co., Ltd. | | 781,058 |
| 2,714,081 | | VSTECS Holdings Ltd. | | 1,313,628 |
| 500,081 | | Yihai International Holding Ltd. (c) | | 1,222,342 |
| 1,399,822 | | Yuzhou Properties Co., Ltd. | | 577,412 |
| 509,194 | | Zhen Ding Technology Holding Ltd. | | 1,328,606 |
| | | | | 20,924,082 |
| | | Chile – 1.0% | | |
| 1,995,291 | | AES Gener S.A. | | 556,324 |
| 56,661 | | CAP S.A. | | 496,396 |
| 32,364 | | Inversiones La Construccion S.A. | | 522,301 |
| | | | | 1,575,021 |
| | | China – 3.5% | | |
| 1,549,738 | | Beijing Capital Land Ltd., Class H | | 556,128 |
| 1,404,645 | | China BlueChemical Ltd., Class H | | 441,278 |
| 3,062,190 | | China Suntien Green Energy Corp., Ltd., Class H | | 786,029 |
| 2,864,626 | | Huaneng Renewables Corp., Ltd., Class H | | 768,242 |
| 330,855 | | Livzon Pharmaceutical Group Inc., Class H | | 961,235 |
| 1,402,259 | | Shandong Chenming Paper Holdings Ltd., Class H | | 802,263 |
| 2,789,567 | | Sinotrans Ltd., Class H | | 1,211,229 |
| | | | | 5,526,404 |
| | | Hong Kong – 3.5% | | |
| 386,083 | | BYD Electronic International Co., Ltd. | | 485,161 |
| 634,992 | | China Everbright Ltd. | | 1,125,559 |
| 882,469 | | China Overseas Grand Oceans Group Ltd. | | 289,630 |
| 1,278,482 | | China Power International Development Ltd. | | 290,620 |
| 8,690,988 | | China South City Holdings Ltd. | | 1,231,977 |
| 2,418,656 | | Poly Property Group Co., Ltd. | | 756,747 |
Page 98
See Notes to Financial Statements
First Trust Emerging Markets Small Cap AlphaDEX® Fund (FEMS)
Portfolio of Investments (Continued)
December 31, 2018
| Shares | | Description | | Value |
| COMMON STOCKS (a) (Continued) |
| | | Hong Kong (Continued) | | |
| 3,835,635 | | Shougang Fushan Resources Group Ltd. | | $778,834 |
| 1,289,680 | | Sino-Ocean Group Holding Ltd. | | 568,213 |
| | | | | 5,526,741 |
| | | India – 4.3% | | |
| 789,120 | | Adani Enterprises Ltd. | | 1,813,569 |
| 73,325 | | Graphite India Ltd. | | 791,908 |
| 12,321 | | HEG Ltd. | | 654,214 |
| 1,173,794 | | Indiabulls Real Estate Ltd. (b) | | 1,466,086 |
| 209,950 | | Jindal Steel & Power Ltd. (b) | | 495,442 |
| 73,040 | | Reliance Capital Ltd. | | 239,840 |
| 205,981 | | Reliance Infrastructure Ltd. | | 930,256 |
| 70,263 | | Sterlite Technologies Ltd. | | 295,534 |
| | | | | 6,686,849 |
| | | Indonesia – 5.8% | | |
| 20,056,464 | | Aneka Tambang Tbk | | 1,066,982 |
| 3,923,081 | | Bukit Asam Tbk PT | | 1,173,105 |
| 11,005,008 | | Bumi Serpong Damai Tbk PT (b) | | 960,451 |
| 8,826,933 | | Erajaya Swasembada Tbk PT | | 1,350,435 |
| 7,565,943 | | Indika Energy Tbk PT | | 833,937 |
| 327,809 | | Indo Tambangraya Megah Tbk PT | | 461,623 |
| 1,895,717 | | Jasa Marga Persero Tbk PT | | 564,233 |
| 12,105,508 | | Kresna Graha Investama Tbk PT (b) | | 551,398 |
| 8,473,856 | | Medco Energi Internasional Tbk PT (b) | | 403,657 |
| 10,526,529 | | Media Nusantara Citra Tbk PT | | 505,098 |
| 2,778,313 | | PP Persero Tbk PT | | 348,738 |
| 23,669,989 | | Waskita Beton Precast Tbk PT | | 618,909 |
| 2,492,311 | | Waskita Karya Persero Tbk PT | | 291,174 |
| | | | | 9,129,740 |
| | | Jersey – 0.5% | | |
| 6,054,910 | | West China Cement Ltd. | | 819,642 |
| | | Malaysia – 2.9% | | |
| 2,081,800 | | AirAsia Group Bhd | | 1,496,176 |
| 1,084,600 | | DRB-Hicom Bhd | | 446,175 |
| 4,669,600 | | Hibiscus Petroleum Bhd (f) | | 949,175 |
| 344,600 | | QL Resources Bhd | | 567,871 |
| 926,600 | | Serba Dinamik Holdings Bhd | | 847,561 |
| 363,200 | | Supermax Corp. Bhd | | 305,853 |
| | | | | 4,612,811 |
| | | Mexico – 2.4% | | |
| 460,541 | | Banco del Bajio S.A. (g) | | 896,159 |
| 119,527 | | Grupo Aeroportuario del Centro Norte S.A.B. de C.V. | | 570,455 |
| 276,119 | | Megacable Holdings S.A.B. de C.V. | | 1,236,313 |
| 319,784 | | Qualitas Controladora S.A.B. de CV | | 673,032 |
| 45,143 | | Regional S.A.B. de C.V. | | 207,455 |
| Shares | | Description | | Value |
|
| | | Mexico (Continued) | | |
| 112,743 | | Unifin Financiera S.A.B. de C.V. SOFOM ENR | | $239,866 |
| | | | | 3,823,280 |
| | | Poland – 4.9% | | |
| 65,974 | | Asseco Poland S.A. | | 813,051 |
| 113,309 | | Bank Millennium S.A. (b) | | 268,562 |
| 21,046 | | Dino Polska S.A. (b) (g) | | 539,035 |
| 524,053 | | Enea S.A. (b) | | 1,386,328 |
| 670,145 | | Energa S.A. (b) | | 1,595,519 |
| 79,162 | | Jastrzebska Spolka Weglowa S.A. (b) | | 1,422,752 |
| 236,060 | | Orange Polska S.A. (b) | | 302,144 |
| 2,368,602 | | Tauron Polska Energia S.A. (b) | | 1,386,091 |
| | | | | 7,713,482 |
| | | Russia – 1.1% | | |
| 560,592,335 | | Federal Grid Co. Unified Energy System PJSC | | 1,191,746 |
| 532,463 | | Rostelecom PJSC | | 558,408 |
| | | | | 1,750,154 |
| | | South Africa – 3.1% | | |
| 156,457 | | African Rainbow Minerals Ltd. | | 1,547,986 |
| 126,375 | | Dis-Chem Pharmacies Ltd. (g) | | 254,639 |
| 146,319 | | Impala Platinum Holdings Ltd. (b) | | 373,031 |
| 231,784 | | MMI Holdings Ltd. (b) | | 275,966 |
| 12,230 | | Santam Ltd. | | 251,987 |
| 301,707 | | Super Group Ltd. (b) | | 711,724 |
| 311,558 | | Telkom S.A. SOC Ltd. | | 1,370,530 |
| | | | | 4,785,863 |
| | | Taiwan – 20.8% | | |
| 1,031,496 | | Acer, Inc. | | 652,718 |
| 15,835 | | ASMedia Technology, Inc. | | 257,589 |
| 938,569 | | China Airlines Ltd. | | 335,890 |
| 3,841,487 | | China Man-Made Fiber Corp. | | 1,274,788 |
| 1,015,411 | | China Motor Corp. | | 802,762 |
| 1,244,697 | | China Petrochemical Development Corp. (b) | | 443,421 |
| 446,937 | | Chong Hong Construction Co., Ltd. | | 1,122,541 |
| 3,004,069 | | Chung Hung Steel Corp. (b) | | 1,045,760 |
| 458,140 | | Compal Electronics, Inc. | | 260,095 |
| 720,478 | | Compeq Manufacturing Co., Ltd. | | 464,114 |
| 1,769,937 | | Eva Airways Corp. | | 909,816 |
| 278,261 | | Everlight Electronics Co., Ltd. | | 267,515 |
| 100,251 | | FLEXium Interconnect, Inc. | | 242,987 |
| 466,135 | | Formosa Taffeta Co., Ltd. | | 523,960 |
| 540,359 | | Gigabyte Technology Co., Ltd. | | 706,719 |
| 1,142,337 | | Grand Pacific Petrochemical | | 812,053 |
| 229,980 | | Great Wall Enterprise Co., Ltd. | | 250,653 |
| 5,764,781 | | HannStar Display Corp. | | 1,320,365 |
| 538,126 | | Highwealth Construction Corp. | | 787,835 |
| 577,501 | | Hsin Kuang Steel Co., Ltd. | | 584,321 |
See Notes to Financial Statements
Page 99
First Trust Emerging Markets Small Cap AlphaDEX® Fund (FEMS)
Portfolio of Investments (Continued)
December 31, 2018
| Shares | | Description | | Value |
| COMMON STOCKS (a) (Continued) |
| | | Taiwan (Continued) | | |
| 1,069,182 | | HTC Corp. (b) | | $1,229,645 |
| 573,054 | | Hung Sheng Construction Ltd. | | 476,349 |
| 1,584,263 | | Inventec Corp. | | 1,136,513 |
| 851,153 | | King Yuan Electronics Co., Ltd. | | 643,827 |
| 410,485 | | Long Chen Paper Co., Ltd. | | 190,305 |
| 1,364,520 | | Macronix International | | 814,619 |
| 57,305 | | Makalot Industrial Co., Ltd. | | 316,942 |
| 917,087 | | Mitac Holdings Corp. | | 735,472 |
| 1,183,204 | | Nantex Industry Co., Ltd. | | 1,070,146 |
| 57,495 | | Novatek Microelectronics Corp. | | 265,618 |
| 1,019,884 | | Oriental Union Chemical Corp. | | 856,069 |
| 269,202 | | Pou Chen Corp. | | 285,519 |
| 104,223 | | Powertech Technology, Inc. | | 224,132 |
| 127,673 | | Realtek Semiconductor Corp. | | 593,982 |
| 781,312 | | Ruentex Development Co., Ltd. | | 1,137,512 |
| 462,935 | | Ruentex Industries Ltd. | | 1,183,808 |
| 2,767,095 | | Shinkong Synthetic Fibers Corp. | | 1,039,787 |
| 101,899 | | Sinbon Electronics Co., Ltd. | | 274,498 |
| 811,379 | | TA Chen Stainless Pipe Co., Ltd. | | 1,110,014 |
| 2,346,422 | | Taiwan Business Bank | | 790,105 |
| 861,713 | | Tatung Co., Ltd. (b) | | 726,108 |
| 411,458 | | Tong Yang Industry Co., Ltd. | | 493,289 |
| 1,732,022 | | Unimicron Technology Corp. | | 1,256,599 |
| 2,112,350 | | Walsin Lihwa Corp. | | 1,151,116 |
| 2,993,710 | | Winbond Electronics Corp. | | 1,319,737 |
| 400,081 | | Yulon Motor Co., Ltd. | | 236,896 |
| | | | | 32,624,509 |
| | | Thailand – 8.2% | | |
| 132,000 | | AEON Thana Sinsap Thailand PCL | | 737,838 |
| 4,042,000 | | AP Thailand PCL | | 744,840 |
| 951,300 | | B Grimm Power PCL | | 774,246 |
| 260,900 | | Bangchak Corp. PCL | | 254,410 |
| 884,200 | | Bangkok Chain Hospital PCL | | 453,506 |
| 6,475,700 | | Chularat Hospital PCL | | 381,859 |
| 6,875,200 | | CK Power PCL | | 1,047,328 |
| 2,043,500 | | Com7 PCL, Class F | | 972,796 |
| 2,357,800 | | Esso Thailand PCL | | 738,623 |
| 1,751,500 | | Golden Land Property Development PCL | | 376,551 |
| 6,010,200 | | Italian-Thai Development PCL (b) | | 395,019 |
| 1,656,900 | | Jasmine International PCL | | 226,959 |
| 762,300 | | Muangthai Capital PCL | | 1,147,196 |
| 1,323,100 | | Plan B Media PCL | | 247,878 |
| 1,313,700 | | Siam Global House PCL | | 786,767 |
| 2,966,300 | | Siamgas & Petrochemicals PCL | | 774,372 |
| 738,600 | | Sino-Thai Engineering & Construction PCL (b) | | 462,759 |
| 2,242,800 | | Sri Trang Agro-Industry PCL | | 971,237 |
| 2,468,600 | | Star Petroleum Refining PCL | | 727,843 |
| 378,400 | | Supalai PCL | | 211,514 |
| 342,200 | | Thanachart Capital PCL | | 522,864 |
| | | | | 12,956,405 |
| Shares | | Description | | Value |
|
| | | Turkey – 10.1% | | |
| 7,907,949 | | Dogan Sirketler Grubu Holding A.S. (b) | | $1,524,064 |
| 1,291,582 | | Enerjisa Enerji A.S. (g) | | 1,244,604 |
| 447,737 | | Haci Omer Sabanci Holding A.S. | | 636,180 |
| 940,248 | | ICBC Turkey Bank A.S. (b) | | 875,847 |
| 1,262,156 | | Kardemir Karabuk Demir Celik Sanayi ve Ticaret A.S., Class D (b) | | 519,887 |
| 189,230 | | Pegasus Hava Tasimaciligi A.S. (b) | | 819,490 |
| 319,274 | | Petkim Petrokimya Holding A.S. | | 304,042 |
| 1,232,408 | | Soda Sanayii A.S. | | 1,653,301 |
| 273,037 | | TAV Havalimanlari Holding A.S. | | 1,234,019 |
| 395,032 | | Tekfen Holding A.S. | | 1,546,540 |
| 1,588,946 | | Trakya Cam Sanayii A.S. | | 909,685 |
| 765,972 | | Turkiye Halk Bankasi A.S. | | 1,015,989 |
| 1,159,355 | | Turkiye Is Bankasi A.S., Class C | | 992,325 |
| 1,462,429 | | Turkiye Sise ve Cam Fabrikalari A.S. | | 1,566,740 |
| 1,352,072 | | Turkiye Vakiflar Bankasi TAO, Class D | | 996,331 |
| | | | | 15,839,044 |
| | | Total Common Stocks | | 152,951,865 |
| | | (Cost $165,135,228) | | |
| REAL ESTATE INVESTMENT TRUSTS (a) – 2.7% |
| | | South Africa – 1.8% | | |
| 1,297,990 | | Attacq Ltd. | | 1,330,694 |
| 2,922,835 | | SA Corporate Real Estate Ltd. | | 682,587 |
| 598,478 | | Vukile Property Fund Ltd. | | 829,862 |
| | | | | 2,843,143 |
| | | Turkey – 0.9% | | |
| 4,771,277 | | Emlak Konut Gayrimenkul Yatirim Ortakligi A.S. | | 1,352,275 |
| | | Total Real Estate Investment Trusts | | 4,195,418 |
| | | (Cost $5,711,726) | | |
| RIGHTS (a) – 0.0% |
| | | Taiwan – 0.0% | | |
| 100,084 | | Eva Airways Corp., expiring 1/18/19 (b) (d) | | 9,117 |
| | | (Cost $7,960) | | |
| WARRANTS (a) – 0.0% |
| | | Thailand – 0.0% | | |
| 755,060 | | VGI Global Media PCL (b) | | 8,812 |
| | | (Cost $0) | | |
| MONEY MARKET FUNDS – 0.5% |
| 785,365 | | Goldman Sachs Financial Square Treasury Obligations Fund - Institutional Class - 2.61% (h) (i) | | 785,365 |
| | | (Cost $785,365) | | |
Page 100
See Notes to Financial Statements
First Trust Emerging Markets Small Cap AlphaDEX® Fund (FEMS)
Portfolio of Investments (Continued)
December 31, 2018
Principal
Value | | Description | | Value |
| REPURCHASE AGREEMENTS – 1.0% |
| $346,529 | | BNP Paribas S.A., 2.95% (h), dated 12/31/18, due 1/2/19, with a maturity value of $346,586. Collateralized by U.S. Treasury Notes, interest rate of 2.375%, due 4/30/20. The value of the collateral including accrued interest is $354,861. (i) | | $346,529 |
| 1,247,166 | | JPMorgan Chase & Co., 2.85% (h), dated 12/31/18, due 1/2/19, with a maturity value of $1,247,364. Collateralized by U.S. Treasury Notes, interest rate of 0.00%, due 5/9/19. The value of the collateral including accrued interest is $1,272,085. (i) | | 1,247,166 |
| | | Total Repurchase Agreements | | 1,593,695 |
| | | (Cost $1,593,695) | | |
| | | Total Investments – 101.4% | | 159,544,272 |
| | | (Cost $173,233,974) (j) | | |
| | | Net Other Assets and Liabilities – (1.4)% | | (2,218,636) |
| | | Net Assets – 100.0% | | $157,325,636 |
|
| (a) | Portfolio securities are categorized based upon their country of incorporation, which can be different from the country categorization of the Fund’s underlying index. For a breakdown of the portfolio securities by sector, please see the Fund Performance Overview. |
| (b) | Non-income producing security. |
| (c) | All or a portion of this security is on loan (see Note 2D - Securities Lending in the Notes to Financial Statements). The aggregate value of such securities is $1,390,006 and the total value of the collateral held by the Fund is $2,376,249. |
| (d) | This security is fair valued by the Advisor’s Pricing Committee in accordance with procedures adopted by the Trust’s Board of Trustees, and in accordance with the provisions of the Investment Company Act of 1940, as amended. At December 31, 2018, securities noted as such are valued at $9,117 or 0.0% of net assets. |
| (e) | This security’s value was determined using significant unobservable inputs (see Note 2A – Portfolio Valuation in the Notes to Financial Statements). |
| (f) | Non-income producing security which makes payment-in-kind (“PIK”) distributions. There were no in-kind distributions received for the fiscal year ended December 31, 2018. |
| (g) | This security is restricted in the U.S. and cannot be offered for public sale without first being registered under the Securities Act of 1933, as amended. This security is not restricted on the foreign exchange where it trades freely without any additional registration. As such, it does not require the additional disclosure required of restricted securities. |
| (h) | Rate shown reflects yield as of December 31, 2018. |
| (i) | This security serves as collateral for securities on loan. |
| (j) | Aggregate cost for federal income tax purposes was $175,174,428. As of December 31, 2018, the aggregate gross unrealized appreciation for all investments in which there was an excess of value over tax cost was $8,471,258 and the aggregate gross unrealized depreciation for all investments in which there was an excess of tax cost over value was $24,101,414. The net unrealized depreciation was $15,630,156. |
Valuation Inputs
A summary of the inputs used to value the Fund’s investments as of December 31, 2018 is as follows (see Note 2A - Portfolio Valuation in the Notes to Financial Statements):
| | Total
Value at
12/31/2018 | Level 1
Quoted
Prices | Level 2
Significant
Observable
Inputs | Level 3
Significant
Unobservable
Inputs |
| Common Stocks: | | | | |
| Cayman Islands | $ 20,924,082 | $ 20,924,082 | $ — | $ —** |
| Thailand | 12,956,405 | — | 12,956,405 | — |
| Other Country Categories* | 119,071,378 | 119,071,378 | — | — |
| Real Estate Investment Trusts* | 4,195,418 | 4,195,418 | — | — |
| Rights* | 9,117 | — | 9,117 | — |
| Warrants* | 8,812 | — | 8,812 | — |
| Money Market Funds | 785,365 | 785,365 | — | — |
| Repurchase Agreements | 1,593,695 | — | 1,593,695 | — |
| Total Investments | $ 159,544,272 | $ 144,976,243 | $ 14,568,029 | $—** |
| * | See Portfolio of Investments for country breakout. |
| ** | Investment is valued at $0. |
Level 3 Common Stocks are fair valued by the Advisor’s Pricing Committee and are footnoted in the Portfolio of Investments. The Level 3 Common Stocks values are based on unobservable and non-quantitative inputs.
Offsetting Assets and Liabilities
Offsetting assets and liabilities requires entities to disclose both gross and net information about instruments and transactions eligible for offset, and to disclose instruments and transactions subject to master netting or similar agreements (see Note 2I – Offsetting on the Statements of Assets and Liabilities in the Notes to Financial Statements).
The Fund’s loaned securities were all subject to an enforceable Securities Lending Agency Agreement. Securities lent in
See Notes to Financial Statements
Page 101
First Trust Emerging Markets Small Cap AlphaDEX® Fund (FEMS)
Portfolio of Investments (Continued)
December 31, 2018
accordance with the Securities Lending Agency Agreement on a gross basis were as follows:
| Security Lending Agency Agreement | |
| Total gross amount presented on the Statements of Assets and Liabilities(1) | $1,390,006 |
| Non-cash Collateral(2) | (1,390,006) |
| Net Amount | $— |
| (1) | The amount presented on the Statements of Assets and Liabilities, which is included in “Investments, at value”, is not offset and is shown on a gross basis. |
| (2) | At December 31, 2018, the value of the collateral received from each borrower exceeded the value of the related securities loaned. This amount is disclosed on the Portfolio of Investments. |
The Fund’s investments in repurchase agreements were all subject to an enforceable Master Repurchase Agreement. Repurchase Agreements on a gross basis were as follows:
| Repurchase Agreements | |
| Total gross amount presented on the Statements of Assets and Liabilities(3) | $1,593,695 |
| Non-cash Collateral(4) | (1,593,695) |
| Net Amount | $— |
| (3) | The amount is included in “Investments, at value” on the Statements of Assets and Liabilities. |
| (4) | At December 31, 2018, the value of the collateral received from each seller exceeded the value of the repurchase agreements. |
Currency Exposure
Diversification | % of Total
Investments |
| TWD | 22.1% |
| HKD | 20.9 |
| TRY | 10.8 |
| BRL | 9.7 |
| THB | 8.1 |
| IDR | 5.7 |
| PLN | 4.8 |
| ZAR | 4.8 |
| INR | 4.2 |
| MYR | 2.9 |
| MXN | 2.4 |
| USD | 1.5 |
| RUB | 1.1 |
| CLP | 1.0 |
| Total | 100.0% |
| Currency Abbreviations |
| BRL | Brazilian Real |
| CLP | Chilean Peso |
| HKD | Hong Kong Dollar |
| IDR | Indonesian Rupiah |
| INR | Indian Rupee |
| MXN | Mexican Peso |
| MYR | Malaysian Ringgit |
| PLN | Polish Zloty |
| RUB | Russian Ruble |
| THB | Thai Baht |
| TRY | Turkish Lira |
| TWD | New Taiwan Dollar |
| USD | United States Dollar |
| ZAR | South African Rand |
Page 102
See Notes to Financial Statements
First Trust Eurozone AlphaDEX® ETF (FEUZ)
Portfolio of Investments
December 31, 2018
| Shares | | Description | | Value |
| COMMON STOCKS (a) – 95.6% |
| | | Austria – 2.7% | | |
| 2,286 | | ANDRITZ AG | | $105,082 |
| 7,122 | | OMV AG | | 312,121 |
| 13,889 | | Raiffeisen Bank International AG | | 353,276 |
| 17,234 | | Telekom Austria AG | | 131,112 |
| 14,571 | | voestalpine AG | | 435,732 |
| | | | | 1,337,323 |
| | | Belgium – 4.1% | | |
| 767 | | Ackermans & van Haaren N.V. | | 115,825 |
| 4,959 | | Ageas | | 223,294 |
| 4,140 | | Elia System Operator S.A./N.V. | | 276,540 |
| 16,737 | | Proximus S.A.D.P. | | 452,947 |
| 2,673 | | Sofina S.A. | | 507,777 |
| 994 | | Solvay S.A. | | 99,447 |
| 4,450 | | UCB S.A. | | 363,529 |
| | | | | 2,039,359 |
| | | Finland – 4.4% | | |
| 13,048 | | Amer Sports OYJ | | 573,622 |
| 21,273 | | Fortum OYJ | | 465,535 |
| 7,524 | | Metso OYJ | | 197,412 |
| 8,063 | | Neste OYJ | | 622,284 |
| 6,973 | | Stora Enso OYJ, Class R | | 80,572 |
| 10,191 | | UPM-Kymmene OYJ | | 258,631 |
| | | | | 2,198,056 |
| | | France – 24.0% | | |
| 12,983 | | Accor S.A. | | 552,021 |
| 1,184 | | Aeroports de Paris | | 224,512 |
| 3,888 | | Alten S.A. | | 323,855 |
| 3,228 | | Arkema S.A. | | 277,238 |
| 30,897 | | Bollore S.A. | | 123,901 |
| 6,173 | | Bouygues S.A. | | 221,659 |
| 6,340 | | Casino Guichard Perrachon S.A. | | 263,976 |
| 12,364 | | Cie de Saint-Gobain | | 413,153 |
| 4,461 | | Cie Generale des Etablissements Michelin SCA | | 443,140 |
| 7,070 | | Cie Plastic Omnium S.A. | | 163,386 |
| 11,062 | | CNP Assurances | | 234,728 |
| 890 | | Dassault Systemes SE | | 105,745 |
| 13,989 | | Edenred | | 514,656 |
| 1,194 | | Eiffage S.A. | | 99,811 |
| 18,132 | | Engie S.A. | | 260,204 |
| 901 | | EssilorLuxottica S.A. | | 114,020 |
| 6,769 | | Eurazeo SE | | 479,295 |
| 5,638 | | Eutelsat Communications S.A. | | 111,140 |
| 4,433 | | Faurecia S.A. | | 167,966 |
| 201 | | Hermes International | | 111,647 |
| 2,041 | | Iliad S.A. | | 286,814 |
| 3,607 | | Imerys S.A. | | 173,492 |
| 3,172 | | Ipsen S.A. | | 410,133 |
| 4,334 | | Lagardere SCA | | 109,344 |
| 1,508 | | LVMH Moet Hennessy Louis Vuitton SE | | 446,116 |
| 16,719 | | Orange S.A. | | 271,150 |
| 24,713 | | Peugeot S.A. | | 527,932 |
| Shares | | Description | | Value |
|
| | | France (Continued) | | |
| 7,706 | | Renault S.A. | | $481,630 |
| 4,756 | | Safran S.A. | | 574,344 |
| 2,907 | | Sartorius Stedim Biotech | | 290,936 |
| 14,352 | | SCOR SE | | 647,886 |
| 9,317 | | Societe Generale S.A. | | 296,977 |
| 18,761 | | Suez | | 247,842 |
| 2,120 | | Teleperformance | | 339,087 |
| 3,754 | | Thales S.A. | | 438,717 |
| 10,281 | | TOTAL S.A. | | 543,975 |
| 3,687 | | Ubisoft Entertainment S.A. (b) | | 297,734 |
| 9,210 | | Valeo S.A. | | 269,191 |
| 5,182 | | Vivendi S.A. | | 126,345 |
| | | | | 11,985,698 |
| | | Germany – 29.4% | | |
| 8,221 | | 1&1 Drillisch AG | | 419,155 |
| 1,089 | | adidas AG | | 227,584 |
| 1,794 | | Allianz SE | | 359,996 |
| 4,500 | | BASF SE | | 311,415 |
| 6,003 | | Bayer AG | | 416,528 |
| 7,388 | | Bayerische Motoren Werke AG | | 598,461 |
| 6,565 | | Bechtle AG | | 510,357 |
| 8,639 | | Brenntag AG | | 373,160 |
| 4,751 | | Carl Zeiss Meditec AG | | 371,788 |
| 12,807 | | Commerzbank AG (b) | | 84,858 |
| 3,063 | | Continental AG | | 423,764 |
| 8,219 | | Covestro AG (c) | | 406,623 |
| 10,563 | | Daimler AG | | 555,628 |
| 27,131 | | Deutsche Lufthansa AG | | 612,381 |
| 11,115 | | Deutsche Wohnen SE | | 509,401 |
| 7,451 | | Evonik Industries AG | | 186,106 |
| 2,236 | | GRENKE AG | | 190,093 |
| 4,717 | | Hannover Rueck SE | | 636,110 |
| 5,117 | | HeidelbergCement AG | | 312,956 |
| 7,170 | | Hella GmbH & Co., KGaA | | 285,883 |
| 2,169 | | KION Group AG | | 110,166 |
| 4,492 | | LEG Immobilien AG | | 468,968 |
| 8,514 | | METRO AG | | 130,667 |
| 1,775 | | MTU Aero Engines AG | | 322,139 |
| 3,645 | | Nemetschek SE | | 399,877 |
| 3,348 | | OSRAM Licht AG | | 145,460 |
| 9,898 | | Porsche Automobil Holding SE (Preference Shares) | | 585,630 |
| 552 | | Rational AG | | 313,697 |
| 10,806 | | RWE AG | | 234,805 |
| 2,464 | | Sartorius AG (Preference Shares) | | 307,439 |
| 41,714 | | Schaeffler AG (Preference Shares) | | 356,446 |
| 2,178 | | Siltronic AG | | 180,171 |
| 5,355 | | Sixt SE | | 424,576 |
| 28,005 | | TAG Immobilien AG | | 638,847 |
| 8,662 | | Uniper SE | | 224,293 |
| 8,453 | | United Internet AG | | 369,968 |
| 3,787 | | Volkswagen AG (Preference Shares) | | 602,768 |
| 10,914 | | Vonovia SE | | 495,062 |
See Notes to Financial Statements
Page 103
First Trust Eurozone AlphaDEX® ETF (FEUZ)
Portfolio of Investments (Continued)
December 31, 2018
| Shares | | Description | | Value |
| COMMON STOCKS (a) (Continued) |
| | | Germany (Continued) | | |
| 1,061 | | Wacker Chemie AG | | $96,157 |
| 3,075 | | Wirecard AG | | 467,879 |
| | | | | 14,667,262 |
| | | Ireland – 0.9% | | |
| 4,071 | | CRH PLC | | 107,747 |
| 1,205 | | Kerry Group PLC, Class A | | 119,424 |
| 17,503 | | Ryanair Holdings PLC (b) | | 215,581 |
| | | | | 442,752 |
| | | Italy – 9.8% | | |
| 153,604 | | A2A S.p.A. | | 276,747 |
| 23,996 | | Amplifon S.p.A. | | 386,282 |
| 32,108 | | Buzzi Unicem S.p.A | | 552,736 |
| 4,247 | | De’ Longhi S.p.A. | | 107,539 |
| 52,048 | | Enel S.p.A. | | 300,794 |
| 28,208 | | Eni S.p.A. | | 444,326 |
| 39,885 | | FinecoBank Banca Fineco S.p.A. | | 401,139 |
| 42,852 | | Hera S.p.A. | | 130,698 |
| 4,073 | | Interpump Group S.p.A. | | 121,333 |
| 3,096 | | Moncler S.p.A. | | 102,622 |
| 86,525 | | Saipem S.p.A. (b) | | 323,679 |
| 45,027 | | Societa Iniziative Autostradali e Servizi S.p.A. | | 622,171 |
| 1,097,694 | | Telecom Italia S.p.A. (b) | | 607,838 |
| 35,427 | | UniCredit S.p.A. | | 401,602 |
| 56,619 | | UnipolSai Assicurazioni S.p.A. | | 128,218 |
| | | | | 4,907,724 |
| | | Luxembourg – 2.6% | | |
| 11,630 | | APERAM S.A. | | 307,143 |
| 21,421 | | ArcelorMittal | | 445,212 |
| 25,721 | | Grand City Properties S.A. | | 558,453 |
| | | | | 1,310,808 |
| | | Netherlands – 9.3% | | |
| 82,190 | | Aegon N.V. | | 384,116 |
| 1,055 | | Airbus SE | | 101,488 |
| 11,185 | | ASR Nederland N.V. | | 443,150 |
| 3,972 | | EXOR N.V. | | 215,077 |
| 16,248 | | GrandVision N.V. (c) | | 356,127 |
| 8,562 | | IMCD Group N.V. | | 549,355 |
| 17,441 | | Koninklijke Ahold Delhaize N.V. | | 441,125 |
| 5,036 | | Koninklijke DSM N.V. | | 412,209 |
| 14,939 | | NN Group N.V. | | 595,649 |
| 20,853 | | OCI N.V. (b) | | 425,522 |
| 7,044 | | QIAGEN N.V. (b) | | 239,537 |
| 5,151 | | Signify N.V. (c) | | 120,809 |
| 7,331 | | STMicroelectronics N.V. | | 102,726 |
| 4,275 | | Wolters Kluwer N.V. | | 253,035 |
| | | | | 4,639,925 |
| | | Portugal – 1.3% | | |
| 26,874 | | Galp Energia SGPS S.A. | | 424,760 |
| Shares | | Description | | Value |
|
| | | Portugal (Continued) | | |
| 54,442 | | Navigator (The) Co., S.A. | | $224,557 |
| | | | | 649,317 |
| | | Spain – 7.1% | | |
| 7,355 | | Acciona S.A. (d) | | 622,755 |
| 27,959 | | Acerinox S.A. | | 277,479 |
| 15,651 | | ACS Actividades de Construccion y Servicios S.A. | | 606,644 |
| 13,266 | | Almirall S.A. | | 203,218 |
| 4,305 | | Amadeus IT Group S.A. | | 300,090 |
| 10,381 | | Cia de Distribucion Integral Logista Holdings S.A. | | 260,004 |
| 12,777 | | CIE Automotive S.A. | | 313,865 |
| 12,339 | | Endesa S.A. | | 284,586 |
| 18,138 | | Iberdrola S.A. | | 145,845 |
| 4,889 | | Naturgy Energy Group S.A. | | 124,691 |
| 26,757 | | Repsol S.A. | | 431,648 |
| | | | | 3,570,825 |
| | | Total Common Stocks | | 47,749,049 |
| | | (Cost $56,387,030) | | |
| REAL ESTATE INVESTMENT TRUSTS (a) – 4.2% |
| | | France – 2.3% | | |
| 3,838 | | Covivio | | 370,260 |
| 2,391 | | Gecina S.A. | | 309,562 |
| 15,043 | | Klepierre S.A. | | 464,670 |
| | | | | 1,144,492 |
| | | Spain – 1.9% | | |
| 38,487 | | Inmobiliaria Colonial Socimi S.A. | | 358,725 |
| 49,131 | | Merlin Properties Socimi S.A. | | 607,107 |
| | | | | 965,832 |
| | | Total Real Estate Investment Trusts | | 2,110,324 |
| | | (Cost $2,483,977) | | |
| RIGHTS – 0.0% |
| | | Spain – 0.0% | | |
| 26,784 | | Repsol S.A., expiring 01/09/19 (b) | | 12,275 |
| | | (Cost $12,314) | | |
| MONEY MARKET FUNDS – 0.3% |
| 140,393 | | Goldman Sachs Financial Square Treasury Obligations Fund - Institutional Class - 2.61% (e) (f) | | 140,393 |
| | | (Cost $140,393) | | |
Page 104
See Notes to Financial Statements
First Trust Eurozone AlphaDEX® ETF (FEUZ)
Portfolio of Investments (Continued)
December 31, 2018
Principal
Value | | Description | | Value |
| REPURCHASE AGREEMENTS – 0.6% |
| $61,946 | | BNP Paribas S.A., 2.95% (e), dated 12/31/18, due 1/2/19, with a maturity value of $61,956. Collateralized by U.S. Treasury Note, interest rate of 2.375%, due 4/30/20. The value of the collateral including accrued interest is $63,435. (f) | | $61,946 |
| 222,945 | | JPMorgan Chase & Co., 2.85% (e), dated 12/31/18, due 1/2/19, with a maturity value of $222,980. Collateralized by U.S. Treasury Bill, interest rate of 0.000%, due 5/9/19. The value of the collateral including accrued interest is $227,399. (f) | | 222,945 |
| | | Total Repurchase Agreements | | 284,891 |
| | | (Cost $284,891) | | |
| | | Total Investments – 100.7% | | 50,296,932 |
| | | (Cost $59,308,605) (g) | | |
| | | Net Other Assets and Liabilities – (0.7)% | | (371,511) |
| | | Net Assets – 100.0% | | $49,925,421 |
|
| (a) | Portfolio securities are categorized based upon their country of incorporation. For a breakdown of the portfolio securities by sector, please see the Fund Performance Overview. |
| (b) | Non-income producing security. |
| (c) | This security is restricted in the U.S. and cannot be offered for public sale without first being registered under the Securities Act of 1933, as amended. This security is not restricted on the foreign exchange where it trades freely without any additional registration. As such, it does not require the additional disclosure required of restricted securities. |
| (d) | All or a portion of this security is on loan (see Note 2D - Securities Lending in the Notes to Financial Statements). The aggregate value of such securities is $414,888 and the total value of the collateral held by the Fund is $424,781. |
| (e) | Rate shown reflects yield as of December 31, 2018. |
| (f) | This security serves as collateral for securities on loan. |
| (g) | Aggregate cost for federal income tax purposes was $59,608,358. As of December 31, 2018, the aggregate gross unrealized appreciation for all investments in which there was an excess of value over tax cost was $474,715 and the aggregate gross unrealized depreciation for all investments in which there was an excess of tax cost over value was $9,786,141. The net unrealized depreciation was $9,311,426. |
Valuation Inputs
A summary of the inputs used to value the Fund’s investments as of December 31, 2018 is as follows (see Note 2A - Portfolio Valuation in the Notes to Financial Statements):
| | Total
Value at
12/31/2018 | Level 1
Quoted
Prices | Level 2
Significant
Observable
Inputs | Level 3
Significant
Unobservable
Inputs |
| Common Stocks* | $ 47,749,049 | $ 47,749,049 | $ — | $ — |
| Real Estate Investment Trusts* | 2,110,324 | 2,110,324 | — | — |
| Rights* | 12,275 | 12,275 | — | — |
| Money Market Funds | 140,393 | 140,393 | — | — |
| Repurchase Agreements | 284,891 | — | 284,891 | — |
| Total Investments | $ 50,296,932 | $ 50,012,041 | $ 284,891 | $— |
| * | See Portfolio of Investments for country breakout. |
Offsetting Assets and Liabilities
Offsetting assets and liabilities requires entities to disclose both gross and net information about instruments and transactions eligible for offset, and to disclose instruments and transactions subject to master netting or similar agreements (see Note 2I – Offsetting on the Statements of Assets and Liabilities in the Notes to Financial Statements).
The Fund’s loaned securities were all subject to an enforceable Securities Lending Agency Agreement. Securities lent in accordance with the Securities Lending Agency Agreement on a gross basis were as follows:
| Security Lending Agency Agreement | |
| Total gross amount presented on the Statements of Assets and Liabilities(1) | $414,888 |
| Non-cash Collateral(2) | (414,888) |
| Net Amount | $— |
| (1) | The amount presented on the Statements of Assets and Liabilities, which is included in “Investments, at value”, is not offset and is shown on a gross basis. |
| (2) | At December 31, 2018, the value of the collateral received from each borrower exceeded the value of the related securities loaned. This amount is disclosed on the Portfolio of Investments. |
See Notes to Financial Statements
Page 105
First Trust Eurozone AlphaDEX® ETF (FEUZ)
Portfolio of Investments (Continued)
December 31, 2018
The Fund’s investments in repurchase agreements were all subject to an enforceable Master Repurchase Agreement. Repurchase Agreements on a gross basis were as follows:
| Repurchase Agreements | |
| Total gross amount presented on the Statements of Assets and Liabilities(3) | $284,891 |
| Non-cash Collateral(4) | (284,891) |
| Net Amount | $— |
| (3) | The amount is included in “Investments, at value” on the Statements of Assets and Liabilities. |
| (4) | At December 31, 2018, the value of the collateral received from each seller exceeded the value of the repurchase agreements. |
Page 106
See Notes to Financial Statements
This page intentionally left blank
First Trust Exchange-Traded AlphaDEX® Fund II
Statements of Assets and Liabilities
December 31, 2018
| | First Trust
Asia Pacific
ex-Japan
AlphaDEX®
Fund
(FPA) | | First Trust
Europe
AlphaDEX®
Fund
(FEP) | | First Trust
Latin
America
AlphaDEX®
Fund
(FLN) | | First Trust
Brazil
AlphaDEX®
Fund
(FBZ) |
| ASSETS: | | | | | | | |
Investments, at value
| $ 30,276,826 | | $ 590,686,458 | | $ 17,355,726 | | $ 128,347,510 |
Cash
| 39,293 | | — | | — | | 3,299,582 |
Foreign currency
| 1 | | 15,053 | | 1,637 | | 38,013 |
Due from authorized participant
| — | | — | | — | | 36,300 |
| Receivables: | | | | | | | |
Dividends
| 123,959 | | 868,688 | | 71,448 | | 695,372 |
Dividend reclaims
| — | | 1,535,740 | | — | | — |
Securities lending income
| 286 | | 9,785 | | — | | — |
Investment securities sold
| — | | 9,465,656 | | 5,975 | | — |
Miscellaneous
| — | | — | | — | | — |
Total Assets
| 30,440,365 | | 602,581,380 | | 17,434,786 | | 132,416,777 |
| LIABILITIES: | | | | | | | |
Due to authorized participant
| — | | 9,465,656 | | — | | 3,242,110 |
Due to custodian
| — | | 98,446 | | 4,722 | | — |
Due to custodian foreign currency
| — | | — | | — | | — |
Due to securities lending agent
| — | | — | | — | | — |
| Payables: | | | | | | | |
Collateral for securities on loan
| — | | — | | — | | — |
Investment advisory fees
| 21,808 | | 431,605 | | 11,787 | | 93,491 |
Investment securities purchased
| — | | — | | — | | — |
Fund shares redeemed
| — | | — | | — | | — |
Other liabilities
| — | | — | | — | | — |
Total Liabilities
| 21,808 | | 9,995,707 | | 16,509 | | 3,335,601 |
NET ASSETS
| $30,418,557 | | $592,585,673 | | $17,418,277 | | $129,081,176 |
| NET ASSETS consist of: | | | | | | | |
Paid-in capital
| $ 42,540,502 | | $ 796,082,322 | | $ 24,306,089 | | $ 130,646,555 |
Par value
| 11,000 | | 190,500 | | 9,500 | | 96,500 |
Accumulated distributable earnings (loss)
| (12,132,945) | | (203,687,149) | | (6,897,312) | | (1,661,879) |
NET ASSETS
| $30,418,557 | | $592,585,673 | | $17,418,277 | | $129,081,176 |
NET ASSET VALUE,per share
| $27.65 | | $31.11 | | $18.33 | | $13.38 |
Number of shares outstanding (unlimited number of shares authorized, par value $0.01 per share)
| 1,100,002 | | 19,050,002 | | 950,002 | | 9,650,002 |
Investments, at cost
| $31,977,371 | | $666,164,731 | | $17,699,515 | | $127,998,641 |
Foreign currency, at cost (proceeds)
| $1 | | $15,041 | | $1,640 | | $38,101 |
Securities on loan, at value
| $— | | $— | | $— | | $— |
Page 108
See Notes to Financial Statements
First Trust
China
AlphaDEX®
Fund
(FCA) | | First Trust
Japan
AlphaDEX®
Fund
(FJP) | | First Trust
South
Korea
AlphaDEX®
Fund
(FKO) | | First Trust
Developed
Markets
ex-US
AlphaDEX®
Fund
(FDT) | | First Trust
Emerging
Markets
AlphaDEX®
Fund
(FEM) |
| | | | | | | | | |
| $ 7,140,904 | | $ 156,474,214 | | $ 2,247,811 | | $ 949,776,199 | | $ 459,289,426 |
| 5,745 | | 221,571 | | 441 | | — | | 4,310,498 |
| — | | — | | — | | 25,514 | | 1,024,235 |
| — | | 7,049,977 | | — | | — | | 2,623,598 |
| | | | | | | | | |
| — | | 264,179 | | 20,131 | | 2,418,606 | | 716,330 |
| — | | — | | — | | 431,644 | | 6,151 |
| 68 | | 10,078 | | — | | 35,678 | | 17,247 |
| — | | 4,739,725 | | — | | 15,693,788 | | — |
| — | | — | | — | | — | | 211,873 |
| 7,146,717 | | 168,759,744 | | 2,268,383 | | 968,381,429 | | 468,199,358 |
| | | | | | | | | |
| — | | 4,830,082 | | — | | 5,879,459 | | 6,892 |
| — | | — | | — | | 130,880 | | — |
| — | | — | | — | | — | | — |
| — | | 4,540 | | — | | 13,238 | | 8,259 |
| | | | | | | | | |
| — | | 3,837,219 | | — | | 11,188,407 | | 6,980,211 |
| 4,986 | | 106,368 | | 1,557 | | 688,385 | | 302,622 |
| — | | 7,047,832 | | — | | — | | 8,294,378 |
| — | | — | | — | | 9,848,438 | | — |
| — | | — | | — | | — | | — |
| 4,986 | | 15,826,041 | | 1,557 | | 27,748,807 | | 15,592,362 |
| $ 7,141,731 | | $ 152,933,703 | | $ 2,266,826 | | $ 940,632,622 | | $ 452,606,996 |
| | | | | | | | | |
| $ 13,901,808 | | $ 204,894,451 | | $ 4,400,197 | | $ 1,183,172,759 | | $ 603,805,891 |
| 3,000 | | 31,500 | | 1,000 | | 191,020 | | 198,500 |
| (6,763,077) | | (51,992,248) | | (2,134,371) | | (242,731,157) | | (151,397,395) |
| $ 7,141,731 | | $ 152,933,703 | | $ 2,266,826 | | $ 940,632,622 | | $ 452,606,996 |
| $23.81 | | $48.55 | | $22.67 | | $49.24 | | $22.80 |
| 300,002 | | 3,150,002 | | 100,002 | | 19,102,000 | | 19,850,002 |
| $8,646,068 | | $178,776,325 | | $2,192,680 | | $1,083,994,518 | | $485,107,238 |
| $— | | $— | | $— | | $25,499 | | $1,024,181 |
| $— | | $3,680,850 | | $— | | $10,566,032 | | $6,576,493 |
See Notes to Financial Statements
Page 109
First Trust Exchange-Traded AlphaDEX® Fund II
Statements of Assets and Liabilities (Continued)
December 31, 2018
| | First Trust
Germany
AlphaDEX®
Fund
(FGM) | | First Trust
Canada
AlphaDEX®
Fund
(FCAN) | | First Trust
Australia
AlphaDEX®
Fund
(FAUS) | | First Trust
United
Kingdom
AlphaDEX®
Fund
(FKU) |
| ASSETS: | | | | | | | |
Investments, at value
| $ 138,592,038 | | $ 7,118,171 | | $ 1,370,981 | | $ 9,594,886 |
Cash
| 28 | | 2,544 | | 877 | | 756 |
Foreign currency
| — | | 5,253 | | — | | — |
Due from authorized participant
| — | | — | | — | | 1,557,444 |
| Receivables: | | | | | | | |
Dividends
| — | | 10,500 | | 7,382 | | 35,135 |
Dividend reclaims
| 532,010 | | 24 | | 35 | | 5,261 |
Securities lending income
| — | | 68 | | — | | — |
Investment securities sold
| — | | — | | — | | — |
Miscellaneous
| — | | — | | — | | — |
Total Assets
| 139,124,076 | | 7,136,560 | | 1,379,275 | | 11,193,482 |
| LIABILITIES: | | | | | | | |
Due to authorized participant
| — | | — | | — | | — |
Due to custodian
| — | | — | | — | | — |
Due to custodian foreign currency
| — | | — | | — | | — |
Due to securities lending agent
| — | | — | | — | | — |
| Payables: | | | | | | | |
Collateral for securities on loan
| — | | — | | — | | — |
Investment advisory fees
| 102,069 | | 4,638 | | 962 | | 5,540 |
Investment securities purchased
| — | | — | | — | | 1,555,642 |
Fund shares redeemed
| — | | — | | — | | — |
Other liabilities
| — | | — | | — | | — |
Total Liabilities
| 102,069 | | 4,638 | | 962 | | 1,561,182 |
NET ASSETS
| $139,022,007 | | $7,131,922 | | $1,378,313 | | $9,632,300 |
| NET ASSETS consist of: | | | | | | | |
Paid-in capital
| $ 186,174,878 | | $ 24,623,994 | | $ 2,107,544 | | $ 48,191,084 |
Par value
| 37,000 | | 3,500 | | 500 | | 3,000 |
Accumulated distributable earnings (loss)
| (47,189,871) | | (17,495,572) | | (729,731) | | (38,561,784) |
NET ASSETS
| $139,022,007 | | $7,131,922 | | $1,378,313 | | $9,632,300 |
NET ASSET VALUE,per share
| $37.57 | | $20.38 | | $27.57 | | $32.11 |
Number of shares outstanding (unlimited number of shares authorized, par value $0.01 per share)
| 3,700,002 | | 350,002 | | 50,002 | | 300,002 |
Investments, at cost
| $164,698,088 | | $9,137,480 | | $1,643,678 | | $11,082,418 |
Foreign currency, at cost (proceeds)
| $— | | $5,252 | | $— | | $— |
Securities on loan, at value
| $— | | $— | | $— | | $— |
Page 110
See Notes to Financial Statements
First Trust
India
NIFTY 50
Equal Weight
ETF
(NFTY) | | First Trust
Hong Kong
AlphaDEX®
Fund
(FHK) | | First Trust
Switzerland
AlphaDEX®
Fund
(FSZ) | | First Trust
Developed
Markets
ex-US
Small Cap
AlphaDEX®
Fund
(FDTS) | | First Trust
Emerging
Markets
Small Cap
AlphaDEX®
Fund
(FEMS) | | First Trust
Eurozone
AlphaDEX®
ETF
(FEUZ) |
| | | | | | | | | | | |
| $ 3,513,783 | | $ 3,442,652 | | $ 149,156,346 | | $ 10,032,155 | | $ 159,544,272 | | $ 50,296,932 |
| — | | 5,970 | | 646 | | 5,274 | | — | | — |
| 177,249 | | — | | — | | 248 | | 214,152 | | — |
| — | | — | | — | | — | | — | | 130,594 |
| | | | | | | | | | | |
| 2,047 | | 6,069 | | — | | 25,396 | | 149,951 | | 16,082 |
| — | | — | | 2,361,519 | | 7,119 | | 918 | | 92,212 |
| — | | 292 | | — | | — | | 6,466 | | 2,713 |
| — | | — | | — | | — | | — | | 980 |
| 2,008 | | — | | — | | — | | — | | — |
| 3,695,087 | | 3,454,983 | | 151,518,511 | | 10,070,192 | | 159,915,759 | | 50,539,513 |
| | | | | | | | | | | |
| — | | — | | — | | — | | — | | 3,775 |
| 157,455 | | — | | — | | — | | 99,588 | | 9,941 |
| — | | — | | — | | — | | — | | 5,110 |
| — | | 43 | | — | | — | | 2,811 | | 503 |
| | | | | | | | | | | |
| — | | 36,550 | | — | | — | | 2,376,249 | | 424,781 |
| 2,341 | | 2,369 | | 109,218 | | 7,012 | | 111,166 | | 39,388 |
| — | | — | | — | | — | | — | | 130,594 |
| — | | — | | — | | — | | — | | — |
| — | | — | | — | | — | | 309 | | — |
| 159,796 | | 38,962 | | 109,218 | | 7,012 | | 2,590,123 | | 614,092 |
| $ 3,535,291 | | $ 3,416,021 | | $ 151,409,293 | | $ 10,063,180 | | $ 157,325,636 | | $ 49,925,421 |
| | | | | | | | | | | |
| $ 4,920,645 | | $ 52,959,226 | | $ 189,191,379 | | $ 14,770,901 | | $ 206,454,083 | | $ 68,085,483 |
| 1,000 | | 1,000 | | 34,500 | | 3,000 | | 48,500 | | 14,500 |
| (1,386,354) | | (49,544,205) | | (37,816,586) | | (4,710,721) | | (49,176,947) | | (18,174,562) |
| $ 3,535,291 | | $ 3,416,021 | | $ 151,409,293 | | $ 10,063,180 | | $ 157,325,636 | | $ 49,925,421 |
| $35.35 | | $34.16 | | $43.89 | | $33.54 | | $32.44 | | $34.43 |
| 100,002 | | 100,002 | | 3,450,002 | | 300,002 | | 4,850,002 | | 1,450,002 |
| $3,805,148 | | $3,617,985 | | $163,222,280 | | $12,043,960 | | $173,233,974 | | $59,308,605 |
| $176,661 | | $— | | $— | | $247 | | $212,930 | | $(5,099) |
| $— | | $33,607 | | $— | | $— | | $1,390,006 | | $414,888 |
See Notes to Financial Statements
Page 111
First Trust Exchange-Traded AlphaDEX® Fund II
Statements of Operations
For the Year Ended December 31, 2018
| | First Trust
Asia Pacific
ex-Japan
AlphaDEX®
Fund
(FPA) | | First Trust
Europe
AlphaDEX®
Fund
(FEP) | | First Trust
Latin
America
AlphaDEX®
Fund
(FLN) | | First Trust
Brazil
AlphaDEX®
Fund
(FBZ) |
| INVESTMENT INCOME: | | | | | | | |
Dividends
| $ 1,316,186 | | $ 28,064,593 | | $ 683,191 | | $ 2,352,044 |
Securities lending income (net of fees)
| 6,615 | | 423,520 | | — | | — |
Foreign withholding tax
| (74,370) | | (2,797,384) | | (62,677) | | (169,598) |
Other
| 179 | | 1,208 | | 4 | | 6 |
Total investment income
| 1,248,610 | | 25,691,937 | | 620,518 | | 2,182,452 |
| EXPENSES: | | | | | | | |
Investment advisory fees
| 402,693 | | 6,639,207 | | 152,484 | | 228,583 |
Total expenses
| 402,693 | | 6,639,207 | | 152,484 | | 228,583 |
NET INVESTMENT INCOME (LOSS)
| 845,917 | | 19,052,730 | | 468,034 | | 1,953,869 |
| NET REALIZED AND UNREALIZED GAIN (LOSS): | | | | | | | |
| Net realized gain (loss) on: | | | | | | | |
Investments
| (3,020,190) | | (40,300,843) | | (1,007,613) | | (388,393) |
In-kind redemptions
| 1,146,828 | | 10,813,464 | | (269,433) | | — |
Foreign currency transactions
| (31,690) | | (157,036) | | (18,147) | | 188,513 |
Foreign capital gains tax
| — | | — | | (139) | | — |
Net realized gain (loss)
| (1,905,052) | | (29,644,415) | | (1,295,332) | | (199,880) |
Net increase from payment by the advisor
| — | | — | | — | | — |
| Net change in unrealized appreciation (depreciation) on: | | | | | | | |
Investments
| (9,854,404) | | (155,631,824) | | (2,098,900) | | (2,639,498) |
Foreign currency translation
| (821) | | (87,692) | | 321 | | 1,736 |
Deferred foreign capital gains tax
| — | | — | | — | | — |
Net change in unrealized appreciation (depreciation)
| (9,855,225) | | (155,719,516) | | (2,098,579) | | (2,637,762) |
NET REALIZED AND UNREALIZED GAIN (LOSS)
| (11,760,277) | | (185,363,931) | | (3,393,911) | | (2,837,642) |
NET INCREASE (DECREASE) IN NET ASSETS RESULTING FROM OPERATIONS
| $(10,914,360) | | $(166,311,201) | | $(2,925,877) | | $(883,773) |
Page 112
See Notes to Financial Statements
| | First Trust
China
AlphaDEX®
Fund
(FCA) | | First Trust
Japan
AlphaDEX®
Fund
(FJP) | | First Trust
South
Korea
AlphaDEX®
Fund
(FKO) | | First Trust
Developed
Markets
ex-US
AlphaDEX®
Fund
(FDT) | | First Trust
Emerging
Markets
AlphaDEX®
Fund
(FEM) |
| | | | | | | | | | |
| | $377,892 | | $3,707,624 | | $39,873 | | $31,972,896 | | $25,643,488 |
| | 1,938 | | 32,987 | | — | | 333,200 | | 209,987 |
| | (24,729) | | (365,875) | | (9,388) | | (2,740,587) | | (2,113,035) |
| | — | | 11 | | 462 | | 482 | | 6 |
| | 355,101 | | 3,374,747 | | 30,947 | | 29,565,991 | | 23,740,446 |
| | | | | | | | | | |
| | 76,728 | | 1,261,503 | | 21,323 | | 9,233,597 | | 4,550,947 |
| | 76,728 | | 1,261,503 | | 21,323 | | 9,233,597 | | 4,550,947 |
| | 278,373 | | 2,113,244 | | 9,624 | | 20,332,394 | | 19,189,499 |
| | | | | | | | | | |
| | | | | | | | | | |
| | (483,348) | | (14,423,799) | | 70,567 | | (69,052,232) | | (62,527,152) |
| | (45,263) | | 13,969,791 | | — | | 2,870,338 | | 7,505,401 |
| | 290 | | (51,560) | | 56 | | (633,875) | | (619,083) |
| | — | | — | | — | | — | | (221,922) |
| | (528,321) | | (505,568) | | 70,623 | | (66,815,769) | | (55,862,756) |
| | — | | — | | — | | — | | — |
| | | | | | | | | | |
| | (1,756,848) | | (33,851,109) | | (695,784) | | (213,942,677) | | (69,859,331) |
| | 5 | | 1,235 | | (35) | | (14,906) | | (6,232) |
| | — | | — | | — | | — | | 211,870 |
| | (1,756,843) | | (33,849,874) | | (695,819) | | (213,957,583) | | (69,653,693) |
| | (2,285,164) | | (34,355,442) | | (625,196) | | (280,773,352) | | (125,516,449) |
| | $(2,006,791) | | $(32,242,198) | | $(615,572) | | $(260,440,958) | | $(106,326,950) |
See Notes to Financial Statements
Page 113
First Trust Exchange-Traded AlphaDEX® Fund II
Statements of Operations (Continued)
For the Year Ended December 31, 2018
| | First Trust
Germany
AlphaDEX®
Fund
(FGM) | | First Trust
Canada
AlphaDEX®
Fund
(FCAN) | | First Trust
Australia
AlphaDEX®
Fund
(FAUS) | | First Trust
United
Kingdom
AlphaDEX®
Fund
(FKU) |
| INVESTMENT INCOME: | | | | | | | |
Dividends
| $ 6,566,474 | | $ 245,878 | | $ 63,122 | | $ 493,196 |
Securities lending income (net of fees)
| 3,907 | | 1,085 | | — | | — |
Foreign withholding tax
| (789,029) | | (36,999) | | (3,520) | | (4,195) |
Other
| — | | — | | — | | — |
Total investment income
| 5,781,352 | | 209,964 | | 59,602 | | 489,001 |
| EXPENSES: | | | | | | | |
Investment advisory fees
| 1,878,251 | | 85,103 | | 12,908 | | 108,503 |
Total expenses
| 1,878,251 | | 85,103 | | 12,908 | | 108,503 |
NET INVESTMENT INCOME (LOSS)
| 3,903,101 | | 124,861 | | 46,694 | | 380,498 |
| NET REALIZED AND UNREALIZED GAIN (LOSS): | | | | | | | |
| Net realized gain (loss) on: | | | | | | | |
Investments
| 3,188,463 | | (199,731) | | 48,798 | | 820,947 |
In-kind redemptions
| 2,998,400 | | (834,015) | | 230,274 | | 1,048,693 |
Foreign currency transactions
| 13,284 | | (146) | | (538) | | (3,196) |
Foreign capital gains tax
| — | | — | | — | | — |
Net realized gain (loss)
| 6,200,147 | | (1,033,892) | | 278,534 | | 1,866,444 |
Net increase from payment by the advisor
| — | | — | | — | | — |
| Net change in unrealized appreciation (depreciation) on: | | | | | | | |
Investments
| (69,815,400) | | (2,583,624) | | (565,634) | | (3,343,894) |
Foreign currency translation
| (32,750) | | (124) | | (5) | | (549) |
Deferred foreign capital gains tax
| — | | — | | — | | — |
Net change in unrealized appreciation (depreciation)
| (69,848,150) | | (2,583,748) | | (565,639) | | (3,344,443) |
NET REALIZED AND UNREALIZED GAIN (LOSS)
| (63,648,003) | | (3,617,640) | | (287,105) | | (1,477,999) |
NET INCREASE (DECREASE) IN NET ASSETS RESULTING FROM OPERATIONS
| $(59,744,902) | | $(3,492,779) | | $(240,411) | | $(1,097,501) |
Page 114
See Notes to Financial Statements
| | First Trust
India
NIFTY 50
Equal Weight
ETF
(NFTY) | | First Trust
Hong Kong
AlphaDEX®
Fund
(FHK) | | First Trust
Switzerland
AlphaDEX®
Fund
(FSZ) | | First Trust
Developed
Markets
ex-US
Small Cap
AlphaDEX®
Fund
(FDTS) | | First Trust
Emerging
Markets
Small Cap
AlphaDEX®
Fund
(FEMS) | | First Trust
Eurozone
AlphaDEX®
ETF
(FEUZ) |
| | | | | | | | | | | | |
| | $46,506 | | $145,857 | | $6,592,640 | | $321,560 | | $11,261,735 | | $2,420,365 |
| | — | | 2,666 | | — | | — | | 53,634 | | 49,066 |
| | — | | — | | (629,949) | | (32,752) | | (1,124,074) | | (319,515) |
| | — | | — | | 6 | | 80 | | — | | 350 |
| | 46,506 | | 148,523 | | 5,962,697 | | 288,888 | | 10,191,295 | | 2,150,266 |
| | | | | | | | | | | | |
| | 23,713 | | 31,970 | | 1,842,656 | | 110,082 | | 2,135,798 | | 592,967 |
| | 23,713 | | 31,970 | | 1,842,656 | | 110,082 | | 2,135,798 | | 592,967 |
| | 22,793 | | 116,553 | | 4,120,041 | | 178,806 | | 8,055,497 | | 1,557,299 |
| | | | | | | | | | | | |
| | | | | | | | | | | | |
| | 783,118 | | 27,005 | | (2,598,425) | | (1,233,462) | | (32,092,490) | | (8,662,895) |
| | — | | 579,266 | | 17,069,741 | | 64,429 | | 2,181,960 | | 589,140 |
| | (1,041) | | 87 | | (7,972) | | (9,405) | | (517,129) | | (5,005) |
| | (1,905) | | — | | — | | — | | (1,278) | | — |
| | 780,172 | | 606,358 | | 14,463,344 | | (1,178,438) | | (30,428,937) | | (8,078,760) |
| | 14,188 | | — | | — | | — | | — | | — |
| | | | | | | | | | | | |
| | (919,041) | | (1,390,647) | | (52,093,118) | | (3,103,673) | | (42,492,446) | | (11,885,728) |
| | 591 | | (5) | | (18,790) | | (324) | | (104) | | (3,314) |
| | 2,008 | | — | | — | | — | | — | | — |
| | (916,442) | | (1,390,652) | | (52,111,908) | | (3,103,997) | | (42,492,550) | | (11,889,042) |
| | (122,082) | | (784,294) | | (37,648,564) | | (4,282,435) | | (72,921,487) | | (19,967,802) |
| | $(99,289) | | $(667,741) | | $(33,528,523) | | $(4,103,629) | | $(64,865,990) | | $(18,410,503) |
See Notes to Financial Statements
Page 115
First Trust Exchange-Traded AlphaDEX® Fund II
Statements of Changes in Net Assets
| | First Trust Asia Pacific
ex-Japan AlphaDEX® Fund (FPA) | | First Trust Europe
AlphaDEX® Fund (FEP) |
| | Year
Ended
12/31/2018 | | Year
Ended
12/31/2017 | | Year
Ended
12/31/2018 | | Year
Ended
12/31/2017 |
| OPERATIONS: | | | | | | | |
Net investment income (loss)
| $ 845,917 | | $ 1,328,760 | | $ 19,052,730 | | $ 6,264,001 |
Net realized gain (loss)
| (1,905,052) | | 3,070,819 | | (29,644,415) | | 37,223,345 |
Net increase from payment by the advisor
| — | | — | | — | | — |
Net change in unrealized appreciation (depreciation)
| (9,855,225) | | 8,830,389 | | (155,719,516) | | 79,690,096 |
Net increase (decrease) in net assets resulting from operations
| (10,914,360) | | 13,229,968 | | (166,311,201) | | 123,177,442 |
| DISTRIBUTIONS TO SHAREHOLDERS FROM: | | | | | | | |
Investment operations
| (1,047,602) | | | | (18,614,887) | | |
Net investment income
| | | (1,716,347) | | | | (9,061,721) |
Net realized gain
| | | — | | | | — |
Return of capital
| (101,870) | | — | | — | | — |
Total distributions to shareholders
| (1,149,472) | | (1,716,347) | | (18,614,887) | | (9,061,721) |
| SHAREHOLDER TRANSACTIONS: | | | | | | | |
Proceeds from shares sold
| 3,698,358 | | 20,122,738 | | 250,992,759 | | 352,575,234 |
Cost of shares redeemed
| (20,175,241) | | (5,270,585) | | (180,568,319) | | (8,791,380) |
Net increase (decrease) in net assets resulting from shareholder transactions
| (16,476,883) | | 14,852,153 | | 70,424,440 | | 343,783,854 |
Total increase (decrease) in net assets
| (28,540,715) | | 26,365,774 | | (114,501,648) | | 457,899,575 |
| NET ASSETS: | | | | | | | |
Beginning of period
| 58,959,272 | | 32,593,498 | | 707,087,321 | | 249,187,746 |
End of period
| $ 30,418,557 | | $ 58,959,272 | | $ 592,585,673 | | $ 707,087,321 |
Accumulated net investment income (loss) at end of period
| | | $(344,420) | | | | $(2,861,076) |
| CHANGES IN SHARES OUTSTANDING: | | | | | | | |
Shares outstanding, beginning of period
| 1,650,002 | | 1,200,002 | | 18,100,002 | | 8,500,002 |
Shares sold
| 100,000 | | 600,000 | | 6,250,000 | | 9,900,000 |
Shares redeemed
| (650,000) | | (150,000) | | (5,300,000) | | (300,000) |
Shares outstanding, end of period
| 1,100,002 | | 1,650,002 | | 19,050,002 | | 18,100,002 |
Page 116
See Notes to Financial Statements
First Trust Latin America
AlphaDEX® Fund (FLN) | | First Trust Brazil
AlphaDEX® Fund (FBZ) | | First Trust China
AlphaDEX® Fund (FCA) |
Year
Ended
12/31/2018 | | Year
Ended
12/31/2017 | | Year
Ended
12/31/2018 | | Year
Ended
12/31/2017 | | Year
Ended
12/31/2018 | | Year
Ended
12/31/2017 |
| | | | | | | | | | | |
| $ 468,034 | | $ 2,204,552 | | $ 1,953,869 | | $ 2,256,588 | | $ 278,373 | | $ 124,931 |
| (1,295,332) | | 2,026,103 | | (199,880) | | 4,904,766 | | (528,321) | | 1,910,476 |
| — | | — | | — | | — | | — | | — |
| (2,098,579) | | (1,301,884) | | (2,637,762) | | (6,155,271) | | (1,756,843) | | 626,521 |
| (2,925,877) | | 2,928,771 | | (883,773) | | 1,006,083 | | (2,006,791) | | 2,661,928 |
| | | | | | | | | | | |
| (464,297) | | | | (3,378,863) | | | | (251,046) | | |
| | | (2,920,964) | | | | (2,439,989) | | | | (177,821) |
| | | — | | | | (103,980) | | | | — |
| (46,029) | | — | | — | | — | | — | | — |
| (510,326) | | (2,920,964) | | (3,378,863) | | (2,543,969) | | (251,046) | | (177,821) |
| | | | | | | | | | | |
| 19,605,504 | | 60,665,092 | | 153,263,136 | | 70,645,418 | | 3,241,582 | | 6,713,848 |
| (16,114,287) | | (150,114,316) | | (29,226,860) | | (160,098,839) | | (1,285,459) | | (5,610,697) |
| 3,491,217 | | (89,449,224) | | 124,036,276 | | (89,453,421) | | 1,956,123 | | 1,103,151 |
| 55,014 | | (89,441,417) | | 119,773,640 | | (90,991,307) | | (301,714) | | 3,587,258 |
| | | | | | | | | | | |
| 17,363,263 | | 106,804,680 | | 9,307,536 | | 100,298,843 | | 7,443,445 | | 3,856,187 |
| $17,418,277 | | $ 17,363,263 | | $ 129,081,176 | | $ 9,307,536 | | $ 7,141,731 | | $ 7,443,445 |
| | | $(19,785) | | | | $(14,443) | | | | $(31,486) |
| | | | | | | | | | | |
| 850,002 | | 5,700,002 | | 600,002 | | 7,200,002 | | 250,002 | | 200,002 |
| 950,000 | | 2,850,000 | | 11,250,000 | | 4,550,000 | | 100,000 | | 250,000 |
| (850,000) | | (7,700,000) | | (2,200,000) | | (11,150,000) | | (50,000) | | (200,000) |
| 950,002 | | 850,002 | | 9,650,002 | | 600,002 | | 300,002 | | 250,002 |
See Notes to Financial Statements
Page 117
First Trust Exchange-Traded AlphaDEX® Fund II
Statements of Changes in Net Assets (Continued)
| | First Trust Japan
AlphaDEX® Fund (FJP) | | First Trust South Korea
AlphaDEX® Fund (FKO) |
| | Year
Ended
12/31/2018 | | Year
Ended
12/31/2017 | | Year
Ended
12/31/2018 | | Year
Ended
12/31/2017 |
| OPERATIONS: | | | | | | | |
Net investment income (loss)
| $ 2,113,244 | | $ 769,987 | | $ 9,624 | | $ 67,388 |
Net realized gain (loss)
| (505,568) | | 2,208,759 | | 70,623 | | 479,683 |
Net increase from payment by the advisor
| — | | — | | — | | — |
Net change in unrealized appreciation (depreciation)
| (33,849,874) | | 12,297,130 | | (695,819) | | 847,334 |
Net increase (decrease) in net assets resulting from operations
| (32,242,198) | | 15,275,876 | | (615,572) | | 1,394,405 |
| DISTRIBUTIONS TO SHAREHOLDERS FROM: | | | | | | | |
Investment operations
| (2,237,007) | | | | (42,814) | | |
Net investment income
| | | (1,002,182) | | | | (22,080) |
Net realized gain
| | | — | | | | — |
Return of capital
| — | | — | | (26,947) | | — |
Total distributions to shareholders
| (2,237,007) | | (1,002,182) | | (69,761) | | (22,080) |
| SHAREHOLDER TRANSACTIONS: | | | | | | | |
Proceeds from shares sold
| 203,059,711 | | 52,874,641 | | — | | 22,253 |
Cost of shares redeemed
| (99,364,520) | | (31,282,166) | | — | | (2,821,680) |
Net increase (decrease) in net assets resulting from shareholder transactions
| 103,695,191 | | 21,592,475 | | — | | (2,799,427) |
Total increase (decrease) in net assets
| 69,215,986 | | 35,866,169 | | (685,333) | | (1,427,102) |
| NET ASSETS: | | | | | | | |
Beginning of period
| 83,717,717 | | 47,851,548 | | 2,952,159 | | 4,379,261 |
End of period
| $ 152,933,703 | | $ 83,717,717 | | $ 2,266,826 | | $ 2,952,159 |
Accumulated net investment income (loss) at end of period
| | | $(235,836) | | | | $12,640 |
| CHANGES IN SHARES OUTSTANDING: | | | | | | | |
Shares outstanding, beginning of period
| 1,400,002 | | 1,000,002 | | 100,002 | | 200,002 |
Shares sold
| 3,400,000 | | 1,000,000 | | — | | — |
Shares redeemed
| (1,650,000) | | (600,000) | | — | | (100,000) |
Shares outstanding, end of period
| 3,150,002 | | 1,400,002 | | 100,002 | | 100,002 |
Page 118
See Notes to Financial Statements
First Trust Developed Markets
ex-US AlphaDEX® Fund (FDT) | | First Trust Emerging Markets
AlphaDEX® Fund (FEM) | | First Trust Germany
AlphaDEX® Fund (FGM) |
Year
Ended
12/31/2018 | | Year
Ended
12/31/2017 | | Year
Ended
12/31/2018 | | Year
Ended
12/31/2017 | | Year
Ended
12/31/2018 | | Year
Ended
12/31/2017 |
| | | | | | | | | | | |
| $ 20,332,394 | | $ 8,200,783 | | $ 19,189,499 | | $ 8,045,766 | | $ 3,903,101 | | $ 4,255,043 |
| (66,815,769) | | 30,469,565 | | (55,862,756) | | 42,246,374 | | 6,200,147 | | 12,688,056 |
| — | | — | | — | | — | | — | | — |
| (213,957,583) | | 78,453,588 | | (69,653,693) | | 41,365,315 | | (69,848,150) | | 47,584,769 |
| (260,440,958) | | 117,123,936 | | (106,326,950) | | 91,657,455 | | (59,744,902) | | 64,527,868 |
| | | | | | | | | | | |
| (20,849,188) | | | | (17,760,227) | | | | (4,271,617) | | |
| | | (10,575,893) | | | | (9,394,816) | | | | (4,674,742) |
| | | — | | | | — | | | | — |
| (817,374) | | — | | — | | — | | — | | — |
| (21,666,562) | | (10,575,893) | | (17,760,227) | | (9,394,816) | | (4,271,617) | | (4,674,742) |
| | | | | | | | | | | |
| 553,607,021 | | 729,991,217 | | 274,597,856 | | 271,763,386 | | 24,647,440 | | 182,231,354 |
| (141,060,958) | | (185,342,428) | | (147,566,982) | | (52,965,236) | | (80,454,260) | | (81,717,451) |
| 412,546,063 | | 544,648,789 | | 127,030,874 | | 218,798,150 | | (55,806,820) | | 100,513,903 |
| 130,438,543 | | 651,196,832 | | 2,943,697 | | 301,060,789 | | (119,823,339) | | 160,367,029 |
| | | | | | | | | | | |
| 810,194,079 | | 158,997,247 | | 449,663,299 | | 148,602,510 | | 258,845,346 | | 98,478,317 |
| $940,632,622 | | $ 810,194,079 | | $ 452,606,996 | | $ 449,663,299 | | $ 139,022,007 | | $ 258,845,346 |
| | | $(2,518,025) | | | | $(682,580) | | | | $— |
| | | | | | | | | | | |
| 13,002,000 | | 3,352,000 | | 16,150,002 | | 7,250,002 | | 5,050,002 | | 2,700,002 |
| 8,750,000 | | 12,750,000 | | 9,600,000 | | 10,800,000 | | 500,000 | | 4,200,000 |
| (2,650,000) | | (3,100,000) | | (5,900,000) | | (1,900,000) | | (1,850,000) | | (1,850,000) |
| 19,102,000 | | 13,002,000 | | 19,850,002 | | 16,150,002 | | 3,700,002 | | 5,050,002 |
See Notes to Financial Statements
Page 119
First Trust Exchange-Traded AlphaDEX® Fund II
Statements of Changes in Net Assets (Continued)
| | First Trust Canada
AlphaDEX® Fund (FCAN) | | First Trust Australia
AlphaDEX® Fund (FAUS) |
| | Year
Ended
12/31/2018 | | Year
Ended
12/31/2017 | | Year
Ended
12/31/2018 | | Year
Ended
12/31/2017 |
| OPERATIONS: | | | | | | | |
Net investment income (loss)
| $ 124,861 | | $ 111,097 | | $ 46,694 | | $ 52,745 |
Net realized gain (loss)
| (1,033,892) | | (137,337) | | 278,534 | | 127,475 |
Net increase from payment by the advisor
| — | | — | | — | | — |
Net change in unrealized appreciation (depreciation)
| (2,583,748) | | 526,886 | | (565,639) | | 156,296 |
Net increase (decrease) in net assets resulting from operations
| (3,492,779) | | 500,646 | | (240,411) | | 336,516 |
| DISTRIBUTIONS TO SHAREHOLDERS FROM: | | | | | | | |
Investment operations
| (147,686) | | | | (49,972) | | |
Net investment income
| | | (112,596) | | | | (80,283) |
Net realized gain
| | | — | | | | — |
Return of capital
| — | | — | | — | | — |
Total distributions to shareholders
| (147,686) | | (112,596) | | (49,972) | | (80,283) |
| SHAREHOLDER TRANSACTIONS: | | | | | | | |
Proceeds from shares sold
| 12,981,135 | | 17,631,286 | | 1,629,940 | | — |
Cost of shares redeemed
| (8,829,979) | | (18,385,543) | | (1,644,878) | | — |
Net increase (decrease) in net assets resulting from shareholder transactions
| 4,151,156 | | (754,257) | | (14,938) | | — |
Total increase (decrease) in net assets
| 510,691 | | (366,207) | | (305,321) | | 256,233 |
| NET ASSETS: | | | | | | | |
Beginning of period
| 6,621,231 | | 6,987,438 | | 1,683,634 | | 1,427,401 |
End of period
| $ 7,131,922 | | $ 6,621,231 | | $ 1,378,313 | | $ 1,683,634 |
Accumulated net investment income (loss) at end of period
| | | $22,850 | | | | $(53,933) |
| CHANGES IN SHARES OUTSTANDING: | | | | | | | |
Shares outstanding, beginning of period
| 250,002 | | 300,002 | | 50,002 | | 50,002 |
Shares sold
| 500,000 | | 750,000 | | 50,000 | | — |
Shares redeemed
| (400,000) | | (800,000) | | (50,000) | | — |
Shares outstanding, end of period
| 350,002 | | 250,002 | | 50,002 | | 50,002 |
Page 120
See Notes to Financial Statements
First Trust United Kingdom
AlphaDEX® Fund (FKU) | | First Trust India
NIFTY 50 Equal Weight ETF (NFTY) | | First Trust Hong Kong
AlphaDEX® Fund (FHK) |
Year
Ended
12/31/2018 | | Year
Ended
12/31/2017 | | Year
Ended
12/31/2018 | | Year
Ended
12/31/2017 | | Year
Ended
12/31/2018 | | Year
Ended
12/31/2017 |
| | | | | | | | | | | |
| $ 380,498 | | $ 762,171 | | $ 22,793 | | $ 86,902 | | $ 116,553 | | $ 403,613 |
| 1,866,444 | | (1,909,051) | | 780,172 | | 304,513 | | 606,358 | | 695,617 |
| — | | — | | 14,188 | | — | | — | | — |
| (3,344,443) | | 6,970,252 | | (916,442) | | 302,146 | | (1,390,652) | | 1,679,478 |
| (1,097,501) | | 5,823,372 | | (99,289) | | 693,561 | | (667,741) | | 2,778,708 |
| | | | | | | | | | | |
| (557,843) | | | | — | | | | (98,852) | | |
| | | (788,507) | | | | (146,993) | | | | (469,086) |
| | | — | | | | — | | | | — |
| — | | — | | — | | — | | — | | — |
| (557,843) | | (788,507) | | — | | (146,993) | | (98,852) | | (469,086) |
| | | | | | | | | | | |
| 1,557,444 | | — | | 1,856,385 | | — | | — | | — |
| (8,256,139) | | (14,974,287) | | (1,855,093) | | — | | (2,223,210) | | (4,036,464) |
| (6,698,695) | | (14,974,287) | | 1,292 | | — | | (2,223,210) | | (4,036,464) |
| (8,354,039) | | (9,939,422) | | (97,997) | | 546,568 | | (2,989,803) | | (1,726,842) |
| | | | | | | | | | | |
| 17,986,339 | | 27,925,761 | | 3,633,288 | | 3,086,720 | | 6,405,824 | | 8,132,666 |
| $9,632,300 | | $ 17,986,339 | | $ 3,535,291 | | $ 3,633,288 | | $ 3,416,021 | | $ 6,405,824 |
| | | $70,501 | | | | $(51,707) | | | | $(41,034) |
| | | | | | | | | | | |
| 450,002 | | 850,002 | | 100,002 | | 100,002 | | 150,002 | | 250,002 |
| 50,000 | | — | | 50,000 | | — | | — | | — |
| (200,000) | | (400,000) | | (50,000) | | — | | (50,000) | | (100,000) |
| 300,002 | | 450,002 | | 100,002 | | 100,002 | | 100,002 | | 150,002 |
See Notes to Financial Statements
Page 121
First Trust Exchange-Traded AlphaDEX® Fund II
Statements of Changes in Net Assets (Continued)
| | First Trust Switzerland
AlphaDEX® Fund (FSZ) | | First Trust Developed Markets ex-US
Small Cap AlphaDEX® Fund (FDTS) |
| | Year
Ended
12/31/2018 | | Year
Ended
12/31/2017 | | Year
Ended
12/31/2018 | | Year
Ended
12/31/2017 |
| OPERATIONS: | | | | | | | |
Net investment income (loss)
| $ 4,120,041 | | $ 2,552,254 | | $ 178,806 | | $ 140,954 |
Net realized gain (loss)
| 14,463,344 | | 4,777,970 | | (1,178,438) | | 1,327,951 |
Net increase from payment by the advisor
| — | | — | | — | | — |
Net change in unrealized appreciation (depreciation)
| (52,111,908) | | 37,156,414 | | (3,103,997) | | 963,600 |
Net increase (decrease) in net assets resulting from operations
| (33,528,523) | | 44,486,638 | | (4,103,629) | | 2,432,505 |
| DISTRIBUTIONS TO SHAREHOLDERS FROM: | | | | | | | |
Investment operations
| (4,115,398) | | | | (207,752) | | |
Net investment income
| | | (3,096,407) | | | | (185,062) |
Net realized gain
| | | — | | | | — |
Return of capital
| (795,384) | | — | | (10,134) | | — |
Total distributions to shareholders
| (4,910,782) | | (3,096,407) | | (217,886) | | (185,062) |
| SHAREHOLDER TRANSACTIONS: | | | | | | | |
Proceeds from shares sold
| 53,962,639 | | 105,414,378 | | 9,208,562 | | 7,822,662 |
Cost of shares redeemed
| (101,401,838) | | (13,596,586) | | (3,801,204) | | (7,833,316) |
Net increase (decrease) in net assets resulting from shareholder transactions
| (47,439,199) | | 91,817,792 | | 5,407,358 | | (10,654) |
Total increase (decrease) in net assets
| (85,878,504) | | 133,208,023 | | 1,085,843 | | 2,236,789 |
| NET ASSETS: | | | | | | | |
Beginning of period
| 237,287,797 | | 104,079,774 | | 8,977,337 | | 6,740,548 |
End of period
| $ 151,409,293 | | $ 237,287,797 | | $ 10,063,180 | | $ 8,977,337 |
Accumulated net investment income (loss) at end of period
| | | $(328,174) | | | | $(36,342) |
| CHANGES IN SHARES OUTSTANDING: | | | | | | | |
Shares outstanding, beginning of period
| 4,500,002 | | 2,550,002 | | 200,002 | | 200,002 |
Shares sold
| 1,050,000 | | 2,250,000 | | 200,000 | | 200,000 |
Shares redeemed
| (2,100,000) | | (300,000) | | (100,000) | | (200,000) |
Shares outstanding, end of period
| 3,450,002 | | 4,500,002 | | 300,002 | | 200,002 |
Page 122
See Notes to Financial Statements
First Trust Emerging Markets
Small Cap AlphaDEX® Fund (FEMS) | | First Trust Eurozone
AlphaDEX® ETF (FEUZ) |
Year
Ended
12/31/2018 | | Year
Ended
12/31/2017 | | Year
Ended
12/31/2018 | | Year
Ended
12/31/2017 |
| | | | | | | |
| $ 8,055,497 | | $ 6,346,963 | | $ 1,557,299 | | $ 144,791 |
| (30,428,937) | | 30,283,493 | | (8,078,760) | | 940,107 |
| — | | — | | — | | — |
| (42,492,550) | | 28,305,922 | | (11,889,042) | | 2,666,560 |
| (64,865,990) | | 64,936,378 | | (18,410,503) | | 3,751,458 |
| | | | | | | |
| (9,593,043) | | | | (1,614,237) | | |
| | | (7,510,083) | | | | (168,471) |
| | | (1,350,720) | | | | — |
| — | | — | | — | | — |
| (9,593,043) | | (8,860,803) | | (1,614,237) | | (168,471) |
| | | | | | | |
| 112,432,427 | | 172,061,512 | | 79,310,329 | | 32,847,682 |
| (151,703,188) | | (51,387,268) | | (48,785,143) | | (3,534,316) |
| (39,270,761) | | 120,674,244 | | 30,525,186 | | 29,313,366 |
| (113,729,794) | | 176,749,819 | | 10,500,446 | | 32,896,353 |
| | | | | | | |
| 271,055,430 | | 94,305,611 | | 39,424,975 | | 6,528,622 |
| $157,325,636 | | $ 271,055,430 | | $ 49,925,421 | | $ 39,424,975 |
| | | $(1,109,275) | | | | $(8,150) |
| | | | | | | |
| 6,300,002 | | 3,100,002 | | 900,002 | | 200,002 |
| 2,500,000 | | 4,500,000 | | 1,850,000 | | 800,000 |
| (3,950,000) | | (1,300,000) | | (1,300,000) | | (100,000) |
| 4,850,002 | | 6,300,002 | | 1,450,002 | | 900,002 |
See Notes to Financial Statements
Page 123
First Trust Exchange-Traded AlphaDEX® Fund II
Financial Highlights
For a share outstanding throughout each period
First Trust Asia Pacific ex-Japan AlphaDEX® Fund (FPA)
| | Year Ended December 31, |
| 2018 | | 2017 | | 2016 | | 2015 | | 2014 |
Net asset value, beginning of period
| $ 35.73 | | $ 27.16 | | $ 27.72 | | $ 27.93 | | $ 27.89 |
| Income from investment operations: | | | | | | | | | |
Net investment income (loss)
| 0.40 | | 0.93 | | 0.48 | | 0.55 | | 0.41 |
Net realized and unrealized gain (loss)
| (7.72) | | 8.76 | | (0.38) | | (0.28) | | 0.78 |
Total from investment operations
| (7.32) | | 9.69 | | 0.10 | | 0.27 | | 1.19 |
| Distributions paid to shareholders from: | | | | | | | | | |
Net investment income
| (0.69) | | (1.12) | | (0.66) | | (0.22) | | (1.06) |
Return of capital
| (0.07) | | — | | — | | (0.26) | | (0.09) |
Total distributions
| (0.76) | | (1.12) | | (0.66) | | (0.48) | | (1.15) |
Net asset value, end of period
| $27.65 | | $35.73 | | $27.16 | | $27.72 | | $27.93 |
Total return (a)
| (20.71)% | | 35.93% | | 0.29% | | 0.97% | | 4.23% |
| Ratios to average net assets/supplemental data: | | | | | | | | | |
Net assets, end of period (in 000’s)
| $ 30,419 | | $ 58,959 | | $ 32,593 | | $ 36,036 | | $ 30,727 |
Ratio of total expenses to average net assets
| 0.80% | | 0.80% | | 0.80% | | 0.80% | | 0.80% |
Ratio of net investment income (loss) to average net assets
| 1.68% | | 2.95% | | 1.68% | | 1.55% | | 1.46% |
Portfolio turnover rate (b)
| 88% | | 94% | | 96% | | 127% | | 186% |
| (a) | Total return is calculated assuming an initial investment made at the net asset value at the beginning of the period, reinvestment of all distributions at net asset value during the period, and redemption at net asset value on the last day of the period. The returns presented do not reflect the deduction of taxes that a shareholder would pay on Fund distributions or the redemption or sale of Fund shares. Total return is calculated for the time period presented and is not annualized for periods of less than a year. |
| (b) | Portfolio turnover is calculated for the time period presented and is not annualized for periods of less than a year and does not include securities received or delivered from processing creations or redemptions and in-kind transactions. |
Page 124
See Notes to Financial Statements
First Trust Exchange-Traded AlphaDEX® Fund II
Financial Highlights (Continued)
For a share outstanding throughout each period
First Trust Europe AlphaDEX® Fund (FEP)
| | Year Ended December 31, |
| 2018 | | 2017 | | 2016 | | 2015 | | 2014 |
Net asset value, beginning of period
| $ 39.07 | | $ 29.32 | | $ 29.61 | | $ 29.50 | | $ 33.10 |
| Income from investment operations: | | | | | | | | | |
Net investment income (loss)
| 0.84 | | 0.49 | | 0.53 | | 0.62 | | 0.70 |
Net realized and unrealized gain (loss)
| (7.99) | | 9.90 | | (0.20) | | 0.14 | | (3.58) |
Total from investment operations
| (7.15) | | 10.39 | | 0.33 | | 0.76 | | (2.88) |
| Distributions paid to shareholders from: | | | | | | | | | |
Net investment income
| (0.81) | | (0.64) | | (0.62) | | (0.65) | | (0.72) |
Net asset value, end of period
| $31.11 | | $39.07 | | $29.32 | | $29.61 | | $29.50 |
Total return (a)
| (18.67)% | | 35.67% | | 1.24% | | 2.53% | | (8.90)% |
| Ratios to average net assets/supplemental data: | | | | | | | | | |
Net assets, end of period (in 000’s)
| $ 592,586 | | $ 707,087 | | $ 249,188 | | $ 408,613 | | $ 277,286 |
Ratio of total expenses to average net assets
| 0.80% | | 0.80% | | 0.80% | | 0.80% | | 0.80% |
Ratio of net investment income (loss) to average net assets
| 2.30% | | 1.39% | | 2.03% | | 2.12% | | 2.39% |
Portfolio turnover rate (b)
| 99% | | 100% | | 103% | | 118% | | 106% |
| (a) | Total return is calculated assuming an initial investment made at the net asset value at the beginning of the period, reinvestment of all distributions at net asset value during the period, and redemption at net asset value on the last day of the period. The returns presented do not reflect the deduction of taxes that a shareholder would pay on Fund distributions or the redemption or sale of Fund shares. Total return is calculated for the time period presented and is not annualized for periods of less than a year. |
| (b) | Portfolio turnover is calculated for the time period presented and is not annualized for periods of less than a year and does not include securities received or delivered from processing creations or redemptions and in-kind transactions. |
See Notes to Financial Statements
Page 125
First Trust Exchange-Traded AlphaDEX® Fund II
Financial Highlights (Continued)
For a share outstanding throughout each period
First Trust Latin America AlphaDEX® Fund (FLN)
| | Year Ended December 31, |
| 2018 | | 2017 | | 2016 | | 2015 | | 2014 |
Net asset value, beginning of period
| $ 20.43 | | $ 18.74 | | $ 13.28 | | $ 19.09 | | $ 23.43 |
| Income from investment operations: | | | | | | | | | |
Net investment income (loss)
| 0.52 | | 1.56 | | 0.31 | | 0.40 | | 0.73 |
Net realized and unrealized gain (loss)
| (2.06) | | 2.23 | | 5.35 | | (5.90) | | (4.32) |
Total from investment operations
| (1.54) | | 3.79 | | 5.66 | | (5.50) | | (3.59) |
| Distributions paid to shareholders from: | | | | | | | | | |
Net investment income
| (0.51) | | (2.10) | | (0.20) | | (0.26) | | (0.75) |
Return of capital
| (0.05) | | — | | — | | (0.05) | | — |
Total distributions
| (0.56) | | (2.10) | | (0.20) | | (0.31) | | (0.75) |
Net asset value, end of period
| $18.33 | | $20.43 | | $18.74 | | $13.28 | | $19.09 |
Total return (a)
| (7.50)% | | 20.50% | | 42.81% | | (29.08)% | | (15.80)% |
| Ratios to average net assets/supplemental data: | | | | | | | | | |
Net assets, end of period (in 000’s)
| $ 17,418 | | $ 17,363 | | $ 106,805 | | $ 3,985 | | $ 5,726 |
Ratio of total expenses to average net assets
| 0.80% | | 0.82% (b) | | 0.80% | | 0.80% | | 0.80% |
Ratio of net investment income (loss) to average net assets
| 2.46% | | 3.02% | | 1.62% | | 2.36% | | 3.11% |
Portfolio turnover rate (c)
| 158% | | 187% | | 186% | | 129% | | 103% |
| (a) | Total return is calculated assuming an initial investment made at the net asset value at the beginning of the period, reinvestment of all distributions at net asset value during the period, and redemption at net asset value on the last day of the period. The returns presented do not reflect the deduction of taxes that a shareholder would pay on Fund distributions or the redemption or sale of Fund shares. Total return is calculated for the time period presented and is not annualized for periods of less than a year. |
| (b) | Includes excise tax. If this excise tax was not included, the expense ratio would have been 0.80%. |
| (c) | Portfolio turnover is calculated for the time period presented and is not annualized for periods of less than a year and does not include securities received or delivered from processing creations or redemptions and in-kind transactions. |
Page 126
See Notes to Financial Statements
First Trust Exchange-Traded AlphaDEX® Fund II
Financial Highlights (Continued)
For a share outstanding throughout each period
First Trust Brazil AlphaDEX® Fund (FBZ)
| | Year Ended December 31, |
| 2018 | | 2017 | | 2016 | | 2015 | | 2014 |
Net asset value, beginning of period
| $ 15.51 | | $ 13.93 | | $ 8.87 | | $ 15.65 | | $ 19.45 |
| Income from investment operations: | | | | | | | | | |
Net investment income (loss)
| 0.55 | | 2.46 | | 0.34 | | 0.36 | | 0.78 |
Net realized and unrealized gain (loss)
| (0.97) | | 1.06 | | 4.95 | | (6.80) | | (3.84) |
Total from investment operations
| (0.42) | | 3.52 | | 5.29 | | (6.44) | | (3.06) |
| Distributions paid to shareholders from: | | | | | | | | | |
Net investment income
| (0.54) | | (1.77) | | (0.23) | | (0.33) | | (0.74) |
Net realized gain
| (1.17) | | (0.17) | | — | | — | | — |
Return of capital
| — | | — | | — | | (0.01) | | — |
Total distributions
| (1.71) | | (1.94) | | (0.23) | | (0.34) | | (0.74) |
Net asset value, end of period
| $13.38 | | $15.51 | | $13.93 | | $8.87 | | $15.65 |
Total return (a)
| (1.17)% | | 25.91% | | 59.89% (b) | | (41.80)% | | (16.40)% |
| Ratios to average net assets/supplemental data: | | | | | | | | | |
Net assets, end of period (in 000’s)
| $ 129,081 | | $ 9,308 | | $ 100,299 | | $ 2,218 | | $ 3,912 |
Ratio of total expenses to average net assets
| 0.80% | | 0.84% (c) | | 0.80% | | 0.81% (c) | | 0.80% |
Ratio of net investment income (loss) to average net assets
| 6.84% | | 3.19% | | 2.34% | | 2.90% | | 4.04% |
Portfolio turnover rate (d)
| 128% | | 159% | | 111% | | 106% | | 104% |
| (a) | Total return is calculated assuming an initial investment made at the net asset value at the beginning of the period, reinvestment of all distributions at net asset value during the period, and redemption at net asset value on the last day of the period. The returns presented do not reflect the deduction of taxes that a shareholder would pay on Fund distributions or the redemption or sale of Fund shares. Total return is calculated for the time period presented and is not annualized for periods of less than a year. |
| (b) | The Fund received a reimbursement from the advisor in the amount of $69,112, which represents $0.02 per share. Since the advisor reimbursed the Fund, there was no effect on the Fund’s total return. |
| (c) | Includes excise tax. If this excise tax was not included, the expense ratio would have been 0.80%. |
| (d) | Portfolio turnover is calculated for the time period presented and is not annualized for periods of less than a year and does not include securities received or delivered from processing creations or redemptions and in-kind transactions. |
See Notes to Financial Statements
Page 127
First Trust Exchange-Traded AlphaDEX® Fund II
Financial Highlights (Continued)
For a share outstanding throughout each period
First Trust China AlphaDEX® Fund (FCA)
| | Year Ended December 31, |
| 2018 | | 2017 | | 2016 | | 2015 | | 2014 |
Net asset value, beginning of period
| $ 29.77 | | $ 19.28 | | $ 20.78 | | $ 22.58 | | $ 23.56 |
| Income from investment operations: | | | | | | | | | |
Net investment income (loss)
| 0.84 | | 0.47 | | 0.42 | | 0.85 | | 0.58 |
Net realized and unrealized gain (loss)
| (6.07) | | 10.70 | | (1.44) | | (1.80) | | (1.00) |
Total from investment operations
| (5.23) | | 11.17 | | (1.02) | | (0.95) | | (0.42) |
| Distributions paid to shareholders from: | | | | | | | | | |
Net investment income
| (0.73) | | (0.68) | | (0.48) | | (0.85) | | (0.56) |
Net asset value, end of period
| $23.81 | | $29.77 | | $19.28 | | $20.78 | | $22.58 |
Total return (a)
| (17.87)% | | 58.35% | | (4.96)% (b) | | (4.37)% | | (1.68)% |
| Ratios to average net assets/supplemental data: | | | | | | | | | |
Net assets, end of period (in 000’s)
| $ 7,142 | | $ 7,443 | | $ 3,856 | | $ 9,351 | | $ 15,803 |
Ratio of total expenses to average net assets
| 0.80% | | 0.80% | | 0.80% | | 0.80% | | 0.80% |
Ratio of net investment income (loss) to average net assets
| 2.90% | | 1.69% | | 2.07% | | 3.85% | | 2.04% |
Portfolio turnover rate (c)
| 97% | | 69% | | 197% | | 177% | | 79% |
| (a) | Total return is calculated assuming an initial investment made at the net asset value at the beginning of the period, reinvestment of all distributions at net asset value during the period, and redemption at net asset value on the last day of the period. The returns presented do not reflect the deduction of taxes that a shareholder would pay on Fund distributions or the redemption or sale of Fund shares. Total return is calculated for the time period presented and is not annualized for periods of less than a year. |
| (b) | The Fund received a reimbursement from the advisor in the amount of $9,330, which represents less than $0.03 per share. Since the advisor reimbursed the Fund, there was no effect on the Fund’s total return. |
| (c) | Portfolio turnover is calculated for the time period presented and is not annualized for periods of less than a year and does not include securities received or delivered from processing creations or redemptions and in-kind transactions. |
Page 128
See Notes to Financial Statements
First Trust Exchange-Traded AlphaDEX® Fund II
Financial Highlights (Continued)
For a share outstanding throughout each period
First Trust Japan AlphaDEX® Fund (FJP)
| | Year Ended December 31, |
| 2018 | | 2017 | | 2016 | | 2015 | | 2014 |
Net asset value, beginning of period
| $ 59.80 | | $ 47.85 | | $ 47.18 | | $ 44.99 | | $ 46.02 |
| Income from investment operations: | | | | | | | | | |
Net investment income (loss)
| 0.79 | | 0.64 | | 0.48 | | 0.46 | | 0.49 (a) |
Net realized and unrealized gain (loss)
| (11.30) | | 12.08 | | 0.88 | | 2.13 | | (1.03) |
Total from investment operations
| (10.51) | | 12.72 | | 1.36 | | 2.59 | | (0.54) |
| Distributions paid to shareholders from: | | | | | | | | | |
Net investment income
| (0.74) | | (0.77) | | (0.69) | | (0.40) | | (0.49) |
Net asset value, end of period
| $48.55 | | $59.80 | | $47.85 | | $47.18 | | $44.99 |
Total return (b)
| (17.66)% | | 26.70% | | 2.91% | | 5.73% | | (1.22)% |
| Ratios to average net assets/supplemental data: | | | | | | | | | |
Net assets, end of period (in 000’s)
| $ 152,934 | | $ 83,718 | | $ 47,852 | | $ 96,714 | | $ 38,238 |
Ratio of total expenses to average net assets
| 0.80% | | 0.80% | | 0.80% | | 0.80% | | 0.80% |
Ratio of net investment income (loss) to average net assets
| 1.34% | | 1.22% | | 0.86% | | 0.99% | | 1.06% |
Portfolio turnover rate (c)
| 90% | | 101% | | 122% | | 105% | | 148% |
| (a) | Based on average shares outstanding. |
| (b) | Total return is calculated assuming an initial investment made at the net asset value at the beginning of the period, reinvestment of all distributions at net asset value during the period, and redemption at net asset value on the last day of the period. The returns presented do not reflect the deduction of taxes that a shareholder would pay on Fund distributions or the redemption or sale of Fund shares. Total return is calculated for the time period presented and is not annualized for periods of less than a year. |
| (c) | Portfolio turnover is calculated for the time period presented and is not annualized for periods of less than a year and does not include securities received or delivered from processing creations or redemptions and in-kind transactions. |
See Notes to Financial Statements
Page 129
First Trust Exchange-Traded AlphaDEX® Fund II
Financial Highlights (Continued)
For a share outstanding throughout each period
First Trust South Korea AlphaDEX® Fund (FKO)
| | Year Ended December 31, |
| 2018 | | 2017 | | 2016 | | 2015 | | 2014 |
Net asset value, beginning of period
| $ 29.52 | | $ 21.90 | | $ 22.89 | | $ 23.85 | | $ 27.85 |
| Income from investment operations: | | | | | | | | | |
Net investment income (loss)
| 0.10 | | 0.35 | | (0.01) | | 0.09 | | 0.07 (a) |
Net realized and unrealized gain (loss)
| (6.25) | | 7.38 | | (0.57) | | (0.81) | | (3.83) |
Total from investment operations
| (6.15) | | 7.73 | | (0.58) | | (0.72) | | (3.76) |
| Distributions paid to shareholders from: | | | | | | | | | |
Net investment income
| (0.43) | | (0.11) | | — | | (0.07) | | (0.20) |
Return of capital
| (0.27) | | — | | (0.41) | | (0.17) | | (0.04) |
Total distributions
| (0.70) | | (0.11) | | (0.41) | | (0.24) | | (0.24) |
Net asset value, end of period (b)
| $22.67 | | $29.52 | | $21.90 | | $22.89 | | $23.85 |
Total return
| (20.98)% | | 35.39% | | (2.74)% | | (3.11)% | | (13.60)% |
| Ratios to average net assets/supplemental data: | | | | | | | | | |
Net assets, end of period (in 000’s)
| $ 2,267 | | $ 2,952 | | $ 4,379 | | $ 3,434 | | $ 3,578 |
Ratio of total expenses to average net assets
| 0.80% | | 0.80% | | 0.80% | | 0.80% | | 0.80% |
Ratio of net investment income (loss) to average net assets
| 0.36% | | 1.38% | | (0.08)% | | 0.32% | | 0.25% |
Portfolio turnover rate (c)
| 73% | | 77% | | 268% | | 138% | | 97% |
| (a) | Based on average shares outstanding. |
| (b) | Total return is calculated assuming an initial investment made at the net asset value at the beginning of the period, reinvestment of all distributions at net asset value during the period, and redemption at net asset value on the last day of the period. The returns presented do not reflect the deduction of taxes that a shareholder would pay on Fund distributions or the redemption or sale of Fund shares. Total return is calculated for the time period presented and is not annualized for periods of less than a year. |
| (c) | Portfolio turnover is calculated for the time period presented and is not annualized for periods of less than a year and does not include securities received or delivered from processing creations or redemptions and in-kind transactions. |
Page 130
See Notes to Financial Statements
First Trust Exchange-Traded AlphaDEX® Fund II
Financial Highlights (Continued)
For a share outstanding throughout each period
First Trust Developed Markets ex-US AlphaDEX® Fund (FDT)
| | Year Ended December 31, |
| 2018 | | 2017 | | 2016 | | 2015 | | 2014 |
Net asset value, beginning of period
| $ 62.31 | | $ 47.43 | | $ 46.63 | | $ 47.14 | | $ 50.96 |
| Income from investment operations: | | | | | | | | | |
Net investment income (loss)
| 1.04 | | 0.88 | | 0.73 | | 0.65 | | 0.73 |
Net realized and unrealized gain (loss)
| (13.06) | | 14.98 | | 0.90 | | (0.31) | | (3.72) |
Total from investment operations
| (12.02) | | 15.86 | | 1.63 | | 0.34 | | (2.99) |
| Distributions paid to shareholders from: | | | | | | | | | |
Net investment income
| (1.01) | | (0.98) | | (0.83) | | (0.66) | | (0.83) |
Return of capital
| (0.04) | | — | | — | | (0.19) | | — |
Total distributions
| (1.05) | | (0.98) | | (0.83) | | (0.85) | | (0.83) |
Net asset value, end of period
| $49.24 | | $62.31 | | $47.43 | | $46.63 | | $47.14 |
Total return (a)
| (19.52)% | | 33.57% | | 3.55% | | 0.67% | | (5.98)% |
| Ratios to average net assets/supplemental data: | | | | | | | | | |
Net assets, end of period (in 000’s)
| $ 940,633 | | $ 810,194 | | $ 158,997 | | $ 167,953 | | $ 108,510 |
Ratio of total expenses to average net assets
| 0.80% | | 0.80% | | 0.80% | | 0.80% | | 0.80% |
Ratio of net investment income (loss) to average net assets
| 1.76% | | 1.85% | | 1.46% | | 1.36% | | 1.43% |
Portfolio turnover rate (b)
| 109% | | 104% | | 124% | | 115% | | 115% |
| (a) | Total return is calculated assuming an initial investment made at the net asset value at the beginning of the period, reinvestment of all distributions at net asset value during the period, and redemption at net asset value on the last day of the period. The returns presented do not reflect the deduction of taxes that a shareholder would pay on Fund distributions or the redemption or sale of Fund shares. Total return is calculated for the time period presented and is not annualized for periods of less than a year. |
| (b) | Portfolio turnover is calculated for the time period presented and is not annualized for periods of less than a year and does not include securities received or delivered from processing creations or redemptions and in-kind transactions. |
See Notes to Financial Statements
Page 131
First Trust Exchange-Traded AlphaDEX® Fund II
Financial Highlights (Continued)
For a share outstanding throughout each period
First Trust Emerging Markets AlphaDEX® Fund (FEM)
| | Year Ended December 31, |
| 2018 | | 2017 | | 2016 | | 2015 | | 2014 |
Net asset value, beginning of period
| $ 27.84 | | $ 20.50 | | $ 18.10 | | $ 21.53 | | $ 24.55 |
| Income from investment operations: | | | | | | | | | |
Net investment income (loss)
| 0.88 | | 0.59 | | 0.49 | | 0.68 | | 0.62 |
Net realized and unrealized gain (loss)
| (5.12) | | 7.43 | | 2.37 | | (3.46) | | (3.03) |
Total from investment operations
| (4.24) | | 8.02 | | 2.86 | | (2.78) | | (2.41) |
| Distributions paid to shareholders from: | | | | | | | | | |
Net investment income
| (0.80) | | (0.68) | | (0.46) | | (0.64) | | (0.61) |
Return of capital
| — | | — | | — | | (0.01) | | — |
Total distributions
| (0.80) | | (0.68) | | (0.46) | | (0.65) | | (0.61) |
Net asset value, end of period
| $22.80 | | $27.84 | | $20.50 | | $18.10 | | $21.53 |
Total return (a)
| (15.48)% | | 39.43% | | 15.86% | | (13.11)% | | (10.04)% |
| Ratios to average net assets/supplemental data: | | | | | | | | | |
Net assets, end of period (in 000’s)
| $ 452,607 | | $ 449,663 | | $ 148,603 | | $ 114,925 | | $ 476,909 |
Ratio of total expenses to average net assets
| 0.80% | | 0.80% | | 0.81% (b) | | 0.80% | | 0.80% |
Ratio of net investment income (loss) to average net assets
| 3.37% | | 2.69% | | 2.49% | | 2.29% | | 2.76% |
Portfolio turnover rate (c)
| 103% | | 101% | | 119% | | 112% | | 116% |
| (a) | Total return is calculated assuming an initial investment made at the net asset value at the beginning of the period, reinvestment of all distributions at net asset value during the period, and redemption at net asset value on the last day of the period. The returns presented do not reflect the deduction of taxes that a shareholder would pay on Fund distributions or the redemption or sale of Fund shares. Total return is calculated for the time period presented and is not annualized for periods of less than a year. |
| (b) | Includes foreign capital gains tax. If this tax expense was not included, the expense ratio would have been 0.80%. |
| (c) | Portfolio turnover is calculated for the time period presented and is not annualized for periods of less than a year and does not include securities received or delivered from processing creations or redemptions and in-kind transactions. |
Page 132
See Notes to Financial Statements
First Trust Exchange-Traded AlphaDEX® Fund II
Financial Highlights (Continued)
For a share outstanding throughout each period
First Trust Germany AlphaDEX® Fund (FGM)
| | Year Ended December 31, |
| 2018 | | 2017 | | 2016 | | 2015 | | 2014 |
Net asset value, beginning of period
| $ 51.26 | | $ 36.47 | | $ 36.37 | | $ 36.07 | | $ 41.48 |
| Income from investment operations: | | | | | | | | | |
Net investment income (loss)
| 0.72 | | 1.00 | | 0.47 | | 0.35 | | 0.62 |
Net realized and unrealized gain (loss)
| (13.59) | | 14.87 | | 0.11 | | 0.36 | | (5.34) |
Total from investment operations
| (12.87) | | 15.87 | | 0.58 | | 0.71 | | (4.72) |
| Distributions paid to shareholders from: | | | | | | | | | |
Net investment income
| (0.82) | | (1.08) | | (0.46) | | (0.34) | | (0.69) |
Return of capital
| — | | — | | (0.02) | | (0.07) | | — |
Total distributions
| (0.82) | | (1.08) | | (0.48) | | (0.41) | | (0.69) |
Net asset value, end of period
| $37.57 | | $51.26 | | $36.47 | | $36.37 | | $36.07 |
Total return (a)
| (25.40)% | | 43.96% | | 1.67% | | 1.94% | | (11.60)% |
| Ratios to average net assets/supplemental data: | | | | | | | | | |
Net assets, end of period (in 000’s)
| $ 139,022 | | $ 258,845 | | $ 98,478 | | $ 189,111 | | $ 57,715 |
Ratio of total expenses to average net assets
| 0.80% | | 0.80% | | 0.80% | | 0.80% | | 0.80% |
Ratio of net investment income (loss) to average net assets
| 1.66% | | 2.38% | | 1.32% | | 1.34% | | 1.92% |
Portfolio turnover rate (b)
| 81% | | 82% | | 114% | | 90% | | 83% |
| (a) | Total return is calculated assuming an initial investment made at the net asset value at the beginning of the period, reinvestment of all distributions at net asset value during the period, and redemption at net asset value on the last day of the period. The returns presented do not reflect the deduction of taxes that a shareholder would pay on Fund distributions or the redemption or sale of Fund shares. Total return is calculated for the time period presented and is not annualized for periods of less than a year. |
| (b) | Portfolio turnover is calculated for the time period presented and is not annualized for periods of less than a year and does not include securities received or delivered from processing creations or redemptions and in-kind transactions. |
See Notes to Financial Statements
Page 133
First Trust Exchange-Traded AlphaDEX® Fund II
Financial Highlights (Continued)
For a share outstanding throughout each period
First Trust Canada AlphaDEX® Fund (FCAN)
| | Year Ended December 31, |
| 2018 | | 2017 | | 2016 | | 2015 | | 2014 |
Net asset value, beginning of period
| $ 26.48 | | $ 23.29 | | $ 21.51 | | $ 31.44 | | $ 36.11 |
| Income from investment operations: | | | | | | | | | |
Net investment income (loss)
| 0.24 | | 0.28 | | 0.22 | | 0.27 | | 0.75 |
Net realized and unrealized gain (loss)
| (6.01) | | 3.18 | | 1.70 | | (10.00) | | (4.62) |
Total from investment operations
| (5.77) | | 3.46 | | 1.92 | | (9.73) | | (3.87) |
| Distributions paid to shareholders from: | | | | | | | | | |
Net investment income
| (0.33) | | (0.27) | | (0.14) | | (0.20) | | (0.80) |
Net asset value, end of period
| $20.38 | | $26.48 | | $23.29 | | $21.51 | | $31.44 |
Total return (a)
| (21.94)% | | 15.03% | | 8.94% | | (30.98)% | | (10.86)% |
| Ratios to average net assets/supplemental data: | | | | | | | | | |
Net assets, end of period (in 000’s)
| $ 7,132 | | $ 6,621 | | $ 6,987 | | $ 6,452 | | $ 34,579 |
Ratio of total expenses to average net assets
| 0.80% | | 0.80% | | 0.80% | | 0.80% | | 0.80% |
Ratio of net investment income (loss) to average net assets
| 1.17% | | 1.12% | | 0.98% | | 1.32% | | 1.44% |
Portfolio turnover rate (b)
| 88% | | 85% | | 114% | | 166% | | 103% |
| (a) | Total return is calculated assuming an initial investment made at the net asset value at the beginning of the period, reinvestment of all distributions at net asset value during the period, and redemption at net asset value on the last day of the period. The returns presented do not reflect the deduction of taxes that a shareholder would pay on Fund distributions or the redemption or sale of Fund shares. Total return is calculated for the time period presented and is not annualized for periods of less than a year. |
| (b) | Portfolio turnover is calculated for the time period presented and is not annualized for periods of less than a year and does not include securities received or delivered from processing creations or redemptions and in-kind transactions. |
Page 134
See Notes to Financial Statements
First Trust Exchange-Traded AlphaDEX® Fund II
Financial Highlights (Continued)
For a share outstanding throughout each period
First Trust Australia AlphaDEX® Fund (FAUS)
| | Year Ended December 31, |
| 2018 | | 2017 | | 2016 | | 2015 | | 2014 |
Net asset value, beginning of period
| $ 33.67 | | $ 28.55 | | $ 27.10 | | $ 28.97 | | $ 29.99 |
| Income from investment operations: | | | | | | | | | |
Net investment income (loss)
| 0.93 | | 1.06 | | 0.70 | | 0.98 | | 1.16 |
Net realized and unrealized gain (loss)
| (6.03) | | 5.67 | | 2.77 | | (2.05) | | (0.67) |
Total from investment operations
| (5.10) | | 6.73 | | 3.47 | | (1.07) | | 0.49 |
| Distributions paid to shareholders from: | | | | | | | | | |
Net investment income
| (1.00) | | (1.61) | | (2.02) | | (0.80) | | (1.51) |
Net asset value, end of period
| $27.57 | | $33.67 | | $28.55 | | $27.10 | | $28.97 |
Total return (a)
| (15.48)% | | 23.87% | | 12.80% | | (3.68)% | | 1.47% |
| Ratios to average net assets/supplemental data: | | | | | | | | | |
Net assets, end of period (in 000’s)
| $ 1,378 | | $ 1,684 | | $ 1,427 | | $ 2,710 | | $ 1,449 |
Ratio of total expenses to average net assets
| 0.80% | | 0.80% | | 0.81% (b) | | 0.80% | | 0.80% |
Ratio of net investment income (loss) to average net assets
| 2.89% | | 3.33% | | 2.50% | | 3.64% | | 3.65% |
Portfolio turnover rate (c)
| 80% | | 75% | | 92% | | 101% | | 99% |
| (a) | Total return is calculated assuming an initial investment made at the net asset value at the beginning of the period, reinvestment of all distributions at net asset value during the period, and redemption at net asset value on the last day of the period. The returns presented do not reflect the deduction of taxes that a shareholder would pay on Fund distributions or the redemption or sale of Fund shares. Total return is calculated for the time period presented and is not annualized for periods of less than a year. |
| (b) | Includes excise tax. If this excise tax was not included, the expense ratio would have been 0.80%. |
| (c) | Portfolio turnover is calculated for the time period presented and is not annualized for periods of less than a year and does not include securities received or delivered from processing creations or redemptions and in-kind transactions. |
See Notes to Financial Statements
Page 135
First Trust Exchange-Traded AlphaDEX® Fund II
Financial Highlights (Continued)
For a share outstanding throughout each period
First Trust United Kingdom AlphaDEX® Fund (FKU)
| | Year Ended December 31, |
| 2018 | | 2017 | | 2016 | | 2015 | | 2014 |
Net asset value, beginning of period
| $ 39.97 | | $ 32.85 | | $ 40.12 | | $ 39.29 | | $ 42.46 |
| Income from investment operations: | | | | | | | | | |
Net investment income (loss)
| 1.13 | | 1.15 | | 1.01 | | 1.04 | | 1.20 |
Net realized and unrealized gain (loss)
| (7.35) | | 7.14 | | (7.43) | | 0.85 | | (3.08) |
Total from investment operations
| (6.22) | | 8.29 | | (6.42) | | 1.89 | | (1.88) |
| Distributions paid to shareholders from: | | | | | | | | | |
Net investment income
| (1.64) | | (1.17) | | (0.85) | | (1.06) | | (1.29) |
Net asset value, end of period
| $32.11 | | $39.97 | | $32.85 | | $40.12 | | $39.29 |
Total return (a)
| (16.16)% | | 25.53% | | (16.08)% | | 4.75% | | (4.53)% |
| Ratios to average net assets/supplemental data: | | | | | | | | | |
Net assets, end of period (in 000’s)
| $ 9,632 | | $ 17,986 | | $ 27,926 | | $ 210,651 | | $ 64,830 |
Ratio of total expenses to average net assets
| 0.80% | | 0.80% | | 0.80% | | 0.80% | | 0.80% |
Ratio of net investment income (loss) to average net assets
| 2.81% | | 2.87% | | 2.47% | | 2.97% | | 2.67% |
Portfolio turnover rate (b)
| 107% | | 98% | | 109% | | 91% | | 67% |
| (a) | Total return is calculated assuming an initial investment made at the net asset value at the beginning of the period, reinvestment of all distributions at net asset value during the period, and redemption at net asset value on the last day of the period. The returns presented do not reflect the deduction of taxes that a shareholder would pay on Fund distributions or the redemption or sale of Fund shares. Total return is calculated for the time period presented and is not annualized for periods of less than a year. |
| (b) | Portfolio turnover is calculated for the time period presented and is not annualized for periods of less than a year and does not include securities received or delivered from processing creations or redemptions and in-kind transactions. |
Page 136
See Notes to Financial Statements
First Trust Exchange-Traded AlphaDEX® Fund II
Financial Highlights (Continued)
For a share outstanding throughout each period
First Trust India NIFTY 50 Equal Weight ETF (NFTY)
| | Year Ended December 31, |
| 2018 | | 2017 | | 2016 | | 2015 | | 2014 |
Net asset value, beginning of period
| $ 36.33 | | $ 30.87 | | $ 28.85 | | $ 36.44 | | $ 31.82 |
| Income from investment operations: | | | | | | | | | |
Net investment income (loss)
| 0.23 | | 0.87 | | 0.93 | | 1.13 | | 0.08 |
Net realized and unrealized gain (loss)
| (1.21) | | 6.06 | | 2.10 | | (7.47) | | 4.73 |
Total from investment operations
| (0.98) | | 6.93 | | 3.03 | | (6.34) | | 4.81 |
| Distributions paid to shareholders from: | | | | | | | | | |
Net investment income
| — | | (1.47) | | (0.76) | | (1.15) | | (0.03) |
Return of capital
| — | | — | | (0.25) | | (0.10) | | (0.16) |
Total distributions
| — | | (1.47) | | (1.01) | | (1.25) | | (0.19) |
Net asset value, end of period
| $35.35 | | $36.33 | | $30.87 | | $28.85 | | $36.44 |
Total return (a)
| (2.67)% (b) | | 22.54% | | 10.31% | | (17.56)% | | 15.13% |
| Ratios to average net assets/supplemental data: | | | | | | | | | |
Net assets, end of period (in 000’s)
| $ 3,535 | | $ 3,633 | | $ 3,087 | | $ 5,771 | | $ 27,327 |
Ratio of total expenses to average net assets
| 0.80% | | 0.80% | | 0.80% | | 0.80% | | 0.80% |
Ratio of net investment income (loss) to average net assets
| 0.77% | | 2.45% | | 2.17% | | 1.59% | | 0.55% |
Portfolio turnover rate (c)
| 156% (d) | | 64% | | 76% | | 133% | | 26% |
| (a) | Total return is calculated assuming an initial investment made at the net asset value at the beginning of the period, reinvestment of all distributions at net asset value during the period, and redemption at net asset value on the last day of the period. The returns presented do not reflect the deduction of taxes that a shareholder would pay on Fund distributions or the redemption or sale of Fund shares. Total return is calculated for the time period presented and is not annualized for periods of less than a year. |
| (b) | The Fund received a reimbursement from the advisor in the amount of $14,188, which represents $0.14 per share. Since the advisor reimbursed the Fund, there was no effect on the Fund’s total return. |
| (c) | Portfolio turnover is calculated for the time period presented and is not annualized for periods of less than a year and does not include securities received or delivered from processing creations or redemptions and in-kind transactions. |
| (d) | The variation in the portfolio turnover rate is due to the change in the Fund’s underlying index effective April 17, 2018 which resulted in a complete rebalance of the Fund’s portfolio. |
See Notes to Financial Statements
Page 137
First Trust Exchange-Traded AlphaDEX® Fund II
Financial Highlights (Continued)
For a share outstanding throughout each period
First Trust Hong Kong AlphaDEX® Fund (FHK)
| | Year Ended December 31, |
| 2018 | | 2017 | | 2016 | | 2015 | | 2014 |
Net asset value, beginning of period
| $ 42.70 | | $ 32.53 | | $ 33.72 | | $ 38.29 | | $ 38.60 |
| Income from investment operations: | | | | | | | | | |
Net investment income (loss)
| 1.03 | | 2.41 | | 1.33 | | 0.78 | | 1.20 |
Net realized and unrealized gain (loss)
| (8.58) | | 10.59 | | (1.17) | | (4.35) | | (0.58) |
Total from investment operations
| (7.55) | | 13.00 | | 0.16 | | (3.57) | | 0.62 |
| Distributions paid to shareholders from: | | | | | | | | | |
Net investment income
| (0.99) | | (2.83) | | (1.35) | | (1.00) | | (0.93) |
Net asset value, end of period
| $34.16 | | $42.70 | | $32.53 | | $33.72 | | $38.29 |
Total return (a)
| (17.84)% | | 40.31% | | 0.54% | | (9.51)% | | 1.63% |
| Ratios to average net assets/supplemental data: | | | | | | | | | |
Net assets, end of period (in 000’s)
| $ 3,416 | | $ 6,406 | | $ 8,133 | | $ 141,620 | | $ 40,204 |
Ratio of total expenses to average net assets
| 0.80% | | 0.80% | | 0.81% (b) | | 0.81% (b) | | 0.80% |
Ratio of net investment income (loss) to average net assets
| 2.92% | | 4.83% | | 0.98% | | 2.82% | | 5.30% |
Portfolio turnover rate (c)
| 66% | | 76% | | 257% | | 106% | | 43% |
| (a) | Total return is calculated assuming an initial investment made at the net asset value at the beginning of the period, reinvestment of all distributions at net asset value during the period, and redemption at net asset value on the last day of the period. The returns presented do not reflect the deduction of taxes that a shareholder would pay on Fund distributions or the redemption or sale of Fund shares. Total return is calculated for the time period presented and is not annualized for periods of less than a year. |
| (b) | Includes excise tax. If this excise tax was not included, the expense ratio would have been 0.80%. |
| (c) | Portfolio turnover is calculated for the time period presented and is not annualized for periods of less than a year and does not include securities received or delivered from processing creations or redemptions and in-kind transactions. |
Page 138
See Notes to Financial Statements
First Trust Exchange-Traded AlphaDEX® Fund II
Financial Highlights (Continued)
For a share outstanding throughout each period
First Trust Switzerland AlphaDEX® Fund (FSZ)
| | Year Ended December 31, |
| 2018 | | 2017 | | 2016 | | 2015 | | 2014 |
Net asset value, beginning of period
| $ 52.73 | | $ 40.82 | | $ 39.97 | | $ 38.09 | | $ 40.79 |
| Income from investment operations: | | | | | | | | | |
Net investment income (loss)
| 0.82 | | 0.66 | | 0.75 | | 0.44 | | 0.56 |
Net realized and unrealized gain (loss)
| (8.66) | | 12.03 | | 0.89 | | 1.87 | | (2.54) |
Total from investment operations
| (7.84) | | 12.69 | | 1.64 | | 2.31 | | (1.98) |
| Distributions paid to shareholders from: | | | | | | | | | |
Net investment income
| (0.84) | | (0.78) | | (0.74) | | (0.43) | | (0.48) |
Return of capital
| (0.16) | | — | | (0.05) | | — | | (0.24) |
Total distributions
| (1.00) | | (0.78) | | (0.79) | | (0.43) | | (0.72) |
Net asset value, end of period (a)
| $43.89 | | $52.73 | | $40.82 | | $39.97 | | $38.09 |
Total return
| (15.11)% | | 31.26% | | 4.21% | | 6.06% | | (5.06)% |
| Ratios to average net assets/supplemental data: | | | | | | | | | |
Net assets, end of period (in 000’s)
| $ 151,409 | | $ 237,288 | | $ 104,080 | | $ 191,851 | | $ 53,332 |
Ratio of total expenses to average net assets
| 0.80% | | 0.80% | | 0.80% | | 0.80% | | 0.80% |
Ratio of net investment income (loss) to average net assets
| 1.79% | | 1.43% | | 1.91% | | 1.82% | | 0.86% |
Portfolio turnover rate (b)
| 65% | | 50% | | 92% | | 82% | | 72% |
| (a) | Total return is calculated assuming an initial investment made at the net asset value at the beginning of the period, reinvestment of all distributions at net asset value during the period, and redemption at net asset value on the last day of the period. The returns presented do not reflect the deduction of taxes that a shareholder would pay on Fund distributions or the redemption or sale of Fund shares. Total return is calculated for the time period presented and is not annualized for periods of less than a year. |
| (b) | Portfolio turnover is calculated for the time period presented and is not annualized for periods of less than a year and does not include securities received or delivered from processing creations or redemptions and in-kind transactions. |
See Notes to Financial Statements
Page 139
First Trust Exchange-Traded AlphaDEX® Fund II
Financial Highlights (Continued)
For a share outstanding throughout each period
First Trust Developed Markets ex-US Small Cap AlphaDEX® Fund (FDTS)
| | Year Ended December 31, |
| 2018 | | 2017 | | 2016 | | 2015 | | 2014 |
Net asset value, beginning of period
| $ 44.89 | | $ 33.70 | | $ 33.32 | | $ 32.07 | | $ 36.63 |
| Income from investment operations: | | | | | | | | | |
Net investment income (loss)
| 0.58 | | 0.71 | | 0.50 | | 0.45 | | 0.57 |
Net realized and unrealized gain (loss)
| (11.28) | | 11.41 | | 0.47 | | 1.37 | | (4.30) |
Total from investment operations
| (10.70) | | 12.12 | | 0.97 | | 1.82 | | (3.73) |
| Distributions paid to shareholders from: | | | | | | | | | |
Net investment income
| (0.62) | | (0.93) | | (0.59) | | (0.57) | | (0.83) |
Return of capital
| (0.03) | | — | | — | | — | | — |
Total distributions
| (0.65) | | (0.93) | | — | | — | | — |
Net asset value, end of period
| $33.54 | | $44.89 | | $33.70 | | $33.32 | | $32.07 |
Total return (a)
| (24.03)% | | 36.23% | | 2.96% | | 5.65% | | (10.36)% |
| Ratios to average net assets/supplemental data: | | | | | | | | | |
Net assets, end of period (in 000’s)
| $ 10,063 | | $ 8,977 | | $ 6,741 | | $ 6,665 | | $ 6,414 |
Ratio of total expenses to average net assets
| 0.80% | | 0.80% | | 0.80% | | 0.80% | | 0.80% |
Ratio of net investment income (loss) to average net assets
| 1.30% | | 1.80% | | 1.53% | | 1.31% | | 1.54% |
Portfolio turnover rate (b)
| 142% | | 111% | | 127% | | 137% | | 137% |
| (a) | Total return is calculated assuming an initial investment made at the net asset value at the beginning of the period, reinvestment of all distributions at net asset value during the period, and redemption at net asset value on the last day of the period. The returns presented do not reflect the deduction of taxes that a shareholder would pay on Fund distributions or the redemption or sale of Fund shares. Total return is calculated for the time period presented and is not annualized for periods of less than a year. |
| (b) | Portfolio turnover is calculated for the time period presented and is not annualized for periods of less than a year and does not include securities received or delivered from processing creations or redemptions and in-kind transactions. |
Page 140
See Notes to Financial Statements
First Trust Exchange-Traded AlphaDEX® Fund II
Financial Highlights (Continued)
For a share outstanding throughout each period
First Trust Emerging Markets Small Cap AlphaDEX® Fund (FEMS)
| | Year Ended December 31, |
| 2018 | | 2017 | | 2016 | | 2015 | | 2014 |
Net asset value, beginning of period
| $ 43.02 | | $ 30.42 | | $ 27.43 | | $ 32.64 | | $ 35.44 |
| Income from investment operations: | | | | | | | | | |
Net investment income (loss)
| 1.19 | | 1.11 | | 0.64 | | 0.71 | | 0.62 |
Net realized and unrealized gain (loss)
| (10.26) | | 12.96 | | 3.08 | | (5.03) | | (2.29) |
Total from investment operations
| (9.07) | | 14.07 | | 3.72 | | (4.32) | | (1.67) |
| Distributions paid to shareholders from: | | | | | | | | | |
Net investment income
| (1.44) | | (1.26) | | (0.73) | | (0.80) | | (1.08) |
Net realized gain
| (0.07) | | (0.21) | | — | | — | | — |
Return of capital
| — | | — | | — | | (0.09) | | (0.05) |
Total distributions
| (1.51) | | (1.47) | | (0.73) | | (0.89) | | (1.13) |
Net asset value, end of period
| $32.44 | | $43.02 | | $30.42 | | $27.43 | | $32.64 |
Total return (a)
| (21.42)% | | 46.57% | | 13.53% (a) | | (13.39)% | | (4.89)% |
| Ratios to average net assets/supplemental data: | | | | | | | | | |
Net assets, end of period (in 000’s)
| $ 157,326 | | $ 271,055 | | $94,306 (b) | | $ 24,684 | | $ 40,799 |
Ratio of total expenses to average net assets
| 0.80% | | 0.80% | | 0.93% (c) | | 0.80% | | 0.80% |
Ratio of net investment income (loss) to average net assets
| 3.02% | | 3.26% | | 2.39% | | 2.53% | | 2.11% |
Portfolio turnover rate (d)
| 126% | | 113% | | 121% | | 151% | | 174% |
| (a) | Total return is calculated assuming an initial investment made at the net asset value at the beginning of the period, reinvestment of all distributions at net asset value during the period, and redemption at net asset value on the last day of the period. The returns presented do not reflect the deduction of taxes that a shareholder would pay on Fund distributions or the redemption or sale of Fund shares. Total return is calculated for the time period presented and is not annualized for periods of less than a year. |
| (b) | The Fund received a reimbursement from the advisor in the amount of $2,732, which represents less than $0.01 per share. Since the advisor reimbursed the Fund, there was no effect on the Fund’s total return. |
| (c) | Ratio reflects foreign capital gain tax expense of 0.14% which is not covered under the annual unitary management fee. |
| (d) | Portfolio turnover is calculated for the time period presented and is not annualized for periods of less than a year and does not include securities received or delivered from processing creations or redemptions and in-kind transactions. |
See Notes to Financial Statements
Page 141
First Trust Exchange-Traded AlphaDEX® Fund II
Financial Highlights (Continued)
For a share outstanding throughout each period
First Trust Eurozone AlphaDEX® ETF (FEUZ)
| | Year Ended December 31, | | Period
Ended
12/31/2014 (a) |
| 2018 | | 2017 | | 2016 | | 2015 | |
Net asset value, beginning of period
| $ 43.81 | | $ 32.64 | | $ 31.66 | | $ 30.89 | | $ 30.55 |
| Income from investment operations: | | | | | | | | | |
Net investment income (loss)
| 0.80 | | 0.47 | | 0.50 | | 0.34 | | 0.01 |
Net realized and unrealized gain (loss)
| (9.34) | | 11.26 | | 1.17 | | 0.77 | | 0.34 |
Total from investment operations
| (8.54) | | 11.73 | | 1.67 | | 1.11 | | 0.35 |
| Distributions paid to shareholders from: | | | | | | | | | |
Net investment income
| (0.84) | | (0.56) | | (0.69) | | (0.23) | | (0.01) |
Return of capital
| — | | — | | — | | (0.11) | | — |
Total distributions
| (0.84) | | (0.56) | | (0.69) | | (0.34) | | (0.01) |
Net asset value, end of period
| $34.43 | | $43.81 | | $32.64 | | $31.66 | | $30.89 |
Total return (b)
| (19.82)% | | 36.19% | | 5.49% | | 3.54% | | 1.14% |
| Ratios to average net assets/supplemental data: | | | | | | | | | |
Net assets, end of period (in 000’s)
| $ 49,925 | | $ 39,425 | | $ 6,529 | | $ 11,080 | | $ 338,213 |
Ratio of total expenses to average net assets
| 0.80% | | 0.80% | | 0.80% | | 0.80% | | 0.80% (c) |
Ratio of net investment income (loss) to average net assets
| 2.10% | | 0.96% | | 1.70% | | 0.30% | | 0.08% (c) |
Portfolio turnover rate (d)
| 90% | | 77% | | 98% | | 21% | | 2% |
| (a) | Inception date is October 21, 2014, which is consistent with the commencement of investment operations and is the date the initial creation units were established. |
| (b) | Total return is calculated assuming an initial investment made at the net asset value at the beginning of the period, reinvestment of all distributions at net asset value during the period, and redemption at net asset value on the last day of the period. The returns presented do not reflect the deduction of taxes that a shareholder would pay on Fund distributions or the redemption or sale of Fund shares. Total return is calculated for the time period presented and is not annualized for periods of less than a year. |
| (c) | Annualized. |
| (d) | Portfolio turnover is calculated for the time period presented and is not annualized for periods of less than a year and does not include securities received or delivered from processing creations or redemptions and in-kind transactions. |
Page 142
See Notes to Financial Statements
Notes to Financial Statements
First Trust Exchange-Traded AlphaDEX® Fund II
December 31, 2018
1. Organization
First Trust Exchange-Traded AlphaDEX® Fund II (the “Trust”) is an open-end management investment company organized as a Massachusetts business trust on December 3, 2010, and is registered with the Securities and Exchange Commission (“SEC”) under the Investment Company Act of 1940, as amended (the “1940 Act”).
The Trust currently consists of the following nineteen funds (each a “Fund” and collectively, the “Funds”), including the exchange on which they are listed and traded:
First Trust Asia Pacific ex-Japan AlphaDEX® Fund – (The Nasdaq Stock Market LLC (“Nasdaq”) ticker “FPA”)
First Trust Europe AlphaDEX® Fund – (Nasdaq ticker “FEP”)
First Trust Latin America AlphaDEX® Fund – (Nasdaq ticker “FLN”)
First Trust Brazil AlphaDEX® Fund – (Nasdaq ticker “FBZ”)
First Trust China AlphaDEX® Fund – (Nasdaq ticker “FCA”)
First Trust Japan AlphaDEX® Fund – (Nasdaq ticker “FJP”)
First Trust South Korea AlphaDEX® Fund – (Nasdaq ticker “FKO”)
First Trust Developed Markets ex-US AlphaDEX® Fund – (Nasdaq ticker “FDT”)
First Trust Emerging Markets AlphaDEX® Fund – (Nasdaq ticker “FEM”)
First Trust Germany AlphaDEX® Fund – (Nasdaq ticker “FGM”)
First Trust Canada AlphaDEX® Fund – (Nasdaq ticker “FCAN”)
First Trust Australia AlphaDEX® Fund – (NYSE Arca, Inc. (“NYSE Arca”) ticker “FAUS”)
First Trust United Kingdom AlphaDEX® Fund – (Nasdaq ticker “FKU”)
First Trust India NIFTY 50 Equal Weight ETF – (Nasdaq ticker “NFTY”)(1)
First Trust Hong Kong AlphaDEX® Fund – (Nasdaq ticker “FHK”)
First Trust Switzerland AlphaDEX® Fund – (Nasdaq ticker “FSZ”)
First Trust Developed Markets ex-US Small Cap AlphaDEX® Fund – (Nasdaq ticker “FDTS”)
First Trust Emerging Markets Small Cap AlphaDEX® Fund – (Nasdaq ticker “FEMS”)
First Trust Eurozone AlphaDEX® ETF – (Nasdaq ticker “FEUZ”)
| (1) | Effective on April 17, 2018, First Trust Taiwan AlphaDEX® Fund (Nasdaq ticker “FTW”) changed its name and ticker symbol to First Trust India NIFTY 50 Equal Weight ETF (Nasdaq ticker “NFTY”). |
Each Fund represents a separate series of beneficial interest in the Trust. Unlike conventional mutual funds, each Fund issues and redeems shares on a continuous basis, at net asset value (“NAV”), only in large specified blocks consisting of 50,000 shares called a “Creation Unit.” Creation Units are issued and redeemed in-kind for securities in which a Fund invests and/or cash. Except when aggregated in Creation Units, each Fund’s shares are not redeemable securities. The investment objective of each Fund is to seek investment results that correspond generally to the price and yield (before the Fund’s fees and expenses) of the following indices:
| Fund | Index |
| First Trust Asia Pacific ex-Japan AlphaDEX® Fund | NASDAQ AlphaDEX® Asia Pacific Ex-Japan Index |
| First Trust Europe AlphaDEX® Fund | NASDAQ AlphaDEX® Europe Index |
| First Trust Latin America AlphaDEX® Fund | NASDAQ AlphaDEX® Latin America Index |
| First Trust Brazil AlphaDEX® Fund | NASDAQ AlphaDEX® Brazil Index |
| First Trust China AlphaDEX® Fund | NASDAQ AlphaDEX® China Index |
| First Trust Japan AlphaDEX® Fund | NASDAQ AlphaDEX® Japan Index |
| First Trust South Korea AlphaDEX® Fund | NASDAQ AlphaDEX® South Korea Index |
| First Trust Developed Markets ex-US AlphaDEX® Fund | NASDAQ AlphaDEX® Developed Markets Ex-US Index |
| First Trust Emerging Markets AlphaDEX® Fund | NASDAQ AlphaDEX® Emerging Markets Index |
| First Trust Germany AlphaDEX® Fund | NASDAQ AlphaDEX® Germany Index |
| First Trust Canada AlphaDEX® Fund | NASDAQ AlphaDEX® Canada Index |
| First Trust Australia AlphaDEX® Fund | NASDAQ AlphaDEX® Australia Index |
| First Trust United Kingdom AlphaDEX® Fund | NASDAQ AlphaDEX® United Kingdom Index |
| First Trust India NIFTY 50 Equal Weight ETF | NIFTY 50 Equal Weight Index(2) |
| First Trust Hong Kong AlphaDEX® Fund | NASDAQ AlphaDEX® Hong Kong Index |
| First Trust Switzerland AlphaDEX® Fund | NASDAQ AlphaDEX® Switzerland Index |
| First Trust Developed Markets ex-US Small Cap AlphaDEX® Fund | NASDAQ AlphaDEX® Developed Markets Ex-US Small Cap Index |
| First Trust Emerging Markets Small Cap AlphaDEX® Fund | NASDAQ AlphaDEX® Emerging Markets Small Cap Index |
| First Trust Eurozone AlphaDEX® ETF | NASDAQ AlphaDEX® Eurozone Index |
| (2) | Effective on April 17, 2018, First Trust India NIFTY 50 Equal Weight ETF’s underlying index was changed from the NASDAQ AlphaDEX® Taiwan Index to the NIFTY 50 Equal Weight Index. |
Notes to Financial Statements (Continued)
First Trust Exchange-Traded AlphaDEX® Fund II
December 31, 2018
2. Significant Accounting Policies
The Funds are each considered an investment company and follow accounting and reporting guidance under Financial Accounting Standards Board (“FASB”) Accounting Standards Codification (“ASC”) Topic 946, “Financial Services-Investment Companies.” The following is a summary of significant accounting policies consistently followed by the Funds in the preparation of the financial statements. The preparation of the financial statements in accordance with accounting principles generally accepted in the United States of America (“U.S. GAAP”) requires management to make estimates and assumptions that affect the reported amounts and disclosures in the financial statements. Actual results could differ from those estimates.
A. Portfolio Valuation
Each Fund’s NAV is determined daily as of the close of regular trading on the New York Stock Exchange (“NYSE”), normally 4:00 p.m. Eastern time, on each day the NYSE is open for trading. If the NYSE closes early on a valuation day, the NAV is determined as of that time. Foreign securities are priced using data reflecting the earlier closing of the principal markets for those securities. Each Fund’s NAV is calculated by dividing the value of all assets of each Fund (including accrued interest and dividends), less all liabilities (including accrued expenses and dividends declared but unpaid), by the total number of shares outstanding.
Each Fund’s investments are valued daily at market value or, in the absence of market value with respect to any portfolio securities, at fair value. Market value prices represent last sale or official closing prices from a national or foreign exchange (i.e., a regulated market) and are primarily obtained from third-party pricing services. Fair value prices represent any prices not considered market value prices and are either obtained from a third-party pricing service or are determined by the Pricing Committee of the Funds’ investment advisor, First Trust Advisors L.P. (“First Trust” or the “Advisor”), in accordance with valuation procedures adopted by the Trust’s Board of Trustees, and in accordance with provisions of the 1940 Act. Investments valued by the Advisor’s Pricing Committee, if any, are footnoted as such in the footnotes to the Portfolio of Investments. Each Fund’s investments are valued as follows:
Common stocks, real estate investment trusts (“REITs”), and other equity securities listed on any national or foreign exchange (excluding Nasdaq and the London Stock Exchange Alternative Investment Market (“AIM”)) are valued at the last sale price on the exchange on which they are principally traded or, for Nasdaq and AIM securities, the official closing price. Securities traded on more than one securities exchange are valued at the last sale price or official closing price, as applicable, at the close of the securities exchange representing the principal market for such securities.
Shares of open-end funds are valued at fair value which is based on NAV per share.
Securities traded in an over-the-counter market are fair valued at the mean of their most recent bid and asked price, if available, and otherwise at their closing bid price.
Overnight repurchase agreements are valued at amortized cost when it represents the best estimate of fair value.
Certain securities may not be able to be priced by pre-established pricing methods. Such securities may be valued by the Trust’s Board of Trustees or its delegate, the Advisor’s Pricing Committee, at fair value. These securities generally include, but are not limited to, restricted securities (securities which may not be publicly sold without registration under the Securities Act of 1933, as amended) for which a third-party pricing service is unable to provide a market price; securities whose trading has been formally suspended; a security whose market or fair value price is not available from a pre-established pricing source; a security with respect to which an event has occurred that is likely to materially affect the value of the security after the market has closed but before the calculation of a Fund’s NAV or make it difficult or impossible to obtain a reliable market quotation; and a security whose price, as provided by the third-party pricing service, does not reflect the security’s fair value. As a general principle, the current fair value of a security would appear to be the amount which the owner might reasonably expect to receive for the security upon its current sale. When fair value prices are used, generally they will differ from market quotations or official closing prices on the applicable exchanges. A variety of factors may be considered in determining the fair value of such securities, including, but not limited to, the following:
| 1) | the type of security; |
| 2) | the size of the holding; |
| 3) | the initial cost of the security; |
| 4) | transactions in comparable securities; |
| 5) | price quotes from dealers and/or third-party pricing services; |
| 6) | relationships among various securities; |
| 7) | information obtained by contacting the issuer, analysts, or the appropriate stock exchange; |
| 8) | an analysis of the issuer’s financial statements; and |
| 9) | the existence of merger proposals or tender offers that might affect the value of the security. |
Notes to Financial Statements (Continued)
First Trust Exchange-Traded AlphaDEX® Fund II
December 31, 2018
If the securities in question are foreign securities, the following additional information may be considered:
| 1) | the value of similar foreign securities traded on other foreign markets; |
| 2) | ADR trading of similar securities; |
| 3) | closed-end fund or exchange-traded fund trading of similar securities; |
| 4) | foreign currency exchange activity; |
| 5) | the trading prices of financial products that are tied to baskets of foreign securities; |
| 6) | factors relating to the event that precipitated the pricing problem; |
| 7) | whether the event is likely to recur; and |
| 8) | whether the effects of the event are isolated or whether they affect entire markets, countries or regions. |
In addition, differences between the prices used to calculate a Fund’s NAV and the prices used by such Fund’s corresponding index could result in a difference between a Fund’s performance and the performance of its underlying index.
Because foreign markets may be open on different days than the days during which investors may transact in the shares of a Fund, the value of the Fund’s securities may change on the days when investors are not able to transact in the shares of the Fund. The value of securities denominated in foreign currencies is converted into U.S. dollars using exchange rates determined daily as of the close of regular trading on the NYSE. Any use of a different rate from the rates used by a relevant index may adversely affect the Fund’s ability to track the index.
The Funds are subject to fair value accounting standards that define fair value, establish the framework for measuring fair value and provide a three-level hierarchy for fair valuation based upon the inputs to the valuation as of the measurement date. The three levels of the fair value hierarchy are as follows:
| • | Level 1 – Level 1 inputs are quoted prices in active markets for identical investments. An active market is a market in which transactions for the investment occur with sufficient frequency and volume to provide pricing information on an ongoing basis. |
| • | Level 2 – Level 2 inputs are observable inputs, either directly or indirectly, and include the following: |
| o | Quoted prices for similar investments in active markets. |
| o | Quoted prices for identical or similar investments in markets that are non-active. A non-active market is a market where there are few transactions for the investment, the prices are not current, or price quotations vary substantially either over time or among market makers, or in which little information is released publicly. |
| o | Inputs other than quoted prices that are observable for the investment (for example, interest rates and yield curves observable at commonly quoted intervals, volatilities, prepayment speeds, loss severities, credit risks, and default rates). |
| o | Inputs that are derived principally from or corroborated by observable market data by correlation or other means. |
| • | Level 3 – Level 3 inputs are unobservable inputs. Unobservable inputs may reflect the reporting entity’s own assumptions about the assumptions that market participants would use in pricing the investment. |
The inputs or methodologies used for valuing investments are not necessarily an indication of the risk associated with investing in those investments. A summary of the inputs used to value each Fund’s investments as of December 31, 2018, is included with each Fund’s Portfolio of Investments.
B. Securities Transactions and Investment Income
Securities transactions are recorded as of the trade date. Realized gains and losses from securities transactions are recorded on the identified cost basis. Dividend income is recorded on the ex-dividend date except that certain dividends from foreign securities are recorded as soon as the information becomes available after the ex-dividend date. Interest income, if any, is recorded on the accrual basis.
Withholding taxes and tax reclaims on foreign dividends have been provided for in accordance with each Fund’s understanding of the applicable country’s tax rules and rates.
Distributions received from a Fund’s investments in REITs may be comprised of return of capital, capital gains, and investment income. The actual character of the amounts received during the year are not known until after the REITs’ fiscal year end. A Fund records the character of distributions received from the REITs during the year based on estimates available. The characterization of distributions received by a Fund may be subsequently revised based on information received from the REITs after their tax reporting periods conclude.
Notes to Financial Statements (Continued)
First Trust Exchange-Traded AlphaDEX® Fund II
December 31, 2018
C. Foreign Currency
The books and records of the Funds are maintained in U.S. dollars. Foreign currencies, investments and other assets and liabilities are translated into U.S. dollars at the exchange rates prevailing at the end of the period. Purchases and sales of investments and items of income and expense are translated on the respective dates of such transactions. Unrealized gains and losses on assets and liabilities, other than investments in securities, which result from changes in foreign currency exchange rates have been included in “Net change in unrealized appreciation (depreciation) on foreign currency translation” on the Statements of Operations. Unrealized gains and losses on investments in securities which result from changes in foreign exchange rates are included with fluctuations arising from changes in market price and are included in “Net change in unrealized appreciation (depreciation) on investments” on the Statements of Operations. Net realized foreign currency gains and losses include the effect of changes in exchange rates between trade date and settlement date on investment security transactions, foreign currency transactions and interest and dividends received and are included in “Net realized gain (loss) on foreign currency transactions” on the Statements of Operations. The portion of foreign currency gains and losses related to fluctuations in exchange rates between the initial purchase settlement date and subsequent sale trade date is included in “Net realized gain (loss) on investments” on the Statements of Operations.
D. Securities Lending
The Funds may lend securities representing up to 33 1/3% of the value of their total assets to broker-dealers, banks and other institutions to generate additional income. When a Fund loans its portfolio securities, it will receive, at the inception of each loan, collateral equal to at least 102% (for domestic securities) or 105% (for international securities) of the market value of the loaned securities. The collateral amount is valued at the beginning of each business day and is compared to the market value of the loaned securities from the prior business day to determine if additional collateral is required. If additional collateral is required, a request is sent to the borrower. Securities lending involves the risk that the Fund may lose money because the borrower of the Fund’s loaned securities fails to return the securities in a timely manner or at all. The Fund could also lose money in the event of (i) a decline in the value of the collateral provided for the loaned securities, (ii) a decline in the value of any investments made with cash collateral or (iii) an increase in the value of the loaned securities if the borrower does not increase the collateral accordingly and the borrower fails to return the securities. These events could also trigger adverse tax consequences for the Fund.
Under the Funds’ Securities Lending Agency Agreement, the securities lending agent will generally bear the risk that a borrower may default on its obligation to return loaned securities. Brown Brothers Harriman & Co. (“BBH”) acts as the Funds’ securities lending agent and is responsible for executing the lending of the portfolio securities to creditworthy borrowers. The Funds, however, will be responsible for the risks associated with the investment of cash collateral. A Fund may lose money on its investment of cash collateral, which may affect its ability to repay the collateral to the borrower without the use of other Fund assets. Each Fund that engages in securities lending receives compensation (net of any rebate and securities lending agent fees) for lending its securities. Compensation can be in the form of fees received from the securities lending agent or dividends or interest earned from the investment of cash collateral. The fees received from the securities lending agent are accrued daily. The dividend and interest earned on the securities loaned is accounted for in the same manner as other dividend and interest income. At December 31, 2018, FJP, FDT, FEM, FHK, FEMS, and FEUZ had securities in the securities lending program. During the fiscal year ended December 31, 2018, FPA, FEP, FCA, FJP, FDT, FEM, FGM, FCAN, FHK, FEMS, and FEUZ participated in the securities lending program.
In the event of a default by a borrower with respect to any loan, BBH will exercise any and all remedies provided under the applicable borrower agreement to make the Funds whole. These remedies include purchasing replacement securities by applying the collateral held from the defaulting broker against the purchase cost of the replacement securities. If, despite such efforts by BBH to exercise these remedies, a Fund sustains losses as a result of a borrower’s default, BBH will indemnify the Fund by purchasing replacement securities at its own expense, or paying the Funds an amount equal to the market value of the replacement securities, subject to certain limitations which are set forth in detail in the Securities Lending Agency Agreement between the Trust on behalf of the Funds and BBH.
E. Repurchase Agreements
Repurchase agreements involve the purchase of securities subject to the seller’s agreement to repurchase the securities at a mutually agreed upon date and price, under the terms of a Master Repurchase Agreement (“MRA”). During the term of a repurchase agreement, the value of the underlying securities held as collateral on behalf of a Fund, including accrued interest, is required to exceed the value of the repurchase agreement, including accrued interest. The underlying securities for all repurchase agreements are held at the Funds’ custodian or designated sub-custodians under tri-party repurchase agreements.
MRAs govern transactions between a Fund and select counterparties. The MRAs maintain provisions for, among other things, initiation, income payments, events of default, and maintenance of collateral for repurchase agreements.
Repurchase agreements received for lending securities are collateralized by U.S. Treasury securities. The U.S. Treasury securities are held in a joint custody account at BBH on behalf of the Funds participating in the securities lending program. In the event the
Notes to Financial Statements (Continued)
First Trust Exchange-Traded AlphaDEX® Fund II
December 31, 2018
counterparty defaults on the repurchase agreement, the U.S. Treasury securities can either be maintained as part of a Fund’s portfolio or sold for cash. A Fund could suffer a loss to the extent that the proceeds from the sale of the underlying collateral held by the Fund are less than the repurchase price and the Fund’s costs associated with the delay and enforcement of the MRA.
While the Funds may invest in repurchase agreements, any repurchase agreements held by the Funds during the fiscal year ended December 31, 2018, were received as collateral for lending securities.
F. Dividends and Distributions to Shareholders
Dividends from net investment income, if any, are declared and paid quarterly by each Fund, or as the Board of Trustees may determine from time to time. Distributions of net realized capital gains earned by each Fund, if any, are distributed at least annually.
Distributions from income and capital gains are determined in accordance with federal income tax regulations, which may differ from U.S. GAAP. Certain capital accounts in the financial statements are periodically adjusted for permanent differences in order to reflect their tax character. These permanent differences are primarily due to the varying treatment of income and gain/loss on portfolio securities held by the Funds and have no impact on net assets or NAV per share. Temporary differences, which arise from recognizing certain items of income, expense and gain/loss in different periods for financial statement and tax purposes, will reverse at some time in the future.
The tax character of distributions paid by each Fund during the fiscal year ended December 31, 2018, was as follows:
| | Distributions
paid from
Ordinary
Income | | Distributions
paid from
Capital
Gains | | Distributions
paid from
Return of
Capital |
First Trust Asia Pacific ex-Japan AlphaDEX® Fund
| $ 1,047,602 | | $ — | | $ 101,870 |
First Trust Europe AlphaDEX® Fund
| 18,614,887 | | — | | — |
First Trust Latin America AlphaDEX® Fund
| 464,297 | | — | | 46,029 |
First Trust Brazil AlphaDEX® Fund
| 2,178,371 | | 1,200,492 | | — |
First Trust China AlphaDEX® Fund
| 251,046 | | — | | — |
First Trust Japan AlphaDEX® Fund
| 2,237,007 | | — | | — |
First Trust South Korea AlphaDEX® Fund
| 42,814 | | — | | 26,947 |
First Trust Developed Markets ex-US AlphaDEX® Fund
| 20,849,188 | | — | | 817,374 |
First Trust Emerging Markets AlphaDEX® Fund
| 17,760,227 | | — | | — |
First Trust Germany AlphaDEX® Fund
| 4,271,617 | | — | | — |
First Trust Canada AlphaDEX® Fund
| 147,686 | | — | | — |
First Trust Australia AlphaDEX® Fund
| 49,972 | | — | | — |
First Trust United Kingdom AlphaDEX® Fund
| 557,843 | | — | | — |
First Trust India NIFTY 50 Equal Weight ETF
| — | | — | | — |
First Trust Hong Kong AlphaDEX® Fund
| 98,852 | | — | | — |
First Trust Switzerland AlphaDEX® Fund
| 4,115,398 | | — | | 795,384 |
First Trust Developed Markets ex-US Small Cap AlphaDEX® Fund
| 207,752 | | — | | 10,134 |
First Trust Emerging Markets Small Cap AlphaDEX® Fund
| 9,374,796 | | 218,247 | | — |
First Trust Eurozone AlphaDEX® ETF
| 1,614,237 | | — | | — |
Notes to Financial Statements (Continued)
First Trust Exchange-Traded AlphaDEX® Fund II
December 31, 2018
The tax character of distributions paid by each Fund during the fiscal year ended December 31, 2017, was as follows:
| | Distributions
paid from
Ordinary
Income | | Distributions
paid from
Capital
Gains | | Distributions
paid from
Return of
Capital |
First Trust Asia Pacific ex-Japan AlphaDEX® Fund
| $ 1,716,347 | | $ — | | $ — |
First Trust Europe AlphaDEX® Fund
| 9,061,721 | | — | | — |
First Trust Latin America AlphaDEX® Fund
| 2,920,964 | | — | | — |
First Trust Brazil AlphaDEX® Fund
| 2,543,969 | | — | | — |
First Trust China AlphaDEX® Fund
| 177,821 | | — | | — |
First Trust Japan AlphaDEX® Fund
| 1,002,182 | | — | | — |
First Trust South Korea AlphaDEX® Fund
| 22,080 | | — | | — |
First Trust Developed Markets ex-US AlphaDEX® Fund
| 10,575,893 | | — | | — |
First Trust Emerging Markets AlphaDEX® Fund
| 9,394,816 | | — | | — |
First Trust Germany AlphaDEX® Fund
| 4,674,742 | | — | | — |
First Trust Canada AlphaDEX® Fund
| 112,596 | | — | | — |
First Trust Australia AlphaDEX® Fund
| 80,283 | | — | | — |
First Trust United Kingdom AlphaDEX® Fund
| 788,507 | | — | | — |
First Trust India NIFTY 50 Equal Weight ETF
| 146,993 | | — | | — |
First Trust Hong Kong AlphaDEX® Fund
| 469,086 | | — | | — |
First Trust Switzerland AlphaDEX® Fund
| 3,096,407 | | — | | — |
First Trust Developed Markets ex-US Small Cap AlphaDEX® Fund
| 185,062 | | — | | — |
First Trust Emerging Markets Small Cap AlphaDEX® Fund
| 8,143,233 | | 717,570 | | — |
First Trust Eurozone AlphaDEX® ETF
| 168,471 | | — | | — |
As of December 31, 2018, the components of distributable earnings on a tax basis for each Fund were as follows:
| | Undistributed
Ordinary
Income | | Accumulated
Capital and
Other
Gain (Loss) | | Net
Unrealized
Appreciation
(Depreciation) |
First Trust Asia Pacific ex-Japan AlphaDEX® Fund
| $ — | | $ (10,068,249) | | $ (2,064,696) |
First Trust Europe AlphaDEX® Fund
| — | | (126,223,917) | | (77,463,232) |
First Trust Latin America AlphaDEX® Fund
| — | | (6,114,908) | | (782,404) |
First Trust Brazil AlphaDEX® Fund
| 76,444 | | — | | (1,738,323) |
First Trust China AlphaDEX® Fund
| 862 | | (5,192,806) | | (1,571,133) |
First Trust Japan AlphaDEX® Fund
| — | | (29,040,702) | | (22,951,546) |
First Trust South Korea AlphaDEX® Fund
| — | | (2,149,384) | | 15,013 |
First Trust Developed Markets ex-US AlphaDEX® Fund
| — | | (103,321,781) | | (139,409,376) |
First Trust Emerging Markets AlphaDEX® Fund
| 98,887 | | (121,484,392) | | (30,011,890) |
First Trust Germany AlphaDEX® Fund
| — | | (19,399,636) | | (27,790,235) |
First Trust Canada AlphaDEX® Fund
| — | | (15,418,669) | | (2,076,903) |
First Trust Australia AlphaDEX® Fund
| 1,304 | | (439,517) | | (291,518) |
First Trust United Kingdom AlphaDEX® Fund
| — | | (37,040,742) | | (1,521,042) |
First Trust India NIFTY 50 Equal Weight ETF
| 3,717 | | (1,100,025) | | (290,046) |
First Trust Hong Kong AlphaDEX® Fund
| 2,006 | | (49,347,327) | | (198,884) |
First Trust Switzerland AlphaDEX® Fund
| — | | (22,613,388) | | (15,203,198) |
First Trust Developed Markets ex-US Small Cap AlphaDEX® Fund
| — | | (2,607,186) | | (2,103,535) |
First Trust Emerging Markets Small Cap AlphaDEX® Fund
| — | | (33,547,054) | | (15,629,893) |
First Trust Eurozone AlphaDEX® ETF
| — | | (8,860,433) | | (9,314,129) |
Notes to Financial Statements (Continued)
First Trust Exchange-Traded AlphaDEX® Fund II
December 31, 2018
G. Income and Other Taxes
Each Fund intends to continue to qualify as a regulated investment company by complying with the requirements under Subchapter M of the Internal Revenue Code of 1986, as amended, which includes distributing substantially all of its net investment income and net realized gains to shareholders. Accordingly, no provision has been made for federal and state income taxes. However, due to the timing and amount of distributions, each Fund may be subject to an excise tax of 4% of the amount by which approximately 98% of each Fund’s taxable income exceeds the distributions from such taxable income for the calendar year.
Certain countries assess a capital gains tax on securities sold in their local markets. This tax is accrued as the securities in these foreign markets appreciate in value and is paid at the time of sale to the extent a capital gain is realized. Taxes accrued on securities in an unrealized appreciation position are included in “Net change in unrealized appreciation (depreciation) on deferred foreign capital gains tax” on the Statements of Operations. The capital gains tax paid on securities sold is included in “Net realized gain (loss) on foreign capital gains tax” on the Statements of Operations.
India’s Finance Bill, 2018 (“Finance Bill, 2018”) was enacted into law on March 29, 2018 and amongst other provisions, it introduces a long-term capital gains tax beginning April 1, 2018. Long-term capital gains on the sale of listed shares in excess of INR 0.1 million will be taxed at the rate of 10% (plus applicable surcharge and cess (which is a type of tax)) subject to satisfaction of certain conditions. Long-term capital gains accruing as of January 31, 2018 will be considered exempt due to a grandfather clause in the provision. In the case of the sale of listed shares held by a Fund for one year or less, the income would be classified as short-term capital gains and would be taxable at 15% (plus applicable surcharge and cess) provided the shares are sold on the stock exchange and subjected to securities transaction tax (“STT”). The Finance Bill, 2018 increases the cess imposed on the sum of tax and surcharge from 3% to 4%. The cess 4% rate is applied to the capital gains tax, resulting in a higher effective rate of capital gains tax. Where the sale of shares is outside the stock exchange and not subject to STT, the long-term capital gains would be taxed at 10% (plus applicable surcharge and cess) and short-term capital gains would be taxed at 30% (plus applicable surcharge and cess). The Finance Bill, 2018, approves the carry forward of long-term capital losses to be offset against long-term capital gains. Short-term losses and long-term losses can be netted against short-term gains and long-term gains, respectively.
The Funds are subject to accounting standards that establish a minimum threshold for recognizing, and a system for measuring, the benefits of a tax position taken or expected to be taken in a tax return. Taxable years ended 2015, 2016, 2017, and 2018 remain open to federal and state audit. As of December 31, 2018, management has evaluated the application of these standards to the Funds and has determined that no provision for income tax is required in the Funds’ financial statements for uncertain tax positions.
Under the Regulated Investment Company Modernization Act of 2010 (the “Act”), net capital losses may be carried forward indefinitely, and their character is retained as short-term and/or long-term losses. At December 31, 2018, for federal income tax purposes, each Fund had capital loss carryforwards available that are shown in the following table, to the extent provided by regulations, to offset future capital gains. To the extent that these loss carryforwards are used to offset future capital gains, it is probable that the capital gains so offset will not be distributed to Fund shareholders. The Funds are subject to certain limitations, under U.S. tax rules, on the use of capital loss carryforwards and net unrealized built-in losses. These limitations apply when there has been a 50% change in ownership.
Notes to Financial Statements (Continued)
First Trust Exchange-Traded AlphaDEX® Fund II
December 31, 2018
| | Capital
Loss Available |
First Trust Asia Pacific ex-Japan AlphaDEX® Fund
| $ 10,068,249 |
First Trust Europe AlphaDEX® Fund
| 126,183,512 |
First Trust Latin America AlphaDEX® Fund
| 6,114,908 |
First Trust Brazil AlphaDEX® Fund
| — |
First Trust China AlphaDEX® Fund
| 5,192,806 |
First Trust Japan AlphaDEX® Fund
| 29,010,747 |
First Trust South Korea AlphaDEX® Fund
| 2,147,235 |
First Trust Developed Markets ex-US AlphaDEX® Fund
| 103,321,781 |
First Trust Emerging Markets AlphaDEX® Fund
| 121,484,392 |
First Trust Germany AlphaDEX® Fund
| 19,399,636 |
First Trust Canada AlphaDEX® Fund
| 15,418,548 |
First Trust Australia AlphaDEX® Fund
| 439,517 |
First Trust United Kingdom AlphaDEX® Fund
| 37,020,134 |
First Trust India NIFTY 50 Equal Weight ETF
| 1,100,025 |
First Trust Hong Kong AlphaDEX® Fund
| 49,347,327 |
First Trust Switzerland AlphaDEX® Fund
| 22,613,388 |
First Trust Developed Markets ex-US Small Cap AlphaDEX® Fund
| 2,607,186 |
First Trust Emerging Markets Small Cap AlphaDEX® Fund
| 33,458,016 |
First Trust Eurozone AlphaDEX® ETF
| 8,840,272 |
Certain losses realized during the current fiscal year may be deferred and treated as occurring on the first day of the following fiscal year for federal income tax purposes. For the fiscal year ended December 31, 2018, the Funds incurred and elected to defer net ordinary losses as follows:
| | Ordinary Losses |
First Trust Asia Pacific ex-Japan AlphaDEX® Fund
| $ — |
First Trust Europe AlphaDEX® Fund
| 40,405 |
First Trust Latin America AlphaDEX® Fund
| — |
First Trust Brazil AlphaDEX® Fund
| — |
First Trust China AlphaDEX® Fund
| — |
First Trust Japan AlphaDEX® Fund
| 29,955 |
First Trust South Korea AlphaDEX® Fund
| 2,149 |
First Trust Developed Markets ex-US AlphaDEX® Fund
| — |
First Trust Emerging Markets AlphaDEX® Fund
| — |
First Trust Germany AlphaDEX® Fund
| — |
First Trust Canada AlphaDEX® Fund
| 121 |
First Trust Australia AlphaDEX® Fund
| — |
First Trust United Kingdom AlphaDEX® Fund
| 20,608 |
First Trust India NIFTY 50 Equal Weight ETF
| — |
First Trust Hong Kong AlphaDEX® Fund
| — |
First Trust Switzerland AlphaDEX® Fund
| — |
First Trust Developed Markets ex-US Small Cap AlphaDEX® Fund
| — |
First Trust Emerging Markets Small Cap AlphaDEX® Fund
| 89,038 |
First Trust Eurozone AlphaDEX® ETF
| 20,161 |
In order to present paid-in capital and accumulated distributable earnings (loss) (which consists of accumulated net investment income (loss), accumulated net realized gain (loss) on investments and net unrealized appreciation (depreciation) on investments) on the Statements of Assets and Liabilities that more closely represent their tax character, certain adjustments have been made to paid-in capital, accumulated net investment income (loss) and accumulated net realized gain (loss) on investments. These adjustments are primarily due to the difference between book and tax treatments of income and gains on various investment securities held by the
Notes to Financial Statements (Continued)
First Trust Exchange-Traded AlphaDEX® Fund II
December 31, 2018
Funds and in-kind transactions. The results of operations and net assets were not affected by these adjustments. For the fiscal year ended December 31, 2018, the adjustments for each Fund were as follows:
| | Accumulated
Net
Investment
Income (Loss) | | Accumulated
Net Realized
Gain (Loss)
on Investments | | Paid-in
Capital |
First Trust Asia Pacific ex-Japan AlphaDEX® Fund
| $ 502,241 | | $ (1,338,179) | | $ 835,938 |
First Trust Europe AlphaDEX® Fund
| 2,017,298 | | (10,961,774) | | 8,944,476 |
First Trust Latin America AlphaDEX® Fund
| 16,048 | | 260,296 | | (276,344) |
First Trust Brazil AlphaDEX® Fund
| 201,069 | | (495,749) | | 294,680 |
First Trust China AlphaDEX® Fund
| 5,021 | | 45,191 | | (50,212) |
First Trust Japan AlphaDEX® Fund
| 307,486 | | (13,213,220) | | 12,905,734 |
First Trust South Korea AlphaDEX® Fund
| 10,942 | | (10,942) | | — |
First Trust Developed Markets ex-US AlphaDEX® Fund
| 2,338,851 | | (3,342,450) | | 1,003,599 |
First Trust Emerging Markets AlphaDEX® Fund
| (655,979) | | (5,615,999) | | 6,271,978 |
First Trust Germany AlphaDEX® Fund
| 368,516 | | (1,825,900) | | 1,457,384 |
First Trust Canada AlphaDEX® Fund
| (146) | | 885,696 | | (885,550) |
First Trust Australia AlphaDEX® Fund
| 52,263 | | (242,642) | | 190,379 |
First Trust United Kingdom AlphaDEX® Fund
| 64,939 | | (1,051,315) | | 986,376 |
First Trust India NIFTY 50 Equal Weight ETF
| 32,631 | | (32,631) | | — |
First Trust Hong Kong AlphaDEX® Fund
| 10,857 | | (568,276) | | 557,419 |
First Trust Switzerland AlphaDEX® Fund
| 318,637 | | (15,777,354) | | 15,458,717 |
First Trust Developed Markets ex-US Small Cap AlphaDEX® Fund
| 43,604 | | (88,953) | | 45,349 |
First Trust Emerging Markets Small Cap AlphaDEX® Fund
| 1,268,678 | | (2,688,531) | | 1,419,853 |
First Trust Eurozone AlphaDEX® ETF
| 40,329 | | (232,745) | | 192,416 |
H. Expenses
Expenses that are directly related to the Funds are charged to First Trust pursuant to the Investment Management Agreement, with the exception of the advisory fees, Rule 12b-1 distribution and service fees, if any, brokerage expenses, taxes, interest, acquired fund fees and expenses, and extraordinary expenses, which are paid by each respective Fund.
First Trust Portfolios L.P. (“FTP”) has entered into licensing agreements with Nasdaq (“Licensor”) for all the Funds except NFTY and with India Index Services & Products Ltd. (“IISL”) for NFTY (Nasdaq and IISL collectively, the “Licensors”). The respective license agreements allow for the use by First Trust of each Fund’s respective index and of certain trademarks and trade names of the Licensors. The Funds are sub-licensees to the applicable license agreements.
I. Offsetting on the Statements of Assets and Liabilities
Offsetting Assets and Liabilities requires entities to disclose both gross and net information about instruments and transactions eligible for offset on the Statements of Assets and Liabilities, and disclose instruments and transactions subject to master netting or similar agreements. These disclosure requirements are intended to help investors and other financial statement users better assess the effect or potential effect of offsetting arrangements on a Fund’s financial position. The transactions subject to offsetting disclosures are derivative instruments, repurchase agreements and reverse repurchase agreements, and securities borrowing and securities lending transactions.
This disclosure, if applicable, is included within each Fund’s Portfolio of Investments under the heading “Offsetting Assets and Liabilities.” For financial reporting purposes, the Funds do not offset financial assets and financial liabilities that are subject to master netting arrangements (“MNAs”) or similar agreements on the Statements of Assets and Liabilities. MNAs provide the right, in the event of default (including bankruptcy and insolvency), for the non-defaulting counterparty to liquidate the collateral and calculate the net exposure to the defaulting party or request additional collateral.
J. New Accounting Pronouncement
On August 28, 2018, the FASB issued Accounting Standards Update (“ASU”) 2018-13, “Disclosure Framework – Changes to the Disclosure Requirements for Fair Value Measurement,” which amends the fair value measurement disclosure requirements of ASC 820. The amendments of ASU 2018-13 include new, eliminated, and modified disclosure requirements of ASC 820. In addition, the
Notes to Financial Statements (Continued)
First Trust Exchange-Traded AlphaDEX® Fund II
December 31, 2018
amendments clarify that materiality is an appropriate consideration of entities when evaluating disclosure requirements. The ASU is effective for fiscal years beginning after December 15, 2019, including interim periods therein. Early adoption is permitted for any eliminated or modified disclosures upon issuance of this ASU. The Funds have early adopted ASU 2018-13 for these financial statements, which did not result in a material impact.
3. Investment Advisory Fee, Affiliated Transactions and Other Fee Arrangements
First Trust, the investment advisor to the Funds, is a limited partnership with one limited partner, Grace Partners of DuPage L.P., and one general partner, The Charger Corporation. The Charger Corporation is an Illinois corporation controlled by James A. Bowen, Chief Executive Officer of First Trust. First Trust is responsible for the selection and ongoing monitoring of the securities in each Fund’s portfolio, managing the Funds’ business affairs and providing certain administrative services necessary for the management of the Funds.
First Trust is paid an annual unitary management fee of 0.80% of each Fund’s average daily net assets. First Trust is responsible for the expenses of each Fund including the cost of transfer agency, custody, fund administration, licensing fees, legal, audit and other services, but excluding fee payments under the Investment Management Agreement, Rule 12b-1 distribution and service fees, if any, brokerage expenses, taxes, interest, acquired fund fees and expenses, and extraordinary expenses, which are paid by each respective Fund. First Trust also provides fund reporting services to the Funds for a flat annual fee in the amount of $9,250 per Fund, which is covered under the annual unitary management fee.
During the fiscal year ended December 31, 2018, NFTY received a payment from the Advisor of $14,188 in connection with changing the Index.
The Trust has multiple service agreements with BBH. Under the service agreements, BBH performs custodial, fund accounting, certain administrative services, and transfer agency services for the Funds. As custodian, BBH is responsible for custody of each Fund’s assets. As fund accountant and administrator, BBH is responsible for maintaining the books and records of each Fund’s securities and cash. As transfer agent, BBH is responsible for maintaining shareholder records for each Fund.
Each Trustee who is not an officer or employee of First Trust, any sub-advisor or any of their affiliates (“Independent Trustees”) is paid a fixed annual retainer that is allocated equally among each fund in the First Trust Fund Complex. Each Independent Trustee is also paid an annual per fund fee that varies based on whether the fund is a closed-end or other actively managed fund, or is an index fund.
Additionally, the Lead Independent Trustee and the Chairmen of the Audit Committee, Nominating and Governance Committee and Valuation Committee are paid annual fees to serve in such capacities, with such compensation allocated pro rata among each fund in the First Trust Fund Complex based on net assets. Independent Trustees are reimbursed for travel and out-of-pocket expenses in connection with all meetings. The Lead Independent Trustee and Committee Chairmen rotate every three years. The officers and “Interested” Trustee receive no compensation from the Trust for acting in such capacities.
Notes to Financial Statements (Continued)
First Trust Exchange-Traded AlphaDEX® Fund II
December 31, 2018
4. Purchases and Sales of Securities
For the fiscal year ended December 31, 2018, the cost of purchases and proceeds from sales of investment securities for each Fund, excluding short-term investments and in-kind transactions, were as follows:
| | Purchases | | Sales |
| First Trust Asia Pacific ex-Japan AlphaDEX® Fund | $ 43,820,754 | | $ 48,664,829 |
| First Trust Europe AlphaDEX® Fund | 807,506,545 | | 807,454,919 |
| First Trust Latin America AlphaDEX® Fund | 32,628,598 | | 29,847,184 |
| First Trust Brazil AlphaDEX® Fund | 159,038,852 | | 36,672,125 |
| First Trust China AlphaDEX® Fund | 12,289,392 | | 9,095,496 |
| First Trust Japan AlphaDEX® Fund | 139,814,172 | | 140,401,321 |
| First Trust South Korea AlphaDEX® Fund | 1,943,086 | | 1,969,846 |
| First Trust Developed Markets ex-US AlphaDEX® Fund | 1,333,553,711 | | 1,229,482,140 |
| First Trust Emerging Markets AlphaDEX® Fund | 719,615,126 | | 577,764,644 |
| First Trust Germany AlphaDEX® Fund | 189,207,618 | | 187,730,229 |
| First Trust Canada AlphaDEX® Fund | 8,898,628 | | 9,031,291 |
| First Trust Australia AlphaDEX® Fund | 1,261,969 | | 1,261,166 |
| First Trust United Kingdom AlphaDEX® Fund | 14,433,676 | | 14,600,614 |
| First Trust India NIFTY 50 Equal Weight ETF | 4,797,824 | | 4,783,679 |
| First Trust Hong Kong AlphaDEX® Fund | 2,681,958 | | 2,682,602 |
| First Trust Switzerland AlphaDEX® Fund | 147,178,791 | | 146,666,727 |
| First Trust Developed Markets ex-US Small Cap AlphaDEX® Fund | 20,213,428 | | 19,175,482 |
| First Trust Emerging Markets Small Cap AlphaDEX® Fund | 362,317,626 | | 332,203,175 |
| First Trust Eurozone AlphaDEX® ETF | 63,553,496 | | 63,550,805 |
| | | | |
For the fiscal year ended December 31, 2018, the cost of in-kind purchases and proceeds from in-kind sales for each Fund were as follows:
| | Purchases | | Sales |
| First Trust Asia Pacific ex-Japan AlphaDEX® Fund | $ 1,121,848 | | $ 12,877,420 |
| First Trust Europe AlphaDEX® Fund | 249,887,197 | | 180,003,598 |
| First Trust Latin America AlphaDEX® Fund | 4,490,340 | | 3,767,935 |
| First Trust Brazil AlphaDEX® Fund | — | | — |
| First Trust China AlphaDEX® Fund | — | | 1,223,146 |
| First Trust Japan AlphaDEX® Fund | 202,586,456 | | 98,705,665 |
| First Trust South Korea AlphaDEX® Fund | — | | — |
| First Trust Developed Markets ex-US AlphaDEX® Fund | 433,170,326 | | 126,666,789 |
| First Trust Emerging Markets AlphaDEX® Fund | 88,919,267 | | 101,930,580 |
| First Trust Germany AlphaDEX® Fund | 22,067,101 | | 80,279,482 |
| First Trust Canada AlphaDEX® Fund | 12,961,370 | | 8,675,436 |
| First Trust Australia AlphaDEX® Fund | 1,623,472 | | 1,643,702 |
| First Trust United Kingdom AlphaDEX® Fund | 1,555,642 | | 8,193,425 |
| First Trust India NIFTY 50 Equal Weight ETF | — | | — |
| First Trust Hong Kong AlphaDEX® Fund | — | | 2,228,164 |
| First Trust Switzerland AlphaDEX® Fund | 50,448,305 | | 100,191,241 |
| First Trust Developed Markets ex-US Small Cap AlphaDEX® Fund | 7,457,369 | | 3,144,230 |
| First Trust Emerging Markets Small Cap AlphaDEX® Fund | 30,330,412 | | 101,874,393 |
| First Trust Eurozone AlphaDEX® ETF | 79,184,085 | | 48,749,147 |
Notes to Financial Statements (Continued)
First Trust Exchange-Traded AlphaDEX® Fund II
December 31, 2018
5. Creations, Redemptions and Transaction Fees
Shares are created and redeemed by each Fund only in Creation Unit size aggregations of 50,000 shares in transactions with broker-dealers or large institutional investors that have entered into a participation agreement (an “Authorized Participant”). In order to purchase Creation Units of a Fund, an Authorized Participant must deposit (i) a designated portfolio of securities and other instruments determined by First Trust (the “Deposit Securities”) and generally make or receive a cash payment referred to as the “Cash Component,” which is an amount equal to the difference between the NAV of the Fund shares (per Creation Unit Aggregations) and the market value of the Deposit Securities, and/or (ii) cash in lieu of all or a portion of the Deposit Securities. If the Cash Component is a positive number (i.e., the NAV per Creation Unit Aggregation exceeds the Deposit Amount), the Authorized Participant will deliver the Cash Component. If the Cash Component is a negative number (i.e., the NAV per Creation Unit Aggregation is less than the Deposit Amount), the Authorized Participant will receive the Cash Component. Authorized Participants purchasing Creation Units must pay to BBH, as transfer agent, a creation transaction fee (the “Creation Transaction Fee”) regardless of the number of Creation Units purchased in the transaction. The Creation Transaction Fee may vary and is based on the composition of the securities included in the respective Fund’s portfolio and the countries in which the transactions are settled. The price for each Creation Unit will equal the daily NAV per share times the number of shares in a Creation Unit plus the fees described above and, if applicable, any operational processing and brokerage costs, transfer fees or stamp taxes. When a Fund permits an Authorized Participant to substitute cash or a different security in lieu of depositing one or more of the requisite Deposit Securities, the Authorized Participant may also be assessed an amount to cover the cost of purchasing the Deposit Securities and/or disposing of the substituted securities, including operational processing and brokerage costs, transfer fees, stamp taxes, and part or all of the spread between the expected bid and offer side of the market related to such Deposit Securities and/or substitute securities.
Authorized Participants redeeming Creation Units must pay to BBH, as transfer agent, a redemption transaction fee (the “Redemption Transaction Fee”), regardless of the number of Creation Units redeemed in the transaction. The Redemption Transaction Fee may vary and is based on the composition of the securities included in the respective Fund’s portfolio and the countries in which the transactions are settled. Each Fund reserves the right to effect redemptions in cash. An Authorized Participant may request cash redemption in lieu of securities; however, a Fund may, in its discretion, reject any such request.
The standard Creation Transaction Fees and the Redemption Transaction Fees for each Fund are as follows:
| | Creation
Transaction Fees | | Redemption
Transaction Fees |
| First Trust Asia Pacific ex-Japan AlphaDEX® Fund | $ 3,500 | | $ 3,500 |
| First Trust Europe AlphaDEX® Fund | 4,200 | | 4,200 |
| First Trust Latin America AlphaDEX® Fund | 2,600 | | 2,600 |
| First Trust Brazil AlphaDEX® Fund | 2,600 | | 2,600 |
| First Trust China AlphaDEX® Fund | 2,100 | | 2,100 |
| First Trust Japan AlphaDEX® Fund | 1,000 | | 1,000 |
| First Trust South Korea AlphaDEX® Fund | 1,600 | | 1,600 |
| First Trust Developed Markets ex-US AlphaDEX® Fund | 6,000 | | 6,000 |
| First Trust Emerging Markets AlphaDEX® Fund | 7,500 | | 7,500 |
| First Trust Germany AlphaDEX® Fund | 1,000 | | 1,000 |
| First Trust Canada AlphaDEX® Fund | 500 | | 500 |
| First Trust Australia AlphaDEX® Fund | 1,200 | | 1,200 |
| First Trust United Kingdom AlphaDEX® Fund | 500 | | 500 |
| First Trust India NIFTY 50 Equal Weight ETF | 2,500 | | 2,500 |
| First Trust Hong Kong AlphaDEX® Fund | 1,600 | | 1,600 |
| First Trust Switzerland AlphaDEX® Fund | 800 | | 800 |
| First Trust Developed Markets ex-US Small Cap AlphaDEX® Fund | 7,400 | | 7,400 |
| First Trust Emerging Markets Small Cap AlphaDEX® Fund | 9,000 | | 9,000 |
| First Trust Eurozone AlphaDEX® ETF | 3,700 | | 3,700 |
Notes to Financial Statements (Continued)
First Trust Exchange-Traded AlphaDEX® Fund II
December 31, 2018
6. Distribution Plan
The Board of Trustees adopted a Distribution and Service Plan pursuant to Rule 12b-1 under the 1940 Act. In accordance with the Rule 12b-1 plan, each Fund is authorized to pay an amount up to 0.25% of its average daily net assets each year to reimburse FTP, the distributor of the Funds, for amounts expended to finance activities primarily intended to result in the sale of Creation Units or to provide investor services. FTP may also use this amount to compensate securities dealers or other persons that are Authorized Participants for providing distribution assistance, including broker-dealer and shareholder support and educational and promotional services.
No 12b-1 fees are currently paid by the Funds, and pursuant to a contractual arrangement, no 12b-1 fees will be paid any time before April 30, 2020.
7. Indemnification
The Trust, on behalf of the Funds, has a variety of indemnification obligations under contracts with its service providers. The Trust’s maximum exposure under these arrangements is unknown. However, the Trust has not had prior claims or losses pursuant to these contracts and expects the risk of loss to be remote.
8. Subsequent Events
Management has evaluated the impact of all subsequent events to the Funds through the date the financial statements were issued, and has determined that there were no subsequent events requiring recognition or disclosure in the financial statements that have not already been disclosed.
Report of Independent Registered Public Accounting Firm
To the shareholders and the Board of Trustees of First Trust Exchange-Traded AlphaDEX® Fund II:
Opinion on the Financial Statements and Financial Highlights
We have audited the accompanying statements of assets and liabilities, including the portfolios of investments, of First Trust Exchange-Traded AlphaDEX®Fund II (the “Trust”), comprising the First Trust Asia Pacific ex-Japan AlphaDEX® Fund, First Trust Europe AlphaDEX® Fund, First Trust Latin America AlphaDEX®Fund, First Trust Brazil AlphaDEX®Fund, First Trust China AlphaDEX® Fund, First Trust Japan AlphaDEX® Fund, First Trust South Korea AlphaDEX®Fund, First Trust Developed Markets ex-US AlphaDEX®Fund, First Trust Emerging Markets AlphaDEX® Fund, First Trust Germany AlphaDEX® Fund, First Trust Canada AlphaDEX® Fund, First Trust Australia AlphaDEX®Fund, First Trust United Kingdom AlphaDEX® Fund, First Trust India NIFTY 50 Equal Weight ETF (formerly known as First Trust Taiwan AlphaDEX®Fund), First Trust Hong Kong AlphaDEX®Fund, First Trust Switzerland AlphaDEX® Fund, First Trust Developed Markets ex-US Small Cap AlphaDEX® Fund, First Trust Emerging Markets Small Cap AlphaDEX® Fund, and First Trust Eurozone AlphaDEX® ETF (the “Funds”), each a series of First Trust Exchange-Traded AlphaDEX® Fund II, as of December 31, 2018, the related statements of operations for the year then ended, the statements of changes in net assets for each of the two years in the period then ended, and the financial highlights for the periods indicated in the table below for the Funds; and the related notes. In our opinion, the financial statements and financial highlights present fairly, in all material respects, the financial position of each of the funds listed above included in First Trust Exchange-Traded AlphaDEX® Fund II as of December 31, 2018, and the results of their operations for the year then ended, the changes in their net assets for each of the two years in the period then ended, and the financial highlights for the period listed in the table below, in conformity with accounting principles generally accepted in the United States of America.
| Individual Funds Included in the Trust | Financial Highlights |
| First Trust Asia Pacific ex-Japan AlphaDEX® Fund | For the years ended December 31, 2018, 2017, 2016, 2015, and 2014 |
| First Trust Europe AlphaDEX® Fund |
| First Trust Latin America AlphaDEX® Fund |
| First Trust Brazil AlphaDEX® Fund |
| First Trust China AlphaDEX® Fund |
| First Trust Japan AlphaDEX® Fund |
| First Trust South Korea AlphaDEX® Fund |
| First Trust Developed Markets ex-US AlphaDEX® Fund |
| First Trust Emerging Markets AlphaDEX® Fund |
| First Trust Germany AlphaDEX® Fund |
| First Trust Canada AlphaDEX® Fund |
| First Trust Australia AlphaDEX® Fund |
| First Trust United Kingdom AlphaDEX® Fund |
| First Trust India NIFTY 50 Equal Weight ETF (formerly known as First Trust Taiwan AlphaDEX® Fund) |
| First Trust Hong Kong AlphaDEX® Fund |
| First Trust Switzerland AlphaDEX® Fund |
| First Trust Developed Markets ex-US Small Cap AlphaDEX® Fund |
| First Trust Emerging Markets Small Cap AlphaDEX® Fund |
| First Trust Eurozone AlphaDEX® ETF | For the years ended December 31, 2018, 2017, 2016, 2015, and the period from October 21, 2014 (commencement of operations) through December 31, 2014 |
Basis for Opinion
These financial statements and financial highlights are the responsibility of the Funds’ management. Our responsibility is to express an opinion on the Funds’ financial statements and financial highlights based on our audits. We are a public accounting firm registered
Report of Independent Registered Public Accounting Firm (Continued)
with the Public Company Accounting Oversight Board (United States) (PCAOB) and are required to be independent with respect to the Funds in accordance with the U.S. federal securities laws and the applicable rules and regulations of the Securities and Exchange Commission and the PCAOB.
We conducted our audits in accordance with the standards of the PCAOB. Those standards require that we plan and perform the audit to obtain reasonable assurance about whether the financial statements and financial highlights are free of material misstatement, whether due to error or fraud. The Funds are not required to have, nor were we engaged to perform, an audit of their internal control over financial reporting. As part of our audits we are required to obtain an understanding of internal control over financial reporting but not for the purpose of expressing an opinion on the effectiveness of the Funds’ internal control over financial reporting. Accordingly, we express no such opinion.
Our audits included performing procedures to assess the risks of material misstatement of the financial statements and financial highlights, whether due to error or fraud, and performing procedures that respond to those risks. Such procedures included examining, on a test basis, evidence regarding the amounts and disclosures in the financial statements and financial highlights. Our audits also included evaluating the accounting principles used and significant estimates made by management, as well as evaluating the overall presentation of the financial statements and financial highlights. Our procedures included confirmation of securities owned as of December 31, 2018, by correspondence with the custodian and brokers; when replies were not received from brokers, we performed other auditing procedures. We believe that our audits provide a reasonable basis for our opinion.
Chicago, Illinois
February 25, 2019
We have served as the auditor of one or more First Trust investment companies since 2001.
Additional Information
First Trust Exchange-Traded AlphaDEX® Fund II
December 31, 2018 (Unaudited)
Proxy Voting Policies and Procedures
A description of the policies and procedures that the Trust uses to determine how to vote proxies and information on how the Fund voted proxies relating to portfolio investments during the most recent 12-month period ended June 30 is available (1) without charge, upon request, by calling (800) 988-5891; (2) on each Fund’s website atwww.ftportfolios.com; and (3) on the Securities and Exchange Commission’s (“SEC”) website atwww.sec.gov.
Portfolio Holdings
The Trust files its complete schedule of each Fund’s portfolio holdings with the SEC for the first and third quarters of each fiscal year on Form N-Q. The Trust’s Form N-Qs are available (1) by calling (800) 988-5891; (2) on each Fund’s website atwww.ftportfolios.com; and (3) on the SEC’s website atwww.sec.gov.
Beginning in April 2019, the Trust will cease to disclose each Fund’s holdings on Form N-Q and will file Form N-PORT with the SEC on a monthly basis. Part F of Form N-PORT, which contains the complete schedule of each Fund’s portfolio holdings, will be made available in the same manner as Form N-Q discussed above.
Federal Tax Information
For the taxable year ended December 31, 2018, the following percentages of income dividend paid by the Funds qualified for the dividends received deduction available to corporations:
| | Dividends
Received Deduction |
First Trust Asia Pacific ex-Japan AlphaDEX® Fund
| 0.00% |
First Trust Europe AlphaDEX® Fund
| 0.00% |
First Trust Latin America AlphaDEX® Fund
| 0.00% |
First Trust Brazil AlphaDEX® Fund
| 0.00% |
First Trust China AlphaDEX® Fund
| 0.00% |
First Trust Japan AlphaDEX® Fund
| 0.00% |
First Trust South Korea AlphaDEX® Fund
| 0.00% |
First Trust Developed Markets ex-US AlphaDEX® Fund
| 0.00% |
First Trust Emerging Markets AlphaDEX® Fund
| 0.00% |
First Trust Germany AlphaDEX® Fund
| 0.00% |
First Trust Canada AlphaDEX® Fund
| 0.00% |
First Trust Australia AlphaDEX® Fund
| 0.00% |
First Trust United Kingdom AlphaDEX® Fund
| 0.00% |
First Trust India NIFTY 50 Equal Weight ETF
| 0.00% |
First Trust Hong Kong AlphaDEX® Fund
| 0.00% |
First Trust Switzerland AlphaDEX® Fund
| 0.00% |
First Trust Developed Markets ex-US Small Cap AlphaDEX® Fund
| 0.00% |
First Trust Emerging Markets Small Cap AlphaDEX® Fund
| 0.00% |
First Trust Eurozone AlphaDEX® ETF
| 0.00% |
Additional Information (Continued)
First Trust Exchange-Traded AlphaDEX® Fund II
December 31, 2018 (Unaudited)
For the taxable year ended December 31, 2018, the following percentages of income dividend paid by the Funds is hereby designated as qualified dividend income:
| | Qualified
Dividend Income |
First Trust Asia Pacific ex-Japan AlphaDEX® Fund
| 29.55% |
First Trust Europe AlphaDEX® Fund
| 100.00% |
First Trust Latin America AlphaDEX® Fund
| 21.14% |
First Trust Brazil AlphaDEX® Fund
| 0.00% |
First Trust China AlphaDEX® Fund
| 82.42% |
First Trust Japan AlphaDEX® Fund
| 100.00% |
First Trust South Korea AlphaDEX® Fund
| 100.00% |
First Trust Developed Markets ex-US AlphaDEX® Fund
| 78.00% |
First Trust Emerging Markets AlphaDEX® Fund
| 68.46% |
First Trust Germany AlphaDEX® Fund
| 100.00% |
First Trust Canada AlphaDEX® Fund
| 100.00% |
First Trust Australia AlphaDEX® Fund
| 90.06% |
First Trust United Kingdom AlphaDEX® Fund
| 100.00% |
First Trust India NIFTY 50 Equal Weight ETF
| 0.00% |
First Trust Hong Kong AlphaDEX® Fund
| 0.00% |
First Trust Switzerland AlphaDEX® Fund
| 100.00% |
First Trust Developed Markets ex-US Small Cap AlphaDEX® Fund
| 100.00% |
First Trust Emerging Markets Small Cap AlphaDEX® Fund
| 50.55% |
First Trust Eurozone AlphaDEX® ETF
| 89.54% |
The following Funds met the requirements of Section 853 of the Internal Revenue Code and elect to pass through to their shareholders credit for foreign taxes paid. The total amount of income received by the Funds from sources within foreign countries and possessions of the United States and of taxes paid to such countries are as follows:
| | Gross Foreign Income | | Foreign Taxes Paid |
| | Amount | | Per Share | | Amount | | Per Share |
First Trust Asia Pacific ex-Japan AlphaDEX® Fund
| $ 1,210,258 | | $ 1.10 | | $ 56,983 | | $ 0.05 |
First Trust Europe AlphaDEX® Fund
| 26,930,522 | | 1.41 | | 2,001,960 | | 0.11 |
First Trust Latin America AlphaDEX® Fund
| 679,849 | | 0.72 | | 65,123 | | 0.07 |
First Trust Brazil AlphaDEX® Fund
| 2,119,159 | | 0.22 | | 134,385 | | 0.01 |
First Trust China AlphaDEX® Fund
| 377,892 | | 1.26 | | 22,555 | | 0.08 |
First Trust Japan AlphaDEX® Fund
| 3,707,624 | | 1.18 | | 362,979 | | 0.12 |
First Trust South Korea AlphaDEX® Fund
| 39,873 | | 0.40 | | 5,426 | | 0.05 |
First Trust Developed Markets ex-US AlphaDEX® Fund
| 30,063,052 | | 1.57 | | 2,153,461 | | 0.11 |
First Trust Emerging Markets AlphaDEX® Fund
| 25,643,488 | | 1.29 | | 2,278,800 | | 0.11 |
First Trust Germany AlphaDEX® Fund
| 6,566,474 | | 1.77 | | 788,824 | | 0.21 |
First Trust Canada AlphaDEX® Fund
| 238,766 | | 0.68 | | 32,591 | | 0.09 |
First Trust Australia AlphaDEX® Fund
| 54,275 | | 1.09 | | 1,855 | | 0.04 |
First Trust United Kingdom AlphaDEX® Fund
| 487,114 | | 1.62 | | 0 | | 0.00 |
First Trust India NIFTY 50 Equal Weight ETF
| 44,349 | | 0.44 | | 0 | | 0.00 |
First Trust Hong Kong AlphaDEX® Fund
| 145,857 | | 1.46 | | 0 | | 0.00 |
First Trust Switzerland AlphaDEX® Fund
| 6,592,640 | | 1.91 | | 629,949 | | 0.18 |
First Trust Developed Markets ex-US Small Cap AlphaDEX® Fund
| 304,645 | | 1.02 | | 28,680 | | 0.10 |
First Trust Emerging Markets Small Cap AlphaDEX® Fund
| 11,194,997 | | 2.31 | | 1,032,737 | | 0.21 |
First Trust Eurozone AlphaDEX® ETF
| 2,313,190 | | 1.60 | | 245,474 | | 0.17 |
Additional Information (Continued)
First Trust Exchange-Traded AlphaDEX® Fund II
December 31, 2018 (Unaudited)
Risk Considerations
Risks are inherent in all investing. Certain general risks that may be applicable to a Fund are identified below, but not all of the material risks relevant to each Fund are included in this report and not all of the risks below apply to each Fund. The material risks of investing in each Fund are spelled out in its prospectus, statement of additional information and other regulatory filings. Before investing, you should consider each Fund’s investment objective, risks, charges and expenses, and read each Fund’s prospectus and statement of additional information carefully. You can download each Fund’s prospectus at www.ftportfolios.com or contact First Trust Portfolios L.P. at (800) 621-1675 to request a prospectus, which contains this and other information about each Fund.
Concentration Risk. To the extent that a fund is able to invest a large percentage of its assets in a single asset class or the securities of issuers within the same country, state, region, industry or sector, an adverse economic, business or political development may affect the value of the fund’s investments more than if the fund were more broadly diversified. A fund that tracks an index will be concentrated to the extent the fund’s corresponding index is concentrated. A concentration makes a fund more susceptible to any single occurrence and may subject the fund to greater market risk than a fund that is not concentrated.
Credit Risk. Credit risk is the risk that an issuer of a security will be unable or unwilling to make dividend, interest and/or principal payments when due and the related risk that the value of a security may decline because of concerns about the issuer’s ability to make such payments.
Cyber Security Risk. The funds are susceptible to potential operational risks through breaches in cyber security. A breach in cyber security refers to both intentional and unintentional events that may cause a fund to lose proprietary information, suffer data corruption or lose operational capacity. Such events could cause a fund to incur regulatory penalties, reputational damage, additional compliance costs associated with corrective measures and/or financial loss. In addition, cyber security breaches of a fund’s third-party service providers, such as its administrator, transfer agent, custodian, or sub-advisor, as applicable, or issuers in which the fund invests, can also subject a fund to many of the same risks associated with direct cyber security breaches.
Derivatives Risk. To the extent a fund uses derivative instruments such as futures contracts, options contracts and swaps, the fund may experience losses because of adverse movements in the price or value of the underlying asset, index or rate, which may be magnified by certain features of the derivative. These risks are heightened when a fund’s portfolio managers use derivatives to enhance the fund’s return or as a substitute for a position or security, rather than solely to hedge (or offset) the risk of a position or security held by the fund.
Equity Securities Risk. To the extent a fund invests in equity securities, the value of the fund’s shares will fluctuate with changes in the value of the equity securities. Equity securities prices fluctuate for several reasons, including changes in investors’ perceptions of the financial condition of an issuer or the general condition of the relevant stock market, such as market volatility, or when political or economic events affecting the issuers occur. In addition, common stock prices may be particularly sensitive to rising interest rates, as the cost of capital rises and borrowing costs increase. Equity securities may decline significantly in price over short or extended periods of time, and such declines may occur in the equity market as a whole, or they may occur in only a particular country, company, industry or sector of the market.
ETF Risk. The shares of an ETF trade like common stock and represent an interest in a portfolio of securities. The risks of owning an ETF generally reflect the risks of owning the underlying securities, although lack of liquidity in an ETF could result in it being more volatile and ETFs have management fees that increase their costs. Shares of an ETF trade on an exchange at market prices rather than net asset value, which may cause the shares to trade at a price greater than net asset value (premium) or less than net asset value (discount). In times of market stress, decisions by market makers to reduce or step away from their role of providing a market for an ETF’s shares, or decisions by an ETF’s authorized participants that they are unable or unwilling to proceed with creation and/or redemption orders of an ETF’s shares, could result in shares of the ETF trading at a discount to net asset value and in greater than normal intraday bid-ask spreads.
Fixed Income Securities Risk. To the extent a fund invests in fixed income securities, the fund will be subject to credit risk, income risk, interest rate risk, liquidity risk and prepayment risk. Income risk is the risk that income from a fund’s fixed income investments could decline during periods of falling interest rates. Interest rate risk is the risk that the value of a fund’s fixed income securities will decline because of rising interest rates. Liquidity risk is the risk that a security cannot be purchased or sold at the time desired, or cannot be purchased or sold without adversely affecting the price. Prepayment risk is the risk that the securities will be redeemed or prepaid by the issuer, resulting in lower interest payments received by the fund. In addition to these risks, high yield securities, or “junk” bonds, are subject to greater market fluctuations and risk of loss than securities with higher ratings, and the market for high yield securities is generally smaller and less liquid than that for investment grade securities.
Additional Information (Continued)
First Trust Exchange-Traded AlphaDEX® Fund II
December 31, 2018 (Unaudited)
Index Constituent Risk. Certain funds may be a constituent of one or more indices. As a result, such a fund may be included in one or more index-tracking exchange-traded funds or mutual funds. Being a component security of such a vehicle could greatly affect the trading activity involving a fund, the size of the fund and the market volatility of the fund. Inclusion in an index could significantly increase demand for the fund and removal from an index could result in outsized selling activity in a relatively short period of time. As a result, a fund’s net asset value could be negatively impacted and the fund’s market price may be significantly below its net asset value during certain periods.
Index Provider Risk. To the extent a fund seeks to track an index, it is subject to Index Provider Risk. There is no assurance that the Index Provider will compile the Index accurately, or that the Index will be determined, maintained, constructed, reconstituted, rebalanced, composed, calculated or disseminated accurately. To correct any such error, the Index Provider may carry out an unscheduled rebalance or other modification of the Index constituents or weightings, which may increase the fund’s costs. The Index Provider does not provide any representation or warranty in relation to the quality, accuracy or completeness of data in the Index, and it does not guarantee that the Index will be calculated in accordance with its stated methodology. Losses or costs associated with any Index Provider errors generally will be borne by the fund and its shareholders.
Investment Companies Risk.To the extent a fund invests in the securities of other investment vehicles, the fund will incur additional fees and expenses that would not be present in a direct investment in those investment vehicles. Furthermore, the fund’s investment performance and risks are directly related to the investment performance and risks of the investment vehicles in which the fund invests.
Management Risk. To the extent that a fund is actively managed, it is subject to management risk. In managing an actively-managed fund’s investment portfolio, the fund’s portfolio managers will apply investment techniques and risk analyses that may not have the desired result. There can be no guarantee that a fund will meet its investment objective.
Market Risk. Securities held by a fund, as well as shares of a fund itself, are subject to market fluctuations caused by factors such as general economic conditions, political events, regulatory or market developments, changes in interest rates and perceived trends in securities prices. Shares of a fund could decline in value or underperform other investments as a result of the risk of loss associated with these market fluctuations.
Non-U.S. Securities Risk. To the extent a fund invests in non-U.S. securities, it is subject to additional risks not associated with securities of domestic issuers. Non-U.S. securities are subject to higher volatility than securities of domestic issuers due to: possible adverse political, social or economic developments; restrictions on foreign investment or exchange of securities; lack of liquidity; currency exchange rates; excessive taxation; government seizure of assets; different legal or accounting standards; and less government supervision and regulation of exchanges in foreign countries. Investments in non-U.S. securities may involve higher costs than investments in U.S. securities, including higher transaction and custody costs, as well as additional taxes imposed by non-U.S. governments. These risks may be heightened for securities of companies located, or with significant operations, in emerging market countries.
Passive Investment Risk. To the extent a Fund seeks to track an index, the Fund will invest in the securities included in, or representative of, the index regardless of their investment merit. A Fund generally will not attempt to take defensive positions in declining markets.
| NOT FDIC INSURED | NOT BANK GUARANTEED | MAY LOSE VALUE |
Remuneration
First Trust Advisors L.P. (“First Trust”) is authorized and regulated by the U.S. Securities and Exchange Commission and is entitled to market shares of the First Trust Exchange-Traded AlphaDEX® Fund II funds it manages (the “Funds”), in certain member states in the European Economic Area in accordance with the cooperation arrangements in Article 42 of the Alternative Investment Fund Managers Directive (the “Directive”). First Trust is required under the Directive to make disclosures in respect of remuneration. The following disclosures are made in line with First Trust’s interpretation of currently available regulatory guidance on remuneration disclosures.
During the year ended December 31, 2018, the amount of remuneration paid (or to be paid) by First Trust Advisors L.P. in respect of the Funds is $1,667,371. This figure is comprised of $73,064 paid (or to be paid) in fixed compensation and $1,594,307 paid (or to be paid) in variable compensation. There were a total of 14 beneficiaries of the remuneration described above. Those amounts include $1,058,869 paid (or to be paid) to senior management of First Trust Advisors L.P. and $608,502 paid (or to be paid) to other employees whose professional activities have a material impact on the risk profiles of First Trust Advisors L.P. or the Funds (collectively, “Code Staff”).
Additional Information (Continued)
First Trust Exchange-Traded AlphaDEX® Fund II
December 31, 2018 (Unaudited)
Code Staff included in the aggregated figures disclosed above are rewarded in line with First Trust’s remuneration policy (the “Remuneration Policy”) which is determined and implemented by First Trust’s senior management. The Remuneration Policy reflects First Trust’s ethos of good governance and encapsulates the following principal objectives:
i. to provide a clear link between remuneration and performance of First Trust and to avoid rewarding for failure;
ii. to promote sound and effective risk management consistent with the risk profiles of the Funds managed by First Trust; and
iii. to remunerate staff in line with the business strategy, objectives, values and interests of First Trust and the Funds managed by First Trust in a manner that avoids conflicts of interest.
First Trust assesses various risk factors which it is exposed to when considering and implementing remuneration for Code Staff and considers whether any potential award to such person(s) would give rise to a conflict of interest. First Trust does not reward failure, or consider the taking of risk or failure to take risk in its remuneration of Code Staff.
First Trust assesses performance for the purposes of determining payments in respect of performance-related remuneration of Code Staff by reference to a broad range of measures including (i) individual performance (using financial and non-financial criteria), and (ii) the overall performance of First Trust. Remuneration is not based upon the performance of the Funds.
The elements of remuneration are balanced between fixed and variable and the senior management sets fixed salaries at a level sufficient to ensure that variable remuneration incentivises and rewards strong individual performance but does not encourage excessive risk taking.
No individual is involved in setting his or her own remuneration.
Board of Trustees and Officers
First Trust Exchange-Traded AlphaDEX® Fund II
December 31, 2018 (Unaudited)
The following tables identify the Trustees and Officers of the Trust. Unless otherwise indicated, the address of all persons is 120 East Liberty Drive, Suite 400, Wheaton, IL 60187.
The Trust’s statement of additional information includes additional information about the Trustees and is available, without charge, upon request, by calling (800) 988-5891.
| Name, Year of Birth and Position with the Trust | Term of Office and Year First Elected or Appointed | Principal Occupations
During Past 5 Years | Number of Portfolios in the First Trust Fund Complex Overseen by Trustee | Other Trusteeships or Directorships Held by Trustee During Past 5 Years |
| INDEPENDENT TRUSTEES |
Richard E. Erickson, Trustee
(1951) | • Indefinite Term
• Since Inception | Physician; Officer, Wheaton Orthopedics; Limited Partner, Gundersen Real Estate Limited Partnership (June 1992 to December 2016); Member, Sportsmed LLC (April 2007 to November 2015) | 161 | None |
Thomas R. Kadlec, Trustee
(1957) | • Indefinite Term
• Since Inception | President, ADM Investor Services, Inc. (Futures Commission Merchant) | 161 | Director of ADM Investor Services, Inc., ADM Investor Services International, Futures Industry Association, and National Futures Association |
Robert F. Keith, Trustee
(1956) | • Indefinite Term
• Since Inception | President, Hibs Enterprises (Financial and Management Consulting) | 161 | Director of Trust Company of Illinois |
Niel B. Nielson, Trustee
(1954) | • Indefinite Term
• Since Inception | Senior Advisor (August 2018 to Present), Managing Director and Chief Operating Officer (January 2015 to August 2018), Pelita Harapan Educational Foundation (Educational Products and Services); President and Chief Executive Officer (June 2012 to September 2014), Servant Interactive LLC (Educational Products and Services); President and Chief Executive Officer (June 2012 to September 2014), Dew Learning LLC (Educational Products and Services) | 161 | Director of Covenant Transport, Inc. (May 2003 to May 2014) |
| INTERESTED TRUSTEE |
James A. Bowen(1), Trustee and
Chairman of the Board
(1955) | • Indefinite Term
• Since Inception | Chief Executive Officer, First Trust Advisors L.P. and First Trust Portfolios L.P.; Chairman of the Board of Directors, BondWave LLC (Software Development Company) and Stonebridge Advisors LLC (Investment Advisor) | 161 | None |
| (1) | Mr. Bowen is deemed an “interested person” of the Trust due to his position as CEO of First Trust Advisors L.P., investment advisor of the Trust. |
Board of Trustees and Officers (Continued)
First Trust Exchange-Traded AlphaDEX® Fund II
December 31, 2018 (Unaudited)
| Name and Year of Birth | Position and Offices with Trust | Term of Office and Length of Service | Principal Occupations
During Past 5 Years |
| OFFICERS(2) |
James M. Dykas
(1966) | President and Chief Executive Officer | • Indefinite Term
• Since January 2016 | Managing Director and Chief Financial Officer (January 2016 to Present), Controller (January 2011 to January 2016), Senior Vice President (April 2007 to January 2016), First Trust Advisors L.P. and First Trust Portfolios L.P.; Chief Financial Officer (January 2016 to Present), BondWave LLC (Software Development Company) and Stonebridge Advisors LLC (Investment Advisor) |
Donald P. Swade
(1972) | Treasurer, Chief Financial Officer and Chief Accounting Officer | • Indefinite Term
• Since January 2016 | Senior Vice President (July 2016 to Present), Vice President (April 2012 to July 2016), First Trust Advisors L.P. and First Trust Portfolios L.P. |
W. Scott Jardine
(1960) | Secretary and Chief Legal Officer | • Indefinite Term
• Since Inception | General Counsel, First Trust Advisors L.P. and First Trust Portfolios L.P.; Secretary and General Counsel, BondWave LLC; Secretary, Stonebridge Advisors LLC |
Daniel J. Lindquist
(1970) | Vice President | • Indefinite Term
• Since Inception | Managing Director, First Trust Advisors L.P. and First Trust Portfolios L.P. |
Kristi A. Maher
(1966) | Chief Compliance Officer and Assistant Secretary | • Indefinite Term
• Since Inception | Deputy General Counsel, First Trust Advisors L.P. and First Trust Portfolios L.P. |
Roger F. Testin
(1966) | Vice President | • Indefinite Term
• Since Inception | Senior Vice President, First Trust Advisors L.P. and First Trust Portfolios L.P. |
Stan Ueland
(1970) | Vice President | • Indefinite Term
• Since Inception | Senior Vice President, First Trust Advisors L.P. and First Trust Portfolios L.P |
| (2) | The term “officer” means the president, vice president, secretary, treasurer, controller or any other officer who performs a policy making function. |
Privacy Policy
First Trust Exchange-Traded AlphaDEX® Fund II
December 31, 2018 (Unaudited)
Privacy Policy
First Trust values our relationship with you and considers your privacy an important priority in maintaining that relationship. We are committed to protecting the security and confidentiality of your personal information.
Sources of Information
We collect nonpublic personal information about you from the following sources:
| • | Information we receive from you and your broker-dealer, investment advisor or financial representative through interviews, applications, agreements or other forms; |
| • | Information about your transactions with us, our affiliates or others; |
| • | Information we receive from your inquiries by mail, e-mail or telephone; and |
| • | Information we collect on our website through the use of “cookies”. For example, we may identify the pages on our website that your browser requests or visits. |
Information Collected
The type of data we collect may include your name, address, social security number, age, financial status, assets, income, tax information, retirement and estate plan information, transaction history, account balance, payment history, investment objectives, marital status, family relationships and other personal information.
Disclosure of Information
We do not disclose any nonpublic personal information about our customers or former customers to anyone, except as permitted by law. In addition to using this information to verify your identity (as required under law), the permitted uses may also include the disclosure of such information to unaffiliated companies for the following reasons:
| • | In order to provide you with products and services and to effect transactions that you request or authorize, we may disclose your personal information as described above to unaffiliated financial service providers and other companies that perform administrative or other services on our behalf, such as transfer agents, custodians and trustees, or that assist us in the distribution of investor materials such as trustees, banks, financial representatives, proxy services, solicitors and printers. |
| • | We may release information we have about you if you direct us to do so, if we are compelled by law to do so, or in other legally limited circumstances (for example to protect your account from fraud). |
In addition, in order to alert you to our other financial products and services, we may share your personal information within First Trust.
Use of Website Analytics
We currently use third party analytics tools, Google Analytics and AddThis, to gather information for purposes of improving First Trust’s website and marketing our products and services to you. These tools employ cookies, which are small pieces of text stored in a file by your web browser and sent to websites that you visit, to collect information, track website usage and viewing trends such as the number of hits, pages visited, videos and PDFs viewed and the length of user sessions in order to evaluate website performance and enhance navigation of the website. We may also collect other anonymous information, which is generally limited to technical and web navigation information such as the IP address of your device, internet browser type and operating system for purposes of analyzing the data to make First Trust’s website better and more useful to our users. The information collected does not include any personal identifiable information such as your name, address, phone number or email address unless you provide that information through the website for us to contact you in order to answer your questions or respond to your requests. To find out how to opt-out of these services click on:Google Analytics andAddThis.
Confidentiality and Security
With regard to our internal security procedures, First Trust restricts access to your nonpublic personal information to those First Trust employees who need to know that information to provide products or services to you. We maintain physical, electronic and procedural safeguards to protect your nonpublic personal information.
Policy Updates and Inquiries
As required by federal law, we will notify you of our privacy policy annually. We reserve the right to modify this policy at any time, however, if we do change it, we will tell you promptly. For questions about our policy, or for additional copies of this notice, please go towww.ftportfolios.com, or contact us at 1-800-621-1675 (First Trust Portfolios) or 1-800-222-6822 (First Trust Advisors).
May 2017
This page intentionally left blank
This page intentionally left blank
This page intentionally left blank
First Trust Exchange-Traded AlphaDEX® Fund II
INVESTMENT ADVISOR
First Trust Advisors L.P.
120 East Liberty Drive, Suite 400
Wheaton, IL 60187
ADMINISTRATOR, CUSTODIAN,
FUND ACCOUNTANT &
TRANSFER AGENT
Brown Brothers Harriman & Co.
50 Post Office Square
Boston, MA 02110
INDEPENDENT REGISTERED
PUBLIC ACCOUNTING FIRM
Deloitte & Touche LLP
111 S. Wacker Drive
Chicago, IL 60606
LEGAL COUNSEL
Chapman and Cutler LLP
111 W. Monroe Street
Chicago, IL 60603
Item 2. Code of Ethics.
| (a) | | The registrant, as of the end of the period covered by this report, has adopted a code of ethics that applies to the registrant’s principal executive officer, principal financial officer, principal accounting officer or controller, or persons performing similar functions, regardless of whether these individuals are employed by the registrant or a third party. |
| (c) | | There have been no amendments, during the period covered by this report, to a provision of the code of ethics that applies to the registrant's principal executive officer, principal financial officer, principal accounting officer or controller, or persons performing similar functions, regardless of whether these individuals are employed by the registrant or a third party, and that relates to any element of the code of ethics description. |
| (d) | | The registrant has not granted any waivers, including an implicit waiver, from a provision of the code of ethics that applies to the registrant’s principal executive officer, principal financial officer, principal accounting officer or controller, or persons performing similar functions, regardless of whether these individuals are employed by the registrant or a third party, that relates to one or more of the items set forth in paragraph (b) of this item’s instructions. |
Item 3. Audit Committee Financial Expert.
As of the end of the period covered by the report, the registrant's board of trustees has determined that Thomas R. Kadlec and Robert F. Keith are qualified to serve as audit committee financial experts serving on its audit committee and that each of them is “independent,” as defined by Item 3 of Form N-CSR.
Item 4. Principal Accountant Fees and Services.
(a)Audit Fees(Registrant) — The aggregate fees billedfor each of the last two fiscal yearsfor professional services rendered by the principal accountant for the audit of the Registrant’s annual financial statements or services that are normally provided by the accountant in connection with statutory and regulatory filings or engagements were $427,500 for the fiscal year ended December 31, 2017 and $431,000 for the fiscal year ended December 31, 2018.
(b)Audit-Related Fees(Registrant) —The aggregate fees billed in each of the last two fiscal years for assurance and related services by the principal accountant that are reasonably related to the performance of the audit of the registrant’s financial statements and are not reported under paragraph (a) of this Item were $0 for the fiscal year ended December 31, 2017, and $0 for the fiscal year ended December 31, 2018.
Audit-Related Fees(Investment Adviser and Distributor) —The aggregate fees billed in each of the last two fiscal years for assurance and related services by the principal accountant that are reasonably related to the performance of the audit of the registrant’s financial statements and are not reported under paragraph (a) of this Item were $0 for the fiscal year ended December 31, 2017 and $0 for the fiscal year ended December 31, 2018.
(c)Tax Fees(Registrant)—The aggregate fees billed in each of the last two fiscal years for professional services rendered by the principal accountant for tax compliance, tax advice, and tax planning to the registrant were $190,535 for the fiscal year ended December 31, 2017, and $124,200 for the fiscal year ended December 31, 2018.
Tax Fees(Investment Adviser and Distributor) —The aggregate fees billed in each of the last two fiscal years for professional services rendered by the principal accountant for tax compliance, tax advice, and tax planning to the registrant’s adviser and distributor were $0 for the fiscal year ended December 31, 2017 and $0 for the fiscal year ended December 31, 2018.
(d)All Other Fees(Registrant) —The aggregate fees billed in each of the last two fiscal years for products and services provided by the principal accountant to the registrant, other than the services reported in paragraphs (a) through (c) of this Item were $0 for the fiscal year ended December 31, 2017, and $0 for the fiscal year ended December 31, 2018.
All Other Fees(Investment Adviser and Distributor) —The aggregate fees billed in each of the last two fiscal years for products and services provided by the principal accountant to the registrant’s investment adviser and distributor, other than the services reported in paragraphs (a) through (c) of this Item were $0 for the fiscal year ended December 31, 2017, and $0 for the fiscal year ended December 31, 2018.
| (e)(1) | | Disclose the audit committee’s pre-approval policies and procedures described in paragraph (c)(7) of Rule 2-01 of Regulation S-X. |
Pursuant to its charter and its Audit and Non-Audit Services Pre-Approval Policy, the Audit Committee (the“Committee”) is responsible for the pre-approval of all audit services and permitted non-audit services (including the fees and terms thereof) to be performed for the Registrant by its independent auditors. The Chairman of the Committee authorized to give such pre-approvals on behalf of the Committee up to $25,000 and report any such pre-approval to the full Committee.
The Committee is also responsible for the pre-approval of the independent auditor’s engagements for non-audit services with the Registrant’s adviser (not including a sub-adviser whose role is primarily portfolio management and is sub-contracted or overseen by another investment adviser) and any entity controlling, controlled by or under common control with the investment adviser that provides ongoing services to the Registrant, if the engagement relates directly to the operations and financial reporting of the Registrant, subject to thede minimisexceptions for non-audit services described in Rule 2-01 of Regulation S-X. If the independent auditor has provided non-audit services to the Registrant’s adviser (other than any sub-adviser whose role is primarily portfolio management and is sub-contracted with or overseen by another investment adviser) and any entity controlling, controlled by or under common control with the investment adviser that provides ongoing services to the Registrant that were not pre-approved pursuant to thede minimisexception, the Committee will consider whether the provision of such non-audit services is compatible with the auditor’s independence.
| (e)(2) | | The percentage of services described in each of paragraphs (b) through (d) for the Registrant and the Registrant’s investment adviser of this Item that were approved by the audit committee pursuant to the pre-approval exceptions included in paragraph (c)(7)(i)(c) or paragraph (c)(7)(ii) of Rule 2-01 of Regulation S-X are as follows: |
(b) 0%
(c) 0%
(d) 0%
| (f) | | The percentage of hours expended on the principal accountant’s engagement to audit the registrant’s financial statements for the most recent fiscal year that were attributed to work performed by persons other than the principal accountant’s full-time, permanent employees was less than fifty percent. |
| (g) | | The aggregate non-audit fees billed by the registrant’s accountant for services rendered to the registrant, and rendered to the registrant���s investment adviser (not including any sub-adviser whose role is primarily portfolio management and is subcontracted with or overseen by another investment adviser), and any entity controlling, controlled by, or under common control with the adviser that provides ongoing services to the Registrant for the fiscal year ended December 31, 2017 were $190,535 for the Registrant, $44,000 for the Registrant’s investment adviser, and $63,400 for the Registrant’s distributor; and for the fiscal year ended December 31, 2018 were $124,200 for the Registrant, $48,190 for the Registrant’s investment adviser, and $80,310 for the Registrant’s distributor. |
| (h) | | The Registrant’s audit committee of its Board of Trustees has determined that the provision of non-audit services that were rendered to the Registrant’s investment adviser (not including any sub-adviser whose role is primarily portfolio management and is subcontracted with or overseen by another investment adviser), and any entity controlling, controlled by, or under common control with the investment adviser that provides ongoing services to the Registrant that were not pre-approved pursuant to paragraph (c)(7)(ii) of Rule 2-01 of Regulation S-X is compatible with maintaining the principal accountant’s independence. |
Item 5. Audit Committee of Listed Registrants.
The Registrant has a separately designated standing audit committee established in accordance with Section 3(a)(58)(A) of the Securities Exchange Act of 1934 consisting of all the independent directors of the Registrant. The audit committee of the registrant is comprised of: Richard E. Erickson, Thomas R. Kadlec, Robert F. Keith and Niel B. Nielson.
Item 6. Investments.
| (a) | | Schedule of Investments in securities of unaffiliated issuers as of the close of the reporting period is included as part of the report to shareholders filed under Item 1 of this form. |
Item 7. Disclosure of Proxy Voting Policies and Procedures for Closed-End Management Investment Companies.
Not applicable.
Item 8. Portfolio Managers of Closed-End Management Investment Companies.
Not applicable.
Item 9. Purchases of Equity Securities by Closed-End Management Investment Company and Affiliated Purchasers.
Not applicable.
Item 10. Submission of Matters to a Vote of Security Holders.
There have been no material changes to the procedures by which the shareholders may recommend nominees to the registrant’s board of trustees, where those changes were implemented after the registrant last provided disclosure in response to the requirements of Item 407 (c) (2) (iv) of Regulation S-K (17 CFR 229.407) (as required by Item 22 (b) (15) of Schedule 14A (17 CFR 240.14a-101)), or this Item.
Item 11. Controls and Procedures.
| (a) | | The registrant’s principal executive and principal financial officers, or persons performing similar functions, have concluded that the registrant’s disclosure controls and procedures (as defined in Rule 30a-3(c) under the Investment Company Act of 1940, as amended (the “1940 Act”) (17 CFR 270.30a-3 (c))) are effective, as of a date within 90 days of the filing date of the report that includes the disclosure required by this paragraph, based on their evaluation of these controls and procedures required by Rule 30a-3(b) under the 1940 Act (17 CFR 270.30a-3(b)) and Rules 13a-15(b) or 15d-15(b) under the Securities Exchange Act of 1934, as amended (17 CFR 240.13a-15(b) or 240.15d-15 (b)). |
| (b) | | There were no changes in the registrant's internal control over financial reporting (as defined in Rule 30a-3(d) under the 1940 Act (17 CFR 270.30a-3(d)) that occurred during the registrant's last fiscal quarter of the period covered by this report that have materially affected, or are reasonably likely to materially affect, the registrant's internal control over financial reporting. |
Item 12. Disclosure of Securities Lending Activities for Closed-End Management Investment Companies
(a) Not applicable.
(b) Not applicable.
Item 13. Exhibits.
| (a)(1) | | Code of ethics, or any amendment thereto, that is the subject of disclosure required by Item 2 is attached hereto. |
| (a)(2) | | Certifications pursuant to Rule 30a-2(a) under the 1940 Act and Section 302 of the Sarbanes-Oxley Act of 2002 are attached hereto. |
| (b) | | Certifications pursuant to Rule 30a-2(b) under the 1940 Act and Section 906 of the Sarbanes-Oxley Act of 2002 are attached hereto. |
SIGNATURES
Pursuant to the requirements of the Securities Exchange Act of 1934 and the Investment Company Act of 1940, the registrant has duly caused this report to be signed on its behalf by the undersigned, thereunto duly authorized.
| (registrant) | | First Trust Exchange-Traded AlphaDEX® Fund II | | |
| By (Signature and Title)* | | /s/ James M. Dykas | | |
| | | James M. Dykas, President and Chief Executive Officer
(principal executive officer) | | |
Pursuant to the requirements of the Securities Exchange Act of 1934 and the Investment Company Act of 1940, this report has been signed below by the following persons on behalf of the registrant and in the capacities and on the dates indicated.
| By (Signature and Title)* | | /s/ James M. Dykas | | |
| | | James M. Dykas, President and Chief Executive Officer
(principal executive officer) | | |
| By (Signature and Title)* | | /s/ Donald P. Swade | | |
| | | Donald P. Swade, Treasurer, Chief Financial Officer
and Chief Accounting Officer
(principal financial officer) | | |
* Print the name and title of each signing officer under his or her signature.