UNITED STATES
SECURITIES AND EXCHANGE COMMISSION
Washington, D.C. 20549
FORM N-CSR
CERTIFIED SHAREHOLDER REPORT OF REGISTERED MANAGEMENT INVESTMENT COMPANIES
Investment Company Act file number 811-21774
First Trust Exchange-Traded AlphaDEX® Fund II
(Exact name of registrant as specified in charter)
120 East Liberty Drive, Suite 400
Wheaton, IL 60187
(Address of principal executive offices) (Zip code)
W. Scott Jardine, Esq.
First Trust Portfolios L.P.
120 East Liberty Drive, Suite 400
Wheaton, IL 60187
(Name and address of agent for service)
Registrant's telephone number, including area code: (630) 765-8000
Date of fiscal year end: December 31
Date of reporting period: June 30, 2022
Form N-CSR is to be used by management investment companies to file reports with the Commission not later than 10 days after the transmission to stockholders of any report that is required to be transmitted to stockholders under Rule 30e-1 under the Investment Company Act of 1940 (17 CFR 270.30e-1). The Commission may use the information provided on Form N-CSR in its regulatory, disclosure review, inspection, and policymaking roles.
A registrant is required to disclose the information specified by Form N-CSR, and the Commission will make this information public. A registrant is not required to respond to the collection of information contained in Form N-CSR unless the Form displays a currently valid Office of Management and Budget ("OMB") control number. Please direct comments concerning the accuracy of the information collection burden estimate and any suggestions for reducing the burden to Secretary, Securities and Exchange Commission, 100 F Street, NE, Washington, DC 20549-0609. The OMB has reviewed this collection of information under the clearance requirements of 44 U.S.C. § 3507.
Item 1. Report to Stockholders.
| (a) | | The registrant's semi-annual report transmitted to shareholders pursuant to Rule 30e-1 under the Investment Company Act of 1940 is as follows: |
First Trust Exchange-Traded AlphaDEX® Fund II
First Trust Asia Pacific ex-Japan AlphaDEX® Fund (FPA)
First Trust Europe AlphaDEX® Fund (FEP)
First Trust Latin America AlphaDEX® Fund (FLN)
First Trust Brazil AlphaDEX® Fund (FBZ)
First Trust China AlphaDEX® Fund (FCA)
First Trust Japan AlphaDEX® Fund (FJP)
First Trust Developed Markets ex-US AlphaDEX® Fund (FDT)
First Trust Emerging Markets AlphaDEX® Fund (FEM)
First Trust Germany AlphaDEX® Fund (FGM)
First Trust United Kingdom AlphaDEX® Fund (FKU)
First Trust India NIFTY 50 Equal Weight ETF (NFTY)
First Trust Switzerland AlphaDEX® Fund (FSZ)
First Trust Developed Markets ex-US Small Cap AlphaDEX® Fund (FDTS)
First Trust Emerging Markets Small Cap AlphaDEX® Fund (FEMS)
First Trust Eurozone AlphaDEX® ETF (FEUZ)
AlphaDEX® is a registered trademark of First Trust Portfolios L.P.
First Trust Exchange-Traded AlphaDEX® Fund II
Semi-Annual Report
June 30, 2022
Caution Regarding Forward-Looking Statements
This report contains certain forward-looking statements within the meaning of the Securities Act of 1933, as amended, and the Securities Exchange Act of 1934, as amended. Forward-looking statements include statements regarding the goals, beliefs, plans or current expectations of First Trust Advisors L.P. (“First Trust” or the “Advisor”) and its representatives, taking into account the information currently available to them. Forward-looking statements include all statements that do not relate solely to current or historical fact. For example, forward-looking statements include the use of words such as “anticipate,” “estimate,” “intend,” “expect,” “believe,” “plan,” “may,” “should,” “would” or other words that convey uncertainty of future events or outcomes.
Forward-looking statements involve known and unknown risks, uncertainties and other factors that may cause the actual results, performance or achievements of any series of First Trust Exchange-Traded AlphaDEX® Fund II (the “Trust”) described in this report (each such series is referred to as a “Fund” and collectively, the “Funds”) to be materially different from any future results, performance or achievements expressed or implied by the forward-looking statements. When evaluating the information included in this report, you are cautioned not to place undue reliance on these forward-looking statements, which reflect the judgment of the Advisor and its representatives only as of the date hereof. We undertake no obligation to publicly revise or update these forward-looking statements to reflect events and circumstances that arise after the date hereof.
Performance and Risk Disclosure
There is no assurance that any Fund described in this report will achieve its investment objective. Each Fund is subject to market risk, which is the possibility that the market values of securities owned by the Fund will decline and that the value of the Fund’s shares may therefore be less than what you paid for them. Accordingly, you can lose money by investing in a Fund. See “Risk Considerations” in the Additional Information section of this report for a discussion of certain other risks of investing in the Funds.
Performance data quoted represents past performance, which is no guarantee of future results, and current performance may be lower or higher than the figures shown. For the most recent month-end performance figures, please visit www.ftportfolios.com or speak with your financial advisor. Investment returns, net asset value and share price will fluctuate and Fund shares, when sold, may be worth more or less than their original cost.
The Advisor may also periodically provide additional information on Fund performance on each Fund’s web page at www.ftportfolios.com.
How to Read This Report
This report contains information that may help you evaluate your investment. It includes details about each Fund and presents data and analysis that provide insight into each Fund’s performance and investment approach.
By reading the market overview by Robert F. Carey, Chief Market Strategist of the Advisor, you may obtain an understanding of how the market environment affected the performance of each Fund. The statistical information that follows may help you understand each Fund’s performance compared to that of relevant market benchmarks.
It is important to keep in mind that the opinions expressed by personnel of the Advisor are just that: informed opinions. They should not be considered to be promises or advice. The opinions, like the statistics, cover the period through the date on the cover of this report. The material risks of investing in each Fund are spelled out in the prospectus, the statement of additional information, and other Fund regulatory filings.
First Trust Exchange-Traded AlphaDEX® Fund II
Semi-Annual Letter from the Chairman and CEO
June 30, 2022
Dear Shareholders,
First Trust is pleased to provide you with the semi-annual report for the First Trust Exchange-Traded AlphaDEX® Fund II (the “Funds”), which contains detailed information about the Funds for the six months ended June 30, 2022.
The trillions of dollars of stimulus funneled into the U.S. financial system by the Federal government throughout the bulk of the coronavirus (“COVID-19”) pandemic was effective in bolstering economic activity, as reflected by some impressive gross domestic product (“GDP”) statistics. It also fueled inflation. I will touch on that angle as well. Data from the U.S. Bureau of Economic Analysis indicates that annualized real GDP growth rates over the four quarters comprising 2021 were 6.3%, 6.7%, 2.3% and 6.9%, respectively. It appears, however, that the upside from those stimulus dollars may be waning. In the first two quarters of 2022, the U.S. economy contracted. Real GDP declined by an annualized 1.6% in the first quarter and declined by an annualized 0.9% in the second quarter. The war between Russia and Ukraine, which commenced in late February 2022, China’s COVID-19 shutdown this year and the ongoing supply chain bottlenecks have also provided a drag on the global economy and securities markets, in my opinion. While the standard definition of a recession is two consecutive quarters of negative GDP growth, the official arbiter of declaring recessions in the U.S. belongs to the National Bureau of Economic Research, and it factors in additional economic indicators in its evaluation process. Even if we were to experience a recession, it does not necessarily mean it will be deep in scope. Currently, the Federal Reserve (the “Fed”) is still hoping to orchestrate a soft landing for the economy, though it admits it will be challenging.
In addition to the recent decline in economic activity, the financial media is paying a good deal of attention to the inverted yield curve in the Treasury market, particularly the spread between the yields on the 2-Year and 10-Year Treasury Note (“T-Note”). As of July 27, 2022, the closing yield on the 2-Year T-Note was 3.00%, 21 basis points (“bps”) above the 2.79% yield on the 10-Year T-Note. The current inversion has only been in play in earnest since July 5, 2022. Yields on shorter-maturity bonds should be lower than those further out on the curve. For the 30-year period ended July 27, 2022, the average yield on the 10-Year T-Note was 113 bps higher than the average yield on the 2-Year T-Note. Historically, such inversions have portended that a recession is likely to arrive in the next 12-24 months. At its meeting on July 27, 2022, the Fed raised the Federal Funds target rate by 75 bps to combat the spike in inflation. The target rate currently sits at 2.50%, marking the upper bound of its 2.25% to 2.50% range. The Fed’s next meeting is scheduled for September 20-21, 2022.
In the current climate, the number one goal is to tame inflation. The Fed has made it clear that it is committed to doing so. The Consumer Price Index stood at a trailing 12-month rate of 9.1% in June 2022, its highest level since 1981. Surging inflation is the number one concern of Americans. It is certainly going to be a hot button issue in the upcoming mid-term elections in November. A recent CNN poll revealed that 75% of Americans consider inflation their top economic concern and only 25% approve of President Joe Biden’s efforts to curtail it. This dovetails into another concern: the markets. With respect to returns, on a year-to-date and 12-month basis, all the major domestic and foreign stock and bond indices were sitting in negative territory, based on their respective total returns through June 30, 2022. Sell-offs are a natural part of market cycles. We all know that prices do not go up in a straight line. As previously noted, the Fed, the economy and the markets are battling some significant headwinds. The good news is we know what they are. Suffice it to say, it will take some time to remedy them. Stay the course!
Thank you for giving First Trust the opportunity to play a role in your financial future. We value our relationship with you and will report on the Funds again in six months.
Sincerely,
James A. Bowen
Chairman of the Board of Trustees
Chief Executive Officer of First Trust Advisors L.P.
First Trust Exchange-Traded AlphaDEX® Fund II
Semi-Annual Report (Unaudited)
June 30, 2022
Robert F. Carey, CFA
Senior Vice President and Chief Market Strategist
First Trust Advisors L.P.
Mr. Carey is responsible for the overall management of research and analysis of the First Trust product line. Mr. Carey has more than 30 years of experience as an Equity and Fixed-Income Analyst and is a recipient of the Chartered Financial Analyst (“CFA”) designation. He is a graduate of the University of Illinois at Champaign-Urbana with a B.S. in Physics. He is also a member of the Investment Analysts Society of Chicago and the CFA Institute. Mr. Carey has appeared as a guest on such programs as Bloomberg TV, CNBC, and WBBM Radio, and has been quoted by several publications, including The Wall Street Journal, The Wall Street Reporter, Bloomberg News Service, and Registered Rep.
State of the Global Economy/Investing
As we head into the second half of 2022, the latest hot topic appears to be whether or not the U.S. economy is on the cusp of a recession. After all, real gross domestic product (“GDP”) declined by an annualized 1.6% in the first quarter of 2022, according to data from the U.S. Bureau of Economic Analysis. The technical definition of a recession is two consecutive quarters of negative GDP growth. Opinions on this topic vary. Some pundits believe the U.S. economy is already in a recession. Brian Wesbury, Chief Economist at First Trust, is not one of them. Wesbury notes that the official arbiter of recessions, the National Bureau of Economic Research, considers other factors beyond just real GDP, including the job market, manufacturing activity and real income. While subject to change, Wesbury does not currently foresee a recession arriving until late 2023 or 2024. Investors should monitor the actions of the Federal Reserve (the “Fed”) over the next few months. We are anticipating additional interest rate hikes by the Fed to combat the surge in inflation, which reached 9.1% on a trailing 12-month basis in June 2022, as measured by the Consumer Price Index.
Economic headwinds extend beyond what is transpiring in the U.S. Two of the most critical events to surface so far in 2022 are the war between Russia and Ukraine, which commenced in late February 2022, and the coronavirus-induced shutdown in China. The war has helped drive the relative value of the U.S. Dollar higher against other major world currencies, in our opinion. We will touch on the U.S. Dollar later. A strong U.S. Dollar can put downward pressure on commodity prices. Historically speaking, it is common for foreign investors to funnel capital into U.S. assets when wars break out or during periods of great uncertainty. The U.S. is still viewed by many as a safe haven for capital. An end to the Russian conflict and the reopening of China’s economy would be a net gain for the economy, in our opinion.
The global growth forecast from the International Monetary Fund (“IMF”) released in April 2022 projected a 3.6% real GDP growth rate for 2022, down from 6.1% in 2021. The IMF is calling for a 3.7% growth rate for the U.S. in 2022, down from 5.7% the previous year. Advanced Economies are expected to register a 3.3% growth rate, down from 5.2%. While the gap has narrowed from prior years, Emerging Market and Developing Economies are still expected to grow faster than Advanced Economies. Their 2022 growth rate estimate is 3.8%, down from 6.8% a year ago.
We believe that global mergers and acquisitions (“M&A”) activity is a useful barometer for gauging the state of the global economy. When activity is elevated, it signals that CEOs are willing to assume risk in order to grow their businesses. Data from Refinitiv, a global provider of financial market data and infrastructure, indicates that global M&A activity totaled $2.2 trillion through the first half of 2022. While that is a good showing, the dollar volume was down 20% from the same period a year ago. The U.S. accounted for 44% of total M&A activity in the first half of 2022. Full-year 2021 set the record for global M&A. Deal activity reached an all-time high of $5.90 trillion.
Investors continued to funnel capital into exchange-traded funds (“ETFs”) and related exchange-traded products (“ETPs”) in the first half of 2022 despite the sharp sell-off in the markets. ETFGI, an independent research and consultancy firm, reported that total assets invested in ETFs/ETPs listed in the U.S. stood at $6.18 trillion at the close of June 2022, down from $7.21 trillion at the end of 2021. In the first half of 2022, net inflows to ETFs/ETPs listed in the U.S. totaled $307.49 billion, with $158.73 billion of it flowing to equity funds. Total assets invested in ETFs/ETPs listed globally stood at $8.86 trillion, down from $10.27 trillion at the end of 2021. In the first half of this year, net inflows to ETFs/ETPs listed globally totaled $463.81 billion, with $277.22 billion of it flowing to equity funds.
Foreign Stocks and Bonds
The U.S. Dollar rose by 9.43% against a basket of major currencies in the first half of 2022, as measured by the U.S. Dollar Index (“DXY”), according to Bloomberg. The DXY Index closed at a reading of 104.69 on June 30, 2022, significantly above its 20-year average of 88.49. The stronger U.S. Dollar had a negative influence on the returns of foreign securities held by U.S. investors, provided they were unhedged.
The Bloomberg EM Hard Currency Aggregate Index of emerging markets debt posted a total return of -18.50% (USD), while the Bloomberg Global Aggregate Index of higher quality debt declined by 13.91% (USD). With respect to equities, the MSCI Emerging Markets Index of stocks posted a total return of -17.63% (USD), while the MSCI World ex USA Index was down 18.76% (USD) on a total return basis, according to Bloomberg.
Fund Performance Overview (Unaudited)
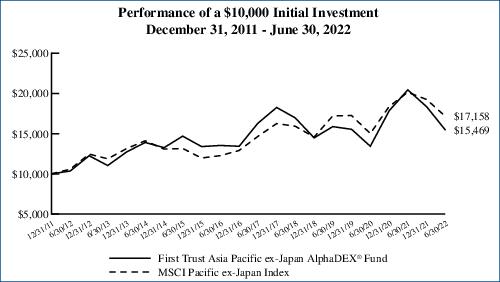
First Trust Asia Pacific ex-Japan AlphaDEX® Fund (FPA)
The First Trust Asia Pacific ex-Japan AlphaDEX® Fund (the “Fund”) seeks investment results that correspond generally to the price and yield (before the Fund’s fees and expenses) of an equity index called the Nasdaq AlphaDEX® Asia Pacific Ex-Japan Index (the “Index”). The Fund will normally invest at least 90% of its net assets (including investment borrowings) in the common stocks, depositary receipts, real estate investment trusts and preferred shares that comprise the Index. The shares of the Fund are listed and trade on The Nasdaq Stock Market LLC (the “Nasdaq”) under the ticker symbol “FPA.” The Fund commenced trading on April 19, 2011.
The Index employs the AlphaDEX® stock selection methodology which uses fundamental growth and value factors to objectively select stocks from the Nasdaq DM Asia Pacific Ex-Japan Index which may generate positive alpha relative to traditional passive indices. The Index is a modified equal-dollar weighted index where higher ranked stocks receive a higher weight within the Index.
| Performance | | | | | | | | | |
| | | | Average Annual Total Returns | | Cumulative Total Returns |
| | 6 Months
Ended
6/30/22 | 1 Year
Ended
6/30/22 | 5 Years
Ended
6/30/22 | 10 Years
Ended
6/30/22 | Inception
(4/18/11)
to 6/30/22 | | 5 Years
Ended
6/30/22 | 10 Years
Ended
6/30/22 | Inception
(4/18/11)
to 6/30/22 |
| Fund Performance | | | | | | | | | |
| NAV | -15.67% | -24.34% | -1.02% | 4.10% | 1.72% | | -4.98% | 49.38% | 20.99% |
| Market Price | -14.56% | -24.00% | -1.06% | 4.08% | 1.72% | | -5.17% | 49.12% | 21.01% |
| Index Performance | | | | | | | | | |
| Nasdaq AlphaDEX® Asia Pacific Ex-Japan Index(1) | -15.18% | -24.06% | -0.02% | N/A | N/A | | -0.11% | N/A | N/A |
| Nasdaq DM Asia Pacific Ex-Japan Index(1) | -17.06% | -22.59% | 2.19% | N/A | N/A | | 11.44% | N/A | N/A |
| MSCI Pacific ex-Japan Index | -10.85% | -14.85% | 3.21% | 4.95% | 3.22% | | 17.10% | 62.14% | 42.64% |
(See Notes to Fund Performance Overview Page 34.)
| (1) | Performance data is not available for all the periods shown in the table for the index because performance data does not exist for some of the entire periods. |
Nasdaq® and Nasdaq AlphaDEX® Asia Pacific Ex-Japan Index are registered trademarks and service marks of Nasdaq, Inc. (together with its affiliates hereinafter referred to as the “Corporations”) and are licensed for use by First Trust. AlphaDEX® is a registered trademark owned by First Trust that has been licensed to Nasdaq, Inc. for use in the name of the Index. The Fund has not been passed on by the Corporations as to its legality or suitability. The Fund is not issued, endorsed, sold or promoted by the Corporations. THE CORPORATIONS MAKE NO WARRANTIES AND BEAR NO LIABILITY WITH RESPECT TO THE FUND.
Fund Performance Overview (Unaudited) (Continued)
First Trust Asia Pacific ex-Japan AlphaDEX® Fund (FPA) (Continued)
| Sector Allocation | % of Total
Long-Term
Investments |
| Materials | 22.6% |
| Industrials | 18.3 |
| Real Estate | 14.1 |
| Financials | 9.8 |
| Information Technology | 8.1 |
| Energy | 6.6 |
| Consumer Discretionary | 6.0 |
| Consumer Staples | 5.0 |
| Communication Services | 4.7 |
| Utilities | 3.0 |
| Health Care | 1.8 |
| Total | 100.0% |
| Top Ten Holdings | % of Total
Long-Term
Investments |
| Jardine Cycle & Carriage Ltd. | 2.2% |
| Ampol Ltd. | 2.0 |
| Keppel Corp., Ltd. | 1.9 |
| Kerry Properties Ltd. | 1.9 |
| WH Group Ltd. | 1.9 |
| Nine Dragons Paper Holdings Ltd. | 1.9 |
| LG Corp. | 1.9 |
| Sino Land Co., Ltd. | 1.8 |
| Woodside Energy Group Ltd. | 1.8 |
| Hopson Development Holdings Ltd. | 1.7 |
| Total | 19.0% |
Performance figures assume reinvestment of all distributions and do not reflect the deduction of taxes that a shareholder would pay on Fund distributions or the redemption or sale of Fund shares. An index is a statistical composite that tracks a specified financial market or sector. Unlike the Fund, the index does not actually hold a portfolio of securities and therefore does not incur the expenses incurred by the Fund. These expenses negatively impact the performance of the Fund. The Fund’s past performance does not predict future performance.
Frequency Distribution of Discounts and Premiums
Information showing the number of days the market price of the Fund’s shares was greater (at a premium) and less (at a discount) than the Fund’s net asset value for the most recently completed year, and the most recently completed calendar quarters since that year (or life of the Fund, if shorter), is available at https://www.ftportfolios.com/Retail/etf/home.aspx.
Fund Performance Overview (Unaudited) (Continued)
First Trust Europe AlphaDEX® Fund (FEP)
The First Trust Europe AlphaDEX® Fund (the “Fund”) seeks investment results that correspond generally to the price and yield (before the Fund’s fees and expenses) of an equity index called the Nasdaq AlphaDEX® Europe Index (the “Index”). The Fund will normally invest at least 90% of its net assets (including investment borrowings) in the common stocks, depositary receipts, real estate investment trusts and preferred shares that comprise the Index. The shares of the Fund are listed and trade on the Nasdaq under the ticker symbol “FEP.” The Fund commenced trading on April 19, 2011.
The Index employs the AlphaDEX® stock selection methodology which uses fundamental growth and value factors to objectively select stocks from the Nasdaq DM Europe Index which may generate positive alpha relative to traditional passive indices. The Index is a modified equal-dollar weighted index where higher ranked stocks receive a higher weight within the Index.
| Performance | | | | | | | | | |
| | | | Average Annual Total Returns | | Cumulative Total Returns |
| | 6 Months
Ended
6/30/22 | 1 Year
Ended
6/30/22 | 5 Years
Ended
6/30/22 | 10 Years
Ended
6/30/22 | Inception
(4/18/11)
to 6/30/22 | | 5 Years
Ended
6/30/22 | 10 Years
Ended
6/30/22 | Inception
(4/18/11)
to 6/30/22 |
| Fund Performance | | | | | | | | | |
| NAV | -26.13% | -23.28% | 0.75% | 6.37% | 3.17% | | 3.83% | 85.35% | 41.79% |
| Market Price | -25.32% | -23.35% | 0.76% | 6.34% | 3.21% | | 3.85% | 84.91% | 42.40% |
| Index Performance | | | | | | | | | |
| Nasdaq AlphaDEX® Europe Index(1) | -26.37% | -23.29% | 1.37% | N/A | N/A | | 7.04% | N/A | N/A |
| Nasdaq DM Europe Index(1) | -21.87% | -19.02% | 1.86% | N/A | N/A | | 9.64% | N/A | N/A |
| MSCI Europe Index | -20.79% | -17.61% | 2.16% | 5.44% | 3.46% | | 11.29% | 69.81% | 46.37% |
(See Notes to Fund Performance Overview Page 34.)
| (1) | Performance data is not available for all the periods shown in the table for the index because performance data does not exist for some of the entire periods. |
Nasdaq® and Nasdaq AlphaDEX® Europe Index are registered trademarks and service marks of Nasdaq, Inc. (together with its affiliates hereinafter referred to as the “Corporations”) and are licensed for use by First Trust. AlphaDEX® is a registered trademark owned by First Trust that has been licensed to Nasdaq, Inc. for use in the name of the Index. The Fund has not been passed on by the Corporations as to its legality or suitability. The Fund is not issued, endorsed, sold or promoted by the Corporations. THE CORPORATIONS MAKE NO WARRANTIES AND BEAR NO LIABILITY WITH RESPECT TO THE FUND.
Fund Performance Overview (Unaudited) (Continued)
First Trust Europe AlphaDEX® Fund (FEP) (Continued)
| Sector Allocation | % of Total
Long-Term
Investments |
| Financials | 23.8% |
| Materials | 16.3 |
| Industrials | 11.2 |
| Consumer Discretionary | 10.7 |
| Energy | 9.9 |
| Utilities | 7.6 |
| Real Estate | 6.6 |
| Communication Services | 4.7 |
| Health Care | 4.2 |
| Consumer Staples | 4.0 |
| Information Technology | 1.0 |
| Total | 100.0% |
| Top Ten Holdings | % of Total
Long-Term
Investments |
| Repsol S.A. | 1.1% |
| Leonardo S.p.A. | 1.0 |
| Bank of Ireland Group PLC | 1.0 |
| Prosus N.V. | 1.0 |
| Shell PLC | 1.0 |
| OCI N.V. | 0.9 |
| Centrica PLC | 0.9 |
| Equinor ASA | 0.9 |
| Aker BP ASA | 0.9 |
| Saab AB, Class B | 0.9 |
| Total | 9.6% |

Performance figures assume reinvestment of all distributions and do not reflect the deduction of taxes that a shareholder would pay on Fund distributions or the redemption or sale of Fund shares. An index is a statistical composite that tracks a specified financial market or sector. Unlike the Fund, the index does not actually hold a portfolio of securities and therefore does not incur the expenses incurred by the Fund. These expenses negatively impact the performance of the Fund. The Fund’s past performance does not predict future performance.
Frequency Distribution of Discounts and Premiums
Information showing the number of days the market price of the Fund’s shares was greater (at a premium) and less (at a discount) than the Fund’s net asset value for the most recently completed year, and the most recently completed calendar quarters since that year (or life of the Fund, if shorter), is available at https://www.ftportfolios.com/Retail/etf/home.aspx.
Fund Performance Overview (Unaudited) (Continued)
First Trust Latin America AlphaDEX® Fund (FLN)
The First Trust Latin America AlphaDEX® Fund (the “Fund”) seeks investment results that correspond generally to the price and yield (before the Fund’s fees and expenses) of an equity index called the Nasdaq AlphaDEX® Latin America Index (the “Index”). The Fund will normally invest at least 90% of its net assets (including investment borrowings) in the common stocks, depositary receipts, real estate investment trusts and preferred shares that comprise the Index. The shares of the Fund are listed and trade on the Nasdaq under the ticker symbol “FLN.” The Fund commenced trading on April 19, 2011.
The Index employs the AlphaDEX® stock selection methodology which uses fundamental growth and value factors to objectively select stocks from the Nasdaq Latin America Index which may generate positive alpha relative to traditional passive indices. The Index is a modified equal-dollar weighted index where higher ranked stocks receive a higher weight within the Index.
| Performance | | | | | | | | | |
| | | | Average Annual Total Returns | | Cumulative Total Returns |
| | 6 Months
Ended
6/30/22 | 1 Year
Ended
6/30/22 | 5 Years
Ended
6/30/22 | 10 Years
Ended
6/30/22 | Inception
(4/18/11)
to 6/30/22 | | 5 Years
Ended
6/30/22 | 10 Years
Ended
6/30/22 | Inception
(4/18/11)
to 6/30/22 |
| Fund Performance | | | | | | | | | |
| NAV | -2.95% | -14.11% | 1.46% | -0.49% | -1.85% | | 7.53% | -4.83% | -18.86% |
| Market Price | -2.33% | -13.71% | 1.54% | -0.52% | -1.84% | | 7.94% | -5.11% | -18.82% |
| Index Performance | | | | | | | | | |
| Nasdaq AlphaDEX® Latin America Index(1) | -3.09% | -13.42% | 2.79% | N/A | N/A | | 14.73% | N/A | N/A |
| Nasdaq Latin America Index(1) | -3.20% | -22.16% | -1.60% | N/A | N/A | | -7.74% | N/A | N/A |
| MSCI EM Latin America Index | -0.57% | -16.08% | -0.58% | -2.18% | -3.68% | | -2.85% | -19.79% | -34.26% |
(See Notes to Fund Performance Overview Page 34.)
| (1) | Performance data is not available for all the periods shown in the table for the index because performance data does not exist for some of the entire periods. |
Nasdaq® and Nasdaq AlphaDEX® Latin America Index are registered trademarks and service marks of Nasdaq, Inc. (together with its affiliates hereinafter referred to as the “Corporations”) and are licensed for use by First Trust. AlphaDEX® is a registered trademark owned by First Trust that has been licensed to Nasdaq, Inc. for use in the name of the Index. The Fund has not been passed on by the Corporations as to its legality or suitability. The Fund is not issued, endorsed, sold or promoted by the Corporations. THE CORPORATIONS MAKE NO WARRANTIES AND BEAR NO LIABILITY WITH RESPECT TO THE FUND.
Fund Performance Overview (Unaudited) (Continued)
First Trust Latin America AlphaDEX® Fund (FLN) (Continued)
| Sector Allocation | % of Total
Long-Term
Investments |
| Materials | 24.7% |
| Utilities | 17.2 |
| Financials | 16.6 |
| Industrials | 10.1 |
| Energy | 8.8 |
| Consumer Staples | 7.0 |
| Communication Services | 6.8 |
| Consumer Discretionary | 5.8 |
| Health Care | 3.0 |
| Total | 100.0% |
| Top Ten Holdings | % of Total
Long-Term
Investments |
| Sociedad Quimica y Minera de Chile S.A., Class B (Preference Shares) | 4.1% |
| Cia Sud Americana de Vapores S.A. | 4.0 |
| Empresas Copec S.A. | 3.8 |
| Banco do Brasil S.A. | 3.7 |
| El Puerto de Liverpool S.A.B. de C.V. | 3.6 |
| Cia Paranaense de Energia, Class B (Preference Shares) | 3.4 |
| Cia Energetica de Minas Gerais (Preference Shares) | 3.4 |
| Petroleo Brasileiro S.A. (Preference Shares) | 3.2 |
| Empresas CMPC S.A. | 3.0 |
| Hypera S.A. | 3.0 |
| Total | 35.2% |

Performance figures assume reinvestment of all distributions and do not reflect the deduction of taxes that a shareholder would pay on Fund distributions or the redemption or sale of Fund shares. An index is a statistical composite that tracks a specified financial market or sector. Unlike the Fund, the index does not actually hold a portfolio of securities and therefore does not incur the expenses incurred by the Fund. These expenses negatively impact the performance of the Fund. The Fund’s past performance does not predict future performance.
Frequency Distribution of Discounts and Premiums
Information showing the number of days the market price of the Fund’s shares was greater (at a premium) and less (at a discount) than the Fund’s net asset value for the most recently completed year, and the most recently completed calendar quarters since that year (or life of the Fund, if shorter), is available at https://www.ftportfolios.com/Retail/etf/home.aspx.
Fund Performance Overview (Unaudited) (Continued)
First Trust Brazil AlphaDEX® Fund (FBZ)
The First Trust Brazil AlphaDEX® Fund (the “Fund”) seeks investment results that correspond generally to the price and yield (before the Fund’s fees and expenses) of an equity index called the Nasdaq AlphaDEX® Brazil Index (the “Index”). The Fund will normally invest at least 90% of its net assets (including investment borrowings) in the common stocks, depositary receipts, real estate investment trusts and preferred shares that comprise the Index. The shares of the Fund are listed and trade on the Nasdaq under the ticker symbol “FBZ.” The Fund commenced trading on April 19, 2011.
The Index employs the AlphaDEX® stock selection methodology which uses fundamental growth and value factors to objectively select stocks from the Nasdaq Brazil Index which may generate positive alpha relative to traditional passive indices. The Index is a modified equal-dollar weighted index where higher ranked stocks receive a higher weight within the Index.
| Performance | | | | | | | | | |
| | | | Average Annual Total Returns | | Cumulative Total Returns |
| | 6 Months
Ended
6/30/22 | 1 Year
Ended
6/30/22 | 5 Years
Ended
6/30/22 | 10 Years
Ended
6/30/22 | Inception
(4/18/11)
to 6/30/22 | | 5 Years
Ended
6/30/22 | 10 Years
Ended
6/30/22 | Inception
(4/18/11)
to 6/30/22 |
| Fund Performance | | | | | | | | | |
| NAV | -7.07% | -25.22% | 3.09% | -1.80% | -3.65% | | 16.45% | -16.61% | -34.08% |
| Market Price | -7.34% | -25.81% | 3.05% | -1.79% | -3.69% | | 16.22% | -16.54% | -34.34% |
| Index Performance | | | | | | | | | |
| Nasdaq AlphaDEX® Brazil Index(1) | -6.89% | -23.95% | 5.20% | N/A | N/A | | 28.86% | N/A | N/A |
| Nasdaq Brazil Index(1) | -1.52% | -29.98% | -0.11% | N/A | N/A | | -0.53% | N/A | N/A |
| MSCI Brazil Index | 2.75% | -23.30% | 0.80% | -2.00% | -4.53% | | 4.09% | -18.27% | -40.49% |
(See Notes to Fund Performance Overview Page 34.)
| (1) | Performance data is not available for all the periods shown in the table for the index because performance data does not exist for some of the entire periods. |
Nasdaq® and Nasdaq AlphaDEX® Brazil Index are registered trademarks and service marks of Nasdaq, Inc. (together with its affiliates hereinafter referred to as the “Corporations”) and are licensed for use by First Trust. AlphaDEX® is a registered trademark owned by First Trust that has been licensed to Nasdaq, Inc. for use in the name of the Index. The Fund has not been passed on by the Corporations as to its legality or suitability. The Fund is not issued, endorsed, sold or promoted by the Corporations. THE CORPORATIONS MAKE NO WARRANTIES AND BEAR NO LIABILITY WITH RESPECT TO THE FUND.
Fund Performance Overview (Unaudited) (Continued)
First Trust Brazil AlphaDEX® Fund (FBZ) (Continued)
| Sector Allocation | % of Total
Long-Term
Investments |
| Utilities | 26.3% |
| Materials | 24.3 |
| Financials | 14.1 |
| Consumer Staples | 14.1 |
| Energy | 9.6 |
| Industrials | 5.4 |
| Consumer Discretionary | 2.8 |
| Communication Services | 2.3 |
| Health Care | 1.1 |
| Total | 100.0% |
| Top Ten Holdings | % of Total
Long-Term
Investments |
| Cia Paranaense de Energia, Class B (Preference Shares) | 4.1% |
| Petroleo Brasileiro S.A. (Preference Shares) | 3.8 |
| EDP - Energias do Brasil S.A. | 3.8 |
| Cia de Transmissao de Energia Electrica Paulista (Preference Shares) | 3.7 |
| Transmissora Alianca de Energia Eletrica S.A. | 3.3 |
| JBS S.A. | 3.2 |
| Gerdau S.A. (Preference Shares) | 3.2 |
| Vale S.A. | 3.1 |
| Itausa S.A. (Preference Shares) | 2.9 |
| Neoenergia S.A. | 2.9 |
| Total | 34.0% |

Performance figures assume reinvestment of all distributions and do not reflect the deduction of taxes that a shareholder would pay on Fund distributions or the redemption or sale of Fund shares. An index is a statistical composite that tracks a specified financial market or sector. Unlike the Fund, the index does not actually hold a portfolio of securities and therefore does not incur the expenses incurred by the Fund. These expenses negatively impact the performance of the Fund. The Fund’s past performance does not predict future performance.
Frequency Distribution of Discounts and Premiums
Information showing the number of days the market price of the Fund’s shares was greater (at a premium) and less (at a discount) than the Fund’s net asset value for the most recently completed year, and the most recently completed calendar quarters since that year (or life of the Fund, if shorter), is available at https://www.ftportfolios.com/Retail/etf/home.aspx.
Fund Performance Overview (Unaudited) (Continued)
First Trust China AlphaDEX® Fund (FCA)
The First Trust China AlphaDEX® Fund (the “Fund”) seeks investment results that correspond generally to the price and yield (before the Fund’s fees and expenses) of an equity index called the Nasdaq AlphaDEX® China Index (the “Index”). The Fund will normally invest at least 90% of its net assets (including investment borrowings) in the common stocks, depositary receipts, real estate investment trusts and preferred shares that comprise the Index. The shares of the Fund are listed and trade on the Nasdaq under the ticker symbol “FCA.” The Fund commenced trading on April 19, 2011.
The Index employs the AlphaDEX® stock selection methodology which uses fundamental growth and value factors to objectively select stocks from the Nasdaq China Index which may generate positive alpha relative to traditional passive indices. The Index is a modified equal-dollar weighted index where higher ranked stocks receive a higher weight within the Index.
| Performance | | | | | | | | | |
| | | | Average Annual Total Returns | | Cumulative Total Returns |
| | 6 Months
Ended
6/30/22 | 1 Year
Ended
6/30/22 | 5 Years
Ended
6/30/22 | 10 Years
Ended
6/30/22 | Inception
(4/18/11)
to 6/30/22 | | 5 Years
Ended
6/30/22 | 10 Years
Ended
6/30/22 | Inception
(4/18/11)
to 6/30/22 |
| Fund Performance | | | | | | | | | |
| NAV | -5.68% | -14.86% | 5.24% | 5.65% | 1.77% | | 29.12% | 73.27% | 21.70% |
| Market Price | -4.22% | -13.54% | 5.52% | 5.75% | 1.86% | | 30.85% | 74.88% | 22.86% |
| Index Performance | | | | | | | | | |
| Nasdaq AlphaDEX® China Index(1) | -5.10% | -15.37% | 6.19% | N/A | N/A | | 35.05% | N/A | N/A |
| Nasdaq China Index(1) | -9.99% | -31.96% | 0.72% | N/A | N/A | | 3.65% | N/A | N/A |
| MSCI China Index | -11.26% | -31.79% | 2.14% | 5.49% | 2.87% | | 11.16% | 70.65% | 37.34% |
(See Notes to Fund Performance Overview Page 34.)
| (1) | Performance data is not available for all the periods shown in the table for the index because performance data does not exist for some of the entire periods. |
Nasdaq® and Nasdaq AlphaDEX® China Index are registered trademarks and service marks of Nasdaq, Inc. (together with its affiliates hereinafter referred to as the “Corporations”) and are licensed for use by First Trust. AlphaDEX® is a registered trademark owned by First Trust that has been licensed to Nasdaq, Inc. for use in the name of the Index. The Fund has not been passed on by the Corporations as to its legality or suitability. The Fund is not issued, endorsed, sold or promoted by the Corporations. THE CORPORATIONS MAKE NO WARRANTIES AND BEAR NO LIABILITY WITH RESPECT TO THE FUND.
Fund Performance Overview (Unaudited) (Continued)
First Trust China AlphaDEX® Fund (FCA) (Continued)
| Sector Allocation | % of Total
Long-Term
Investments |
| Materials | 15.2% |
| Utilities | 15.2 |
| Energy | 14.2 |
| Industrials | 13.7 |
| Information Technology | 10.3 |
| Consumer Discretionary | 9.3 |
| Financials | 9.0 |
| Real Estate | 7.2 |
| Health Care | 2.2 |
| Consumer Staples | 2.0 |
| Communication Services | 1.7 |
| Total | 100.0% |
| Top Ten Holdings | % of Total
Long-Term
Investments |
| China Hongqiao Group Ltd. | 3.9% |
| China Overseas Land & Investment Ltd. | 3.9 |
| China Power International Development Ltd. | 3.5 |
| Dongfeng Motor Group Co., Ltd., Class H | 3.4 |
| China State Construction International Holdings Ltd. | 3.3 |
| China Coal Energy Co., Ltd., Class H | 3.2 |
| Kunlun Energy Co., Ltd. | 3.2 |
| PetroChina Co., Ltd., Class H | 3.2 |
| Angang Steel Co., Ltd., Class H | 3.1 |
| Kingboard Holdings Ltd. | 2.9 |
| Total | 33.6% |

Performance figures assume reinvestment of all distributions and do not reflect the deduction of taxes that a shareholder would pay on Fund distributions or the redemption or sale of Fund shares. An index is a statistical composite that tracks a specified financial market or sector. Unlike the Fund, the index does not actually hold a portfolio of securities and therefore does not incur the expenses incurred by the Fund. These expenses negatively impact the performance of the Fund. The Fund’s past performance does not predict future performance.
Frequency Distribution of Discounts and Premiums
Information showing the number of days the market price of the Fund’s shares was greater (at a premium) and less (at a discount) than the Fund’s net asset value for the most recently completed year, and the most recently completed calendar quarters since that year (or life of the Fund, if shorter), is available at https://www.ftportfolios.com/Retail/etf/home.aspx.
Fund Performance Overview (Unaudited) (Continued)
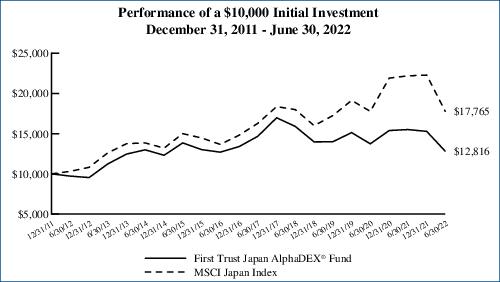
First Trust Japan AlphaDEX® Fund (FJP)
The First Trust Japan AlphaDEX® Fund (the “Fund”) seeks investment results that correspond generally to the price and yield (before the Fund’s fees and expenses) of an equity index called the Nasdaq AlphaDEX® Japan Index (the “Index”). The Fund will normally invest at least 90% of its net assets (including investment borrowings) in the common stocks, depositary receipts, real estate investment trusts and preferred shares that comprise the Index. The shares of the Fund are listed and trade on the Nasdaq under the ticker symbol “FJP.” The Fund commenced trading on April 19, 2011.
The Index employs the AlphaDEX® stock selection methodology which uses fundamental growth and value factors to objectively select stocks from the Nasdaq Japan Index which may generate positive alpha relative to traditional passive indices. The Index is a modified equal-dollar weighted index where higher ranked stocks receive a higher weight within the Index.
| Performance | | | | | | | | | |
| | | | Average Annual Total Returns | | Cumulative Total Returns |
| | 6 Months
Ended
6/30/22 | 1 Year
Ended
6/30/22 | 5 Years
Ended
6/30/22 | 10 Years
Ended
6/30/22 | Inception
(4/18/11)
to 6/30/22 | | 5 Years
Ended
6/30/22 | 10 Years
Ended
6/30/22 | Inception
(4/18/11)
to 6/30/22 |
| Fund Performance | | | | | | | | | |
| NAV | -16.15% | -17.39% | -2.67% | 2.80% | 1.81% | | -12.64% | 31.81% | 22.19% |
| Market Price | -16.00% | -17.30% | -2.72% | 2.82% | 1.82% | | -12.90% | 32.00% | 22.36% |
| Index Performance | | | | | | | | | |
| Nasdaq AlphaDEX® Japan Index(1) | -16.21% | -17.35% | -2.09% | N/A | N/A | | -10.03% | N/A | N/A |
| Nasdaq Japan Index(1) | -19.41% | -19.75% | 1.23% | N/A | N/A | | 6.33% | N/A | N/A |
| MSCI Japan Index | -20.27% | -19.93% | 1.76% | 5.59% | 4.56% | | 9.13% | 72.25% | 64.83% |
(See Notes to Fund Performance Overview Page 34.)
| (1) | Performance data is not available for all the periods shown in the table for the index because performance data does not exist for some of the entire periods. |
Nasdaq® and Nasdaq AlphaDEX® Japan Index are registered trademarks and service marks of Nasdaq, Inc. (together with its affiliates hereinafter referred to as the “Corporations”) and are licensed for use by First Trust. AlphaDEX® is a registered trademark owned by First Trust that has been licensed to Nasdaq, Inc. for use in the name of the Index. The Fund has not been passed on by the Corporations as to its legality or suitability. The Fund is not issued, endorsed, sold or promoted by the Corporations. THE CORPORATIONS MAKE NO WARRANTIES AND BEAR NO LIABILITY WITH RESPECT TO THE FUND.
Fund Performance Overview (Unaudited) (Continued)
First Trust Japan AlphaDEX® Fund (FJP) (Continued)
| Sector Allocation | % of Total
Long-Term
Investments |
| Industrials | 32.2% |
| Consumer Discretionary | 15.3 |
| Materials | 13.7 |
| Financials | 12.4 |
| Information Technology | 10.0 |
| Energy | 6.0 |
| Utilities | 4.7 |
| Communication Services | 2.9 |
| Health Care | 1.6 |
| Consumer Staples | 1.2 |
| Total | 100.0% |
| Top Ten Holdings | % of Total
Long-Term
Investments |
| Inpex Corp. | 2.5% |
| Kawasaki Kisen Kaisha Ltd. | 2.0 |
| Idemitsu Kosan Co., Ltd. | 1.9 |
| Mitsubishi Corp. | 1.9 |
| Mitsui & Co., Ltd. | 1.9 |
| Marubeni Corp. | 1.9 |
| Mitsui OSK Lines Ltd. | 1.8 |
| Mitsubishi Heavy Industries Ltd. | 1.8 |
| Nippon Yusen KK | 1.8 |
| Nippon Steel Corp. | 1.7 |
| Total | 19.2% |
Performance figures assume reinvestment of all distributions and do not reflect the deduction of taxes that a shareholder would pay on Fund distributions or the redemption or sale of Fund shares. An index is a statistical composite that tracks a specified financial market or sector. Unlike the Fund, the index does not actually hold a portfolio of securities and therefore does not incur the expenses incurred by the Fund. These expenses negatively impact the performance of the Fund. The Fund’s past performance does not predict future performance.
Frequency Distribution of Discounts and Premiums
Information showing the number of days the market price of the Fund’s shares was greater (at a premium) and less (at a discount) than the Fund’s net asset value for the most recently completed year, and the most recently completed calendar quarters since that year (or life of the Fund, if shorter), is available at https://www.ftportfolios.com/Retail/etf/home.aspx.
Fund Performance Overview (Unaudited) (Continued)
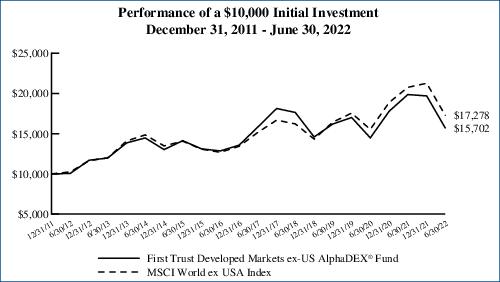
First Trust Developed Markets ex-US AlphaDEX® Fund (FDT)
The First Trust Developed Markets ex-US AlphaDEX® Fund (the “Fund”) seeks investment results that correspond generally to the price and yield (before the Fund’s fees and expenses) of an equity index called the Nasdaq AlphaDEX® Developed Markets Ex-US Index (the “Index”). The Fund will normally invest at least 90% of its net assets (including investment borrowings) in the common stocks, depositary receipts, real estate investment trusts and preferred shares that comprise the Index. The shares of the Fund are listed and trade on the Nasdaq under the ticker symbol “FDT.” The Fund commenced trading on April 19, 2011.
The Index employs the AlphaDEX® stock selection methodology which uses fundamental growth and value factors to objectively select stocks from the Nasdaq Developed Markets Ex-US Index which may generate positive alpha relative to traditional passive indices. The Index is a modified equal-dollar weighted index where higher ranked stocks receive a higher weight within the Index.
| Performance | | | | | | | | | |
| | | | Average Annual Total Returns | | Cumulative Total Returns |
| | 6 Months
Ended
6/30/22 | 1 Year
Ended
6/30/22 | 5 Years
Ended
6/30/22 | 10 Years
Ended
6/30/22 | Inception
(4/18/11)
to 6/30/22 | | 5 Years
Ended
6/30/22 | 10 Years
Ended
6/30/22 | Inception
(4/18/11)
to 6/30/22 |
| Fund Performance | | | | | | | | | |
| NAV | -20.27% | -20.93% | -0.14% | 4.56% | 1.95% | | -0.71% | 56.17% | 24.18% |
| Market Price | -19.74% | -20.42% | -0.08% | 4.59% | 2.01% | | -0.38% | 56.64% | 24.99% |
| Index Performance | | | | | | | | | |
| Nasdaq AlphaDEX® Developed Markets Ex-US Index(1) | -20.23% | -20.78% | 0.67% | N/A | N/A | | 3.42% | N/A | N/A |
| Nasdaq Developed Markets Ex-US Index(1) | -19.63% | -18.62% | 2.23% | N/A | N/A | | 11.65% | N/A | N/A |
| MSCI World ex USA Index | -18.76% | -16.76% | 2.66% | 5.37% | 3.54% | | 14.04% | 68.69% | 47.64% |
(See Notes to Fund Performance Overview Page 34.)
| (1) | Performance data is not available for all the periods shown in the table for the index because performance data does not exist for some of the entire periods. |
Nasdaq® and Nasdaq AlphaDEX® Developed Markets Ex-US Index are registered trademarks and service marks of Nasdaq, Inc. (together with its affiliates hereinafter referred to as the “Corporations”) and are licensed for use by First Trust. AlphaDEX® is a registered trademark owned by First Trust that has been licensed to Nasdaq, Inc. for use in the name of the Index. The Fund has not been passed on by the Corporations as to its legality or suitability. The Fund is not issued, endorsed, sold or promoted by the Corporations. THE CORPORATIONS MAKE NO WARRANTIES AND BEAR NO LIABILITY WITH RESPECT TO THE FUND.
Fund Performance Overview (Unaudited) (Continued)
First Trust Developed Markets ex-US AlphaDEX® Fund (FDT) (Continued)
| Sector Allocation | % of Total
Long-Term
Investments |
| Materials | 21.8% |
| Industrials | 17.7 |
| Energy | 14.8 |
| Financials | 13.5 |
| Consumer Discretionary | 9.5 |
| Real Estate | 6.9 |
| Consumer Staples | 4.3 |
| Utilities | 4.2 |
| Communication Services | 3.2 |
| Information Technology | 3.0 |
| Health Care | 1.1 |
| Total | 100.0% |
| Top Ten Holdings | % of Total
Long-Term
Investments |
| Cenovus Energy, Inc. | 0.8% |
| Suncor Energy, Inc. | 0.7 |
| MEG Energy Corp. | 0.7 |
| Crescent Point Energy Corp. | 0.7 |
| WH Group Ltd. | 0.7 |
| Imperial Oil Ltd. | 0.6 |
| Prosus N.V. | 0.6 |
| Nine Dragons Paper Holdings Ltd. | 0.6 |
| LG Corp. | 0.6 |
| ARC Resources Ltd. | 0.6 |
| Total | 6.6% |
Performance figures assume reinvestment of all distributions and do not reflect the deduction of taxes that a shareholder would pay on Fund distributions or the redemption or sale of Fund shares. An index is a statistical composite that tracks a specified financial market or sector. Unlike the Fund, the index does not actually hold a portfolio of securities and therefore does not incur the expenses incurred by the Fund. These expenses negatively impact the performance of the Fund. The Fund’s past performance does not predict future performance.
Frequency Distribution of Discounts and Premiums
Information showing the number of days the market price of the Fund’s shares was greater (at a premium) and less (at a discount) than the Fund’s net asset value for the most recently completed year, and the most recently completed calendar quarters since that year (or life of the Fund, if shorter), is available at https://www.ftportfolios.com/Retail/etf/home.aspx.
Fund Performance Overview (Unaudited) (Continued)
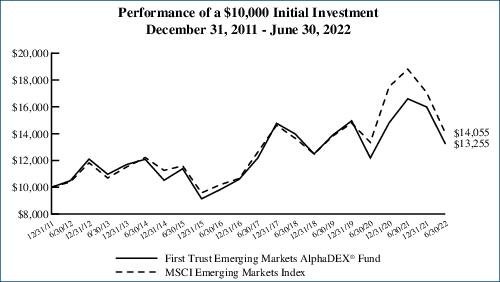
First Trust Emerging Markets AlphaDEX® Fund (FEM)
The First Trust Emerging Markets AlphaDEX® Fund (the “Fund”) seeks investment results that correspond generally to the price and yield (before the Fund’s fees and expenses) of an equity index called the Nasdaq AlphaDEX® Emerging Markets Index (the “Index”). The Fund will normally invest at least 90% of its net assets (including investment borrowings) in the common stocks, depositary receipts, real estate investment trusts and preferred shares that comprise the Index. The shares of the Fund are listed and trade on the Nasdaq under the ticker symbol “FEM.” The Fund commenced trading on April 19, 2011.
The Index employs the AlphaDEX® stock selection methodology which uses fundamental growth and value factors to objectively select stocks from the Nasdaq Emerging Markets Index which may generate positive alpha relative to traditional passive indices. The Index is a modified equal-dollar weighted index where higher ranked stocks receive a higher weight within the Index.
| Performance | | | | | | | | | |
| | | | Average Annual Total Returns | | Cumulative Total Returns |
| | 6 Months
Ended
6/30/22 | 1 Year
Ended
6/30/22 | 5 Years
Ended
6/30/22 | 10 Years
Ended
6/30/22 | Inception
(4/18/11)
to 6/30/22 | | 5 Years
Ended
6/30/22 | 10 Years
Ended
6/30/22 | Inception
(4/18/11)
to 6/30/22 |
| Fund Performance | | | | | | | | | |
| NAV | -17.10% | -20.16% | 1.71% | 2.37% | 0.16% | | 8.87% | 26.41% | 1.78% |
| Market Price | -15.90% | -19.23% | 1.81% | 2.42% | 0.23% | | 9.41% | 27.05% | 2.64% |
| Index Performance | | | | | | | | | |
| Nasdaq AlphaDEX® Emerging Markets Index(1) | -17.89% | -20.58% | 2.66% | N/A | N/A | | 14.05% | N/A | N/A |
| Nasdaq Emerging Markets Index(1) | -14.90% | -21.96% | 2.65% | N/A | N/A | | 13.97% | N/A | N/A |
| MSCI Emerging Markets Index | -17.63% | -25.28% | 2.18% | 3.06% | 1.10% | | 11.38% | 35.23% | 13.03% |
(See Notes to Fund Performance Overview Page 34.)
| (1) | Performance data is not available for all the periods shown in the table for the index because performance data does not exist for some of the entire periods. |
Nasdaq® and Nasdaq AlphaDEX® Emerging Markets Index are registered trademarks and service marks of Nasdaq, Inc. (together with its affiliates hereinafter referred to as the “Corporations”) and are licensed for use by First Trust. AlphaDEX® is a registered trademark owned by First Trust that has been licensed to Nasdaq, Inc. for use in the name of the Index. The Fund has not been passed on by the Corporations as to its legality or suitability. The Fund is not issued, endorsed, sold or promoted by the Corporations. THE CORPORATIONS MAKE NO WARRANTIES AND BEAR NO LIABILITY WITH RESPECT TO THE FUND.
Fund Performance Overview (Unaudited) (Continued)
First Trust Emerging Markets AlphaDEX® Fund (FEM) (Continued)
| Sector Allocation | % of Total
Long-Term
Investments |
| Materials | 22.1% |
| Industrials | 14.1 |
| Energy | 13.0 |
| Utilities | 11.2 |
| Financials | 10.4 |
| Information Technology | 10.1 |
| Consumer Discretionary | 7.2 |
| Real Estate | 4.3 |
| Consumer Staples | 3.6 |
| Communication Services | 3.0 |
| Health Care | 1.0 |
| Total | 100.0% |
| Top Ten Holdings | % of Total
Long-Term
Investments |
| BYD Electronic International Co., Ltd. | 1.7% |
| China Coal Energy Co., Ltd., Class H | 1.5 |
| Adaro Energy Indonesia Tbk PT | 1.4 |
| Naspers Ltd., Class N | 1.4 |
| Dongfeng Motor Group Co., Ltd., Class H | 1.3 |
| Cia Sud Americana de Vapores S.A. | 1.2 |
| Sasol Ltd. | 1.2 |
| Kunlun Energy Co., Ltd. | 1.2 |
| Greentown China Holdings Ltd. | 1.2 |
| Beijing Enterprises Holdings Ltd. | 1.2 |
| Total | 13.3% |
Performance figures assume reinvestment of all distributions and do not reflect the deduction of taxes that a shareholder would pay on Fund distributions or the redemption or sale of Fund shares. An index is a statistical composite that tracks a specified financial market or sector. Unlike the Fund, the index does not actually hold a portfolio of securities and therefore does not incur the expenses incurred by the Fund. These expenses negatively impact the performance of the Fund. The Fund’s past performance does not predict future performance.
Frequency Distribution of Discounts and Premiums
Information showing the number of days the market price of the Fund’s shares was greater (at a premium) and less (at a discount) than the Fund’s net asset value for the most recently completed year, and the most recently completed calendar quarters since that year (or life of the Fund, if shorter), is available at https://www.ftportfolios.com/Retail/etf/home.aspx.
Fund Performance Overview (Unaudited) (Continued)
First Trust Germany AlphaDEX® Fund (FGM)
The First Trust Germany AlphaDEX® Fund (the “Fund”) seeks investment results that correspond generally to the price and yield (before the Fund’s fees and expenses) of an equity index called the Nasdaq AlphaDEX® Germany Index (the “Index”). The Fund will normally invest at least 90% of its net assets (including investment borrowings) in the common stocks, depositary receipts, real estate investment trusts and preferred shares that comprise the Index. The shares of the Fund are listed and trade on the Nasdaq under the ticker symbol “FGM.” The Fund commenced trading on February 15, 2012.
The Index employs the AlphaDEX® stock selection methodology which uses fundamental growth and value factors to objectively select stocks from the Nasdaq Germany Index which may generate positive alpha relative to traditional passive indices. The Index is a modified equal-dollar weighted index where higher ranked stocks receive a higher weight within the Index.
| Performance | | | | | | | | | |
| | | | Average Annual Total Returns | | Cumulative Total Returns |
| | 6 Months
Ended
6/30/22 | 1 Year
Ended
6/30/22 | 5 Years
Ended
6/30/22 | 10 Years
Ended
6/30/22 | Inception
(2/14/12)
to 6/30/22 | | 5 Years
Ended
6/30/22 | 10 Years
Ended
6/30/22 | Inception
(2/14/12)
to 6/30/22 |
| Fund Performance | | | | | | | | | |
| NAV | -34.57% | -37.89% | -2.45% | 4.27% | 3.23% | | -11.67% | 51.93% | 39.11% |
| Market Price | -34.48% | -37.98% | -2.48% | 4.27% | 3.25% | | 11.80% | 51.96% | 39.29% |
| Index Performance | | | | | | | | | |
| Nasdaq AlphaDEX® Germany Index(1) | -34.81% | -38.05% | -2.13% | N/A | N/A | | -10.22% | N/A | N/A |
| Nasdaq Germany Index(1) | -28.36% | -31.82% | -3.12% | N/A | N/A | | -14.66% | N/A | N/A |
| MSCI Germany Index | -28.68% | -31.16% | -2.70% | 3.97% | 2.97% | | -12.78% | 47.62% | 35.42% |
(See Notes to Fund Performance Overview Page 34.)
| (1) | Performance data is not available for all the periods shown in the table for the index because performance data does not exist for some of the entire periods. |
Nasdaq® and Nasdaq AlphaDEX® Germany Index are registered trademarks and service marks of Nasdaq, Inc. (together with its affiliates hereinafter referred to as the “Corporations”) and are licensed for use by First Trust. AlphaDEX® is a registered trademark owned by First Trust that has been licensed to Nasdaq, Inc. for use in the name of the Index. The Fund has not been passed on by the Corporations as to its legality or suitability. The Fund is not issued, endorsed, sold or promoted by the Corporations. THE CORPORATIONS MAKE NO WARRANTIES AND BEAR NO LIABILITY WITH RESPECT TO THE FUND.
Fund Performance Overview (Unaudited) (Continued)
First Trust Germany AlphaDEX® Fund (FGM) (Continued)
| Sector Allocation | % of Total
Long-Term
Investments |
| Consumer Discretionary | 21.9% |
| Materials | 17.8 |
| Financials | 13.4 |
| Health Care | 11.8 |
| Real Estate | 8.9 |
| Utilities | 8.3 |
| Communication Services | 7.7 |
| Industrials | 5.7 |
| Information Technology | 4.5 |
| Total | 100.0% |
| Top Ten Holdings | % of Total
Long-Term
Investments |
| Talanx AG | 5.1% |
| Bayerische Motoren Werke AG | 5.0 |
| Porsche Automobil Holding SE (Preference Shares) | 4.5 |
| Aurubis AG | 4.4 |
| Hannover Rueck SE | 4.0 |
| E.ON SE | 3.9 |
| Mercedes-Benz Group AG | 3.9 |
| LEG Immobilien SE | 3.9 |
| HeidelbergCement AG | 3.7 |
| Covestro AG | 3.6 |
| Total | 42.0% |

Performance figures assume reinvestment of all distributions and do not reflect the deduction of taxes that a shareholder would pay on Fund distributions or the redemption or sale of Fund shares. An index is a statistical composite that tracks a specified financial market or sector. Unlike the Fund, the index does not actually hold a portfolio of securities and therefore does not incur the expenses incurred by the Fund. These expenses negatively impact the performance of the Fund. The Fund’s past performance does not predict future performance.
Frequency Distribution of Discounts and Premiums
Information showing the number of days the market price of the Fund’s shares was greater (at a premium) and less (at a discount) than the Fund’s net asset value for the most recently completed year, and the most recently completed calendar quarters since that year (or life of the Fund, if shorter), is available at https://www.ftportfolios.com/Retail/etf/home.aspx.
Fund Performance Overview (Unaudited) (Continued)
First Trust United Kingdom AlphaDEX® Fund (FKU)
The First Trust United Kingdom AlphaDEX® Fund (the “Fund”) seeks investment results that correspond generally to the price and yield (before the Fund’s fees and expenses) of an equity index called the Nasdaq AlphaDEX® United Kingdom Index (the “Index”). The Fund will normally invest at least 90% of its net assets (including investment borrowings) in the common stocks, depositary receipts, real estate investment trusts and preferred shares that comprise the Index. The shares of the Fund are listed and trade on the Nasdaq under the ticker symbol “FKU.” The Fund commenced trading on February 15, 2012.
The Index employs the AlphaDEX® stock selection methodology which uses fundamental growth and value factors to objectively select stocks from the Nasdaq United Kingdom Index which may generate positive alpha relative to traditional passive indices. The Index is a modified equal-dollar weighted index where higher ranked stocks receive a higher weight within the Index.
| Performance | | | | | | | | | |
| | | | Average Annual Total Returns | | Cumulative Total Returns |
| | 6 Months
Ended
6/30/22 | 1 Year
Ended
6/30/22 | 5 Years
Ended
6/30/22 | 10 Years
Ended
6/30/22 | Inception
(2/14/12)
to 6/30/22 | | 5 Years
Ended
6/30/22 | 10 Years
Ended
6/30/22 | Inception
(2/14/12)
to 6/30/22 |
| Fund Performance | | | | | | | | | |
| NAV | -26.00% | -24.31% | 0.82% | 4.09% | 3.67% | | 4.15% | 49.30% | 45.37% |
| Market Price | -26.36% | -24.78% | 0.81% | 4.00% | 3.68% | | 4.13% | 48.07% | 45.41% |
| Index Performance | | | | | | | | | |
| Nasdaq AlphaDEX® United Kingdom Index(1) | -25.89% | -23.68% | 1.90% | N/A | N/A | | 9.85% | N/A | N/A |
| Nasdaq United Kingdom Index(1) | -13.44% | -9.73% | 1.67% | N/A | N/A | | 8.65% | N/A | N/A |
| MSCI United Kingdom Index | -8.84% | -4.00% | 2.24% | 3.75% | 3.29% | | 11.74% | 44.50% | 39.84% |
(See Notes to Fund Performance Overview Page 34.)
| (1) | Performance data is not available for all the periods shown in the table for the index because performance data does not exist for some of the entire periods. |
Nasdaq® and Nasdaq AlphaDEX® United Kingdom Index are registered trademarks and service marks of Nasdaq, Inc. (together with its affiliates hereinafter referred to as the “Corporations”) and are licensed for use by First Trust. AlphaDEX® is a registered trademark owned by First Trust that has been licensed to Nasdaq, Inc. for use in the name of the Index. The Fund has not been passed on by the Corporations as to its legality or suitability. The Fund is not issued, endorsed, sold or promoted by the Corporations. THE CORPORATIONS MAKE NO WARRANTIES AND BEAR NO LIABILITY WITH RESPECT TO THE FUND.
Fund Performance Overview (Unaudited) (Continued)
First Trust United Kingdom AlphaDEX® Fund (FKU) (Continued)
| Sector Allocation | % of Total
Long-Term
Investments |
| Financials | 22.3% |
| Materials | 14.5 |
| Consumer Discretionary | 13.3 |
| Industrials | 12.2 |
| Communication Services | 10.3 |
| Consumer Staples | 9.4 |
| Utilities | 6.3 |
| Energy | 4.1 |
| Real Estate | 3.9 |
| Information Technology | 2.9 |
| Health Care | 0.8 |
| Total | 100.0% |
| Top Ten Holdings | % of Total
Long-Term
Investments |
| Investec PLC | 3.3% |
| Centrica PLC | 3.1 |
| Rio Tinto PLC | 2.8 |
| Anglo American PLC | 2.7 |
| BP PLC | 2.6 |
| Imperial Brands PLC | 2.5 |
| BT Group PLC | 2.4 |
| Frasers Group PLC | 2.4 |
| Endeavour Mining PLC | 2.3 |
| SSE PLC | 2.2 |
| Total | 26.3% |

Performance figures assume reinvestment of all distributions and do not reflect the deduction of taxes that a shareholder would pay on Fund distributions or the redemption or sale of Fund shares. An index is a statistical composite that tracks a specified financial market or sector. Unlike the Fund, the index does not actually hold a portfolio of securities and therefore does not incur the expenses incurred by the Fund. These expenses negatively impact the performance of the Fund. The Fund’s past performance does not predict future performance.
Frequency Distribution of Discounts and Premiums
Information showing the number of days the market price of the Fund’s shares was greater (at a premium) and less (at a discount) than the Fund’s net asset value for the most recently completed year, and the most recently completed calendar quarters since that year (or life of the Fund, if shorter), is available at https://www.ftportfolios.com/Retail/etf/home.aspx.
Fund Performance Overview (Unaudited) (Continued)
First Trust India NIFTY 50 Equal Weight ETF (NFTY)
The First Trust India NIFTY 50 Equal Weight ETF (the “Fund”) seeks investment results that correspond generally to the price and yield (before the Fund’s fees and expenses) of an equity index called the NIFTY 50 Equal Weight Index (the “Index”). The Fund will normally invest at least 90% of its net assets (including investment borrowings) in the common stocks that comprise the Index. The shares of the Fund are listed and trade on the Nasdaq under the ticker symbol “NFTY.” The Fund commenced trading on February 15, 2012.
The Index is an equally weighted total return index designed to provide diversified exposure to the NIFTY 50 Index, the main index for Indian equity securities. The NIFTY 50 Index is a market capitalization-weighted index comprising the 50 largest and most liquid Indian equity securities. All constituents of the NIFTY 50 Index will be included in the Index, but will be equally weighted.
| Performance | | | | | | | | | |
| | | | Average Annual Total Returns | | Cumulative Total Returns |
| | 6 Months
Ended
6/30/22 | 1 Year
Ended
6/30/22 | 5 Years
Ended
6/30/22 | 10 Years
Ended
6/30/22 | Inception
(2/14/12)
to 6/30/22 | | 5 Years
Ended
6/30/22 | 10 Years
Ended
6/30/22 | Inception
(2/14/12)
to 6/30/22 |
| Fund Performance | | | | | | | | | |
| NAV | -12.71% | -5.23% | 4.34% | 6.22% | 5.21% | | 23.68% | 82.88% | 69.40% |
| Market Price | -12.24% | -4.80% | 4.61% | 6.28% | 5.28% | | 25.29% | 83.87% | 70.57% |
| Index Performance | | | | | | | | | |
| NIFTY 50 Equal Weight Index* | -13.40% | -4.12% | N/A | N/A | N/A | | N/A | N/A | N/A |
| NIFTY 50 Index | -13.73% | -4.25% | 7.68% | 9.20% | 7.29% | | 44.77% | 141.13% | 107.44% |
(See Notes to Fund Performance Overview Page 34.)
| * | On April 17, 2018, the Fund’s underlying index changed from the NASDAQ AlphaDEX® Taiwan Index to the Index. On July 14, 2015, the Fund’s underlying index changed from the Defined Taiwan Index to the NASDAQ AlphaDEX® Taiwan Index. Therefore, the Fund’s performance and total returns shown for the periods prior to April 17, 2018, are not necessarily indicative of the performance that the Fund, based on the current index, would have generated. Since the Fund’s new underlying index had an inception date of September 29, 2017, it was not in existence for all the periods disclosed. |
The First Trust India NIFTY 50 Equal Weight ETF (the “Product”) offered by First Trust is not sponsored, endorsed, sold or promoted by NSE INDICES LIMITED (formerly known as India Index Services & Products Limited (IISL)). NSE INDICES LIMITED does not make any representation or warranty, express or implied (including warranties of merchantability or fitness for particular purpose or use) and disclaims all liability to the owners of the Product or any member of the public regarding the advisability of investing in securities generally or in the Product linked to the NIFTY 50 Equal Weight Index or particularly in the ability of the NIFTY 50 Equal Weight Index to track general stock market performance in India. Please read the full Disclaimers in relation to the NIFTY 50 Equal Weight Index in the Prospectus and Statement of Additional Information.
Fund Performance Overview (Unaudited) (Continued)
First Trust India NIFTY 50 Equal Weight ETF (NFTY) (Continued)
| Sector Allocation | % of Total
Long-Term
Investments |
| Financials | 21.8% |
| Materials | 16.0 |
| Consumer Discretionary | 13.9 |
| Health Care | 10.0 |
| Consumer Staples | 10.0 |
| Information Technology | 9.9 |
| Energy | 8.3 |
| Utilities | 4.1 |
| Industrials | 4.0 |
| Communication Services | 2.0 |
| Total | 100.0% |
| Top Ten Holdings | % of Total
Long-Term
Investments |
| Oil & Natural Gas Corp., Ltd. | 2.2% |
| Reliance Industries Ltd. | 2.1 |
| NTPC Ltd. | 2.1 |
| Hindalco Industries Ltd. | 2.1 |
| Coal India Ltd. | 2.1 |
| Dr. Reddy’s Laboratories Ltd. | 2.1 |
| Larsen & Toubro Ltd. | 2.0 |
| ITC Ltd. | 2.0 |
| State Bank of India | 2.0 |
| Mahindra & Mahindra Ltd. | 2.0 |
| Total | 20.7% |

Performance figures assume reinvestment of all distributions and do not reflect the deduction of taxes that a shareholder would pay on Fund distributions or the redemption or sale of Fund shares. An index is a statistical composite that tracks a specified financial market or sector. Unlike the Fund, the index does not actually hold a portfolio of securities and therefore does not incur the expenses incurred by the Fund. These expenses negatively impact the performance of the Fund. The Fund’s past performance does not predict future performance.
Frequency Distribution of Discounts and Premiums
Information showing the number of days the market price of the Fund’s shares was greater (at a premium) and less (at a discount) than the Fund’s net asset value for the most recently completed year, and the most recently completed calendar quarters since that year (or life of the Fund, if shorter), is available at https://www.ftportfolios.com/Retail/etf/home.aspx.
Fund Performance Overview (Unaudited) (Continued)
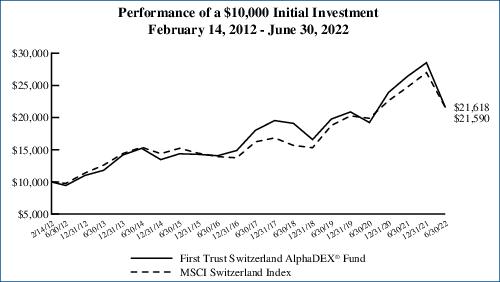
First Trust Switzerland AlphaDEX® Fund (FSZ)
The First Trust Switzerland AlphaDEX® Fund (the “Fund”) seeks investment results that correspond generally to the price and yield (before the Fund’s fees and expenses) of an equity index called the Nasdaq AlphaDEX® Switzerland Index (the “Index”). The Fund will normally invest at least 90% of its net assets (including investment borrowings) in the common stocks, depositary receipts, real estate investment trusts and preferred shares that comprise the Index. The shares of the Fund are listed and trade on the Nasdaq under the ticker symbol “FSZ.” The Fund commenced trading on February 15, 2012.
The Index employs the AlphaDEX® stock selection methodology which uses fundamental growth and value factors to objectively select stocks from the Nasdaq Switzerland Index which may generate positive alpha relative to traditional passive indices. The Index is a modified equal-dollar weighted index where higher ranked stocks receive a higher weight within the Index.
| Performance | | | | | | | | | |
| | | | Average Annual Total Returns | | Cumulative Total Returns |
| | 6 Months
Ended
6/30/22 | 1 Year
Ended
6/30/22 | 5 Years
Ended
6/30/22 | 10 Years
Ended
6/30/22 | Inception
(2/14/12)
to 6/30/22 | | 5 Years
Ended
6/30/22 | 10 Years
Ended
6/30/22 | Inception
(2/14/12)
to 6/30/22 |
| Fund Performance | | | | | | | | | |
| NAV | -24.23% | -18.10% | 3.69% | 8.63% | 7.72% | | 19.88% | 128.91% | 116.18% |
| Market Price | -23.72% | -17.65% | 3.73% | 8.66% | 7.76% | | 20.07% | 129.42% | 117.04% |
| Index Performance | | | | | | | | | |
| Nasdaq AlphaDEX® Switzerland Index(1) | -24.77% | -18.34% | 4.07% | N/A | N/A | | 22.05% | N/A | N/A |
| Nasdaq Switzerland Index(1) | -20.54% | -13.61% | 5.27% | N/A | N/A | | 29.26% | N/A | N/A |
| MSCI Switzerland Index | -19.99% | -12.68% | 5.88% | 8.25% | 7.70% | | 33.05% | 121.00% | 115.90% |
(See Notes to Fund Performance Overview Page 34.)
| (1) | Performance data is not available for all the periods shown in the table for the index because performance data does not exist for some of the entire periods. |
Nasdaq® and Nasdaq AlphaDEX® Switzerland Index are registered trademarks and service marks of Nasdaq, Inc. (together with its affiliates hereinafter referred to as the “Corporations”) and are licensed for use by First Trust. AlphaDEX® is a registered trademark owned by First Trust that has been licensed to Nasdaq, Inc. for use in the name of the Index. The Fund has not been passed on by the Corporations as to its legality or suitability. The Fund is not issued, endorsed, sold or promoted by the Corporations. THE CORPORATIONS MAKE NO WARRANTIES AND BEAR NO LIABILITY WITH RESPECT TO THE FUND.
Fund Performance Overview (Unaudited) (Continued)
First Trust Switzerland AlphaDEX® Fund (FSZ) (Continued)
| Sector Allocation | % of Total
Long-Term
Investments |
| Financials | 24.0% |
| Industrials | 18.0 |
| Materials | 14.3 |
| Health Care | 13.1 |
| Real Estate | 8.9 |
| Consumer Staples | 6.1 |
| Consumer Discretionary | 5.6 |
| Communication Services | 4.3 |
| Utilities | 3.6 |
| Information Technology | 2.1 |
| Total | 100.0% |
| Top Ten Holdings | % of Total
Long-Term
Investments |
| Clariant AG | 5.1% |
| PSP Swiss Property AG | 5.0 |
| Holcim AG | 4.7 |
| Helvetia Holding AG | 4.4 |
| Swisscom AG | 4.3 |
| SFS Group AG | 4.1 |
| UBS Group AG | 4.0 |
| Swiss Prime Site AG | 4.0 |
| Cie Financiere Richemont S.A., Class A | 3.9 |
| BKW AG | 3.6 |
| Total | 43.1% |
Performance figures assume reinvestment of all distributions and do not reflect the deduction of taxes that a shareholder would pay on Fund distributions or the redemption or sale of Fund shares. An index is a statistical composite that tracks a specified financial market or sector. Unlike the Fund, the index does not actually hold a portfolio of securities and therefore does not incur the expenses incurred by the Fund. These expenses negatively impact the performance of the Fund. The Fund’s past performance does not predict future performance.
Frequency Distribution of Discounts and Premiums
Information showing the number of days the market price of the Fund’s shares was greater (at a premium) and less (at a discount) than the Fund’s net asset value for the most recently completed year, and the most recently completed calendar quarters since that year (or life of the Fund, if shorter), is available at https://www.ftportfolios.com/Retail/etf/home.aspx.
Fund Performance Overview (Unaudited) (Continued)
First Trust Developed Markets ex-US Small Cap AlphaDEX® Fund (FDTS)
The First Trust Developed Markets ex-US Small Cap AlphaDEX® Fund (the “Fund”) seeks investment results that correspond generally to the price and yield (before the Fund’s fees and expenses) of an equity index called the Nasdaq AlphaDEX® Developed Markets Ex-US Small Cap Index (the “Index”). The Fund will normally invest at least 90% of its net assets (including investment borrowings) in the common stocks, depositary receipts, real estate investment trusts and preferred shares that comprise the Index. The shares of the Fund are listed and trade on the Nasdaq under the ticker symbol “FDTS.” The Fund commenced trading on February 16, 2012.
The Index employs the AlphaDEX® stock selection methodology which uses fundamental growth and value factors to objectively select stocks from the Nasdaq Developed Markets Ex-US Small Cap Index which may generate positive alpha relative to traditional passive indices. The Index is a modified equal-dollar weighted index where higher ranked stocks receive a higher weight within the Index.
| Performance | | | | | | | | | |
| | | | Average Annual Total Returns | | Cumulative Total Returns |
| | 6 Months
Ended
6/30/22 | 1 Year
Ended
6/30/22 | 5 Years
Ended
6/30/22 | 10 Years
Ended
6/30/22 | Inception
(2/15/12)
to 6/30/22 | | 5 Years
Ended
6/30/22 | 10 Years
Ended
6/30/22 | Inception
(2/15/12)
to 6/30/22 |
| Fund Performance | | | | | | | | | |
| NAV | -20.05% | -21.36% | 1.27% | 5.41% | 4.12% | | 6.50% | 69.31% | 51.98% |
| Market Price | -19.57% | -21.17% | 1.43% | 5.53% | 4.14% | | 7.36% | 71.33% | 52.27% |
| Index Performance | | | | | | | | | |
| Nasdaq AlphaDEX® Developed Markets Ex-US Small Cap Index(1) | -20.14% | -21.23% | 2.14% | N/A | N/A | | 11.16% | N/A | N/A |
| Nasdaq Developed Markets Ex-US Small Cap Index(1) | -21.55% | -22.70% | 0.59% | N/A | N/A | | 2.97% | N/A | N/A |
| MSCI World ex-USA Small Cap Index | -23.87% | -23.02% | 2.16% | 6.70% | 5.66% | | 11.29% | 91.20% | 77.01% |
(See Notes to Fund Performance Overview Page 34.)
| (1) | Performance data is not available for all the periods shown in the table for the index because performance data does not exist for some of the entire periods. |
Nasdaq® and Nasdaq AlphaDEX® Developed Markets Ex-US Small Cap Index are registered trademarks and service marks of Nasdaq, Inc. (together with its affiliates hereinafter referred to as the “Corporations”) and are licensed for use by First Trust. AlphaDEX® is a registered trademark owned by First Trust that has been licensed to Nasdaq, Inc. for use in the name of the Index. The Fund has not been passed on by the Corporations as to its legality or suitability. The Fund is not issued, endorsed, sold or promoted by the Corporations. THE CORPORATIONS MAKE NO WARRANTIES AND BEAR NO LIABILITY WITH RESPECT TO THE FUND.
Fund Performance Overview (Unaudited) (Continued)
First Trust Developed Markets ex-US Small Cap AlphaDEX® Fund (FDTS) (Continued)
| Sector Allocation | % of Total
Long-Term
Investments |
| Materials | 21.7% |
| Energy | 17.5 |
| Industrials | 15.7 |
| Consumer Discretionary | 12.3 |
| Information Technology | 8.2 |
| Real Estate | 6.6 |
| Financials | 6.1 |
| Communication Services | 3.7 |
| Consumer Staples | 3.5 |
| Health Care | 3.0 |
| Utilities | 1.7 |
| Total | 100.0% |
| Top Ten Holdings | % of Total
Long-Term
Investments |
| OCI Co., Ltd. | 0.6% |
| Cosmo Energy Holdings Co., Ltd. | 0.6 |
| Baytex Energy Corp. | 0.6 |
| Toho Titanium Co., Ltd. | 0.6 |
| DL Holdings Co., Ltd. | 0.5 |
| Whitehaven Coal Ltd. | 0.5 |
| BW LPG Ltd. | 0.5 |
| Grange Resources Ltd. | 0.5 |
| Enerplus Corp. | 0.5 |
| Sembcorp Industries Ltd. | 0.5 |
| Total | 5.4% |

Performance figures assume reinvestment of all distributions and do not reflect the deduction of taxes that a shareholder would pay on Fund distributions or the redemption or sale of Fund shares. An index is a statistical composite that tracks a specified financial market or sector. Unlike the Fund, the index does not actually hold a portfolio of securities and therefore does not incur the expenses incurred by the Fund. These expenses negatively impact the performance of the Fund. The Fund’s past performance does not predict future performance.
Frequency Distribution of Discounts and Premiums
Information showing the number of days the market price of the Fund’s shares was greater (at a premium) and less (at a discount) than the Fund’s net asset value for the most recently completed year, and the most recently completed calendar quarters since that year (or life of the Fund, if shorter), is available at https://www.ftportfolios.com/Retail/etf/home.aspx.
Fund Performance Overview (Unaudited) (Continued)
First Trust Emerging Markets Small Cap AlphaDEX® Fund (FEMS)
The First Trust Emerging Markets Small Cap AlphaDEX® Fund (the “Fund”) seeks investment results that correspond generally to the price and yield (before the Fund’s fees and expenses) of an equity index called the Nasdaq AlphaDEX® Emerging Markets Small Cap Index (the “Index”). The Fund will normally invest at least 90% of its net assets (including investment borrowings) in the common stocks, depositary receipts, real estate investment trusts and preferred shares that comprise the Index. The shares of the Fund are listed and trade on the Nasdaq under the ticker symbol “FEMS.” The Fund commenced trading on February 16, 2012.
The Index employs the AlphaDEX® stock selection methodology which uses fundamental growth and value factors to objectively select stocks from the Nasdaq Emerging Markets Small Cap Index which may generate positive alpha relative to traditional passive indices. The Index is a modified equal-dollar weighted index where higher ranked stocks receive a higher weight within the Index.
| Performance | | | | | | | | | |
| | | | Average Annual Total Returns | | Cumulative Total Returns |
| | 6 Months
Ended
6/30/22 | 1 Year
Ended
6/30/22 | 5 Years
Ended
6/30/22 | 10 Years
Ended
6/30/22 | Inception
(2/15/12)
to 6/30/22 | | 5 Years
Ended
6/30/22 | 10 Years
Ended
6/30/22 | Inception
(2/15/12)
to 6/30/22 |
| Fund Performance | | | | | | | | | |
| NAV | -11.76% | -20.93% | 3.62% | 6.32% | 5.01% | | 19.46% | 84.63% | 65.99% |
| Market Price | -11.11% | -20.47% | 3.66% | 6.30% | 5.07% | | 19.70% | 84.18% | 66.92% |
| Index Performance | | | | | | | | | |
| Nasdaq AlphaDEX® Emerging Markets Small Cap Index(1) | -11.51% | -20.34% | 5.29% | N/A | N/A | | 29.40% | N/A | N/A |
| Nasdaq Emerging Markets Small Cap Index(1) | -15.75% | -18.04% | 3.75% | N/A | N/A | | 20.23% | N/A | N/A |
| MSCI Emerging Markets Small Cap Index | -20.03% | -20.72% | 3.48% | 4.31% | 3.14% | | 18.65% | 52.48% | 37.80% |
(See Notes to Fund Performance Overview Page 34.)
| (1) | Performance data is not available for all the periods shown in the table for the index because performance data does not exist for some of the entire periods. |
Nasdaq® and Nasdaq AlphaDEX® Emerging Markets Small Cap Index are registered trademarks and service marks of Nasdaq, Inc. (together with its affiliates hereinafter referred to as the “Corporations”) and are licensed for use by First Trust. AlphaDEX® is a registered trademark owned by First Trust that has been licensed to Nasdaq, Inc. for use in the name of the Index. The Fund has not been passed on by the Corporations as to its legality or suitability. The Fund is not issued, endorsed, sold or promoted by the Corporations. THE CORPORATIONS MAKE NO WARRANTIES AND BEAR NO LIABILITY WITH RESPECT TO THE FUND.
Fund Performance Overview (Unaudited) (Continued)
First Trust Emerging Markets Small Cap AlphaDEX® Fund (FEMS) (Continued)
| Sector Allocation | % of Total
Long-Term
Investments |
| Materials | 19.6% |
| Industrials | 18.4 |
| Information Technology | 11.3 |
| Energy | 10.0 |
| Consumer Discretionary | 9.8 |
| Real Estate | 8.8 |
| Utilities | 6.3 |
| Consumer Staples | 5.8 |
| Financials | 3.7 |
| Communication Services | 3.5 |
| Health Care | 2.8 |
| Total | 100.0% |
| Top Ten Holdings | % of Total
Long-Term
Investments |
| Inner Mongolia Yitai Coal Co., Ltd., Class B | 1.4% |
| Pegasus Hava Tasimaciligi A.S. | 1.3 |
| Turk Hava Yollari AO | 1.2 |
| Turkiye Sise ve Cam Fabrikalari A.S. | 1.2 |
| Aygaz A.S. | 1.2 |
| Aksa Akrilik Kimya Sanayii A.S. | 1.1 |
| Turkiye Petrol Rafinerileri A.S. | 1.0 |
| Semirara Mining & Power Corp. | 1.0 |
| Arcelik A.S. | 1.0 |
| Indo Tambangraya Megah Tbk PT | 1.0 |
| Total | 11.4% |

Performance figures assume reinvestment of all distributions and do not reflect the deduction of taxes that a shareholder would pay on Fund distributions or the redemption or sale of Fund shares. An index is a statistical composite that tracks a specified financial market or sector. Unlike the Fund, the index does not actually hold a portfolio of securities and therefore does not incur the expenses incurred by the Fund. These expenses negatively impact the performance of the Fund. The Fund’s past performance does not predict future performance.
Frequency Distribution of Discounts and Premiums
Information showing the number of days the market price of the Fund’s shares was greater (at a premium) and less (at a discount) than the Fund’s net asset value for the most recently completed year, and the most recently completed calendar quarters since that year (or life of the Fund, if shorter), is available at https://www.ftportfolios.com/Retail/etf/home.aspx.
Fund Performance Overview (Unaudited) (Continued)
First Trust Eurozone AlphaDEX® ETF (FEUZ)
The First Trust Eurozone AlphaDEX® ETF (the “Fund”) seeks investment results that correspond generally to the price and yield (before the Fund’s fees and expenses) of an equity index called the Nasdaq AlphaDEX® Eurozone Index (the “Index”). The Fund will normally invest at least 90% of its net assets (including investment borrowings) in the common stocks, depositary receipts, real estate investment trusts and preferred shares that comprise the Index. The shares of the Fund are listed and trade on the Nasdaq under the ticker symbol “FEUZ.” The Fund commenced trading on October 22, 2014.
The Index employs the AlphaDEX® stock selection methodology which uses fundamental growth and value factors to objectively select stocks from the Nasdaq Eurozone Index which may generate positive alpha relative to traditional passive indices. The Index is a modified equal-dollar weighted index where higher ranked stocks receive a higher weight within the Index.
| Performance | | | | | | | |
| | | | Average Annual Total Returns | | Cumulative Total Returns |
| | 6 Months
Ended
6/30/22 | 1 Year
Ended
6/30/22 | 5 Years
Ended
6/30/22 | Inception
(10/21/14)
to 6/30/22 | | 5 Years
Ended
6/30/22 | Inception
(10/21/14)
to 6/30/22 |
| Fund Performance | | | | | | | |
| NAV | -24.89% | -23.89% | -0.40% | 3.44% | | -2.00% | 29.75% |
| Market Price | -24.21% | -23.86% | -0.51% | 3.48% | | -2.54% | 30.08% |
| Index Performance | | | | | | | |
| Nasdaq AlphaDEX® Eurozone Index | -25.06% | -23.89% | 0.12% | 3.95% | | 0.62% | 34.68% |
| Nasdaq Eurozone Index | -24.84% | -23.86% | 0.27% | 2.74% | | 1.38% | 23.08% |
| MSCI EMU Index | -25.23% | -24.02% | 0.48% | 2.57% | | 2.40% | 21.53% |
(See Notes to Fund Performance Overview Page 34.)
Nasdaq® and Nasdaq AlphaDEX® Eurozone Index are registered trademarks and service marks of Nasdaq, Inc. (together with its affiliates hereinafter referred to as the “Corporations”) and are licensed for use by First Trust. AlphaDEX® is a registered trademark owned by First Trust that has been licensed to Nasdaq, Inc. for use in the name of the Index. The Fund has not been passed on by the Corporations as to its legality or suitability. The Fund is not issued, endorsed, sold or promoted by the Corporations. THE CORPORATIONS MAKE NO WARRANTIES AND BEAR NO LIABILITY WITH RESPECT TO THE FUND.
Fund Performance Overview (Unaudited) (Continued)
First Trust Eurozone AlphaDEX® ETF (FEUZ) (Continued)
| Sector Allocation | % of Total
Long-Term
Investments |
| Financials | 21.2% |
| Materials | 14.6 |
| Consumer Discretionary | 13.4 |
| Industrials | 11.6 |
| Energy | 8.8 |
| Utilities | 8.6 |
| Communication Services | 6.5 |
| Real Estate | 5.4 |
| Health Care | 4.9 |
| Consumer Staples | 3.8 |
| Information Technology | 1.2 |
| Total | 100.0% |
| Top Ten Holdings | % of Total
Long-Term
Investments |
| Prosus N.V. | 1.6% |
| Repsol S.A. | 1.5 |
| TotalEnergies SE | 1.4 |
| Leonardo S.p.A. | 1.4 |
| Bank of Ireland Group PLC | 1.3 |
| OCI N.V. | 1.2 |
| Jeronimo Martins SGPS S.A. | 1.2 |
| Bayerische Motoren Werke AG | 1.2 |
| Rheinmetall AG | 1.2 |
| Tenaris S.A. | 1.1 |
| Total | 13.1% |

Performance figures assume reinvestment of all distributions and do not reflect the deduction of taxes that a shareholder would pay on Fund distributions or the redemption or sale of Fund shares. An index is a statistical composite that tracks a specified financial market or sector. Unlike the Fund, the indices do not actually hold a portfolio of securities and therefore do not incur the expenses incurred by the Fund. These expenses negatively impact the performance of the Fund. The Fund’s past performance does not predict future performance.
Frequency Distribution of Discounts and Premiums
Information showing the number of days the market price of the Fund’s shares was greater (at a premium) and less (at a discount) than the Fund’s net asset value for the most recently completed year, and the most recently completed calendar quarters since that year (or life of the Fund, if shorter), is available at https://www.ftportfolios.com/Retail/etf/home.aspx.
Notes to Fund Performance Overview (Unaudited)
Total returns for the periods since inception are calculated from the inception date of each Fund. “Average Annual Total Returns” represent the average annual change in value of an investment over the periods indicated. “Cumulative Total Returns” represent the total change in value of an investment over the periods indicated.
Each Fund’s per share net asset value (“NAV”) is the value of one share of the Fund and is computed by dividing the value of all assets of the Fund (including accrued interest and dividends), less all liabilities (including accrued expenses and dividends declared but unpaid), by the total number of outstanding shares. The price used to calculate market return (“Market Price”) is determined by using the midpoint of the national best bid and offer price (“NBBO”) as of the time that the Fund’s NAV is calculated. Under SEC rules, the NBBO consists of the highest displayed buy and lowest sell prices among the various exchanges trading the Fund at the time the Fund’s NAV is calculated. Prior to January 1, 2019, the price used was the midpoint between the highest bid and the lowest offer on the stock exchange on which shares of the Fund were listed for trading as of the time that the Fund’s NAV was calculated. Since shares of each Fund did not trade in the secondary market until after the Fund’s inception, for the period from inception to the first day of secondary market trading in shares of the Fund, the NAV of each Fund is used as a proxy for the secondary market trading price to calculate market returns. NAV and market returns assume that all distributions have been reinvested in each Fund at NAV and Market Price, respectively.
An index is a statistical composite that tracks a specified financial market or sector. Unlike each Fund, the indices do not actually hold a portfolio of securities and therefore do not incur the expenses incurred by each Fund. These expenses negatively impact the performance of each Fund. Also, market returns do not include brokerage commissions that may be payable on secondary market transactions. If brokerage commissions were included, market returns would be lower. The total returns presented reflect the reinvestment of dividends on securities in the indices. The returns presented do not reflect the deduction of taxes that a shareholder would pay on Fund distributions or the redemption or sale of Fund shares. The investment return and principal value of shares of each Fund will vary with changes in market conditions. Shares of each Fund may be worth more or less than their original cost when they are redeemed or sold in the market. Each Fund’s past performance is no guarantee of future performance.
First Trust Exchange-Traded AlphaDEX® Fund II
Understanding Your Fund Expenses
June 30, 2022 (Unaudited)
As a shareholder of First Trust Asia Pacific ex-Japan AlphaDEX® Fund, First Trust Europe AlphaDEX® Fund, First Trust Latin America AlphaDEX® Fund, First Trust Brazil AlphaDEX® Fund, First Trust China AlphaDEX® Fund, First Trust Japan AlphaDEX® Fund, First Trust Developed Markets ex-US AlphaDEX® Fund, First Trust Emerging Markets AlphaDEX® Fund, First Trust Germany AlphaDEX® Fund, First Trust United Kingdom AlphaDEX® Fund, First Trust India NIFTY 50 Equal Weight ETF, First Trust Switzerland AlphaDEX® Fund, First Trust Developed Markets ex-US Small Cap AlphaDEX® Fund, First Trust Emerging Markets Small Cap AlphaDEX® Fund or First Trust Eurozone AlphaDEX® ETF (each a “Fund” and collectively, the “Funds”), you incur two types of costs: (1) transaction costs; and (2) ongoing costs, including management fees, distribution and/or service (12b-1) fees, if any, and other Fund expenses. This Example is intended to help you understand your ongoing costs (in U.S. dollars) of investing in the Funds and to compare these costs with the ongoing costs of investing in other funds.
The Example is based on an investment of $1,000 invested at the beginning of the period and held through the six-month period ended June 30, 2022.
Actual Expenses
The first line in the following table provides information about actual account values and actual expenses. You may use the information in this line, together with the amount you invested, to estimate the expenses that you paid over the period. Simply divide your account value by $1,000 (for example, an $8,600 account value divided by $1,000 = 8.6), then multiply the result by the number in the first line under the heading entitled “Expenses Paid During the Six-Month Period” to estimate the expenses you paid on your account during this six-month period.
Hypothetical Example for Comparison Purposes
The second line in the following table provides information about hypothetical account values and hypothetical expenses based on each Fund’s actual expense ratio and an assumed rate of return of 5% per year before expenses, which is not each Fund’s actual return. The hypothetical account values and expenses may not be used to estimate the actual ending account balance or expenses you paid for the period. You may use this information to compare the ongoing costs of investing in the Funds and other funds. To do so, compare this 5% hypothetical example with the 5% hypothetical examples that appear in the shareholder reports of the other funds.
Please note that the expenses shown in the table are meant to highlight your ongoing costs only and do not reflect any transactional costs such as brokerage commissions. Therefore, the second line in the table is useful in comparing ongoing costs only, and will not help you determine the relative total costs of owning different funds. In addition, if these transactional costs were included, your costs would have been higher.
| | Beginning
Account Value
January 1, 2022 | Ending
Account Value
June 30, 2022 | Annualized
Expense Ratio
Based on the
Six-Month
Period | Expenses Paid
During the
Six-Month
Period (a) |
| First Trust Asia Pacific ex-Japan AlphaDEX® Fund (FPA) |
| Actual | $1,000.00 | $843.30 | 0.80% | $3.66 |
| Hypothetical (5% return before expenses) | $1,000.00 | $1,020.83 | 0.80% | $4.01 |
| First Trust Europe AlphaDEX® Fund (FEP) |
| Actual | $1,000.00 | $738.70 | 0.80% | $3.45 |
| Hypothetical (5% return before expenses) | $1,000.00 | $1,020.83 | 0.80% | $4.01 |
| First Trust Latin America AlphaDEX® Fund (FLN) |
| Actual | $1,000.00 | $970.50 | 0.80% | $3.91 |
| Hypothetical (5% return before expenses) | $1,000.00 | $1,020.83 | 0.80% | $4.01 |
| First Trust Brazil AlphaDEX® Fund (FBZ) |
| Actual | $1,000.00 | $929.30 | 0.80% | $3.83 |
| Hypothetical (5% return before expenses) | $1,000.00 | $1,020.83 | 0.80% | $4.01 |
| First Trust China AlphaDEX® Fund (FCA) |
| Actual | $1,000.00 | $943.20 | 0.80% | $3.85 |
| Hypothetical (5% return before expenses) | $1,000.00 | $1,020.83 | 0.80% | $4.01 |
First Trust Exchange-Traded AlphaDEX® Fund II
Understanding Your Fund Expenses (Continued)
June 30, 2022 (Unaudited)
| | Beginning
Account Value
January 1, 2022 | Ending
Account Value
June 30, 2022 | Annualized
Expense Ratio
Based on the
Six-Month
Period | Expenses Paid
During the
Six-Month
Period (a) |
| First Trust Japan AlphaDEX® Fund (FJP) |
| Actual | $1,000.00 | $838.50 | 0.80% | $3.65 |
| Hypothetical (5% return before expenses) | $1,000.00 | $1,020.83 | 0.80% | $4.01 |
| First Trust Developed Markets ex-US AlphaDEX® Fund (FDT) |
| Actual | $1,000.00 | $797.30 | 0.80% | $3.57 |
| Hypothetical (5% return before expenses) | $1,000.00 | $1,020.83 | 0.80% | $4.01 |
| First Trust Emerging Markets AlphaDEX® Fund (FEM) |
| Actual | $1,000.00 | $829.00 | 0.80% | $3.63 |
| Hypothetical (5% return before expenses) | $1,000.00 | $1,020.83 | 0.80% | $4.01 |
| First Trust Germany AlphaDEX® Fund (FGM) |
| Actual | $1,000.00 | $654.30 | 0.80% | $3.28 |
| Hypothetical (5% return before expenses) | $1,000.00 | $1,020.83 | 0.80% | $4.01 |
| First Trust United Kingdom AlphaDEX® Fund (FKU) |
| Actual | $1,000.00 | $740.00 | 0.80% | $3.45 |
| Hypothetical (5% return before expenses) | $1,000.00 | $1,020.83 | 0.80% | $4.01 |
| First Trust India NIFTY 50 Equal Weight ETF (NFTY) |
| Actual | $1,000.00 | $872.90 | 0.80% | $3.72 |
| Hypothetical (5% return before expenses) | $1,000.00 | $1,020.83 | 0.80% | $4.01 |
| First Trust Switzerland AlphaDEX® Fund (FSZ) |
| Actual | $1,000.00 | $757.70 | 0.80% | $3.49 |
| Hypothetical (5% return before expenses) | $1,000.00 | $1,020.83 | 0.80% | $4.01 |
| First Trust Developed Markets ex-US Small Cap AlphaDEX® Fund (FDTS) |
| Actual | $1,000.00 | $799.50 | 0.80% | $3.57 |
| Hypothetical (5% return before expenses) | $1,000.00 | $1,020.83 | 0.80% | $4.01 |
| First Trust Emerging Markets Small Cap AlphaDEX® Fund (FEMS) |
| Actual | $1,000.00 | $882.40 | 0.80% | $3.73 |
| Hypothetical (5% return before expenses) | $1,000.00 | $1,020.83 | 0.80% | $4.01 |
| First Trust Eurozone AlphaDEX® ETF (FEUZ) |
| Actual | $1,000.00 | $751.10 | 0.80% | $3.47 |
| Hypothetical (5% return before expenses) | $1,000.00 | $1,020.83 | 0.80% | $4.01 |
| (a) | Expenses are equal to the annualized expense ratios as indicated in the table multiplied by the average account value over the period (January 1, 2022 through June 30, 2022), multiplied by 181/365 (to reflect the six-month period). |
First Trust Asia Pacific ex-Japan AlphaDEX® Fund (FPA)
Portfolio of Investments
June 30, 2022 (Unaudited)
| Shares | | Description | | Value |
| COMMON STOCKS (a) – 95.0% |
| | | Australia – 27.2% | | |
| 23,999 | | Allkem Ltd. (b) | | $170,788 |
| 5,118 | | ALS Ltd. | | 37,729 |
| 11,191 | | Ampol Ltd. | | 264,413 |
| 55,755 | | Aurizon Holdings Ltd. | | 146,243 |
| 5,953 | | BHP Group Ltd. | | 169,499 |
| 16,438 | | BlueScope Steel Ltd. | | 180,407 |
| 44,531 | | Cleanaway Waste Management Ltd. | | 77,459 |
| 8,329 | | Computershare Ltd. | | 141,658 |
| 9,958 | | Fortescue Metals Group Ltd. | | 120,493 |
| 38,455 | | Harvey Norman Holdings Ltd. | | 98,477 |
| 4,878 | | IGO Ltd. | | 33,468 |
| 72,378 | | Incitec Pivot Ltd. | | 165,364 |
| 2,530 | | JB Hi-Fi Ltd. | | 67,164 |
| 19,120 | | Lynas Rare Earths Ltd. (b) | | 115,215 |
| 2,602 | | Mineral Resources Ltd. | | 86,694 |
| 25,541 | | Northern Star Resources Ltd. | | 120,587 |
| 8,599 | | Orica Ltd. | | 93,602 |
| 44,031 | | Origin Energy Ltd. | | 174,148 |
| 5,143 | | OZ Minerals Ltd. | | 63,047 |
| 64,292 | | Pilbara Minerals Ltd. (b) | | 101,625 |
| 11,927 | | QBE Insurance Group Ltd. | | 100,026 |
| 2,303 | | Rio Tinto Ltd. | | 163,257 |
| 12,933 | | Seven Group Holdings Ltd. | | 148,277 |
| 1,933 | | Sonic Healthcare Ltd. | | 44,044 |
| 68,305 | | South32 Ltd. | | 185,761 |
| 78,297 | | Tabcorp Holdings Ltd. | | 57,557 |
| 10,682 | | Woodside Energy Group Ltd. | | 234,764 |
| 1,841 | | Woolworths Group Ltd. | | 45,239 |
| 15,936 | | Worley Ltd. | | 156,637 |
| | | | | 3,563,642 |
| | | Bermuda – 5.6% | | |
| 148,907 | | Hopson Development Holdings Ltd. | | 227,342 |
| 91,000 | | Kerry Properties Ltd. | | 252,816 |
| 294,735 | | Nine Dragons Paper Holdings Ltd. | | 249,406 |
| | | | | 729,564 |
| | | Cayman Islands – 6.2% | | |
| 5,100 | | ASMPT Ltd. | | 43,319 |
| 15,245 | | CK Asset Holdings Ltd. | | 107,827 |
| 27,844 | | CK Hutchison Holdings Ltd. | | 188,245 |
| 114,496 | | Shimao Group Holdings Ltd. (c) (d) | | 64,494 |
| 325,866 | | WH Group Ltd. (e) (f) | | 251,663 |
| 63,201 | | Xinyi Glass Holdings Ltd. | | 151,583 |
| | | | | 807,131 |
| | | Hong Kong – 3.3% | | |
| 91,000 | | PCCW Ltd. | | 48,128 |
| 159,105 | | Sino Land Co., Ltd. | | 234,801 |
| 8,446 | | Sun Hung Kai Properties Ltd. | | 99,779 |
| Shares | | Description | | Value |
|
| | | Hong Kong (Continued) | | |
| 8,500 | | Swire Pacific Ltd., Class A | | $50,641 |
| | | | | 433,349 |
| | | New Zealand – 1.7% | | |
| 3,571 | | EBOS Group Ltd. | | 87,003 |
| 26,924 | | Infratil Ltd. | | 129,142 |
| | | | | 216,145 |
| | | Singapore – 9.4% | | |
| 27,300 | | City Developments Ltd. | | 160,149 |
| 13,900 | | Jardine Cycle & Carriage Ltd. | | 283,043 |
| 54,300 | | Keppel Corp., Ltd. | | 253,658 |
| 79,625 | | Olam Group Ltd. | | 87,116 |
| 16,900 | | Singapore Technologies Engineering Ltd. | | 49,631 |
| 4,400 | | United Overseas Bank Ltd. | | 83,135 |
| 44,400 | | Wilmar International Ltd. | | 129,112 |
| 271,300 | | Yangzijiang Shipbuilding Holdings Ltd. | | 181,609 |
| | | | | 1,227,453 |
| | | South Korea – 41.6% | | |
| 338 | | CJ CheilJedang Corp. | | 98,661 |
| 1,822 | | Coway Co., Ltd. | | 89,669 |
| 4,465 | | DB Insurance Co., Ltd. | | 210,801 |
| 3,853 | | Hana Financial Group, Inc. | | 116,771 |
| 3,473 | | Hanwha Solutions Corp. (b) | | 101,376 |
| 10,707 | | HMM Co., Ltd. (g) | | 202,859 |
| 1,303 | | Hyundai Engineering & Construction Co., Ltd. | | 41,497 |
| 1,297 | | Hyundai Glovis Co., Ltd. | | 179,306 |
| 871 | | Hyundai Mobis Co., Ltd. | | 133,494 |
| 692 | | Hyundai Motor Co. | | 96,200 |
| 7,511 | | Hyundai Steel Co. | | 185,693 |
| 11,506 | | Industrial Bank of Korea | | 85,249 |
| 1,594 | | Kakao Games Corp. (b) (g) | | 60,340 |
| 2,241 | | Kangwon Land, Inc. (b) | | 43,840 |
| 3,055 | | KB Financial Group, Inc. | | 113,292 |
| 3,374 | | Kia Corp. | | 200,870 |
| 5,512 | | Korea Electric Power Corp. (b) | | 95,730 |
| 533 | | Korea Zinc Co., Ltd. | | 200,121 |
| 6,994 | | KT Corp. | | 196,343 |
| 773 | | KT&G Corp. | | 48,938 |
| 1,106 | | L&F Co., Ltd. (b) | | 178,882 |
| 117 | | LG Chem Ltd. | | 46,497 |
| 4,085 | | LG Corp. | | 245,087 |
| 12,091 | | LG Display Co., Ltd. (g) | | 135,493 |
| 806 | | LG Innotek Co., Ltd. | | 212,612 |
| 17,834 | | LG Uplus Corp. | | 175,126 |
| 1,490 | | Lotte Chemical Corp. | | 206,562 |
| 4,607 | | Meritz Financial Group, Inc. | | 91,721 |
| 6,577 | | Meritz Fire & Marine Insurance Co., Ltd. | | 167,920 |
| 7,292 | | Mirae Asset Securities Co., Ltd. | | 37,179 |
| 1,065 | | POSCO Holdings, Inc. | | 189,065 |
See Notes to Financial Statements
Page 37
First Trust Asia Pacific ex-Japan AlphaDEX® Fund (FPA)
Portfolio of Investments (Continued)
June 30, 2022 (Unaudited)
| Shares | | Description | | Value |
| COMMON STOCKS (a) (Continued) |
| | | South Korea (Continued) | | |
| 378 | | Samsung Electro-Mechanics Co., Ltd. | | $37,992 |
| 2,690 | | Samsung Electronics Co., Ltd. | | 118,092 |
| 9,530 | | Samsung Engineering Co., Ltd. (b) | | 158,173 |
| 285 | | Samsung Fire & Marine Insurance Co., Ltd. | | 44,120 |
| 3,356 | | SD Biosensor, Inc. | | 100,416 |
| 1,504 | | Shinhan Financial Group Co., Ltd. | | 42,917 |
| 2,645 | | SK Hynix, Inc. | | 185,378 |
| 3,291 | | SK Telecom Co., Ltd. | | 131,802 |
| 258 | | SK, Inc. | | 42,722 |
| 2,582 | | S-Oil Corp. | | 206,815 |
| 20,332 | | Woori Financial Group, Inc. | | 189,477 |
| | | | | 5,445,098 |
| | | Total Common Stocks | | 12,422,382 |
| | | (Cost $14,084,587) | | |
| REAL ESTATE INVESTMENT TRUSTS (a) – 4.9% |
| | | Australia – 4.2% | | |
| 4,154 | | Charter Hall Group | | 31,053 |
| 18,789 | | Dexus | | 115,166 |
| 52,956 | | GPT (The) Group | | 154,253 |
| 55,083 | | Mirvac Group | | 75,092 |
| 48,182 | | Stockland | | 120,060 |
| 36,771 | | Vicinity Centres | | 46,574 |
| | | | | 542,198 |
| | | Singapore – 0.7% | | |
| 62,000 | | CapitaLand Integrated Commercial Trust | | 96,840 |
| | | Total Real Estate Investment Trusts | | 639,038 |
| | | (Cost $804,046) | | |
| MONEY MARKET FUNDS – 1.0% |
| 129,411 | | Goldman Sachs Financial Square Treasury Obligations Fund - Institutional Class - 1.39% (h) (i) | | 129,411 |
| | | (Cost $129,411) | | |
Principal
Value | | Description | | Value |
| REPURCHASE AGREEMENTS – 0.9% |
| $121,708 | | BNP Paribas S.A., 1.44% (h), dated 6/30/22, due 7/1/22, with a maturity value of $121,713. Collateralized by U.S. Treasury Note, interest rate of 1.25%, due 5/31/28. The value of the collateral including accrued interest is $124,398. (i) | | $121,708 |
| | | (Cost $121,708) | | |
| | | Total Investments – 101.8% | | 13,312,539 |
| | | (Cost $15,139,752) | | |
| | | Net Other Assets and Liabilities – (1.8)% | | (229,993) |
| | | Net Assets – 100.0% | | $13,082,546 |
| (a) | Portfolio securities are categorized based upon their country of incorporation, which can be different from the country categorization of the Fund’s underlying index. For a breakdown of the portfolio securities by sector, please see the Fund Performance Overview. |
| (b) | Non-income producing security. |
| (c) | This security is fair valued by the Advisor’s Pricing Committee in accordance with procedures adopted by the Trust’s Board of Trustees, and in accordance with the provisions of the Investment Company Act of 1940, as amended. At June 30, 2022, securities noted as such are valued at $64,494 or 0.5% of net assets. |
| (d) | Pursuant to procedures adopted by the Trust’s Board of Trustees, this security has been determined to be illiquid by First Trust Advisors L.P., the Fund’s advisor. |
| (e) | This security may be resold to qualified foreign investors and foreign institutional buyers under Regulation S of the Securities Act of 1933, as amended (the “1933 Act”). |
| (f) | This security is exempt from registration upon resale under Rule 144A of the 1933 Act and may be resold in transactions exempt from registration, normally to qualified institutional buyers. This security is not restricted on the foreign exchange where it trades freely without any additional registration. As such, it does not require the additional disclosure required of restricted securities. |
| (g) | All or a portion of this security is on loan (see Note 2F - Securities Lending in the Notes to Financial Statements). The remaining contractual maturity of all of the securities lending transactions is overnight and continuous. The aggregate value of such securities is $239,256 and the total value of the collateral held by the Fund is $251,119. |
| (h) | Rate shown reflects yield as of June 30, 2022. |
| (i) | This security serves as collateral for securities on loan. |
Page 38
See Notes to Financial Statements
First Trust Asia Pacific ex-Japan AlphaDEX® Fund (FPA)
Portfolio of Investments (Continued)
June 30, 2022 (Unaudited)
Offsetting Assets and Liabilities
Offsetting assets and liabilities requires entities to disclose both gross and net information about instruments and transactions eligible for offset, and to disclose instruments and transactions subject to master netting or similar agreements (see Note 2E – Offsetting on the Statements of Assets and Liabilities in the Notes to Financial Statements).
The Fund’s loaned securities were all subject to an enforceable Securities Lending Agency Agreement. Securities lent in accordance with the Securities Lending Agency Agreement on a gross basis were as follows:
| Security Lending Agency Agreement | |
| Total gross amount presented on the Statements of Assets and Liabilities (1) | $239,256 |
| Non-cash Collateral (2) | (239,256) |
| Net Amount | $— |
| (1) | The amount presented on the Statements of Assets and Liabilities, which is included in “Investments, at value,” is not offset and is shown on a gross basis. |
| (2) | At June 30, 2022, the value of the collateral received from each borrower exceeded the value of the related securities loaned. This amount is disclosed on the Portfolio of Investments. |
The Fund’s investments in repurchase agreements were all subject to an enforceable Master Repurchase Agreement. Repurchase Agreements on a gross basis were as follows:
| Repurchase Agreements | |
| Total gross amount presented on the Statements of Assets and Liabilities (3) | $121,708 |
| Non-cash Collateral (4) | (121,708) |
| Net Amount | $— |
| (3) | The amount is included in “Investments, at value” on the Statements of Assets and Liabilities. |
| (4) | At June 30, 2022, the value of the collateral received from each seller exceeded the value of the repurchase agreements. |
Currency Exposure
Diversification | % of Total
Investments |
| South Korean Won | 40.9% |
| Australian Dollar | 30.8 |
| Hong Kong Dollar | 14.8 |
| Singapore Dollar | 10.0 |
| United States Dollar | 1.9 |
| New Zealand Dollar | 1.6 |
| Total | 100.0% |
Valuation Inputs
A summary of the inputs used to value the Fund’s investments as of June 30, 2022 is as follows (see Note 2A - Portfolio Valuation in the Notes to Financial Statements):
| | Total
Value at
6/30/2022 | Level 1
Quoted
Prices | Level 2
Significant
Observable
Inputs | Level 3
Significant
Unobservable
Inputs |
| Common Stocks: | | | | |
| Cayman Islands | $ 807,131 | $ 742,637 | $ 64,494 | $ — |
| Other Country Categories* | 11,615,251 | 11,615,251 | — | — |
| Real Estate Investment Trusts* | 639,038 | 639,038 | — | — |
| Money Market Funds | 129,411 | 129,411 | — | — |
| Repurchase Agreements | 121,708 | — | 121,708 | — |
| Total Investments | $ 13,312,539 | $ 13,126,337 | $ 186,202 | $— |
| * | See Portfolio of Investments for country breakout. |
See Notes to Financial Statements
Page 39
First Trust Europe AlphaDEX® Fund (FEP)
Portfolio of Investments
June 30, 2022 (Unaudited)
| Shares | | Description | | Value |
| COMMON STOCKS (a) – 96.1% |
| | | Austria – 2.2% | | |
| 51,356 | | OMV AG | | $2,408,917 |
| 129,053 | | Raiffeisen Bank International AG | | 1,398,393 |
| 11,668 | | Verbund AG | | 1,141,435 |
| 82,471 | | voestalpine AG | | 1,752,709 |
| | | | | 6,701,454 |
| | | Belgium – 2.6% | | |
| 9,878 | | Ackermans & van Haaren N.V. | | 1,475,110 |
| 3,638 | | D’ieteren Group | | 532,217 |
| 12,091 | | Elia Group S.A./N.V. | | 1,713,087 |
| 66,121 | | Proximus S.A.D.P. | | 974,585 |
| 8,434 | | Sofina S.A. | | 1,723,490 |
| 12,456 | | Solvay S.A. | | 1,009,278 |
| 5,135 | | UCB S.A. | | 433,942 |
| | | | | 7,861,709 |
| | | Bermuda – 0.3% | | |
| 95,724 | | Hiscox Ltd. | | 1,098,130 |
| | | Denmark – 1.2% | | |
| 1,018 | | AP Moller - Maersk A.S., Class B | | 2,374,480 |
| 5,532 | | Novo Nordisk A.S., Class B | | 613,562 |
| 11,009 | | Topdanmark A.S. | | 572,976 |
| | | | | 3,561,018 |
| | | Finland – 2.1% | | |
| 127,887 | | Kojamo Oyj | | 2,205,956 |
| 39,357 | | Sampo Oyj, Class A | | 1,712,458 |
| 93,812 | | Stora Enso Oyj, Class R | | 1,471,213 |
| 37,563 | | UPM-Kymmene Oyj | | 1,141,954 |
| | | | | 6,531,581 |
| | | France – 12.1% | | |
| 3,855 | | Air Liquide S.A. | | 517,585 |
| 20,491 | | Arkema S.A. | | 1,823,533 |
| 62,912 | | AXA S.A. | | 1,428,014 |
| 351,547 | | Bollore SE | | 1,628,344 |
| 52,836 | | Bouygues S.A. | | 1,625,648 |
| 5,504 | | Capgemini SE | | 942,766 |
| 113,429 | | Carrefour S.A. (b) | | 2,007,085 |
| 20,532 | | Cie de Saint-Gobain | | 880,993 |
| 51,175 | | Credit Agricole S.A. | | 468,233 |
| 11,949 | | Eiffage S.A. | | 1,075,385 |
| 140,043 | | Engie S.A. | | 1,609,349 |
| 14,896 | | Eramet S.A. | | 1,547,758 |
| 37,089 | | Eurazeo SE | | 2,297,064 |
| 14,752 | | Ipsen S.A. | | 1,392,115 |
| 19,649 | | Nexans S.A. | | 1,522,717 |
| 52,043 | | Orange S.A. | | 611,922 |
| 69,999 | | Renault S.A. (c) | | 1,745,126 |
| 114,686 | | Rexel S.A. | | 1,763,718 |
| 19,084 | | SCOR SE | | 409,981 |
| 68,326 | | Societe Generale S.A. | | 1,495,771 |
| 14,666 | | Thales S.A. | | 1,798,969 |
| Shares | | Description | | Value |
|
| | | France (Continued) | | |
| 48,410 | | TotalEnergies SE | | $2,555,334 |
| 66,500 | | Valeo | | 1,284,014 |
| 19,151 | | Veolia Environnement S.A. | | 467,414 |
| 235,254 | | Vivendi SE | | 2,390,398 |
| 24,063 | | Wendel SE | | 2,011,041 |
| | | | | 37,300,277 |
| | | Germany – 15.4% | | |
| 25,684 | | Aurubis AG | | 1,743,051 |
| 43,051 | | BASF SE | | 1,873,413 |
| 26,914 | | Bayer AG | | 1,599,761 |
| 28,350 | | Bayerische Motoren Werke AG | | 2,182,451 |
| 321,691 | | Commerzbank AG (c) | | 2,253,958 |
| 25,556 | | Continental AG | | 1,780,964 |
| 60,763 | | Covestro AG (d) (e) | | 2,100,054 |
| 44,160 | | Daimler Truck Holding AG (c) | | 1,152,772 |
| 3,417 | | Deutsche Boerse AG | | 571,503 |
| 12,793 | | Deutsche Post AG | | 479,146 |
| 52,843 | | E.ON SE | | 443,458 |
| 50,119 | | Fresenius SE & Co., KGaA | | 1,517,892 |
| 43,136 | | HeidelbergCement AG | | 2,072,168 |
| 31,751 | | HUGO BOSS AG | | 1,675,651 |
| 101,471 | | K+S AG | | 2,465,944 |
| 9,285 | | KION Group AG | | 385,219 |
| 26,977 | | LEG Immobilien SE | | 2,236,766 |
| 43,652 | | Mercedes-Benz Group AG | | 2,526,045 |
| 31,689 | | Porsche Automobil Holding SE (Preference Shares) | | 2,096,120 |
| 8,700 | | Rheinmetall AG | | 2,008,511 |
| 70,464 | | RWE AG | | 2,590,403 |
| 396,502 | | Schaeffler AG (Preference Shares) | | 2,243,777 |
| 27,841 | | Talanx AG | | 1,059,671 |
| 225,631 | | Telefonica Deutschland Holding AG | | 647,873 |
| 143,025 | | thyssenkrupp AG (c) | | 810,867 |
| 17,865 | | United Internet AG | | 509,790 |
| 39,734 | | VERBIO Vereinigte BioEnergie AG | | 1,998,684 |
| 14,191 | | Volkswagen AG (Preference Shares) | | 1,894,921 |
| 26,335 | | Vonovia SE | | 811,374 |
| 10,800 | | Wacker Chemie AG | | 1,557,337 |
| | | | | 47,289,544 |
| | | Greece – 0.7% | | |
| 1,048,627 | | Eurobank Ergasias Services and Holdings S.A. (c) | | 926,600 |
| 33,968 | | Hellenic Telecommunications Organization S.A. | | 589,838 |
| 42,202 | | OPAP S.A. | | 603,679 |
| | | | | 2,120,117 |
| | | Ireland – 1.4% | | |
| 278,124 | | AIB Group PLC | | 633,634 |
| 479,586 | | Bank of Ireland Group PLC | | 3,031,575 |
Page 40
See Notes to Financial Statements
First Trust Europe AlphaDEX® Fund (FEP)
Portfolio of Investments (Continued)
June 30, 2022 (Unaudited)
| Shares | | Description | | Value |
| COMMON STOCKS (a) (Continued) |
| | | Ireland (Continued) | | |
| 15,327 | | CRH PLC | | $530,044 |
| | | | | 4,195,253 |
| | | Italy – 3.5% | | |
| 716,738 | | A2A S.p.A. | | 910,340 |
| 107,286 | | Assicurazioni Generali S.p.A. | | 1,711,752 |
| 207,094 | | Banco BPM S.p.A. | | 589,438 |
| 22,516 | | De’ Longhi S.p.A. | | 418,587 |
| 209,527 | | Eni S.p.A. | | 2,487,332 |
| 308,804 | | Leonardo S.p.A. | | 3,131,909 |
| 35,989 | | Prysmian S.p.A. | | 988,501 |
| 71,548 | | Terna-Rete Elettrica Nazionale S.p.A. | | 561,441 |
| | | | | 10,799,300 |
| | | Jersey – 1.6% | | |
| 470,770 | | Glencore PLC | | 2,550,727 |
| 804,736 | | Man Group PLC | | 2,447,054 |
| | | | | 4,997,781 |
| | | Luxembourg – 1.5% | | |
| 95,068 | | ArcelorMittal S.A. | | 2,142,966 |
| 202,503 | | Tenaris S.A. | | 2,603,854 |
| | | | | 4,746,820 |
| | | Netherlands – 4.5% | | |
| 232,022 | | Aegon N.V. | | 1,003,713 |
| 52,768 | | ASR Nederland N.V. | | 2,132,852 |
| 7,155 | | BE Semiconductor Industries N.V. | | 343,937 |
| 19,135 | | Koninklijke Ahold Delhaize N.V. | | 498,506 |
| 177,247 | | Koninklijke KPN N.V. | | 631,722 |
| 80,360 | | Koninklijke Philips N.V. | | 1,731,004 |
| 36,442 | | NN Group N.V. | | 1,655,128 |
| 86,827 | | OCI N.V. | | 2,864,376 |
| 45,873 | | Prosus N.V. | | 3,003,577 |
| | | | | 13,864,815 |
| | | Norway – 5.3% | | |
| 81,969 | | Aker BP ASA | | 2,846,949 |
| 71,617 | | Aker BP ASA, SDR (c) | | 2,487,403 |
| 82,307 | | Equinor ASA | | 2,862,449 |
| 64,111 | | Kongsberg Gruppen ASA | | 2,297,652 |
| 200,441 | | Leroy Seafood Group ASA | | 1,423,480 |
| 259,166 | | Norsk Hydro ASA | | 1,451,374 |
| 7,761 | | Salmar ASA | | 545,650 |
| 184,141 | | Storebrand ASA | | 1,310,526 |
| 24,525 | | Yara International ASA | | 1,024,852 |
| | | | | 16,250,335 |
| | | Portugal – 1.5% | | |
| 1,811,371 | | Banco Espirito Santo
S.A. (c) (f) (g) (h) (i) | | 0 |
| 193,518 | | Galp Energia SGPS S.A. | | 2,268,286 |
| Shares | | Description | | Value |
|
| | | Portugal (Continued) | | |
| 102,548 | | Jeronimo Martins SGPS S.A. | | $2,228,828 |
| | | | | 4,497,114 |
| | | Spain – 6.3% | | |
| 12,841 | | Acciona S.A. | | 2,361,655 |
| 106,926 | | Banco Bilbao Vizcaya Argentaria S.A. (b) | | 485,246 |
| 2,988,653 | | Banco de Sabadell S.A. | | 2,382,168 |
| 179,705 | | Banco Santander S.A. | | 506,209 |
| 209,274 | | Bankinter S.A. | | 1,305,325 |
| 362,095 | | CaixaBank S.A. | | 1,258,660 |
| 28,171 | | Endesa S.A. (b) | | 531,392 |
| 16,579 | | Laboratorios Farmeceuticos Rovi S.A. | | 1,014,640 |
| 586,404 | | Mapfre S.A. | | 1,033,626 |
| 82,045 | | Naturgy Energy Group S.A. | | 2,361,845 |
| 233,599 | | Repsol S.A. | | 3,439,441 |
| 507,770 | | Telefonica S.A. | | 2,587,156 |
| | | | | 19,267,363 |
| | | Sweden – 8.1% | | |
| 75,461 | | Axfood AB | | 2,170,940 |
| 63,003 | | Boliden AB | | 2,003,766 |
| 99,041 | | Castellum AB | | 1,272,655 |
| 124,229 | | Fabege AB | | 1,172,857 |
| 223,104 | | Fastighets AB Balder, Class B (c) | | 1,068,875 |
| 32,859 | | Holmen AB, Class B | | 1,332,701 |
| 109,446 | | Industrivarden AB, Class C | | 2,433,976 |
| 140,105 | | Investor AB, Class B | | 2,303,366 |
| 116,700 | | Kinnevik AB, Class B (c) | | 1,880,022 |
| 12,021 | | L E Lundbergforetagen AB, Class B | | 488,725 |
| 33,980 | | Nodrnet AB publ | | 444,109 |
| 72,332 | | Orron Energy AB (b) | | 49,425 |
| 67,602 | | Saab AB, Class B | | 2,792,698 |
| 683,617 | | Samhallsbyggnadsbolaget i Norden AB (b) | | 1,138,387 |
| 112,567 | | SKF AB, Class B (b) | | 1,656,085 |
| 457,731 | | SSAB AB, Class B | | 1,893,612 |
| 153,061 | | Telia Co., AB | | 586,225 |
| 84,392 | | Wallenstam AB | | 369,172 |
| | | | | 25,057,596 |
| | | Switzerland – 6.1% | | |
| 10,363 | | Baloise Holding AG | | 1,692,339 |
| 9,834 | | BKW AG | | 1,027,025 |
| 4,834 | | Cie Financiere Richemont S.A., Class A | | 514,719 |
| 141,803 | | Clariant AG (c) | | 2,700,444 |
| 7,337 | | DKSH Holding AG | | 605,620 |
| 18,903 | | Helvetia Holding AG | | 2,211,769 |
| 25,187 | | Holcim AG | | 1,077,766 |
| 21,062 | | Novartis AG | | 1,783,756 |
| 9,380 | | PSP Swiss Property AG | | 1,043,478 |
| 2,944 | | Sonova Holding AG | | 937,491 |
See Notes to Financial Statements
Page 41
First Trust Europe AlphaDEX® Fund (FEP)
Portfolio of Investments (Continued)
June 30, 2022 (Unaudited)
| Shares | | Description | | Value |
| COMMON STOCKS (a) (Continued) |
| | | Switzerland (Continued) | | |
| 2,880 | | Swiss Life Holding AG | | $1,402,818 |
| 94,306 | | UBS Group AG | | 1,520,316 |
| 4,994 | | Zurich Insurance Group AG | | 2,172,009 |
| | | | | 18,689,550 |
| | | United Kingdom – 19.7% | | |
| 169,526 | | 3i Group PLC | | 2,287,545 |
| 1,095,326 | | abrdn PLC | | 2,131,345 |
| 59,253 | | Anglo American PLC | | 2,118,419 |
| 84,419 | | Antofagasta PLC | | 1,186,917 |
| 13,940 | | AstraZeneca PLC | | 1,832,669 |
| 105,394 | | Aviva PLC | | 514,852 |
| 262,486 | | BAE Systems PLC | | 2,652,690 |
| 634,890 | | Barclays PLC | | 1,183,390 |
| 360,469 | | Barratt Developments PLC | | 2,007,066 |
| 37,761 | | Berkeley Group Holdings PLC | | 1,711,791 |
| 250,846 | | BP PLC | | 1,185,693 |
| 516,763 | | BT Group PLC | | 1,171,931 |
| 31,724 | | Bunzl PLC | | 1,050,013 |
| 2,939,382 | | Centrica PLC (c) | | 2,862,488 |
| 64,005 | | Computacenter PLC | | 1,832,520 |
| 299,474 | | Drax Group PLC | | 2,344,055 |
| 114,619 | | Evraz PLC (f) (h) | | 112,862 |
| 128,273 | | Fresnillo PLC | | 1,197,333 |
| 179,206 | | HSBC Holdings PLC | | 1,168,398 |
| 172,445 | | IG Group Holdings PLC | | 1,449,479 |
| 87,695 | | Imperial Brands PLC | | 1,959,951 |
| 299,151 | | Investec PLC | | 1,619,768 |
| 1,724,014 | | ITV PLC | | 1,369,574 |
| 372,593 | | J Sainsbury PLC | | 925,257 |
| 921,636 | | Kingfisher PLC | | 2,740,820 |
| 2,000,941 | | Lloyds Banking Group PLC | | 1,030,564 |
| 11,820 | | London Stock Exchange Group PLC | | 1,098,129 |
| 638,480 | | M&G PLC | | 1,512,473 |
| 94,693 | | Mondi PLC | | 1,677,175 |
| 80,309 | | National Grid PLC | | 1,028,437 |
| 65,659 | | Persimmon PLC | | 1,489,034 |
| 30,968 | | Rio Tinto PLC | | 1,853,390 |
| 715,458 | | Royal Mail PLC | | 2,348,890 |
| 111,638 | | Shell PLC | | 2,900,041 |
| 53,848 | | SSE PLC | | 1,059,275 |
| 65,000 | | St. James’s Place PLC | | 872,348 |
| 1,440,770 | | Taylor Wimpey PLC | | 2,045,865 |
| 170,567 | | Tesco PLC | | 530,498 |
| 377,101 | | Vodafone Group PLC | | 581,426 |
| | | | | 60,644,371 |
| | | Total Common Stocks | | 295,474,128 |
| | | (Cost $357,333,376) | | |
| REAL ESTATE INVESTMENT TRUSTS (a) – 2.9% |
| | | Belgium – 0.6% | | |
| 56,992 | | Warehouses De Pauw CVA | | 1,791,743 |
| Shares | | Description | | Value |
|
| | | France – 0.7% | | |
| 15,444 | | Covivio | | $856,971 |
| 4,875 | | Gecina S.A. | | 454,679 |
| 19,094 | | ICADE | | 931,245 |
| | | | | 2,242,895 |
| | | Spain – 0.2% | | |
| 67,608 | | Inmobiliaria Colonial Socimi S.A. | | 432,538 |
| | | United Kingdom – 1.4% | | |
| 174,944 | | Segro PLC | | 2,080,187 |
| 973,471 | | Tritax Big Box REIT PLC | | 2,150,786 |
| | | | | 4,230,973 |
| | | Total Real Estate Investment Trusts | | 8,698,149 |
| | | (Cost $11,017,875) | | |
| MONEY MARKET FUNDS – 1.4% |
| 4,310,391 | | Goldman Sachs Financial Square Treasury Obligations Fund - Institutional Class - 1.39% (j) (k) | | 4,310,391 |
| | | (Cost $4,310,391) | | |
Principal
Value | | Description | | Value |
| REPURCHASE AGREEMENTS – 1.3% |
| $4,053,844 | | BNP Paribas S.A., 1.44% (j), dated 6/30/22, due 7/01/22, with a maturity value of $4,054,006. Collateralized by U.S. Treasury Note, interest rate of 1.25%, due 5/31/28. The value of the collateral including accrued interest is $4,143,437. (k) | | 4,053,844 |
| | | (Cost $4,053,844) | | |
| | | Total Investments – 101.7% | | 312,536,512 |
| | | (Cost $376,715,486) | | |
| | | Net Other Assets and Liabilities – (1.7)% | | (5,135,599) |
| | | Net Assets – 100.0% | | $307,400,913 |
Page 42
See Notes to Financial Statements
First Trust Europe AlphaDEX® Fund (FEP)
Portfolio of Investments (Continued)
June 30, 2022 (Unaudited)
| (a) | Portfolio securities are categorized based upon their country of incorporation, which can be different from the country categorization of the Fund’s underlying index. For a breakdown of the portfolio securities by sector, please see the Fund Performance Overview. |
| (b) | All or a portion of this security is on loan (see Note 2F - Securities Lending in the Notes to Financial Statements). The remaining contractual maturity of all of the securities lending transactions is overnight and continuous. The aggregate value of such securities is $2,034,499 and the total value of the collateral held by the Fund is $8,364,235. |
| (c) | Non-income producing security. |
| (d) | This security may be resold to qualified foreign investors and foreign institutional buyers under Regulation S of the Securities Act of 1933, as amended (the “1933 Act”). |
| (e) | This security is exempt from registration upon resale under Rule 144A of the 1933 Act and may be resold in transactions exempt from registration, normally to qualified institutional buyers. This security is not restricted on the foreign exchange where it trades freely without any additional registration. As such, it does not require the additional disclosure required of restricted securities. |
| (f) | This security is fair valued by the Advisor’s Pricing Committee in accordance with procedures adopted by the Trust’s Board of Trustees, and in accordance with the provisions of the Investment Company Act of 1940, as amended. At June 30, 2022, securities noted as such are valued at $112,862 or 0.0% of net assets. |
| (g) | This issuer has filed for protection in bankruptcy court. |
| (h) | Pursuant to procedures adopted by the Trust’s Board of Trustees, this security has been determined to be illiquid by First Trust Advisors L.P., the Fund’s advisor. |
| (i) | This security’s value was determined using significant unobservable inputs (see Note 2A – Portfolio Valuation in the Notes to Financial Statements). |
| (j) | Rate shown reflects yield as of June 30, 2022. |
| (k) | This security serves as collateral for securities on loan. |
| SDR | Swedish Depositary Receipt |
Offsetting Assets and Liabilities
Offsetting assets and liabilities requires entities to disclose both gross and net information about instruments and transactions eligible for offset, and to disclose instruments and transactions subject to master netting or similar agreements (see Note 2E – Offsetting on the Statements of Assets and Liabilities in the Notes to Financial Statements).
The Fund’s loaned securities were all subject to an enforceable Securities Lending Agency Agreement. Securities lent in accordance with the Securities Lending Agency Agreement on a gross basis were as follows:
| Security Lending Agency Agreement | |
| Total gross amount presented on the Statements of Assets and Liabilities (1) | $2,034,499 |
| Non-cash Collateral (2) | (2,034,499) |
| Net Amount | $— |
| (1) | The amount presented on the Statements of Assets and Liabilities, which is included in “Investments, at value,” is not offset and is shown on a gross basis. |
| (2) | At June 30, 2022, the value of the collateral received from each borrower exceeded the value of the related securities loaned. This amount is disclosed on the Portfolio of Investments. |
The Fund’s investments in repurchase agreements were all subject to an enforceable Master Repurchase Agreement. Repurchase Agreements on a gross basis were as follows:
| Repurchase Agreements | |
| Total gross amount presented on the Statements of Assets and Liabilities (3) | $4,053,844 |
| Non-cash Collateral (4) | (4,053,844) |
| Net Amount | $— |
| (3) | The amount is included in “Investments, at value” on the Statements of Assets and Liabilities. |
| (4) | At June 30, 2022, the value of the collateral received from each seller exceeded the value of the repurchase agreements. |
Currency Exposure
Diversification | % of Total
Investments |
| Euro | 54.3% |
| British Pound Sterling | 22.7 |
| Swedish Krona | 8.8 |
| Swiss Franc | 6.0 |
| Norwegian Krone | 4.4 |
| United States Dollar | 2.7 |
| Danish Krone | 1.1 |
| Total | 100.0% |
See Notes to Financial Statements
Page 43
First Trust Europe AlphaDEX® Fund (FEP)
Portfolio of Investments (Continued)
June 30, 2022 (Unaudited)
Valuation Inputs
A summary of the inputs used to value the Fund’s investments as of June 30, 2022 is as follows (see Note 2A - Portfolio Valuation in the Notes to Financial Statements):
| | Total
Value at
6/30/2022 | Level 1
Quoted
Prices | Level 2
Significant
Observable
Inputs | Level 3
Significant
Unobservable
Inputs |
| Common Stocks: | | | | |
| Portugal | $ 4,497,114 | $ 4,497,114 | $ — | $ —** |
| United Kingdom | 60,644,371 | 60,531,509 | 112,862 | — |
| Other Country Categories* | 230,332,643 | 230,332,643 | — | — |
| Real Estate Investment Trusts* | 8,698,149 | 8,698,149 | — | — |
| Money Market Funds | 4,310,391 | 4,310,391 | — | — |
| Repurchase Agreements | 4,053,844 | — | 4,053,844 | — |
| Total Investments | $ 312,536,512 | $ 308,369,806 | $ 4,166,706 | $—** |
| * | See Portfolio of Investments for country breakout. |
| ** | Investment is valued at $0. |
Level 3 investments are fair valued by the Advisor’s Pricing Committee and are footnoted in the Portfolio of Investments. The Level 3 investments values are based on unobservable and non-quantitative inputs.
Page 44
See Notes to Financial Statements
First Trust Latin America AlphaDEX® Fund (FLN)
Portfolio of Investments
June 30, 2022 (Unaudited)
| Shares | | Description | | Value |
| COMMON STOCKS (a) – 98.9% |
| | | Bermuda – 1.7% | | |
| 6,040 | | Credicorp Ltd. | | $724,257 |
| | | Brazil – 56.5% | | |
| 292,016 | | Atacadao S.A. | | 930,153 |
| 236,896 | | Banco do Brasil S.A. | | 1,510,970 |
| 89,157 | | Banco Santander Brasil S.A. | | 490,807 |
| 111,336 | | Braskem S.A., Class A (Preference Shares) | | 792,241 |
| 184,933 | | Caixa Seguridade Participacoes S.A. | | 244,884 |
| 240,010 | | CCR S.A. | | 574,635 |
| 86,575 | | Centrais Eletricas Brasileiras S.A. | | 764,269 |
| 103,379 | | Cia de Saneamento Basico do Estado de Sao Paulo | | 833,005 |
| 248,724 | | Cia de Transmissao de Energia Electrica Paulista (Preference Shares) | | 1,091,668 |
| 702,590 | | Cia Energetica de Minas Gerais (Preference Shares) | | 1,393,514 |
| 1,087,339 | | Cia Paranaense de Energia, Class B (Preference Shares) | | 1,419,050 |
| 315,801 | | Cia Siderurgica Nacional S.A. | | 931,693 |
| 139,033 | | Cosan S.A. | | 483,505 |
| 67,367 | | Energisa S.A. | | 519,401 |
| 241,685 | | Equatorial Energia S.A. | | 1,054,770 |
| 266,807 | | Gerdau S.A. (Preference Shares) | | 1,139,427 |
| 169,883 | | Hypera S.A. | | 1,234,816 |
| 119,655 | | Itau Unibanco Holding S.A. (Preference Shares) | | 518,316 |
| 611,744 | | Itausa S.A. (Preference Shares) | | 974,872 |
| 176,639 | | JBS S.A. | | 1,066,223 |
| 69,050 | | Petro Rio S.A. (b) | | 290,135 |
| 245,748 | | Petroleo Brasileiro S.A. (Preference Shares) | | 1,311,514 |
| 29,812 | | Suzano S.A. | | 283,056 |
| 91,865 | | Telefonica Brasil S.A. | | 826,064 |
| 476,884 | | TIM S.A. | | 1,162,721 |
| 68,789 | | Vale S.A. | | 1,006,312 |
| 210,958 | | Vibra Energia S.A. | | 673,573 |
| | | | | 23,521,594 |
| | | Chile – 16.6% | | |
| 3,231,913 | | Banco de Chile | | 294,082 |
| 9,605 | | Banco de Credito e Inversiones S.A. | | 281,163 |
| 18,298,776 | | Cia Sud Americana de Vapores S.A. | | 1,634,955 |
| 747,443 | | Empresas CMPC S.A. | | 1,242,141 |
| 209,427 | | Empresas Copec S.A. | | 1,545,056 |
| 108,259 | | Falabella S.A. | | 253,645 |
| 20,015 | | Sociedad Quimica y Minera de Chile S.A., Class B (Preference Shares) | | 1,668,553 |
| | | | | 6,919,595 |
| Shares | | Description | | Value |
|
| | | Colombia – 1.8% | | |
| 96,655 | | Bancolombia S.A. (Preference Shares) | | $738,061 |
| | | Mexico – 22.3% | | |
| 51,013 | | Arca Continental S.A.B. de C.V. | | 336,451 |
| 1,936,214 | | Cemex S.A.B. de C.V., Series CPO (b) | | 755,826 |
| 340,005 | | El Puerto de Liverpool S.A.B. de C.V. | | 1,472,152 |
| 83,445 | | Fomento Economico Mexicano S.A.B. de C.V., Series UBD | | 563,216 |
| 42,772 | | Grupo Aeroportuario del Pacifico S.A.B. de C.V., Class B | | 597,951 |
| 15,765 | | Grupo Aeroportuario del Sureste S.A.B. de C.V., Class B | | 310,769 |
| 278,164 | | Grupo Carso S.A.B. de C.V., Series A1 | | 1,029,274 |
| 46,135 | | Grupo Financiero Banorte S.A.B. de CV, Class O | | 257,867 |
| 496,715 | | Grupo Financiero Inbursa S.A.B. de C.V., Class O (b) | | 794,862 |
| 231,911 | | Grupo Mexico S.A.B. de C.V., Series B | | 966,531 |
| 295,099 | | Grupo Televisa S.A.B., Series CPO | | 483,528 |
| 82,367 | | Industrias Penoles S.A.B. de C.V. | | 763,931 |
| 272,488 | | Operadora De Sites Mexicanos S.A.B de C.V. | | 315,178 |
| 262,785 | | Orbia Advance Corp. S.A.B. de C.V. | | 616,795 |
| | | | | 9,264,331 |
| | | Total Investments – 98.9% | | 41,167,838 |
| | | (Cost $48,463,853) | | |
| | | Net Other Assets and Liabilities – 1.1% | | 442,117 |
| | | Net Assets – 100.0% | | $41,609,955 |
| (a) | Portfolio securities are categorized based upon their country of incorporation, which can be different from the country categorization of the Fund’s underlying index. For a breakdown of the portfolio securities by sector, please see the Fund Performance Overview. |
| (b) | Non-income producing security. |
See Notes to Financial Statements
Page 45
First Trust Latin America AlphaDEX® Fund (FLN)
Portfolio of Investments (Continued)
June 30, 2022 (Unaudited)
Valuation Inputs
A summary of the inputs used to value the Fund’s investments as of June 30, 2022 is as follows (see Note 2A - Portfolio Valuation in the Notes to Financial Statements):
| | Total
Value at
6/30/2022 | Level 1
Quoted
Prices | Level 2
Significant
Observable
Inputs | Level 3
Significant
Unobservable
Inputs |
| Common Stocks* | $ 41,167,838 | $ 41,167,838 | $ — | $ — |
| * | See Portfolio of Investments for country breakout. |
Page 46
See Notes to Financial Statements
First Trust Brazil AlphaDEX® Fund (FBZ)
Portfolio of Investments
June 30, 2022 (Unaudited)
| Shares | | Description | | Value |
| COMMON STOCKS – 98.1% |
| | | Aerospace & Defense – 1.8% | | |
| 43,914 | | Embraer S.A. (a) | | $95,993 |
| | | Banks – 9.3% | | |
| 24,965 | | Banco Bradesco S.A. (Preference Shares) | | 82,049 |
| 22,668 | | Banco do Brasil S.A. | | 144,581 |
| 14,542 | | Banco Santander Brasil S.A. | | 80,053 |
| 10,405 | | Itau Unibanco Holding S.A. (Preference Shares) | | 45,072 |
| 97,644 | | Itausa S.A. (Preference Shares) | | 155,605 |
| | | | | 507,360 |
| | | Beverages – 1.3% | | |
| 28,274 | | Ambev S.A. | | 72,394 |
| | | Capital Markets – 0.8% | | |
| 19,568 | | B3 S.A. - Brasil Bolsa Balcao | | 40,980 |
| | | Chemicals – 2.5% | | |
| 18,913 | | Braskem S.A., Class A (Preference Shares) | | 134,581 |
| | | Containers & Packaging – 2.4% | | |
| 33,981 | | Klabin S.A. | | 131,159 |
| | | Electric Utilities – 23.4% | | |
| 44,835 | | Cia de Transmissao de Energia Electrica Paulista (Preference Shares) | | 196,784 |
| 64,848 | | Cia Energetica de Minas Gerais (Preference Shares) | | 128,619 |
| 169,247 | | Cia Paranaense de Energia, Class B (Preference Shares) | | 220,879 |
| 52,051 | | EDP - Energias do Brasil S.A. | | 203,989 |
| 14,739 | | Energisa S.A. | | 113,638 |
| 19,283 | | Equatorial Energia S.A. | | 84,156 |
| 53,825 | | Neoenergia S.A. | | 153,449 |
| 23,975 | | Transmissora Alianca de Energia Eletrica S.A. | | 176,922 |
| | | | | 1,278,436 |
| | | Electrical Equipment – 0.6% | | |
| 6,610 | | WEG S.A. | | 33,407 |
| | | Food & Staples Retailing – 3.9% | | |
| 28,589 | | Atacadao S.A. | | 91,064 |
| 36,151 | | Grupo Mateus S.A. (a) | | 23,348 |
| 26,912 | | Raia Drogasil S.A. | | 98,732 |
| | | | | 213,144 |
| | | Food Products – 8.2% | | |
| 19,360 | | BRF S.A. (a) | | 50,273 |
| 28,721 | | JBS S.A. | | 173,365 |
| 39,509 | | Marfrig Global Foods S.A. | | 91,422 |
| Shares | | Description | | Value |
|
| | | Food Products (Continued) | | |
| 18,989 | | Sao Martinho S.A. | | $131,820 |
| | | | | 446,880 |
| | | Insurance – 3.8% | | |
| 21,011 | | BB Seguridade Participacoes S.A. | | 104,223 |
| 10,420 | | Porto Seguro S.A. | | 35,361 |
| 15,860 | | Sul America S.A. | | 66,974 |
| | | | | 206,558 |
| | | Metals & Mining – 15.0% | | |
| 43,615 | | Cia Siderurgica Nacional S.A. | | 128,675 |
| 129,371 | | CSN Mineracao S.A. | | 95,419 |
| 39,983 | | Gerdau S.A. (Preference Shares) | | 170,752 |
| 76,622 | | Metalurgica Gerdau S.A. (Preference Shares) | | 139,820 |
| 71,896 | | Usinas Siderurgicas de Minas Gerais S.A., Class A (Preference Shares) | | 118,832 |
| 11,185 | | Vale S.A. | | 163,625 |
| | | | | 817,123 |
| | | Oil, Gas & Consumable Fuels – 9.4% | | |
| 30,151 | | Cosan S.A. | | 104,854 |
| 31,639 | | Petro Rio S.A. (a) | | 132,941 |
| 38,311 | | Petroleo Brasileiro S.A. (Preference Shares) | | 204,459 |
| 29,985 | | Ultrapar Participacoes S.A. | | 70,530 |
| | | | | 512,784 |
| | | Paper & Forest Products – 4.0% | | |
| 43,715 | | Dexco S.A. | | 82,444 |
| 14,506 | | Suzano S.A. | | 137,730 |
| | | | | 220,174 |
| | | Personal Products – 0.4% | | |
| 8,572 | | Natura & Co. Holding S.A. | | 21,981 |
| | | Pharmaceuticals – 1.0% | | |
| 7,711 | | Hypera S.A. | | 56,048 |
| | | Road & Rail – 2.1% | | |
| 4,113 | | Localiza Rent a Car S.A. | | 41,189 |
| 24,548 | | Rumo S.A. | | 74,909 |
| | | | | 116,098 |
| | | Specialty Retail – 2.4% | | |
| 40,746 | | Vibra Energia S.A. | | 130,099 |
| | | Textiles, Apparel & Luxury
Goods – 0.4% | | |
| 5,888 | | Alpargatas S.A. (Preference Shares) | | 21,534 |
See Notes to Financial Statements
Page 47
First Trust Brazil AlphaDEX® Fund (FBZ)
Portfolio of Investments (Continued)
June 30, 2022 (Unaudited)
| Shares | | Description | | Value |
| COMMON STOCKS (Continued) |
| | | Transportation Infrastructure – 0.8% | | |
| 18,808 | | CCR S.A. | | $45,030 |
| | | Water Utilities – 2.4% | | |
| 16,276 | | Cia de Saneamento Basico do Estado de Sao Paulo | | 131,149 |
| | | Wireless Telecommunication
Services – 2.2% | | |
| 49,732 | | TIM S.A. | | 121,255 |
| | | Total Investments – 98.1% | | 5,354,167 |
| | | (Cost $5,172,124) | | |
| | | Net Other Assets and Liabilities – 1.9% | | 104,810 |
| | | Net Assets – 100.0% | | $5,458,977 |
| (a) | Non-income producing security. |
| Country Allocation† | % of Net
Assets |
| Brazil | 98.1% |
| Total Investments | 98.1 |
| Net Other Assets and Liabilities | 1.9 |
| Total | 100.0% |
† Portfolio securities are categorized based upon their country of incorporation, which can be different from the country categorization of the Fund’s underlying index.
Valuation Inputs
A summary of the inputs used to value the Fund’s investments as of June 30, 2022 is as follows (see Note 2A - Portfolio Valuation in the Notes to Financial Statements):
| | Total
Value at
6/30/2022 | Level 1
Quoted
Prices | Level 2
Significant
Observable
Inputs | Level 3
Significant
Unobservable
Inputs |
| Common Stocks* | $ 5,354,167 | $ 5,354,167 | $ — | $ — |
| * | See Portfolio of Investments for industry breakout. |
Page 48
See Notes to Financial Statements
First Trust China AlphaDEX® Fund (FCA)
Portfolio of Investments
June 30, 2022 (Unaudited)
| Shares | | Description | | Value |
| COMMON STOCKS – 97.6% |
| | | Automobiles – 7.3% | | |
| 5,772 | | BYD Co., Ltd., Class H | | $230,974 |
| 387,880 | | Dongfeng Motor Group Co., Ltd., Class H | | 294,613 |
| 66,000 | | Yadea Group Holdings Ltd. (a) (b) | | 129,194 |
| | | | | 654,781 |
| | | Banks – 1.5% | | |
| 178,800 | | Bank of China Ltd., Class H | | 71,321 |
| 93,000 | | China Construction Bank Corp., Class H | | 62,460 |
| | | | | 133,781 |
| | | Capital Markets – 3.9% | | |
| 74,000 | | CITIC Securities Co., Ltd., Class H | | 165,412 |
| 101,600 | | GF Securities Co., Ltd., Class H | | 134,400 |
| 41,600 | | Guotai Junan Securities Co., Ltd., Class H (a) (b) | | 51,796 |
| | | | | 351,608 |
| | | Chemicals – 1.1% | | |
| 562,000 | | Sinopec Shanghai Petrochemical Co., Ltd., Class H | | 95,973 |
| | | Commercial Services &
Supplies – 2.6% | | |
| 402,000 | | China Everbright Environment Group Ltd. | | 237,200 |
| | | Construction & Engineering – 6.6% | | |
| 37,517 | | China Conch Venture Holdings Ltd. | | 81,758 |
| 366,000 | | China Railway Group Ltd., Class H | | 226,220 |
| 260,000 | | China State Construction International Holdings Ltd. | | 287,608 |
| | | | | 595,586 |
| | | Construction Materials – 6.9% | | |
| 51,856 | | Anhui Conch Cement Co., Ltd., Class H | | 224,691 |
| 158,000 | | China National Building Material Co., Ltd., Class H | | 168,736 |
| 341,822 | | China Resources Cement Holdings Ltd. | | 229,572 |
| | | | | 622,999 |
| | | Diversified Telecommunication
Services – 1.7% | | |
| 1,171,403 | | China Tower Corp., Ltd., Class H (a) (b) | | 150,777 |
| Shares | | Description | | Value |
|
| | | Electrical Equipment – 1.5% | | |
| 115,000 | | Dongfang Electric Corp., Ltd., Class H | | $137,763 |
| | | Electronic Equipment,
Instruments & Components – 3.3% | | |
| 66,450 | | Kingboard Holdings Ltd. | | 251,512 |
| 38,000 | | Kingboard Laminates Holdings Ltd. | | 46,878 |
| | | | | 298,390 |
| | | Food Products – 2.0% | | |
| 32,000 | | Tingyi Cayman Islands Holding Corp. | | 54,810 |
| 141,000 | | Want Want China Holdings Ltd. | | 122,549 |
| | | | | 177,359 |
| | | Gas Utilities – 3.1% | | |
| 343,400 | | Kunlun Energy Co., Ltd. | | 281,396 |
| | | Health Care Providers &
Services – 1.6% | | |
| 59,200 | | Sinopharm Group Co., Ltd., Class H | | 143,496 |
| | | Independent Power &
Renewable Electricity Producers – 11.7% | | |
| 479,000 | | China Power International Development Ltd. | | 303,999 |
| 97,187 | | China Resources Power Holdings Co., Ltd. | | 200,646 |
| 1,144,000 | | Datang International Power Generation Co., Ltd., Class H | | 189,529 |
| 445,022 | | Huadian Power International Corp., Ltd., Class H | | 162,202 |
| 386,000 | | Huaneng Power International, Inc., Class H | | 192,341 |
| | | | | 1,048,717 |
| | | Insurance – 3.4% | | |
| 47,000 | | China Taiping Insurance Holdings Co., Ltd. | | 57,980 |
| 236,068 | | PICC Property & Casualty Co., Ltd., Class H | | 245,491 |
| | | | | 303,471 |
| | | Life Sciences Tools &
Services – 0.6% | | |
| 13,800 | | Genscript Biotech Corp. (c) | | 50,034 |
| | | Marine – 2.6% | | |
| 166,490 | | COSCO SHIPPING Holdings Co., Ltd., Class H | | 232,544 |
| | | Metals & Mining – 6.8% | | |
| 724,200 | | Angang Steel Co., Ltd., Class H | | 270,417 |
See Notes to Financial Statements
Page 49
First Trust China AlphaDEX® Fund (FCA)
Portfolio of Investments (Continued)
June 30, 2022 (Unaudited)
| Shares | | Description | | Value |
| COMMON STOCKS (Continued) |
| | | Metals & Mining (Continued) | | |
| 305,765 | | China Hongqiao Group Ltd. | | $345,636 |
| | | | | 616,053 |
| | | Oil, Gas & Consumable Fuels – 13.9% | | |
| 335,836 | | China Coal Energy Co., Ltd., Class H | | 284,614 |
| 553,600 | | China Petroleum & Chemical Corp., Class H | | 249,045 |
| 82,753 | | China Shenhua Energy Co., Ltd., Class H | | 237,287 |
| 580,000 | | PetroChina Co., Ltd., Class H | | 276,444 |
| 64,534 | | Yankuang Energy Group Co., Ltd., Class H | | 202,316 |
| | | | | 1,249,706 |
| | | Real Estate Management &
Development – 7.0% | | |
| 109,272 | | China Overseas Land & Investment Ltd. | | 345,357 |
| 30,200 | | China Resources Land Ltd. | | 140,863 |
| 73,000 | | Country Garden Holdings Co., Ltd. | | 45,213 |
| 171,300 | | Sunac China Holdings Ltd. (d) (e) | | 99,984 |
| | | | | 631,417 |
| | | Semiconductors &
Semiconductor Equipment – 1.9% | | |
| 25,000 | | Flat Glass Group Co., Ltd., Class H (c) | | 87,934 |
| 20,000 | | Shanghai Fudan Microelectronics Group Co., Ltd., Class H (c) | | 79,650 |
| | | | | 167,584 |
| | | Software – 2.5% | | |
| 53,400 | | Shanghai Baosight Software Co., Ltd., Class B | | 225,241 |
| | | Specialty Retail – 1.8% | | |
| 12,600 | | China Meidong Auto Holdings Ltd. | | 39,662 |
| 16,750 | | Zhongsheng Group Holdings Ltd. | | 118,152 |
| | | | | 157,814 |
| Shares | | Description | | Value |
|
| | | Technology Hardware,
Storage & Peripherals – 2.3% | | |
| 224,000 | | Lenovo Group Ltd. | | $209,247 |
| | | Total Investments – 97.6% | | 8,772,937 |
| | | (Cost $9,576,333) | | |
| | | Net Other Assets and Liabilities – 2.4% | | 213,538 |
| | | Net Assets – 100.0% | | $8,986,475 |
| (a) | This security may be resold to qualified foreign investors and foreign institutional buyers under Regulation S of the Securities Act of 1933, as amended (the “1933 Act”). |
| (b) | This security is exempt from registration upon resale under Rule 144A of the 1933 Act and may be resold in transactions exempt from registration, normally to qualified institutional buyers. This security is not restricted on the foreign exchange where it trades freely without any additional registration. As such, it does not require the additional disclosure required of restricted securities. |
| (c) | Non-income producing security. |
| (d) | This security is fair valued by the Advisor’s Pricing Committee in accordance with procedures adopted by the Trust’s Board of Trustees, and in accordance with the provisions of the Investment Company Act of 1940, as amended. At June 30, 2022, securities noted as such are valued at $99,984 or 1.1% of net assets. |
| (e) | Pursuant to procedures adopted by the Trust’s Board of Trustees, this security has been determined to be illiquid by First Trust Advisors L.P., the Fund’s advisor. |
| Country Allocation† | % of Net
Assets |
| China | 56.7% |
| Cayman Islands | 22.7 |
| Hong Kong | 15.1 |
| Bermuda | 3.1 |
| Total Investments | 97.6 |
| Net Other Assets and Liabilities | 2.4 |
| Total | 100.0% |
† Portfolio securities are categorized based upon their country of incorporation, which can be different from the country categorization of the Fund’s underlying index.
Currency Exposure
Diversification | % of Total
Investments |
| Hong Kong Dollar | 97.4% |
| United States Dollar | 2.6 |
| Total | 100.0% |
Page 50
See Notes to Financial Statements
First Trust China AlphaDEX® Fund (FCA)
Portfolio of Investments (Continued)
June 30, 2022 (Unaudited)
Valuation Inputs
A summary of the inputs used to value the Fund’s investments as of June 30, 2022 is as follows (see Note 2A - Portfolio Valuation in the Notes to Financial Statements):
| | Total
Value at
6/30/2022 | Level 1
Quoted
Prices | Level 2
Significant
Observable
Inputs | Level 3
Significant
Unobservable
Inputs |
| Common Stocks: | | | | |
| Real Estate Management & Development | $ 631,417 | $ 531,433 | $ 99,984 | $ — |
| Other industry categories* | 8,141,520 | 8,141,520 | — | — |
| Total Investments | $ 8,772,937 | $ 8,672,953 | $ 99,984 | $— |
| * | See Portfolio of Investments for industry breakout. |
See Notes to Financial Statements
Page 51
First Trust Japan AlphaDEX® Fund (FJP)
Portfolio of Investments
June 30, 2022 (Unaudited)
| Shares | | Description | | Value |
| COMMON STOCKS – 99.7% |
| | | Auto Components – 3.9% | | |
| 12,900 | | Aisin Corp. | | $399,322 |
| 7,400 | | Denso Corp. | | 393,125 |
| 37,700 | | Sumitomo Electric Industries Ltd. | | 416,512 |
| | | | | 1,208,959 |
| | | Automobiles – 8.1% | | |
| 17,500 | | Honda Motor Co., Ltd. | | 424,731 |
| 29,600 | | Isuzu Motors Ltd. | | 327,459 |
| 64,000 | | Mazda Motor Corp. | | 523,585 |
| 50,900 | | Nissan Motor Co., Ltd. | | 198,153 |
| 6,900 | | Subaru Corp. | | 122,637 |
| 3,200 | | Suzuki Motor Corp. | | 100,566 |
| 20,100 | | Toyota Motor Corp. | | 311,100 |
| 25,600 | | Yamaha Motor Co., Ltd. (a) | | 469,056 |
| | | | | 2,477,287 |
| | | Banks – 2.1% | | |
| 40,200 | | Japan Post Bank Co., Ltd. | | 312,581 |
| 22,600 | | Mitsubishi UFJ Financial Group, Inc. | | 121,495 |
| 19,300 | | Mizuho Financial Group, Inc. | | 219,486 |
| | | | | 653,562 |
| | | Building Products – 1.5% | | |
| 10,300 | | AGC, Inc. (a) | | 362,109 |
| 500 | | Daikin Industries Ltd. | | 80,152 |
| | | | | 442,261 |
| | | Capital Markets – 1.4% | | |
| 22,500 | | SBI Holdings, Inc. | | 440,282 |
| | | Chemicals – 6.9% | | |
| 26,100 | | Asahi Kasei Corp. | | 199,289 |
| 3,200 | | JSR Corp. | | 83,019 |
| 16,600 | | Mitsubishi Chemical Holdings Corp. | | 90,170 |
| 22,800 | | Mitsui Chemicals, Inc. | | 485,643 |
| 1,600 | | Nitto Denko Corp. | | 103,538 |
| 78,300 | | Sumitomo Chemical Co., Ltd. | | 306,436 |
| 62,200 | | Toray Industries, Inc. | | 348,958 |
| 41,400 | | Tosoh Corp. | | 514,144 |
| | | | | 2,131,197 |
| | | Commercial Services &
Supplies – 2.5% | | |
| 14,700 | | Dai Nippon Printing Co., Ltd. | | 317,012 |
| 26,200 | | Toppan, Inc. | | 437,761 |
| | | | | 754,773 |
| | | Construction & Engineering – 1.6% | | |
| 32,000 | | Kajima Corp. | | 367,217 |
| 4,100 | | Taisei Corp. | | 127,672 |
| | | | | 494,889 |
| Shares | | Description | | Value |
|
| | | Consumer Finance – 1.3% | | |
| 170,900 | | Acom Co., Ltd. | | $399,287 |
| | | Diversified Financial Services – 2.4% | | |
| 74,600 | | Mitsubishi HC Capital, Inc. | | 344,189 |
| 24,100 | | ORIX Corp. | | 404,272 |
| | | | | 748,461 |
| | | Diversified Telecommunication
Services – 0.4% | | |
| 4,500 | | Nippon Telegraph & Telephone Corp. | | 129,216 |
| | | Electric Utilities – 2.4% | | |
| 34,900 | | Chubu Electric Power Co., Inc. | | 351,366 |
| 39,500 | | Kansai Electric Power (The) Co., Inc. | | 391,274 |
| | | | | 742,640 |
| | | Electrical Equipment – 1.9% | | |
| 9,000 | | Fuji Electric Co., Ltd. | | 372,789 |
| 19,400 | | Mitsubishi Electric Corp. | | 207,469 |
| | | | | 580,258 |
| | | Electronic Equipment,
Instruments & Components – 2.0% | | |
| 700 | | Hirose Electric Co., Ltd. | | 92,917 |
| 6,200 | | Ibiden Co., Ltd. | | 174,786 |
| 400 | | Keyence Corp. | | 136,734 |
| 1,300 | | Omron Corp. | | 66,025 |
| 4,300 | | Taiyo Yuden Co., Ltd. | | 146,101 |
| | | | | 616,563 |
| | | Food & Staples Retailing – 0.5% | | |
| 6,300 | | Kobe Bussan Co., Ltd. | | 154,389 |
| | | Food Products – 0.3% | | |
| 4,100 | | Ajinomoto Co., Inc. | | 99,720 |
| | | Gas Utilities – 2.3% | | |
| 22,300 | | Osaka Gas Co., Ltd. | | 426,671 |
| 13,700 | | Tokyo Gas Co., Ltd. | | 283,431 |
| | | | | 710,102 |
| | | Health Care Equipment &
Supplies – 0.2% | | |
| 900 | | Sysmex Corp. | | 54,167 |
| | | Household Durables – 3.3% | | |
| 21,100 | | Iida Group Holdings Co., Ltd. | | 324,866 |
| 7,100 | | Open House Group Co., Ltd. | | 282,577 |
| 11,100 | | Panasonic Corp. | | 89,705 |
| 3,900 | | Sony Group Corp. | | 318,916 |
| | | | | 1,016,064 |
Page 52
See Notes to Financial Statements
First Trust Japan AlphaDEX® Fund (FJP)
Portfolio of Investments (Continued)
June 30, 2022 (Unaudited)
| Shares | | Description | | Value |
| COMMON STOCKS (Continued) |
| | | Industrial Conglomerates – 1.1% | | |
| 2,200 | | Hitachi Ltd. | | $104,390 |
| 6,000 | | Toshiba Corp. | | 243,882 |
| | | | | 348,272 |
| | | Insurance – 5.0% | | |
| 24,300 | | Dai-ichi Life Holdings, Inc. | | 449,536 |
| 31,500 | | Japan Post Holdings Co., Ltd. | | 224,990 |
| 15,200 | | Japan Post Insurance Co., Ltd. | | 243,213 |
| 5,800 | | Sompo Holdings, Inc. | | 255,759 |
| 9,600 | | T&D Holdings, Inc. | | 114,906 |
| 4,400 | | Tokio Marine Holdings, Inc. | | 256,288 |
| | | | | 1,544,692 |
| | | IT Services – 3.1% | | |
| 7,900 | | NEC Corp. | | 306,847 |
| 22,900 | | NTT Data Corp. | | 316,630 |
| 12,300 | | TIS, Inc. | | 322,277 |
| | | | | 945,754 |
| | | Machinery – 6.6% | | |
| 11,000 | | Ebara Corp. | | 411,851 |
| 11,000 | | Kubota Corp. | | 164,335 |
| 17,200 | | MINEBEA MITSUMI, Inc. | | 292,836 |
| 3,000 | | MISUMI Group, Inc. | | 63,237 |
| 16,000 | | Mitsubishi Heavy Industries Ltd. | | 559,552 |
| 29,000 | | NGK Insulators Ltd. | | 390,714 |
| 300 | | SMC Corp. | | 133,704 |
| | | | | 2,016,229 |
| | | Marine – 5.6% | | |
| 10,200 | | Kawasaki Kisen Kaisha Ltd. | | 620,209 |
| 24,700 | | Mitsui OSK Lines Ltd. | | 565,253 |
| 8,000 | | Nippon Yusen KK | | 546,580 |
| | | | | 1,732,042 |
| | | Metals & Mining – 5.3% | | |
| 6,600 | | Hitachi Metals Ltd. (b) | | 99,866 |
| 48,100 | | JFE Holdings, Inc. | | 506,950 |
| 37,600 | | Nippon Steel Corp. | | 526,256 |
| 16,200 | | Sumitomo Metal Mining Co., Ltd. | | 507,444 |
| | | | | 1,640,516 |
| | | Oil, Gas & Consumable Fuels – 6.0% | | |
| 131,500 | | ENEOS Holdings, Inc. | | 497,874 |
| 24,000 | | Idemitsu Kosan Co., Ltd. | | 578,420 |
| 70,600 | | Inpex Corp. | | 764,903 |
| | | | | 1,841,197 |
| | | Paper & Forest Products – 1.4% | | |
| 101,400 | | Oji Holdings Corp. | | 439,440 |
| Shares | | Description | | Value |
|
| | | Pharmaceuticals – 1.4% | | |
| 21,300 | | Sumitomo Pharma Co., Ltd. | | $171,273 |
| 9,000 | | Takeda Pharmaceutical Co., Ltd. | | 253,258 |
| | | | | 424,531 |
| | | Professional Services – 1.8% | | |
| 21,100 | | Persol Holdings Co., Ltd. | | 383,495 |
| 6,100 | | Recruit Holdings Co., Ltd. | | 179,610 |
| | | | | 563,105 |
| | | Road & Rail – 0.7% | | |
| 4,100 | | NIPPON EXPRESS HOLDINGS, Inc. | | 222,708 |
| | | Semiconductors &
Semiconductor Equipment – 3.5% | | |
| 2,600 | | Advantest Corp. | | 139,122 |
| 4,600 | | SCREEN Holdings Co., Ltd. | | 310,893 |
| 12,900 | | Shinko Electric Industries Co., Ltd. | | 332,768 |
| 900 | | Tokyo Electron Ltd. | | 293,853 |
| | | | | 1,076,636 |
| | | Technology Hardware,
Storage & Peripherals – 1.4% | | |
| 15,100 | | Canon, Inc. (a) | | 343,334 |
| 6,900 | | Seiko Epson Corp. | | 97,641 |
| | | | | 440,975 |
| | | Tobacco – 0.4% | | |
| 6,100 | | Japan Tobacco, Inc. (a) | | 105,473 |
| | | Trading Companies &
Distributors – 8.9% | | |
| 12,000 | | ITOCHU Corp. | | 324,322 |
| 63,100 | | Marubeni Corp. | | 569,240 |
| 19,300 | | Mitsubishi Corp. | | 574,249 |
| 25,900 | | Mitsui & Co., Ltd. | | 571,621 |
| 25,000 | | Sumitomo Corp. | | 342,165 |
| 10,600 | | Toyota Tsusho Corp. | | 346,094 |
| | | | | 2,727,691 |
| | | Wireless Telecommunication
Services – 2.5% | | |
| 8,400 | | KDDI Corp. | | 265,534 |
| 13,000 | | SoftBank Group Corp. | | 501,584 |
| | | | | 767,118 |
| | | Total Common Stocks | | 30,690,456 |
| | | (Cost $36,941,077) | | |
| MONEY MARKET FUNDS – 1.9% |
| 575,080 | | Goldman Sachs Financial Square Treasury Obligations Fund - Institutional Class - 1.39% (c) (d) | | 575,080 |
| | | (Cost $575,080) | | |
See Notes to Financial Statements
Page 53
First Trust Japan AlphaDEX® Fund (FJP)
Portfolio of Investments (Continued)
June 30, 2022 (Unaudited)
Principal
Value | | Description | | Value |
| REPURCHASE AGREEMENTS – 1.8% |
| $540,852 | | BNP Paribas S.A., 1.44% (c), dated 6/30/22, due 7/1/22, with a maturity value of $540,874. Collateralized by U.S. Treasury Note, interest rate of 1.25%, due 5/31/28. The value of the collateral including accrued interest is $552,805. (d) | | $540,852 |
| | | (Cost $540,852) | | |
| | | Total Investments – 103.4% | | 31,806,388 |
| | | (Cost $38,057,009) | | |
| | | Net Other Assets and Liabilities – (3.4)% | | (1,035,035) |
| | | Net Assets – 100.0% | | $30,771,353 |
| (a) | All or a portion of this security is on loan (see Note 2F - Securities Lending in the Notes to Financial Statements). The remaining contractual maturity of all of the securities lending transactions is overnight and continuous. The aggregate value of such securities is $1,071,356 and the total value of the collateral held by the Fund is $1,115,932. |
| (b) | Non-income producing security. |
| (c) | Rate shown reflects yield as of June 30, 2022. |
| (d) | This security serves as collateral for securities on loan. |
Offsetting Assets and Liabilities
Offsetting assets and liabilities requires entities to disclose both gross and net information about instruments and transactions eligible for offset, and to disclose instruments and transactions subject to master netting or similar agreements (see Note 2E – Offsetting on the Statements of Assets and Liabilities in the Notes to Financial Statements).
The Fund’s loaned securities were all subject to an enforceable Securities Lending Agency Agreement. Securities lent in accordance with the Securities Lending Agency Agreement on a gross basis were as follows:
| Security Lending Agency Agreement | |
| Total gross amount presented on the Statements of Assets and Liabilities (1) | $1,071,356 |
| Non-cash Collateral (2) | (1,071,356) |
| Net Amount | $— |
| (1) | The amount presented on the Statements of Assets and Liabilities, which is included in “Investments, at value,” is not offset and is shown on a gross basis. |
| (2) | At June 30, 2022, the value of the collateral received from each borrower exceeded the value of the related securities loaned. This amount is disclosed on the Portfolio of Investments. |
The Fund’s investments in repurchase agreements were all subject to an enforceable Master Repurchase Agreement. Repurchase Agreements on a gross basis were as follows:
| Repurchase Agreements | |
| Total gross amount presented on the Statements of Assets and Liabilities (3) | $540,852 |
| Non-cash Collateral (4) | (540,852) |
| Net Amount | $— |
| (3) | The amount is included in “Investments, at value” on the Statements of Assets and Liabilities. |
| (4) | At June 30, 2022, the value of the collateral received from each seller exceeded the value of the repurchase agreements. |
| Country Allocation† | % of Net
Assets |
| Japan | 99.7% |
| United States | 3.7 |
| Total Investments | 103.4 |
| Net Other Assets and Liabilities | (3.4) |
| Total | 100.0% |
† Portfolio securities are categorized based upon their country of incorporation, which can be different from the country categorization of the Fund’s underlying index.
Valuation Inputs
A summary of the inputs used to value the Fund’s investments as of June 30, 2022 is as follows (see Note 2A - Portfolio Valuation in the Notes to Financial Statements):
| | Total
Value at
6/30/2022 | Level 1
Quoted
Prices | Level 2
Significant
Observable
Inputs | Level 3
Significant
Unobservable
Inputs |
| Common Stocks* | $ 30,690,456 | $ 30,690,456 | $ — | $ — |
| Money Market Funds | 575,080 | 575,080 | — | — |
| Repurchase Agreements | 540,852 | — | 540,852 | — |
| Total Investments | $ 31,806,388 | $ 31,265,536 | $ 540,852 | $— |
| * | See Portfolio of Investments for industry breakout. |
Page 54
See Notes to Financial Statements
First Trust Developed Markets ex-US AlphaDEX® Fund (FDT)
Portfolio of Investments
June 30, 2022 (Unaudited)
| Shares | | Description | | Value |
| COMMON STOCKS (a) – 95.9% |
| | | Australia – 4.9% | | |
| 122,535 | | Allkem Ltd. (b) | | $872,018 |
| 91,420 | | Ampol Ltd. | | 2,160,004 |
| 379,562 | | Aurizon Holdings Ltd. | | 995,572 |
| 45,591 | | BHP Group Ltd. | | 1,298,104 |
| 167,855 | | BlueScope Steel Ltd. | | 1,842,204 |
| 101,688 | | Fortescue Metals Group Ltd. | | 1,230,433 |
| 392,684 | | Harvey Norman Holdings Ltd. | | 1,005,596 |
| 369,543 | | Incitec Pivot Ltd. | | 844,305 |
| 65,081 | | Lynas Rare Earths Ltd. (b) | | 392,170 |
| 13,287 | | Mineral Resources Ltd. | | 442,701 |
| 260,813 | | Northern Star Resources Ltd. | | 1,231,379 |
| 224,810 | | Origin Energy Ltd. | | 889,153 |
| 218,842 | | Pilbara Minerals Ltd. (b) | | 345,918 |
| 11,760 | | Rio Tinto Ltd. | | 833,651 |
| 132,067 | | Seven Group Holdings Ltd. | | 1,514,155 |
| 418,498 | | South32 Ltd. | | 1,138,141 |
| 87,262 | | Woodside Energy Group Ltd. | | 1,917,806 |
| 54,242 | | Worley Ltd. | | 533,153 |
| | | | | 19,486,463 |
| | | Austria – 0.8% | | |
| 21,787 | | OMV AG | | 1,021,946 |
| 72,995 | | Raiffeisen Bank International AG | | 790,960 |
| 69,970 | | voestalpine AG | | 1,487,032 |
| | | | | 3,299,938 |
| | | Belgium – 0.7% | | |
| 6,840 | | Elia Group S.A./N.V. | | 969,111 |
| 7,157 | | Sofina S.A. | | 1,462,535 |
| 5,285 | | Solvay S.A. | | 428,230 |
| | | | | 2,859,876 |
| | | Bermuda – 1.6% | | |
| 1,216,267 | | Hopson Development Holdings Ltd. (c) | | 1,856,920 |
| 743,852 | | Kerry Properties Ltd. | | 2,066,572 |
| 3,010,709 | | Nine Dragons Paper Holdings Ltd. | | 2,547,676 |
| | | | | 6,471,168 |
| | | Canada – 14.9% | | |
| 46,652 | | Alimentation Couche-Tard, Inc. | | 1,819,761 |
| 93,837 | | AltaGas Ltd. | | 1,979,967 |
| 196,193 | | ARC Resources Ltd. | | 2,473,751 |
| 12,871 | | Aritzia, Inc. (b) | | 348,473 |
| 343,302 | | B2Gold Corp. | | 1,162,831 |
| 42,425 | | Canadian Natural Resources Ltd. | | 2,279,783 |
| 157,593 | | Cenovus Energy, Inc. | | 2,998,332 |
| 362,500 | | Crescent Point Energy Corp. | | 2,576,814 |
| 9,266 | | Dollarama, Inc. | | 533,558 |
| 29,629 | | Empire Co., Ltd., Class A | | 912,671 |
| 22,828 | | Enbridge, Inc. | | 964,054 |
| 3,852 | | Fairfax Financial Holdings, Ltd. | | 2,041,213 |
| 69,805 | | Finning International, Inc. | | 1,469,094 |
| 75,883 | | First Quantum Minerals Ltd. | | 1,439,608 |
| Shares | | Description | | Value |
|
| | | Canada (Continued) | | |
| 8,533 | | George Weston Ltd. | | $996,820 |
| 54,287 | | Imperial Oil Ltd. | | 2,559,148 |
| 3,555 | | Intact Financial Corp. | | 501,434 |
| 41,456 | | Keyera Corp. (c) | | 946,866 |
| 17,564 | | Loblaw Cos., Ltd. | | 1,584,062 |
| 155,530 | | Lundin Mining Corp. | | 985,958 |
| 192,399 | | MEG Energy Corp. (b) | | 2,663,572 |
| 48,178 | | Methanex Corp. | | 1,840,361 |
| 9,129 | | Metro, Inc. | | 489,996 |
| 25,414 | | Nutrien Ltd. | | 2,023,919 |
| 39,200 | | Onex Corp. | | 1,952,082 |
| 35,534 | | Parkland Corp. | | 965,094 |
| 41,955 | | Pembina Pipeline Corp. (c) | | 1,483,027 |
| 96,668 | | SSR Mining, Inc. | | 1,614,638 |
| 80,694 | | Suncor Energy, Inc. | | 2,831,060 |
| 65,060 | | Teck Resources Ltd., Class B | | 1,989,405 |
| 4,935 | | TFI International, Inc. | | 396,157 |
| 46,635 | | Tourmaline Oil Corp. | | 2,424,861 |
| 87,488 | | Turquoise Hill Resources Ltd. (b) | | 2,343,526 |
| 31,931 | | West Fraser Timber Co., Ltd. | | 2,450,144 |
| 317,626 | | Whitecap Resources, Inc. (c) | | 2,206,010 |
| 188,210 | | Yamana Gold, Inc. | | 875,837 |
| | | | | 59,123,887 |
| | | Cayman Islands – 1.5% | | |
| 214,529 | | CK Hutchison Holdings Ltd. | | 1,450,370 |
| 826,967 | | Shimao Group Holdings Ltd. (d) (e) | | 465,820 |
| 3,328,114 | | WH Group Ltd. (f) (g) | | 2,570,267 |
| 650,409 | | Xinyi Glass Holdings Ltd. | | 1,559,960 |
| | | | | 6,046,417 |
| | | Denmark – 0.5% | | |
| 862 | | AP Moller - Maersk A.S., Class B | | 2,010,611 |
| | | Finland – 0.6% | | |
| 86,804 | | Kojamo Oyj | | 1,497,305 |
| 53,060 | | Stora Enso Oyj, Class R | | 832,117 |
| | | | | 2,329,422 |
| | | France – 4.1% | | |
| 17,383 | | Arkema S.A. | | 1,546,947 |
| 17,793 | | AXA S.A. | | 403,876 |
| 99,418 | | Bollore SE | | 460,498 |
| 14,944 | | Bouygues S.A. | | 459,794 |
| 72,177 | | Carrefour S.A. (c) | | 1,277,146 |
| 39,606 | | Engie S.A. | | 455,145 |
| 9,479 | | Eramet S.A. | | 984,908 |
| 31,467 | | Eurazeo SE | | 1,948,872 |
| 4,172 | | Ipsen S.A. | | 393,703 |
| 5,556 | | Nexans S.A. | | 430,567 |
| 39,591 | | Renault S.A. (b) | | 987,033 |
| 72,977 | | Rexel S.A. | | 1,122,289 |
| 19,324 | | Societe Generale S.A. | | 423,035 |
See Notes to Financial Statements
Page 55
First Trust Developed Markets ex-US AlphaDEX® Fund (FDT)
Portfolio of Investments (Continued)
June 30, 2022 (Unaudited)
| Shares | | Description | | Value |
| COMMON STOCKS (a) (Continued) |
| | | France (Continued) | | |
| 4,148 | | Thales S.A. | | $508,804 |
| 30,805 | | TotalEnergies SE | | 1,626,049 |
| 199,593 | | Vivendi SE | | 2,028,049 |
| 15,313 | | Wendel SE | | 1,279,769 |
| | | | | 16,336,484 |
| | | Germany – 6.9% | | |
| 21,792 | | Aurubis AG | | 1,478,919 |
| 27,393 | | BASF SE | | 1,192,037 |
| 15,221 | | Bayer AG | | 904,732 |
| 24,052 | | Bayerische Motoren Werke AG | | 1,851,581 |
| 136,461 | | Commerzbank AG (b) | | 956,127 |
| 14,455 | | Continental AG | | 1,007,350 |
| 41,241 | | Covestro AG (f) (g) | | 1,425,346 |
| 18,732 | | Daimler Truck Holding AG (b) | | 488,988 |
| 14,174 | | Fresenius SE & Co., KGaA | | 429,270 |
| 36,594 | | HeidelbergCement AG | | 1,757,904 |
| 8,979 | | HUGO BOSS AG | | 473,865 |
| 86,089 | | K+S AG | | 2,092,132 |
| 22,887 | | LEG Immobilien SE | | 1,897,648 |
| 29,629 | | Mercedes-Benz Group AG | | 1,714,565 |
| 26,884 | | Porsche Automobil Holding SE (Preference Shares) | | 1,778,285 |
| 7,380 | | Rheinmetall AG | | 1,703,772 |
| 47,826 | | RWE AG | | 1,758,184 |
| 252,297 | | Schaeffler AG (Preference Shares) (c) | | 1,427,731 |
| 26,970 | | VERBIO Vereinigte BioEnergie AG | | 1,356,634 |
| 6,020 | | Volkswagen AG (Preference Shares) | | 803,849 |
| 6,110 | | Wacker Chemie AG | | 881,049 |
| | | | | 27,379,968 |
| | | Hong Kong – 0.6% | | |
| 1,622,146 | | Sino Land Co., Ltd. | | 2,393,899 |
| | | Ireland – 0.5% | | |
| 325,507 | | Bank of Ireland Group PLC | | 2,057,606 |
| | | Israel – 1.8% | | |
| 48,586 | | Bank Leumi Le-Israel BM | | 431,897 |
| 305,630 | | Bezeq The Israeli Telecommunication Corp., Ltd. | | 474,245 |
| 7,192 | | Elbit Systems Ltd. | | 1,641,438 |
| 175,591 | | ICL Group Ltd. | | 1,593,060 |
| 4,508 | | Israel Corp., Ltd. (b) | | 1,981,071 |
| 26,810 | | Mizrahi Tefahot Bank Ltd. | | 886,516 |
| | | | | 7,008,227 |
| | | Italy – 1.2% | | |
| 68,265 | | Assicurazioni Generali S.p.A. | | 1,089,171 |
| 142,211 | | Eni S.p.A. | | 1,688,212 |
| 209,595 | | Leonardo S.p.A. | | 2,125,725 |
| | | | | 4,903,108 |
| Shares | | Description | | Value |
|
| | | Japan – 21.8% | | |
| 38,900 | | AGC, Inc. (c) | | $1,367,578 |
| 45,800 | | Aisin Corp. | | 1,417,748 |
| 120,100 | | Asahi Kasei Corp. | | 917,037 |
| 21,200 | | Canon, Inc. (c) | | 482,031 |
| 76,800 | | Dai-ichi Life Holdings, Inc. | | 1,420,755 |
| 38,000 | | Dentsu, Inc. (c) | | 1,141,288 |
| 28,100 | | Ebara Corp. | | 1,052,093 |
| 557,300 | | ENEOS Holdings, Inc. | | 2,110,002 |
| 10,500 | | Fuji Electric Co., Ltd. | | 434,920 |
| 10,500 | | Hitachi Ltd. | | 498,224 |
| 37,900 | | Hitachi Transport System Ltd. | | 2,391,097 |
| 36,560 | | Honda Motor Co., Ltd. | | 887,324 |
| 75,800 | | Idemitsu Kosan Co., Ltd. | | 1,826,843 |
| 120,600 | | Iida Group Holdings Co., Ltd. | | 1,856,820 |
| 221,500 | | Inpex Corp. (c) | | 2,399,801 |
| 120,500 | | Isuzu Motors Ltd. | | 1,333,067 |
| 61,700 | | ITOCHU Corp. | | 1,667,555 |
| 59,900 | | Japan Post Insurance Co., Ltd. | | 958,453 |
| 148,200 | | JFE Holdings, Inc. | | 1,561,955 |
| 85,600 | | Kajima Corp. | | 982,305 |
| 55,400 | | Kansai Electric Power (The) Co., Inc. | | 548,774 |
| 39,600 | | Kawasaki Kisen Kaisha Ltd. | | 2,407,871 |
| 223,600 | | Marubeni Corp. | | 2,017,146 |
| 140,300 | | Mazda Motor Corp. | | 1,147,796 |
| 156,100 | | Mitsubishi Chemical Holdings Corp. | | 847,919 |
| 69,300 | | Mitsubishi Corp. | | 2,061,941 |
| 45,400 | | Mitsubishi Electric Corp. | | 485,520 |
| 223,800 | | Mitsubishi HC Capital, Inc. | | 1,032,568 |
| 47,700 | | Mitsubishi Heavy Industries Ltd. | | 1,668,164 |
| 385,600 | | Mitsubishi Motors Corp. (b) | | 1,304,469 |
| 96,000 | | Mitsui & Co., Ltd. | | 2,118,750 |
| 82,600 | | Mitsui Chemicals, Inc. | | 1,759,390 |
| 15,400 | | Mitsui High-Tec, Inc. | | 955,690 |
| 93,500 | | Mitsui OSK Lines Ltd. | | 2,139,722 |
| 16,100 | | MS&AD Insurance Group Holdings, Inc. | | 493,395 |
| 12,500 | | NEC Corp. | | 485,517 |
| 109,400 | | NGK Insulators Ltd. | | 1,473,933 |
| 48,600 | | Nikon Corp. | | 562,009 |
| 147,100 | | Nippon Steel Corp. | | 2,058,836 |
| 18,000 | | Nippon Telegraph & Telephone Corp. | | 516,863 |
| 29,700 | | Nippon Yusen KK | | 2,029,179 |
| 116,500 | | Nissan Motor Co., Ltd. | | 453,533 |
| 315,500 | | Oji Holdings Corp. | | 1,367,291 |
| 26,300 | | ORIX Corp. | | 441,176 |
| 30,600 | | Osaka Gas Co., Ltd. | | 585,478 |
| 61,900 | | SBI Holdings, Inc. | | 1,211,265 |
| 10,500 | | SCREEN Holdings Co., Ltd. | | 709,648 |
| 30,300 | | Sega Sammy Holdings, Inc. | | 486,390 |
| 69,300 | | Seiko Epson Corp. | | 980,660 |
| 44,100 | | Seven & i Holdings Co., Ltd. | | 1,711,930 |
Page 56
See Notes to Financial Statements
First Trust Developed Markets ex-US AlphaDEX® Fund (FDT)
Portfolio of Investments (Continued)
June 30, 2022 (Unaudited)
| Shares | | Description | | Value |
| COMMON STOCKS (a) (Continued) |
| | | Japan (Continued) | | |
| 32,700 | | Shinko Electric Industries Co., Ltd. | | $843,529 |
| 28,600 | | Shinsei Bank Ltd. | | 431,066 |
| 46,000 | | SoftBank Group Corp. | | 1,774,838 |
| 158,000 | | Sojitz Corp. | | 2,237,014 |
| 35,500 | | Sompo Holdings, Inc. | | 1,565,422 |
| 340,500 | | Sumitomo Chemical Co., Ltd. | | 1,332,588 |
| 120,400 | | Sumitomo Corp. | | 1,647,868 |
| 87,200 | | Sumitomo Electric Industries Ltd. | | 963,390 |
| 41,200 | | Sumitomo Metal Mining Co., Ltd. | | 1,290,537 |
| 76,600 | | T&D Holdings, Inc. | | 916,851 |
| 17,900 | | Tokio Marine Holdings, Inc. | | 1,042,628 |
| 316,800 | | Tokyo Electric Power Co., Holdings, Inc. (b) | | 1,323,892 |
| 117,800 | | Toppan, Inc. | | 1,968,253 |
| 199,800 | | Toray Industries, Inc. | | 1,120,930 |
| 176,080 | | Tosoh Corp. | | 2,186,725 |
| 57,300 | | Toyota Motor Corp. | | 886,866 |
| 12,700 | | Toyota Tsusho Corp. | | 414,659 |
| 92,800 | | Yamaha Motor Co., Ltd. (c) | | 1,700,330 |
| | | | | 86,417,105 |
| | | Jersey – 0.8% | | |
| 399,410 | | Glencore PLC | | 2,164,084 |
| 341,373 | | Man Group PLC | | 1,038,052 |
| | | | | 3,202,136 |
| | | Luxembourg – 0.9% | | |
| 80,656 | | ArcelorMittal S.A. | | 1,818,099 |
| 137,443 | | Tenaris S.A. | | 1,767,290 |
| | | | | 3,585,389 |
| | | Netherlands – 2.0% | | |
| 22,383 | | ASR Nederland N.V. | | 904,708 |
| 51,134 | | Koninklijke Philips N.V. | | 1,101,458 |
| 20,614 | | NN Group N.V. | | 936,250 |
| 73,666 | | OCI N.V. | | 2,430,202 |
| 38,919 | | Prosus N.V. | | 2,548,257 |
| | | | | 7,920,875 |
| | | New Zealand – 0.3% | | |
| 274,933 | | Infratil Ltd. | | 1,318,728 |
| | | Norway – 2.2% | | |
| 55,637 | | Aker BP ASA | | 1,932,386 |
| 34,357 | | Aker BP ASA, SDR (b) | | 1,193,288 |
| 69,830 | | Equinor ASA | | 2,428,527 |
| 40,795 | | Kongsberg Gruppen ASA | | 1,462,038 |
| 56,685 | | Leroy Seafood Group ASA | | 402,562 |
| 164,908 | | Norsk Hydro ASA | | 923,513 |
| 52,075 | | Storebrand ASA | | 370,616 |
| | | | | 8,712,930 |
| Shares | | Description | | Value |
|
| | | Portugal – 0.7% | | |
| 81,454 | | Banco Espirito Santo
S.A. (b) (d) (e) (h) (i) | | $0 |
| 123,138 | | Galp Energia SGPS S.A. | | 1,443,340 |
| 65,250 | | Jeronimo Martins SGPS S.A. | | 1,418,175 |
| | | | | 2,861,515 |
| | | Singapore – 1.8% | | |
| 113,800 | | Jardine Cycle & Carriage Ltd. | | 2,317,283 |
| 443,600 | | Keppel Corp., Ltd. | | 2,072,241 |
| 302,200 | | Wilmar International Ltd. | | 878,779 |
| 2,770,500 | | Yangzijiang Shipbuilding Holdings Ltd. | | 1,854,578 |
| | | | | 7,122,881 |
| | | South Korea – 10.5% | | |
| 1,724 | | CJ CheilJedang Corp. | | 503,232 |
| 18,611 | | Coway Co., Ltd. | | 915,929 |
| 27,358 | | DB Insurance Co., Ltd. | | 1,291,625 |
| 13,116 | | Hana Financial Group, Inc. | | 397,500 |
| 17,731 | | Hanwha Solutions Corp. (b) | | 517,564 |
| 87,470 | | HMM Co., Ltd. | | 1,657,241 |
| 9,935 | | Hyundai Glovis Co., Ltd. | | 1,373,485 |
| 8,894 | | Hyundai Mobis Co., Ltd. | | 1,363,144 |
| 7,063 | | Hyundai Motor Co. | | 981,879 |
| 61,365 | | Hyundai Steel Co. | | 1,517,111 |
| 58,749 | | Industrial Bank of Korea | | 435,278 |
| 10,398 | | KB Financial Group, Inc. | | 385,600 |
| 34,457 | | Kia Corp. | | 2,051,391 |
| 4,358 | | Korea Zinc Co., Ltd. | | 1,636,264 |
| 71,421 | | KT Corp. | | 2,005,003 |
| 7,899 | | KT&G Corp. | | 500,075 |
| 5,646 | | L&F Co., Ltd. (b) | | 913,170 |
| 1,197 | | LG Chem Ltd. | | 475,702 |
| 41,717 | | LG Corp. | | 2,502,891 |
| 92,604 | | LG Display Co., Ltd. (c) | | 1,037,730 |
| 8,235 | | LG Innotek Co., Ltd. | | 2,172,279 |
| 136,593 | | LG Uplus Corp. | | 1,341,313 |
| 15,213 | | Lotte Chemical Corp. | | 2,109,011 |
| 31,362 | | Meritz Financial Group, Inc. (c) | | 624,390 |
| 67,169 | | Meritz Fire & Marine Insurance Co., Ltd. | | 1,714,920 |
| 74,467 | | Mirae Asset Securities Co., Ltd. | | 379,676 |
| 10,878 | | POSCO Holdings, Inc. | | 1,931,130 |
| 18,317 | | Samsung Electronics Co., Ltd. | | 804,120 |
| 72,989 | | Samsung Engineering Co., Ltd. (b) | | 1,211,424 |
| 34,272 | | SD Biosensor, Inc. | | 1,025,468 |
| 21,608 | | SK Hynix, Inc. | | 1,514,424 |
| 33,610 | | SK Telecom Co., Ltd. | | 1,346,057 |
| 2,635 | | SK, Inc. | | 436,325 |
| 13,183 | | S-Oil Corp. | | 1,055,940 |
| 166,105 | | Woori Financial Group, Inc. | | 1,547,959 |
| | | | | 41,676,250 |
| | | Spain – 2.0% | | |
| 8,172 | | Acciona S.A. | | 1,502,955 |
See Notes to Financial Statements
Page 57
First Trust Developed Markets ex-US AlphaDEX® Fund (FDT)
Portfolio of Investments (Continued)
June 30, 2022 (Unaudited)
| Shares | | Description | | Value |
| COMMON STOCKS (a) (Continued) |
| | | Spain (Continued) | | |
| 1,901,709 | | Banco de Sabadell S.A. | | $1,515,797 |
| 34,805 | | Naturgy Energy Group S.A. | | 1,001,938 |
| 158,550 | | Repsol S.A. | | 2,334,442 |
| 323,098 | | Telefonica S.A. | | 1,646,227 |
| | | | | 8,001,359 |
| | | Sweden – 4.1% | | |
| 48,017 | | Axfood AB | | 1,381,403 |
| 42,760 | | Boliden AB | | 1,359,952 |
| 63,021 | | Castellum AB (c) | | 809,806 |
| 35,133 | | Fabege AB | | 331,694 |
| 94,645 | | Fastighets AB Balder, Class B (b) | | 453,437 |
| 18,583 | | Holmen AB, Class B | | 753,693 |
| 92,856 | | Industrivarden AB, Class C | | 2,065,030 |
| 118,868 | | Investor AB, Class B | | 1,954,224 |
| 99,009 | | Kinnevik AB, Class B (b) | | 1,595,023 |
| 36,822 | | Orron Energy AB (c) | | 25,160 |
| 57,354 | | Saab AB, Class B | | 2,369,344 |
| 579,990 | | Samhallsbyggnadsbolaget i Norden AB (c) | | 965,823 |
| 31,835 | | SKF AB, Class B | | 468,356 |
| 388,344 | | SSAB AB, Class B | | 1,606,561 |
| | | | | 16,139,506 |
| | | Switzerland – 1.6% | | |
| 5,862 | | Baloise Holding AG | | 957,299 |
| 60,155 | | Clariant AG (b) | | 1,145,569 |
| 12,028 | | Helvetia Holding AG | | 1,407,351 |
| 10,685 | | Holcim AG | | 457,217 |
| 815 | | Swiss Life Holding AG | | 396,978 |
| 26,671 | | UBS Group AG | | 429,966 |
| 3,178 | | Zurich Insurance Group AG | | 1,382,188 |
| | | | | 6,176,568 |
| | | United Kingdom – 6.6% | | |
| 143,828 | | 3i Group PLC | | 1,940,782 |
| 929,290 | | abrdn PLC | | 1,808,263 |
| 50,274 | | Anglo American PLC | | 1,797,401 |
| 23,873 | | Antofagasta PLC | | 335,650 |
| 3,943 | | AstraZeneca PLC | | 518,380 |
| 111,349 | | BAE Systems PLC | | 1,125,296 |
| 229,370 | | Barratt Developments PLC | | 1,277,116 |
| 10,679 | | Berkeley Group Holdings PLC | | 484,103 |
| 2,493,807 | | Centrica PLC (b) | | 2,428,569 |
| 27,153 | | Computacenter PLC | | 777,415 |
| 254,077 | | Drax Group PLC | | 1,988,721 |
| 97,536 | | IG Group Holdings PLC | | 819,834 |
| 24,801 | | Imperial Brands PLC | | 554,293 |
| 84,601 | | Investec PLC | | 458,076 |
| 625,542 | | Kingfisher PLC | | 1,860,277 |
| 361,129 | | M&G PLC | | 855,466 |
| 18,567 | | Persimmon PLC | | 421,068 |
| 19,704 | | Rio Tinto PLC | | 1,179,256 |
| 607,005 | | Royal Mail PLC | | 1,992,833 |
| Shares | | Description | | Value |
|
| | | United Kingdom (Continued) | | |
| 94,714 | | Shell PLC | | $2,460,403 |
| 611,184 | | Taylor Wimpey PLC | | 867,869 |
| | | | | 25,951,071 |
| | | Total Common Stocks | | 380,793,387 |
| | | (Cost $425,654,063) | | |
| REAL ESTATE INVESTMENT TRUSTS (a) – 3.7% |
| | | Australia – 1.3% | | |
| 191,861 | | Dexus | | 1,175,997 |
| 540,761 | | GPT (The) Group | | 1,575,158 |
| 562,482 | | Mirvac Group | | 766,800 |
| 656,009 | | Stockland | | 1,634,645 |
| | | | | 5,152,600 |
| | | Belgium – 0.2% | | |
| 24,176 | | Warehouses De Pauw CVA | | 760,057 |
| | | Canada – 1.3% | | |
| 48,974 | | Canadian Apartment Properties REIT (c) | | 1,705,263 |
| 34,075 | | Granite Real Estate Investment Trust | | 2,089,979 |
| 60,023 | | SmartCentres Real Estate Investment Trust (c) | | 1,281,877 |
| | | | | 5,077,119 |
| | | United Kingdom – 0.9% | | |
| 148,423 | | Segro PLC | | 1,764,836 |
| 825,908 | | Tritax Big Box REIT PLC | | 1,824,761 |
| | | | | 3,589,597 |
| | | Total Real Estate Investment Trusts | | 14,579,373 |
| | | (Cost $17,415,819) | | |
| MONEY MARKET FUNDS – 2.2% |
| 8,652,044 | | Goldman Sachs Financial Square Treasury Obligations Fund - Institutional Class - 1.39% (j) (k) | | 8,652,044 |
| | | (Cost $8,652,044) | | |
Page 58
See Notes to Financial Statements
First Trust Developed Markets ex-US AlphaDEX® Fund (FDT)
Portfolio of Investments (Continued)
June 30, 2022 (Unaudited)
Principal
Value | | Description | | Value |
| REPURCHASE AGREEMENTS – 2.0% |
| $8,137,089 | | BNP Paribas S.A., 1.44% (j), dated 6/30/22, due 7/01/22, with a maturity value of $8,137,415. Collateralized by U.S. Treasury Note, interest rate of 1.25%, due 5/31/28. The value of the collateral including accrued interest is $8,316,926. (k) | | $8,137,089 |
| | | (Cost $8,137,089) | | |
| | | Total Investments – 103.8% | | 412,161,893 |
| | | (Cost $459,859,015) | | |
| | | Net Other Assets and Liabilities – (3.8)% | | (15,093,478) |
| | | Net Assets – 100.0% | | $397,068,415 |
| (a) | Portfolio securities are categorized based upon their country of incorporation, which can be different from the country categorization of the Fund’s underlying index. For a breakdown of the portfolio securities by sector, please see the Fund Performance Overview. |
| (b) | Non-income producing security. |
| (c) | All or a portion of this security is on loan (see Note 2F - Securities Lending in the Notes to Financial Statements). The remaining contractual maturity of all of the securities lending transactions is overnight and continuous. The aggregate value of such securities is $14,628,668 and the total value of the collateral held by the Fund is $16,789,133. |
| (d) | This security is fair valued by the Advisor’s Pricing Committee in accordance with procedures adopted by the Trust’s Board of Trustees, and in accordance with the provisions of the Investment Company Act of 1940, as amended. At June 30, 2022, securities noted as such are valued at $465,820 or 0.1% of net assets. |
| (e) | Pursuant to procedures adopted by the Trust’s Board of Trustees, this security has been determined to be illiquid by First Trust Advisors L.P., the Fund’s advisor. |
| (f) | This security may be resold to qualified foreign investors and foreign institutional buyers under Regulation S of the Securities Act of 1933, as amended (the “1933 Act”). |
| (g) | This security is exempt from registration upon resale under Rule 144A of the 1933 Act and may be resold in transactions exempt from registration, normally to qualified institutional buyers. This security is not restricted on the foreign exchange where it trades freely without any additional registration. As such, it does not require the additional disclosure required of restricted securities. |
| (h) | This issuer has filed for protection in bankruptcy court. |
| (i) | This security’s value was determined using significant unobservable inputs (see Note 2A – Portfolio Valuation in the Notes to Financial Statements). |
| (j) | Rate shown reflects yield as of June 30, 2022. |
| (k) | This security serves as collateral for securities on loan. |
| SDR | Swedish Depositary Receipt |
Offsetting Assets and Liabilities
Offsetting assets and liabilities requires entities to disclose both gross and net information about instruments and transactions eligible for offset, and to disclose instruments and transactions subject to master netting or similar agreements (see Note 2E – Offsetting on the Statements of Assets and Liabilities in the Notes to Financial Statements).
The Fund’s loaned securities were all subject to an enforceable Securities Lending Agency Agreement. Securities lent in accordance with the Securities Lending Agency Agreement on a gross basis were as follows:
| Security Lending Agency Agreement | |
| Total gross amount presented on the Statements of Assets and Liabilities (1) | $14,628,668 |
| Non-cash Collateral (2) | (14,628,668) |
| Net Amount | $— |
| (1) | The amount presented on the Statements of Assets and Liabilities, which is included in “Investments, at value,” is not offset and is shown on a gross basis. |
| (2) | At June 30, 2022, the value of the collateral received from each borrower exceeded the value of the related securities loaned. This amount is disclosed on the Portfolio of Investments. |
| Repurchase Agreements | |
| Total gross amount presented on the Statements of Assets and Liabilities (3) | $8,137,089 |
| Non-cash Collateral (4) | (8,137,089) |
| Net Amount | $— |
| (3) | The amount is included in “Investments, at value” on the Statements of Assets and Liabilities. |
| (4) | At June 30, 2022, the value of the collateral received from each seller exceeded the value of the repurchase agreements. |
See Notes to Financial Statements
Page 59
First Trust Developed Markets ex-US AlphaDEX® Fund (FDT)
Portfolio of Investments (Continued)
June 30, 2022 (Unaudited)
Currency Exposure
Diversification | % of Total
Investments |
| Japanese Yen | 21.0% |
| Euro | 20.0 |
| Canadian Dollar | 15.6 |
| South Korean Won | 10.1 |
| British Pound Sterling | 7.9 |
| Australian Dollar | 6.0 |
| Swedish Krona | 4.2 |
| United States Dollar | 4.1 |
| Hong Kong Dollar | 3.6 |
| Norwegian Krone | 1.8 |
| Singapore Dollar | 1.7 |
| Israeli Shekel | 1.7 |
| Swiss Franc | 1.5 |
| Danish Krone | 0.5 |
| New Zealand Dollar | 0.3 |
| Total | 100.0% |
Valuation Inputs
A summary of the inputs used to value the Fund’s investments as of June 30, 2022 is as follows (see Note 2A - Portfolio Valuation in the Notes to Financial Statements):
| | Total
Value at
6/30/2022 | Level 1
Quoted
Prices | Level 2
Significant
Observable
Inputs | Level 3
Significant
Unobservable
Inputs |
| Common Stocks: | | | | |
| Cayman Islands | $ 6,046,417 | $ 5,580,597 | $ 465,820 | $ — |
| Portugal | 2,861,515 | 2,861,515 | — | —** |
| Other Country Categories* | 371,885,455 | 371,885,455 | — | — |
| Real Estate Investment Trusts* | 14,579,373 | 14,579,373 | — | — |
| Money Market Funds | 8,652,044 | 8,652,044 | — | — |
| Repurchase Agreements | 8,137,089 | — | 8,137,089 | — |
| Total Investments | $ 412,161,893 | $ 403,558,984 | $ 8,602,909 | $—** |
| * | See Portfolio of Investments for country breakout. |
| ** | Investment is valued at $0. |
Level 3 investments are fair valued by the Advisor’s Pricing Committee and are footnoted in the Portfolio of Investments. The Level 3 investments values are based on unobservable and non-quantitative inputs.
Page 60
See Notes to Financial Statements
First Trust Emerging Markets AlphaDEX® Fund (FEM)
Portfolio of Investments
June 30, 2022 (Unaudited)
| Shares | | Description | | Value |
| COMMON STOCKS (a) – 98.1% |
| | | Bermuda – 2.3% | | |
| 2,008,270 | | China Gas Holdings Ltd. | | $3,101,931 |
| 4,993 | | Credicorp Ltd. | | 598,711 |
| 4,918,980 | | Kunlun Energy Co., Ltd. | | 4,030,820 |
| | | | | 7,731,462 |
| | | Brazil – 9.9% | | |
| 362,165 | | Atacadao S.A. | | 1,153,597 |
| 470,085 | | Banco do Brasil S.A. | | 2,998,297 |
| 85,474 | | Cia de Saneamento Basico do Estado de Sao Paulo | | 688,731 |
| 308,471 | | Cia de Transmissao de Energia Electrica Paulista (Preference Shares) | | 1,353,902 |
| 1,045,637 | | Cia Energetica de Minas Gerais (Preference Shares) | | 2,073,912 |
| 2,697,080 | | Cia Paranaense de Energia, Class B (Preference Shares) | | 3,519,869 |
| 626,659 | | Cia Siderurgica Nacional S.A. | | 1,848,802 |
| 167,096 | | Energisa S.A. | | 1,288,313 |
| 299,742 | | Equatorial Energia S.A. | | 1,308,144 |
| 661,795 | | Gerdau S.A. (Preference Shares) | | 2,826,265 |
| 210,694 | | Hypera S.A. | | 1,531,456 |
| 758,695 | | Itausa S.A. (Preference Shares) | | 1,209,053 |
| 328,605 | | JBS S.A. | | 1,983,516 |
| 609,564 | | Petroleo Brasileiro S.A. (Preference Shares) | | 3,253,136 |
| 151,908 | | Telefonica Brasil S.A. | | 1,365,980 |
| 591,441 | | TIM S.A. | | 1,442,029 |
| 127,970 | | Vale S.A. | | 1,872,070 |
| 348,844 | | Vibra Energia S.A. | | 1,113,832 |
| | | | | 32,830,904 |
| | | Cayman Islands – 7.4% | | |
| 1,467,195 | | China Conch Venture Holdings Ltd. | | 3,197,359 |
| 2,570,259 | | China Hongqiao Group Ltd. | | 2,905,413 |
| 4,116,756 | | China Resources Cement Holdings Ltd. | | 2,764,860 |
| 184,945 | | China Resources Land Ltd. | | 862,643 |
| 2,564,705 | | China State Construction International Holdings Ltd. | | 2,837,034 |
| 1,516,560 | | CIFI Holdings Group Co., Ltd. | | 761,488 |
| 1,114,529 | | Country Garden Holdings Co., Ltd. | | 690,296 |
| 1,877,226 | | Greentown China Holdings Ltd. | | 3,889,954 |
| 330,526 | | Haitian International Holdings Ltd. | | 844,554 |
| 882,159 | | Kingboard Holdings Ltd. | | 3,338,956 |
| 1,042,094 | | Kingboard Laminates Holdings Ltd. | | 1,285,552 |
| 1,757,614 | | Sunac China Holdings Ltd. (b) | | 1,025,880 |
| | | | | 24,403,989 |
| Shares | | Description | | Value |
|
| | | Chile – 3.2% | | |
| 45,374,639 | | Cia Sud Americana de Vapores S.A. | | $4,054,124 |
| 415,579 | | Empresas Copec S.A. | | 3,065,951 |
| 39,719 | | Sociedad Quimica y Minera de Chile S.A., Class B (Preference Shares) | | 3,311,179 |
| | | | | 10,431,254 |
| | | China – 15.6% | | |
| 9,309,253 | | Angang Steel Co., Ltd., Class H | | 3,476,081 |
| 833,770 | | Anhui Conch Cement Co., Ltd., Class H | | 3,612,706 |
| 2,133,210 | | Bank of China Ltd., Class H | | 850,913 |
| 5,292,356 | | BBMG Corp., Class H | | 768,885 |
| 5,015,774 | | China Cinda Asset Management Co., Ltd., Class H | | 786,232 |
| 5,705,213 | | China Coal Energy Co., Ltd., Class H | | 4,835,049 |
| 1,140,755 | | China Construction Bank Corp., Class H | | 766,144 |
| 2,069,265 | | China National Building Material Co., Ltd., Class H | | 2,209,874 |
| 5,130,807 | | China Petroleum & Chemical Corp., Class H | | 2,308,170 |
| 3,061,663 | | China Railway Group Ltd., Class H | | 1,892,372 |
| 1,338,559 | | China Shenhua Energy Co., Ltd., Class H | | 3,838,199 |
| 15,274,277 | | China Tower Corp., Ltd., Class H (c) (d) | | 1,966,027 |
| 983,917 | | COSCO SHIPPING Holdings Co., Ltd., Class H | | 1,374,284 |
| 5,704,847 | | Dongfeng Motor Group Co., Ltd., Class H | | 4,333,090 |
| 1,027,888 | | Guangzhou Automobile Group Co., Ltd., Class H | | 994,249 |
| 1,647,311 | | Inner Mongolia ERDOS Resources Co., Ltd., Class B | | 2,895,973 |
| 819,692 | | Jiangsu Expressway Co., Ltd., Class H | | 825,249 |
| 8,534,168 | | Maanshan Iron & Steel Co., Ltd., Class H (e) | | 2,588,484 |
| 1,675,760 | | PICC Property & Casualty Co., Ltd., Class H | | 1,742,647 |
| 751,682 | | Sinopharm Group Co., Ltd., Class H | | 1,822,015 |
| 1,155,521 | | Yankuang Energy Group Co., Ltd., Class H | | 3,622,600 |
| 2,228,338 | | Zijin Mining Group Co., Ltd., Class H | | 2,729,052 |
| 2,693,639 | | Zoomlion Heavy Industry Science and Technology Co., Ltd., Class H | | 1,438,338 |
| | | | | 51,676,633 |
See Notes to Financial Statements
Page 61
First Trust Emerging Markets AlphaDEX® Fund (FEM)
Portfolio of Investments (Continued)
June 30, 2022 (Unaudited)
| Shares | | Description | | Value |
| COMMON STOCKS (a) (Continued) |
| | | Colombia – 0.2% | | |
| 79,915 | | Bancolombia S.A. (Preference Shares) | | $610,234 |
| | | Czech Republic – 0.6% | | |
| 40,689 | | CEZ A.S. | | 1,832,108 |
| | | Hong Kong – 6.0% | | |
| 1,081,998 | | Beijing Enterprises Holdings Ltd. | | 3,847,141 |
| 1,701,670 | | BYD Electronic International Co., Ltd. (e) | | 5,367,326 |
| 1,419,657 | | China Merchants Port Holdings Co., Ltd. | | 2,413,496 |
| 1,146,601 | | China Overseas Land & Investment Ltd. | | 3,623,860 |
| 1,575,669 | | Fosun International Ltd. | | 1,455,829 |
| 2,240,122 | | Sinotruk Hong Kong Ltd. | | 3,140,305 |
| | | | | 19,847,957 |
| | | Hungary – 1.1% | | |
| 483,357 | | MOL Hungarian Oil & Gas PLC | | 3,728,018 |
| | | India – 9.8% | | |
| 129,104 | | Adani Enterprises Ltd. | | 3,581,676 |
| 351,312 | | Adani Power Ltd. (f) | | 1,169,298 |
| 1,748,062 | | Bank of Baroda | | 2,155,956 |
| 542,879 | | Bharat Petroleum Corp., Ltd. | | 2,120,028 |
| 1,253,349 | | GAIL India Ltd. | | 2,145,719 |
| 570,921 | | Hindalco Industries Ltd. | | 2,448,224 |
| 545,308 | | Indian Hotels Co., Ltd. | | 1,554,669 |
| 28,841 | | Info Edge India Ltd. | | 1,372,725 |
| 355,029 | | JSW Steel Ltd. | | 2,537,768 |
| 1,979,540 | | Steel Authority of India Ltd. | | 1,718,288 |
| 22,068 | | Tata Elxsi Ltd. | | 2,283,171 |
| 299,840 | | Tata Motors Ltd. (f) | | 1,563,508 |
| 1,089,929 | | Tata Power (The) Co., Ltd. | | 2,790,638 |
| 248,730 | | Tata Steel Ltd. | | 2,730,841 |
| 806,098 | | Vedanta Ltd. | | 2,276,233 |
| | | | | 32,448,742 |
| | | Indonesia – 3.8% | | |
| 22,908,413 | | Adaro Energy Indonesia Tbk PT | | 4,397,923 |
| 5,623,449 | | Astra International Tbk PT | | 2,500,778 |
| 780,046 | | Gudang Garam Tbk PT | | 1,632,350 |
| 964,753 | | United Tractors Tbk PT | | 1,839,167 |
| 5,518,534 | | Vale Indonesia Tbk PT (f) | | 2,092,950 |
| | | | | 12,463,168 |
| | | Malaysia – 1.5% | | |
| 429,600 | | Kuala Lumpur Kepong Bhd | | 2,138,497 |
| 2,178,100 | | Sime Darby Plantation Bhd | | 2,139,801 |
| 400,900 | | Tenaga Nasional Bhd | | 725,849 |
| | | | | 5,004,147 |
| | | Mexico – 2.4% | | |
| 3,201,803 | | Cemex S.A.B. de C.V., Series CPO (f) | | 1,249,865 |
| Shares | | Description | | Value |
|
| | | Mexico (Continued) | | |
| 674,695 | | El Puerto de Liverpool S.A.B. de C.V. | | $2,921,290 |
| 103,493 | | Fomento Economico Mexicano S.A.B. de C.V., Series UBD | | 698,531 |
| 459,982 | | Grupo Carso S.A.B. de C.V., Series A1 | | 1,702,044 |
| 410,694 | | Grupo Financiero Inbursa S.A.B. de C.V., Class O (f) | | 657,208 |
| 143,812 | | Grupo Mexico S.A.B. de C.V., Series B | | 599,363 |
| | | | | 7,828,301 |
| | | Philippines – 0.7% | | |
| 356,580 | | Manila Electric Co. | | 2,334,615 |
| | | Poland – 3.8% | | |
| 644,131 | | Cyfrowy Polsat S.A. | | 3,050,042 |
| 82,735 | | KGHM Polska Miedz S.A. (f) | | 2,195,116 |
| 1,568,514 | | PGE Polska Grupa Energetyczna S.A. (f) | | 3,729,307 |
| 235,215 | | Polski Koncern Naftowy ORLEN S.A. | | 3,596,406 |
| | | | | 12,570,871 |
| | | Russia – 0.1% | | |
| 76,383,797 | | Inter RAO UES PJSC (b) (g) (h) | | 99,104 |
| 11,679 | | Magnit PJSC (b) (g) (h) | | 16,480 |
| 4,142,443 | | Magnitogorsk Iron & Steel Works PJSC (b) (g) (h) | | 91,167 |
| 262,800,255 | | RusHydro PJSC (b) (g) (h) | | 83,714 |
| 403,137 | | Tatneft PJSC (b) (g) (h) | | 68,795 |
| | | | | 359,260 |
| | | Singapore – 0.3% | | |
| 108,476 | | BOC Aviation Ltd. (c) (d) | | 911,708 |
| | | South Africa – 12.3% | | |
| 131,695 | | Absa Group Ltd. | | 1,251,482 |
| 175,293 | | African Rainbow Minerals Ltd. | | 2,303,120 |
| 168,172 | | Bidvest Group (The) Ltd. | | 2,166,557 |
| 275,348 | | Discovery Ltd. (f) | | 2,168,088 |
| 169,819 | | Exxaro Resources Ltd. | | 2,068,673 |
| 323,739 | | FirstRand Ltd. | | 1,241,128 |
| 167,178 | | Impala Platinum Holdings Ltd. | | 1,861,398 |
| 66,000 | | MTN Group Ltd. | | 535,667 |
| 30,142 | | Naspers Ltd., Class N | | 4,386,804 |
| 107,607 | | Nedbank Group Ltd. | | 1,370,888 |
| 2,732,030 | | Old Mutual Ltd. | | 1,852,281 |
| 540,518 | | Pepkor Holdings Ltd. (c) (d) | | 635,249 |
| 1,948,462 | | Rand Merchant Investment Holdings Ltd. | | 3,334,318 |
| 251,102 | | Remgro Ltd. | | 2,005,112 |
| 868,422 | | Sanlam Ltd. | | 2,822,188 |
| 176,620 | | Sasol Ltd. (f) | | 4,035,105 |
| 158,962 | | Shoprite Holdings Ltd. | | 1,933,486 |
| 629,098 | | Sibanye Stillwater Ltd. | | 1,572,672 |
Page 62
See Notes to Financial Statements
First Trust Emerging Markets AlphaDEX® Fund (FEM)
Portfolio of Investments (Continued)
June 30, 2022 (Unaudited)
| Shares | | Description | | Value |
| COMMON STOCKS (a) (Continued) |
| | | South Africa (Continued) | | |
| 344,241 | | Standard Bank Group Ltd. | | $3,283,342 |
| | | | | 40,827,558 |
| | | Taiwan – 10.2% | | |
| 712,692 | | ASE Technology Holding Co., Ltd. | | 1,831,257 |
| 197,493 | | Asustek Computer, Inc. | | 2,062,373 |
| 6,193,419 | | AU Optronics Corp. | | 3,395,252 |
| 1,280,619 | | China Development Financial Holding Corp. | | 633,128 |
| 1,893,803 | | China Steel Corp. | | 1,812,054 |
| 917,458 | | Compal Electronics, Inc. | | 701,975 |
| 836,322 | | CTBC Financial Holding Co., Ltd. | | 705,994 |
| 743,960 | | E.Sun Financial Holding Co., Ltd. | | 725,607 |
| 762,415 | | Eva Airways Corp. | | 811,557 |
| 728,529 | | Evergreen Marine Corp. Taiwan Ltd. | | 2,072,866 |
| 230,872 | | Formosa Plastics Corp. | | 842,471 |
| 7,317,820 | | Innolux Corp. | | 2,977,975 |
| 1,421,264 | | Nanya Technology Corp. | | 2,361,325 |
| 1,240,246 | | Ruentex Development Co., Ltd. | | 3,061,666 |
| 1,632,661 | | Synnex Technology International Corp. | | 2,921,202 |
| 197,493 | | Unimicron Technology Corp. | | 1,052,773 |
| 455,331 | | United Microelectronics Corp. | | 599,533 |
| 465,386 | | Wan Hai Lines Ltd. | | 1,862,577 |
| 1,576,146 | | Winbond Electronics Corp. | | 1,150,297 |
| 789,972 | | Yang Ming Marine Transport Corp. | | 2,186,581 |
| | | | | 33,768,463 |
| | | Thailand – 2.8% | | |
| 386,600 | | Jasmine Technology Solution PCL (f) | | 1,530,873 |
| 594,500 | | PTT Exploration & Production PCL | | 2,682,018 |
| 2,811,200 | | PTT Global Chemical PCL | | 3,617,864 |
| 741,100 | | PTT PCL | | 712,697 |
| 74,500 | | Siam Cement (The) PCL | | 788,092 |
| | | | | 9,331,544 |
| | | Turkey – 4.1% | | |
| 3,354,861 | | Enka Insaat ve Sanayi A.S. | | 3,465,157 |
| 1,940,110 | | Eregli Demir ve Celik Fabrikalari T.A.S. | | 3,154,622 |
| 210,703 | | Ford Otomotiv Sanayi A.S. | | 3,370,491 |
| 1,586,918 | | KOC Holding A.S. | | 3,479,739 |
| | | | | 13,470,009 |
| | | Total Common Stocks | | 324,410,945 |
| | | (Cost $383,571,918) | | |
| Shares | | Description | | Value |
| MONEY MARKET FUNDS – 0.1% |
| 474,319 | | Goldman Sachs Financial Square Treasury Obligations Fund - Institutional Class - 1.39% (i) (j) | | $474,319 |
| | | (Cost $474,319) | | |
Principal
Value | | Description | | Value |
| REPURCHASE AGREEMENTS – 0.1% |
| $446,088 | | BNP Paribas S.A., 1.44% (i), dated 6/30/22, due 7/1/22, with a maturity value of $446,106. Collateralized by U.S. Treasury Note, interest rate of 1.25%, due 5/31/28. The value of the collateral including accrued interest is $455,947. (j) | | 446,088 |
| | | (Cost $446,088) | | |
| | | Total Investments – 98.3% | | 325,331,352 |
| | | (Cost $384,492,325) | | |
| | | Net Other Assets and Liabilities – 1.7% | | 5,495,279 |
| | | Net Assets – 100.0% | | $330,826,631 |
| (a) | Portfolio securities are categorized based upon their country of incorporation, which can be different from the country categorization of the Fund’s underlying index. For a breakdown of the portfolio securities by sector, please see the Fund Performance Overview. |
| (b) | This security is fair valued by the Advisor’s Pricing Committee in accordance with procedures adopted by the Trust’s Board of Trustees, and in accordance with the provisions of the Investment Company Act of 1940, as amended. At June 30, 2022, securities noted as such are valued at $1,385,140 or 0.4% of net assets. |
| (c) | This security may be resold to qualified foreign investors and foreign institutional buyers under Regulation S of the Securities Act of 1933, as amended (the “1933 Act”). |
| (d) | This security is exempt from registration upon resale under Rule 144A of the 1933 Act and may be resold in transactions exempt from registration, normally to qualified institutional buyers. This security is not restricted on the foreign exchange where it trades freely without any additional registration. As such, it does not require the additional disclosure required of restricted securities. |
| (e) | All or a portion of this security is on loan (see Note 2F - Securities Lending in the Notes to Financial Statements). The remaining contractual maturity of all of the securities lending transactions is overnight and continuous. The aggregate value of such securities is $873,531 and the total value of the collateral held by the Fund is $920,407. |
| (f) | Non-income producing security. |
| (g) | Pursuant to procedures adopted by the Trust’s Board of Trustees, this security has been determined to be illiquid by First Trust Advisors L.P., the Fund’s advisor. |
See Notes to Financial Statements
Page 63
First Trust Emerging Markets AlphaDEX® Fund (FEM)
Portfolio of Investments (Continued)
June 30, 2022 (Unaudited)
| (h) | This security’s value was determined using significant unobservable inputs (see Note 2A – Portfolio Valuation in the Notes to Financial Statements). |
| (i) | Rate shown reflects yield as of June 30, 2022. |
| (j) | This security serves as collateral for securities on loan. |
Offsetting Assets and Liabilities
Offsetting assets and liabilities requires entities to disclose both gross and net information about instruments and transactions eligible for offset, and to disclose instruments and transactions subject to master netting or similar agreements (see Note 2E – Offsetting on the Statements of Assets and Liabilities in the Notes to Financial Statements).
The Fund’s loaned securities were all subject to an enforceable Securities Lending Agency Agreement. Securities lent in accordance with the Securities Lending Agency Agreement on a gross basis were as follows:
| Security Lending Agency Agreement | |
| Total gross amount presented on the Statements of Assets and Liabilities (1) | $873,531 |
| Non-cash Collateral (2) | (873,531) |
| Net Amount | $— |
| (1) | The amount presented on the Statements of Assets and Liabilities, which is included in “Investments, at value,” is not offset and is shown on a gross basis. |
| (2) | At June 30, 2022, the value of the collateral received from each borrower exceeded the value of the related securities loaned. This amount is disclosed on the Portfolio of Investments. |
The Fund’s investments in repurchase agreements were all subject to an enforceable Master Repurchase Agreement. Repurchase Agreements on a gross basis were as follows:
| Repurchase Agreements | |
| Total gross amount presented on the Statements of Assets and Liabilities (3) | $446,088 |
| Non-cash Collateral (4) | (446,088) |
| Net Amount | $— |
| (3) | The amount is included in “Investments, at value” on the Statements of Assets and Liabilities. |
| (4) | At June 30, 2022, the value of the collateral received from each seller exceeded the value of the repurchase agreements. |
Currency Exposure
Diversification | % of Total
Investments |
| Hong Kong Dollar | 31.1% |
| South African Rand | 12.5 |
| New Taiwan Dollar | 10.4 |
| Brazilian Real | 10.1 |
| Indian Rupee | 10.0 |
| Turkish Lira | 4.1 |
| Polish Zloty | 3.9 |
| Indonesian Rupiah | 3.8 |
| Chilean Peso | 3.2 |
| Thai Baht | 2.9 |
| Mexican Peso | 2.4 |
| Malaysian Ringgit | 1.5 |
| United States Dollar | 1.4 |
| Hungarian Forint | 1.1 |
| Philippine Peso | 0.7 |
| Czech Republic Koruna | 0.6 |
| Colombian Peso | 0.2 |
| Russian Ruble | 0.1 |
| Total | 100.0% |
Valuation Inputs
A summary of the inputs used to value the Fund’s investments as of June 30, 2022 is as follows (see Note 2A - Portfolio Valuation in the Notes to Financial Statements):
| | Total
Value at
6/30/2022 | Level 1
Quoted
Prices | Level 2
Significant
Observable
Inputs | Level 3
Significant
Unobservable
Inputs |
| Common Stocks: | | | | |
| Cayman Islands | $ 24,403,989 | $ 23,378,109 | $ 1,025,880 | $ — |
| Russia | 359,260 | — | — | 359,260 |
| Thailand | 9,331,544 | — | 9,331,544 | — |
| Other Country Categories* | 290,316,152 | 290,316,152 | — | — |
| Money Market Funds | 474,319 | 474,319 | — | — |
| Repurchase Agreements | 446,088 | — | 446,088 | — |
| Total Investments | $ 325,331,352 | $ 314,168,580 | $ 10,803,512 | $ 359,260 |
| * | See Portfolio of Investments for country breakout. |
Level 3 investments are fair valued by the Advisor’s Pricing Committee and are footnoted in the Portfolio of Investments. All Level 3 investments values are based on unobservable and non-quantitative inputs.
Page 64
See Notes to Financial Statements
First Trust Germany AlphaDEX® Fund (FGM)
Portfolio of Investments
June 30, 2022 (Unaudited)
| Shares | | Description | | Value |
| COMMON STOCKS – 99.6% |
| | | Air Freight & Logistics – 0.8% | | |
| 3,758 | | Deutsche Post AG | | $140,751 |
| | | Auto Components – 4.4% | | |
| 4,564 | | Continental AG | | 318,059 |
| 87,431 | | Schaeffler AG (Preference Shares) | | 494,766 |
| | | | | 812,825 |
| | | Automobiles – 16.8% | | |
| 12,005 | | Bayerische Motoren Werke AG | | 924,174 |
| 12,573 | | Mercedes-Benz Group AG | | 727,572 |
| 12,731 | | Porsche Automobil Holding SE (Preference Shares) | | 842,112 |
| 4,788 | | Volkswagen AG (Preference Shares) | | 639,341 |
| | | | | 3,133,199 |
| | | Banks – 1.2% | | |
| 31,762 | | Commerzbank AG (a) | | 222,543 |
| | | Chemicals – 7.6% | | |
| 10,317 | | BASF SE | | 448,956 |
| 19,599 | | Covestro AG (b) (c) | | 677,369 |
| 10,644 | | FUCHS PETROLUB SE (Preference Shares) | | 296,706 |
| | | | | 1,423,031 |
| | | Construction Materials – 3.7% | | |
| 14,278 | | HeidelbergCement AG | | 685,887 |
| | | Diversified Telecommunication
Services – 5.0% | | |
| 13,034 | | Deutsche Telekom AG | | 258,783 |
| 174,074 | | Telefonica Deutschland Holding AG | | 499,833 |
| 6,081 | | United Internet AG | | 173,526 |
| | | | | 932,142 |
| | | Health Care Equipment &
Supplies – 4.1% | | |
| 2,299 | | Carl Zeiss Meditec AG | | 274,412 |
| 1,428 | | Sartorius AG (Preference Shares) | | 498,924 |
| | | | | 773,336 |
| | | Health Care Providers &
Services – 2.9% | | |
| 3,718 | | Fresenius Medical Care AG & Co., KGaA | | 185,580 |
| 12,003 | | Fresenius SE & Co., KGaA | | 363,520 |
| | | | | 549,100 |
| | | Independent Power &
Renewable Electricity Producers – 4.4% | | |
| 11,896 | | RWE AG | | 437,322 |
| Shares | | Description | | Value |
|
| | | Independent Power &
Renewable Electricity Producers (Continued) | | |
| 25,414 | | Uniper SE | | $377,384 |
| | | | | 814,706 |
| | | Industrial Conglomerates – 0.8% | | |
| 1,392 | | Siemens AG | | 141,630 |
| | | Insurance – 12.2% | | |
| 5,128 | | Hannover Rueck SE | | 744,283 |
| 2,447 | | Muenchener Rueckversicherungs-Gesellschaft AG in Muenchen | | 574,924 |
| 24,972 | | Talanx AG | | 950,473 |
| | | | | 2,269,680 |
| | | Machinery – 3.4% | | |
| 13,254 | | GEA Group AG | | 456,826 |
| 4,404 | | KION Group AG | | 182,715 |
| | | | | 639,541 |
| | | Metals & Mining – 6.4% | | |
| 12,063 | | Aurubis AG | | 818,658 |
| 65,817 | | thyssenkrupp AG (a) | | 373,144 |
| | | | | 1,191,802 |
| | | Multi-Utilities – 3.9% | | |
| 87,130 | | E.ON SE | | 731,193 |
| | | Pharmaceuticals – 4.7% | | |
| 4,758 | | Dermapharm Holding SE | | 236,842 |
| 3,744 | | Merck KGaA | | 631,687 |
| | | | | 868,529 |
| | | Real Estate Management &
Development – 8.8% | | |
| 22,981 | | Deutsche Wohnen SE | | 528,380 |
| 8,658 | | LEG Immobilien SE | | 717,868 |
| 13,142 | | Vonovia SE | | 404,901 |
| | | | | 1,651,149 |
| | | Road & Rail – 0.7% | | |
| 1,365 | | Sixt SE | | 139,970 |
| | | Semiconductors &
Semiconductor Equipment – 2.0% | | |
| 15,637 | | Infineon Technologies AG | | 378,371 |
| | | Software – 2.4% | | |
| 7,534 | | Nemetschek SE | | 456,030 |
| | | Textiles, Apparel & Luxury
Goods – 0.7% | | |
| 1,976 | | Puma SE | | 130,126 |
See Notes to Financial Statements
Page 65
First Trust Germany AlphaDEX® Fund (FGM)
Portfolio of Investments (Continued)
June 30, 2022 (Unaudited)
| Shares | | Description | | Value |
| COMMON STOCKS (Continued) |
| | | Wireless Telecommunication
Services – 2.7% | | |
| 26,535 | | 1&1 AG | | $500,532 |
| | | Total Investments – 99.6% | | 18,586,073 |
| | | (Cost $28,841,075) | | |
| | | Net Other Assets and Liabilities – 0.4% | | 70,445 |
| | | Net Assets – 100.0% | | $18,656,518 |
| (a) | Non-income producing security. |
| (b) | This security may be resold to qualified foreign investors and foreign institutional buyers under Regulation S of the Securities Act of 1933, as amended (the “1933 Act”). |
| (c) | This security is exempt from registration upon resale under Rule 144A of the 1933 Act and may be resold in transactions exempt from registration, normally to qualified institutional buyers. This security is not restricted on the foreign exchange where it trades freely without any additional registration. As such, it does not require the additional disclosure required of restricted securities. |
| Country Allocation† | % of Net
Assets |
| Germany | 99.6% |
| Total Investments | 99.6 |
| Net Other Assets and Liabilities | 0.4 |
| Total | 100.0% |
† Portfolio securities are categorized based upon their country of incorporation, which can be different from the country categorization of the Fund’s underlying index.
Valuation Inputs
A summary of the inputs used to value the Fund’s investments as of June 30, 2022 is as follows (see Note 2A - Portfolio Valuation in the Notes to Financial Statements):
| | Total
Value at
6/30/2022 | Level 1
Quoted
Prices | Level 2
Significant
Observable
Inputs | Level 3
Significant
Unobservable
Inputs |
| Common Stocks* | $ 18,586,073 | $ 18,586,073 | $ — | $ — |
| * | See Portfolio of Investments for industry breakout. |
Page 66
See Notes to Financial Statements
First Trust United Kingdom AlphaDEX® Fund (FKU)
Portfolio of Investments
June 30, 2022 (Unaudited)
| Shares | | Description | | Value |
| COMMON STOCKS – 95.7% |
| | | Aerospace & Defense – 0.8% | | |
| 56,007 | | BAE Systems PLC | | $566,008 |
| | | Air Freight & Logistics – 1.5% | | |
| 304,273 | | Royal Mail PLC | | 998,946 |
| | | Banks – 6.6% | | |
| 493,995 | | Barclays PLC | | 920,772 |
| 68,633 | | HSBC Holdings PLC | | 447,477 |
| 2,576,768 | | Lloyds Banking Group PLC | | 1,327,138 |
| 272,861 | | NatWest Group PLC | | 725,091 |
| 137,343 | | Standard Chartered PLC | | 1,034,223 |
| | | | | 4,454,701 |
| | | Capital Markets – 10.7% | | |
| 106,254 | | 3i Group PLC | | 1,433,767 |
| 639,111 | | abrdn PLC | | 1,243,617 |
| 113,625 | | IG Group Holdings PLC | | 955,070 |
| 14,035 | | Intermediate Capital Group PLC | | 223,640 |
| 408,037 | | Investec PLC | | 2,209,337 |
| 91,453 | | St. James’s Place PLC | | 1,227,366 |
| | | | | 7,292,797 |
| | | Chemicals – 1.4% | | |
| 12,171 | | Croda International PLC | | 958,876 |
| | | Containers & Packaging – 0.8% | | |
| 160,461 | | DS Smith PLC | | 541,648 |
| | | Distributors – 1.7% | | |
| 135,426 | | Inchcape PLC | | 1,146,560 |
| | | Diversified Telecommunication
Services – 2.4% | | |
| 726,450 | | BT Group PLC | | 1,647,465 |
| | | Electric Utilities – 2.2% | | |
| 74,693 | | SSE PLC | | 1,469,328 |
| | | Electronic Equipment,
Instruments & Components – 0.7% | | |
| 19,245 | | Halma PLC | | 470,647 |
| | | Food & Staples Retailing – 4.8% | | |
| 334,942 | | J Sainsbury PLC | | 831,759 |
| 665,350 | | Marks & Spencer Group PLC (a) | | 1,097,456 |
| 424,869 | | Tesco PLC | | 1,321,428 |
| | | | | 3,250,643 |
| | | Hotels, Restaurants &
Leisure – 1.2% | | |
| 37,520 | | Greggs PLC | | 825,769 |
| | | Household Durables – 4.0% | | |
| 82,333 | | Barratt Developments PLC | | 458,424 |
| 36,921 | | Bellway PLC | | 964,497 |
| 6,449 | | Berkeley Group Holdings PLC | | 292,348 |
| Shares | | Description | | Value |
|
| | | Household
Durables (Continued) | | |
| 21,563 | | Persimmon PLC | | $489,012 |
| 350,910 | | Taylor Wimpey PLC | | 498,285 |
| | | | | 2,702,566 |
| | | Insurance – 4.9% | | |
| 227,823 | | Aviva PLC | | 1,112,921 |
| 220,734 | | Direct Line Insurance Group PLC | | 676,317 |
| 414,015 | | Legal & General Group PLC | | 1,207,033 |
| 47,141 | | Phoenix Group Holdings PLC | | 338,799 |
| | | | | 3,335,070 |
| | | Interactive Media & Services – 1.2% | | |
| 83,223 | | Auto Trader Group PLC (b) (c) | | 562,256 |
| 38,733 | | Rightmove PLC | | 267,999 |
| | | | | 830,255 |
| | | IT Services – 1.3% | | |
| 31,745 | | Computacenter PLC | | 908,888 |
| | | Media – 4.7% | | |
| 24,119 | | Future PLC | | 505,874 |
| 278,538 | | ITV PLC | | 221,273 |
| 150,648 | | Pearson PLC | | 1,375,012 |
| 110,022 | | WPP PLC | | 1,104,385 |
| | | | | 3,206,544 |
| | | Metals & Mining – 11.8% | | |
| 51,580 | | Anglo American PLC | | 1,844,094 |
| 23,005 | | Antofagasta PLC | | 323,446 |
| 73,754 | | Endeavour Mining PLC | | 1,528,068 |
| 153,120 | | Evraz PLC (d) (e) | | 150,773 |
| 103,469 | | Fresnillo PLC | | 965,806 |
| 246,372 | | Glencore PLC | | 1,334,893 |
| 31,721 | | Rio Tinto PLC | | 1,898,456 |
| | | | | 8,045,536 |
| | | Multiline Retail – 0.6% | | |
| 97,137 | | B&M European Value Retail S.A. | | 433,604 |
| | | Multi-Utilities – 3.6% | | |
| 2,153,313 | | Centrica PLC (a) | | 2,096,982 |
| 29,055 | | National Grid PLC | | 372,078 |
| | | | | 2,469,060 |
| | | Oil, Gas & Consumable Fuels – 4.1% | | |
| 372,676 | | BP PLC | | 1,761,556 |
| 37,973 | | Shell PLC | | 986,431 |
| | | | | 2,747,987 |
| | | Paper & Forest Products – 0.4% | | |
| 16,863 | | Mondi PLC | | 298,673 |
See Notes to Financial Statements
Page 67
First Trust United Kingdom AlphaDEX® Fund (FKU)
Portfolio of Investments (Continued)
June 30, 2022 (Unaudited)
| Shares | | Description | | Value |
| COMMON STOCKS (Continued) |
| | | Pharmaceuticals – 0.8% | | |
| 5,783 | | Dechra Pharmaceuticals PLC | | $243,431 |
| 13,877 | | Hikma Pharmaceuticals PLC | | 273,236 |
| | | | | 516,667 |
| | | Professional Services – 1.1% | | |
| 25,434 | | Experian PLC | | 744,917 |
| | | Software – 0.8% | | |
| 72,232 | | Sage Group (The) PLC | | 558,167 |
| | | Specialty Retail – 5.3% | | |
| 199,691 | | Frasers Group PLC (a) | | 1,617,723 |
| 424,137 | | JD Sports Fashion PLC | | 595,813 |
| 455,105 | | Kingfisher PLC | | 1,353,420 |
| | | | | 3,566,956 |
| | | Textiles, Apparel & Luxury
Goods – 0.5% | | |
| 16,942 | | Burberry Group PLC | | 338,432 |
| | | Tobacco – 4.6% | | |
| 33,794 | | British American Tobacco PLC | | 1,447,832 |
| 76,195 | | Imperial Brands PLC | | 1,702,930 |
| | | | | 3,150,762 |
| | | Trading Companies &
Distributors – 8.8% | | |
| 10,364 | | Ashtead Group PLC | | 433,868 |
| 42,693 | | Bunzl PLC | | 1,413,069 |
| 45,632 | | Diploma PLC | | 1,237,606 |
| 11,748 | | Ferguson PLC | | 1,313,961 |
| 68,336 | | Howden Joinery Group PLC | | 501,275 |
| 76,598 | | RS GROUP PLC | | 810,280 |
| 19,809 | | Travis Perkins PLC | | 233,322 |
| | | | | 5,943,381 |
| | | Water Utilities – 0.5% | | |
| 10,449 | | Severn Trent PLC | | 345,845 |
| | | Wireless Telecommunication
Services – 1.9% | | |
| 822,886 | | Vodafone Group PLC | | 1,268,752 |
| | | Total Common Stocks | | 65,035,450 |
| | | (Cost $84,497,934) | | |
| REAL ESTATE INVESTMENT TRUSTS – 3.9% |
| | | Equity Real Estate Investment
Trusts – 3.9% | | |
| 107,179 | | Segro PLC | | 1,274,421 |
| Shares | | Description | | Value |
|
| | | Equity Real Estate Investment
Trusts (Continued) | | |
| 618,321 | | Tritax Big Box REIT PLC | | $1,366,118 |
| | | Total Real Estate Investment Trusts | | 2,640,539 |
| | | (Cost $3,766,212) | | |
| | | Total Investments – 99.6% | | 67,675,989 |
| | | (Cost $88,264,146) | | |
| | | Net Other Assets and Liabilities – 0.4% | | 258,193 |
| | | Net Assets – 100.0% | | $67,934,182 |
| (a) | Non-income producing security. |
| (b) | This security may be resold to qualified foreign investors and foreign institutional buyers under Regulation S of the Securities Act of 1933, as amended (the “1933 Act”). |
| (c) | This security is exempt from registration upon resale under Rule 144A of the 1933 Act and may be resold in transactions exempt from registration, normally to qualified institutional buyers. This security is not restricted on the foreign exchange where it trades freely without any additional registration. As such, it does not require the additional disclosure required of restricted securities. |
| (d) | This security is fair valued by the Advisor’s Pricing Committee in accordance with procedures adopted by the Trust’s Board of Trustees, and in accordance with the provisions of the Investment Company Act of 1940, as amended. At June 30, 2022, securities noted as such are valued at $150,773 or 0.2% of net assets. |
| (e) | Pursuant to procedures adopted by the Trust’s Board of Trustees, this security has been determined to be illiquid by First Trust Advisors L.P., the Fund’s advisor. |
| Country Allocation† | % of Net
Assets |
| United Kingdom | 92.4% |
| Jersey | 6.6 |
| Luxembourg | 0.6 |
| Total Investments | 99.6 |
| Net Other Assets and Liabilities | 0.4 |
| Total | 100.0% |
† Portfolio securities are categorized based upon their country of incorporation, which can be different from the country categorization of the Fund’s underlying index.
Page 68
See Notes to Financial Statements
First Trust United Kingdom AlphaDEX® Fund (FKU)
Portfolio of Investments (Continued)
June 30, 2022 (Unaudited)
Valuation Inputs
A summary of the inputs used to value the Fund’s investments as of June 30, 2022 is as follows (see Note 2A - Portfolio Valuation in the Notes to Financial Statements):
| | Total
Value at
6/30/2022 | Level 1
Quoted
Prices | Level 2
Significant
Observable
Inputs | Level 3
Significant
Unobservable
Inputs |
| Common Stocks: | | | | |
| Metals & Mining | $ 8,045,536 | $ 7,894,763 | $ 150,773 | $ — |
| Other industry categories* | 56,989,914 | 56,989,914 | — | — |
| Real Estate Investment Trusts* | 2,640,539 | 2,640,539 | — | — |
| Total Investments | $ 67,675,989 | $ 67,525,216 | $ 150,773 | $— |
| * | See Portfolio of Investments for industry breakout. |
See Notes to Financial Statements
Page 69
First Trust India NIFTY 50 Equal Weight ETF (NFTY)
Portfolio of Investments
June 30, 2022 (Unaudited)
| Shares | | Description | | Value |
| COMMON STOCKS – 100.2% |
| | | Automobiles – 12.0% | | |
| 19,448 | | Bajaj Auto Ltd. | | $912,798 |
| 26,364 | | Eicher Motors Ltd. | | 932,859 |
| 27,252 | | Hero MotoCorp Ltd. | | 938,520 |
| 69,358 | | Mahindra & Mahindra Ltd. | | 960,065 |
| 8,888 | | Maruti Suzuki India Ltd. | | 953,345 |
| 181,166 | | Tata Motors Ltd. (a) | | 944,685 |
| | | | | 5,642,272 |
| | | Banks – 12.0% | | |
| 117,868 | | Axis Bank Ltd. (a) | | 950,437 |
| 55,368 | | HDFC Bank Ltd. | | 945,089 |
| 104,682 | | ICICI Bank Ltd. | | 937,429 |
| 91,188 | | IndusInd Bank Ltd. | | 917,220 |
| 44,393 | | Kotak Mahindra Bank Ltd. | | 933,758 |
| 162,822 | | State Bank of India | | 960,572 |
| 75,422 | | YES Bank Ltd. Lock-In (a) (b) (c) | | 12,081 |
| | | | | 5,656,586 |
| | | Chemicals – 3.9% | | |
| 26,620 | | Asian Paints Ltd. | | 908,497 |
| 114,280 | | UPL Ltd. | | 915,137 |
| | | | | 1,823,634 |
| | | Construction & Engineering – 2.1% | | |
| 48,895 | | Larsen & Toubro Ltd. | | 964,774 |
| | | Construction Materials – 6.0% | | |
| 55,654 | | Grasim Industries Ltd. | | 930,767 |
| 3,931 | | Shree Cement Ltd. | | 946,243 |
| 13,505 | | UltraTech Cement Ltd. | | 958,898 |
| | | | | 2,835,908 |
| | | Consumer Finance – 1.9% | | |
| 13,312 | | Bajaj Finance Ltd. | | 910,335 |
| | | Diversified Financial Services – 1.9% | | |
| 6,476 | | Bajaj Finserv Ltd. | | 896,439 |
| | | Electric Utilities – 2.0% | | |
| 354,968 | | Power Grid Corp. of India Ltd. | | 952,455 |
| | | Food Products – 6.0% | | |
| 21,709 | | Britannia Industries Ltd. | | 952,890 |
| 4,326 | | Nestle India Ltd. | | 956,981 |
| 102,952 | | Tata Consumer Products Ltd. | | 920,829 |
| | | | | 2,830,700 |
| | | Health Care Providers &
Services – 2.0% | | |
| 19,790 | | Apollo Hospitals Enterprise Ltd. | | 923,061 |
| Shares | | Description | | Value |
|
| | | Independent Power &
Renewable Electricity Producers – 2.1% | | |
| 542,191 | | NTPC Ltd. | | $981,090 |
| | | Insurance – 4.0% | | |
| 134,576 | | HDFC Life Insurance Co., Ltd. (d) (e) | | 937,248 |
| 69,239 | | SBI Life Insurance Co., Ltd. (d) (e) | | 948,291 |
| | | | | 1,885,539 |
| | | IT Services – 10.0% | | |
| 75,672 | | HCL Technologies Ltd. | | 932,575 |
| 50,925 | | Infosys Ltd. | | 942,698 |
| 22,655 | | Tata Consultancy Services Ltd. | | 937,240 |
| 74,557 | | Tech Mahindra Ltd. | | 944,088 |
| 176,732 | | Wipro Ltd. | | 931,075 |
| | | | | 4,687,676 |
| | | Life Sciences Tools &
Services – 2.0% | | |
| 20,442 | | Divi’s Laboratories Ltd. | | 939,728 |
| | | Metals & Mining – 6.1% | | |
| 227,590 | | Hindalco Industries Ltd. | | 975,952 |
| 131,363 | | JSW Steel Ltd. | | 938,990 |
| 86,528 | | Tata Steel Ltd. | | 950,003 |
| | | | | 2,864,945 |
| | | Oil, Gas & Consumable Fuels – 8.3% | | |
| 238,392 | | Bharat Petroleum Corp., Ltd. | | 930,958 |
| 412,488 | | Coal India Ltd. | | 969,423 |
| 530,696 | | Oil & Natural Gas Corp., Ltd. | | 1,018,418 |
| 30,126 | | Reliance Industries Ltd. | | 990,174 |
| | | | | 3,908,973 |
| | | Personal Products – 1.9% | | |
| 32,359 | | Hindustan Unilever Ltd. | | 913,989 |
| | | Pharmaceuticals – 6.1% | | |
| 80,542 | | Cipla Ltd. | | 935,429 |
| 17,381 | | Dr. Reddy’s Laboratories Ltd. | | 967,028 |
| 89,862 | | Sun Pharmaceutical Industries Ltd. | | 945,131 |
| | | | | 2,847,588 |
| | | Textiles, Apparel & Luxury
Goods – 1.9% | | |
| 36,805 | | Titan Co., Ltd. | | 904,716 |
| | | Thrifts & Mortgage Finance – 2.0% | | |
| 34,220 | | Housing Development Finance Corp., Ltd. | | 940,663 |
| | | Tobacco – 2.0% | | |
| 278,175 | | ITC Ltd. | | 963,384 |
Page 70
See Notes to Financial Statements
First Trust India NIFTY 50 Equal Weight ETF (NFTY)
Portfolio of Investments (Continued)
June 30, 2022 (Unaudited)
| Shares | | Description | | Value |
| COMMON STOCKS (Continued) |
| | | Transportation Infrastructure – 2.0% | | |
| 109,187 | | Adani Ports & Special Economic Zone Ltd. | | $929,173 |
| | | Wireless Telecommunication
Services – 2.0% | | |
| 109,794 | | Bharti Airtel Ltd. (a) | | 952,273 |
| | | Total Investments – 100.2% | | 47,155,901 |
| | | (Cost $46,854,745) | | |
| | | Net Other Assets and Liabilities – (0.2)% | | (74,069) |
| | | Net Assets – 100.0% | | $47,081,832 |
| (a) | Non-income producing security. |
| (b) | Pursuant to procedures adopted by the Trust’s Board of Trustees, this security has been determined to be illiquid by First Trust Advisors L.P., the Fund’s advisor. |
| (c) | This security has a lock-in period of 3 years from commencement of the YES Bank Ltd. Reconstruction Scheme 2020 (the “Scheme”), which was effective March 13, 2020. Shares to the extent of 75% held by existing shareholders as on the date of commencement of the Scheme are locked in for a period of three years. The lock-in period does not apply to shareholders holding less than 100 shares (see Note 2C - Restricted Securities in the Notes to Financial Statements). |
| (d) | This security may be resold to qualified foreign investors and foreign institutional buyers under Regulation S of the Securities Act of 1933, as amended (the “1933 Act”). |
| (e) | This security is exempt from registration upon resale under Rule 144A of the 1933 Act and may be resold in transactions exempt from registration, normally to qualified institutional buyers. This security is not restricted on the foreign exchange where it trades freely without any additional registration. As such, it does not require the additional disclosure required of restricted securities. |
| Country Allocation† | % of Net
Assets |
| India | 100.2% |
| Total Investments | 100.2 |
| Net Other Assets and Liabilities | (0.2) |
| Total | 100.0% |
† Portfolio securities are categorized based upon their country of incorporation, which can be different from the country categorization of the Fund’s underlying index.
Valuation Inputs
A summary of the inputs used to value the Fund’s investments as of June 30, 2022 is as follows (see Note 2A - Portfolio Valuation in the Notes to Financial Statements):
| | Total
Value at
6/30/2022 | Level 1
Quoted
Prices | Level 2
Significant
Observable
Inputs | Level 3
Significant
Unobservable
Inputs |
| Common Stocks* | $ 47,155,901 | $ 47,155,901 | $ — | $ — |
| * | See Portfolio of Investments for industry breakout. |
See Notes to Financial Statements
Page 71
First Trust Switzerland AlphaDEX® Fund (FSZ)
Portfolio of Investments
June 30, 2022 (Unaudited)
| Shares | | Description | | Value |
| COMMON STOCKS – 97.2% |
| | | Banks – 1.1% | | |
| 5,502 | | Banque Cantonale Vaudoise | | $431,676 |
| | | Building Products – 1.8% | | |
| 2,016 | | Belimo Holding AG | | 709,554 |
| | | Capital Markets – 7.4% | | |
| 43,914 | | Credit Suisse Group AG | | 249,321 |
| 12,740 | | Julius Baer Group Ltd. | | 587,723 |
| 256 | | Partners Group Holding AG | | 230,672 |
| 94,918 | | UBS Group AG | | 1,530,182 |
| 4,873 | | Vontobel Holding AG | | 342,511 |
| | | | | 2,940,409 |
| | | Chemicals – 9.3% | | |
| 102,536 | | Clariant AG (a) | | 1,952,658 |
| 385 | | EMS-Chemie Holding AG | | 286,537 |
| 81 | | Givaudan S.A. | | 284,834 |
| 5,122 | | Sika AG | | 1,180,370 |
| | | | | 3,704,399 |
| | | Construction Materials – 4.5% | | |
| 41,892 | | Holcim AG | | 1,792,582 |
| | | Diversified Telecommunication
Services – 4.2% | | |
| 3,029 | | Swisscom AG | | 1,673,383 |
| | | Electric Utilities – 3.5% | | |
| 13,142 | | BKW AG | | 1,372,500 |
| | | Electrical Equipment – 2.2% | | |
| 33,493 | | ABB Ltd. | | 893,240 |
| | | Food Products – 6.0% | | |
| 93 | | Chocoladefabriken Lindt & Spruengli AG | | 945,928 |
| 1,086 | | Emmi AG | | 1,057,958 |
| 3,058 | | Nestle S.A. | | 356,972 |
| | | | | 2,360,858 |
| | | Health Care Equipment &
Supplies – 5.9% | | |
| 14,481 | | Alcon, Inc. | | 1,011,463 |
| 1,091 | | Sonova Holding AG | | 347,419 |
| 8,050 | | Straumann Holding AG | | 966,776 |
| | | | | 2,325,658 |
| | | Insurance – 14.8% | | |
| 7,841 | | Baloise Holding AG | | 1,280,482 |
| 14,509 | | Helvetia Holding AG | | 1,697,643 |
| 2,792 | | Swiss Life Holding AG | | 1,359,954 |
| 8,633 | | Swiss Re AG | | 669,009 |
| 1,949 | | Zurich Insurance Group AG | | 847,667 |
| | | | | 5,854,755 |
| | | Life Sciences Tools &
Services – 2.0% | | |
| 5,439 | | Bachem Holding AG | | 378,021 |
| Shares | | Description | | Value |
|
| | | Life Sciences Tools &
Services (Continued) | | |
| 1,401 | | Tecan Group AG | | $406,806 |
| | | | | 784,827 |
| | | Machinery – 10.6% | | |
| 1,730 | | Bucher Industries AG | | 601,645 |
| 4,842 | | Daetwyler Holding AG | | 1,000,201 |
| 15,434 | | SFS Group AG | | 1,560,133 |
| 4,287 | | VAT Group AG (b) (c) | | 1,022,072 |
| | | | | 4,184,051 |
| | | Pharmaceuticals – 4.8% | | |
| 14,561 | | Novartis AG | | 1,233,182 |
| 2,055 | | Roche Holding AG | | 685,717 |
| | | | | 1,918,899 |
| | | Professional Services – 2.9% | | |
| 33,443 | | Adecco Group AG | | 1,136,428 |
| | | Real Estate Management &
Development – 8.7% | | |
| 17,132 | | PSP Swiss Property AG | | 1,905,848 |
| 17,385 | | Swiss Prime Site AG | | 1,525,160 |
| | | | | 3,431,008 |
| | | Technology Hardware,
Storage & Peripherals – 2.0% | | |
| 15,200 | | Logitech International S.A. | | 794,033 |
| | | Textiles, Apparel & Luxury
Goods – 5.5% | | |
| 14,225 | | Cie Financiere Richemont S.A., Class A | | 1,514,661 |
| 2,791 | | Swatch Group (The) AG | | 662,192 |
| | | | | 2,176,853 |
| | | Total Investments – 97.2% | | 38,485,113 |
| | | (Cost $46,544,300) | | |
| | | Net Other Assets and Liabilities – 2.8% | | 1,088,798 |
| | | Net Assets – 100.0% | | $39,573,911 |
| (a) | Non-income producing security. |
| (b) | This security may be resold to qualified foreign investors and foreign institutional buyers under Regulation S of the Securities Act of 1933, as amended (the “1933 Act”). |
| (c) | This security is exempt from registration upon resale under Rule 144A of the 1933 Act and may be resold in transactions exempt from registration, normally to qualified institutional buyers. This security is not restricted on the foreign exchange where it trades freely without any additional registration. As such, it does not require the additional disclosure required of restricted securities. |
Page 72
See Notes to Financial Statements
First Trust Switzerland AlphaDEX® Fund (FSZ)
Portfolio of Investments (Continued)
June 30, 2022 (Unaudited)
| Country Allocation† | % of Net
Assets |
| Switzerland | 97.2% |
| Total Investments | 97.2 |
| Net Other Assets and Liabilities | 2.8 |
| Total | 100.0% |
† Portfolio securities are categorized based upon their country of incorporation, which can be different from the country categorization of the Fund’s underlying index.
Valuation Inputs
A summary of the inputs used to value the Fund’s investments as of June 30, 2022 is as follows (see Note 2A - Portfolio Valuation in the Notes to Financial Statements):
| | Total
Value at
6/30/2022 | Level 1
Quoted
Prices | Level 2
Significant
Observable
Inputs | Level 3
Significant
Unobservable
Inputs |
| Common Stocks* | $ 38,485,113 | $ 38,485,113 | $ — | $ — |
| * | See Portfolio of Investments for industry breakout. |
See Notes to Financial Statements
Page 73
First Trust Developed Markets ex-US Small Cap AlphaDEX® Fund (FDTS)
Portfolio of Investments
June 30, 2022 (Unaudited)
| Shares | | Description | | Value |
| COMMON STOCKS (a) – 93.4% |
| | | Australia – 6.6% | | |
| 3,156 | | AGL Energy Ltd. | | $17,972 |
| 6,871 | | Aussie Broadband Ltd. (b) | | 15,698 |
| 15,670 | | Beach Energy Ltd. | | 18,658 |
| 37,877 | | BrainChip Holdings Ltd. (b) (c) | | 20,916 |
| 2,001 | | Brickworks Ltd. | | 25,607 |
| 1,805 | | Challenger Ltd. | | 8,522 |
| 6,240 | | Champion Iron Ltd. | | 23,216 |
| 2,523 | | Deterra Royalties Ltd. | | 7,384 |
| 1,834 | | Elders Ltd. | | 15,938 |
| 46,585 | | Firefinch Ltd. (b) (d) | | 6,431 |
| 7,167 | | GrainCorp Ltd., Class A | | 47,046 |
| 54,882 | | Grange Resources Ltd. | | 47,921 |
| 3,237 | | Iluka Resources Ltd. | | 21,092 |
| 5,367 | | Metcash Ltd. | | 15,707 |
| 3,338 | | Monadelphous Group Ltd. | | 22,925 |
| 18,856 | | New Hope Corp., Ltd. | | 45,033 |
| 5,774 | | Nufarm Ltd. | | 20,286 |
| 3,375 | | Orora Ltd. | | 8,503 |
| 24,865 | | Perseus Mining Ltd. | | 27,204 |
| 16,922 | | Ramelius Resources Ltd. | | 10,162 |
| 4,290 | | Sandfire Resources Ltd. | | 13,177 |
| 71,669 | | Seven West Media Ltd. (b) | | 20,283 |
| 2,826 | | Sims Ltd. | | 26,743 |
| 5,152 | | Uniti Group Ltd. (b) | | 17,496 |
| 15,554 | | Viva Energy Group Ltd. (e) (f) | | 31,028 |
| 19,494 | | West African Resources Ltd. (b) | | 16,282 |
| 14,679 | | Whitehaven Coal Ltd. | | 49,040 |
| | | | | 600,270 |
| | | Austria – 0.7% | | |
| 653 | | AT&S Austria Technologie & Systemtechnik AG | | 34,900 |
| 293 | | CA Immobilien Anlagen AG | | 9,288 |
| 215 | | DO & CO AG (b) | | 17,912 |
| | | | | 62,100 |
| | | Belgium – 1.4% | | |
| 695 | | Bekaert S.A. | | 22,622 |
| 1,367 | | bpost S.A. | | 8,072 |
| 602 | | Gimv N.V. | | 33,247 |
| 1,025 | | KBC Ancora | | 37,617 |
| 1,903 | | Recticel S.A. | | 28,398 |
| | | | | 129,956 |
| | | Bermuda – 3.4% | | |
| 6,617 | | BW LPG Ltd. (e) (f) | | 48,974 |
| 100,000 | | Concord New Energy Group Ltd. | | 9,940 |
| 44,250 | | First Pacific Co., Ltd. | | 17,143 |
| 1,301 | | FLEX LNG Ltd. | | 35,980 |
| 2,930 | | Golden Ocean Group Ltd. | | 34,061 |
| 11,679 | | Gulf Keystone Petroleum Ltd. | | 36,964 |
| 8,000 | | Luk Fook Holdings International Ltd. | | 20,543 |
| 6,585 | | Odfjell Drilling Ltd. (b) | | 15,510 |
| 87,917 | | Pacific Basin Shipping Ltd. | | 33,613 |
| Shares | | Description | | Value |
|
| | | Bermuda (Continued) | | |
| 33,000 | | PAX Global Technology Ltd. | | $25,696 |
| 53,333 | | Skyworth Group Ltd. | | 26,372 |
| | | | | 304,796 |
| | | Canada – 14.3% | | |
| 6,560 | | Advantage Energy Ltd. (b) | | 40,771 |
| 794 | | Ag Growth International, Inc. | | 18,314 |
| 1,131 | | Alaris Equity Partners Income | | 14,533 |
| 948 | | Altius Minerals Corp. | | 13,360 |
| 10,484 | | Baytex Energy Corp. (b) | | 50,905 |
| 5,468 | | Birchcliff Energy Ltd. | | 37,170 |
| 2,218 | | Canfor Corp. (b) | | 38,684 |
| 7,479 | | Cardinal Energy Ltd. | | 42,008 |
| 891 | | Cascades, Inc. | | 7,012 |
| 2,306 | | Celestica, Inc. (b) | | 22,429 |
| 12,157 | | Copper Mountain Mining Corp. (b) | | 16,056 |
| 4,646 | | Corus Entertainment, Inc., Class B | | 12,741 |
| 4,291 | | Doman Building Materials Group Ltd. (c) | | 20,902 |
| 6,128 | | Dundee Precious Metals, Inc. | | 30,516 |
| 1,986 | | Energy Fuels, Inc. (b) | | 9,782 |
| 3,607 | | Enerplus Corp. | | 47,666 |
| 5,537 | | Equinox Gold Corp. (b) | | 24,691 |
| 2,396 | | Freehold Royalties Ltd. | | 23,714 |
| 3,943 | | Frontera Energy Corp. (b) | | 31,705 |
| 1,828 | | Gibson Energy, Inc. | | 33,856 |
| 313 | | Hardwoods Distribution, Inc. | | 6,872 |
| 6,895 | | Headwater Exploration, Inc. (b) | | 28,979 |
| 3,491 | | Hudbay Minerals, Inc. | | 14,238 |
| 1,643 | | Interfor Corp. (b) | | 33,110 |
| 6,782 | | Kelt Exploration Ltd. (b) | | 32,245 |
| 617 | | Linamar Corp. | | 26,143 |
| 2,566 | | Mullen Group Ltd. | | 22,506 |
| 15,103 | | New Gold, Inc. (b) | | 16,075 |
| 5,406 | | NuVista Energy Ltd. (b) | | 43,342 |
| 5,157 | | Obsidian Energy Ltd. (b) | | 39,823 |
| 16,503 | | OceanGold Corp. (b) | | 31,667 |
| 1,831 | | Paramount Resources Ltd., Class A | | 43,727 |
| 891 | | Parex Resources, Inc. | | 15,090 |
| 2,239 | | Pason Systems, Inc. | | 25,378 |
| 4,506 | | Peyto Exploration & Development Corp. | | 42,147 |
| 1,322 | | PrairieSky Royalty Ltd. | | 16,648 |
| 370 | | Precision Drilling Corp. (b) | | 23,775 |
| 1,380 | | Russel Metals, Inc. | | 27,896 |
| 1,134 | | Sandstorm Gold Ltd. | | 6,731 |
| 4,280 | | Secure Energy Services, Inc. | | 19,950 |
| 182 | | Sprott, Inc. | | 6,323 |
| 1,099 | | Stelco Holdings, Inc. | | 27,475 |
| 9,216 | | Tamarack Valley Energy Ltd. | | 31,002 |
| 1,094 | | Topaz Energy Corp. | | 17,262 |
| 2,912 | | Torex Gold Resources, Inc. (b) | | 22,487 |
Page 74
See Notes to Financial Statements
First Trust Developed Markets ex-US Small Cap AlphaDEX® Fund (FDTS)
Portfolio of Investments (Continued)
June 30, 2022 (Unaudited)
| Shares | | Description | | Value |
| COMMON STOCKS (a) (Continued) |
| | | Canada (Continued) | | |
| 15,360 | | Trican Well Service Ltd. (b) | | $44,032 |
| 1,499 | | Uni-Select, Inc. (b) | | 33,306 |
| 2,177 | | Vermilion Energy, Inc. (c) | | 41,436 |
| 1,437 | | Victoria Gold Corp. (b) | | 11,153 |
| 1,457 | | Wesdome Gold Mines Ltd. (b) | | 12,621 |
| | | | | 1,300,254 |
| | | Cayman Islands – 2.2% | | |
| 60,000 | | China High Speed Transmission Equipment Group Co., Ltd. (b) | | 35,556 |
| 52,500 | | Lee & Man Paper Manufacturing Ltd. | | 22,547 |
| 24,000 | | PC Partner Group Ltd. | | 21,777 |
| 37,000 | | Texhong Textile Group Ltd. | | 39,137 |
| 128,000 | | Truly International Holdings Ltd. | | 39,150 |
| 69,500 | | United Laboratories International Holdings (The) Ltd. | | 41,186 |
| | | | | 199,353 |
| | | Denmark – 0.8% | | |
| 1,294 | | D/S Norden A/S | | 44,850 |
| 88 | | Solar A/S, B Shares | | 7,513 |
| 530 | | Sydbank AS | | 16,219 |
| | | | | 68,582 |
| | | Finland – 0.4% | | |
| 8,463 | | Outokumpu OYJ | | 34,996 |
| | | France – 1.6% | | |
| 23,812 | | CGG S.A. (b) | | 20,702 |
| 866 | | Derichebourg S.A. | | 4,991 |
| 364 | | IPSOS | | 17,280 |
| 258 | | Nexity S.A. | | 6,895 |
| 218 | | PEUGEOT INVEST | | 19,761 |
| 483 | | Quadient S.A. | | 8,240 |
| 540 | | Societe BIC S.A. | | 29,540 |
| 49 | | Sopra Steria Group SACA | | 7,322 |
| 2,800 | | Television Francaise 1 | | 19,821 |
| 535 | | Vicat S.A. | | 14,745 |
| | | | | 149,297 |
| | | Germany – 1.4% | | |
| 134 | | 2G Energy AG | | 12,708 |
| 544 | | Bilfinger SE | | 15,894 |
| 492 | | Draegerwerk AG & Co., KGaA (Preference Shares) | | 25,599 |
| 952 | | ElringKlinger AG | | 7,178 |
| 6,881 | | Heidelberger Druckmaschinen AG (b) | | 10,276 |
| 3,354 | | Kloeckner & Co., SE | | 25,553 |
| 972 | | Salzgitter AG | | 23,652 |
| 800 | | TAG Immobilien AG | | 9,130 |
| | | | | 129,990 |
| Shares | | Description | | Value |
|
| | | Greece – 0.6% | | |
| 3,231 | | FF Group (b) (d) (g) (h) | | $8,126 |
| 1,318 | | LAMDA Development S.A. (b) | | 7,735 |
| 1,752 | | Motor Oil Hellas Corinth Refineries S.A. | | 32,405 |
| 554 | | Mytilineos S.A. | | 8,128 |
| | | | | 56,394 |
| | | Isle Of Man (U.K.) – 0.3% | | |
| 4,695 | | Playtech PLC (b) | | 30,948 |
| | | Israel – 3.8% | | |
| 4,750 | | Cellcom Israel Ltd. (b) | | 23,390 |
| 2,370 | | Delek Automotive Systems Ltd. | | 25,783 |
| 63 | | Delek Group Ltd. (b) | | 8,205 |
| 534 | | Delta Galil Industries Ltd. | | 26,203 |
| 615 | | Electra Consumer Products 1970 Ltd. | | 25,829 |
| 37 | | Electra Ltd. | | 20,554 |
| 57 | | Fox Wizel Ltd. | | 6,470 |
| 3,734 | | Harel Insurance Investments & Financial Services Ltd. | | 36,368 |
| 3,694 | | Isracard Ltd. | | 13,167 |
| 1,848 | | Menora Mivtachim Holdings Ltd. (b) | | 33,924 |
| 25,536 | | Migdal Insurance & Financial Holding Ltd. | | 37,921 |
| 114,502 | | Oil Refineries Ltd. | | 40,943 |
| 1,098 | | Partner Communications Co., Ltd. (b) | | 7,802 |
| 311 | | Paz Oil Co., Ltd. (b) | | 37,253 |
| | | | | 343,812 |
| | | Italy – 1.1% | | |
| 6,043 | | Anima Holding S.p.A (e) (f) | | 22,152 |
| 1,951 | | Buzzi Unicem S.p.A | | 31,916 |
| 16,697 | | OVS S.p.A. (e) (f) | | 27,226 |
| 11,784 | | Saras S.p.A. (b) | | 17,128 |
| | | | | 98,422 |
| | | Japan – 24.7% | | |
| 1,200 | | ADEKA Corp. | | 20,722 |
| 2,200 | | Alpen Co., Ltd. (c) | | 32,770 |
| 1,000 | | Asahi Holdings, Inc. | | 15,706 |
| 1,500 | | Belluna Co., Ltd. | | 8,236 |
| 1,400 | | BML, Inc. | | 36,372 |
| 6,400 | | Citizen Watch Co., Ltd. | | 26,038 |
| 2,100 | | Cosmo Energy Holdings Co., Ltd. | | 58,196 |
| 900 | | Daido Steel Co., Ltd. | | 23,183 |
| 2,100 | | Daiki Aluminium Industry Co., Ltd. | | 18,527 |
| 600 | | DeNA Co., Ltd. | | 8,353 |
| 1,000 | | Dowa Holdings Co., Ltd. | | 33,203 |
| 300 | | Eizo Corp. | | 8,336 |
| 1,300 | | Electric Power Development Co., Ltd. | | 21,501 |
See Notes to Financial Statements
Page 75
First Trust Developed Markets ex-US Small Cap AlphaDEX® Fund (FDTS)
Portfolio of Investments (Continued)
June 30, 2022 (Unaudited)
| Shares | | Description | | Value |
| COMMON STOCKS (a) (Continued) |
| | | Japan (Continued) | | |
| 2,100 | | Exedy Corp. | | $26,637 |
| 3,300 | | FCC Co., Ltd. | | 32,786 |
| 3,900 | | Financial Products Group Co., Ltd. | | 26,042 |
| 400 | | Fujitec Co., Ltd. | | 8,859 |
| 400 | | FULLCAST Holdings Co., Ltd. | | 6,406 |
| 5,100 | | Gree, Inc. | | 30,973 |
| 300 | | Gunze Ltd. | | 8,137 |
| 1,100 | | H.U. Group Holdings, Inc. | | 23,908 |
| 1,000 | | Hanwa Co., Ltd. | | 20,924 |
| 2,300 | | Hokkaido Electric Power Co., Inc. | | 8,391 |
| 8,000 | | Hokuetsu Corp. | | 41,274 |
| 3,800 | | Hosiden Corp. | | 34,589 |
| 5,400 | | Iino Kaiun Kaisha Ltd. | | 27,223 |
| 2,700 | | Inabata & Co., Ltd. | | 44,098 |
| 1,100 | | Itochu Enex Co., Ltd. | | 8,545 |
| 3,000 | | JAFCO Group Co., Ltd. | | 36,173 |
| 1,300 | | Japan Petroleum Exploration Co., Ltd. | | 30,708 |
| 800 | | JGC Corp. | | 10,342 |
| 1,400 | | Kaga Electronics Co., Ltd. | | 31,265 |
| 1,100 | | Kanamoto Co., Ltd. | | 15,607 |
| 600 | | Kaneka Corp. | | 14,770 |
| 1,400 | | Kintetsu World Express, Inc. | | 43,028 |
| 5,600 | | Kobe Steel Ltd. | | 25,466 |
| 800 | | Komeri Co., Ltd. | | 15,548 |
| 1,100 | | Kuraray Co., Ltd. | | 8,878 |
| 300 | | Kureha Corp. | | 21,160 |
| 1,900 | | KYB Corp. | | 43,341 |
| 800 | | Macnica Fuji Electronics Holdings, Inc. | | 15,419 |
| 400 | | Maruichi Steel Tube Ltd. | | 8,455 |
| 400 | | Matsuda Sangyo Co., Ltd. | | 5,914 |
| 1,500 | | Megachips Corp. | | 34,880 |
| 300 | | Meiko Electronics Co., Ltd. | | 7,031 |
| 600 | | Mirait Holdings Corp. | | 7,062 |
| 500 | | Mitsubishi Gas Chemical Co., Inc. | | 7,204 |
| 1,600 | | Mitsubishi Materials Corp. | | 22,901 |
| 1,700 | | Mitsui Mining & Smelting Co., Ltd. | | 39,718 |
| 300 | | Nabtesco Corp. (c) | | 7,009 |
| 1,700 | | NGK Spark Plug Co., Ltd. | | 30,860 |
| 1,300 | | NHK Spring Co., Ltd. | | 8,556 |
| 900 | | Nichiha Corp. | | 17,512 |
| 500 | | Nikkon Holdings Co., Ltd. | | 7,927 |
| 400 | | Nippon Electric Glass Co., Ltd. | | 7,656 |
| 700 | | Nippon Soda Co., Ltd. | | 22,520 |
| 1,700 | | Nippon Television Holdings, Inc. | | 15,123 |
| 600 | | Nishimatsu Construction Co., Ltd. | | 17,976 |
| 800 | | Nishio Rent All Co., Ltd. | | 15,902 |
| 3,100 | | Nissha Co., Ltd. | | 33,609 |
| 4,200 | | Nisshinbo Holdings, Inc. | | 31,605 |
| Shares | | Description | | Value |
|
| | | Japan (Continued) | | |
| 800 | | Nitta Corp. | | $16,268 |
| 1,900 | | Nojima Corp. | | 39,434 |
| 1,000 | | NOK Corp. | | 8,137 |
| 700 | | Noritake Co., Ltd. | | 20,792 |
| 1,300 | | NS United Kaiun Kaisha Ltd. | | 35,307 |
| 600 | | Optex Group Co., Ltd. | | 8,933 |
| 300 | | Organo Corp. | | 18,772 |
| 2,900 | | Osaka Steel Co., Ltd. | | 31,612 |
| 1,300 | | Pacific Metals Co., Ltd. | | 22,593 |
| 600 | | Pilot Corp. (c) | | 21,381 |
| 2,800 | | Rengo Co., Ltd. | | 15,189 |
| 700 | | Sankyo Co., Ltd. | | 21,179 |
| 2,600 | | Sanyo Special Steel Co., Ltd. | | 37,655 |
| 300 | | SBS Holdings, Inc. | | 6,025 |
| 500 | | Seiko Holdings Corp. | | 10,680 |
| 2,000 | | Shin Nippon Biomedical Laboratories Ltd. | | 29,157 |
| 1,000 | | Shin-Etsu Polymer Co., Ltd. | | 8,704 |
| 8,000 | | SKY Perfect JSAT Holdings, Inc. | | 31,840 |
| 700 | | Snow Peak, Inc. | | 14,002 |
| 2,000 | | Sumitomo Forestry Co., Ltd. (c) | | 28,346 |
| 300 | | Sumitomo Osaka Cement Co., Ltd. | | 7,440 |
| 1,000 | | Sumitomo Rubber Industries Ltd. | | 8,542 |
| 1,900 | | Sumitomo Warehouse (The) Co., Ltd. | | 28,077 |
| 1,700 | | Taiheiyo Cement Corp. | | 25,372 |
| 900 | | Takara Standard Co., Ltd. | | 8,292 |
| 400 | | Tama Home Co., Ltd. | | 7,223 |
| 2,100 | | Toagosei Co., Ltd. (c) | | 15,617 |
| 3,100 | | Toho Titanium Co., Ltd. | | 50,494 |
| 700 | | Tokai Rika Co., Ltd. | | 7,636 |
| 1,900 | | Tokuyama Corp. | | 24,170 |
| 1,800 | | Tomy Co., Ltd. | | 18,082 |
| 800 | | Towa Pharmaceutical Co., Ltd. | | 14,522 |
| 2,400 | | Toyo Seikan Group Holdings Ltd. | | 25,100 |
| 2,800 | | Toyo Tire Corp. | | 34,959 |
| 3,000 | | Toyobo Co., Ltd. | | 22,155 |
| 1,100 | | Toyoda Gosei Co., Ltd. | | 17,374 |
| 700 | | Tsubakimoto Chain Co. | | 15,658 |
| 700 | | TV Asahi Holdings Corp. | | 7,625 |
| 1,000 | | UACJ Corp. | | 15,220 |
| 1,700 | | UBE Corp. | | 25,272 |
| 5,800 | | Yamada Holdings Co., Ltd. | | 20,861 |
| 300 | | Yamato Kogyo Co., Ltd. | | 9,928 |
| 2,600 | | Yokohama Rubber (The) Co., Ltd. (c) | | 35,202 |
| 4,300 | | Yonex Co., Ltd. | | 36,224 |
| 1,600 | | Zeon Corp. | | 15,495 |
| | | | | 2,243,606 |
| | | Jersey – 0.3% | | |
| 7,600 | | Centamin PLC | | 7,264 |
Page 76
See Notes to Financial Statements
First Trust Developed Markets ex-US Small Cap AlphaDEX® Fund (FDTS)
Portfolio of Investments (Continued)
June 30, 2022 (Unaudited)
| Shares | | Description | | Value |
| COMMON STOCKS (a) (Continued) |
| | | Jersey (Continued) | | |
| 5,245 | | Yellow Cake PLC (b) (e) (f) | | $20,751 |
| | | | | 28,015 |
| | | Luxembourg – 0.8% | | |
| 1,367 | | ADLER Group S.A. (b) (e) (f) | | 5,401 |
| 1,023 | | APERAM S.A. | | 28,409 |
| 714 | | Millicom International Cellular S.A. (b) | | 10,190 |
| 3,900 | | Samsonite International S.A. (b) (e) (f) | | 7,764 |
| 2,912 | | Subsea 7 S.A. | | 23,279 |
| | | | | 75,043 |
| | | Netherlands – 0.8% | | |
| 630 | | AMG Advanced Metallurgical Group N.V. | | 16,241 |
| 1,508 | | Fugro N.V. (b) | | 19,027 |
| 3,003 | | Koninklijke BAM Groep N.V. (b) | | 7,100 |
| 31,326 | | MFE-MediaForEurope N.V., Class B | | 22,077 |
| 1,590 | | SRH N.V. (b) (d) (g) (h) | | 0 |
| 40,588 | | Steinhoff International Holdings N.V. (b) | | 6,282 |
| | | | | 70,727 |
| | | New Zealand – 0.2% | | |
| 2,239 | | Summerset Group Holdings Ltd. | | 13,424 |
| | | Norway – 2.0% | | |
| 5,248 | | Aker Solutions ASA | | 14,258 |
| 2,341 | | Austevoll Seafood ASA | | 27,403 |
| 30,853 | | DNO ASA | | 42,788 |
| 8,457 | | Elkem ASA (e) (f) | | 26,943 |
| 10,811 | | MPC Container Ships ASA | | 21,387 |
| 1,216 | | TGS ASA | | 17,074 |
| 6,163 | | Wallenius Wilhelmsen ASA | | 33,194 |
| | | | | 183,047 |
| | | Portugal – 0.2% | | |
| 15,783 | | Sonae SGPS S.A. | | 19,368 |
| | | Singapore – 0.7% | | |
| 37,500 | | Riverstone Holdings Ltd. | | 19,974 |
| 23,200 | | Sembcorp Industries Ltd. | | 47,592 |
| | | | | 67,566 |
| | | South Korea – 18.1% | | |
| 178 | | Ahnlab, Inc. | | 11,845 |
| 64 | | BGF retail Co., Ltd. | | 9,316 |
| 1,818 | | BH Co., Ltd. | | 34,164 |
| 471 | | Cheil Worldwide, Inc. | | 8,615 |
| 1,952 | | Daeduck Electronics Co., Ltd. | | 39,314 |
| 1,428 | | Daesang Corp. | | 22,546 |
| 1,584 | | Daewoo Engineering & Construction Co., Ltd. (b) | | 7,125 |
| Shares | | Description | | Value |
|
| | | South Korea (Continued) | | |
| 296 | | DB HiTek Co., Ltd. | | $11,387 |
| 906 | | DL Holdings Co., Ltd. | | 49,473 |
| 471 | | DN Automotive Corp. | | 20,133 |
| 3,310 | | Dongkuk Steel Mill Co., Ltd. | | 32,758 |
| 3,340 | | Doosan Infracore Co., Ltd. (b) | | 13,994 |
| 215 | | DoubleUGames Co., Ltd. | | 6,359 |
| 393 | | E-MART, Inc. | | 31,933 |
| 1,010 | | GS Holdings Corp. | | 32,554 |
| 1,956 | | GS Retail Co., Ltd. | | 38,641 |
| 851 | | HAESUNG DS Co., Ltd. | | 40,571 |
| 1,243 | | Handsome Co., Ltd. | | 29,390 |
| 1,051 | | Hanil Cement Co., Ltd. | | 10,806 |
| 1,514 | | Hankook & Co. Co., Ltd. | | 14,984 |
| 1,318 | | Hankook Tire & Technology Co., Ltd. | | 33,447 |
| 416 | | Hansae Co., Ltd. | | 5,431 |
| 637 | | Hanwha Aerospace Co., Ltd. | | 23,892 |
| 5,281 | | Harim Holdings Co., Ltd. | | 34,206 |
| 645 | | Hyosung Corp. | | 39,940 |
| 95 | | Hyosung TNC Corp. | | 25,096 |
| 300 | | Hyundai Construction Equipment Co., Ltd. | | 10,386 |
| 368 | | Hyundai Home Shopping Network Corp. | | 14,341 |
| 1,380 | | Hyundai Marine & Fire Insurance Co., Ltd. | | 32,895 |
| 163 | | Il Dong Pharmaceutical Co., Ltd. (b) | | 3,873 |
| 826 | | Innox Advanced Materials Co., Ltd. | | 21,152 |
| 584 | | IS Dongseo Co., Ltd. | | 17,542 |
| 2,141 | | Jusung Engineering Co., Ltd. | | 27,867 |
| 361 | | JYP Entertainment Corp. | | 13,415 |
| 525 | | KCC Glass Corp. | | 19,550 |
| 2,957 | | KG DONGBUSTEEL | | 30,290 |
| 1,912 | | Kginicis Co., Ltd. | | 18,702 |
| 1,774 | | Korea Circuit Co., Ltd. (b) | | 26,369 |
| 348 | | Korea Electric Terminal Co., Ltd. | | 14,446 |
| 560 | | Korea Gas Corp. | | 17,058 |
| 15,927 | | Korea Line Corp. (b) | | 32,139 |
| 265 | | Korea Petrochemical Ind. Co., Ltd. | | 25,002 |
| 3,381 | | Korean Reinsurance Co. | | 21,873 |
| 358 | | Kumho Petrochemical Co., Ltd. | | 38,326 |
| 463 | | LIG Nex1 Co., Ltd. | | 25,603 |
| 183 | | Lotte Chilsung Beverage Co., Ltd. | | 24,665 |
| 700 | | LOTTE Fine Chemical Co., Ltd. | | 35,313 |
| 210 | | LS Corp. | | 10,286 |
| 1,610 | | LX International Corp. | | 40,362 |
| 153 | | LX Semicon Co., Ltd. | | 11,289 |
| 538 | | MegaStudyEdu Co., Ltd. | | 32,320 |
| 6,783 | | Meritz Securities Co., Ltd. | | 23,717 |
| 528 | | OCI Co., Ltd. | | 58,355 |
| 778 | | Orion Holdings Corp. | | 8,988 |
See Notes to Financial Statements
Page 77
First Trust Developed Markets ex-US Small Cap AlphaDEX® Fund (FDTS)
Portfolio of Investments (Continued)
June 30, 2022 (Unaudited)
| Shares | | Description | | Value |
| COMMON STOCKS (a) (Continued) |
| | | South Korea (Continued) | | |
| 4,759 | | Pan Ocean Co., Ltd. | | $21,772 |
| 121 | | PharmaResearch Co., Ltd. | | 6,281 |
| 1,670 | | Poongsan Corp. | | 31,898 |
| 440 | | PSK, Inc. | | 12,606 |
| 2,989 | | Seah Besteel Corp. | | 35,337 |
| 884 | | SGC Energy Co., Ltd. | | 24,782 |
| 792 | | SIMMTECH Co., Ltd. | | 22,539 |
| 802 | | SK Discovery Co., Ltd. | | 21,588 |
| 386 | | SK Gas Ltd. | | 36,121 |
| 272 | | SM Entertainment Co., Ltd. | | 13,219 |
| 480 | | SNT Motiv Co., Ltd. | | 15,878 |
| 3,503 | | Ssangyong Motor Co. (b) (d) (g) (h) | | 6,043 |
| 528 | | Unid Co., Ltd. | | 39,201 |
| 2,286 | | Vidente Co., Ltd. (b) | | 15,089 |
| 5,930 | | Woori Technology Investment Co., Ltd. (b) | | 23,932 |
| 486 | | YG Entertainment, Inc. | | 16,526 |
| 699 | | Youngone Corp. | | 20,673 |
| | | | | 1,647,529 |
| | | Spain – 0.9% | | |
| 2,472 | | Acerinox S.A. | | 23,926 |
| 2,442 | | Indra Sistemas SA (b) | | 23,352 |
| 533 | | Let’s GOWEX
S.A. (b) (d) (g) (h) (i) | | 0 |
| 5,390 | | Mediaset Espana Comunicacion S.A. (b) | | 22,153 |
| 402 | | Solaria Energia y Medio Ambiente S.A. (b) | | 8,531 |
| | | | | 77,962 |
| | | Sweden – 0.6% | | |
| 1,383 | | Bure Equity AB | | 27,607 |
| 7,868 | | Scandic Hotels Group AB (b) (e) (f) | | 30,365 |
| | | | | 57,972 |
| | | Switzerland – 1.1% | | |
| 276 | | Bobst Group S.A. | | 17,751 |
| 339 | | Leonteq AG | | 18,821 |
| 328 | | Sulzer AG | | 20,374 |
| 375 | | u-blox Holding AG (b) | | 37,985 |
| | | | | 94,931 |
| | | United Kingdom – 4.4% | | |
| 585 | | Bank of Georgia Group PLC | | 9,300 |
| 286 | | Bellway PLC | | 7,471 |
| 15,722 | | Capricorn Energy PLC (b) | | 41,722 |
| 8,759 | | Central Asia Metals PLC | | 23,617 |
| 36,240 | | Coats Group PLC | | 27,484 |
| 11,718 | | Diversified Energy Co. PLC (e) | | 15,891 |
| 112,625 | | EnQuest PLC (b) | | 32,081 |
| 18,630 | | Ferrexpo PLC | | 29,550 |
| 6,188 | | Firstgroup PLC (b) | | 9,604 |
| Shares | | Description | | Value |
|
| | | United Kingdom (Continued) | | |
| 7,440 | | Indivior PLC (b) | | $28,003 |
| 38,605 | | IP Group PLC | | 32,896 |
| 1,951 | | Mediclinic International PLC | | 10,872 |
| 4,477 | | Molten Ventures PLC (b) | | 22,780 |
| 93,067 | | Pan African Resources PLC | | 23,508 |
| 1,609 | | Redde Northgate PLC | | 6,601 |
| 2,658 | | Redrow PLC | | 15,848 |
| 9,645 | | Serco Group PLC | | 20,453 |
| 5,231 | | Serica Energy PLC | | 18,148 |
| 5,684 | | Spire Healthcare Group PLC (b) (e) (f) | | 16,260 |
| 2,274 | | Synthomer PLC | | 6,228 |
| | | | | 398,317 |
| | | Total Common Stocks | | 8,486,677 |
| | | (Cost $10,064,161) | | |
| REAL ESTATE INVESTMENT TRUSTS (a) – 6.1% |
| | | Australia – 3.6% | | |
| 14,724 | | Abacus Property Group | | 26,120 |
| 12,093 | | BWP Trust | | 32,471 |
| 15,864 | | Centuria Industrial REIT | | 30,770 |
| 11,451 | | Charter Hall Long Wale REIT | | 33,750 |
| 14,470 | | Charter Hall Retail REIT | | 37,655 |
| 12,432 | | Charter Hall Social Infrastructure REIT | | 29,004 |
| 14,376 | | Dexus Industria REIT | | 26,792 |
| 11,101 | | Growthpoint Properties Australia Ltd. | | 26,129 |
| 4,496 | | National Storage REIT | | 6,641 |
| 20,863 | | Shopping Centres Australasia Property Group | | 39,602 |
| 22,816 | | Waypoint REIT Ltd. | | 36,537 |
| | | | | 325,471 |
| | | Canada – 0.9% | | |
| 3,497 | | Artis Real Estate Investment Trust | | 31,949 |
| 708 | | Dream Industrial Real Estate Investment Trust | | 6,644 |
| 1,429 | | InterRent Real Estate Investment Trust | | 13,311 |
| 2,076 | | Summit Industrial Income REIT | | 27,595 |
| | | | | 79,499 |
| | | Guernsey – 0.2% | | |
| 21,207 | | Picton Property Income (The) Ltd. | | 22,872 |
| | | Japan – 0.1% | | |
| 9 | | Takara Leben Real Estate Investment Corp. | | 7,781 |
| | | Netherlands – 0.5% | | |
| 1,342 | | Eurocommercial Properties N.V. | | 28,886 |
Page 78
See Notes to Financial Statements
First Trust Developed Markets ex-US Small Cap AlphaDEX® Fund (FDTS)
Portfolio of Investments (Continued)
June 30, 2022 (Unaudited)
| Shares | | Description | | Value |
| REAL ESTATE INVESTMENT TRUSTS (a) (Continued) |
| | | Netherlands (Continued) | | |
| 414 | | NSI N.V. | | $14,252 |
| | | | | 43,138 |
| | | New Zealand – 0.4% | | |
| 27,869 | | Goodman Property Trust | | 34,811 |
| | | United Kingdom – 0.4% | | |
| 452 | | Big Yellow Group PLC | | 7,219 |
| 2,520 | | LondonMetric Property PLC | | 7,006 |
| 16,011 | | Warehouse Reit PLC (e) | | 28,729 |
| | | | | 42,954 |
| | | Total Real Estate Investment Trusts | | 556,526 |
| | | (Cost $684,202) | | |
| MONEY MARKET FUNDS – 1.2% |
| 109,763 | | Goldman Sachs Financial Square Treasury Obligations Fund - Institutional Class - 1.39% (j) (k) | | 109,763 |
| | | (Cost $109,763) | | |
Principal
Value | | Description | | Value |
| REPURCHASE AGREEMENTS – 1.1% |
| $103,230 | | BNP Paribas S.A., 1.44% (j), dated 6/30/22, due 7/1/22, with a maturity value of $103,234. Collateralized by U.S. Treasury Note, interest rate of 1.25%, due 5/31/28. The value of the collateral including accrued interest is $105,511. (k) | | 103,230 |
| | | (Cost $103,230) | | |
| | | Total Investments – 101.8% | | 9,256,196 |
| | | (Cost $10,961,356) | | |
| | | Net Other Assets and Liabilities – (1.8)% | | (162,885) |
| | | Net Assets – 100.0% | | $9,093,311 |
| (a) | Portfolio securities are categorized based upon their country of incorporation, which can be different from the country categorization of the Fund’s underlying index. For a breakdown of the portfolio securities by sector, please see the Fund Performance Overview. |
| (b) | Non-income producing security. |
| (c) | All or a portion of this security is on loan (see Note 2F - Securities Lending in the Notes to Financial Statements). The remaining contractual maturity of all of the securities lending transactions is overnight and continuous. The aggregate value of such securities is $200,665 and the total value of the collateral held by the Fund is $212,993. |
| (d) | This security is fair valued by the Advisor’s Pricing Committee in accordance with procedures adopted by the Trust’s Board of Trustees, and in accordance with the provisions of the Investment Company Act of 1940, as amended. At June 30, 2022, securities noted as such are valued at $20,600 or 0.2% of net assets. |
| (e) | This security may be resold to qualified foreign investors and foreign institutional buyers under Regulation S of the Securities Act of 1933, as amended (the “1933 Act”). |
| (f) | This security is exempt from registration upon resale under Rule 144A of the 1933 Act and may be resold in transactions exempt from registration, normally to qualified institutional buyers. This security is not restricted on the foreign exchange where it trades freely without any additional registration. As such, it does not require the additional disclosure required of restricted securities. |
| (g) | Pursuant to procedures adopted by the Trust’s Board of Trustees, this security has been determined to be illiquid by First Trust Advisors L.P., the Fund’s advisor. |
| (h) | This security’s value was determined using significant unobservable inputs (see Note 2A – Portfolio Valuation in the Notes to Financial Statements). |
| (i) | This issuer has filed for protection in bankruptcy court. |
| (j) | Rate shown reflects yield as of June 30, 2022. |
| (k) | This security serves as collateral for securities on loan. |
See Notes to Financial Statements
Page 79
First Trust Developed Markets ex-US Small Cap AlphaDEX® Fund (FDTS)
Portfolio of Investments (Continued)
June 30, 2022 (Unaudited)
Offsetting Assets and Liabilities
Offsetting assets and liabilities requires entities to disclose both gross and net information about instruments and transactions eligible for offset, and to disclose instruments and transactions subject to master netting or similar agreements (see Note 2E – Offsetting on the Statements of Assets and Liabilities in the Notes to Financial Statements).
The Fund’s loaned securities were all subject to an enforceable Securities Lending Agency Agreement. Securities lent in accordance with the Securities Lending Agency Agreement on a gross basis were as follows:
| Security Lending Agency Agreement | |
| Total gross amount presented on the Statements of Assets and Liabilities (1) | $200,665 |
| Non-cash Collateral (2) | (200,665) |
| Net Amount | $— |
| (1) | The amount presented on the Statements of Assets and Liabilities, which is included in “Investments, at value,” is not offset and is shown on a gross basis. |
| (2) | At June 30, 2022, the value of the collateral received from each borrower exceeded the value of the related securities loaned. This amount is disclosed on the Portfolio of Investments. |
The Fund’s investments in repurchase agreements were all subject to an enforceable Master Repurchase Agreement. Repurchase Agreements on a gross basis were as follows:
| Repurchase Agreements | |
| Total gross amount presented on the Statements of Assets and Liabilities (3) | $103,230 |
| Non-cash Collateral (4) | (103,230) |
| Net Amount | $— |
| (3) | The amount is included in “Investments, at value” on the Statements of Assets and Liabilities. |
| (4) | At June 30, 2022, the value of the collateral received from each seller exceeded the value of the repurchase agreements. |
Currency Exposure
Diversification | % of Total
Investments |
| Japanese Yen | 24.3% |
| South Korean Won | 17.8 |
| Canadian Dollar | 14.9 |
| Australian Dollar | 10.0 |
| Euro | 9.8 |
| British Pound Sterling | 6.1 |
| Israeli Shekel | 3.7 |
| Norwegian Krone | 3.7 |
| Hong Kong Dollar | 3.7 |
| United States Dollar | 2.3 |
| Swiss Franc | 1.0 |
| Danish Krone | 0.8 |
| Swedish Krona | 0.7 |
| Singapore Dollar | 0.7 |
| New Zealand Dollar | 0.5 |
| Total | 100.0% |
Valuation Inputs
A summary of the inputs used to value the Fund’s investments as of June 30, 2022 is as follows (see Note 2A - Portfolio Valuation in the Notes to Financial Statements):
| | Total
Value at
6/30/2022 | Level 1
Quoted
Prices | Level 2
Significant
Observable
Inputs | Level 3
Significant
Unobservable
Inputs |
| Common Stocks: | | | | |
| Australia | $ 600,270 | $ 593,839 | $ 6,431 | $ — |
| Greece | 56,394 | 48,268 | — | 8,126 |
| Netherlands | 70,727 | 70,727 | — | —** |
| South Korea | 1,647,529 | 1,641,486 | — | 6,043 |
| Spain | 77,962 | 77,962 | — | —** |
| Other Country Categories* | 6,033,795 | 6,033,795 | — | — |
| Real Estate Investment Trusts* | 556,526 | 556,526 | — | — |
| Money Market Funds | 109,763 | 109,763 | — | — |
| Repurchase Agreements | 103,230 | — | 103,230 | — |
| Total Investments | $ 9,256,196 | $ 9,132,366 | $ 109,661 | $ 14,169 |
| * | See Portfolio of Investments for country breakout. |
| ** | Investment is valued at $0. |
Level 3 investments are fair valued by the Advisor’s Pricing Committee and are footnoted in the Portfolio of Investments. The Level 3 investments values are based on unobservable and non-quantitative inputs.
Page 80
See Notes to Financial Statements
First Trust Emerging Markets Small Cap AlphaDEX® Fund (FEMS)
Portfolio of Investments
June 30, 2022 (Unaudited)
| Shares | | Description | | Value |
| COMMON STOCKS (a) – 97.3% |
| | | Bermuda – 2.3% | | |
| 537,378 | | BOE Varitronix Ltd. | | $1,079,303 |
| 7,930,142 | | Gemdale Properties & Investment Corp., Ltd. | | 717,541 |
| 28,468 | | Geopark Ltd. | | 367,807 |
| 437,419 | | Shenzhen International Holdings Ltd. | | 430,350 |
| | | | | 2,595,001 |
| | | Brazil – 9.4% | | |
| 11,206 | | Arezzo Industria e Comercio S.A. | | 148,922 |
| 80,043 | | Auren Energia S.A. | | 208,311 |
| 152,741 | | Bradespar S.A. (Preference Shares) | | 736,643 |
| 158,590 | | BrasilAgro - Co Brasileira de Propriedades Agricolas | | 738,791 |
| 41,844 | | Cia Brasileira de Distribuicao | | 130,646 |
| 73,708 | | Cia de Saneamento de Minas Gerais-Copasa | | 162,248 |
| 198,436 | | Cia de Saneamento do Parana | | 691,604 |
| 42,442 | | Cia Ferro Ligas da Bahia-Ferbasa (Preference Shares) | | 377,347 |
| 68,838 | | Dexco S.A. | | 129,825 |
| 128,895 | | EDP - Energias do Brasil S.A. | | 505,142 |
| 243,620 | | Enauta Participacoes S.A. | | 817,893 |
| 59,884 | | Intelbras S.A. Industria de Telecomunicacao Eletronica Brasileira | | 282,745 |
| 615,243 | | JHSF Participacoes S.A. | | 685,373 |
| 107,542 | | Log-in Logistica Intermodal S.A. (b) | | 623,456 |
| 78,794 | | Mahle-Metal Leve S.A. | | 349,145 |
| 329,702 | | Metalurgica Gerdau S.A. (Preference Shares) | | 601,640 |
| 319,285 | | Minerva S.A. | | 809,583 |
| 526,321 | | Multilaser Industrial S.A. | | 398,252 |
| 574,985 | | Raizen S.A. (Preference Shares) | | 504,291 |
| 94,620 | | Randon S.A. Implementos e Participacoes (Preference Shares) | | 169,589 |
| 22,780 | | Sao Martinho S.A. | | 158,136 |
| 20,292 | | SLC Agricola S.A. | | 171,108 |
| 32,050 | | Unipar Carbocloro S.A., Class B (Preference Shares) | | 557,903 |
| 361,681 | | Usinas Siderurgicas de Minas Gerais S.A., Class A (Preference Shares) | | 597,797 |
| | | | | 10,556,390 |
| | | Cayman Islands – 13.1% | | |
| 520,528 | | 3SBio, Inc. (c) (d) | | 413,939 |
| 1,257,524 | | Agile Group Holdings Ltd. (e) | | 503,215 |
| 912,000 | | China Aoyuan Group Ltd. (b) (f) (g) | | 137,146 |
| Shares | | Description | | Value |
|
| | | Cayman Islands (Continued) | | |
| 11,550 | | China Metal Recycling Holdings Ltd. (b) (f) (g) (h) | | $0 |
| 1,311,538 | | China Modern Dairy Holdings Ltd. (e) | | 197,229 |
| 356,196 | | China Overseas Property Holdings Ltd. (e) | | 383,577 |
| 859,320 | | China Renaissance Holdings Ltd. (c) (d) | | 1,077,600 |
| 802,448 | | China Risun Group Ltd. (c) | | 345,654 |
| 3,518,344 | | China SCE Group Holdings Ltd. | | 484,250 |
| 585,860 | | China Yongda Automobiles Services Holdings Ltd. | | 553,994 |
| 935,944 | | China Yuhua Education Corp., Ltd. (b) (c) (d) | | 165,795 |
| 3,171,951 | | China Zhongwang Holdings Ltd. (b) (f) (g) | | 679,115 |
| 2,921,570 | | CMGE Technology Group Ltd. (b) | | 860,074 |
| 1,606,818 | | Fufeng Group Ltd. | | 1,030,011 |
| 98,671 | | Fulgent Sun International Holding Co., Ltd. | | 574,103 |
| 63,534 | | General Interface Solution Holding Ltd. | | 163,464 |
| 496,266 | | Greentown Management Holdings Co., Ltd. (c) (d) | | 383,261 |
| 1,617,908 | | Kaisa Group Holdings Ltd. (b) (f) (g) | | 173,197 |
| 1,541,860 | | KWG Group Holdings Ltd. | | 491,238 |
| 1,140,678 | | KWG Living Group Holdings Ltd. (c) | | 356,153 |
| 3,022,042 | | Logan Group Co., Ltd. (e) (f) | | 839,584 |
| 2,335,178 | | Lonking Holdings Ltd. | | 565,433 |
| 304,681 | | NetDragon Websoft Holdings Ltd. | | 655,428 |
| 3,217,758 | | Powerlong Real Estate Holdings Ltd. | | 537,195 |
| 275,140 | | Q Technology Group Co., Ltd. (b) (c) (e) | | 189,345 |
| 394,818 | | Seazen Group Ltd. (b) | | 195,225 |
| 496,713 | | TCL Electronics Holdings Ltd. | | 234,848 |
| 1,497,780 | | Tian Lun Gas Holdings Ltd. | | 941,028 |
| 742,112 | | Tianneng Power International Ltd. (e) | | 802,943 |
| 1,914,507 | | Times China Holdings Ltd. (e) | | 634,363 |
| 70,520 | | Wisdom Marine Lines Co., Ltd. | | 154,163 |
| | | | | 14,722,570 |
| | | Chile – 1.7% | | |
| 68,584 | | CAP S.A. | | 618,082 |
| 13,510,112 | | Colbun S.A. | | 935,026 |
| 97,322 | | Empresa Nacional de Telecomunicaciones S.A. | | 304,274 |
| | | | | 1,857,382 |
See Notes to Financial Statements
Page 81
First Trust Emerging Markets Small Cap AlphaDEX® Fund (FEMS)
Portfolio of Investments (Continued)
June 30, 2022 (Unaudited)
| Shares | | Description | | Value |
| COMMON STOCKS (a) (Continued) |
| | | China – 5.8% | | |
| 455,844 | | A-Living Smart City Services Co., Ltd., Class H (c) (d) | | $733,134 |
| 217,552 | | Anhui Expressway Co., Ltd. | | 175,776 |
| 1,266,343 | | BAIC Motor Corp., Ltd., Class H (c) (d) | | 421,211 |
| 2,807,832 | | Beijing Jingneng Clean Energy Co., Ltd., Class H | | 644,097 |
| 2,476,208 | | China BlueChemical Ltd., Class H | | 713,186 |
| 468,847 | | China Communications Services Corp., Ltd., Class H | | 206,138 |
| 1,797,248 | | Guangzhou R&F Properties Co., Ltd., Class H (e) | | 474,117 |
| 979,085 | | Inner Mongolia Yitai Coal Co., Ltd., Class B | | 1,604,720 |
| 168,906 | | Legend Holdings Corp., Class H (c) (d) | | 221,712 |
| 201,070 | | Shenzhen Expressway Co., Ltd., Class H | | 208,839 |
| 1,359,056 | | Sinotrans Ltd., Class H | | 389,697 |
| 258,828 | | Xinte Energy Co., Ltd. | | 776,801 |
| | | | | 6,569,428 |
| | | Egypt – 0.4% | | |
| 219,750 | | Egyptian Financial Group-Hermes Holding Co. (i) | | 139,448 |
| 941,253 | | ElSewedy Electric Co. (b) | | 303,404 |
| | | | | 442,852 |
| | | Hong Kong – 2.9% | | |
| 702,832 | | China Everbright Environment Group Ltd. | | 414,706 |
| 2,113,070 | | China Nonferrous Mining Corp., Ltd. | | 974,832 |
| 724,411 | | China Overseas Grand Oceans Group Ltd. | | 384,971 |
| 322,622 | | Genertec Universal Medical Group Co., Ltd. (c) (d) | | 196,941 |
| 283,167 | | Shanghai Industrial Holdings Ltd. | | 409,226 |
| 2,162,510 | | Shougang Fushan Resources Group Ltd. | | 898,428 |
| | | | | 3,279,104 |
| | | India – 1.8% | | |
| 34,140 | | BSE Ltd. | | 258,041 |
| 97,646 | | Delta Corp. Ltd. | | 205,808 |
| 9,478,890 | | Jaiprakash Power Ventures Ltd. (b) | | 774,179 |
| 529,199 | | National Aluminium Co., Ltd. | | 461,033 |
| 3,522,211 | | Suzlon Energy Ltd. (b) | | 305,513 |
| | | | | 2,004,574 |
| | | Indonesia – 5.7% | | |
| 730,065 | | Astra Agro Lestari Tbk PT | | 480,257 |
| Shares | | Description | | Value |
|
| | | Indonesia (Continued) | | |
| 3,713,197 | | Bukit Asam Tbk PT | | $952,134 |
| 61,699,085 | | Bumi Resources Minerals Tbk PT (b) | | 1,018,827 |
| 773,191 | | Indah Kiat Pulp & Paper Tbk PT | | 394,445 |
| 5,478,215 | | Indika Energy Tbk PT (b) | | 856,804 |
| 534,869 | | Indo Tambangraya Megah Tbk PT | | 1,101,333 |
| 1,477,793 | | Matahari Department Store Tbk PT | | 494,995 |
| 9,208,356 | | Media Nusantara Citra Tbk PT | | 577,937 |
| 10,054,666 | | Surya Esa Perkasa Tbk PT | | 563,561 |
| | | | | 6,440,293 |
| | | Jersey – 0.7% | | |
| 6,662,570 | | West China Cement Ltd. | | 840,590 |
| | | Malaysia – 3.2% | | |
| 8,723,600 | | Bumi Armada Bhd (b) | | 762,016 |
| 2,656,000 | | Dagang NeXchange Bhd | | 476,061 |
| 368,700 | | Hartalega Holdings Bhd | | 255,978 |
| 3,110,200 | | Hibiscus Petroleum Bhd | | 705,661 |
| 2,281,000 | | Kossan Rubber Industries | | 683,136 |
| 3,788,876 | | Supermax Corp. Bhd | | 752,187 |
| | | | | 3,635,039 |
| | | Mexico – 2.4% | | |
| 425,272 | | Alsea S.A.B. de C.V. (b) | | 805,732 |
| 193,591 | | Coca-Cola Femsa S.A.B. de C.V. | | 1,073,104 |
| 1,004,337 | | Gentera S.A.B. de C.V. | | 806,586 |
| | | | | 2,685,422 |
| | | Philippines – 1.9% | | |
| 6,093,000 | | DMCI Holdings, Inc. | | 977,362 |
| 1,792,200 | | Semirara Mining & Power Corp. | | 1,140,802 |
| | | | | 2,118,164 |
| | | Poland – 1.1% | | |
| 45,563 | | Jastrzebska Spolka Weglowa S.A. (b) (e) | | 653,950 |
| 449,276 | | Orange Polska S.A. | | 628,590 |
| | | | | 1,282,540 |
| | | Russia – 0.0% | | |
| 378,620,637 | | Federal Grid Co. Unified Energy System PJSC (f) (g) (h) | | 15,696 |
| 580,351 | | Mechel PJSC (b) (f) (g) (h) | | 22,005 |
| 41,053,967 | | ROSSETI PJSC (f) (g) (h) | | 12,719 |
| | | | | 50,420 |
| | | South Africa – 2.1% | | |
| 21,085 | | Foschini Group (The) Ltd. | | 158,117 |
| 42,061 | | Harmony Gold Mining Co., Ltd. | | 134,363 |
| 162,168 | | PSG Group Ltd. (b) | | 837,417 |
| 218,450 | | Sappi Ltd. (b) | | 723,210 |
| 209,586 | | Telkom S.A. SOC Ltd. (b) | | 470,993 |
| | | | | 2,324,100 |
Page 82
See Notes to Financial Statements
First Trust Emerging Markets Small Cap AlphaDEX® Fund (FEMS)
Portfolio of Investments (Continued)
June 30, 2022 (Unaudited)
| Shares | | Description | | Value |
| COMMON STOCKS (a) (Continued) |
| | | Taiwan – 18.7% | | |
| 323,233 | | Asia Polymer Corp. | | $306,562 |
| 209,200 | | Asia Vital Components Co., Ltd. | | 655,036 |
| 1,212,527 | | BES Engineering Corp. | | 353,153 |
| 201,087 | | China Motor Corp. | | 419,981 |
| 355,620 | | ChipMOS Technologies, Inc. | | 441,931 |
| 396,075 | | Chung Hung Steel Corp. | | 357,664 |
| 74,760 | | Coremax Corp. | | 320,578 |
| 525,821 | | CTCI Corp. | | 794,032 |
| 37,844 | | Elite Semiconductor Microelectronics Technology, Inc. | | 113,022 |
| 330,241 | | Evergreen International Storage & Transport Corp. | | 317,652 |
| 59,833 | | Faraday Technology Corp. | | 384,351 |
| 189,418 | | Feng Hsin Steel Co., Ltd. | | 435,744 |
| 122,471 | | Getac Holdings Corp. | | 166,200 |
| 46,869 | | Gigabyte Technology Co., Ltd. | | 139,818 |
| 714,716 | | Global Brands Manufacture Ltd. | | 687,470 |
| 71,682 | | Gold Circuit Electronics Ltd. | | 183,463 |
| 1,115,925 | | Grand Pacific Petrochemical | | 851,952 |
| 288,083 | | Hannstar Board Corp. | | 306,652 |
| 1,971,829 | | HannStar Display Corp. | | 673,115 |
| 51,417 | | Hotai Finance Co., Ltd. | | 173,791 |
| 179,733 | | Hsin Kuang Steel Co., Ltd. | | 239,676 |
| 142,193 | | King Yuan Electronics Co., Ltd. | | 191,290 |
| 359,466 | | Kinpo Electronics | | 157,769 |
| 44,966 | | Lotus Pharmaceutical Co., Ltd. | | 232,138 |
| 455,832 | | Macronix International Co., Ltd. | | 544,236 |
| 1,030,956 | | Mitac Holdings Corp. | | 951,780 |
| 279,066 | | Nantex Industry Co., Ltd. | | 399,356 |
| 159,501 | | Nuvoton Technology Corp. | | 729,552 |
| 267,235 | | Oriental Union Chemical Corp. (b) | | 168,070 |
| 386,241 | | Pou Chen Corp. | | 383,208 |
| 128,273 | | Powertech Technology, Inc. | | 378,777 |
| 183,247 | | Qisda Corp. | | 176,569 |
| 210,102 | | Ruentex Industries Ltd. | | 548,335 |
| 154,057 | | Sercomm Corp. | | 420,200 |
| 290,833 | | Shinkong Synthetic Fibers Corp. | | 177,531 |
| 102,002 | | Shiny Chemical Industrial Co., Ltd. | | 516,297 |
| 351,516 | | Supreme Electronics Co., Ltd. | | 497,124 |
| 198,953 | | T3EX Global Holdings Corp. | | 576,782 |
| 847,715 | | Ta Ya Electric Wire & Cable | | 738,420 |
| 725,351 | | Taiwan Glass Industry Corp. | | 435,452 |
| 51,635 | | Taiwan Surface Mounting Technology Corp. | | 156,988 |
| 1,687,798 | | Ton Yi Industrial Corp. | | 828,757 |
| 71,682 | | Topco Scientific Co., Ltd. | | 332,693 |
| 174,583 | | TSRC Corp. | | 174,093 |
| 173,095 | | Tung Ho Steel Enterprise Corp. | | 302,138 |
| 166,930 | | Wah Lee Industrial Corp. | | 473,839 |
| 629,432 | | Walsin Lihwa Corp. | | 763,147 |
| 326,408 | | WPG Holdings Ltd. | | 604,876 |
| 307,337 | | WT Microelectronics Co., Ltd. | | 693,572 |
| Shares | | Description | | Value |
|
| | | Taiwan (Continued) | | |
| 26,841 | | Yulon Finance Corp. | | $193,633 |
| | | | | 21,068,465 |
| | | Thailand – 4.7% | | |
| 1,285,600 | | AP Thailand PCL | | 363,626 |
| 237,700 | | Bangchak Corp. PCL | | 210,101 |
| 721,500 | | Beyond Securities PCL (b) | | 240,806 |
| 164,400 | | Com7 PCL | | 139,499 |
| 7,944,800 | | IRPC PCL | | 723,582 |
| 858,800 | | Polyplex Thailand PCL | | 548,971 |
| 827,000 | | Precious Shipping PCL | | 430,400 |
| 650,200 | | Regional Container Lines PCL | | 708,039 |
| 1,346,800 | | Sri Trang Agro-Industry PCL | | 807,585 |
| 1,120,100 | | Sri Trang Gloves Thailand PCL | | 516,409 |
| 732,700 | | Star Petroleum Refining PCL | | 250,762 |
| 169,900 | | Thonburi Healthcare Group PCL | | 295,541 |
| | | | | 5,235,321 |
| | | Turkey – 19.4% | | |
| 340,525 | | AG Anadolu Grubu Holding A.S. | | 967,843 |
| 357,707 | | Aksa Akrilik Kimya Sanayii A.S. | | 1,239,772 |
| 520,735 | | Alarko Holding A.S. | | 1,023,297 |
| 257,785 | | Arcelik A.S. | | 1,119,713 |
| 584,997 | | Aygaz A.S. | | 1,305,192 |
| 147,393 | | BIM Birlesik Magazalar A.S. | | 713,950 |
| 133,072 | | Coca-Cola Icecek A.S. | | 1,030,055 |
| 4,711,789 | | Dogan Sirketler Grubu Holding A.S. | | 982,373 |
| 959,755 | | Enerjisa Enerji A.S. (c) (d) | | 782,007 |
| 888,662 | | Haci Omer Sabanci Holding A.S. | | 1,006,791 |
| 527,190 | | Hektas Ticaret TAS (b) | | 934,910 |
| 1,019,348 | | Kardemir Karabuk Demir Celik Sanayi ve Ticaret A.S., Class D | | 688,879 |
| 361,857 | | Koza Anadolu Metal Madencilik Isletmeleri A.S. (b) | | 559,763 |
| 341,419 | | Migros Ticaret A.S. (b) | | 981,839 |
| 144,810 | | Pegasus Hava Tasimaciligi A.S. (b) | | 1,483,562 |
| 1,727,134 | | Petkim Petrokimya Holding A.S. (b) | | 912,653 |
| 306,405 | | TAV Havalimanlari Holding A.S. (b) | | 913,455 |
| 585,766 | | Tekfen Holding A.S. | | 758,737 |
| 483,448 | | Turk Hava Yollari AO (b) | | 1,355,523 |
| 13,416 | | Turk Traktor ve Ziraat Makineleri A.S. | | 175,062 |
| 415,156 | | Turkcell Iletisim Hizmetleri A.S. | | 402,937 |
| 72,743 | | Turkiye Petrol Rafinerileri A.S. (b) | | 1,152,731 |
| 1,025,379 | | Turkiye Sise ve Cam Fabrikalari A.S. | | 1,320,791 |
| | | | | 21,811,835 |
| | | Total Common Stocks | | 109,519,490 |
| | | (Cost $127,480,055) | | |
See Notes to Financial Statements
Page 83
First Trust Emerging Markets Small Cap AlphaDEX® Fund (FEMS)
Portfolio of Investments (Continued)
June 30, 2022 (Unaudited)
| Shares | | Description | | Value |
| REAL ESTATE INVESTMENT TRUSTS (a) – 1.5% |
| | | Mexico – 0.9% | | |
| 408,320 | | Prologis Property Mexico S.A. de C.V. | | $1,071,080 |
| | | South Africa – 0.6% | | |
| 999,182 | | Fortress REIT Ltd., Class A | | 656,550 |
| | | Total Real Estate Investment Trusts | | 1,727,630 |
| | | (Cost $2,024,697) | | |
| MONEY MARKET FUNDS – 1.1% |
| 1,265,250 | | Goldman Sachs Financial Square Treasury Obligations Fund - Institutional Class - 1.39% (j) (k) | | 1,265,250 |
| | | (Cost $1,265,250) | | |
Principal
Value | | Description | | Value |
| REPURCHASE AGREEMENTS – 1.1% |
| $1,189,944 | | BNP Paribas S.A., 1.44% (j), dated 6/30/22, due 7/1/22, with a maturity value of $1,189,992. Collateralized by U.S. Treasury Note, interest rate of 1.25%, due 5/31/28. The value of the collateral including accrued interest is $1,216,243. (k) | | 1,189,944 |
| | | (Cost $1,189,944) | | |
| | | Total Investments – 101.0% | | 113,702,314 |
| | | (Cost $131,959,946) | | |
| | | Net Other Assets and Liabilities – (1.0)% | | (1,127,629) |
| | | Net Assets – 100.0% | | $112,574,685 |
| (a) | Portfolio securities are categorized based upon their country of incorporation, which can be different from the country categorization of the Fund’s underlying index. For a breakdown of the portfolio securities by sector, please see the Fund Performance Overview. |
| (b) | Non-income producing security. |
| (c) | This security may be resold to qualified foreign investors and foreign institutional buyers under Regulation S of the Securities Act of 1933, as amended (the “1933 Act”). |
| (d) | This security is exempt from registration upon resale under Rule 144A of the 1933 Act and may be resold in transactions exempt from registration, normally to qualified institutional buyers. This security is not restricted on the foreign exchange where it trades freely without any additional registration. As such, it does not require the additional disclosure required of restricted securities. |
| (e) | All or a portion of this security is on loan (see Note 2F - Securities Lending in the Notes to Financial Statements). The remaining contractual maturity of all of the securities lending transactions is overnight and continuous. The aggregate value of such securities is $2,645,183 and the total value of the collateral held by the Fund is $2,455,194. |
| (f) | This security is fair valued by the Advisor’s Pricing Committee in accordance with procedures adopted by the Trust’s Board of Trustees, and in accordance with the provisions of the Investment Company Act of 1940, as amended. At June 30, 2022, securities noted as such are valued at $1,879,462 or 1.7% of net assets. |
| (g) | Pursuant to procedures adopted by the Trust’s Board of Trustees, this security has been determined to be illiquid by First Trust Advisors L.P., the Fund’s advisor. |
| (h) | This security’s value was determined using significant unobservable inputs (see Note 2A – Portfolio Valuation in the Notes to Financial Statements). |
| (i) | Non-income producing security that makes payment-in-kind (“PIK”) distributions. There were no in-kind distributions received for the six months ended June 30, 2022. |
| (j) | Rate shown reflects yield as of June 30, 2022. |
| (k) | This security serves as collateral for securities on loan. |
Page 84
See Notes to Financial Statements
First Trust Emerging Markets Small Cap AlphaDEX® Fund (FEMS)
Portfolio of Investments (Continued)
June 30, 2022 (Unaudited)
Offsetting Assets and Liabilities
Offsetting assets and liabilities requires entities to disclose both gross and net information about instruments and transactions eligible for offset, and to disclose instruments and transactions subject to master netting or similar agreements (see Note 2E – Offsetting on the Statements of Assets and Liabilities in the Notes to Financial Statements).
The Fund’s loaned securities were all subject to an enforceable Securities Lending Agency Agreement. Securities lent in accordance with the Securities Lending Agency Agreement on a gross basis were as follows:
| Security Lending Agency Agreement | |
| Total gross amount presented on the Statements of Assets and Liabilities (1) | $2,645,183 |
| Non-cash Collateral (2) | (2,455,194) |
| Net Amount | $189,989 |
| (1) | The amount presented on the Statements of Assets and Liabilities, which is included in “Investments, at value,” is not offset and is shown on a gross basis. |
| (2) | The collateral requirements are determined at the beginning of each business day based on the market value of the loaned securities from the end of the prior day. On June 30, 2022, the last business day of the period, there was sufficient collateral based on the end of day market value from the prior business day; however, market movement from June 29 to June 30 reduced the collateral value below the value of the related securities loaned. See Note 2F – Securities Lending in the Notes to Financial Statements. |
The Fund’s investments in repurchase agreements were all subject to an enforceable Master Repurchase Agreement. Repurchase Agreements on a gross basis were as follows:
| Repurchase Agreements | |
| Total gross amount presented on the Statements of Assets and Liabilities (3) | $1,189,944 |
| Non-cash Collateral (4) | (1,189,944) |
| Net Amount | $— |
| (3) | The amount is included in “Investments, at value” on the Statements of Assets and Liabilities. |
| (4) | At June 30, 2022, the value of the collateral received from each seller exceeded the value of the repurchase agreements. |
Currency Exposure
Diversification | % of Total
Investments |
| Hong Kong Dollar | 22.1% |
| New Taiwan Dollar | 19.3 |
| Turkish Lira | 19.2 |
| Brazilian Real | 9.3 |
| Indonesian Rupiah | 5.7 |
| Thai Baht | 4.6 |
| United States Dollar | 3.9 |
| Mexican Peso | 3.3 |
| Malaysian Ringgit | 3.2 |
| South African Rand | 2.6 |
| Philippine Peso | 1.9 |
| Indian Rupee | 1.8 |
| Chilean Peso | 1.6 |
| Polish Zloty | 1.1 |
| Egyptian Pound | 0.4 |
| Russian Ruble | 0.0* |
| Total | 100.0% |
| * | Amount is less than 0.1%. |
Valuation Inputs
A summary of the inputs used to value the Fund’s investments as of June 30, 2022 is as follows (see Note 2A - Portfolio Valuation in the Notes to Financial Statements):
| | Total
Value at
6/30/2022 | Level 1
Quoted
Prices | Level 2
Significant
Observable
Inputs | Level 3
Significant
Unobservable
Inputs |
| Common Stocks: | | | | |
| Cayman Islands | $ 14,722,570 | $ 12,893,528 | $ 1,829,042 | $ —** |
| Russia | 50,420 | — | — | 50,420 |
| Thailand | 5,235,321 | — | 5,235,321 | — |
| Other Country Categories* | 89,511,179 | 89,511,179 | — | — |
| Real Estate Investment Trusts* | 1,727,630 | 1,727,630 | — | — |
| Money Market Funds | 1,265,250 | 1,265,250 | — | — |
| Repurchase Agreements | 1,189,944 | — | 1,189,944 | — |
| Total Investments | $ 113,702,314 | $ 105,397,587 | $ 8,254,307 | $ 50,420 |
| * | See Portfolio of Investments for country breakout. |
| ** | Investment is valued at $0. |
Level 3 investments are fair valued by the Advisor’s Pricing Committee and are footnoted in the Portfolio of Investments. The Level 3 investments values are based on unobservable and non-quantitative inputs.
See Notes to Financial Statements
Page 85
First Trust Eurozone AlphaDEX® ETF (FEUZ)
Portfolio of Investments
June 30, 2022 (Unaudited)
| Shares | | Description | | Value |
| COMMON STOCKS (a) – 96.3% |
| | | Austria – 3.5% | | |
| 5,221 | | OMV AG | | $244,897 |
| 17,494 | | Raiffeisen Bank International AG | | 189,561 |
| 1,779 | | Verbund AG | | 174,033 |
| 10,481 | | voestalpine AG | | 222,747 |
| | | | | 831,238 |
| | | Belgium – 5.5% | | |
| 1,004 | | Ackermans & van Haaren N.V. | | 149,930 |
| 1,236 | | Ageas S.A./N.V. | | 54,375 |
| 1,044 | | Anheuser-Busch InBev S.A./N.V. | | 56,191 |
| 740 | | D’ieteren Group | | 108,258 |
| 1,639 | | Elia Group S.A./N.V. | | 232,218 |
| 3,021 | | Etablissements Franz Colruyt N.V. | | 82,154 |
| 10,084 | | Proximus S.A.D.P. | | 148,632 |
| 858 | | Sofina S.A. | | 175,333 |
| 1,899 | | Solvay S.A. | | 153,871 |
| 1,567 | | UCB S.A. | | 132,422 |
| | | | | 1,293,384 |
| | | Finland – 3.5% | | |
| 13,002 | | Kojamo Oyj | | 224,275 |
| 1,376 | | Orion Oyj, Class B | | 61,428 |
| 4,001 | | Sampo Oyj, Class A | | 174,087 |
| 12,717 | | Stora Enso Oyj, Class R | | 199,435 |
| 5,729 | | UPM-Kymmene Oyj | | 174,168 |
| | | | | 833,393 |
| | | France – 23.1% | | |
| 416 | | Aeroports de Paris (b) | | 52,684 |
| 784 | | Air Liquide S.A. | | 105,262 |
| 2,604 | | Arkema S.A. | | 231,735 |
| 8,528 | | AXA S.A. | | 193,574 |
| 1,091 | | BNP Paribas S.A. | | 51,866 |
| 47,654 | | Bollore SE | | 220,730 |
| 5,372 | | Bouygues S.A. | | 165,285 |
| 839 | | Capgemini SE | | 143,710 |
| 11,532 | | Carrefour S.A. (c) | | 204,055 |
| 2,087 | | Cie de Saint-Gobain | | 89,550 |
| 1,843 | | Cie Generale des Etablissements Michelin SCA | | 50,167 |
| 10,405 | | Credit Agricole S.A. | | 95,202 |
| 1,822 | | Eiffage S.A. | | 163,976 |
| 14,238 | | Engie S.A. | | 163,621 |
| 1,893 | | Eramet S.A. | | 196,691 |
| 341 | | EssilorLuxottica S.A. | | 51,065 |
| 3,771 | | Eurazeo SE | | 233,553 |
| 1,116 | | Gaztransport Et Technigaz S.A. | | 139,757 |
| 2,000 | | Ipsen S.A. | | 188,736 |
| 87 | | LVMH Moet Hennessy Louis Vuitton SE | | 53,035 |
| 2,664 | | Nexans S.A. | | 206,449 |
| 10,582 | | Orange S.A. | | 124,423 |
| 284 | | Pernod Ricard S.A. | | 52,172 |
| 303 | | Remy Cointreau S.A. | | 52,932 |
| Shares | | Description | | Value |
|
| | | France (Continued) | | |
| 9,489 | | Renault S.A. (b) | | $236,568 |
| 14,575 | | Rexel S.A. | | 224,144 |
| 5,821 | | SCOR SE | | 125,052 |
| 9,262 | | Societe Generale S.A. | | 202,761 |
| 1,988 | | Thales S.A. | | 243,853 |
| 6,152 | | TotalEnergies SE | | 324,735 |
| 10,141 | | Valeo | | 195,807 |
| 3,894 | | Veolia Environnement S.A. | | 95,040 |
| 1,218 | | Vinci S.A. | | 108,443 |
| 23,918 | | Vivendi SE | | 243,029 |
| 3,058 | | Wendel SE | | 255,569 |
| | | | | 5,485,231 |
| | | Germany – 27.0% | | |
| 523 | | Allianz SE | | 99,816 |
| 2,611 | | Aurubis AG | | 177,196 |
| 4,377 | | BASF SE | | 190,470 |
| 3,648 | | Bayer AG | | 216,836 |
| 3,603 | | Bayerische Motoren Werke AG | | 277,368 |
| 32,705 | | Commerzbank AG (b) | | 229,151 |
| 3,464 | | Continental AG | | 241,402 |
| 6,178 | | Covestro AG (d) (e) | | 213,520 |
| 913 | | CTS Eventim AG & Co., KGaA (b) | | 47,839 |
| 6,734 | | Daimler Truck Holding AG (b) | | 175,787 |
| 9,841 | | Deutsche Bank AG | | 85,783 |
| 1,042 | | Deutsche Boerse AG | | 174,277 |
| 7,697 | | Deutsche Lufthansa AG (b) | | 44,880 |
| 2,601 | | Deutsche Post AG | | 97,417 |
| 3,345 | | Deutsche Telekom AG | | 66,413 |
| 10,745 | | E.ON SE | | 90,172 |
| 2,249 | | Evonik Industries AG | | 47,985 |
| 5,096 | | Fresenius SE & Co., KGaA | | 154,336 |
| 1,728 | | FUCHS PETROLUB SE (Preference Shares) | | 48,169 |
| 370 | | Hannover Rueck SE | | 53,702 |
| 5,482 | | HeidelbergCement AG | | 263,344 |
| 1,945 | | Hella GmbH & Co., KGaA | | 131,162 |
| 4,304 | | HUGO BOSS AG | | 227,143 |
| 10,316 | | K+S AG | | 250,699 |
| 1,888 | | KION Group AG | | 78,330 |
| 2,743 | | LEG Immobilien SE | | 227,433 |
| 4,438 | | Mercedes-Benz Group AG | | 256,817 |
| 3,222 | | Porsche Automobil Holding SE (Preference Shares) | | 213,124 |
| 1,179 | | Rheinmetall AG | | 272,188 |
| 7,164 | | RWE AG | | 263,364 |
| 40,311 | | Schaeffler AG (Preference Shares) | | 228,117 |
| 4,246 | | Talanx AG | | 161,609 |
| 45,878 | | Telefonica Deutschland Holding AG | | 131,733 |
| 21,811 | | thyssenkrupp AG (b) | | 123,656 |
| 3,633 | | United Internet AG | | 103,670 |
Page 86
See Notes to Financial Statements
First Trust Eurozone AlphaDEX® ETF (FEUZ)
Portfolio of Investments (Continued)
June 30, 2022 (Unaudited)
| Shares | | Description | | Value |
| COMMON STOCKS (a) (Continued) |
| | | Germany (Continued) | | |
| 4,040 | | VERBIO Vereinigte BioEnergie AG | | $203,218 |
| 1,443 | | Volkswagen AG (Preference Shares) | | 192,684 |
| 4,016 | | Vonovia SE | | 123,732 |
| 1,464 | | Wacker Chemie AG | | 211,106 |
| | | | | 6,395,648 |
| | | Greece – 1.4% | | |
| 159,916 | | Eurobank Ergasias Services and Holdings S.A. (b) | | 141,307 |
| 3,453 | | Hellenic Telecommunications Organization S.A. | | 59,960 |
| 8,581 | | OPAP S.A. | | 122,747 |
| | | | | 324,014 |
| | | Ireland – 2.5% | | |
| 56,552 | | AIB Group PLC | | 128,839 |
| 48,758 | | Bank of Ireland Group PLC | | 308,211 |
| 3,116 | | CRH PLC | | 107,758 |
| 636 | | Kingspan Group PLC | | 38,257 |
| | | | | 583,065 |
| | | Italy – 6.7% | | |
| 109,303 | | A2A S.p.A. | | 138,827 |
| 13,634 | | Assicurazioni Generali S.p.A. | | 217,531 |
| 21,055 | | Banco BPM S.p.A. | | 59,927 |
| 2,133 | | Brunello Cucinelli S.p.A. | | 96,072 |
| 2,289 | | De’ Longhi S.p.A. | | 42,554 |
| 21,302 | | Eni S.p.A. | | 252,880 |
| 1,878 | | ERG S.p.A. | | 58,333 |
| 33,854 | | Hera S.p.A. | | 97,917 |
| 31,395 | | Leonardo S.p.A. | | 318,410 |
| 11,486 | | Pirelli & C S.p.A. (d) (e) | | 46,655 |
| 5,488 | | Prysmian S.p.A. | | 150,738 |
| 14,548 | | Terna-Rete Elettrica Nazionale S.p.A. | | 114,159 |
| | | | | 1,594,003 |
| | | Luxembourg – 2.0% | | |
| 9,665 | | ArcelorMittal S.A. | | 217,863 |
| 20,588 | | Tenaris S.A. | | 264,727 |
| | | | | 482,590 |
| | | Netherlands – 8.8% | | |
| 1,218 | | Aalberts N.V. | | 47,469 |
| 35,383 | | Aegon N.V. | | 153,065 |
| 200 | | Argenx SE (b) | | 74,928 |
| 5,365 | | ASR Nederland N.V. | | 216,850 |
| 2,182 | | BE Semiconductor Industries N.V. | | 104,888 |
| 5,836 | | Koninklijke Ahold Delhaize N.V. | | 152,040 |
| 36,040 | | Koninklijke KPN N.V. | | 128,449 |
| 8,170 | | Koninklijke Philips N.V. | | 175,987 |
| 1,928 | | Koninklijke Vopak N.V. | | 48,652 |
| Shares | | Description | | Value |
|
| | | Netherlands (Continued) | | |
| 4,940 | | NN Group N.V. | | $224,366 |
| 8,827 | | OCI N.V. | | 291,198 |
| 5,830 | | Prosus N.V. | | 381,725 |
| 1,037 | | Randstad N.V. | | 50,207 |
| 1,431 | | STMicroelectronics N.V. | | 44,988 |
| | | | | 2,094,812 |
| | | Portugal – 2.2% | | |
| 19,674 | | Galp Energia SGPS S.A. | | 230,605 |
| 13,032 | | Jeronimo Martins SGPS S.A. | | 283,244 |
| | | | | 513,849 |
| | | Spain – 10.1% | | |
| 1,306 | | Acciona S.A. | | 240,193 |
| 2,312 | | ACS Actividades de Construccion y Servicios S.A. | | 56,041 |
| 21,742 | | Banco Bilbao Vizcaya Argentaria S.A. | | 98,668 |
| 303,846 | | Banco de Sabadell S.A. | | 242,187 |
| 36,540 | | Banco Santander S.A. | | 102,929 |
| 31,914 | | Bankinter S.A. | | 199,060 |
| 55,220 | | CaixaBank S.A. | | 191,948 |
| 5,728 | | Endesa S.A. | | 108,048 |
| 2,528 | | Laboratorios Farmeceuticos Rovi S.A. | | 154,714 |
| 89,427 | | Mapfre S.A. | | 157,629 |
| 8,341 | | Naturgy Energy Group S.A. | | 240,114 |
| 23,749 | | Repsol S.A. | | 349,673 |
| 51,672 | | Telefonica S.A. | | 263,276 |
| | | | | 2,404,480 |
| | | Total Common Stocks | | 22,835,707 |
| | | (Cost $28,666,122) | | |
| REAL ESTATE INVESTMENT TRUSTS (a) – 2.9% |
| | | Belgium – 0.8% | | |
| 5,794 | | Warehouses De Pauw CVA | | 182,155 |
| | | France – 1.5% | | |
| 2,355 | | Covivio | | 130,676 |
| 991 | | Gecina S.A. | | 92,428 |
| 1,941 | | ICADE | | 94,666 |
| 2,342 | | Klepierre S.A. | | 45,061 |
| | | | | 362,831 |
| | | Spain – 0.6% | | |
| 13,747 | | Inmobiliaria Colonial Socimi S.A. | | 87,949 |
| 5,351 | | Merlin Properties Socimi S.A. | | 51,618 |
| | | | | 139,567 |
| | | Total Real Estate Investment Trusts | | 684,553 |
| | | (Cost $939,362) | | |
See Notes to Financial Statements
Page 87
First Trust Eurozone AlphaDEX® ETF (FEUZ)
Portfolio of Investments (Continued)
June 30, 2022 (Unaudited)
| Shares | | Description | | Value |
| MONEY MARKET FUNDS – 0.4% |
| 95,248 | | Goldman Sachs Financial Square Treasury Obligations Fund - Institutional Class - 1.39% (f) (g) | | $95,248 |
| | | (Cost $95,248) | | |
Principal
Value | | Description | | Value |
| REPURCHASE AGREEMENTS – 0.4% |
| $89,579 | | BNP Paribas S.A., 1.44% (f), dated 6/30/22, due 7/01/22, with a maturity value of $89,583. Collateralized by U.S. Treasury Note, interest rate of 1.25%, due 5/31/28. The value of the collateral including accrued interest is $91,559. (g) | | 89,579 |
| | | (Cost $89,579) | | |
| | | Total Investments – 100.0% | | 23,705,087 |
| | | (Cost $29,790,311) | | |
| | | Net Other Assets and Liabilities – (0.0)% | | (8,346) |
| | | Net Assets – 100.0% | | $23,696,741 |
| (a) | Portfolio securities are categorized based upon their country of incorporation, which can be different from the country categorization of the Fund’s underlying index. For a breakdown of the portfolio securities by sector, please see the Fund Performance Overview. |
| (b) | Non-income producing security. |
| (c) | All or a portion of this security is on loan (see Note 2F - Securities Lending in the Notes to Financial Statements). The remaining contractual maturity of all of the securities lending transactions is overnight and continuous. The aggregate value of such securities is $173,867 and the total value of the collateral held by the Fund is $184,827. |
| (d) | This security may be resold to qualified foreign investors and foreign institutional buyers under Regulation S of the Securities Act of 1933, as amended (the “1933 Act”). |
| (e) | This security is exempt from registration upon resale under Rule 144A of the 1933 Act and may be resold in transactions exempt from registration, normally to qualified institutional buyers. This security is not restricted on the foreign exchange where it trades freely without any additional registration. As such, it does not require the additional disclosure required of restricted securities. |
| (f) | Rate shown reflects yield as of June 30, 2022. |
| (g) | This security serves as collateral for securities on loan. |
Page 88
See Notes to Financial Statements
First Trust Eurozone AlphaDEX® ETF (FEUZ)
Portfolio of Investments (Continued)
June 30, 2022 (Unaudited)
Offsetting Assets and Liabilities
Offsetting assets and liabilities requires entities to disclose both gross and net information about instruments and transactions eligible for offset, and to disclose instruments and transactions subject to master netting or similar agreements (see Note 2E – Offsetting on the Statements of Assets and Liabilities in the Notes to Financial Statements).
The Fund’s loaned securities were all subject to an enforceable Securities Lending Agency Agreement. Securities lent in accordance with the Securities Lending Agency Agreement on a gross basis were as follows:
| Security Lending Agency Agreement | |
| Total gross amount presented on the Statements of Assets and Liabilities (1) | $173,867 |
| Non-cash Collateral (2) | (173,867) |
| Net Amount | $— |
| (1) | The amount presented on the Statements of Assets and Liabilities, which is included in “Investments, at value,” is not offset and is shown on a gross basis. |
| (2) | At June 30, 2022, the value of the collateral received from each borrower exceeded the value of the related securities loaned. This amount is disclosed on the Portfolio of Investments. |
The Fund’s investments in repurchase agreements were all subject to an enforceable Master Repurchase Agreement. Repurchase Agreements on a gross basis were as follows:
| Repurchase Agreements | |
| Total gross amount presented on the Statements of Assets and Liabilities (3) | $89,579 |
| Non-cash Collateral (4) | (89,579) |
| Net Amount | $— |
| (3) | The amount is included in “Investments, at value” on the Statements of Assets and Liabilities. |
| (4) | At June 30, 2022, the value of the collateral received from each seller exceeded the value of the repurchase agreements. |
Valuation Inputs
A summary of the inputs used to value the Fund’s investments as of June 30, 2022 is as follows (see Note 2A - Portfolio Valuation in the Notes to Financial Statements):
| | Total
Value at
6/30/2022 | Level 1
Quoted
Prices | Level 2
Significant
Observable
Inputs | Level 3
Significant
Unobservable
Inputs |
| Common Stocks* | $ 22,835,707 | $ 22,835,707 | $ — | $ — |
| Real Estate Investment Trusts* | 684,553 | 684,553 | — | — |
| Money Market Funds | 95,248 | 95,248 | — | — |
| Repurchase Agreements | 89,579 | — | 89,579 | — |
| Total Investments | $ 23,705,087 | $ 23,615,508 | $ 89,579 | $— |
| * | See Portfolio of Investments for country breakout. |
See Notes to Financial Statements
Page 89
First Trust Exchange-Traded AlphaDEX® Fund II
Statements of Assets and Liabilities
June 30, 2022 (Unaudited)
| | First Trust
Asia Pacific
ex-Japan
AlphaDEX®
Fund
(FPA) | | First Trust
Europe
AlphaDEX®
Fund
(FEP) | | First Trust
Latin
America
AlphaDEX®
Fund
(FLN) | | First Trust
Brazil
AlphaDEX®
Fund
(FBZ) |
| ASSETS: | | | | | | | |
Investments, at value
| $ 13,312,539 | | $ 312,536,512 | | $ 41,167,838 | | $ 5,354,167 |
Cash
| — | | — | | 17,527 | | — |
Foreign currency
| 2 | | — | | 157,784 | | 48,424 |
| Receivables: | | | | | | | |
Fund shares sold
| — | | — | | — | | — |
Dividends
| 53,230 | | 559,103 | | 303,419 | | 65,299 |
Dividend reclaims
| — | | 2,581,311 | | — | | — |
Securities lending income
| 81 | | 16,685 | | — | | — |
Investment securities sold
| — | | 585,555 | | 671 | | — |
Miscellaneous
| — | | — | | — | | — |
Total Assets
| 13,365,852 | | 316,279,166 | | 41,647,239 | | 5,467,890 |
| LIABILITIES: | | | | | | | |
Due to custodian
| 22,991 | | 272,400 | | — | | 4,166 |
Due to custodian foreign currency
| — | | 8,045 | | — | | — |
Due to authorized participant
| — | | — | | 5,034 | | — |
Due to securities lending agent
| — | | — | | — | | — |
| Payables: | | | | | | | |
Investment securities purchased
| — | | — | | — | | — |
Investment advisory fees
| 9,196 | | 233,573 | | 32,250 | | 4,747 |
Collateral for securities on loan
| 251,119 | | 8,364,235 | | — | | — |
Deferred foreign capital gains tax
| — | | — | | — | | — |
Total Liabilities
| 283,306 | | 8,878,253 | | 37,284 | | 8,913 |
NET ASSETS
| $13,082,546 | | $307,400,913 | | $41,609,955 | | $5,458,977 |
| NET ASSETS consist of: | | | | | | | |
Paid-in capital
| $ 28,132,926 | | $ 575,623,353 | | $ 90,568,950 | | $ 32,800,250 |
Par value
| 5,000 | | 98,500 | | 25,500 | | 5,500 |
Accumulated distributable earnings (loss)
| (15,055,380) | | (268,320,940) | | (48,984,495) | | (27,346,773) |
NET ASSETS
| $13,082,546 | | $307,400,913 | | $41,609,955 | | $5,458,977 |
NET ASSET VALUE, per share
| $26.16 | | $31.21 | | $16.32 | | $9.93 |
Number of shares outstanding (unlimited number of shares authorized, par value $0.01 per share)
| 500,002 | | 9,850,002 | | 2,550,002 | | 550,002 |
Investments, at cost
| $15,139,752 | | $376,715,486 | | $48,463,853 | | $5,172,124 |
Foreign currency, at cost (proceeds)
| $2 | | $(8,018) | | $157,926 | | $48,461 |
Securities on loan, at value
| $239,256 | | $2,034,499 | | $— | | $— |
Page 90
See Notes to Financial Statements
First Trust
China
AlphaDEX®
Fund
(FCA) | | First Trust
Japan
AlphaDEX®
Fund
(FJP) | | First Trust
Developed
Markets
ex-US
AlphaDEX®
Fund
(FDT) | | First Trust
Emerging
Markets
AlphaDEX®
Fund
(FEM) | | First Trust
Germany
AlphaDEX®
Fund
(FGM) |
| | | | | | | | | |
| $ 8,772,937 | | $ 31,806,388 | | $ 412,161,893 | | $ 325,331,352 | | $ 18,586,073 |
| — | | — | | — | | — | | 28,550 |
| 35,534 | | 75,360 | | 263,658 | | 932,622 | | 145 |
| | | | | | | | | |
| — | | — | | 4,824,996 | | — | | — |
| 221,807 | | 178,176 | | 1,139,155 | | 5,546,329 | | — |
| — | | 1,610 | | 893,369 | | 186,577 | | 55,798 |
| — | | — | | 5,645 | | 305 | | — |
| — | | — | | 277,082 | | — | | — |
| — | | — | | — | | 370,740 | | — |
| 9,030,278 | | 32,061,534 | | 419,565,798 | | 332,367,925 | | 18,670,566 |
| | | | | | | | | |
| 37,850 | | 152,579 | | 625,588 | | 385,780 | | — |
| — | | — | | — | | — | | — |
| — | | — | | — | | — | | — |
| — | | 40 | | — | | — | | — |
| | | | | | | | | |
| — | | — | | 4,807,252 | | — | | — |
| 5,953 | | 21,630 | | 275,410 | | 235,107 | | 14,048 |
| — | | 1,115,932 | | 16,789,133 | | 920,407 | | — |
| — | | — | | — | | — | | — |
| 43,803 | | 1,290,181 | | 22,497,383 | | 1,541,294 | | 14,048 |
| $ 8,986,475 | | $ 30,771,353 | | $ 397,068,415 | | $ 330,826,631 | | $ 18,656,518 |
| | | | | | | | | |
| $ 16,561,012 | | $ 88,399,981 | | $ 739,187,450 | | $ 554,084,881 | | $ 60,977,894 |
| 3,500 | | 7,500 | | 83,364 | | 156,000 | | 5,500 |
| (7,578,037) | | (57,636,128) | | (342,202,399) | | (223,414,250) | | (42,326,876) |
| $ 8,986,475 | | $ 30,771,353 | | $ 397,068,415 | | $ 330,826,631 | | $ 18,656,518 |
| $25.68 | | $41.03 | | $47.63 | | $21.21 | | $33.92 |
| 350,002 | | 750,002 | | 8,336,412 | | 15,600,002 | | 550,002 |
| $9,576,333 | | $38,057,009 | | $459,859,015 | | $384,492,325 | | $28,841,075 |
| $35,533 | | $74,929 | | $261,914 | | $933,520 | | $145 |
| $— | | $1,071,356 | | $14,628,668 | | $873,531 | | $— |
See Notes to Financial Statements
Page 91
First Trust Exchange-Traded AlphaDEX® Fund II
Statements of Assets and Liabilities (Continued)
June 30, 2022 (Unaudited)
| | First Trust
United
Kingdom
AlphaDEX®
Fund
(FKU) | | First Trust
India
NIFTY 50
Equal Weight
ETF
(NFTY) | | First Trust
Switzerland
AlphaDEX®
Fund
(FSZ) | | First Trust
Developed
Markets
ex-US
Small Cap
AlphaDEX®
Fund
(FDTS) |
| ASSETS: | | | | | | | |
Investments, at value
| $ 67,675,989 | | $ 47,155,901 | | $ 38,485,113 | | $ 9,256,196 |
Cash
| — | | — | | 4,371 | | — |
Foreign currency
| — | | 2,951,047 | | — | | 15,520 |
| Receivables: | | | | | | | |
Fund shares sold
| — | | 23,239 | | — | | — |
Dividends
| 355,592 | | 247,469 | | — | | 33,838 |
Dividend reclaims
| 8,964 | | — | | 1,128,763 | | 12,777 |
Securities lending income
| — | | — | | — | | 54 |
Investment securities sold
| — | | 2,942,983 | | — | | 12,512 |
Miscellaneous
| — | | — | | — | | — |
Total Assets
| 68,040,545 | | 53,320,639 | | 39,618,247 | | 9,330,897 |
| LIABILITIES: | | | | | | | |
Due to custodian
| 58,499 | | 2,940,944 | | — | | 5,000 |
Due to custodian foreign currency
| 8 | | — | | — | | — |
Due to authorized participant
| — | | — | | — | | — |
Due to securities lending agent
| — | | — | | — | | — |
| Payables: | | | | | | | |
Investment securities purchased
| — | | 2,954,788 | | — | | 13,064 |
Investment advisory fees
| 47,856 | | 31,768 | | 44,336 | | 6,529 |
Collateral for securities on loan
| — | | — | | — | | 212,993 |
Deferred foreign capital gains tax
| — | | 311,307 | | — | | — |
Total Liabilities
| 106,363 | | 6,238,807 | | 44,336 | | 237,586 |
NET ASSETS
| $67,934,182 | | $47,081,832 | | $39,573,911 | | $9,093,311 |
| NET ASSETS consist of: | | | | | | | |
Paid-in capital
| $ 129,011,961 | | $ 46,031,841 | | $ 76,182,880 | | $ 14,821,680 |
Par value
| 21,500 | | 11,500 | | 7,500 | | 2,500 |
Accumulated distributable earnings (loss)
| (61,099,279) | | 1,038,491 | | (36,616,469) | | (5,730,869) |
NET ASSETS
| $67,934,182 | | $47,081,832 | | $39,573,911 | | $9,093,311 |
NET ASSET VALUE, per share
| $31.60 | | $40.94 | | $52.77 | | $36.37 |
Number of shares outstanding (unlimited number of shares authorized, par value $0.01 per share)
| 2,150,002 | | 1,150,002 | | 750,002 | | 250,002 |
Investments, at cost
| $88,264,146 | | $46,854,745 | | $46,544,300 | | $10,961,356 |
Foreign currency, at cost (proceeds)
| $(8) | | $2,951,047 | | $— | | $15,459 |
Securities on loan, at value
| $— | | $— | | $— | | $200,665 |
Page 92
See Notes to Financial Statements
First Trust
Emerging
Markets
Small Cap
AlphaDEX®
Fund
(FEMS) | | First Trust
Eurozone
AlphaDEX®
ETF
(FEUZ) |
| | | |
| $ 113,702,314 | | $ 23,705,087 |
| 70,787 | | 3,195 |
| 204,697 | | 2,475 |
| | | |
| — | | — |
| 1,121,267 | | 13,280 |
| 3,297 | | 174,603 |
| 10,815 | | 464 |
| — | | — |
| — | | — |
| 115,113,177 | | 23,899,104 |
| | | |
| — | | — |
| — | | — |
| — | | — |
| — | | — |
| | | |
| — | | — |
| 83,298 | | 17,536 |
| 2,455,194 | | 184,827 |
| — | | — |
| 2,538,492 | | 202,363 |
| $ 112,574,685 | | $ 23,696,741 |
| | | |
| $ 164,824,447 | | $ 53,409,615 |
| 32,500 | | 7,000 |
| (52,282,262) | | (29,719,874) |
| $ 112,574,685 | | $ 23,696,741 |
| $34.64 | | $33.85 |
| 3,250,002 | | 700,002 |
| $131,959,946 | | $29,790,311 |
| $204,741 | | $2,475 |
| $2,645,183 | | $173,867 |
See Notes to Financial Statements
Page 93
First Trust Exchange-Traded AlphaDEX® Fund II
Statements of Operations
For the Six Months Ended June 30, 2022 (Unaudited)
| | First Trust
Asia Pacific
ex-Japan
AlphaDEX®
Fund
(FPA) | | First Trust
Europe
AlphaDEX®
Fund
(FEP) | | First Trust
Latin
America
AlphaDEX®
Fund
(FLN) | | First Trust
Brazil
AlphaDEX®
Fund
(FBZ) |
| INVESTMENT INCOME: | | | | | | | |
Dividends
| $ 378,840 | | $ 12,630,684 | | $ 1,841,148 | | $ 392,890 |
Securities lending income (net of fees)
| 3,004 | | 85,669 | | — | | — |
Foreign withholding tax
| (43,291) | | (1,236,344) | | (247,744) | | (11,259) |
Other
| 27 | | 2,934 | | 1 | | 3 |
Total investment income
| 338,580 | | 11,482,943 | | 1,593,405 | | 381,634 |
| EXPENSES: | | | | | | | |
Investment advisory fees
| 60,002 | | 1,858,574 | | 125,214 | | 44,845 |
Total expenses
| 60,002 | | 1,858,574 | | 125,214 | | 44,845 |
NET INVESTMENT INCOME (LOSS)
| 278,578 | | 9,624,369 | | 1,468,191 | | 336,789 |
| NET REALIZED AND UNREALIZED GAIN (LOSS): | | | | | | | |
| Net realized gain (loss) on: | | | | | | | |
Investments
| (259,514) | | (33,552,753) | | (341,482) | | (478,059) |
In-kind redemptions
| 673,486 | | 3,356,030 | | 72,191 | | (306) |
Foreign currency transactions
| (32,085) | | (90,970) | | (147,920) | | (14,747) |
Foreign capital gains tax
| — | | — | | — | | — |
Net realized gain (loss)
| 381,887 | | (30,287,693) | | (417,211) | | (493,112) |
| Net change in unrealized appreciation (depreciation) on: | | | | | | | |
Investments
| (3,196,348) | | (115,551,508) | | (8,004,858) | | 632,237 |
Foreign currency translation
| (924) | | (232,425) | | (14,443) | | 1,389 |
Deferred foreign capital gains tax
| — | | — | | — | | — |
Net change in unrealized appreciation (depreciation)
| (3,197,272) | | (115,783,933) | | (8,019,301) | | 633,626 |
NET REALIZED AND UNREALIZED GAIN (LOSS)
| (2,815,385) | | (146,071,626) | | (8,436,512) | | 140,514 |
NET INCREASE (DECREASE) IN NET ASSETS RESULTING FROM OPERATIONS
| $(2,536,807) | | $(136,447,257) | | $(6,968,321) | | $ 477,303 |
Page 94
See Notes to Financial Statements
| | First Trust
China
AlphaDEX®
Fund
(FCA) | | First Trust
Japan
AlphaDEX®
Fund
(FJP) | | First Trust
Developed
Markets
ex-US
AlphaDEX®
Fund
(FDT) | | First Trust
Emerging
Markets
AlphaDEX®
Fund
(FEM) | | First Trust
Germany
AlphaDEX®
Fund
(FGM) |
| | | | | | | | | | |
| | $356,462 | | $789,615 | | $10,340,517 | | $16,097,661 | | $1,063,108 |
| | 336 | | 5,109 | | 84,659 | | 30,396 | | 2,385 |
| | (23,633) | | (78,962) | | (1,057,202) | | (1,866,459) | | (138,271) |
| | — | | — | | 730 | | 1,590 | | 166 |
| | 333,165 | | 715,762 | | 9,368,704 | | 14,263,188 | | 927,388 |
| | | | | | | | | | |
| | 36,688 | | 133,260 | | 1,710,950 | | 1,585,621 | | 205,521 |
| | 36,688 | | 133,260 | | 1,710,950 | | 1,585,621 | | 205,521 |
| | 296,477 | | 582,502 | | 7,657,754 | | 12,677,567 | | 721,867 |
| | | | | | | | | | |
| | | | | | | | | | |
| | (598,935) | | (435,644) | | (25,525,850) | | (1,015,387) | | (326,482) |
| | — | | — | | — | | 874,505 | | (5,945,252) |
| | (28) | | (50,725) | | (278,849) | | (437,570) | | 465 |
| | — | | — | | — | | (720,307) | | — |
| | (598,963) | | (486,369) | | (25,804,699) | | (1,298,759) | | (6,271,269) |
| | | | | | | | | | |
| | (246,615) | | (5,858,113) | | (77,734,995) | | (84,887,091) | | (14,831,097) |
| | 47 | | (13,274) | | (118,580) | | (46,327) | | (4,822) |
| | — | | — | | — | | 1,478,891 | | — |
| | (246,568) | | (5,871,387) | | (77,853,575) | | (83,454,527) | | (14,835,919) |
| | (845,531) | | (6,357,756) | | (103,658,274) | | (84,753,286) | | (21,107,188) |
| | $(549,054) | | $(5,775,254) | | $(96,000,520) | | $(72,075,719) | | $(20,385,321) |
See Notes to Financial Statements
Page 95
First Trust Exchange-Traded AlphaDEX® Fund II
Statements of Operations (Continued)
For the Six Months Ended June 30, 2022 (Unaudited)
| | First Trust
United
Kingdom
AlphaDEX®
Fund
(FKU) | | First Trust
India
NIFTY 50
Equal Weight
ETF
(NFTY) | | First Trust
Switzerland
AlphaDEX®
Fund
(FSZ) | | First Trust
Developed
Markets
ex-US
Small Cap
AlphaDEX®
Fund
(FDTS) |
| INVESTMENT INCOME: | | | | | | | |
Dividends
| $ 2,156,249 | | $ 513,333 | | $ 2,252,674 | | $ 227,288 |
Securities lending income (net of fees)
| — | | — | | — | | 2,917 |
Foreign withholding tax
| (10,053) | | (118,645) | | (275,848) | | (24,127) |
Other
| 3 | | — | | — | | 58 |
Total investment income
| 2,146,199 | | 394,688 | | 1,976,826 | | 206,136 |
| EXPENSES: | | | | | | | |
Investment advisory fees
| 329,774 | | 223,184 | | 339,389 | | 46,437 |
Total expenses
| 329,774 | | 223,184 | | 339,389 | | 46,437 |
NET INVESTMENT INCOME (LOSS)
| 1,816,425 | | 171,504 | | 1,637,437 | | 159,699 |
| NET REALIZED AND UNREALIZED GAIN (LOSS): | | | | | | | |
| Net realized gain (loss) on: | | | | | | | |
Investments
| (3,929,782) | | 1,559,810 | | 2,400,309 | | (597,628) |
In-kind redemptions
| 1,837,712 | | — | | (2,070,563) | | 183,868 |
Foreign currency transactions
| (30,846) | | (35,522) | | (6,903) | | (9,414) |
Foreign capital gains tax
| — | | (462,934) | | — | | — |
Net realized gain (loss)
| (2,122,916) | | 1,061,354 | | 322,843 | | (423,174) |
| Net change in unrealized appreciation (depreciation) on: | | | | | | | |
Investments
| (24,082,857) | | (9,584,258) | | (26,832,538) | | (2,112,781) |
Foreign currency translation
| (13,878) | | 106,183 | | (38,246) | | (1,709) |
Deferred foreign capital gains tax
| — | | 1,196,381 | | — | | — |
Net change in unrealized appreciation (depreciation)
| (24,096,735) | | (8,281,694) | | (26,870,784) | | (2,114,490) |
NET REALIZED AND UNREALIZED GAIN (LOSS)
| (26,219,651) | | (7,220,340) | | (26,547,941) | | (2,537,664) |
NET INCREASE (DECREASE) IN NET ASSETS RESULTING FROM OPERATIONS
| $(24,403,226) | | $(7,048,836) | | $(24,910,504) | | $(2,377,965) |
Page 96
See Notes to Financial Statements
| | First Trust
Emerging
Markets
Small Cap
AlphaDEX®
Fund
(FEMS) | | First Trust
Eurozone
AlphaDEX®
ETF
(FEUZ) |
| | | | |
| | $4,270,879 | | $946,932 |
| | 93,540 | | 3,787 |
| | (478,850) | | (120,401) |
| | — | | 488 |
| | 3,885,569 | | 830,806 |
| | | | |
| | 548,341 | | 197,306 |
| | 548,341 | | 197,306 |
| | 3,337,228 | | 633,500 |
| | | | |
| | | | |
| | (1,329,894) | | (3,936,367) |
| | (103,241) | | (4,089,731) |
| | (195,790) | | (861) |
| | (1,645) | | — |
| | (1,630,570) | | (8,026,959) |
| | | | |
| | (18,190,950) | | (5,817,097) |
| | 370 | | (12,024) |
| | 4,745 | | — |
| | (18,185,835) | | (5,829,121) |
| | (19,816,405) | | (13,856,080) |
| | $(16,479,177) | | $(13,222,580) |
See Notes to Financial Statements
Page 97
First Trust Exchange-Traded AlphaDEX® Fund II
Statements of Changes in Net Assets
| | First Trust Asia Pacific
ex-Japan AlphaDEX® Fund (FPA) | | First Trust Europe
AlphaDEX® Fund (FEP) |
| | Six Months
Ended
6/30/2022
(Unaudited) | | Year
Ended
12/31/2021 | | Six Months
Ended
6/30/2022
(Unaudited) | | Year
Ended
12/31/2021 |
| OPERATIONS: | | | | | | | |
Net investment income (loss)
| $ 278,578 | | $ 925,520 | | $ 9,624,369 | | $ 11,969,339 |
Net realized gain (loss)
| 381,887 | | 1,481,007 | | (30,287,693) | | 75,355,601 |
Net change in unrealized appreciation (depreciation)
| (3,197,272) | | (2,508,413) | | (115,783,933) | | (9,103,026) |
Net increase (decrease) in net assets resulting from operations
| (2,536,807) | | (101,886) | | (136,447,257) | | 78,221,914 |
| DISTRIBUTIONS TO SHAREHOLDERS FROM: | | | | | | | |
Investment operations
| (258,401) | | (1,196,923) | | (7,896,231) | | (18,281,993) |
| SHAREHOLDER TRANSACTIONS: | | | | | | | |
Proceeds from shares sold
| — | | 10,439,636 | | 12,410,288 | | 301,558,631 |
Cost of shares redeemed
| (9,379,791) | | (1,618,879) | | (134,574,588) | | (230,355,044) |
Net increase (decrease) in net assets resulting from shareholder transactions
| (9,379,791) | | 8,820,757 | | (122,164,300) | | 71,203,587 |
Total increase (decrease) in net assets
| (12,174,999) | | 7,521,948 | | (266,507,788) | | 131,143,508 |
| NET ASSETS: | | | | | | | |
Beginning of period
| 25,257,545 | | 17,735,597 | | 573,908,701 | | 442,765,193 |
End of period
| $ 13,082,546 | | $ 25,257,545 | | $ 307,400,913 | | $ 573,908,701 |
| CHANGES IN SHARES OUTSTANDING: | | | | | | | |
Shares outstanding, beginning of period
| 800,002 | | 550,002 | | 13,250,002 | | 11,500,002 |
Shares sold
| — | | 300,000 | | 300,000 | | 7,200,000 |
Shares redeemed
| (300,000) | | (50,000) | | (3,700,000) | | (5,450,000) |
Shares outstanding, end of period
| 500,002 | | 800,002 | | 9,850,002 | | 13,250,002 |
Page 98
See Notes to Financial Statements
First Trust Latin America
AlphaDEX® Fund (FLN) | | First Trust Brazil
AlphaDEX® Fund (FBZ) | | First Trust China
AlphaDEX® Fund (FCA) |
Six Months
Ended
6/30/2022
(Unaudited) | | Year
Ended
12/31/2021 | | Six Months
Ended
6/30/2022
(Unaudited) | | Year
Ended
12/31/2021 | | Six Months
Ended
6/30/2022
(Unaudited) | | Year
Ended
12/31/2021 |
| | | | | | | | | | | |
| $ 1,468,191 | | $ 441,518 | | $ 336,789 | | $ 665,597 | | $ 296,477 | | $ 468,390 |
| (417,211) | | 1,704,097 | | (493,112) | | 360,032 | | (598,963) | | 1,187,903 |
| (8,019,301) | | (2,901,672) | | 633,626 | | (2,116,477) | | (246,568) | | (1,661,645) |
| (6,968,321) | | (756,057) | | 477,303 | | (1,090,848) | | (549,054) | | (5,352) |
| | | | | | | | | | | |
| (1,328,296) | | (400,317) | | (484,792) | | (502,366) | | (113,541) | | (517,232) |
| | | | | | | | | | | |
| 44,622,511 | | 912,884 | | 3,542,642 | | 16,473,683 | | — | | 7,297,067 |
| (2,521,405) | | (5,550,414) | | (10,114,794) | | (12,214,912) | | — | | (10,245,972) |
| 42,101,106 | | (4,637,530) | | (6,572,152) | | 4,258,771 | | — | | (2,948,905) |
| 33,804,489 | | (5,793,904) | | (6,579,641) | | 2,665,557 | | (662,595) | | (3,471,489) |
| | | | | | | | | | | |
| 7,805,466 | | 13,599,370 | | 12,038,618 | | 9,373,061 | | 9,649,070 | | 13,120,559 |
| $41,609,955 | | $ 7,805,466 | | $ 5,458,977 | | $ 12,038,618 | | $ 8,986,475 | | $ 9,649,070 |
| | | | | | | | | | | |
| 450,002 | | 700,002 | | 1,050,002 | | 700,002 | | 350,002 | | 450,002 |
| 2,250,000 | | 50,000 | | 300,000 | | 1,250,000 | | — | | 250,000 |
| (150,000) | | (300,000) | | (800,000) | | (900,000) | | — | | (350,000) |
| 2,550,002 | | 450,002 | | 550,002 | | 1,050,002 | | 350,002 | | 350,002 |
See Notes to Financial Statements
Page 99
First Trust Exchange-Traded AlphaDEX® Fund II
Statements of Changes in Net Assets (Continued)
| | First Trust Japan
AlphaDEX® Fund (FJP) | | First Trust Developed Markets
ex-US AlphaDEX® Fund (FDT) |
| | Six Months
Ended
6/30/2022
(Unaudited) | | Year
Ended
12/31/2021 | | Six Months
Ended
6/30/2022
(Unaudited) | | Year
Ended
12/31/2021 |
| OPERATIONS: | | | | | | | |
Net investment income (loss)
| $ 582,502 | | $ 589,668 | | $ 7,657,754 | | $ 9,579,953 |
Net realized gain (loss)
| (486,369) | | 372,425 | | (25,804,699) | | 49,704,396 |
Net change in unrealized appreciation (depreciation)
| (5,871,387) | | (883,872) | | (77,853,575) | | (21,075,655) |
Net increase (decrease) in net assets resulting from operations
| (5,775,254) | | 78,221 | | (96,000,520) | | 38,208,694 |
| DISTRIBUTIONS TO SHAREHOLDERS FROM: | | | | | | | |
Investment operations
| (581,401) | | (875,402) | | (5,994,504) | | (15,144,146) |
| SHAREHOLDER TRANSACTIONS: | | | | | | | |
Proceeds from shares sold
| 2,226,991 | | — | | 84,484,180 | | 36,993,954 |
Cost of shares redeemed
| — | | (5,437,368) | | — | | (5,897,300) |
Net increase (decrease) in net assets resulting from shareholder transactions
| 2,226,991 | | (5,437,368) | | 84,484,180 | | 31,096,654 |
Total increase (decrease) in net assets
| (4,129,664) | | (6,234,549) | | (17,510,844) | | 54,161,202 |
| NET ASSETS: | | | | | | | |
Beginning of period
| 34,901,017 | | 41,135,566 | | 414,579,259 | | 360,418,057 |
End of period
| $ 30,771,353 | | $ 34,901,017 | | $ 397,068,415 | | $ 414,579,259 |
| CHANGES IN SHARES OUTSTANDING: | | | | | | | |
Shares outstanding, beginning of period
| 700,002 | | 800,002 | | 6,836,412 | | 6,336,412 |
Shares sold
| 50,000 | | — | | 1,500,000 | | 600,000 |
Shares redeemed
| — | | (100,000) | | — | | (100,000) |
Shares outstanding, end of period
| 750,002 | | 700,002 | | 8,336,412 | | 6,836,412 |
Page 100
See Notes to Financial Statements
First Trust Emerging Markets
AlphaDEX® Fund (FEM) | | First Trust Germany
AlphaDEX® Fund (FGM) | | First Trust United Kingdom
AlphaDEX® Fund (FKU) |
Six Months
Ended
6/30/2022
(Unaudited) | | Year
Ended
12/31/2021 | | Six Months
Ended
6/30/2022
(Unaudited) | | Year
Ended
12/31/2021 | | Six Months
Ended
6/30/2022
(Unaudited) | | Year
Ended
12/31/2021 |
| | | | | | | | | | | |
| $ 12,677,567 | | $ 20,291,122 | | $ 721,867 | | $ 1,764,495 | | $ 1,816,425 | | $ 1,655,416 |
| (1,298,759) | | 54,058,582 | | (6,271,269) | | 13,492,527 | | (2,122,916) | | 2,683,372 |
| (83,454,527) | | (39,795,292) | | (14,835,919) | | (9,078,155) | | (24,096,735) | | 149,705 |
| (72,075,719) | | 34,554,412 | | (20,385,321) | | 6,178,867 | | (24,403,226) | | 4,488,493 |
| | | | | | | | | | | |
| (8,651,421) | | (19,810,512) | | (736,093) | | (1,500,281) | | (2,140,837) | | (1,744,928) |
| | | | | | | | | | | |
| 2,614,881 | | 79,485,441 | | 2,232,301 | | 13,472,609 | | 4,147,861 | | 79,396,844 |
| (27,976,044) | | (99,025,014) | | (61,951,568) | | (14,034,516) | | (8,612,418) | | (2,227,657) |
| (25,361,163) | | (19,539,573) | | (59,719,267) | | (561,907) | | (4,464,557) | | 77,169,187 |
| (106,088,303) | | (4,795,673) | | (80,840,681) | | 4,116,679 | | (31,008,620) | | 79,912,752 |
| | | | | | | | | | | |
| 436,914,934 | | 441,710,607 | | 99,497,199 | | 95,380,520 | | 98,942,802 | | 19,030,050 |
| $330,826,631 | | $ 436,914,934 | | $ 18,656,518 | | $ 99,497,199 | | $ 67,934,182 | | $ 98,942,802 |
| | �� | | | | | | | | | |
| 16,650,002 | | 17,450,002 | | 1,850,002 | | 1,850,002 | | 2,250,002 | | 500,002 |
| 100,000 | | 2,950,000 | | 50,000 | | 250,000 | | 100,000 | | 1,800,000 |
| (1,150,000) | | (3,750,000) | | (1,350,000) | | (250,000) | | (200,000) | | (50,000) |
| 15,600,002 | | 16,650,002 | | 550,002 | | 1,850,002 | | 2,150,002 | | 2,250,002 |
See Notes to Financial Statements
Page 101
First Trust Exchange-Traded AlphaDEX® Fund II
Statements of Changes in Net Assets (Continued)
| | First Trust India
NIFTY 50 Equal Weight ETF (NFTY) | | First Trust Switzerland
AlphaDEX® Fund (FSZ) |
| | Six Months
Ended
6/30/2022
(Unaudited) | | Year
Ended
12/31/2021 | | Six Months
Ended
6/30/2022
(Unaudited) | | Year
Ended
12/31/2021 |
| OPERATIONS: | | | | | | | |
Net investment income (loss)
| $ 171,504 | | $ 517,271 | | $ 1,637,437 | | $ 1,340,611 |
Net realized gain (loss)
| 1,061,354 | | 4,125,186 | | 322,843 | | 11,727,434 |
Net change in unrealized appreciation (depreciation)
| (8,281,694) | | 7,778,700 | | (26,870,784) | | 5,471,228 |
Net increase (decrease) in net assets resulting from operations
| (7,048,836) | | 12,421,157 | | (24,910,504) | | 18,539,273 |
| DISTRIBUTIONS TO SHAREHOLDERS FROM: | | | | | | | |
Investment operations
| (1,619,253) | | (824,801) | | (990,303) | | (1,875,162) |
| SHAREHOLDER TRANSACTIONS: | | | | | | | |
Proceeds from shares sold
| — | | 66,917,813 | | — | | 6,345,850 |
Cost of shares redeemed
| (6,953,409) | | (19,693,610) | | (34,468,108) | | (20,420,756) |
Net increase (decrease) in net assets resulting from shareholder transactions
| (6,953,409) | | 47,224,203 | | (34,468,108) | | (14,074,906) |
Total increase (decrease) in net assets
| (15,621,498) | | 58,820,559 | | (60,368,915) | | 2,589,205 |
| NET ASSETS: | | | | | | | |
Beginning of period
| 62,703,330 | | 3,882,771 | | 99,942,826 | | 97,353,621 |
End of period
| $ 47,081,832 | | $ 62,703,330 | | $ 39,573,911 | | $ 99,942,826 |
| CHANGES IN SHARES OUTSTANDING: | | | | | | | |
Shares outstanding, beginning of period
| 1,300,002 | | 100,002 | | 1,400,002 | | 1,600,002 |
Shares sold
| — | | 1,600,000 | | — | | 100,000 |
Shares redeemed
| (150,000) | | (400,000) | | (650,000) | | (300,000) |
Shares outstanding, end of period
| 1,150,002 | | 1,300,002 | | 750,002 | | 1,400,002 |
Page 102
See Notes to Financial Statements
First Trust Developed Markets ex-US
Small Cap AlphaDEX® Fund (FDTS) | | First Trust Emerging Markets
Small Cap AlphaDEX® Fund (FEMS) | | First Trust Eurozone
AlphaDEX® ETF (FEUZ) |
Six Months
Ended
6/30/2022
(Unaudited) | | Year
Ended
12/31/2021 | | Six Months
Ended
6/30/2022
(Unaudited) | | Year
Ended
12/31/2021 | | Six Months
Ended
6/30/2022
(Unaudited) | | Year
Ended
12/31/2021 |
| | | | | | | | | | | |
| $ 159,699 | | $ 145,363 | | $ 3,337,228 | | $ 5,574,164 | | $ 633,500 | | $ 899,396 |
| (423,174) | | 1,706,019 | | (1,630,570) | | 29,064,086 | | (8,026,959) | | 4,839,728 |
| (2,114,490) | | (856,439) | | (18,185,835) | | (30,029,448) | | (5,829,121) | | (3,425,251) |
| (2,377,965) | | 994,943 | | (16,479,177) | | 4,608,802 | | (13,222,580) | | 2,313,873 |
| | | | | | | | | | | |
| (119,376) | | (347,513) | | (3,051,582) | | (8,877,525) | | (684,307) | | (1,009,147) |
| | | | | | | | | | | |
| — | | 9,293,815 | | — | | 25,725,874 | | — | | 68,170,224 |
| (2,226,151) | | (4,668,214) | | (10,924,622) | | (31,008,175) | | (43,531,725) | | (15,702,337) |
| (2,226,151) | | 4,625,601 | | (10,924,622) | | (5,282,301) | | (43,531,725) | | 52,467,887 |
| (4,723,492) | | 5,273,031 | | (30,455,381) | | (9,551,024) | | (57,438,612) | | 53,772,613 |
| | | | | | | | | | | |
| 13,816,803 | | 8,543,772 | | 143,030,066 | | 152,581,090 | | 81,135,353 | | 27,362,740 |
| $9,093,311 | | $ 13,816,803 | | $ 112,574,685 | | $ 143,030,066 | | $ 23,696,741 | | $ 81,135,353 |
| | | | | | | | | | | |
| 300,002 | | 200,002 | | 3,550,002 | | 3,700,002 | | 1,750,002 | | 650,002 |
| — | | 200,000 | | — | | 550,000 | | — | | 1,450,000 |
| (50,000) | | (100,000) | | (300,000) | | (700,000) | | (1,050,000) | | (350,000) |
| 250,002 | | 300,002 | | 3,250,002 | | 3,550,002 | | 700,002 | | 1,750,002 |
See Notes to Financial Statements
Page 103
First Trust Exchange-Traded AlphaDEX® Fund II
Financial Highlights
For a share outstanding throughout each period
First Trust Asia Pacific ex-Japan AlphaDEX® Fund (FPA)
| | Six Months
Ended
6/30/2022
(Unaudited) | | Year Ended December 31, |
| | 2021 | | 2020 | | 2019 | | 2018 | | 2017 | |
Net asset value, beginning of period
| $ 31.57 | | $ 32.25 | | $ 28.57 | | $ 27.65 | | $ 35.73 | | $ 27.16 |
| Income from investment operations: | | | | | | | | | | | |
Net investment income (loss)
| 0.51 | | 1.28 | | 0.58 | | 0.63 | | 0.40 | | 0.93 |
Net realized and unrealized gain (loss)
| (5.40) | | (0.37) | | 3.61 | | 1.40 | | (7.72) | | 8.76 |
Total from investment operations
| (4.89) | | 0.91 | | 4.19 | | 2.03 | | (7.32) | | 9.69 |
| Distributions paid to shareholders from: | | | | | | | | | | | |
Net investment income
| (0.52) | | (1.59) | | (0.51) | | (1.09) | | (0.69) | | (1.12) |
Return of capital
| — | | — | | — | | (0.02) | | (0.07) | | — |
Total distributions
| (0.52) | | (1.59) | | (0.51) | | (1.11) | | (0.76) | | (1.12) |
Net asset value, end of period
| $26.16 | | $31.57 | | $32.25 | | $28.57 | | $27.65 | | $35.73 |
Total return (a)
| (15.67)% | | 2.75% | | 14.89% | | 7.35% | | (20.71)% | | 35.93% |
| Ratios to average net assets/supplemental data: | | | | | | | | | | | |
Net assets, end of period (in 000’s)
| $ 13,083 | | $ 25,258 | | $ 17,736 | | $ 19,997 | | $ 30,419 | | $ 58,959 |
Ratio of total expenses to average net assets
| 0.80% (b) | | 0.80% | | 0.80% | | 0.80% | | 0.80% | | 0.80% |
Ratio of net investment income (loss) to average net assets
| 3.71% (b) | | 4.03% | | 2.33% | | 2.64% | | 1.68% | | 2.95% |
Portfolio turnover rate (c)
| 43% | | 102% | | 103% | | 101% | | 88% | | 94% |
| (a) | Total return is calculated assuming an initial investment made at the net asset value at the beginning of the period, reinvestment of all distributions at net asset value during the period, and redemption at net asset value on the last day of the period. The returns presented do not reflect the deduction of taxes that a shareholder would pay on Fund distributions or the redemption or sale of Fund shares. Total return is calculated for the time period presented and is not annualized for periods of less than a year. |
| (b) | Annualized. |
| (c) | Portfolio turnover is calculated for the time period presented and is not annualized for periods of less than a year and does not include securities received or delivered from processing creations or redemptions and in-kind transactions. |
Page 104
See Notes to Financial Statements
First Trust Exchange-Traded AlphaDEX® Fund II
Financial Highlights (Continued)
For a share outstanding throughout each period
First Trust Europe AlphaDEX® Fund (FEP)
| | Six Months
Ended
6/30/2022
(Unaudited) | | Year Ended December 31, |
| | 2021 | | 2020 | | 2019 | | 2018 | | 2017 | |
Net asset value, beginning of period
| $ 43.31 | | $ 38.50 | | $ 37.64 | | $ 31.11 | | $ 39.07 | | $ 29.32 |
| Income from investment operations: | | | | | | | | | | | |
Net investment income (loss)
| 0.79 | | 1.05 | | 0.42 | | 0.87 | | 0.84 | | 0.49 |
Net realized and unrealized gain (loss)
| (12.10) | | 5.26 | | 1.32 | | 6.65 | | (7.99) | | 9.90 |
Total from investment operations
| (11.31) | | 6.31 | | 1.74 | | 7.52 | | (7.15) | | 10.39 |
| Distributions paid to shareholders from: | | | | | | | | | | | |
Net investment income
| (0.79) | | (1.50) | | (0.88) | | (0.99) | | (0.81) | | (0.64) |
Net asset value, end of period
| $31.21 | | $43.31 | | $38.50 | | $37.64 | | $31.11 | | $39.07 |
Total return (a)
| (26.13)% | | 16.53% | | 4.95% | | 24.38% | | (18.67)% | | 35.67% |
| Ratios to average net assets/supplemental data: | | | | | | | | | | | |
Net assets, end of period (in 000’s)
| $ 307,401 | | $ 573,909 | | $ 442,765 | | $ 511,890 | | $ 592,586 | | $ 707,087 |
Ratio of total expenses to average net assets
| 0.80% (b) | | 0.80% | | 0.80% | | 0.80% | | 0.80% | | 0.80% |
Ratio of net investment income (loss) to average net assets
| 4.14% (b) | | 2.33% | | 1.32% | | 2.49% | | 2.30% | | 1.39% |
Portfolio turnover rate (c)
| 48% | | 105% | | 109% | | 102% | | 99% | | 100% |
| (a) | Total return is calculated assuming an initial investment made at the net asset value at the beginning of the period, reinvestment of all distributions at net asset value during the period, and redemption at net asset value on the last day of the period. The returns presented do not reflect the deduction of taxes that a shareholder would pay on Fund distributions or the redemption or sale of Fund shares. Total return is calculated for the time period presented and is not annualized for periods of less than a year. |
| (b) | Annualized. |
| (c) | Portfolio turnover is calculated for the time period presented and is not annualized for periods of less than a year and does not include securities received or delivered from processing creations or redemptions and in-kind transactions. |
See Notes to Financial Statements
Page 105
First Trust Exchange-Traded AlphaDEX® Fund II
Financial Highlights (Continued)
For a share outstanding throughout each period
First Trust Latin America AlphaDEX® Fund (FLN)
| | Six Months
Ended
6/30/2022
(Unaudited) | | Year Ended December 31, |
| | 2021 | | 2020 | | 2019 | | 2018 | | 2017 | |
Net asset value, beginning of period
| $ 17.35 | | $ 19.43 | | $ 22.67 | | $ 18.33 | | $ 20.43 | | $ 18.74 |
| Income from investment operations: | | | | | | | | | | | |
Net investment income (loss)
| 0.55 | | 0.89 | | 0.52 | | 0.48 | | 0.52 | | 1.56 |
Net realized and unrealized gain (loss)
| (1.06) | | (2.16) | | (3.44) | | 4.29 | | (2.06) | | 2.23 |
Total from investment operations
| (0.51) | | (1.27) | | (2.92) | | 4.77 | | (1.54) | | 3.79 |
| Distributions paid to shareholders from: | | | | | | | | | | | |
Net investment income
| (0.52) | | (0.81) | | (0.20) | | (0.43) | | (0.51) | | (2.10) |
Return of capital
| — | | — | | (0.12) | | — | | (0.05) | | — |
Total distributions
| (0.52) | | (0.81) | | (0.32) | | (0.43) | | (0.56) | | (2.10) |
Net asset value, end of period
| $16.32 | | $17.35 | | $19.43 | | $22.67 | | $18.33 | | $20.43 |
Total return (a)
| (2.95)% | | (6.66)% | | (12.32)% | | 26.26% | | (7.50)% | | 20.50% |
| Ratios to average net assets/supplemental data: | | | | | | | | | | | |
Net assets, end of period (in 000’s)
| $ 41,610 | | $ 7,805 | | $ 13,599 | | $ 131,463 | | $ 17,418 | | $ 17,363 |
Ratio of total expenses to average net assets
| 0.80% (b) | | 0.80% | | 0.80% | | 0.80% | | 0.80% | | 0.82% (c) |
Ratio of net investment income (loss) to average net assets
| 9.38% (b) | | 4.28% | | 0.81% | | 2.02% | | 2.46% | | 3.02% |
Portfolio turnover rate (d)
| 76% | | 91% | | 34% | | 165% | | 158% | | 187% |
| (a) | Total return is calculated assuming an initial investment made at the net asset value at the beginning of the period, reinvestment of all distributions at net asset value during the period, and redemption at net asset value on the last day of the period. The returns presented do not reflect the deduction of taxes that a shareholder would pay on Fund distributions or the redemption or sale of Fund shares. Total return is calculated for the time period presented and is not annualized for periods of less than a year. |
| (b) | Annualized. |
| (c) | Includes excise tax. If this excise tax was not included, the expense ratio would have been 0.80%. |
| (d) | Portfolio turnover is calculated for the time period presented and is not annualized for periods of less than a year and does not include securities received or delivered from processing creations or redemptions and in-kind transactions. |
Page 106
See Notes to Financial Statements
First Trust Exchange-Traded AlphaDEX® Fund II
Financial Highlights (Continued)
For a share outstanding throughout each period
First Trust Brazil AlphaDEX® Fund (FBZ)
| | Six Months
Ended
6/30/2022
(Unaudited) | | Year Ended December 31, |
| | 2021 | | 2020 | | 2019 | | 2018 | | 2017 | |
Net asset value, beginning of period
| $ 11.47 | | $ 13.39 | | $ 17.24 | | $ 13.38 | | $ 15.51 | | $ 13.93 |
| Income from investment operations: | | | | | | | | | | | |
Net investment income (loss)
| 0.63 | | 0.94 | | 0.09 | | 0.35 | | 0.55 | | 2.46 |
Net realized and unrealized gain (loss)
| (1.40) (a) | | (2.08) | | (3.60) | | 5.08 | | (0.97) | | 1.06 |
Total from investment operations
| (0.77) | | (1.14) | | (3.51) | | 5.43 | | (0.42) | | 3.52 |
| Distributions paid to shareholders from: | | | | | | | | | | | |
Net investment income
| (0.77) | | (0.78) | | (0.28) | | (1.57) | | (0.54) | | (1.77) |
Net realized gain
| — | | — | | — | | — | | (1.17) | | (0.17) |
Return of capital
| — | | — | | (0.06) | | — | | — | | — |
Total distributions
| (0.77) | | (0.78) | | (0.34) | | (1.57) | | (1.71) | | (1.94) |
Net asset value, end of period
| $9.93 | | $11.47 | | $13.39 | | $17.24 | | $13.38 | | $15.51 |
Total return (b)
| (7.07)% | | (9.00)% | | (19.48)% | | 41.06% | | (1.17)% | | 25.91% |
| Ratios to average net assets/supplemental data: | | | | | | | | | | | |
Net assets, end of period (in 000’s)
| $ 5,459 | | $ 12,039 | | $ 9,373 | | $ 116,374 | | $ 129,081 | | $ 9,308 |
Ratio of total expenses to average net assets
| 0.80% (c) | | 0.80% | | 0.80% | | 0.80% | | 0.80% | | 0.84% (d) |
Ratio of net investment income (loss) to average net assets
| 5.99% (c) | | 7.36% | | 0.72% | | 2.15% | | 6.84% | | 3.19% |
Portfolio turnover rate (e)
| 70% | | 225% | | 154% | | 90% | | 128% | | 159% |
| (a) | The per share amount does not correlate with the aggregate realized and unrealized gain (loss) due to the timing of the Fund share sales and repurchases in relation to market value fluctuation of the underlying investments. |
| (b) | Total return is calculated assuming an initial investment made at the net asset value at the beginning of the period, reinvestment of all distributions at net asset value during the period, and redemption at net asset value on the last day of the period. The returns presented do not reflect the deduction of taxes that a shareholder would pay on Fund distributions or the redemption or sale of Fund shares. Total return is calculated for the time period presented and is not annualized for periods of less than a year. |
| (c) | Annualized. |
| (d) | Includes excise tax. If this excise tax was not included, the expense ratio would have been 0.80%. |
| (e) | Portfolio turnover is calculated for the time period presented and is not annualized for periods of less than a year and does not include securities received or delivered from processing creations or redemptions and in-kind transactions. |
See Notes to Financial Statements
Page 107
First Trust Exchange-Traded AlphaDEX® Fund II
Financial Highlights (Continued)
For a share outstanding throughout each period
First Trust China AlphaDEX® Fund (FCA)
| | Six Months
Ended
6/30/2022
(Unaudited) | | Year Ended December 31, |
| | 2021 | | 2020 | | 2019 | | 2018 | | 2017 | |
Net asset value, beginning of period
| $ 27.57 | | $ 29.16 | | $ 26.87 | | $ 23.81 | | $ 29.77 | | $ 19.28 |
| Income from investment operations: | | | | | | | | | | | |
Net investment income (loss)
| 0.84 | | 1.22 | | 1.22 | | 1.03 | | 0.84 | | 0.47 |
Net realized and unrealized gain (loss)
| (2.41) | | (1.47) | | 2.26 | | 3.03 | | (6.07) | | 10.70 |
Total from investment operations
| (1.57) | | (0.25) | | 3.48 | | 4.06 | | (5.23) | | 11.17 |
| Distributions paid to shareholders from: | | | | | | | | | | | |
Net investment income
| (0.32) | | (1.34) | | (1.19) | | (1.00) | | (0.73) | | (0.68) |
Net asset value, end of period
| $25.68 | | $27.57 | | $29.16 | | $26.87 | | $23.81 | | $29.77 |
Total return (a)
| (5.68)% | | (1.18)% | | 13.58% | | 17.34% | | (17.87)% | | 58.35% |
| Ratios to average net assets/supplemental data: | | | | | | | | | | | |
Net assets, end of period (in 000’s)
| $ 8,986 | | $ 9,649 | | $ 13,121 | | $ 9,403 | | $ 7,142 | | $ 7,443 |
Ratio of total expenses to average net assets
| 0.80% (b) | | 0.80% | | 0.80% | | 0.80% | | 0.80% | | 0.80% |
Ratio of net investment income (loss) to average net assets
| 6.46% (b) | | 3.66% | | 5.16% | | 4.21% | | 2.90% | | 1.69% |
Portfolio turnover rate (c)
| 57% | | 166% | | 83% | | 111% | | 97% | | 69% |
| (a) | Total return is calculated assuming an initial investment made at the net asset value at the beginning of the period, reinvestment of all distributions at net asset value during the period, and redemption at net asset value on the last day of the period. The returns presented do not reflect the deduction of taxes that a shareholder would pay on Fund distributions or the redemption or sale of Fund shares. Total return is calculated for the time period presented and is not annualized for periods of less than a year. |
| (b) | Annualized. |
| (c) | Portfolio turnover is calculated for the time period presented and is not annualized for periods of less than a year and does not include securities received or delivered from processing creations or redemptions and in-kind transactions. |
Page 108
See Notes to Financial Statements
First Trust Exchange-Traded AlphaDEX® Fund II
Financial Highlights (Continued)
For a share outstanding throughout each period
First Trust Japan AlphaDEX® Fund (FJP)
| | Six Months
Ended
6/30/2022
(Unaudited) | | Year Ended December 31, |
| | 2021 | | 2020 | | 2019 | | 2018 | | 2017 | |
Net asset value, beginning of period
| $ 49.86 | | $ 51.42 | | $ 51.10 | | $ 48.55 | | $ 59.80 | | $ 47.85 |
| Income from investment operations: | | | | | | | | | | | |
Net investment income (loss)
| 0.80 | | 0.81 | | 0.49 | | 1.12 | | 0.79 | | 0.64 |
Net realized and unrealized gain (loss)
| (8.85) | | (1.16) | | 0.34 | | 2.84 | | (11.30) | | 12.08 |
Total from investment operations
| (8.05) | | (0.35) | | 0.83 | | 3.96 | | (10.51) | | 12.72 |
| Distributions paid to shareholders from: | | | | | | | | | | | |
Net investment income
| (0.78) | | (1.21) | | (0.51) | | (1.41) | | (0.74) | | (0.77) |
Net asset value, end of period
| $41.03 | | $49.86 | | $51.42 | | $51.10 | | $48.55 | | $59.80 |
Total return (a)
| (16.15)% | | (0.69)% | | 1.71% | | 8.27% | | (17.66)% | | 26.70% |
| Ratios to average net assets/supplemental data: | | | | | | | | | | | |
Net assets, end of period (in 000’s)
| $ 30,771 | | $ 34,901 | | $ 41,136 | | $ 76,647 | | $ 152,934 | | $ 83,718 |
Ratio of total expenses to average net assets
| 0.80% (b) | | 0.80% | | 0.80% | | 0.80% | | 0.80% | | 0.80% |
Ratio of net investment income (loss) to average net assets
| 3.50% (b) | | 1.53% | | 1.13% | | 1.90% | | 1.34% | | 1.22% |
Portfolio turnover rate (c)
| 46% | | 126% | | 136% | | 127% | | 90% | | 101% |
| (a) | Total return is calculated assuming an initial investment made at the net asset value at the beginning of the period, reinvestment of all distributions at net asset value during the period, and redemption at net asset value on the last day of the period. The returns presented do not reflect the deduction of taxes that a shareholder would pay on Fund distributions or the redemption or sale of Fund shares. Total return is calculated for the time period presented and is not annualized for periods of less than a year. |
| (b) | Annualized. |
| (c) | Portfolio turnover is calculated for the time period presented and is not annualized for periods of less than a year and does not include securities received or delivered from processing creations or redemptions and in-kind transactions. |
See Notes to Financial Statements
Page 109
First Trust Exchange-Traded AlphaDEX® Fund II
Financial Highlights (Continued)
For a share outstanding throughout each period
First Trust Developed Markets ex-US AlphaDEX® Fund (FDT)
| | Six Months
Ended
6/30/2022
(Unaudited) | | Year Ended December 31, |
| | 2021 | | 2020 | | 2019 | | 2018 | | 2017 | |
Net asset value, beginning of period
| $ 60.64 | | $ 56.88 | | $ 55.79 | | $ 49.24 | | $ 62.31 | | $ 47.43 |
| Income from investment operations: | | | | | | | | | | | |
Net investment income (loss)
| 1.07 | | 1.52 | | 0.68 | | 1.19 | | 1.04 | | 0.88 |
Net realized and unrealized gain (loss)
| (13.34) | | 4.55 | | 1.78 | | 6.91 | | (13.06) | | 14.98 |
Total from investment operations
| (12.27) | | 6.07 | | 2.46 | | 8.10 | | (12.02) | | 15.86 |
| Distributions paid to shareholders from: | | | | | | | | | | | |
Net investment income
| (0.74) | | (2.31) | | (1.37) | | (1.55) | | (1.01) | | (0.98) |
Return of capital
| — | | — | | — | | — | | (0.04) | | — |
Total distributions
| (0.74) | | (2.31) | | (1.37) | | (1.55) | | (1.05) | | (0.98) |
Net asset value, end of period
| $47.63 | | $60.64 | | $56.88 | | $55.79 | | $49.24 | | $62.31 |
Total return (a)
| (20.27)% | | 10.70% | | 4.61% | | 16.56% | | (19.52)% | | 33.57% |
| Ratios to average net assets/supplemental data: | | | | | | | | | | | |
Net assets, end of period (in 000’s)
| $ 397,068 | | $ 414,579 | | $ 360,418 | | $ 691,886 | | $ 940,633 | | $ 810,194 |
Ratio of total expenses to average net assets
| 0.80% (b) | | 0.80% | | 0.80% | | 0.80% | | 0.80% | | 0.80% |
Ratio of net investment income (loss) to average net assets
| 3.58% (b) | | 2.42% | | 1.39% | | 2.13% | | 1.76% | | 1.85% |
Portfolio turnover rate (c)
| 51% | | 111% | | 117% | | 107% | | 109% | | 104% |
| (a) | Total return is calculated assuming an initial investment made at the net asset value at the beginning of the period, reinvestment of all distributions at net asset value during the period, and redemption at net asset value on the last day of the period. The returns presented do not reflect the deduction of taxes that a shareholder would pay on Fund distributions or the redemption or sale of Fund shares. Total return is calculated for the time period presented and is not annualized for periods of less than a year. |
| (b) | Annualized. |
| (c) | Portfolio turnover is calculated for the time period presented and is not annualized for periods of less than a year and does not include securities received or delivered from processing creations or redemptions and in-kind transactions. |
Page 110
See Notes to Financial Statements
First Trust Exchange-Traded AlphaDEX® Fund II
Financial Highlights (Continued)
For a share outstanding throughout each period
First Trust Emerging Markets AlphaDEX® Fund (FEM)
| | Six Months
Ended
6/30/2022
(Unaudited) | | Year Ended December 31, |
| | 2021 | | 2020 | | 2019 | | 2018 | | 2017 | |
Net asset value, beginning of period
| $ 26.24 | | $ 25.31 | | $ 26.36 | | $ 22.80 | | $ 27.84 | | $ 20.50 |
| Income from investment operations: | | | | | | | | | | | |
Net investment income (loss)
| 0.80 | | 1.11 | | 0.63 | | 0.88 | | 0.88 | | 0.59 |
Net realized and unrealized gain (loss)
| (5.28) | | 0.90 | | (1.00) | | 3.56 | | (5.12) | | 7.43 |
Total from investment operations
| (4.48) | | 2.01 | | (0.37) | | 4.44 | | (4.24) | | 8.02 |
| Distributions paid to shareholders from: | | | | | | | | | | | |
Net investment income
| (0.55) | | (1.08) | | (0.68) | | (0.88) | | (0.80) | | (0.68) |
Net asset value, end of period
| $21.21 | | $26.24 | | $25.31 | | $26.36 | | $22.80 | | $27.84 |
Total return (a)
| (17.10)% | | 7.90% | | (0.92)% | | 19.81% | | (15.48)% | | 39.43% |
| Ratios to average net assets/supplemental data: | | | | | | | | | | | |
Net assets, end of period (in 000’s)
| $ 330,827 | | $ 436,915 | | $ 441,711 | | $ 644,615 | | $ 452,607 | | $ 449,663 |
Ratio of total expenses to average net assets
| 0.80% (b) | | 0.80% | | 0.80% | | 0.80% | | 0.80% | | 0.80% |
Ratio of net investment income (loss) to average net assets
| 6.40% (b) | | 4.03% | | 2.53% | | 3.61% | | 3.37% | | 2.69% |
Portfolio turnover rate (c)
| 55% | | 119% | | 111% | | 122% | | 103% | | 101% |
| (a) | Total return is calculated assuming an initial investment made at the net asset value at the beginning of the period, reinvestment of all distributions at net asset value during the period, and redemption at net asset value on the last day of the period. The returns presented do not reflect the deduction of taxes that a shareholder would pay on Fund distributions or the redemption or sale of Fund shares. Total return is calculated for the time period presented and is not annualized for periods of less than a year. |
| (b) | Annualized. |
| (c) | Portfolio turnover is calculated for the time period presented and is not annualized for periods of less than a year and does not include securities received or delivered from processing creations or redemptions and in-kind transactions. |
See Notes to Financial Statements
Page 111
First Trust Exchange-Traded AlphaDEX® Fund II
Financial Highlights (Continued)
For a share outstanding throughout each period
First Trust Germany AlphaDEX® Fund (FGM)
| | Six Months
Ended
6/30/2022
(Unaudited) | | Year Ended December 31, |
| | 2021 | | 2020 | | 2019 | | 2018 | | 2017 | |
Net asset value, beginning of period
| $ 53.78 | | $ 51.56 | | $ 44.39 | | $ 37.57 | | $ 51.26 | | $ 36.47 |
| Income from investment operations: | | | | | | | | | | | |
Net investment income (loss)
| 1.92 | | 0.91 | | 0.68 | | 1.02 | | 0.72 | | 1.00 |
Net realized and unrealized gain (loss)
| (20.17) | | 2.08 | | 7.17 | | 6.82 | | (13.59) | | 14.87 |
Total from investment operations
| (18.25) | | 2.99 | | 7.85 | | 7.84 | | (12.87) | | 15.87 |
| Distributions paid to shareholders from: | | | | | | | | | | | |
Net investment income
| (1.61) | | (0.77) | | (0.68) | | (1.02) | | (0.82) | | (1.08) |
Net asset value, end of period
| $33.92 | | $53.78 | | $51.56 | | $44.39 | | $37.57 | | $51.26 |
Total return (a)
| (34.57)% | | 5.74% | | 17.90% | | 21.06% | | (25.40)% | | 43.96% |
| Ratios to average net assets/supplemental data: | | | | | | | | | | | |
Net assets, end of period (in 000’s)
| $ 18,657 | | $ 99,497 | | $ 95,381 | | $ 144,261 | | $ 139,022 | | $ 258,845 |
Ratio of total expenses to average net assets
| 0.80% (b) | | 0.80% | | 0.80% | | 0.80% | | 0.80% | | 0.80% |
Ratio of net investment income (loss) to average net assets
| 2.81% (b) | | 1.67% | | 1.40% | | 2.48% | | 1.66% | | 2.38% |
Portfolio turnover rate (c)
| 87% | | 80% | | 106% | | 99% | | 81% | | 82% |
| (a) | Total return is calculated assuming an initial investment made at the net asset value at the beginning of the period, reinvestment of all distributions at net asset value during the period, and redemption at net asset value on the last day of the period. The returns presented do not reflect the deduction of taxes that a shareholder would pay on Fund distributions or the redemption or sale of Fund shares. Total return is calculated for the time period presented and is not annualized for periods of less than a year. |
| (b) | Annualized. |
| (c) | Portfolio turnover is calculated for the time period presented and is not annualized for periods of less than a year and does not include securities received or delivered from processing creations or redemptions and in-kind transactions. |
Page 112
See Notes to Financial Statements
First Trust Exchange-Traded AlphaDEX® Fund II
Financial Highlights (Continued)
For a share outstanding throughout each period
First Trust United Kingdom AlphaDEX® Fund (FKU)
| | Six Months
Ended
6/30/2022
(Unaudited) | | Year Ended December 31, |
| | 2021 | | 2020 | | 2019 | | 2018 | | 2017 | |
Net asset value, beginning of period
| $ 43.97 | | $ 38.06 | | $ 40.99 | | $ 32.11 | | $ 39.97 | | $ 32.85 |
| Income from investment operations: | | | | | | | | | | | |
Net investment income (loss)
| 0.84 | | 1.29 | | 0.58 | | 1.34 | | 1.13 | | 1.15 |
Net realized and unrealized gain (loss)
| (12.22) | | 5.93 | | (2.95) | | 8.91 | | (7.35) | | 7.14 |
Total from investment operations
| (11.38) | | 7.22 | | (2.37) | | 10.25 | | (6.22) | | 8.29 |
| Distributions paid to shareholders from: | | | | | | | | | | | |
Net investment income
| (0.99) | | (1.31) | | (0.56) | | (1.37) | | (1.64) | | (1.17) |
Net asset value, end of period
| $31.60 | | $43.97 | | $38.06 | | $40.99 | | $32.11 | | $39.97 |
Total return (a)
| (26.00)% | | 19.10% | | (5.25)% | | 32.36% | | (16.16)% | | 25.53% |
| Ratios to average net assets/supplemental data: | | | | | | | | | | | |
Net assets, end of period (in 000’s)
| $ 67,934 | | $ 98,943 | | $ 19,030 | | $ 18,444 | | $ 9,632 | | $ 17,986 |
Ratio of total expenses to average net assets
| 0.80% (b) | | 0.80% | | 0.80% | | 0.80% | | 0.80% | | 0.80% |
Ratio of net investment income (loss) to average net assets
| 4.41% (b) | | 3.34% | | 1.72% | | 3.58% | | 2.81% | | 2.87% |
Portfolio turnover rate (c)
| 42% | | 45% | | 109% | | 73% | | 107% | | 98% |
| (a) | Total return is calculated assuming an initial investment made at the net asset value at the beginning of the period, reinvestment of all distributions at net asset value during the period, and redemption at net asset value on the last day of the period. The returns presented do not reflect the deduction of taxes that a shareholder would pay on Fund distributions or the redemption or sale of Fund shares. Total return is calculated for the time period presented and is not annualized for periods of less than a year. |
| (b) | Annualized. |
| (c) | Portfolio turnover is calculated for the time period presented and is not annualized for periods of less than a year and does not include securities received or delivered from processing creations or redemptions and in-kind transactions. |
See Notes to Financial Statements
Page 113
First Trust Exchange-Traded AlphaDEX® Fund II
Financial Highlights (Continued)
For a share outstanding throughout each period
First Trust India NIFTY 50 Equal Weight ETF (NFTY)
| | Six Months
Ended
6/30/2022
(Unaudited) | | Year Ended December 31, |
| | 2021 | | 2020 | | 2019 | | 2018 | | 2017 | |
Net asset value, beginning of period
| $ 48.23 | | $ 38.83 | | $ 35.26 | | $ 35.35 | | $ 36.33 | | $ 30.87 |
| Income from investment operations: | | | | | | | | | | | |
Net investment income (loss)
| 0.14 (a) | | 0.48 | | 0.30 | | 0.26 | | 0.23 | | 0.87 |
Net realized and unrealized gain (loss)
| (6.13) | | 9.65 | | 3.50 | | (0.01) | | (1.21) | | 6.06 |
Total from investment operations
| (5.99) | | 10.13 | | 3.80 | | 0.25 | | (0.98) | | 6.93 |
| Distributions paid to shareholders from: | | | | | | | | | | | |
Net investment income
| (1.30) | | (0.73) | | (0.23) | | (0.27) | | (0.01) | | (1.47) |
Return of capital
| — | | — | | — | | (0.07) | | — | | — |
Total distributions
| (1.30) | | (0.73) | | (0.23) | | (0.34) | | — | | (1.47) |
Net asset value, end of period
| $40.94 | | $48.23 | | $38.83 | | $35.26 | | $35.35 | | $36.33 |
Total return (b)
| (12.71)% | | 26.15% | | 10.66% | | 0.71% | | (2.67)% (c) | | 22.54% |
| Ratios to average net assets/supplemental data: | | | | | | | | | | | |
Net assets, end of period (in 000’s)
| $ 47,082 | | $ 62,703 | | $ 3,883 | | $ 3,526 | | $ 3,535 | | $ 3,633 |
Ratio of total expenses to average net assets
| 0.80% (d) | | 0.80% | | 0.80% | | 0.80% | | 0.80% | | 0.80% |
Ratio of net investment income (loss) to average net assets
| 0.61% (d) | | 0.95% | | 0.98% | | 0.74% | | 0.77% | | 2.45% |
Portfolio turnover rate (e)
| 12% | | 57% | | 38% | | 24% | | 156% (f) | | 64% |
| (a) | Based on average shares outstanding. |
| (b) | Total return is calculated assuming an initial investment made at the net asset value at the beginning of the period, reinvestment of all distributions at net asset value during the period, and redemption at net asset value on the last day of the period. The returns presented do not reflect the deduction of taxes that a shareholder would pay on Fund distributions or the redemption or sale of Fund shares. Total return is calculated for the time period presented and is not annualized for periods of less than a year. |
| (c) | The Fund received a reimbursement from the advisor in the amount of $7,227, which represents less than $0.01 per share. Since the advisor reimbursed the Fund, there was no effect on the Fund’s total return. |
| (d) | Annualized. |
| (e) | Portfolio turnover is calculated for the time period presented and is not annualized for periods of less than a year and does not include securities received or delivered from processing creations or redemptions and in-kind transactions. |
| (f) | The variation in the portfolio turnover rate is due to the change in the Fund’s underlying index effective April 17, 2018 which resulted in a complete rebalance of the Fund’s portfolio. |
Page 114
See Notes to Financial Statements
First Trust Exchange-Traded AlphaDEX® Fund II
Financial Highlights (Continued)
For a share outstanding throughout each period
First Trust Switzerland AlphaDEX® Fund (FSZ)
| | Six Months
Ended
6/30/2022
(Unaudited) | | Year Ended December 31, |
| | 2021 | | 2020 | | 2019 | | 2018 | | 2017 | |
Net asset value, beginning of period
| $ 71.39 | | $ 60.85 | | $ 54.11 | | $ 43.89 | | $ 52.73 | | $ 40.82 |
| Income from investment operations: | | | | | | | | | | | |
Net investment income (loss)
| 2.03 | | 0.78 | | 0.88 | | 1.07 | | 0.82 | | 0.66 |
Net realized and unrealized gain (loss)
| (19.33) | | 10.92 | | 6.78 | | 10.24 | | (8.66) | | 12.03 |
Total from investment operations
| (17.30) | | 11.70 | | 7.66 | | 11.31 | | (7.84) | | 12.69 |
| Distributions paid to shareholders from: | | | | | | | | | | | |
Net investment income
| (1.32) | | (1.16) | | (0.92) | | (1.09) | | (0.84) | | (0.78) |
Return of capital
| — | | — | | — | | — | | (0.16) | | — |
Total distributions
| (1.32) | | (1.16) | | (0.92) | | (1.09) | | (1.00) | | (0.78) |
Net asset value, end of period
| $52.77 | | $71.39 | | $60.85 | | $54.11 | | $43.89 | | $52.73 |
Total return (a)
| (24.23)% | | 19.34% | | 14.50% | | 25.91% | | (15.11)% | | 31.26% |
| Ratios to average net assets/supplemental data: | | | | | | | | | | | |
Net assets, end of period (in 000’s)
| $ 39,574 | | $ 99,943 | | $ 97,354 | | $ 148,811 | | $ 151,409 | | $ 237,288 |
Ratio of total expenses to average net assets
| 0.80% (b) | | 0.80% | | 0.80% | | 0.80% | | 0.80% | | 0.80% |
Ratio of net investment income (loss) to average net assets
| 3.86% (b) | | 1.25% | | 1.59% | | 2.24% | | 1.79% | | 1.43% |
Portfolio turnover rate (c)
| 35% | | 66% | | 86% | | 77% | | 65% | | 50% |
| (a) | Total return is calculated assuming an initial investment made at the net asset value at the beginning of the period, reinvestment of all distributions at net asset value during the period, and redemption at net asset value on the last day of the period. The returns presented do not reflect the deduction of taxes that a shareholder would pay on Fund distributions or the redemption or sale of Fund shares. Total return is calculated for the time period presented and is not annualized for periods of less than a year. |
| (b) | Annualized. |
| (c) | Portfolio turnover is calculated for the time period presented and is not annualized for periods of less than a year and does not include securities received or delivered from processing creations or redemptions and in-kind transactions. |
See Notes to Financial Statements
Page 115
First Trust Exchange-Traded AlphaDEX® Fund II
Financial Highlights (Continued)
For a share outstanding throughout each period
First Trust Developed Markets ex-US Small Cap AlphaDEX® Fund (FDTS)
| | Six Months
Ended
6/30/2022
(Unaudited) | | Year Ended December 31, |
| | 2021 | | 2020 | | 2019 | | 2018 | | 2017 | |
Net asset value, beginning of period
| $ 46.06 | | $ 42.72 | | $ 39.03 | | $ 33.54 | | $ 44.89 | | $ 33.70 |
| Income from investment operations: | | | | | | | | | | | |
Net investment income (loss)
| 0.57 | | 0.74 | | 0.46 | | 0.61 | | 0.58 | | 0.71 |
Net realized and unrealized gain (loss)
| (9.79) | | 3.99 | | 4.09 | | 5.77 | | (11.28) | | 11.41 |
Total from investment operations
| (9.22) | | 4.73 | | 4.55 | | 6.38 | | (10.70) | | 12.12 |
| Distributions paid to shareholders from: | | | | | | | | | | | |
Net investment income
| (0.47) | | (1.39) | | (0.86) | | (0.89) | | (0.62) | | (0.93) |
Return of capital
| — | | — | | — | | — | | (0.03) | | — |
Total distributions
| (0.47) | | (1.39) | | (0.86) | | (0.89) | | (0.65) | | (0.93) |
Net asset value, end of period
| $36.37 | | $46.06 | | $42.72 | | $39.03 | | $33.54 | | $44.89 |
Total return (a)
| (20.05)% | | 11.09% | | 12.18% | | 19.13% | | (24.03)% | | 36.23% |
| Ratios to average net assets/supplemental data: | | | | | | | | | | | |
Net assets, end of period (in 000’s)
| $ 9,093 | | $ 13,817 | | $ 8,544 | | $ 9,758 | | $ 10,063 | | $ 8,977 |
Ratio of total expenses to average net assets
| 0.80% (b) | | 0.80% | | 0.80% | | 0.80% | | 0.80% | | 0.80% |
Ratio of net investment income (loss) to average net assets
| 2.75% (b) | | 1.46% | | 1.35% | | 1.66% | | 1.30% | | 1.80% |
Portfolio turnover rate (c)
| 56% | | 116% | | 127% | | 119% | | 142% | | 111% |
| (a) | Total return is calculated assuming an initial investment made at the net asset value at the beginning of the period, reinvestment of all distributions at net asset value during the period, and redemption at net asset value on the last day of the period. The returns presented do not reflect the deduction of taxes that a shareholder would pay on Fund distributions or the redemption or sale of Fund shares. Total return is calculated for the time period presented and is not annualized for periods of less than a year. |
| (b) | Annualized. |
| (c) | Portfolio turnover is calculated for the time period presented and is not annualized for periods of less than a year and does not include securities received or delivered from processing creations or redemptions and in-kind transactions. |
Page 116
See Notes to Financial Statements
First Trust Exchange-Traded AlphaDEX® Fund II
Financial Highlights (Continued)
For a share outstanding throughout each period
First Trust Emerging Markets Small Cap AlphaDEX® Fund (FEMS)
| | Six Months
Ended
6/30/2022
(Unaudited) | | Year Ended December 31, |
| | 2021 | | 2020 | | 2019 | | 2018 | | 2017 | |
Net asset value, beginning of period
| $ 40.29 | | $ 41.24 | | $ 39.28 | | $ 32.44 | | $ 43.02 | | $ 30.42 |
| Income from investment operations: | | | | | | | | | | | |
Net investment income (loss)
| 0.97 | | 1.57 | | 0.74 | | 1.11 | | 1.19 | | 1.11 |
Net realized and unrealized gain (loss)
| (5.69) | | (0.01) | | 2.41 | | 7.46 | | (10.26) | | 12.96 |
Total from investment operations
| (4.72) | | 1.56 | | 3.15 | | 8.57 | | (9.07) | | 14.07 |
| Distributions paid to shareholders from: | | | | | | | | | | | |
Net investment income
| (0.93) | | (2.51) | | (1.19) | | (1.73) | | (1.44) | | (1.26) |
Net realized gain
| — | | — | | — | | — | | (0.07) | | (0.21) |
Total distributions
| (0.93) | | (2.51) | | (1.19) | | (1.73) | | (1.51) | | (1.47) |
Net asset value, end of period
| $34.64 | | $40.29 | | $41.24 | | $39.28 | | $32.44 | | $43.02 |
Total return (a)
| (11.76)% | | 3.68% | | 8.73% | | 26.90% | | (21.42)% | | 46.57% |
| Ratios to average net assets/supplemental data: | | | | | | | | | | | |
Net assets, end of period (in 000’s)
| $ 112,575 | | $ 143,030 | | $ 152,581 | | $ 163,004 | | $ 157,326 | | $ 271,055 |
Ratio of total expenses to average net assets
| 0.80% (b) | | 0.80% | | 0.80% | | 0.80% | | 0.80% | | 0.80% |
Ratio of net investment income (loss) to average net assets
| 4.87% (b) | | 3.65% | | 2.38% | | 2.88% | | 3.02% | | 3.26% |
Portfolio turnover rate (c)
| 60% | | 127% | | 123% | | 127% | | 126% | | 113% |
| (a) | Total return is calculated assuming an initial investment made at the net asset value at the beginning of the period, reinvestment of all distributions at net asset value during the period, and redemption at net asset value on the last day of the period. The returns presented do not reflect the deduction of taxes that a shareholder would pay on Fund distributions or the redemption or sale of Fund shares. Total return is calculated for the time period presented and is not annualized for periods of less than a year. |
| (b) | Annualized. |
| (c) | Portfolio turnover is calculated for the time period presented and is not annualized for periods of less than a year and does not include securities received or delivered from processing creations or redemptions and in-kind transactions. |
See Notes to Financial Statements
Page 117
First Trust Exchange-Traded AlphaDEX® Fund II
Financial Highlights (Continued)
For a share outstanding throughout each period
First Trust Eurozone AlphaDEX® ETF (FEUZ)
| | Six Months
Ended
6/30/2022
(Unaudited) | | Year Ended December 31, |
| | 2021 | | 2020 | | 2019 | | 2018 | | 2017 | |
Net asset value, beginning of period
| $ 46.36 | | $ 42.10 | | $ 40.88 | | $ 34.43 | | $ 43.81 | | $ 32.64 |
| Income from investment operations: | | | | | | | | | | | |
Net investment income (loss)
| 0.81 | | 1.10 | | 0.50 | | 0.73 | | 0.80 | | 0.47 |
Net realized and unrealized gain (loss)
| (12.35) | | 4.32 | | 1.34 | | 6.51 | | (9.34) | | 11.26 |
Total from investment operations
| (11.54) | | 5.42 | | 1.84 | | 7.24 | | (8.54) | | 11.73 |
| Distributions paid to shareholders from: | | | | | | | | | | | |
Net investment income
| (0.97) | | (1.16) | | (0.62) | | (0.79) | | (0.84) | | (0.56) |
Net asset value, end of period
| $33.85 | | $46.36 | | $42.10 | | $40.88 | | $34.43 | | $43.81 |
Total return (a)
| (24.89)% | | 12.90% | | 4.69% | | 21.15% | | (19.82)% | | 36.19% |
| Ratios to average net assets/supplemental data: | | | | | | | | | | | |
Net assets, end of period (in 000’s)
| $ 23,697 | | $ 81,135 | | $ 27,363 | | $ 53,145 | | $ 49,925 | | $ 39,425 |
Ratio of total expenses to average net assets
| 0.80% (b) | | 0.80% | | 0.80% | | 0.80% | | 0.80% | | 0.80% |
Ratio of net investment income (loss) to average net assets
| 2.57% (b) | | 2.27% | | 1.26% | | 1.96% | | 2.10% | | 0.96% |
Portfolio turnover rate (c)
| 28% | | 59% | | 93% | | 87% | | 90% | | 77% |
| (a) | Total return is calculated assuming an initial investment made at the net asset value at the beginning of the period, reinvestment of all distributions at net asset value during the period, and redemption at net asset value on the last day of the period. The returns presented do not reflect the deduction of taxes that a shareholder would pay on Fund distributions or the redemption or sale of Fund shares. Total return is calculated for the time period presented and is not annualized for periods of less than a year. |
| (b) | Annualized. |
| (c) | Portfolio turnover is calculated for the time period presented and is not annualized for periods of less than a year and does not include securities received or delivered from processing creations or redemptions and in-kind transactions. |
Page 118
See Notes to Financial Statements
Notes to Financial Statements
First Trust Exchange-Traded AlphaDEX® Fund II
June 30, 2022 (Unaudited)
1. Organization
First Trust Exchange-Traded AlphaDEX® Fund II (the “Trust”) is an open-end management investment company organized as a Massachusetts business trust on December 3, 2010, and is registered with the Securities and Exchange Commission (“SEC”) under the Investment Company Act of 1940, as amended (the “1940 Act”).
The Trust currently consists of the following fifteen funds (each a “Fund” and collectively, the “Funds”). The shares of each Fund are listed and traded on The Nasdaq Stock Market LLC (“Nasdaq”).
First Trust Asia Pacific ex-Japan AlphaDEX® Fund – (ticker “FPA”)
First Trust Europe AlphaDEX® Fund – (ticker “FEP”)
First Trust Latin America AlphaDEX® Fund – (ticker “FLN”)
First Trust Brazil AlphaDEX® Fund – (ticker “FBZ”)
First Trust China AlphaDEX® Fund – (ticker “FCA”)
First Trust Japan AlphaDEX® Fund – (ticker “FJP”)
First Trust Developed Markets ex-US AlphaDEX® Fund – (ticker “FDT”)
First Trust Emerging Markets AlphaDEX® Fund – (ticker “FEM”)
First Trust Germany AlphaDEX® Fund – (ticker “FGM”)
First Trust United Kingdom AlphaDEX® Fund – (ticker “FKU”)
First Trust India NIFTY 50 Equal Weight ETF – (ticker “NFTY”)
First Trust Switzerland AlphaDEX® Fund – (ticker “FSZ”)
First Trust Developed Markets ex-US Small Cap AlphaDEX® Fund – (ticker “FDTS”)
First Trust Emerging Markets Small Cap AlphaDEX® Fund – (ticker “FEMS”)
First Trust Eurozone AlphaDEX® ETF – (ticker “FEUZ”)
Each Fund represents a separate series of beneficial interest in the Trust. Unlike conventional mutual funds, each Fund issues and redeems shares on a continuous basis, at net asset value (“NAV”), only in large blocks of shares known as “Creation Units.” The investment objective of each Fund is to seek investment results that correspond generally to the price and yield (before the Fund’s fees and expenses) of the following indices:
| Fund | Index |
| First Trust Asia Pacific ex-Japan AlphaDEX® Fund | Nasdaq AlphaDEX® Asia Pacific Ex-Japan Index |
| First Trust Europe AlphaDEX® Fund | Nasdaq AlphaDEX® Europe Index |
| First Trust Latin America AlphaDEX® Fund | Nasdaq AlphaDEX® Latin America Index |
| First Trust Brazil AlphaDEX® Fund | Nasdaq AlphaDEX® Brazil Index |
| First Trust China AlphaDEX® Fund | Nasdaq AlphaDEX® China Index |
| First Trust Japan AlphaDEX® Fund | Nasdaq AlphaDEX® Japan Index |
| First Trust Developed Markets ex-US AlphaDEX® Fund | Nasdaq AlphaDEX® Developed Markets Ex-US Index |
| First Trust Emerging Markets AlphaDEX® Fund | Nasdaq AlphaDEX® Emerging Markets Index |
| First Trust Germany AlphaDEX® Fund | Nasdaq AlphaDEX® Germany Index |
| First Trust United Kingdom AlphaDEX® Fund | Nasdaq AlphaDEX® United Kingdom Index |
| First Trust India NIFTY 50 Equal Weight ETF | NIFTY 50 Equal Weight Index |
| First Trust Switzerland AlphaDEX® Fund | Nasdaq AlphaDEX® Switzerland Index |
| First Trust Developed Markets ex-US Small Cap AlphaDEX® Fund | Nasdaq AlphaDEX® Developed Markets Ex-US Small Cap Index |
| First Trust Emerging Markets Small Cap AlphaDEX® Fund | Nasdaq AlphaDEX® Emerging Markets Small Cap Index |
| First Trust Eurozone AlphaDEX® ETF | Nasdaq AlphaDEX® Eurozone Index |
2. Significant Accounting Policies
The Funds are each considered an investment company and follow accounting and reporting guidance under Financial Accounting Standards Board Accounting Standards Codification Topic 946, “Financial Services-Investment Companies.” The following is a summary of significant accounting policies consistently followed by the Funds in the preparation of the financial statements. The preparation of the financial statements in accordance with accounting principles generally accepted in the United States of America (“U.S. GAAP”) requires management to make estimates and assumptions that affect the reported amounts and disclosures in the financial statements. Actual results could differ from those estimates.
A. Portfolio Valuation
Each Fund’s NAV is determined daily as of the close of regular trading on the New York Stock Exchange (“NYSE”), normally 4:00 p.m. Eastern time, on each day the NYSE is open for trading. If the NYSE closes early on a valuation day, the NAV is determined as of that time. Foreign securities are priced using data reflecting the earlier closing of the principal markets for those securities. Each Fund’s NAV is calculated by dividing the value of all assets of each Fund (including accrued interest and dividends), less all liabilities (including accrued expenses and dividends declared but unpaid), by the total number of shares outstanding.
Notes to Financial Statements (Continued)
First Trust Exchange-Traded AlphaDEX® Fund II
June 30, 2022 (Unaudited)
Each Fund’s investments are valued daily at market value or, in the absence of market value with respect to any portfolio securities, at fair value. Market value prices represent last sale or official closing prices from a national or foreign exchange (i.e., a regulated market) and are primarily obtained from third-party pricing services. Fair value prices represent any prices not considered market value prices and are either obtained from a third-party pricing service or are determined by the Pricing Committee of the Funds’ investment advisor, First Trust Advisors L.P. (“First Trust” or the “Advisor”), in accordance with valuation procedures adopted by the Trust’s Board of Trustees, and in accordance with provisions of the 1940 Act. Investments valued by the Advisor’s Pricing Committee, if any, are footnoted as such in the footnotes to the Portfolio of Investments. Each Fund’s investments are valued as follows:
Common stocks, real estate investment trusts (“REITs”), and other equity securities listed on any national or foreign exchange (excluding Nasdaq and the London Stock Exchange Alternative Investment Market (“AIM”)) are valued at the last sale price on the exchange on which they are principally traded or, for Nasdaq and AIM securities, the official closing price. Securities traded on more than one securities exchange are valued at the last sale price or official closing price, as applicable, at the close of the securities exchange representing the principal market for such securities.
Securities trading on foreign exchanges or over-the-counter markets that close prior to the NYSE close may be valued using a systematic fair valuation model provided by a third-party pricing service. If these foreign securities meet certain criteria in relation to the valuation model, their valuation is systematically adjusted to reflect the impact of movement in the U.S. market after the close of the foreign markets.
Shares of open-end funds are valued at fair value which is based on NAV per share.
Securities traded in an over-the-counter market are fair valued at the mean of their most recent bid and asked price, if available, and otherwise at their closing bid price.
Overnight repurchase agreements are valued at amortized cost when it represents the best estimate of fair value.
Certain securities may not be able to be priced by pre-established pricing methods. Such securities may be valued by the Trust’s Board of Trustees or its delegate, the Advisor’s Pricing Committee, at fair value. These securities generally include, but are not limited to, restricted securities (securities which may not be publicly sold without registration under the Securities Act of 1933, as amended (the “1933 Act”)) for which a third-party pricing service is unable to provide a market price; securities whose trading has been formally suspended; a security whose market or fair value price is not available from a pre-established pricing source; a security with respect to which an event has occurred that is likely to materially affect the value of the security after the market has closed but before the calculation of a Fund’s NAV or make it difficult or impossible to obtain a reliable market quotation; and a security whose price, as provided by the third-party pricing service, does not reflect the security’s fair value. As a general principle, the current fair value of a security would appear to be the amount which the owner might reasonably expect to receive for the security upon its current sale. When fair value prices are used, generally they will differ from market quotations or official closing prices on the applicable exchanges. A variety of factors may be considered in determining the fair value of such securities, including, but not limited to, the following:
| 1) | the type of security; |
| 2) | the size of the holding; |
| 3) | the initial cost of the security; |
| 4) | transactions in comparable securities; |
| 5) | price quotes from dealers and/or third-party pricing services; |
| 6) | relationships among various securities; |
| 7) | information obtained by contacting the issuer, analysts, or the appropriate stock exchange; |
| 8) | an analysis of the issuer’s financial statements; and |
| 9) | the existence of merger proposals or tender offers that might affect the value of the security. |
If the securities in question are foreign securities, the following additional information may be considered:
| 1) | the value of similar foreign securities traded on other foreign markets; |
| 2) | ADR trading of similar securities; |
| 3) | closed-end fund or exchange-traded fund trading of similar securities; |
| 4) | foreign currency exchange activity; |
| 5) | the trading prices of financial products that are tied to baskets of foreign securities; |
| 6) | factors relating to the event that precipitated the pricing problem; |
| 7) | whether the event is likely to recur; and |
| 8) | whether the effects of the event are isolated or whether they affect entire markets, countries or regions. |
In addition, differences between the prices used to calculate a Fund’s NAV and the prices used by such Fund’s corresponding index could result in a difference between a Fund’s performance and the performance of its underlying index.
Because foreign markets may be open on different days than the days during which investors may transact in the shares of a Fund, the value of the Fund’s securities may change on the days when investors are not able to transact in the shares of the Fund. The value of securities denominated in foreign currencies is converted into U.S. dollars using exchange rates determined daily as of the close of regular trading on the NYSE. Any use of a different rate from the rates used by a relevant index may adversely affect the Fund’s ability to track the index.
Notes to Financial Statements (Continued)
First Trust Exchange-Traded AlphaDEX® Fund II
June 30, 2022 (Unaudited)
The Funds are subject to fair value accounting standards that define fair value, establish the framework for measuring fair value and provide a three-level hierarchy for fair valuation based upon the inputs to the valuation as of the measurement date. The three levels of the fair value hierarchy are as follows:
| • | Level 1 – Level 1 inputs are quoted prices in active markets for identical investments. An active market is a market in which transactions for the investment occur with sufficient frequency and volume to provide pricing information on an ongoing basis. |
| • | Level 2 – Level 2 inputs are observable inputs, either directly or indirectly, and include the following: |
| o | Quoted prices for similar investments in active markets. |
| o | Quoted prices for identical or similar investments in markets that are non-active. A non-active market is a market where there are few transactions for the investment, the prices are not current, or price quotations vary substantially either over time or among market makers, or in which little information is released publicly. |
| o | Inputs other than quoted prices that are observable for the investment (for example, interest rates and yield curves observable at commonly quoted intervals, volatilities, prepayment speeds, loss severities, credit risks, and default rates). |
| o | Inputs that are derived principally from or corroborated by observable market data by correlation or other means. |
| • | Level 3 – Level 3 inputs are unobservable inputs. Unobservable inputs may reflect the reporting entity’s own assumptions about the assumptions that market participants would use in pricing the investment. |
The inputs or methodologies used for valuing investments are not necessarily an indication of the risk associated with investing in those investments. A summary of the inputs used to value each Fund’s investments as of June 30, 2022, is included with each Fund’s Portfolio of Investments.
B. Securities Transactions and Investment Income
Securities transactions are recorded as of the trade date. Realized gains and losses from securities transactions are recorded on the identified cost basis. Dividend income is recorded on the ex-dividend date except that certain dividends from foreign securities are recorded as soon as the information becomes available after the ex-dividend date. Interest income, if any, is recorded on the accrual basis.
Withholding taxes and tax reclaims on foreign dividends have been provided for in accordance with each Fund’s understanding of the applicable country’s tax rules and rates.
Distributions received from a Fund’s investments in REITs may be comprised of return of capital, capital gains, and income. The actual character of the amounts received during the year are not known until after the REITs’ fiscal year end. A Fund records the character of distributions received from the REITs during the year based on estimates available. The characterization of distributions received by a Fund may be subsequently revised based on information received from the REITs after their tax reporting periods conclude.
C. Restricted Securities
NFTY invests in restricted securities, which are securities that may not be offered for public sale without first being registered under the 1933 Act. Prior to registration, restricted securities may only be resold in transactions exempt from registration under Rule 144A under the 1933 Act, normally to qualified institutional buyers. As of June 30, 2022, NFTY held restricted securities as shown in the following table that the Advisor has deemed illiquid pursuant to procedures adopted by the Trust’s Board of Trustees. Although market instability can result in periods of increased overall market illiquidity, liquidity for each security is determined based on security-specific factors and assumptions, which require subjective judgment. NFTY does not have the right to demand that such securities be registered. These securities are valued according to the valuation procedures as stated in the Portfolio Valuation note (Note 2A) and are not expressed as a discount to the carrying value of a comparable unrestricted security. There are no unrestricted securities with the same maturity dates and yields for these issuers.
| Security | Acquisition
Date | Principal
Value/Shares | Current Price | Carrying
Cost | Value | % of
Net
Assets |
| YES Bank Ltd. Lock-In | 03/18/20 | 75,422 | $0.16 | $36,638 | $12,081 | 0.03 % |
D. Foreign Currency
The books and records of the Funds are maintained in U.S. dollars. Foreign currencies, investments and other assets and liabilities are translated into U.S. dollars at the exchange rates prevailing at the end of the period. Purchases and sales of investments and items of income and expense are translated on the respective dates of such transactions. Unrealized gains and losses on assets and liabilities, other than investments in securities, which result from changes in foreign currency exchange rates have been included in “Net change in unrealized appreciation (depreciation) on foreign currency translation” on the Statements of Operations. Unrealized gains and losses on investments in securities which result from changes in foreign exchange rates are included with fluctuations arising from changes in market price and are included in “Net change in unrealized appreciation (depreciation) on investments” on the Statements of Operations. Net realized foreign currency gains and losses include the effect of changes in exchange rates between trade date and settlement date on investment security transactions, foreign currency transactions and interest and dividends received and are included
Notes to Financial Statements (Continued)
First Trust Exchange-Traded AlphaDEX® Fund II
June 30, 2022 (Unaudited)
in “Net realized gain (loss) on foreign currency transactions” on the Statements of Operations. The portion of foreign currency gains and losses related to fluctuations in exchange rates between the initial purchase settlement date and subsequent sale trade date is included in “Net realized gain (loss) on investments” on the Statements of Operations.
E. Offsetting on the Statements of Assets and Liabilities
Offsetting assets and liabilities requires entities to disclose both gross and net information about instruments and transactions eligible for offset on the Statements of Assets and Liabilities and disclose instruments and transactions subject to master netting or similar agreements. These disclosure requirements are intended to help investors and other financial statement users better assess the effect or potential effect of offsetting arrangements on a Fund’s financial position. The transactions subject to offsetting disclosures are derivative instruments, repurchase agreements and reverse repurchase agreements, and securities borrowing and securities lending transactions.
This disclosure, if applicable, is included within each Fund’s Portfolio of Investments under the heading “Offsetting Assets and Liabilities.” For financial reporting purposes, the Funds do not offset financial assets and financial liabilities that are subject to master netting arrangements (“MNAs”) or similar agreements on the Statements of Assets and Liabilities. MNAs provide the right, in the event of default (including bankruptcy and insolvency), for the non-defaulting counterparty to liquidate the collateral and calculate the net exposure to the defaulting party or request additional collateral.
F. Securities Lending
The Funds may lend securities representing up to 33 1/3% of the value of their total assets to broker-dealers, banks and other institutions to generate additional income. When a Fund loans its portfolio securities, it will receive, at the inception of each loan, collateral equal to at least 102% (for domestic securities) or 105% (for international securities) of the market value of the loaned securities. The collateral amount is valued at the beginning of each business day and is compared to the market value of the loaned securities from the prior business day to determine if additional collateral is required. If additional collateral is required, a request is sent to the borrower. Securities lending involves the risk that the Fund may lose money because the borrower of the Fund’s loaned securities fails to return the securities in a timely manner or at all. The Fund could also lose money in the event of (i) a decline in the value of the collateral provided for the loaned securities, (ii) a decline in the value of any investments made with cash collateral or (iii) an increase in the value of the loaned securities if the borrower does not increase the collateral accordingly and the borrower fails to return the securities. These events could also trigger adverse tax consequences for the Funds.
Under the Funds’ Securities Lending Agency Agreement, the securities lending agent will generally bear the risk that a borrower may default on its obligation to return loaned securities. Brown Brothers Harriman & Co. (“BBH”) acts as the Funds’ securities lending agent and is responsible for executing the lending of the portfolio securities to creditworthy borrowers. The Funds, however, will be responsible for the risks associated with the investment of cash collateral. A Fund may lose money on its investment of cash collateral, which may affect its ability to repay the collateral to the borrower without the use of other Fund assets. Each Fund that engages in securities lending receives compensation (net of any rebate and securities lending agent fees) for lending its securities. Compensation can be in the form of fees received from the securities lending agent or dividends or interest earned from the investment of cash collateral. The fees received from the securities lending agent are accrued daily. The dividend and interest earned on the securities loaned is accounted for in the same manner as other dividend and interest income. At June 30, 2022, FPA, FEP, FJP, FDT, FEM, FDTS, FEMS, and FEUZ had securities in the securities lending program. During the six months ended June 30, 2022, FPA, FEP, FCA, FJP, FDT, FEM, FGM, FDTS, FEMS, and FEUZ participated in the securities lending program.
In the event of a default by a borrower with respect to any loan, BBH will exercise any and all remedies provided under the applicable borrower agreement to make the Funds whole. These remedies include purchasing replacement securities by applying the collateral held from the defaulting broker against the purchase cost of the replacement securities. If, despite such efforts by BBH to exercise these remedies, a Fund sustains losses as a result of a borrower’s default, BBH will indemnify the Fund by purchasing replacement securities at its own expense, or paying the Funds an amount equal to the market value of the replacement securities, subject to certain limitations which are set forth in detail in the Securities Lending Agency Agreement between the Trust on behalf of the Funds and BBH.
G. Repurchase Agreements
Repurchase agreements involve the purchase of securities subject to the seller’s agreement to repurchase the securities at a mutually agreed upon date and price, under the terms of a Master Repurchase Agreement (“MRA”). During the term of a repurchase agreement, the value of the underlying securities held as collateral on behalf of a Fund, including accrued interest, is required to exceed the value of the repurchase agreement, including accrued interest. The underlying securities for all repurchase agreements are held at the Funds’ custodian or designated sub-custodians under tri-party repurchase agreements.
MRAs govern transactions between a Fund and select counterparties. The MRAs maintain provisions for, among other things, initiation, income payments, events of default, and maintenance of collateral for repurchase agreements.
Repurchase agreements received for lending securities are collateralized by U.S. Treasury securities. The U.S. Treasury securities are held in a joint custody account at BBH on behalf of the Funds participating in the securities lending program. In the event the counterparty defaults on the repurchase agreement, the U.S. Treasury securities can either be maintained as part of a Fund’s portfolio or sold for cash. A Fund could suffer a loss to the extent that the proceeds from the sale of the underlying collateral held by the Fund are less than the repurchase price and the Fund’s costs associated with the delay and enforcement of the MRA.
Notes to Financial Statements (Continued)
First Trust Exchange-Traded AlphaDEX® Fund II
June 30, 2022 (Unaudited)
While the Funds may invest in repurchase agreements, any repurchase agreements held by the Funds during the six months ended June 30, 2022, were received as collateral for lending securities.
H. Dividends and Distributions to Shareholders
Dividends from net investment income, if any, are declared and paid quarterly by each Fund, or as the Board of Trustees may determine from time to time. Distributions of net realized capital gains earned by each Fund, if any, are distributed at least annually.
Distributions from net investment income and realized capital gains are determined in accordance with federal income tax regulations, which may differ from U.S. GAAP. Certain capital accounts in the financial statements are periodically adjusted for permanent differences in order to reflect their tax character. These permanent differences are primarily due to the varying treatment of income and gain/loss on portfolio securities held by the Funds and have no impact on net assets or NAV per share. Temporary differences, which arise from recognizing certain items of income, expense and gain/loss in different periods for financial statement and tax purposes, will reverse at some time in the future.
The tax character of distributions paid by each Fund during the fiscal year ended December 31, 2021, was as follows:
| | Distributions
paid from
Ordinary
Income | | Distributions
paid from
Capital
Gains | | Distributions
paid from
Return of
Capital |
First Trust Asia Pacific ex-Japan AlphaDEX® Fund
| $ 1,196,923 | | $ — | | $ — |
First Trust Europe AlphaDEX® Fund
| 18,281,993 | | — | | — |
First Trust Latin America AlphaDEX® Fund
| 400,317 | | — | | — |
First Trust Brazil AlphaDEX® Fund
| 502,366 | | — | | — |
First Trust China AlphaDEX® Fund
| 517,232 | | — | | — |
First Trust Japan AlphaDEX® Fund
| 875,402 | | — | | — |
First Trust Developed Markets ex-US AlphaDEX® Fund
| 15,144,146 | | — | | — |
First Trust Emerging Markets AlphaDEX® Fund
| 19,810,512 | | — | | — |
First Trust Germany AlphaDEX® Fund
| 1,500,281 | | — | | — |
First Trust United Kingdom AlphaDEX® Fund
| 1,744,928 | | — | | — |
First Trust India NIFTY 50 Equal Weight ETF
| 824,801 | | — | | — |
First Trust Switzerland AlphaDEX® Fund
| 1,875,162 | | — | | — |
First Trust Developed Markets ex-US Small Cap AlphaDEX® Fund
| 347,513 | | — | | — |
First Trust Emerging Markets Small Cap AlphaDEX® Fund
| 8,877,525 | | — | | — |
First Trust Eurozone AlphaDEX® ETF
| 1,009,147 | | — | | — |
Notes to Financial Statements (Continued)
First Trust Exchange-Traded AlphaDEX® Fund II
June 30, 2022 (Unaudited)
As of December 31, 2021, the components of distributable earnings on a tax basis for each Fund were as follows:
| | Undistributed
Ordinary
Income | | Accumulated
Capital and
Other
Gain (Loss) | | Net
Unrealized
Appreciation
(Depreciation) |
First Trust Asia Pacific ex-Japan AlphaDEX® Fund
| $ — | | $ (13,350,617) | | $ 1,090,445 |
First Trust Europe AlphaDEX® Fund
| 369,361 | | (167,272,385) | | 42,925,572 |
First Trust Latin America AlphaDEX® Fund
| 14,608 | | (41,263,993) | | 561,507 |
First Trust Brazil AlphaDEX® Fund
| 152,930 | | (26,534,866) | | (957,348) |
First Trust China AlphaDEX® Fund
| — | | (6,215,735) | | (699,707) |
First Trust Japan AlphaDEX® Fund
| 46,909 | | (50,630,028) | | (696,354) |
First Trust Developed Markets ex-US AlphaDEX® Fund
| — | | (263,841,660) | | 23,634,285 |
First Trust Emerging Markets AlphaDEX® Fund
| — | | (165,112,502) | | 22,425,391 |
First Trust Germany AlphaDEX® Fund
| 262,330 | | (25,100,818) | | 3,633,026 |
First Trust United Kingdom AlphaDEX® Fund
| 412,969 | | (37,928,201) | | 2,960,016 |
First Trust India NIFTY 50 Equal Weight ETF
| 1,508,243 | | — | | 8,198,337 |
First Trust Switzerland AlphaDEX® Fund
| — | | (29,141,507) | | 18,425,845 |
First Trust Developed Markets ex-US Small Cap AlphaDEX® Fund
| — | | (3,461,431) | | 227,903 |
First Trust Emerging Markets Small Cap AlphaDEX® Fund
| 248,950 | | (30,349,268) | | (2,651,185) |
First Trust Eurozone AlphaDEX® ETF
| 75,925 | | (15,268,300) | | (620,612) |
I. Income and Other Taxes
Each Fund intends to continue to qualify as a regulated investment company by complying with the requirements under Subchapter M of the Internal Revenue Code of 1986, as amended, which includes distributing substantially all of its net investment income and net realized gains to shareholders. Accordingly, no provision has been made for federal and state income taxes. However, due to the timing and amount of distributions, each Fund may be subject to an excise tax of 4% of the amount by which approximately 98% of each Fund’s taxable income exceeds the distributions from such taxable income for the calendar year.
Certain countries assess a capital gains tax on securities sold in their local markets. This tax is accrued as the securities in these foreign markets appreciate in value and is paid at the time of sale to the extent a capital gain is realized. Taxes accrued on securities in an unrealized appreciation position are included in “Net change in unrealized appreciation (depreciation) on deferred foreign capital gains tax” on the Statements of Operations. The capital gains tax paid on securities sold is included in “Net realized gain (loss) on foreign capital gains tax” on the Statements of Operations.
India’s Finance Bill, 2018 (“Finance Bill, 2018”) was enacted into law on March 29, 2018 and amongst other provisions, it introduced a long-term capital gains tax beginning April 1, 2018. Long-term capital gains on the sale of listed shares in excess of INR 0.1 million are taxed at the rate of 10% (plus applicable surcharge and cess (which is a type of tax)) subject to satisfaction of certain conditions. Long-term capital gains accruing as of January 31, 2018 are considered exempt due to a grandfather clause in the provision. The aforesaid exemption from long-term capital gains tax is available with respect to shares acquired between October 1, 2004 and March 31, 2018 only if on such acquisitions Securities Transaction Tax (“STT”) was chargeable. Certain exceptions in this regard, such as acquisition of shares in a public offer, bonus, rights issued, etc. for which the condition of chargeability of STT on acquisition is not applicable, have been notified.
In the case of the sale of listed shares held by a Fund for one year or less, the income is classified as short-term capital gains and is taxable at 15% (plus applicable surcharge and cess) provided the shares are sold on the stock exchange and subjected to STT. For above purposes, the applicable rate of surcharge is 2% or 5% (depending on the level of income of the Fund). The Finance Bill, 2018 increases the cess imposed on the sum of tax and surcharge from 3% to 4%. The cess 4% rate is applied to the capital gains tax, resulting in a higher effective rate of capital gains tax.
Where the sale of shares is outside the stock exchange and not subject to STT, the long-term capital gains are taxed at 10% (plus applicable surcharge and cess) and short-term capital gains are taxed at 30% (plus applicable surcharge and cess). The Finance Bill, 2018, approves the carry forward of long-term capital losses to be offset against long-term capital gains. Short-term losses can be netted against both short-term gains and long-term gains.
Until March 31, 2020, dividends received by a Fund from Indian companies were exempt from tax in India because Indian companies were required to pay dividend distribution tax. The Indian Finance Act, 2020 has amended the dividend taxation framework effective April 1, 2020 and accordingly dividends would now be taxable in the hands of the shareholders at 20%, plus applicable surcharge and cess. Subsequent to the Indian Finance Act, 2020, “The Taxation and Other Laws (Relaxation and Amendment of Certain Provisions) Bill, 2020” (the “Bill”) was enacted into law and is effective retroactively to April 1, 2020. The Bill caps the maximum surcharge at 15% of the tax on dividend income earned by the Fund. The highest effective tax rate proposed for non-corporate entities on dividends
Notes to Financial Statements (Continued)
First Trust Exchange-Traded AlphaDEX® Fund II
June 30, 2022 (Unaudited)
will be 23.92%. Note, the Fund will not obtain relief under the US-India tax treaty as the treaty rate of 25% is higher than the domestic rate. Any excess taxes withheld can be off-set against capital gains tax liability during the year or claimed as a refund in the annual tax return.
Please note that the above description is based on current provisions of Indian law, and any change or modification made by subsequent legislation, regulation, or administrative or judicial decision could increase the Indian tax liability of a Fund and thus reduce the return to a Fund’s shareholders. There can be no assurance that the Indian tax authorities and/or regulators will not take a position contrary to the views expressed herein. If the Indian tax authorities and/or regulators take a position contrary to the views expressed herein, adverse unpredictable consequences may follow.
The Funds are subject to accounting standards that establish a minimum threshold for recognizing, and a system for measuring, the benefits of a tax position taken or expected to be taken in a tax return. Taxable years ended 2018, 2019, 2020, and 2021 remain open to federal and state audit. As of June 30, 2022, management has evaluated the application of these standards to the Funds and has determined that no provision for income tax is required in the Funds’ financial statements for uncertain tax positions.
The Funds intend to utilize provisions of the federal income tax laws, which allow them to carry a realized capital loss forward indefinitely following the year of the loss and offset such loss against any future realized capital gains. The Funds are subject to certain limitations under U.S. tax rules on the use of capital loss carryforwards and net unrealized built-in losses. These limitations apply when there has been a 50% change in ownership. At December 31, 2021, for federal income tax purposes, each applicable Fund had a capital loss carryforward available that is shown in the table below, to the extent provided by regulations, to offset future capital gains.
| | Non-Expiring
Capital Loss
Carryforward |
First Trust Asia Pacific ex-Japan AlphaDEX® Fund
| $ 13,350,617 |
First Trust Europe AlphaDEX® Fund
| 167,272,385 |
First Trust Latin America AlphaDEX® Fund
| 41,263,993 |
First Trust Brazil AlphaDEX® Fund
| 26,534,866 |
First Trust China AlphaDEX® Fund
| 6,215,735 |
First Trust Japan AlphaDEX® Fund
| 50,630,028 |
First Trust Developed Markets ex-US AlphaDEX® Fund
| 263,841,660 |
First Trust Emerging Markets AlphaDEX® Fund
| 165,112,502 |
First Trust Germany AlphaDEX® Fund
| 25,100,818 |
First Trust United Kingdom AlphaDEX® Fund
| 37,928,201 |
First Trust India NIFTY 50 Equal Weight ETF
| — |
First Trust Switzerland AlphaDEX® Fund
| 29,141,507 |
First Trust Developed Markets ex-US Small Cap AlphaDEX® Fund
| 3,461,431 |
First Trust Emerging Markets Small Cap AlphaDEX® Fund
| 30,349,268 |
First Trust Eurozone AlphaDEX® ETF
| 15,268,300 |
Certain losses realized during the current fiscal year may be deferred and treated as occurring on the first day of the following fiscal year for federal income tax purposes. For the fiscal year ended December 31, 2021, the Funds did not defer any net ordinary losses.
Notes to Financial Statements (Continued)
First Trust Exchange-Traded AlphaDEX® Fund II
June 30, 2022 (Unaudited)
As of June 30, 2022, the aggregate cost, gross unrealized appreciation, gross unrealized depreciation, and net unrealized appreciation/(depreciation) on investments (including short positions and derivatives, if any) for federal income tax purposes were as follows:
| | Tax Cost | | Gross
Unrealized
Appreciation | | Gross
Unrealized
(Depreciation) | | Net Unrealized
Appreciation
(Depreciation) |
First Trust Asia Pacific ex-Japan AlphaDEX® Fund
| $ 15,139,752 | | $ 600,684 | | $ (2,427,897) | | $ (1,827,213) |
First Trust Europe AlphaDEX® Fund
| 376,715,486 | | 9,386,656 | | (73,565,630) | | (64,178,974) |
First Trust Latin America AlphaDEX® Fund
| 48,463,853 | | 446,511 | | (7,742,526) | | (7,296,015) |
First Trust Brazil AlphaDEX® Fund
| 5,172,124 | | 643,732 | | (461,689) | | 182,043 |
First Trust China AlphaDEX® Fund
| 9,576,333 | | 806,615 | | (1,610,011) | | (803,396) |
First Trust Japan AlphaDEX® Fund
| 38,057,009 | | 764,538 | | (7,015,159) | | (6,250,621) |
First Trust Developed Markets ex-US AlphaDEX® Fund
| 459,859,015 | | 20,726,471 | | (68,423,593) | | (47,697,122) |
First Trust Emerging Markets AlphaDEX® Fund
| 384,492,325 | | 23,256,191 | | (82,417,164) | | (59,160,973) |
First Trust Germany AlphaDEX® Fund
| 28,841,075 | | 50,515 | | (10,305,517) | | (10,255,002) |
First Trust United Kingdom AlphaDEX® Fund
| 88,264,146 | | 1,645,075 | | (22,233,232) | | (20,588,157) |
First Trust India NIFTY 50 Equal Weight ETF
| 46,854,745 | | 3,422,842 | | (3,121,686) | | 301,156 |
First Trust Switzerland AlphaDEX® Fund
| 46,544,300 | | 473,389 | | (8,532,576) | | (8,059,187) |
First Trust Developed Markets ex-US Small Cap AlphaDEX® Fund
| 10,961,356 | | 329,083 | | (2,034,243) | | (1,705,160) |
First Trust Emerging Markets Small Cap AlphaDEX® Fund
| 131,959,946 | | 6,872,605 | | (25,130,237) | | (18,257,632) |
First Trust Eurozone AlphaDEX® ETF
| 29,790,311 | | 303,863 | | (6,389,087) | | (6,085,224) |
J. Expenses
Expenses that are directly related to the Funds are charged to First Trust pursuant to the Investment Management Agreement, with the exception of the advisory fees, Rule 12b-1 distribution and service fees, if any, brokerage expenses, taxes, interest, acquired fund fees and expenses, and extraordinary expenses, which are paid by each respective Fund.
First Trust Portfolios L.P. (“FTP”) has entered into licensing agreements with Nasdaq (“Licensor”) for all the Funds except NFTY and with NSE Indices Limited (“NSE”) for NFTY (Nasdaq and NSE collectively, the “Licensors”). The respective license agreements allow for the use by First Trust of each Fund’s respective index and of certain trademarks and trade names of the Licensors. The Funds are sub-licensees to the applicable license agreements.
3. Investment Advisory Fee, Affiliated Transactions and Other Fee Arrangements
First Trust, the investment advisor to the Funds, is a limited partnership with one limited partner, Grace Partners of DuPage L.P., and one general partner, The Charger Corporation. The Charger Corporation is an Illinois corporation controlled by James A. Bowen, Chief Executive Officer of First Trust. First Trust is responsible for the selection and ongoing monitoring of the securities in each Fund’s portfolio, managing the Funds’ business affairs and providing certain administrative services necessary for the management of the Funds.
First Trust is paid an annual unitary management fee of 0.80% of each Fund’s average daily net assets. First Trust is responsible for the expenses of each Fund including the cost of transfer agency, custody, fund administration, licensing fees, legal, audit and other services, but excluding fee payments under the Investment Management Agreement, Rule 12b-1 distribution and service fees, if any, brokerage expenses, taxes, interest, acquired fund fees and expenses, and extraordinary expenses, which are paid by each respective Fund. First Trust also provides fund reporting services to the Funds for a flat annual fee in the amount of $9,250 per Fund, which is covered under the annual unitary management fee.
The Trust has multiple service agreements with BBH. Under the service agreements, BBH performs custodial, fund accounting, certain administrative services, and transfer agency services for the Funds. As custodian, BBH is responsible for custody of each Fund’s assets. As fund accountant and administrator, BBH is responsible for maintaining the books and records of each Fund’s securities and cash. As transfer agent, BBH is responsible for maintaining shareholder records for each Fund.
Each Trustee who is not an officer or employee of First Trust, any sub-advisor or any of their affiliates (“Independent Trustees”) is paid a fixed annual retainer that is allocated equally among each fund in the First Trust Fund Complex. Each Independent Trustee is also paid an annual per fund fee that varies based on whether the fund is a closed-end or other actively managed fund, a defined-outcome fund or an index fund.
Additionally, the Lead Independent Trustee and the Chairs of the Audit Committee, Nominating and Governance Committee and Valuation Committee are paid annual fees to serve in such capacities, with such compensation allocated pro rata among each fund in the First Trust Fund Complex based on net assets. Independent Trustees are reimbursed for travel and out-of-pocket expenses in
Notes to Financial Statements (Continued)
First Trust Exchange-Traded AlphaDEX® Fund II
June 30, 2022 (Unaudited)
connection with all meetings. The Lead Independent Trustee and Committee Chairs rotate every three years. The officers and “Interested” Trustee receive no compensation from the Trust for acting in such capacities.
4. Purchases and Sales of Securities
For the six months ended June 30, 2022, the cost of purchases and proceeds from sales of investment securities for each Fund, excluding short-term investments and in-kind transactions, were as follows:
| | Purchases | | Sales |
| First Trust Asia Pacific ex-Japan AlphaDEX® Fund | $ 6,906,086 | | $ 11,115,790 |
| First Trust Europe AlphaDEX® Fund | 220,220,224 | | 220,994,687 |
| First Trust Latin America AlphaDEX® Fund | 50,019,258 | | 23,769,207 |
| First Trust Brazil AlphaDEX® Fund | 7,552,764 | | 14,308,962 |
| First Trust China AlphaDEX® Fund | 5,252,370 | | 5,284,718 |
| First Trust Japan AlphaDEX® Fund | 15,101,485 | | 15,122,876 |
| First Trust Developed Markets ex-US AlphaDEX® Fund | 229,820,704 | | 216,602,471 |
| First Trust Emerging Markets AlphaDEX® Fund | 219,355,738 | | 229,042,547 |
| First Trust Germany AlphaDEX® Fund | 45,593,907 | | 45,799,337 |
| First Trust United Kingdom AlphaDEX® Fund | 35,292,131 | | 35,504,733 |
| First Trust India NIFTY 50 Equal Weight ETF | 6,911,259 | | 15,967,393 |
| First Trust Switzerland AlphaDEX® Fund | 28,852,089 | | 29,296,049 |
| First Trust Developed Markets ex-US Small Cap AlphaDEX® Fund | 6,495,712 | | 6,926,108 |
| First Trust Emerging Markets Small Cap AlphaDEX® Fund | 81,753,921 | | 87,216,086 |
| First Trust Eurozone AlphaDEX® ETF | 13,799,406 | | 13,999,981 |
| | | | |
For the six months ended June 30, 2022, the cost of in-kind purchases and proceeds from in-kind sales for each Fund were as follows:
| | Purchases | | Sales |
| First Trust Asia Pacific ex-Japan AlphaDEX® Fund | $ — | | $ 5,028,807 |
| First Trust Europe AlphaDEX® Fund | 12,346,168 | | 132,926,676 |
| First Trust Latin America AlphaDEX® Fund | 16,026,881 | | 602,086 |
| First Trust Brazil AlphaDEX® Fund | 18,879 | | 19,156 |
| First Trust China AlphaDEX® Fund | — | | — |
| First Trust Japan AlphaDEX® Fund | 2,155,303 | | — |
| First Trust Developed Markets ex-US AlphaDEX® Fund | 72,836,329 | | — |
| First Trust Emerging Markets AlphaDEX® Fund | 586,233 | | 16,778,344 |
| First Trust Germany AlphaDEX® Fund | 2,229,794 | | 61,829,964 |
| First Trust United Kingdom AlphaDEX® Fund | 4,137,739 | | 8,567,944 |
| First Trust India NIFTY 50 Equal Weight ETF | — | | — |
| First Trust Switzerland AlphaDEX® Fund | — | | 33,819,132 |
| First Trust Developed Markets ex-US Small Cap AlphaDEX® Fund | — | | 1,752,940 |
| First Trust Emerging Markets Small Cap AlphaDEX® Fund | — | | 6,379,567 |
| First Trust Eurozone AlphaDEX® ETF | — | | 43,407,765 |
5. Creations, Redemptions and Transaction Fees
Each Fund generally issues and redeems its shares in primary market transactions through a creation and redemption mechanism and does not sell or redeem individual shares. Instead, financial entities known as “Authorized Participants” have contractual arrangements with a Fund or one of the Fund’s service providers to purchase and redeem Fund shares directly with the Fund in large blocks of shares known as “Creation Units.” Prior to start of trading on every business day, a Fund publishes through the National Securities Clearing Corporation (“NSCC”) the “basket” of securities, cash or other assets that it will accept in exchange for a Creation Unit of the Fund’s shares. An Authorized Participant that wishes to effectuate a creation of a Fund’s shares deposits with the Fund the “basket” of securities, cash or other assets identified by the Fund that day, and then receives the Creation Unit of the Fund’s shares in return for those assets. After purchasing a Creation Unit, the Authorized Participant may continue to hold the Fund’s shares or sell them in the secondary market. The redemption process is the reverse of the purchase process: the authorized participant redeems a Creation Unit
Notes to Financial Statements (Continued)
First Trust Exchange-Traded AlphaDEX® Fund II
June 30, 2022 (Unaudited)
of a Fund’s shares for a basket of securities, cash or other assets. The combination of the creation and redemption process with secondary market trading in a Fund’s shares and underlying securities provides arbitrage opportunities that are designed to help keep the market price of a Fund’s shares at or close to the NAV per share of the Fund.
Each Fund imposes fees in connection with the purchase of Creation Units. These fees may vary based upon various facts-based circumstances, including, but not limited to, the composition of the securities included in the Creation Unit or the countries in which the transactions are settled. The price for each Creation Unit will equal the daily NAV per share of a Fund times the number of shares in a Creation Unit, plus the fees described above and, if applicable, any operational processing and brokerage costs, transfer fees, stamp taxes and part or all of the spread between the expected bid and offer side of the market related to the securities comprising the creation basket.
Each Fund also imposes fees in connection with the redemption of Creation Units. These fees may vary based upon various facts-based circumstances, including, but not limited to, the composition of the securities included in the Creation Unit or the countries in which the transactions are settled. The price received for each Creation Unit will equal the daily NAV per share of a Fund times the number of shares in a Creation Unit, minus the fees described above and, if applicable, any operational processing and brokerage costs, transfer fees, stamp taxes and part or all of the spread between the expected bid and offer side of the market related to the securities comprising the redemption basket. Investors who use the services of a broker or other such intermediary in addition to an Authorized Participant to effect a redemption of a Creation Unit may also be assessed an amount to cover the cost of such services. The redemption fee charged by a Fund will comply with Rule 22c-2 of the 1940 Act which limits redemption fees to no more than 2% of the value of the shares redeemed.
6. Distribution Plan
The Board of Trustees adopted a Distribution and Service Plan pursuant to Rule 12b-1 under the 1940 Act. In accordance with the Rule 12b-1 plan, each Fund is authorized to pay an amount up to 0.25% of its average daily net assets each year to reimburse FTP, the distributor of the Funds, for amounts expended to finance activities primarily intended to result in the sale of Creation Units or to provide investor services. FTP may also use this amount to compensate securities dealers or other persons that are Authorized Participants for providing distribution assistance, including broker-dealer and shareholder support and educational and promotional services.
No 12b-1 fees are currently paid by the Funds, and pursuant to a contractual arrangement, no 12b-1 fees will be paid any time before April 30, 2024.
7. Indemnification
The Trust, on behalf of the Funds, has a variety of indemnification obligations under contracts with its service providers. The Trust’s maximum exposure under these arrangements is unknown. However, the Trust has not had prior claims or losses pursuant to these contracts and expects the risk of loss to be remote.
8. Subsequent Events
Management has evaluated the impact of all subsequent events to the Funds through the date the financial statements were issued and has determined that there were no subsequent events requiring recognition or disclosure in the financial statements that have not already been disclosed.
Additional Information
First Trust Exchange-Traded AlphaDEX® Fund II
June 30, 2022 (Unaudited)
Proxy Voting Policies and Procedures
A description of the policies and procedures that the Trust uses to determine how to vote proxies and information on how each Fund voted proxies relating to portfolio investments during the most recent 12-month period ended June 30 is available (1) without charge, upon request, by calling (800) 988-5891; (2) on each Fund’s website at www.ftportfolios.com; and (3) on the Securities and Exchange Commission’s (“SEC”) website at www.sec.gov.
Portfolio Holdings
Each Fund files portfolio holdings information for each month in a fiscal quarter within 60 days after the end of the relevant fiscal quarter on Form N-PORT. Portfolio holdings information for the third month of each fiscal quarter will be publicly available on the SEC’s website at www.sec.gov. Each Fund’s complete schedule of portfolio holdings for the second and fourth quarters of each fiscal year is included in the semi-annual and annual reports to shareholders, respectively, and is filed with the SEC on Form N-CSR. The semi-annual and annual report for each Fund is available to investors within 60 days after the period to which it relates. Each Fund’s Forms N-PORT and Forms N-CSR are available on the SEC’s website listed above.
Risk Considerations
Risks are inherent in all investing. Certain general risks that may be applicable to a Fund are identified below, but not all of the material risks relevant to each Fund are included in this report and not all of the risks below apply to each Fund. The material risks of investing in each Fund are spelled out in its prospectus, statement of additional information and other regulatory filings. Before investing, you should consider each Fund’s investment objective, risks, charges and expenses, and read each Fund’s prospectus and statement of additional information carefully. You can download each Fund’s prospectus at www.ftportfolios.com or contact First Trust Portfolios L.P. at (800) 621-1675 to request a prospectus, which contains this and other information about each Fund.
Concentration Risk. To the extent that a fund is able to invest a significant percentage of its assets in a single asset class or the securities of issuers within the same country, state, region, industry or sector, an adverse economic, business or political development may affect the value of the fund’s investments more than if the fund were more broadly diversified. A fund that tracks an index will be concentrated to the extent the fund’s corresponding index is concentrated. A concentration makes a fund more susceptible to any single occurrence and may subject the fund to greater market risk than a fund that is more broadly diversified.
Credit Risk. Credit risk is the risk that an issuer of a security will be unable or unwilling to make dividend, interest and/or principal payments when due and the related risk that the value of a security may decline because of concerns about the issuer’s ability to make such payments.
Cyber Security Risk. The funds are susceptible to potential operational risks through breaches in cyber security. A breach in cyber security refers to both intentional and unintentional events that may cause a fund to lose proprietary information, suffer data corruption or lose operational capacity. Such events could cause a fund to incur regulatory penalties, reputational damage, additional compliance costs associated with corrective measures and/or financial loss. In addition, cyber security breaches of a fund’s third-party service providers, such as its administrator, transfer agent, custodian, or sub-advisor, as applicable, or issuers in which the fund invests, can also subject a fund to many of the same risks associated with direct cyber security breaches.
Defined Outcome Funds Risk. To the extent a fund’s investment strategy is designed to deliver returns tied to the price performance of an underlying ETF, an investor may not realize the returns the fund seeks to achieve if that investor does not hold shares for the entire target outcome period. In the event an investor purchases shares after the first day of the target outcome period or sells shares prior to the end of the target outcome period, the buffer that the fund seeks to provide against a decline in the value of the underlying ETF may not be available, the enhanced returns that the fund seeks to provide (if any) may not be available and the investor may not participate in a gain in the value of the underlying ETF up to the cap for the investor’s investment period. Additionally, the fund will not participate in gains of the underlying ETF above the cap and a shareholder may lose their entire investment. If the fund seeks enhanced returns, there are certain time periods when the value of the fund may fall faster than the value of the underlying ETF, and it is very unlikely that, on any given day during which the underlying ETF share price increases in value, the fund’s share price will increase at the same rate as the enhanced returns sought by the fund, which is designed for an entire target outcome period. Trading flexible exchange options involves risks different from, or possibly greater than, the risks associated with investing directly in securities, such as less liquidity and correlation and valuation risks. A fund may experience substantial downside from specific flexible exchange option positions and certain positions may expire worthless.
Derivatives Risk. To the extent a fund uses derivative instruments such as futures contracts, options contracts and swaps, the fund may experience losses because of adverse movements in the price or value of the underlying asset, index or rate, which may be magnified
Additional Information (Continued)
First Trust Exchange-Traded AlphaDEX® Fund II
June 30, 2022 (Unaudited)
by certain features of the derivative. These risks are heightened when a fund’s portfolio managers use derivatives to enhance the fund’s return or as a substitute for a position or security, rather than solely to hedge (or offset) the risk of a position or security held by the fund.
Equity Securities Risk. To the extent a fund invests in equity securities, the value of the fund’s shares will fluctuate with changes in the value of the equity securities. Equity securities prices fluctuate for several reasons, including changes in investors’ perceptions of the financial condition of an issuer or the general condition of the relevant stock market, such as market volatility, or when political or economic events affecting the issuers occur. In addition, common stock prices may be particularly sensitive to rising interest rates, as the cost of capital rises and borrowing costs increase. Equity securities may decline significantly in price over short or extended periods of time, and such declines may occur in the equity market as a whole, or they may occur in only a particular country, company, industry or sector of the market.
ETF Risk. The shares of an ETF trade like common stock and represent an interest in a portfolio of securities. The risks of owning an ETF generally reflect the risks of owning the underlying securities, although lack of liquidity in an ETF could result in it being more volatile and ETFs have management fees that increase their costs. Shares of an ETF trade on an exchange at market prices rather than net asset value, which may cause the shares to trade at a price greater than net asset value (premium) or less than net asset value (discount). In times of market stress, decisions by market makers to reduce or step away from their role of providing a market for an ETF’s shares, or decisions by an ETF’s authorized participants that they are unable or unwilling to proceed with creation and/or redemption orders of an ETF’s shares, could result in shares of the ETF trading at a discount to net asset value and in greater than normal intraday bid-ask spreads.
Fixed Income Securities Risk. To the extent a fund invests in fixed income securities, the fund will be subject to credit risk, income risk, interest rate risk, liquidity risk and prepayment risk. Income risk is the risk that income from a fund’s fixed income investments could decline during periods of falling interest rates. Interest rate risk is the risk that the value of a fund’s fixed income securities will decline because of rising interest rates. Liquidity risk is the risk that a security cannot be purchased or sold at the time desired, or cannot be purchased or sold without adversely affecting the price. Prepayment risk is the risk that the securities will be redeemed or prepaid by the issuer, resulting in lower interest payments received by the fund. In addition to these risks, high yield securities, or “junk” bonds, are subject to greater market fluctuations and risk of loss than securities with higher ratings, and the market for high yield securities is generally smaller and less liquid than that for investment grade securities.
Index or Model Constituent Risk. Certain funds may be a constituent of one or more indices or ETF models. As a result, such a fund may be included in one or more index-tracking exchange-traded funds or mutual funds. Being a component security of such a vehicle could greatly affect the trading activity involving a fund, the size of the fund and the market volatility of the fund. Inclusion in an index could increase demand for the fund and removal from an index could result in outsized selling activity in a relatively short period of time. As a result, a fund’s net asset value could be negatively impacted and the fund’s market price may be significantly below its net asset value during certain periods. In addition, index rebalances may potentially result in increased trading activity in a fund’s shares.
Index Provider Risk. To the extent a fund seeks to track an index, it is subject to Index Provider Risk. There is no assurance that the Index Provider will compile the Index accurately, or that the Index will be determined, maintained, constructed, reconstituted, rebalanced, composed, calculated or disseminated accurately. To correct any such error, the Index Provider may carry out an unscheduled rebalance or other modification of the Index constituents or weightings, which may increase the fund’s costs. The Index Provider does not provide any representation or warranty in relation to the quality, accuracy or completeness of data in the Index, and it does not guarantee that the Index will be calculated in accordance with its stated methodology. Losses or costs associated with any Index Provider errors generally will be borne by the fund and its shareholders.
Investment Companies Risk. To the extent a fund invests in the securities of other investment vehicles, the fund will incur additional fees and expenses that would not be present in a direct investment in those investment vehicles. Furthermore, the fund’s investment performance and risks are directly related to the investment performance and risks of the investment vehicles in which the fund invests.
LIBOR Risk. To the extent a fund invests in floating or variable rate obligations that use the London Interbank Offered Rate (“LIBOR”) as a reference interest rate, it is subject to LIBOR Risk. The United Kingdom’s Financial Conduct Authority, which regulates LIBOR has ceased making LIBOR available as a reference rate over a phase-out period that began December 31, 2021. There is no assurance that any alternative reference rate, including the Secured Overnight Financing Rate (“SOFR”) will be similar to or produce the same value or economic equivalence as LIBOR or that instruments using an alternative rate will have the same volume or liquidity. The unavailability or replacement of LIBOR may affect the value, liquidity or return on certain fund investments and may result in costs incurred in connection with closing out positions and entering into new trades. Any potential effects of the transition away from LIBOR on the fund or on certain instruments in which the fund invests can be difficult to ascertain, and they may vary depending on a variety of factors, and they could result in losses to the fund.
Additional Information (Continued)
First Trust Exchange-Traded AlphaDEX® Fund II
June 30, 2022 (Unaudited)
Management Risk. To the extent that a fund is actively managed, it is subject to management risk. In managing an actively-managed fund’s investment portfolio, the fund’s portfolio managers will apply investment techniques and risk analyses that may not have the desired result. There can be no guarantee that a fund will meet its investment objective.
Market Risk. Securities held by a fund, as well as shares of a fund itself, are subject to market fluctuations caused by factors such as general economic conditions, political events, regulatory or market developments, changes in interest rates and perceived trends in securities prices. Shares of a fund could decline in value or underperform other investments as a result of the risk of loss associated with these market fluctuations. In addition, local, regional or global events such as war, acts of terrorism, spread of infectious diseases or other public health issues, recessions, or other events could have a significant negative impact on a fund and its investments. Such events may affect certain geographic regions, countries, sectors and industries more significantly than others. In February 2022, Russia invaded Ukraine which has caused and could continue to cause significant market disruptions and volatility within the markets in Russia, Europe, and the United States. The hostilities and sanctions resulting from those hostilities could have a significant impact on certain fund investments as well as fund performance. The outbreak of the respiratory disease designated as COVID-19 in December 2019 has caused significant volatility and declines in global financial markets, which have caused losses for investors. While the development of vaccines has slowed the spread of the virus and allowed for the resumption of “reasonably” normal business activity in the United States, many countries continue to impose lockdown measures in an attempt to slow the spread. Additionally, there is no guarantee that vaccines will be effective against emerging variants of the disease.
Non-U.S. Securities Risk. To the extent a fund invests in non-U.S. securities, it is subject to additional risks not associated with securities of domestic issuers. Non-U.S. securities are subject to higher volatility than securities of domestic issuers due to: possible adverse political, social or economic developments; restrictions on foreign investment or exchange of securities; capital controls; lack of liquidity; currency exchange rates; excessive taxation; government seizure of assets; the imposition of sanctions by foreign governments; different legal or accounting standards; and less government supervision and regulation of exchanges in foreign countries. Investments in non-U.S. securities may involve higher costs than investments in U.S. securities, including higher transaction and custody costs, as well as additional taxes imposed by non-U.S. governments. These risks may be heightened for securities of companies located, or with significant operations, in emerging market countries.
Operational Risk. Each fund is subject to risks arising from various operational factors, including, but not limited to, human error, processing and communication errors, errors of a fund’s service providers, counterparties or other third-parties, failed or inadequate processes and technology or systems failures. Each fund relies on third-parties for a range of services, including custody. Any delay or failure relating to engaging or maintaining such service providers may affect a fund’s ability to meet its investment objective. Although the funds and the funds’ investment advisor seek to reduce these operational risks through controls and procedures, there is no way to completely protect against such risks.
Passive Investment Risk. To the extent a fund seeks to track an index, the fund will invest in the securities included in, or representative of, the index regardless of their investment merit. A fund generally will not attempt to take defensive positions in declining markets.
Variable Interest Entities Risk. In order to gain exposure to certain Chinese companies that are included in a Fund’s Index but are unavailable to direct investment by foreign investors, certain Funds invest significantly in non-Chinese shell companies that have created structures known as variable interest entities (“VIEs”) in order to gain exposure to such Chinese companies. In China, direct ownership of companies in certain sectors by foreign individuals and entities is prohibited. In order to allow for foreign investment in these businesses, many Chinese companies have created VIE structures to enable indirect foreign ownership. In such an arrangement, a Chinese operating company typically establishes an offshore shell company in another jurisdiction, such as the Cayman Islands. That shell company enters into service and other contracts with the Chinese issuer or operating company to obtain economic exposure to the Chinese company, then issues shares on an exchange outside of mainland China, and U.S. investors hold stock in the non-Chinese shell company rather than directly in the Chinese issuer or operating company. This arrangement allows U.S. investors, such as the Fund, to obtain economic exposure to the Chinese issuer or operating company through contractual means rather than through formal equity ownership. Because neither the shell company nor the Fund owns actual equity interests in the Chinese operating company, they do not have the voting rights or other types of control that an equity holder would expect to benefit from. Although VIEs are a longstanding industry practice and well known to officials and regulators in China, VIEs are not formally recognized under Chinese law. Intervention by the Chinese government with respect to VIEs could significantly affect the Chinese company’s performance and the enforceability of the VIE’s contractual arrangements that establish the links between the Chinese company and the shell company in which the Fund invests. This could considerably impact the financial condition of the shell company in which the Fund invests by limiting its ability to consolidate the financial results of the Chinese operating company into its own financial statements, as well as make the value of the shares held by the Fund effectively worthless. Further, if Chinese officials prohibit the existence of VIEs, the market value of the Fund’s associated holdings would likely suffer significant, and possibly permanent effects, which could negatively
Additional Information (Continued)
First Trust Exchange-Traded AlphaDEX® Fund II
June 30, 2022 (Unaudited)
impact the Fund’s net asset value and could result in substantial losses. Further, it is uncertain whether any new laws, rules or regulations relating to VIE structures will be adopted or, if adopted, what impact they would have on the value of the Fund’s shares.
VIEs are also subject to the investment risks associated with the underlying Chinese issuer or operating company. Chinese companies are not subject to the same degree of regulatory requirements or accounting standards and oversight as companies in more developed countries. As a result, information about the Chinese securities and VIEs in which the Fund invests may be less reliable and incomplete. There also may be significant obstacles to obtaining information necessary for investigations into or litigation against Chinese companies and VIEs, and shareholders may have limited legal remedies, which could negatively impact the Fund. Additionally, U.S.-listed VIEs may be delisted if they do not meet U.S. accounting standards and auditor oversight requirements. Delisting would significantly decrease the liquidity and value of the securities, decrease the ability of the Fund to invest in such securities and may increase the cost of the Fund if required to seek alternative markets in which to invest in such securities.
| NOT FDIC INSURED | NOT BANK GUARANTEED | MAY LOSE VALUE |
Advisory Agreements
Board Considerations Regarding Approval of Continuation of Investment Management Agreements
The Board of Trustees of First Trust Exchange-Traded AlphaDEX® Fund II (the “Trust”), including the Independent Trustees, unanimously approved the continuation of the Investment Management Agreements (as applicable to a specific Fund, the “Agreement” and collectively, the “Agreements”) with First Trust Advisors L.P. (the “Advisor”) on behalf of the following fifteen series of the Trust (each a “Fund” and collectively, the “Funds”):
First Trust Developed Markets ex-US AlphaDEX® Fund (FDT)
First Trust Emerging Markets AlphaDEX® Fund (FEM)
First Trust Asia Pacific ex-Japan AlphaDEX® Fund (FPA)
First Trust Europe AlphaDEX® Fund (FEP)
First Trust Latin America AlphaDEX® Fund (FLN)
First Trust Brazil AlphaDEX® Fund (FBZ)
First Trust China AlphaDEX® Fund (FCA)
First Trust Japan AlphaDEX® Fund (FJP)
First Trust Germany AlphaDEX® Fund (FGM)
First Trust United Kingdom AlphaDEX® Fund (FKU)
First Trust India NIFTY 50 Equal Weight ETF (NFTY)
First Trust Switzerland AlphaDEX® Fund (FSZ)
First Trust Developed Markets ex-US Small Cap AlphaDEX® Fund (FDTS)
First Trust Emerging Markets Small Cap AlphaDEX® Fund (FEMS)
First Trust Eurozone AlphaDEX® ETF (FEUZ)
The Board approved the continuation of the Agreement for each Fund for a one-year period ending June 30, 2023 at a meeting held on June 12–13, 2022. The Board determined for each Fund that the continuation of the Agreement is in the best interests of the Fund in light of the nature, extent and quality of the services provided and such other matters as the Board considered to be relevant in the exercise of its business judgment.
To reach this determination for each Fund, the Board considered its duties under the Investment Company Act of 1940, as amended (the “1940 Act”), as well as under the general principles of state law, in reviewing and approving advisory contracts; the requirements of the 1940 Act in such matters; the fiduciary duty of investment advisors with respect to advisory agreements and compensation; the standards used by courts in determining whether investment company boards have fulfilled their duties; and the factors to be considered by the Board in voting on such agreements. At meetings held on April 18, 2022 and June 12–13, 2022, the Board, including the Independent Trustees, reviewed materials provided by the Advisor responding to requests for information from counsel to the Independent Trustees, submitted on behalf of the Independent Trustees, that, among other things, outlined: the services provided by the Advisor to each Fund (including the relevant personnel responsible for these services and their experience); the unitary fee rate payable by each Fund as compared to fees charged to a peer group of funds (the “Expense Group”) and a broad peer universe of funds (the “Expense Universe”), each assembled by Broadridge Financial Solutions, Inc. (“Broadridge”), an independent source, and as compared to fees charged to other clients of the Advisor, including other exchange-traded funds (“ETFs”) managed by the Advisor; the expense ratio of each Fund as compared to expense ratios of the funds in the Fund’s Expense Group and Expense Universe; performance information for each Fund, including comparisons of each Fund’s performance to that of one or more relevant benchmark indexes and to that of a performance group of funds and a broad performance universe of funds (the “Performance Universe”), each
Additional Information (Continued)
First Trust Exchange-Traded AlphaDEX® Fund II
June 30, 2022 (Unaudited)
assembled by Broadridge; the nature of expenses incurred in providing services to each Fund and the potential for the Advisor to realize economies of scale, if any; profitability and other financial data for the Advisor; any indirect benefits to the Advisor and its affiliate, First Trust Portfolios L.P. (“FTP”); and information on the Advisor’s compliance program. The Board reviewed initial materials with the Advisor at the meeting held on April 18, 2022, prior to which the Independent Trustees and their counsel met separately to discuss the information provided by the Advisor. Following the April meeting, counsel to the Independent Trustees, on behalf of the Independent Trustees, requested certain clarifications and supplements to the materials provided, and the information provided in response to those requests was considered at an executive session of the Independent Trustees and their counsel held prior to the June 12–13, 2022 meeting, as well as at the June meeting. The Board applied its business judgment to determine whether the arrangement between the Trust and the Advisor continues to be a reasonable business arrangement from each Fund’s perspective. The Board determined that, given the totality of the information provided with respect to the Agreements, the Board had received sufficient information to renew the Agreements. The Board considered that shareholders chose to invest or remain invested in a Fund knowing that the Advisor manages the Fund and knowing the Fund’s unitary fee.
In reviewing the Agreement for each Fund, the Board considered the nature, extent and quality of the services provided by the Advisor under the Agreement. The Board considered that the Advisor is responsible for the overall management and administration of the Trust and each Fund and reviewed all of the services provided by the Advisor to the Funds, as well as the background and experience of the persons responsible for such services. In reviewing the services provided, the Board noted the compliance program that had been developed by the Advisor and considered that it includes a robust program for monitoring the Advisor’s and each Fund’s compliance with the 1940 Act, as well as each Fund’s compliance with its investment objective, policies and restrictions. The Board also considered a report from the Advisor with respect to its risk management functions related to the operation of the Funds. Finally, as part of the Board’s consideration of the Advisor’s services, the Advisor, in its written materials and at the April 18, 2022 meeting, described to the Board the scope of its ongoing investment in additional personnel and infrastructure to maintain and improve the quality of services provided to the Funds and the other funds in the First Trust Fund Complex. In light of the information presented and the considerations made, the Board concluded that the nature, extent and quality of the services provided to the Trust and each Fund by the Advisor under the Agreements have been and are expected to remain satisfactory and that the Advisor has managed each Fund consistent with its investment objective, policies and restrictions.
The Board considered the unitary fee rate payable by each Fund under the applicable Agreement for the services provided. The Board considered that as part of the unitary fee the Advisor is responsible for each Fund’s expenses, including the cost of transfer agency, custody, fund administration, legal, audit and other services and license fees, if any, but excluding the fee payment under the applicable Agreement and interest, taxes, brokerage commissions and other expenses connected with the execution of portfolio transactions, distribution and service fees pursuant to a Rule 12b-1 plan, if any, and extraordinary expenses, if any. The Board received and reviewed information showing the fee rates and expense ratios of the peer funds in the Expense Groups, as well as advisory and unitary fee rates charged by the Advisor to other fund (including ETFs) and non-fund clients, as applicable. Because each Fund pays a unitary fee, the Board determined that expense ratios were the most relevant comparative data point. Based on the information provided, the Board noted that the unitary fee rate for NFTY was below the median total (net) expense ratio of the peer funds in its Expense Group and that the unitary fee rate for each other Fund was above the median total (net) expense ratio of the peer funds in its respective Expense Group. With respect to the Expense Groups, the Board, at the April 18, 2022 meeting, discussed with Broadridge its methodology for assembling peer groups and discussed with the Advisor limitations in creating peer groups for index ETFs, including differences in underlying indexes and index-tracking methodologies that can result in greater management complexities across seemingly comparable ETFs, and different business models that may affect the pricing of services among ETF sponsors. The Board took these limitations and differences into account in considering the peer data. With respect to fees charged to other non-ETF clients, the Board considered differences between the Funds and other non-ETF clients that limited their comparability. In considering the unitary fee rates overall, the Board also considered the Advisor’s statement that it seeks to meet investor needs through innovative and value-added investment solutions and the Advisor’s demonstrated long-term commitment to each Fund and the other funds in the First Trust Fund Complex.
The Board considered performance information for each Fund. The Board noted the process it has established for monitoring each Fund’s performance and portfolio risk on an ongoing basis, which includes quarterly performance reporting from the Advisor for the Funds. The Board determined that this process continues to be effective for reviewing each Fund’s performance. The Board received and reviewed information for periods ended December 31, 2021 regarding the performance of each Fund’s underlying index, the correlation between each Fund’s performance and that of its underlying index, each Fund’s tracking difference and each Fund’s excess return as compared to its benchmark index. With respect to NFTY, the Board noted that during 2018, shareholders of the Fund approved changes to the Fund’s investment objective and, effective April 17, 2018, the Fund changed its name and ticker symbol and began tracking the NIFTY 50 Equal Weight Index, and that the performance information included a blend of the old and new indexes. At the April 18, 2022 meeting, the Advisor discussed with the Board factors that impact NFTY’s correlation and tracking difference. With respect to each Fund other than FEUZ, the Board noted that during 2015, each such Fund changed its underlying index to an index developed and maintained by Nasdaq, Inc. using the AlphaDEX® stock selection methodology, and that the performance
Additional Information (Continued)
First Trust Exchange-Traded AlphaDEX® Fund II
June 30, 2022 (Unaudited)
information included a blend of the old and new indexes. The Board considered the Advisor’s explanations of how the AlphaDEX® stock selection methodology impacts Fund performance in various market environments, and the Advisor’s statement that AlphaDEX® is designed to provide long-term outperformance. Based on the information provided and its ongoing review of performance, the Board concluded that each Fund was correlated to its underlying index and that the tracking difference for each Fund was within a reasonable range. In addition, the Board reviewed data prepared by Broadridge comparing each Fund’s performance to that of its respective Performance Universe and to that of a broad-based benchmark index, but given each Fund’s objective of seeking investment results that correspond generally to the performance of its underlying index, the Board placed more emphasis on its review of correlation and tracking difference.
On the basis of all the information provided on the unitary fee and performance of each Fund and the ongoing oversight by the Board, the Board concluded that the unitary fee for each Fund continues to be reasonable and appropriate in light of the nature, extent and quality of the services provided by the Advisor to each Fund under the Agreements.
The Board considered information and discussed with the Advisor whether there were any economies of scale in connection with providing advisory services to the Funds and noted the Advisor’s statement that it believes that its expenses relating to providing advisory services to the Funds will likely increase during the next twelve months as the Advisor continues to build infrastructure and add new staff. The Board noted that any reduction in fixed costs associated with the management of the Funds would benefit the Advisor, but that the unitary fee structure provides a level of certainty in expenses for the Funds. The Board considered the revenues and allocated costs (including the allocation methodology) of the Advisor in serving as investment advisor to each Fund for the twelve months ended December 31, 2021 and the estimated profitability level for each Fund calculated by the Advisor based on such data, as well as complex-wide and product-line profitability data, for the same period. The Board noted the inherent limitations in the profitability analysis and concluded that, based on the information provided, the Advisor’s profitability level for each Fund was not unreasonable. In addition, the Board considered indirect benefits described by the Advisor that may be realized from its relationship with the Funds. The Board considered that the Advisor had identified as an indirect benefit to the Advisor and FTP their exposure to investors and brokers who, absent their exposure to the Funds, may have had no dealings with the Advisor or FTP, and noted that the Advisor does not utilize soft dollars in connection with the Funds. The Board also considered the Advisor’s compensation for fund reporting services provided to each Fund pursuant to a separate Fund Reporting Services Agreement, which is paid from the unitary fee. The Board concluded that the character and amount of potential indirect benefits to the Advisor were not unreasonable.
Based on all of the information considered and the conclusions reached, the Board, including the Independent Trustees, unanimously determined that the terms of the Agreements continue to be fair and reasonable and that the continuation of the Agreements is in the best interests of each Fund. No single factor was determinative in the Board’s analysis.
Liquidity Risk Management Program
In accordance with Rule 22e-4 under the Investment Company Act of 1940, as amended (the “1940 Act”), the Funds and each other fund in the First Trust Fund Complex, other than the closed-end funds, have adopted and implemented a liquidity risk management program (the “Program”) reasonably designed to assess and manage the funds’ liquidity risk, i.e., the risk that a fund could not meet requests to redeem shares issued by the fund without significant dilution of remaining investors’ interests in the fund. The Board of Trustees of the First Trust Funds has appointed First Trust Advisors L.P. (the “Advisor”) as the person designated to administer the Program, and in this capacity the Advisor performs its duties primarily through the activities and efforts of the First Trust Liquidity Committee (the “Liquidity Committee”).
Pursuant to the Program, the Liquidity Committee classifies the liquidity of each fund’s portfolio investments into one of the four liquidity categories specified by Rule 22e-4: highly liquid investments, moderately liquid investments, less liquid investments and illiquid investments. The Liquidity Committee determines certain of the inputs for this classification process, including reasonably anticipated trade sizes and significant investor dilution thresholds. The Liquidity Committee also determines and periodically reviews a highly liquid investment minimum for certain funds, monitors the funds’ holdings of assets classified as illiquid investments to seek to ensure they do not exceed 15% of a fund’s net assets and establishes policies and procedures regarding redemptions in kind.
At the April 18, 2022 meeting of the Board of Trustees, as required by Rule 22e-4 and the Program, the Advisor provided the Board with a written report prepared by the Advisor that addressed the operation of the Program during the period from March 16, 2021 through the Liquidity Committee’s annual meeting held on March 17, 2022 and assessed the Program’s adequacy and effectiveness of implementation during this period, including the operation of the highly liquid investment minimum for each fund that is required under the Program to have one, and any material changes to the Program. Note that because the Funds primarily hold assets that are highly liquid investments, the Funds have not adopted any highly liquid investment minimums.
As stated in the written report, during the review period, no fund breached the 15% limitation on illiquid investments, no fund with a highly liquid investment minimum breached that minimum and no fund filed a Form N-LIQUID. The Advisor concluded that each
Additional Information (Continued)
First Trust Exchange-Traded AlphaDEX® Fund II
June 30, 2022 (Unaudited)
fund’s investment strategy is appropriate for an open-end fund; that the Program operated effectively in all material respects during the review period; and that the Program is reasonably designed to assess and manage the liquidity risk of each fund and to maintain compliance with Rule 22e-4.
This page intentionally left blank
First Trust Exchange-Traded AlphaDEX® Fund II
INVESTMENT ADVISOR
First Trust Advisors L.P.
120 East Liberty Drive, Suite 400
Wheaton, IL 60187
ADMINISTRATOR, CUSTODIAN,
FUND ACCOUNTANT &
TRANSFER AGENT
Brown Brothers Harriman & Co.
50 Post Office Square
Boston, MA 02110
INDEPENDENT REGISTERED
PUBLIC ACCOUNTING FIRM
Deloitte & Touche LLP
111 S. Wacker Drive
Chicago, IL 60606
LEGAL COUNSEL
Chapman and Cutler LLP
320 South Canal Street
Chicago, IL 60606
Item 2. Code of Ethics.
Not applicable.
Item 3. Audit Committee Financial Expert.
Not applicable.
Item 4. Principal Accountant Fees and Services.
Not applicable.
Item 5. Audit Committee of Listed Registrants.
Not applicable.
Items 6. Schedule of Investments.
| (a) | | Schedules of Investments in securities of unaffiliated issuers as of the close of the reporting period are included as part of the report to shareholders filed under Item 1 of this form. |
Item 7. Disclosure of Proxy Voting Policies and Procedures for Closed-End Management Investment Companies.
Not applicable.
Item 8. Portfolio Managers of Closed-End Management Investment Companies.
Not applicable.
Item 9. Purchases of Equity Securities by Closed-End Management Investment Company and Affiliated Purchasers.
Not applicable.
Item 10. Submission of Matters to a Vote of Security Holders.
There have been no material changes to the procedures by which the shareholders may recommend nominees to the registrant’s board of directors, where those changes were implemented after the registrant last provided disclosure in response to the requirements of Item 407 (c) (2) (iv) of Regulation S-K (17 CFR 229.407) (as required by Item 22 (b) (15) of Schedule 14A (17 CFR 240.14a-101)), or this Item.
Item 11. Controls and Procedures.
| (a) | | The registrant’s principal executive and principal financial officers, or persons performing similar functions, have concluded that the registrant's disclosure controls and procedures (as defined in Rule 30a-3(c) under the Investment Company Act of 1940, as amended (the "1940 Act") (17 CFR 270.30a-3 (c))) are effective, as of a date within 90 days of the filing date of the report that includes the disclosure required by this paragraph, based on their evaluation of these controls and procedures required by Rule 30a-3(b) under the 1940 Act (17 CFR 270.30a-3(b)) and Rules 13a-15(b) or 15d-15(b) under the Securities Exchange Act of 1934, as amended (17 CFR 240.13a-15(b) or 240.15d-15 (b)). |
| (b) | | There were no changes in the registrant's internal control over financial reporting (as defined in Rule 30a-3(d) under the 1940 Act (17 CFR 270.30a-3(d)) that occurred during the period covered by this report that have materially affected, or are reasonably likely to materially affect, the registrant's internal control over financial reporting. |
Item 12. Disclosure of Securities Lending Activities for Closed-End Management Investment Companies.
Item 13. Exhibits.
SIGNATURES
Pursuant to the requirements of the Securities Exchange Act of 1934 and the Investment Company Act of 1940, the registrant has duly caused this report to be signed on its behalf by the undersigned, thereunto duly authorized.
| (registrant) | | First Trust Exchange-Traded AlphaDEX® Fund II |
| By (Signature and Title)* | | /s/ James M. Dykas |
| | | James M. Dykas, President and Chief Executive Officer
(principal executive officer) |
Pursuant to the requirements of the Securities Exchange Act of 1934 and the Investment Company Act of 1940, this report has been signed below by the following persons on behalf of the registrant and in the capacities and on the dates indicated.
| By (Signature and Title)* | | /s/ James M. Dykas |
| | | James M. Dykas, President and Chief Executive Officer
(principal executive officer) |
| By (Signature and Title)* | | /s/ Donald P. Swade |
| | | Donald P. Swade, Treasurer, Chief Financial Officer
and Chief Accounting Officer
(principal financial officer) |
* Print the name and title of each signing officer under his or her signature.


