| LA ARENA PROJECT |
| FORM 43-101F1 TECHNICAL REPORT |
DATE AND SIGNATURES PAGE
The effective date of this Technical Report is January 1, 2018. The issue date of this report is February 20, 2018. See Appendix A, Feasibility Study Contributors and Professional Qualifications, for certificates of qualified persons. These certificates are considered the date and signature of this report and the effective date of this report in accordance with Form 43-101F1.
 | i |
| LA ARENA PROJECT |
| FORM 43-101F1 TECHNICAL REPORT |
| LA ARENA PROJECT |
| FORM 43-101F1 TECHNICAL REPORT |
| |
| TABLE OF CONTENTS |
| SECTION | | | PAGE |
| | | | |
| DATE AND SIGNATURES PAGE | I |
| | |
| TABLE OF CONTENTS | II |
| | | |
| LIST OF FIGURES AND ILLUSTRATIONS | IX |
| | |
| LIST OF TABLES | XII |
| | | | |
| 1 | EXECUTIVE SUMMARY | 1 |
| | | |
| | 1.1 | INTRODUCTION | 1 |
| | | | | |
| | 1.2 | LA ARENA PROPERTY | 1 |
| | | | |
| | | 1.2.1 | Property Description and Location | 1 |
| | | | | |
| | 1.3 | LA ARENA MINE | 1 |
| | | | |
| | | 1.3.1 | Geology and Mineralization | 2 |
| | | 1.3.2 | Mineral Resource and Mineral Reserve Estimates | 2 |
| | | 1.3.3 | Mining Methods | 3 |
| | | 1.3.4 | Recovery Methods | 3 |
| | | 1.3.5 | Project Infrastructure | 3 |
| | | 1.3.6 | Capital and Operating Costs | 4 |
| | | 1.3.7 | Interpretation, Conclusions, and Recommendations | 5 |
| | | | | |
| | 1.4 | LA ARENA II PROJECT | 5 |
| | | | |
| | | 1.4.1 | Geology and Mineralization | 6 |
| | | 1.4.2 | Mineral Resource and Mineral Reserve Estimates | 6 |
| | | 1.4.3 | Mining Methods | 7 |
| | | 1.4.4 | Recovery Methods | 8 |
| | | 1.4.5 | Project Infrastructure | 8 |
| | | 1.4.6 | Capital and Operating Costs | 9 |
| | | 1.4.7 | Financial Analysis | 10 |
| | | 1.4.8 | Interpretation, Conclusions, and Recommendations | 11 |
| | | | | |
| 2 | INTRODUCTION | 13 |
| | | |
| | 2.1 | SOURCES OF INFORMATION | 13 |
| | | | |
| | 2.2 | QUALIFIED PERSONS AND SITE VISITS | 14 |
| | | | |
| | 2.3 | TERMS AND DEFINITIONS | 14 |
| | | | |
| 3 | RELIANCE ON OTHER EXPERTS | 17 |
| | | |
| 4 | PROPERTY DESCRIPTION AND LOCATION | 18 |
| | | |
| | 4.1 | PROPERTY LOCATION | 18 |
| | | | |
| | 4.2 | MINERAL TENURE AND TITLE | 18 |
| | | | |
| | 4.3 | STATE ROYALTIES, TAXES AND FEES | 20 |
| ii |
| LA ARENA PROJECT |
| FORM 43-101F1 TECHNICAL REPORT |
| | | 4.3.1 | Mineral Concession Maintenance Fees | 20 |
| | | 4.3.2 | Modified Mining Royalty | 20 |
| | | 4.3.3 | Minimum Production Obligation | 20 |
| | | 4.3.4 | OSINERGMIN Contribution | 20 |
| | | 4.3.5 | OEFA Contribution | 20 |
| | | 4.3.6 | Taxation and Foreign Exchange Controls | 21 |
| | | | | |
| | 4.4 | WORKER PARTICIPATION | 21 |
| | | | |
| | 4.5 | ENVIRONMENTAL LIABILITIES | 21 |
| | | | |
| | 4.6 | PERMITS | 21 |
| | | | |
| | | 4.6.1 | Environmental Impact Assessment (EIA) | 21 |
| | | 4.6.2 | Mining Plan | 22 |
| | | 4.6.3 | Beneficiation Concession | 22 |
| | | 4.6.4 | Certificate for the Inexistence of Archaeological Remains (CIRA) | 22 |
| | | 4.6.5 | Mine Closure Plan | 22 |
| | | 4.6.6 | Water Usage License | 22 |
| | | 4.6.7 | Permanent Power Concession | 22 |
| | | 4.6.8 | Other Operation Permits | 22 |
| | | | | |
| | 4.7 | RISKS THAT MAY AFFECT ACCESS, TITLE, OR THE RIGHT OR ABILITY TO PERFORM WORK | 23 |
| | | | |
| 5 | ACCESSIBILITY, CLIMATE, LOCAL RESOURCES, INFRASTRUCTURE AND PHYSIOGRAPHY | 24 |
| | | |
| | 5.1 | ACCESSIBILITY | 24 |
| | | | |
| | 5.2 | PHYSIOGRAPHY AND CLIMATE | 24 |
| | | | |
| | 5.3 | LOCAL RESOURCES AND INFRASTRUCTURE | 24 |
| | | | |
| 6 | HISTORY | 26 |
| | | |
| | 6.1 | SUMMARY | 26 |
| | | | |
| | 6.2 | EXPLORATION HISTORY | 26 |
| | | | |
| | 6.3 | HISTORICAL MINERAL RESOURCE AND MINERAL RESERVE ESTIMATES | 27 |
| | | | |
| | 6.4 | PRODUCTION HISTORY | 35 |
| | | | |
| 7 | GEOLOGICAL SETTING AND MINERALIZATION | 37 |
| | | |
| | 7.1 | REGIONAL GEOLOGY | 37 |
| | | | |
| | 7.2 | PROJECT GEOLOGY | 40 |
| | | | |
| | 7.3 | STRUCTURAL GEOLOGY | 43 |
| | | | |
| | 7.4 | MINERALIZATION | 44 |
| | | | |
| | | 7.4.1 | High-Sulfidation Epithermal Gold Mineralization | 44 |
| | | 7.4.2 | Porphyry-hosted Copper-Gold Mineralization | 44 |
| | | | | |
| | 7.5 | ALTERATION | 45 |
| | | | |
| 8 | DEPOSIT TYPES | 46 |
| | | |
| 9 | EXPLORATION | 47 |
| | | |
| 10 | DRILLING | 49 |
| iii |
| LA ARENA PROJECT |
| FORM 43-101F1 TECHNICAL REPORT |
| | 10.1 | SUMMARY | 49 |
| | | | |
| | 10.2 | DRILL CAMPAIGNS | 49 |
| | | | |
| | 10.3 | DATA COLLECTION | 50 |
| | | | |
| | | 10.3.1 | Sample Collection and Handling | 51 |
| | | 10.3.2 | Drill Collar Surveys | 51 |
| | | 10.3.3 | Downhole Surveys | 51 |
| | | 10.3.4 | Geologic Logging | 51 |
| | | 10.3.5 | Geotechnical Logging | 52 |
| | | | | |
| | 10.4 | DRILLING SUMMARY, RESULTS AND CONCLUSIONS | 52 |
| | | | |
| 11 | SAMPLE PREPARATION, ANALYSES AND SECURITY | 53 |
| | | |
| | 11.1 | SAMPLING METHOD | 53 |
| | | | |
| | 11.2 | SAMPLE SECURITY | 53 |
| | | | |
| | 11.3 | LABORATORY SAMPLE PREPARATION AND ANALYSES | 53 |
| | | | |
| | 11.4 | QUALITY ASSURANCE / QUALITY CONTROL | 54 |
| | | | |
| | | 11.4.1 | 2004 to 2007 QA/QC Procedures | 54 |
| | | 11.4.2 | 2010 to 2014 QA/QC Procedures | 54 |
| | | 11.4.3 | Current QA/QC Procedures | 54 |
| | | | | |
| | 11.5 | CONCLUSIONS | 60 |
| | | | |
| 12 | DATA VERIFICATION | 61 |
| | | |
| | 12.1 | PRIOR DATA VERIFICATION PROGRAMS | 61 |
| | | | |
| | 12.2 | 2017 DATA VERIFICATION | 62 |
| | | | |
| 13 | MINERAL PROCESSING AND METALLURGICAL TESTING | 63 |
| | | |
| | 13.1 | LA ARENA MINE METALLURGICAL EVALUATION OF OXIDE GOLD DEPOSIT | 63 |
| | | | |
| | | 13.1.1 | 2014 Column Leach Tests | 63 |
| | | 13.1.2 | Late 2014 Oxide Intrusive Program | 64 |
| | | 13.1.3 | Reagent Consumption | 65 |
| | | | | |
| | 13.2 | LA ARENA II METALLURGICAL EVALUATION | 66 |
| | | | |
| | | 13.2.1 | Sampling | 66 |
| | | 13.2.2 | Head Assays | 68 |
| | | | | |
| | 13.3 | LA ARENA II COMMINUTION TEST WORK | 69 |
| | | | |
| | 13.4 | LA ARENA II FLOTATION TEST WORK | 71 |
| | | | |
| | | 13.4.1 | Slurry Density Effect in Flotation | 71 |
| | | 13.4.2 | Effect pH in Rougher flotation | 71 |
| | | 13.4.3 | Primary Collector Evaluation | 72 |
| | | 13.4.4 | Grind Size Sensitivity Evaluation | 74 |
| | | 13.4.5 | Comparison of Test Program Flow Sheets | 75 |
| | | 13.4.6 | Cleaner Tests | 76 |
| | | 13.4.7 | Variability Tests | 79 |
| | | 13.4.8 | Locked Cycle Tests and Recovery Models | 80 |
| iv |
| LA ARENA PROJECT |
| FORM 43-101F1 TECHNICAL REPORT |
| | | 13.4.9 | Diagnostic Leach on Flotation Tailings | 83 |
| | | 13.4.10 | Gravity Concentration Test | 85 |
| | | | | |
| | 13.5 | LA ARENA II SUPPLEMENTARY TESTS | 86 |
| | | | |
| | | 13.5.1 | Flocculant Screening Tests | 86 |
| | | 13.5.2 | Dynamic Thickening Test | 86 |
| | | 13.5.3 | Other Factors Tested | 87 |
| | | | | |
| | 13.6 | FUTURE METALLURGICAL INVESTIGATION | 88 |
| | | | |
| 14 | MINERAL RESOURCE ESTIMATES | 89 |
| | | |
| | 14.1 | MINERAL RESOURCE CLASSIFICATION DEFINITIONS | 89 |
| | | | |
| | 14.2 | DATA USED FOR MINERAL RESOURCE ESTIMATION | 90 |
| | | | |
| | 14.3 | LA ARENA MINE MINERAL RESOURCES | 90 |
| | | | |
| | | 14.3.1 | Geological Modeling | 90 |
| | | 14.3.2 | Gold Domain Model | 91 |
| | | 14.3.3 | Samples and Composites | 91 |
| | | 14.3.4 | Density | 92 |
| | | 14.3.5 | Resource Model and Estimation | 93 |
| | | 14.3.6 | Resource Classification | 94 |
| | | | | |
| | 14.4 | LA ARENA II MINERAL RESOURCES | 94 |
| | | | |
| | | 14.4.1 | Geological Modeling | 95 |
| | | 14.4.2 | Copper and Gold Domain Models | 97 |
| | | 14.4.3 | Samples and Composites | 99 |
| | | 14.4.4 | Density | 100 |
| | | 14.4.5 | Resource Model and Estimation | 100 |
| | | 14.4.6 | Resource Classification | 103 |
| | | | | |
| 15 | MINERAL RESERVE ESTIMATES | 104 |
| | | |
| | 15.1 | MINERAL RESERVE CLASSIFICATION | 104 |
| | | | |
| | | 15.1.1 | Mineral Reserve Definition | 104 |
| | | | | |
| | 15.2 | LA ARENA MINE MINERAL RESERVES | 104 |
| | | | |
| | | 15.2.1 | Cut-off Grade | 105 |
| | | 15.2.2 | Assumptions and Parameters | 105 |
| | | | | |
| | 15.3 | LA ARENA II MINERAL RESERVES | 106 |
| | | | |
| 16 | MINING METHODS | 107 |
| | | |
| | 16.1 | LA ARENA MINE – CURRENT OXIDE OPERATIONS | 107 |
| | | | |
| | | 16.1.1 | Pit Optimization | 107 |
| | | 16.1.2 | Mine | 109 |
| | | 16.1.3 | Waste Rock Storage | 111 |
| | | 16.1.4 | Production Schedule | 111 |
| | | | | |
| | 16.2 | LA ARENA II | 111 |
| | | | |
| | | 16.2.1 | Pit Optimization | 114 |
| | | 16.2.2 | Mine Design | 117 |
| v |
| LA ARENA PROJECT |
| FORM 43-101F1 TECHNICAL REPORT |
| | | 16.2.3 | Waste Rock Storage | 120 |
| | | 16.2.4 | Production Schedule | 120 |
| | | 16.2.5 | Mining Equipment | 123 |
| | | | | |
| 17 | RECOVERY METHODS | 125 |
| | | |
| | 17.1 | LA ARENA MINE EXISTING FACILITY | 125 |
| | | | |
| | 17.2 | LA ARENA II PROCESS | 127 |
| | | | |
| | | 17.2.1 | La Arena II Process Description | 127 |
| | | 17.2.2 | La Arena II Process Design Criteria | 127 |
| | | 17.2.3 | Crushing and Crushed Material Stockpile | 129 |
| | | 17.2.4 | Grinding | 130 |
| | | 17.2.5 | Flotation | 130 |
| | | 17.2.6 | Copper Concentrate Thickening, Filtration and Storage | 131 |
| | | 17.2.7 | Pyrite Flotation, Thickening and Filtration | 131 |
| | | 17.2.8 | Tailing Filtration and Storage | 131 |
| | | 17.2.9 | Reagents and Consumables | 132 |
| | | 17.2.10 | Water Balance | 132 |
| | | 17.2.11 | Plant Services | 132 |
| | | 17.2.12 | Production Estimate | 133 |
| | | | | |
| 18 | PROJECT INFRASTRUCTURE | 135 |
| | | |
| | 18.1 | LA ARENA MINE | 135 |
| | | | |
| | | 18.1.1 | Roads | 135 |
| | | 18.1.2 | Power Supply | 136 |
| | | 18.1.3 | Water Supply | 136 |
| | | 18.1.4 | Leach Pad | 136 |
| | | 18.1.5 | Waste Rock Storage | 136 |
| | | 18.1.6 | Surface Water Management | 136 |
| | | 18.1.7 | Ancillaries | 136 |
| | | | | |
| | 18.2 | LA ARENA II | 137 |
| | | | |
| | | 18.2.1 | Roads | 139 |
| | | 18.2.2 | Power Supply | 139 |
| | | 18.2.3 | Water Supply | 140 |
| | | 18.2.4 | Tailings, Heap Leach Pad and Waste Rock Dumps | 140 |
| | | 18.2.5 | Surface Water Management | 141 |
| | | 18.2.6 | Ancillaries | 143 |
| | | | | |
| 19 | MARKET STUDIES AND CONTRACTS | 144 |
| | | |
| | 19.1 | LA ARENA MINE | 144 |
| | | | |
| | 19.2 | LA ARENA II | 144 |
| | | | |
| 20 | ENVIRONMENTAL STUDIES, PERMITTING AND SOCIAL OR COMMUNITY IMPACT | 146 |
| | | |
| | 20.1 | ENVIRONMENTAL | 146 |
| | | | |
| | | 20.1.1 | Environmental Impact Assessments | 146 |
| | | 20.1.2 | Site Monitoring and Environmental Mitigation Measures | 147 |
| | | 20.1.3 | Environmental Risks | 148 |
| vi |
| LA ARENA PROJECT |
| FORM 43-101F1 TECHNICAL REPORT |
| | 20.2 | PERMITTING | 148 |
| | | | |
| | 20.3 | SOCIAL IMPACT | 148 |
| | | | |
| | 20.4 | MINE CLOSURE | 150 |
| | | | |
| 21 | CAPITAL AND OPERATING COSTS | 152 |
| | | |
| | 21.1 | INTRODUCTION | 152 |
| | | | |
| | 21.2 | LA ARENA MINE | 152 |
| | | | |
| | | 21.2.1 | Initial Capital Costs | 152 |
| | | 21.2.2 | Sustaining Capital | 152 |
| | | 21.2.3 | Operating Expenditures | 152 |
| | | | | |
| | 21.3 | LA ARENA II PROJECT | 153 |
| | | | |
| | | 21.3.1 | Initial Capital Costs | 153 |
| | | 21.3.2 | Sustaining Capital Costs | 156 |
| | | 21.3.3 | Operating Costs | 157 |
| | | | | |
| 22 | ECONOMIC ANALYSIS | 162 |
| | | |
| | 22.1 | INTRODUCTION | 162 |
| | | | |
| | 22.2 | MINE PRODUCTION STATISTICS | 162 |
| | | | |
| | 22.3 | PLANT PRODUCTION STATISTICS | 162 |
| | | | |
| | | 22.3.1 | Smelter Return Factors | 163 |
| | | | | |
| | 22.4 | CAPITAL EXPENDITURE | 163 |
| | | | |
| | | 22.4.1 | Initial and Sustaining Capital | 163 |
| | | 22.4.2 | Working Capital | 164 |
| | | 22.4.3 | Salvage Value | 164 |
| | | | | |
| | 22.5 | REVENUE | 164 |
| | | | |
| | 22.6 | OPERATING COST | 165 |
| | | | |
| | �� | 22.6.1 | Total Production Cost | 165 |
| | | | | |
| | 22.7 | TAXATION | 165 |
| | | | |
| | 22.8 | NET INCOME AFTER TAX | 165 |
| | | | |
| | 22.9 | NPV AND IRR | 166 |
| | | | |
| | 22.10 | FINANCIAL MODEL | 166 |
| | | | |
| 23 | ADJACENT PROPERTIES | 169 |
| | | |
| 24 | OTHER RELEVANT DATA AND INFORMATION | 171 |
| | | |
| 25 | INTERPRETATION AND CONCLUSIONS | 172 |
| | | |
| | 25.1 | LA ARENA MINE | 172 |
| | | | |
| | 25.2 | LA ARENA II | 173 |
| | | | |
| 26 | RECOMMENDATIONS | 175 |
| | | |
| | 26.1 | LA ARENA MINE | 175 |
| vii |
| LA ARENA PROJECT |
| FORM 43-101F1 TECHNICAL REPORT |
| | 26.2 | LA ARENA II | 175 |
| | | | |
| | | 26.2.1 | Resource Definition | 175 |
| | | 26.2.2 | Metallurgical Testing | 175 |
| | | 26.2.3 | Waste and Tails Storage Facilities | 176 |
| | | 26.2.4 | Hydrology and Hydrogeology | 176 |
| | | 26.2.5 | Geochemistry | 177 |
| | | 26.2.6 | Pit Design | 177 |
| | | 26.2.7 | Power Supply | 177 |
| | | 26.2.8 | Permitting | 177 |
| | | 26.2.9 | Community Engagement | 178 |
| | | 26.2.10 | Land Acquisition | 178 |
| | | 26.2.11 | Additional Studies | 178 |
| | | | | |
| 27 | REFERENCES | 179 |
| | | |
| APPENDIX A: FEASIBILITY STUDY CONTRIBUTORS AND PROFESSIONAL QUALIFICATIONS | 181 |
| viii |
| LA ARENA PROJECT |
| FORM 43-101F1 TECHNICAL REPORT |
LIST OF FIGURES AND ILLUSTRATIONS
| FIGURE | DESCRIPTION | PAGE |
| | | |
| Figure 4-1: | La Arena Property Location | 18 |
| | | |
| Figure 4-2: | La Arena Concessions | 19 |
| | | |
| Figure 7-1: | Regional Geology | 39 |
| | | |
| Figure 7-2: | Regional Geologic Cross Section | 40 |
| | | |
| Figure 7-3: | La Arena Geology | 41 |
| | | |
| Figure 7-4: | La Arena Geologic Cross Section | 42 |
| | | |
| Figure 7-5: | Mineralized Structures in Calaorco Pit | 43 |
| | | |
| Figure 8-1: | Spatial Relationship of Epithermal and Porphyry Deposits | 46 |
| | | |
| Figure 9-1: | Regional Exploration Targets | 47 |
| | | |
| Figure 9-2: | La Arena Property Soil Geochemistry | 48 |
| | | |
| Figure 10-1: | La Arena Property Drill Hole Location Map | 50 |
| | | |
| Figure 11-1: | La Arena Mine Gold Assay Blanks | 55 |
| | | |
| Figure 11-2: | La Arena Mine Duplicate Sample Results – Gold | 56 |
| | | |
| Figure 11-3: | La Arena II Copper Assay Blanks | 57 |
| | | |
| Figure 11-4: | La Arena II Gold Assay Blanks | 58 |
| | | |
| Figure 11-5: | La Arena II Duplicate Sample Results - Copper | 59 |
| | | |
| Figure 11-6: | La Arena II Duplicate Sample Results – Gold | 60 |
| | | |
| Figure 13-1: | Gold Extraction Curve kinetics for Column Tests | 64 |
| | | |
| Figure 13-2: | Copper Extraction Curve Kinetics for Column Tests | 64 |
| | | |
| Figure 13-3: | Kinetic Curve for Gold Extraction in Pilot Dump Leach Test | 65 |
| | | |
| Figure 13-4: | Metallurgical drill hole location superimposed on the mine pit shell | 67 |
| | | |
| Figure 13-5: | Cumulative Frequency Distribution of Axb parameters | 70 |
| | | |
| Figure 13-6: | Cumulative Frequency Distribution of Bond Ball Mill Work Indices | 71 |
| | | |
| Figure 13-7: | Selectivity curve for copper against pyrite for ARC samples | 74 |
| | | |
| Figure 13-8: | Selectivity curve for copper minerals against non-sulfide gangue | 74 |
| | | |
| Figure 13-9: | Copper Recovery Versus Grind Size | 75 |
| | | |
| Figure 13-10: | Gold Recovery Versus Grind Size | 75 |
| | | |
| Figure 13-11: | KM3991 Cleaner Flotation Flow Sheet | 77 |
| | | |
| Figure 13-12: | Copper grade-recovery relationship between two and three cleaner stages | 78 |
| | | |
| Figure 13-13: | Gold Grade-Recovery Relationship Between Two and Three Cleaner Stages | 79 |
| | | |
| Figure 13-14: | Comparative copper recovery results in variability composites | 80 |
| ix |
| LA ARENA PROJECT |
| FORM 43-101F1 TECHNICAL REPORT |
| Figure 13-15: | Gold recovery results vs. Gold head grade for all variability composites | 80 |
| | | |
| Figure 13-16: | Locked Cycle Tests – Flowsheet A | 81 |
| | | |
| Figure 13-17: | Locked Cycle Tests - Flowsheet B | 81 |
| | | |
| Figure 13-18: | Locked Cycle Test Cu Head Grade vs. Cu Recovery | 82 |
| | | |
| Figure 13-19: | Locked Cycle Test Au Head Grade vs. Au Recovery | 82 |
| | | |
| Figure 13-20: | Variability Test Au Head Grade vs. Au Recovery | 83 |
| | | |
| Figure 13-21: | Diagnostic leach tests carried out on locked cycle flotation tailings for ARC sample | 84 |
| | | |
| Figure 13-22: | Diagnostic leach carried out on locked cycle flotation tailings for PHC sample | 84 |
| | | |
| Figure 13-23: | Diagnostic leach carried out on locked cycle flotation tailings for KC sample | 85 |
| | | |
| Figure 14-1: | La Arena Mine Gold Mineral Domains | 91 |
| | | |
| Figure 14-2: | La Arena Mine Mineral Resource Block Model | 94 |
| | | |
| Figure 14-3: | La Arena II Porphyry Model with Copper Assays | 96 |
| | | |
| Figure 14-4: | La Arena II Porphyry Model with Gold Assays | 96 |
| | | |
| Figure 14-5: | La Arena II Copper Domains | 98 |
| | | |
| Figure 14-6: | La Arena II Gold Domains | 98 |
| | | |
| Figure 14-7: | La Arena II Copper Mineral Resources | 102 |
| | | |
| Figure 14-8: | La Arena II Gold Mineral Resources | 102 |
| | | |
| Figure 16-1: | La Arena Mine Site Layout | 107 |
| | | |
| Figure 16-2: | Calaorco Final Pit | 110 |
| | | |
| Figure 16-3: | Calaorco LOM Pit | 110 |
| | | |
| Figure 16-4: | La Arena II Proposed General Arrangement | 113 |
| | | |
| Figure 16-5: | La Arena II Stage 1 Pit | 118 |
| | | |
| Figure 16-6: | La Arena II Stage 2 Pit | 118 |
| | | |
| Figure 16-7: | La Arena II Stage 3 Final Pit | 119 |
| | | |
| Figure 16-8: | La Arena II Pit Stages | 119 |
| | | |
| Figure 16-9: | La Arena II Material Movement by Year | 122 |
| | | |
| Figure 16-10: | La Arena II Leach and Mill Movement by Year | 122 |
| | | |
| Figure 16-11: | La Arena II Leach and Mill Process by Year | 123 |
| | | |
| Figure 17-1: | Simplified Process Flow Diagram for the La Arena Mine Gold Dump Leach Operation | 126 |
| | | |
| Figure 17-2: | Simplified Process Flow Diagram for the La Arena II Sulfide Plant | 128 |
| | | |
| Figure 17-3: | Copper Production by Year | 134 |
| | | |
| Figure 17-4: | Gold Production by Source and Year | 134 |
| | | |
| Figure 18-1: | Existing La Arena Mine Facilities | 135 |
| | | |
| Figure 18-2: | Overview of La Arena II Conceptual Site Infrastructure | 138 |
| x |
| LA ARENA PROJECT |
| FORM 43-101F1 TECHNICAL REPORT |
| Figure 18-3: | La Arena II Process Plant Conceptual Infrastructure | 139 |
| | | |
| Figure 18-4: | General Surface Contact Water Control | 142 |
| | | |
| Figure 23-1: | Adjacent Properties | 169 |
| xi |
| LA ARENA PROJECT |
| FORM 43-101F1 TECHNICAL REPORT |
LIST OF TABLES
| TABLE | DESCRIPTION | PAGE |
| | | |
| Table 1-1: | La Arena Mine Mineral Resources | 2 |
| | | |
| Table 1-2: | La Arena Mine Mineral Reserves | 2 |
| | | |
| Table 1-3: | La Arena Mine Mining Schedule | 3 |
| | | |
| Table 1-4: | La Arena Mine Sustaining Capital Expenditures Remaining LOM | 4 |
| | | |
| Table 1-5: | La Arena Mine Operating Costs Remaining LOM | 4 |
| | | |
| Table 1-6: | La Arena Mine Operating Cost per Tonne | 5 |
| | | |
| Table 1-7: | La Arena II Mineral Resources | 6 |
| | | |
| Table 1-8: | La Arena II Project Mineral Resources in Mine Plan | 7 |
| | | |
| Table 1-9: | Metallurgical Recovery Assumptions | 8 |
| | | |
| Table 1-10: | La Arena II Project Initial Capital Summary | 9 |
| | | |
| Table 1-11: | La Arena II Project Sustaining Capital Summary | 9 |
| | | |
| Table 1-12: | La Arena II Average Annual Operating Costs | 10 |
| | | |
| Table 1-13: | Sensitivity Analysis after Taxes | 11 |
| | | |
| Table 2-1: | Areas of Responsibility and Site Visit Dates | 14 |
| | | |
| Table 2-2: | Terms and Abbreviations | 15 |
| | | |
| Table 6-1: | La Arena Au-Cu Project Mineral Resource (March 31, 2008) | 27 |
| | | |
| Table 6-2: | La Arena Project Probable Mineral Reserve | 28 |
| | | |
| Table 6-3: | La Arena Au-Cu Project Mineral Resource (July 31, 2010) | 28 |
| | | |
| Table 6-4: | La Arena Project – Rio Alto Mineral Reserve (31 July 2010) | 29 |
| | | |
| Table 6-5: | Mineral Resource - Oxide Total (In Situ as at September 30, 2011) | 29 |
| | | |
| Table 6-6: | Mineral Resource – Sulfide Total (In-Situ as at September 30, 2011) | 29 |
| | | |
| Table 6-7: | Mineral Resource – Oxide Total (In Situ as at January 1, 2013) | 30 |
| | | |
| Table 6-8: | Mineral Resource – Sulfide Total (In Situ as at January 1, 2013) | 30 |
| | | |
| Table 6-9: | Mineral Reserve – Oxide and Sulfide (In Situ as at January 1, 2013) | 31 |
| | | |
| Table 6-10: | Mineral Resource – Oxide Total (In Situ as at December 31, 2013) | 31 |
| | | |
| Table 6-11: | La Arena – Oxide Mineral Reserve (In Situ as at December 31, 2013) | 32 |
| | | |
| Table 6-12: | La Arena – Oxide Gold Mineral Resources (In Situ as at December 31, 2014) | 33 |
| | | |
| Table 6-13: | Mineral Resource – Sulfide Total (In Situ as at December 31, 2014) | 33 |
| | | |
| Table 6-14: | La Arena – Oxide Mineral Reserve (In Situ as at December 31, 2013) | 34 |
| | | |
| Table 6-15: | La Arena Mineral Reserve Statement for Sulfide | 35 |
| | | |
| Table 6-16: | La Arena Mine Annual Mine Production | 35 |
| xii |
| LA ARENA PROJECT |
| FORM 43-101F1 TECHNICAL REPORT |
| Table 6-17: | La Arena Mine Annual Processing Production | 35 |
| | | |
| Table 10-1: | La Arena Property Drilling History | 49 |
| | | |
| Table 11-1: | La Arena Mine Gold Assay Standard Results | 55 |
| | | |
| Table 11-2: | La Arena Mine Duplicate Sample Statistics - Gold | 56 |
| | | |
| Table 11-3: | La Arena II Project Copper Assay Standard Results | 56 |
| | | |
| Table 11-4: | La Arena II Project Gold Assay Standard Results | 57 |
| | | |
| Table 11-5: | La Arena II Duplicate Sample Statistics – Copper | 58 |
| | | |
| Table 11-6: | La Arena II Duplicate Sample Statistics – Gold | 59 |
| | | |
| Table 13-1: | CERTIMIN and SGS Column Tests Results | 63 |
| | | |
| Table 13-2: | Late 2014 Pilot Dump Leach Results | 65 |
| | | |
| Table 13-3: | Reagents Consumption Calculated for Each Rock Type | 65 |
| | | |
| Table 13-4: | Testwork Composites for KM3262, KM3526 and KM3866 | 67 |
| | | |
| Table 13-5: | Test Work Composites for KM3991 | 68 |
| | | |
| Table 13-6: | Main elements for domain and variability composites head assays | 68 |
| | | |
| Table 13-7: | Comminution Data | 69 |
| | | |
| Table 13-8: | Summary of Comminution Design Parameters | 70 |
| | | |
| Table 13-9: | Effect of pH on Rougher Flotation | 72 |
| | | |
| Table 13-10: | Summary of Primary Collector Tests Results for ARC samples | 72 |
| | | |
| Table 13-11: | Results of Rougher Flotation Tests using KM3526, KM3866 and KM3991 Procedures | 76 |
| | | |
| Table 13-12: | Effect of Aerophine 3418A and rougher feed dilution on cleaner tests | 77 |
| | | |
| Table 13-13: | Effect of Slurry Density on Cleaner Tests and Regrind of 2nd Cleaner Feed (Tests 129 and 133) | 78 |
| | | |
| Table 13-14: | Cleaner flotation tests results on variability composites | 79 |
| | | |
| Table 13-15: | Copper Concentrate Chemical Assay – main pay and penalty elements | 83 |
| | | |
| Table 13-16: | Knelson Gravity Test Results | 85 |
| | | |
| Table 13-17: | Optimum Flocculant Concentration for all Composite Samples | 87 |
| | | |
| Table 13-18: | Optimum Solids Loading for all Composite Samples | 87 |
| | | |
| Table 14-1: | La Arena Mine Mineral Resources | 90 |
| | | |
| Table 14-2: | La Arena Mine Gold Mineral Domain Assay Statistics | 92 |
| | | |
| Table 14-3: | La Arena Mine Gold Mineral Domain Composite Statistics | 92 |
| | | |
| Table 14-4: | Densities Used in La Arena Mine Mineral Resource Model | 93 |
| | | |
| Table 14-5: | La Arena Mine Resource Estimation Parameters | 93 |
| | | |
| Table 14-6: | La Arena II Mineral Resources | 95 |
| | | |
| Table 14-7: | La Arena II Mineral Domains | 97 |
| | | |
| Table 14-8: | La Arena II Copper Mineral Domain Assay Statistics | 99 |
| xiii |
| LA ARENA PROJECT |
| FORM 43-101F1 TECHNICAL REPORT |
| Table 14-9: | La Arena II Gold Mineral Domain Assay Statistics | 99 |
| | | |
| Table 14-10: | La Arena II Sample Capping | 99 |
| | | |
| Table 14-11: | La Arena II Copper Mineral Domain Composite Statistics | 100 |
| | | |
| Table 14-12: | La Arena II Gold Mineral Domain Composite Statistics | 100 |
| | | |
| Table 14-13: | Densities Used in La Arena Mine Mineral Resource Model | 100 |
| | | |
| Table 14-14: | La Arena II Resource Estimation Parameters | 101 |
| | | |
| Table 14-15: | La Arena II Resource Estimation Search Restrictions | 101 |
| | | |
| Table 15-1: | La Arena Mine Mineral Reserves | 105 |
| | | |
| Table 15-2: | La Arena Mine Pit Optimization Parameters | 106 |
| | | |
| Table 16-1: | La Arena Mine Leach Recovery | 108 |
| | | |
| Table 16-2: | La Arena Mine Metal Price Assumptions | 108 |
| | | |
| Table 16-3: | La Arena Mine Operating Cost Assumptions | 108 |
| | | |
| Table 16-4: | La Arena Mine Wall Slope Criteria used in Designs | 109 |
| | | |
| Table 16-5: | La Arena Mine Typical Mining Fleet | 109 |
| | | |
| Table 16-6: | La Arena Mine Mining Schedule | 111 |
| | | |
| Table 16-7: | La Arena II Mineral Resources in Mine Plan | 112 |
| | | |
| Table 16-8: | La Arena II Metallurgical Assumptions | 114 |
| | | |
| Table 16-9: | La Arena II Concentrate Inputs | 115 |
| | | |
| Table 16-10: | La Arena II Operating Cost Assumptions | 115 |
| | | |
| Table 16-11: | La Arena II Wall Slope Assumptions used in Designs | 116 |
| | | |
| Table 16-12: | La Arena II Whittle Pit Shell Summary Positive Margin | 117 |
| | | |
| Table 16-13: | La Arena II Mine Production | 120 |
| | | |
| Table 16-14: | La Arena II Mine Production Schedule | 121 |
| | | |
| Table 16-15: | La Arena II Major Equipment Initial Purchase | 124 |
| | | |
| Table 16-16: | La Arena II Major Equipment Sustaining Purchase | 124 |
| | | |
| Table 17-1: | Process Design Criteria | 129 |
| | | |
| Table 17-2: | Metallurgical Recovery Assumptions | 129 |
| | | |
| Table 17-3: | Flotation Cells | 131 |
| | | |
| Table 17-4: | Process Reagents and Consumption Rates | 132 |
| | | |
| Table 17-5: | La Arena II Mobile Equipment List | 132 |
| | | |
| Table 17-6: | Metal Production | 133 |
| | | |
| Table 19-1: | La Arena II PEA Concentrate Specifications | 145 |
| | | |
| Table 21-1: | La Arena Mine Sustaining Capital Expenditures Remaining LOM | 152 |
| | | |
| Table 21-2: | La Arena Mine Operating Cost Remaining LOM | 153 |
| xiv |
| LA ARENA PROJECT |
| FORM 43-101F1 TECHNICAL REPORT |
| Table 21-3: | La Arena Mine Operating Cost Remaining LOM | 153 |
| | | |
| Table 21-4: | La Arena Mine Operating Cost per Tonne | 153 |
| | | |
| Table 21-5: | La Arena II Capital Cost Summary | 154 |
| | | |
| Table 21-6: | La Arena II Process Plant and Infrastructure Capital Costs | 154 |
| | | |
| Table 21-7: | La Arena II Initial Mine Equipment Summary | 155 |
| | | |
| Table 21-8: | La Arena II Other Mining Initial Capital Costs | 156 |
| | | |
| Table 21-9: | La Arena II Replacement Operating Hours | 156 |
| | | |
| Table 21-10: | La Arena II Sustaining Mining Capital | 157 |
| | | |
| Table 21-11: | La Arena II Process Sustaining Capital | 157 |
| | | |
| Table 21-12: | La Arena II Mine Operating Costs | 158 |
| | | |
| Table 21-13: | La Arena II Process Plant Operating Cost Summary | 158 |
| | | |
| Table 21-14: | La Arena II Process Plant Operating Cost Summary by Area | 159 |
| | | |
| Table 21-15: | La Arena II Process Plant Labor & Fringes | 160 |
| | | |
| Table 21-16: | La Arena II Power Cost Summary | 160 |
| | | |
| Table 21-17: | La Arena II Reagents Consumption Summary | 161 |
| | | |
| Table 21-18: | La Arena II Grinding Media and Wear Items | 161 |
| | | |
| Table 22-1: | Life of Mine Tonnages, Metal Grades and Contained Metal | 162 |
| | | |
| Table 22-2: | Metal Recovery Factors | 162 |
| | | |
| Table 22-3: | Life of Mine Metal Production Summary | 163 |
| | | |
| Table 22-4: | La Arena II Smelter Return Factors | 163 |
| | | |
| Table 22-5: | Initial and Sustaining Capital Summary | 164 |
| | | |
| Table 22-6: | La Arena II Average Annual Operating Costs | 165 |
| | | |
| Table 22-7: | Sensitivity Analysis after Taxes | 166 |
| | | |
| Table 22-8: | La Arena Project Financial Model – 80,000 tpd – Assumes Metal Recovered in Same Year as Mined . | 167 |
| xv |
| LA ARENA PROJECT |
| FORM 43-101F1 TECHNICAL REPORT |
LIST OF APPENDICES
| APPENDIX | | DESCRIPTION |
| | | | |
| A | | Feasibility Study Contributors and Professional Qualifications |
| | | |
| | | • | Certificate of Qualified Person (“QP”) |
| xvi |
| LA ARENA PROJECT |
| FORM 43-101F1 TECHNICAL REPORT |
| 1 | EXECUTIVE SUMMARY |
| | |
| 1.1 | INTRODUCTION |
Tahoe Resources Inc. (Tahoe or the Company), through its wholly-owned subsidiary, La Arena S.A., owns the La Arena Project in north-central Peru. Tahoe assumed ownership of the La Arena property upon their acquisition of Rio Alto Mining Limited in April 2015. The La Arena Project consists of the currently operating La Arena Mine and the La Arena II Project. This Technical Report provides an update to the La Arena Mine and presents a Preliminary Economic Assessment (PEA) for the La Arena II Project.
Both the La Arena Mine and the La Arena II Project are situated within the overall La Arena property owned by the Company, but they are stand-alone projects and independent of each other. The La Arena II Project would not be an expansion of the current operation; rather it would be a separate operation constructed at the end of the La Arena Mine life.
| 1.2 | LA ARENA PROPERTY |
| | |
| 1.2.1 | Property Description and Location |
The La Arena property is located in the Huamachuco District, Sánchez Carrion province, Department of La Libertad along the eastern slope of the Western Cordillera of northern Peru, approximately 480 kilometers north-northwest of the city of Lima. Primary access to the property is via a 165 kilometer national highway from the coastal city of Trujillo. The closest population center is the town of Huamachuco, located about 21 kilometers from the property, with a population of about 35,000 residents.
Through its wholly-owned subsidiary, La Arena S.A., the Company holds 27 mineral concessions in the area of La Arena totaling approximately 33,140 hectares. Of this total, approximately 25,440 hectares form the contiguous concession block which comprises the La Arena property; the remaining concessions are located to the north and west of the La Arena property. The mineral concessions are 100% owned by and registered in the name of La Arena S.A. The mineral concessions are all in good standing, with no litigation or other legal issues pending.
All Mineral Resources identified at the La Arena Mine are contained within mining concessions which are free of underlying agreements and/or royalties. The majority of Mineral Resources identified at the La Arena II Project are also free of underlying agreements and/or royalties except for a small portion which has a two percent net smelter return royalty obligation.
The Company currently has surface ownership of approximately 1,948 hectares and has co-ownership of an additional 349 hectares which covers the current La Arena Mine operations; minor surface land additions are required to accommodate the La Arena Mine life of mine plan. Approximately 1,200 hectares of surface ownership or surface rights would need to be acquired to accommodate the La Arena II life of mine plan as envisioned in the PEA of the project.
The La Arena Mine is a gold oxide open pit, run of mine heap leach operation which has been in production since the latter half of 2011. Through the end of 2017, the La Arena Mine has produced a total of 1.32 million ounces of gold in doré. The current mine life runs through 2021, though potential exists to develop additional resources below the currently designed pit and extend the mine life, which the Company is currently drill testing.
| 1 |
| LA ARENA PROJECT |
| FORM 43-101F1 TECHNICAL REPORT |
| 1.3.1 | Geology and Mineralization |
High-sulfidation gold mineralization at the La Arena Mine is hosted in the Lower Cretaceous Chimu Formation and is both lithologically and structurally controlled, occurring primarily in silicified fractured sandstones and, locally, in hydrothermal breccias. Structural control is mainly associated to the principle northwest-southeast Andean orientation and secondary to tensional fracturing, as well as to bedding planes. Tensional fracturing has acted as a principal fluid channel way, containing oxidized high sulfidation epithermal gold mineralization. Fine grained native gold is free in small proportions as is electrum.
Higher-grade zones of gold mineralization are directly controlled by the intersection of southwest-northeast faults which transverse the mineralized trend oriented to the northwest-southeast. The northwest-trending ‘feeder’ structures, locally termedTilsa structures, have a strike length of approximately 300 meters and thicknesses ranging from a few centimeters to several meters, with grades of 80 to 100 g/t of gold not uncommon. Lower grade gold mineralization occurs as thin stockwork and disseminations within the Chimu sandstone.
| 1.3.2 | Mineral Resource and Mineral Reserve Estimates |
Measured and Indicated Mineral Resources for the La Arena Mine total 49.9 million tonnes with an average gold grade of 0.40 g/t containing 643.5 thousand ounces of gold; Inferred Mineral Resources total 0.4 million tonnes with an average gold grade of 0.32 g/t containing 4.3 thousand ounces of gold. Mineral Resources for the La Arena Mine, reported at gold cut-off grade of 0.10 g/t within a $1,400 per ounce gold pit shell, are summarized in Table 1-1.
Table 1-1: La Arena Mine Mineral Resources
| Material Type | Classification | Tonnes
(M) | Gold
(g/t) | Gold
(koz) |
|
| Oxide | Measured | 0.3 | 0.38 | 3.3 |
| | Indicated | 49.6 | 0.40 | 640.2 |
| | Measured + Indicated | 49.9 | 0.40 | 643.5 |
| | Inferred | 0.4 | 0.32 | 4.3 |
Totals may not sum due to rounding
Drilling and sampling practices at the La Arena Mine are appropriate for the style and distribution of the oxide gold mineralization and provide for a reliable representation of the deposit. Multiple data verification programs of the project database, analytical data and quality assurance/quality control programs are sufficient to ensure the dataset used for the Mineral Resource estimate is valid.
Proven and Probable Mineral Reserves for the La Arena Mine total 44.0 million tonnes with an average gold grade of 0.40 g/t containing 568.4 thousand ounces of gold. The Mineral Reserve estimate for the La Arena Mine, reported at a gold cut-off grade of 0.10 g/t within a designed pit based on an optimized pit shell using $1200 per ounce gold, is summarized in Table 1-2.
Table 1-2: La Arena Mine Mineral Reserves
| Classification | Ore
Type | Tonnes
(M) | Gold Grade
(g/t) | Gold Ounces
(k) |
| Proven | Sediment | - | - | - |
| Intrusive | 0.3 | 0.38 | 3.3 |
| Probable | Sediment | 38.7 | 0.42 | 519.8 |
| Intrusive | 5.0 | 0.28 | 45.3 |
| Proven & Probable | All | 44.0 | 0.40 | 568.4 |
| 2 |
| LA ARENA PROJECT |
| FORM 43-101F1 TECHNICAL REPORT |
The Mineral Resource and Mineral Reserve estimates were prepared in accordance with NI 43-101, and classifications adopted by the CIM Council. The effective date of the La Arena Mine Mineral Resource and Mineral Reserve estimates is January 1, 2018.
The current operation has been mining the oxide deposit at the La Arena Mine since 2011. The operation is a conventional drill, blast, shovel and truck open pit run-of-mine (ROM) operation. Mining is carried out on two 12-hour shifts, operating 7 days per week under an alliance style contract with Peruvian contractors. The oxide ore is hauled directly from the pit to the leach facility or to stockpiles.
The mining fleet consists of 90 tonne class rock trucks and 10 m3 hydraulic shovels. Blasthole drilling is performed by diesel powered rotary single pass track drills. Ancillary support equipment includes motor graders, track dozers and water trucks. Mining at the La Arena Mine is in the final stage of the Calaorco pit. The current mine schedule shows mining will be completed in 2021. The production schedule for the remaining Calaorco pit is shown in Table 1-3.
Table 1-3: La Arena Mine Mining Schedule
| Mine Schedule | 2018 | 2019 | 2020 | 2021 |
| Leach Ore Mined | kt | 14,344 | 12,520 | 9,608 | 6,385 |
| Au grade | g/t | 0.42 | 0.42 | 0.39 | 0.42 |
| Au ounces | koz | 192.5 | 167.6 | 121.1 | 86.7 |
| Waste Mined | kt | 26,463 | 33,105 | 21,602 | 1,086 |
| Total Mined | kt | 40,807 | 45,625 | 31,211 | 7,472 |
| Strip Ratio | | 1.8 | 2.6 | 2.2 | 0.2 |
Ore from the La Arena Mine is truck-dumped onto leach pads with no crushing or agglomeration required prior to leaching. The operation has a capacity of 40,000 tonnes per day. Cyanide leach solution is applied by drip emitters at a rate of 0.175 kg per tonne of ore. Pregnant solution is collected in a 73,000 m3 pregnant solution pond, from which it is pumped to the ADR plant for gold recovery.
The ADR plant comprises 35 carbon adsorption columns, two scavenger carbon columns, two pressure strip vessels and 8 units of electrowinning cells with a total volume of 12 m3. The target gold loading on carbon is 4,000 to 6,000 grams per tonne. Once this target is reached, the loaded carbon is pumped from the carbon adsorption tank to one of the strip vessels carbon is stripped using the standard pressure Zadra procedure. Gold metal collected in the electrolytic cathodes is smelted and molded into bullions. The average life of mine gold recovery at the La Arena Mine is approximately 86%.
| 1.3.5 | Project Infrastructure |
The La Arena Mine includes an open pit, a waste rock storage facility, fully lined leach pads, a lined pregnant solution pond, a lined major events pond (storm water catchment), an ADR processing plant, water treatment plant and sundry facilities including a 600-person camp and associated facilities.
Power for the La Arena Mine is supplied from the 220 kV national grid to the La Ramada substation built by La Arena S.A. in 2014. Power is distributed by an internal power distribution network supplying 22.9 kV to all facilities.
| 3 |
| LA ARENA PROJECT |
| FORM 43-101F1 TECHNICAL REPORT |
The La Arena Mine is authorized to pump ground water from three water wells. Water is pumped to a holding tank and distributed to the workshop, offices, camp, and kitchen via a potable water filtration system. Water can also be delivered to the oxide processing plant for makeup water. The water quality is good and the pH is neutral.
The design of the existing La Arena Mine leach pads is based on conventional pad technology modified to accommodate the mountainous terrain as is common in Peru. The leach pad is contained and all solutions drain into a pregnant solution pond.
All waste material is hauled to the waste rock storage facility located south of the Calaorco pit. Non-Acid Generating (NAG) waste is used to encapsulate the Potentially Acid Generating (PAG) waste.
| 1.3.6 | Capital and Operating Costs |
As the La Arena Mine is a mature operation, capital and operating costs are well understood.
There are no project capital expenditures remaining, as all major components of the operation have been constructed. Only sustaining capital expenditures will be required to maintain production. The estimated sustaining capital requirement for the remaining life of the La Arena Mine gold oxide operation is estimated to be $64.9 million. This includes expansion of the waste rock storage and leach pads, pit dewatering system, land purchases and water treatment facilities. Major sustaining capital items are shown in Table 1-4.
Table 1-4: La Arena Mine Sustaining Capital Expenditures Remaining LOM
| Sustaining Mine Capital | Total LOM
($M) |
|
| Process Expansions | $20.1 |
| Waste Rock Storage | $10.4 |
| Water Treatment | $15.3 |
| Pit Dewatering System | $5.7 |
| Land Purchase | $7.7 |
| Capitalized Mining | $5.0 |
| Other | $0.7 |
| Total | $64.9 |
Table 1-5 shows the total operating costs over the remainder of the operation and Table 1-6 shows operating costs on a per tonne basis.
Table 1-5: La Arena Mine Operating Costs Remaining LOM
| Operating Costs | Total LOM
($) |
|
| G&A Costs | $87.1 |
| Process Costs | $51.9 |
| Mining Costs | $213.0 |
| Total Operating Costs | $352.0 |
| 4 |
| LA ARENA PROJECT |
| FORM 43-101F1 TECHNICAL REPORT |
Table 1-6: La Arena Mine Operating Cost per Tonne
| Operating Costs | | |
| G&A Costs | $/t processed | $2.06 |
| Process Costs | $/t processed | $1.26 |
| Mining Costs | $/t processed | $4.71 |
| |
| Mining Costs | $/t mined | $1.78 |
| 1.3.7 | Interpretation, Conclusions, and Recommendations |
The La Arena Mine is a mature operation. There is good understanding of the geology and geologic controls on mineralization, mining practices, process methodology and gold recovery, and operating and sustaining capital costs.
All permits required for the current operation of the La Arena Mine are current. A modified Environmental Impact Study (EIAd) will likely be required to accommodate the life of mine waste dump and leach pads.
Increasingly positive production reconciliations are likely the result of the final stage of the open pit nearing the limits of the tightly-spaced definition drilling. Geologic mapping has revealed an increase in the density and extent of higher-grade Tilsa and associated structures that were not evident with the current drill density in the lower portions of the resource. Drilling to identify additional resources below the current pit design with potential to extend the mine life was initiated in late 2017 and is continuing in 2018.
Assuming the La Arena mine operates within its permit requirements, the authors do not reasonably foresee any risks on the project’s continued economic viability.
The La Arena II Project is a porphyry-hosted copper-gold deposit adjacent to the La Arena Mine. There has been no production from the La Arena II Project.
The La Arena II PEA supersedes the NI 43-101 Technical Report issued by Rio Alto in 2015 which considered a small capital-constrained project with restrictive financial hurdles. The resulting Mineral Resource and Mineral Reserve estimates presented in the prior study represented only a small portion of the total Mineral Resources. This PEA re-evaluates the La Arena copper-gold porphyry project in the context of a long-term copper-gold project without regard to the constraints previously applied.
The 2015 study included Probable Mineral Reserves. There are no Mineral Reserves reported in this 2018 PEA as the scope of the project has changed significantly with new exploration results, a refined geologic model, an updated Mineral Resource estimate, increased mining and processing rates, with updated capital and operating cost parameters, modified processing scheme, and the use of alternative tailings disposal facilities. While a portion of the data generated for the 2015 study provides support for some of the assumptions incorporated into the 2018 PEA of the project, most of the mining, processing, geotechnical, hydrological, social, and capital and operating cost parameters used in the 2015 study are no longer applicable to the project as envisioned in the 2018 PEA.
The La Arena II PEA is preliminary in nature and includes Inferred Mineral Resources that are considered too speculative geologically to have the economic considerations applied to them that would enable them to be categorized as Mineral Reserves, and there is no certainty that the preliminary economic assessment will be realized.
| 5 |
| LA ARENA PROJECT |
| FORM 43-101F1 TECHNICAL REPORT |
| 1.4.1 | Geology and Mineralization |
Multiple intrusions of dacitic and andesitic feldspar porphyries have intruded the Cretaceous sedimentary sequence at the La Arena property. Four intrusive events have been identified – the earliest intrusive phase (FPA-1) is generally barren of mineralization; the second intrusive phase (FPA-2) intruded FPA-1 and is the primary host of the copper-gold mineralization at the La Arena II Project; the third intrusive stage (FPA-3) cross-cuts both FPA-1 and FPA-2 and generally contains nil to lower-grade copper-gold mineralization; and the fourth final intrusive phase (FPA-4) consists of narrow barren andesitic dikes. The La Arena Mine open pit is situated at the eastern margin of the FPA-3 intrusion, which occurs as a laccolith-like structure.
Porphyry-hosted copper-gold mineralization is associated with phyllic and potassic alteration, which is dominated principally by pyrite and chalcopyrite with lesser amounts of bornite, covellite, chalcocite and molybdenite. Mineral zoning from surface downwards below the oxidized cap is typically about 40 to 50 meters for the zone of secondary enrichment (chalcocite + covellite ± copper oxides) and ten to 40 meters for the mixed oxide-sulfide transitional zone (chalcocite + chalcopyrite ± covellite). The top of the primary sulfide mineralized zone (chalcopyrite ± bornite) which predominates at La Arena is typically located at depths in excess of 100 meters from the surface.
The copper-gold porphyry at La Arena II comprises an elongated mineralized body approximately 1,400 meters in length (oriented northwest-southeast) and 200 to 400 meters wide. Mineralization occurs as disseminations along hairline fractures as well as within larger veins. Mineralization has been identified by drilling to depths of 1,000 meters below the surface which shows the porphyry to be narrowing, but with no decrease in copper and gold grades.
| 1.4.2 | Mineral Resource and Mineral Reserve Estimates |
Measured and Indicated Mineral Resources for the La Arena II Project total 742.4 million tonnes with average gold and copper grades of 0.24 g/t and 0.35%, respectively, containing 5.6 million ounces of gold and 5.8 billion pounds of copper. Inferred Mineral Resources total 91.6 million tonnes with average gold and copper grades of 0.23 g/t and 0.17%, respectively, containing 683 thousand ounces of gold and 349 million pounds of copper. The La Arena Mine Mineral Resource estimate is summarized in Table 1-7.
Table 1-7: La Arena II Mineral Resources
| Material Type | Classification | Tonnes
(M) | Gold
(g/t) | Copper
(%) | Gold
(koz) | Copper
(mlbs) |
| Oxide | Measured | 5.9 | 0.27 | - | 51 | - |
| | Indicated | 43.2 | 0.28 | - | 388 | - |
| | Measured + Indicated | 49.1 | 0.28 | - | 440 | - |
| | Inferred | 41.3 | 0.26 | - | 349 | - |
| Sulfide1 | Measured | 149.7 | 0.25 | 0.39 | 1,214 | 1,279 |
| | Indicated | 543.5 | 0.23 | 0.38 | 3,984 | 4,511 |
| | Measured + Indicated | 693.2 | 0.23 | 0.38 | 5,197 | 5,790 |
| | Inferred | 50.4 | 0 21 | 0.31 | 344 | 349 |
| Total | Measured | 155.7 | 0.25 | 0.37 | 1,265 | 1,279 |
| | Indicated | 586.7 | 0.23 | 0.35 | 4,372 | 4,511 |
| | Measured + Indicated | 742.4 | 0.24 | 0.35 | 5,637 | 5,790 |
| | Inferred | 91.6 | 0.23 | 0.17 | 683 | 349 |
| 1includes supergene, transitional oxide-sulfide and sulfide Mineral Resources | Totals may not sum due to rounding |
| 6 |
| LA ARENA PROJECT |
| FORM 43-101F1 TECHNICAL REPORT |
The La Arena II Mineral Resources are reported within an optimized undiscounted cash flow pit shell using metal prices of $4.00 per pound copper and $1,500 per ounce gold and operating cost parameters developed for the La Arena II PEA. Oxide Mineral Resources are reported using a 0.10 g/t gold cut-off grade; sulfide Mineral Resources are reported using a 0.18% copper-equivalent (CuEq) cut-off grade calculated using $4.00 per pound copper and $1500 per ounce gold. The La Arena II Mineral Resource estimate is reported below the post-La Arena Mine topographic surface and below the pit shell used to report the La Arena Mine Mineral Resources.
Drilling and sampling practices at the La Arena II Project are appropriate for the style and distribution of the porphyry-hosted copper-gold mineralization and provide for a reliable representation of the deposit. Multiple data verification programs of the project database, analytical data and quality assurance/quality control programs are sufficient to ensure the dataset used for the Mineral Resource estimate is valid.
The Mineral Resource estimate for the La Arena II Project was prepared in accordance with NI 43-101, and classifications adopted by the CIM Council. The effective date of the La Arena Mineral Resource estimate is January 1, 2018. There are no Mineral Reserves reported for the La Arena II Project.
The PEA considers the La Arena II project as a conventional drill, blast, truck and shovel operation. The study contemplates that the Owner will own and operate all equipment.
Two processing streams are envisioned for the La Arena II Project. Oxide leach material will be hauled to a ROM leach facility. Sulfide material will be hauled to a differential flotation processing facility where a copper-gold concentrate and a pyrite concentrate will be produced. Waste rock will be hauled from the pit to the dry stack tailings facility for use as embankment material or to the waste rock storage facility.
The mine plan was developed to deliver 80,000 tonnes per day of sulfide resources to the flotation process plant. Oxide resources extracted would be hauled directly to the new oxide leach pad. Over the 21 year mine life (excluding pre-production), the mine will deliver 587.4 million tonnes of sulfide resources containing 4.98 billion pounds of copper and 4.54 million ounces of gold to the flotation plant, with an additional 46.6 million tonnes of oxide resources containing 501 thousand ounces delivered to the leach pad. The average mining rate, including waste, is about 110 million tonnes per year over the 21 year mine life.
Total Mineral Resources processed in the mine plan are shown in Table 1-8.
Table 1-8: La Arena II Project Mineral Resources in Mine Plan
| Resources | Units | Total |
| Oxide Leach Tonnes | M | 69.5 |
| Au grade | g/t | 0.30 |
| Cu grade | % | - |
| Au contained ozs | k | 669.4 |
| Cu contained lbs | M | - |
| | | |
| Sulfide Milled Tonnes | M | 616.4 |
| Au grade | g/t | 0.24 |
| Cu grade | % | 0.38 |
| Au contained ozs | k | 4,753.7 |
| Cu contained lbs | M | 5,215 |
| 7 |
| LA ARENA PROJECT |
| FORM 43-101F1 TECHNICAL REPORT |
The process plant for the La Arena II Project has been designed with a nameplate capacity of 80,000 tpd. The annual ore tonnage milled is nominally 28.8 million tonnes with a life of mine average feed grade of 0.38% Cu and 0.24 g/t Au. The metallurgical recoveries used in this study are summarized in Table 1-9.
Table 1-9: Metallurgical Recovery Assumptions
| Heap Leach Recovery |
| | Sediments | Porphyry |
| Copper Recovery | 0.0% | 0.0% |
| Gold Recovery | 86.0% | 83.0% |
| Mill Recovery |
| | Sulfide | Supergene | Mixed | Oxide |
| Copper Recovery | 87.6% | 87.6% | 43.8% | 0.0% |
| Gold Recovery | 60.1% | 60.1% | 30.5% | 0.0% |
Copper concentrate is produced by conventional flotation with one rougher stage followed by two stages of cleaning. A pyrite flotation circuit is included to reduce the acid generating potential of the mill tailing. Mill tailing and the pyrite tailing will be filtered separately and deposited in separate storage facilities.
| 1.4.5 | Project Infrastructure |
The proposed La Arena II Project includes an open pit, differential flotation processing plant, heap leach pad, dry stack tailing storage facility, lined pyrite tailing storage facility and waste rock storage facility. With the exceptions of the existing ADR plant to process pregnant solution from the new La Arena II heap leach pad and the assay laboratory (which would be relocated), none of the current La Arena Mine facilities will be used for the La Arena II Project.
A 28.5 km road diversion south of the mine site will be needed early during construction to prevent the public from passing through the mining area and to open up options for waste dumps and other future mine infrastructure.
Power to the La Arena Mine is presently supplied from the 220 kV national grid to the La Ramada substation, adjacent to the mine. The existing transmission lines feeding the La Ramada substation have a theoretical capacity of 240 MVA. The La Arena II Project’s new electrical load is envisioned to be 120 MVA.
Processing facilities with filtered tailings require approximately 0.3 m3 of make-up water per each tonne of ore processed. The make-up water for La Arena II is estimated to be 280 L/s. An estimated 180 L/s can be supplied by the pit dewatering program. In the dry season, the remaining estimated water needs of 100 L/s will need to be supplied from groundwater sources. During the rainy season, captured surface water runoff from the tailings and waste rock will provide the required make up water.
There will be two filtered tailings facilities: one for non-acid generating tailings; and one for acid generating tailings (pyrite tailings), which will be lined. The filter pressed tails will be deposited in layers by mobile stacking conveyors. Embankments of non-acid generating waste rock will be constructed around the perimeter of the tailings facilities to provide further stability and containment. The heap leach pad will be within the footprint of the overall tailings facility, will be operated for only the first nine years of mine life, and ultimately will be fully surrounded and covered by non-acid generating tailings after rinsing of the heap has been completed.
| 8 |
| LA ARENA PROJECT |
| FORM 43-101F1 TECHNICAL REPORT |
Non-acid generating materials will be utilized to encapsulate the potentially acid generating material in the surface waste rock storage facility. Detailed test work of waste material geochemistry, including ABA, humidity cell test, meteoric water mobility tests are required to determine waste rock classification. Runoff water from these areas will flow through sediment ponds, discharging into the process water pond for reuse, or discharged offsite with treatment, as necessary.
The outer slopes of the dry stack tailings facility and waste rock dump will be concurrently reclaimed and vegetated as the tailings and waste rock advances, allowing for surface water runoff directly to native streams. At closure, the top surface of the tailings will be graded, covered if necessary, and vegetated. The closed facilities will thus become a stable geomorphic feature of the landscape.
| 1.4.6 | Capital and Operating Costs |
The capital cost for initial developed for the La Arena II Project totals $1,363.9 million, including pre-production credits as summarized in Table 1-10. LOM sustaining capital is estimate at $1,092.7 million, as summarized in Table 1-11.
Table 1-10: La Arena II Project Initial Capital Summary
| Cost Item | Total ($M) |
| Process Plant and Infrastructure | |
| Project Directs | $598.7 |
| Project Indirects | $169.3 |
| Contingency | $192.0 |
| Subtotal | $960.0 |
| Mine Equipment | $260.2 |
| Owner's Costs | $145.4 |
| Pre-Production Credit | ($1.7) |
| Total | $1,363.9 |
Table 1-11: La Arena II Project Sustaining Capital Summary
| Cost Item | Total ($M) |
| Mine Equipment | $406.9 |
| Capitalized Mining | $593.7 |
| Dewatering Wells | $13.2 |
| Process | $78.9 |
| Total | $1,092.7 |
Operating costs for the La Arena II Project were determined using engineering first principles and management experience at similar size operations. The anticipated average annual operating costs are shown in Table 1-12.
| 9 |
| LA ARENA PROJECT |
| FORM 43-101F1 TECHNICAL REPORT |
Table 1-12: La Arena II Average Annual Operating Costs
| Total ($M) | $/tonne
processed | $/tonne
mined |
|
| Mining | $120.5 | $3.93 | $1.33 |
| Processing1 | $162.9 | $5.29 | - |
| General & Administrative | $27.9 | $0.91 | - |
| Refining & Treatment | $84.0 | $2.74 | - |
| Total | $395.3 | $12.87 | - |
(1) Processing costs is weighted average of leaching $1.15 per leach tonne and mill $5.61per mill tonne
The average LOM production cost is $12.87 per tonne of ore processed over the 21 year mine life (excluding preproduction revenue and cost), which equates to co-product costs of $1.55 per pound of saleable copper and $600 per ounce of saleable gold.
This study envisions that La Arena II would produce an average of 200 million pounds of payable copper and 142 thousand ounces of payable gold per year, in concentrate and doré, over the 21 year mine life plus an additional 111 million pounds of payable copper and 221 thousand ounces of payable gold in the pre-production period. The total metal recovered to concentrate and doré is 4.5 billion pounds of copper and 3.4 million ounces of gold. The total payable metal produced to concentrate and doré is 4.3 billion pounds of copper and 3.2 million ounces of gold.
The base case economic analysis of the La Arena II project indicates that the project has an NPV at 8% discount rate (NPV8) of $823.8 million and IRR of 14.7% .
La Arena II would generate an average of $273 million in after-tax cash flow over the 21 year mine life, excluding preproduction cash flow and post-mining reclamation costs. The complete financial model for the La Arena II Project is included in Section 22 – Economic Analysis.
Sensitivity analyses were conducted using changes in metal prices, operating cost, initial capital, and sustaining capital. The results are shown in Table 1-13.
| 10 |
| LA ARENA PROJECT |
| FORM 43-101F1 TECHNICAL REPORT |
Table 1-13: Sensitivity Analysis after Taxes
| Metal Prices | NPV @ 0% | NPV @ 5% | NPV @ 8% | NPV @ 10% | IRR% | Payback |
| Base Case | $4,250 | $1,594 | $824 | $485 | 14.7% | 4.6 |
| 20% | $6,636 | $2,835 | $1,712 | $1,209 | 21.0% | 3.1 |
| 10% | $5,449 | $2,220 | $1,272 | $851 | 18.0% | 3.7 |
| 0% | $4,250 | $1,594 | $824 | $485 | 14.7% | 4.6 |
| -10% | $3,050 | $968 | $375 | $118 | 11.2% | 5.8 |
| -20% | $1,838 | $335 | ($78) | ($252) | 7.3% | 8.4 |
| | | | | | | |
| Operating Cost | NPV @ 0% | NPV @ 5% | NPV @ 8% | NPV @ 10% | IRR% | Payback |
| Base Case | $4,250 | $1,594 | $824 | $485 | 14.7% | 4.6 |
| 20% | $3,311 | $1,071 | $434 | $159 | 11.5% | 5.7 |
| 10% | $3,781 | $1,332 | $629 | $322 | 13.1% | 5.1 |
| 0% | $4,250 | $1,594 | $824 | $485 | 14.7% | 4.6 |
| -10% | $4,719 | $1,855 | $1,018 | $648 | 16.3% | 4.1 |
| -20% | $5,182 | $2,112 | $1,209 | $807 | 17.9% | 3.7 |
| | | | | | | |
| Initial Capital | NPV @ 0% | NPV @ 5% | NPV @ 8% | NPV @ 10% | IRR% | Payback |
| Base Case | $4,250 | $1,594 | $824 | $485 | 14.7% | 4.6 |
| 20% | $4,067 | $1,404 | $637 | $301 | 12.6% | 5.3 |
| 10% | $4,159 | $1,499 | $730 | $393 | 13.6% | 4.9 |
| 0% | $4,250 | $1,594 | $824 | $485 | 14.7% | 4.6 |
| -10% | $4,341 | $1,689 | $917 | $577 | 16.0% | 4.2 |
| -20% | $4,432 | $1,783 | $1,011 | $669 | 17.6% | 3.8 |
| | | | | | | |
| Sustaining Capital | NPV @ 0% | NPV @ 5% | NPV @ 8% | NPV @ 10% | IRR% | Payback |
| Base Case | $4,250 | $1,594 | $824 | $485 | 14.7% | 4.6 |
| 20% | $4,100 | $1,518 | $772 | $445 | 14.4% | 4.6 |
| 10% | $4,175 | $1,556 | $798 | $465 | 14.5% | 4.6 |
| 0% | $4,250 | $1,594 | $824 | $485 | 14.7% | 4.6 |
| -10% | $4,324 | $1,631 | $849 | $505 | 14.9% | 4.6 |
| -20% | $4,399 | $1,669 | $875 | $525 | 15.0% | 4.5 |
| | | | | | | |
| Total Capital | NPV @ 0% | NPV @ 5% | NPV @ 8% | NPV @ 10% | IRR% | Payback |
| Base Case | $4,250 | $1,594 | $824 | $485 | 14.7% | 4.6 |
| 20% | $3,918 | $1,328 | $585 | $261 | 12.3% | 5.3 |
| 10% | $4,084 | $1,461 | $705 | $373 | 13.4% | 5.0 |
| 0% | $4,250 | $1,594 | $824 | $485 | 14.7% | 4.6 |
| -10% | $4,415 | $1,726 | $943 | $597 | 16.2% | 4.2 |
| -20% | $4,581 | $1,859 | $1,062 | $709 | 17.9% | 3.8 |
| 1.4.8 | Interpretation, Conclusions, and Recommendations |
The preliminary economic assessment for the La Arena II Project indicates the potential economic viability of the porphyry-hosted copper-gold deposit worthy of further study. The PEA of the project shows a life of mine after-tax net income of $4.6 billion, with an NPV8 of $824 million, an IRR of 14.7% and payback of 4.6 years. Average annual after-tax cash flow is estimated to be $273 million over the 21 year mine life.
The 2018 La Arena II PEA incorporated a portion of the information and data from prior studies to provide support for some of the assumptions incorporated into the PEA, though much of the mining, processing, geotechnical, hydrological, social, and capital and operating cost parameters used in the prior study are no longer applicable to the project as envisioned in this Technical Report.
| 11 |
| LA ARENA PROJECT |
| FORM 43-101F1 TECHNICAL REPORT |
The following list is not exhaustive, but highlights some of items that are recommended for the next stage of project evaluation:
| | • | Resource definition; |
| | • | Further metallurgical testing; |
| | • | Geotechnical evaluation of the waste rock and tailings facilities foundations; |
| | • | Geochemical evaluation of the waste and tailings material; |
| | • | Detailed geotechnical assessments of the pit wall slope designs; and |
| | • | Detailed hydrogeology studies to quantify dewatering needs and support pit lake modeling. |
While the authors have confidence in the level of study completed and the results of the La Arena II PEA, it is with the understanding that the La Arena II PEA is preliminary in nature and includes Inferred Mineral Resources that are considered too speculative geologically to have the economic considerations applied to them that would enable them to be categorized as Mineral Reserves, and there is no certainty that the preliminary economic assessment will be realized.
The Mineral Resource estimate for the La Arena II Project is contained within a pit shell, but the mineralized porphyry deposit continues at depth as demonstrated by drill intercepts below the resource pit limits. While the porphyry appears to be narrowing somewhat at depth, the deepest drill holes in the deposit do not show signs of decreasing copper and gold grades with depth. While not a specific recommendation necessary to advance the La Arena II Project as envisioned in this report, Tahoe should consider scoping-level studies to evaluate the potential for underground bulk mining, such as block cave or sublevel cave mining methods that could extend the mine life beyond the life of the open pit.
| 12 |
| LA ARENA PROJECT |
| FORM 43-101F1 TECHNICAL REPORT |
This Technical Report is authored by M3 Engineering and Technology Corporation, of Tucson, Arizona, USA (M3) and Tahoe Resources Inc., of Reno, Nevada, USA (Tahoe or the Company) on behalf of Tahoe Resources Inc.
Tahoe is the sole proprietor of the La Arena Project, through its subsidiary, La Arena S.A. The La Arena Project consists of the currently operating gold oxide heap leach La Arena Mine and the La Arena II porphyry copper-gold deposit, each of which are the subjects of this Technical Report. The purpose of this Technical report is to provide an update to the currently operating La Arena Mine and present the Preliminary Economic Assessment (PEA) of the La Arena II copper-gold project. While both the La Arena Mine and the La Arena II Project occur within the overall La Arena property, each is a stand-alone project and independent of the other. Should the La Arena II Project be advanced, it would not be as an extension or expansion of the La Arena Mine operation.
The La Arena II PEA supersedes the NI 43-101 Technical Report issued in 2015 and referenced below. The prior study considered a small capital-constrained project with restrictive financial hurdles. The resulting Mineral Resource and Mineral Reserve estimates presented in the prior study represented only a small portion of the total Mineral Resources. This PEA re-evaluates the La Arena copper-gold porphyry project in the context of a long-term copper-gold project without regard to the constraints previously applied.
The 2015 study included Probable Mineral Reserves. There are no Mineral Reserves reported in this 2018 PEA as the scope of the project has changed significantly with new exploration results, a refined geologic model, an updated Mineral Resource estimate, increased mining and processing rates, with updated capital and operating cost parameters, modified processing scheme, and the use of alternative tailings disposal facilities. While a portion of the data generated for the 2015 study provides support for some of the assumptions incorporated into the 2018 PEA of the project, most of the mining, processing, geotechnical, hydrological, social, and capital and operating cost parameters used in the 2015 study are no longer applicable to the project as envisioned in the 2018 PEA.
The La Arena II PEA is preliminary in nature and includes Inferred Mineral Resources that are considered too speculative geologically to have the economic considerations applied to them that would enable them to be categorized as Mineral Reserves, and there is no certainty that the preliminary economic assessment will be realized.
The Technical Report has been prepared in accordance with Canadian National Instrument 43-101,Standards of Disclosure for Mineral Projects, which came into force on June 30, 2011. The effective date of this report is January 1, 2018.
| 2.1 | SOURCES OF INFORMATION |
There have been six Technical Reports previously filed on the La Arena Project on behalf of the prior owner of the La Arena Project:
| • | La Arena Project, Peru Technical Report, dated June 13, 2008 with an effective date of March 31, 2008, prepared by Coffey Mining Pty Ltd on behalf of Rio Alto Mining Limited. |
| | | |
| • | La Arena Project, Peru Technical Report, dated October 28, 2010 with an effective date of July 31, 2010, prepared by Coffey Mining Pty Ltd on behalf of Rio Alto Mining Limited. |
| | | |
| • | La Arena Project, Peru Technical Report (NI 43-101), dated February 17, 2012 with an effective date of September 30, 2011, prepared by Kirk Mining Consultants Pty Ltd on behalf of Rio Alto Mining Limited. |
| | | |
| • | La Arena Project, Peru Technical Report (NI 43-101), dated May 31, 2013 with an effective date of January 1, 2013, prepared by Kirk Mining Consultants Pty Ltd on behalf of Rio Alto Mining Limited. |
| 13 |
| LA ARENA PROJECT |
| FORM 43-101F1 TECHNICAL REPORT |
| • | La Arena Project, Peru Technical Report (NI 43-101), dated March 28, 2014 with an effective date of December 31, 2013, prepared by Mining Plus Peru S.A.C. on behalf of Rio Alto Mining Limited. |
| | | |
| • | La Arena Project, Peru, Rio Alto Mining Limited, Technical Report (NI 43-101), dated February 27, 2015 with an effective date of December 31, 2014, prepared by Mining Plus Peru S.A.C. on behalf of Rio Alto Mining Limited. |
Additional information was obtained by M3 or provided by Tahoe, and is contained and referenced herein.
| 2.2 | QUALIFIED PERSONS AND SITE VISITS |
The Qualified Persons for this Technical Report are as follows:
| • | Daniel Roth, of M3 Engineering – Project Infrastructure, Process Capital & Operating Costs, and Economic Analysis |
| | • | Art Ibrado, of M3 Engineering – Metallurgy and Recovery Methods |
| | • | Terry Munson, of Tahoe Resources – Mining, Infrastructure and Capital and Operating Mining Costs |
| • | Charlie Muerhoff, of Tahoe Resources – Site Location and Property Description, History, Geology, Exploration, Data Verification, Mineral Resource and Mineral Reserve Estimates, Market Studies and Environmental, Permitting and Social Impacts |
Table 2-1: Areas of Responsibility and Site Visit Dates
| QP Name | Certification | Site Visit Date | Area of Responsibility |
| Daniel Roth | P.Eng. | April 26, 2017 | Sections 2, 18.2, 21.1, 21.3 (process & infrastructure), 22, 24, 27, and corresponding sections of 1, 25 and 26. |
| Art Ibrado, PhD | PE | April 26, 2017 | Sections 13, 17, and corresponding sections of 1, 25 and 26. |
| Terry Munson | SME-RM | April 26, 2017 | Sections 16, 18.1, 21.2, 21.3 (mining) and corresponding sections of 1, 25 and 26. |
| Charlie Muerhoff | SME-RM | Numerous site visits
from 2015 through 2018 | Section 3 thru 12, 14, 15, 19, 20, 23, and corresponding sections of 1, 25 and 26. |
Throughout this report, the La Arena Mine refers to the oxide gold heap leach mining and processing facilities currently in operation by the Company, and the Mineral Resources and Mineral Reserves relative to that operation. The La Arena II Project refers to the porphyry-hosted copper-gold deposit, and the Mineral Resources and Mineral Reserves that are the subject of the PEA for the project. There has been no production from the La Arena II Project.
The report considers US Dollars ($) unless otherwise noted. Most units are metric, however, as noted and as standard for projects of this nature, certain statistics and scientific units are reported as avoirdupois or English units such salable precious metals which are described in terms of troy ounces and salable base metals which are described in terms of English pounds.
Table 2-2 shows the abbreviations that may be used in this report.
| 14 |
| LA ARENA PROJECT |
| FORM 43-101F1 TECHNICAL REPORT |
Table 2-2: Terms and Abbreviations
| Abbreviation | Unit or Term | | Abbreviation | Unit or Term |
| $ | United States Dollars | | GPS | Global Positioning System |
| % (grade) | Percent by weight (grade) | | ha | hectare |
| 2-D | Two-Dimensional | | HC | Humidity Cell |
| 3-D | Three-Dimensional | | HP / hp | Horsepower |
| 4WD | Four-Wheel Drive | | ICP | Inductively-Coupled Plasma |
| AA | Atomic Adsorption | | ICP | induced-coupled polarization |
| AAS | Atomic Absorption Spectrometry | | ID2 | Inverse Distance Squared |
| ABA | Acid Base Accounting | | ID3 | Inverse Distance Cubed |
| AG | Autogenous Grinding | | IRR | Internal Rate of Return |
| Ag | Silver | | Ja | joint alteration |
| AuEq | Gold Equivalent | | Jn | joint number |
| AGP | Acid Generation Potential | | Jr | joint roughness |
| ANP | Acid Neutralization Potential | | Jw | joint water reduction factor |
| ARD | Acid Rock Drainage | | k | thousands |
| AT | Assay Ton | | kg | kilograms |
| Au | Gold | | kg/t | kilograms per metric tonne |
| cfm | Cubic feet per minute | | km | kilometre |
| Chemex | ALS Chemex | | km2 | square kilometre |
| CO3 | Carbonate | | kPa | kilopascal |
| COG | Cut-off grade | | kV | kilovolt |
| Company | Tahoe Resources Inc. | | kW | kilowatt |
| Cu | Copper | | kW-h | Kilowatt-hour |
| CuEq | Copper Equivalent | | L | Liters |
| CV | Coefficient of Variation (standard eviation/mean) | | lb | pound |
| | LOM | Life of Mine |
| DDH | Diamond Drill Hole | | m | metre |
| dmt | Dry metric tonne | | M | millions |
| dmt/h | Dry metric tonnes per hour | | m3 | cubic metre |
| dmtpd | Dry metric tonnes per day | | M m3 | millions of cubic metres |
| dmtpy | Dry metric tonnes per year | | m3/h | cubic metres per hour |
| EIA | Environmental Impact Assessment | | Ma | Million years old |
| FA | Fire Assay | | masl | metres above sea level |
| Fe | Iron | | Mn | Manganese |
| ft | feet | | Mt | Megatonnes, or one thousand metric tonnes |
| g | gram | |
| g/cm3 | grams per cubic centimetre | | MTPD | Metric Tonnes per Day |
| g/t | grams per metric tonne | | MW | megawatt |
| 15 |
| LA ARENA PROJECT |
| FORM 43-101F1 TECHNICAL REPORT |
| Abbreviation | Unit or Term | | Abbreviation | Unit or Term |
| MWMP | Meteoric Water Mobility Procedure | | RQD | rock quality designation |
| MY | Million years old | | S | Sulphur |
| MWSF | Mine Waste Storage Facility | | S/R | Strip Ratio |
| NGO | non-governmental organizations | | Sb | Antimony |
| NNP | Net Neutralization Potential | | SCP | Silica Clay Pyrite |
| NPV | Net Present Value | | SRF | stress reduction factor |
| NSR | Net Smelter Return | | t/d | metric tonnes per day |
| opt | Troy ounces per English ton | | t/h | metric tonnes per hour |
| oz/t | troy ounce per short ton | | t/m3 | Tonne per cubic meter |
| PA | Preliminary Assessment or Preliminary Economic Assessment | | t/h/m2 | Tonnes per hour per square meter |
| | tonne | metric tonne |
| PAX | Potassium Amyl Xanthate | | tonnes | dry metric tonnes (where one tonne = 1.1023 short tons) |
| Pb | Lead | |
| EA | Preliminary Economic Assessment | | tpa | Tonnes per annum |
| ppb | part per billion | | tpy | Tonnes per year |
| ppm | Part per million | | UTM | Universal Transverse Mercator coordinate system |
| PROP | Propylitic | |
| PSD | Particle Size Distribution | | VFD | Variable Frequency Drive |
| QA/QC | Quality Assurance/Quality Control | | wmt | Wet Metric Tonne |
| QFP | Quartz Feldspar Porphyry | | XRD | X-Ray Diffraction |
| RC | Reverse Circulation | | XRF | X-Ray Fluorescence |
| RMR | rock mass rating | | Zn | Zinc |
| ROM | Run of Mine | | μm | micrometre or micron |
| rpm | revolutions per minute | | % (grade) | Percent by weight (grade) |
| 16 |
| LA ARENA PROJECT |
| FORM 43-101F1 TECHNICAL REPORT |
| 3 | RELIANCE ON OTHER EXPERTS |
The authors of this technical report have relied upon independent legal experts to establish and verify the legal status and ownership of the Company’s mineral concessions and surface properties.
| • | Rodrigo, Elias & Medrano, 2015, unpublished report on legal due diligence related to the Company’s acquisition of Rio Alto Gold Limited which covered the following areas: corporate, contractual, finance, mining concessions, real estate, environmental/social, water, regulatory (electricity, roads, hydrocarbons) archaeological heritage, administrative proceedings, intellectual property and IT matters, judicial and arbitration litigation and labor. |
| | | |
| • | CMS Grau, 2018, unpublished report on the real property controlled by the Company through ownership, co-ownership and possessory rights. |
Reports received from other experts who are not authors of this technical report have been reviewed for factual errors by the authors. Any changes made as a result of these reviews did not involve any alteration to the conclusions made. Hence, the statements and opinions expressed in these documents are given in good faith and in the belief that such statements and opinions are not false or misleading at the date of this report.
| 17 |
| LA ARENA PROJECT |
| FORM 43-101F1 TECHNICAL REPORT |
| 4 | PROPERTY DESCRIPTION AND LOCATION |
| | |
| 4.1 | PROPERTY LOCATION |
The La Arena property is located in the Huamachuco District, Sánchez Carrion province, Department of La Libertad in northern Peru, approximately 480 kilometers north-northwest of the city of Lima. The geographic center of the property is located at Latitude 07° 50’ South, Longitude 78° 08’ West; the Universal Transverse Mercator (UTM) center coordinates of the property are 9,126,360 North, 816,237 East (Zone PSAD36). A general location map of the property is shown in Figure 4-1.

Figure 4-1: La Arena Property Location
| 4.2 | MINERAL TENURE AND TITLE |
Through its wholly-owned subsidiary, La Arena S.A., the Company holds 27 mineral concessions in the area of La Arena totaling approximately 33,140 hectares. Of this total, approximately 25,440 hectares form the contiguous concession block which comprises the La Arena property; the remaining concessions, totaling approximately 7,700 hectares are located to the north and west of the property. The mineral concessions are 100% owned by and registered in the name of La Arena S.A. To the best of the Company’s knowledge, the mineral concessions are all in good standing, with no litigation or other legal issues pending. A map showing the contiguous mineral concession package is shown in Figure 4-2.
| 18 |
| LA ARENA PROJECT |
| FORM 43-101F1 TECHNICAL REPORT |
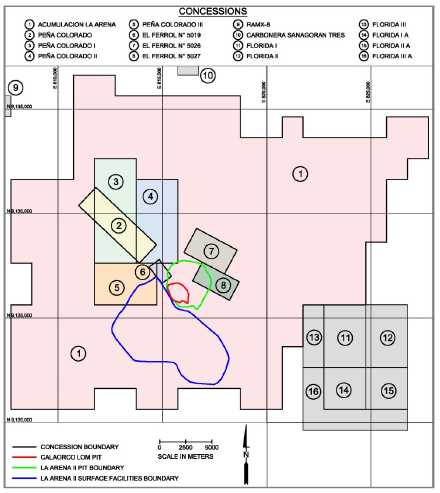
Figure 4-2: La Arena Concessions
All Mineral Resources identified at the La Arena Mine are contained within the amalgamated mining concessionAcumulación La Arena, which is free of any underlying agreements and/or royalties. The majority of Mineral Resources identified at La Arena II are also contained withinAcumulación La Arena, with a small portion of the Mineral Resources contained withinEl Ferrol No 5019 andEl Ferrol No 5027 mineral concessions.
Mining concessionsEl Ferrol No 5019,El Ferrol No 5026 andEl Ferrol No 5027 are subject to a two percent net smelter return (NSR) royalty payable to the previous owners. Mining concessionsFlorida I,Florida IA,Florida II,Florida IIA,Florida III andFlorida IIIA are subject to a 1.6% NSR royalty. Mining concessionsPeña Colorada,Peña Colorada I,Peña Colorada II andPeña Colorada III are subject to a 1.4% NSR royalty. All other concessions are free of underlying royalties.
Under Peruvian law, the Peruvian State is the owner of allin situ mineral resources until such time that valid mineral concessions are duly recorded with the State. The right to explore and develop mineral resources is granted by means of a mineral concession system. Mineral concessions are considered immovable assets and are therefore subject to being transferred, optioned, leased and/or granted as collateral (mortgaged) and, in general, may be subject to any transaction or contract not specifically forbidden by law. Mining concessions may be privately owned and the participation in the ownership by the Peruvian State is not required. Buildings and other permanent structures used in a mining operation are considered real property accessories to the concession on which they are situated.
| 19 |
| LA ARENA PROJECT |
| FORM 43-101F1 TECHNICAL REPORT |
Under the General Mining Law, mining rights may be forfeited only due to a number of enumerated circumstances provided by law (i.e., non-payment of maintenance fees and/or noncompliance with the Minimum Production Obligation). The right of concession holders to sell mine production freely in world markets is established. Peru is party to agreements with the World Bank Multilateral Investment Guarantee Agency and with the Overseas Private Investment Corporation.
The Company currently has surface ownership of approximately 1,948 hectares and has co-ownership of an additional 349 hectares which covers the current La Arena Mine operations; minor surface land additions are required to accommodate the La Arena Mine life of mine plan. Approximately 1,200 hectares of surface ownership or surface rights will need to be acquired to accommodate the La Arena II life of mine plan as envisioned in the PEA of the project.
| 4.3 | STATE ROYALTIES, TAXES AND FEES |
| | |
| 4.3.1 | Mineral Concession Maintenance Fees |
Pursuant to article 39 of the General Mining Law, titleholders of mining concessions pay an annual maintenance fee (Derecho de Vigencia) equal to approximately $3.00 per hectare which is due on June 30 of each year and effective for the following year. The failure to make maintenance fees for two consecutive years results in the termination of the mining concession. Maintenance fees for all mineral concessions at La Arena are current and all mineral concessions are in good standing.
| 4.3.2 | Modified Mining Royalty |
The Modified Mining Royalty (MMR) is paid to the Peruvian government by holders of mining concessions for the exploitation of metallic and non-metallic mineral resources. The MMR applies on all companies’ operating income. The MMR is payable on a quarterly basis with marginal rates ranging from 1% to 12%. An ‘operating income’ to ‘mining operating revenue’ measure is calculated each quarter and, depending on operating margin, the royalty rate increases as the operating margin increases. The new system is designed to provide both a minimum royalty and an additional amount based on the profitability of each project. The Company must always pay at least the minimum royalty rate of 1% of sales, regardless of its profitability. The payment of the MMR is considered an expense when determining corporate income tax in Peru.
| 4.3.3 | Minimum Production Obligation |
Titleholders of metallic mining concessions must reach a minimum level of annual production of at least one Tax Unit of 3,850 Peruvian Soles (S/.) per hectare (equal to about $1,360 per hectare) and three Tax Units within a period of ten years.
| 4.3.4 | OSINERGMIN Contribution |
Payments of 0.15% of the value of monthly operating costs are made toEl Organismo Supervisor de la Inversión en Energía y Minería (OSINERGMIN), Peru’s state energy and mines investment regulator. OSINERGMIN is the government agency of record to inspect and audit compliance with safety, job-related health and mine development matters. The OSINERGMIN contribution is calculated net of national and municipal taxes.
Annual NSR royalty payments of 0.11% are made toEl Organismo de Evaluación y Fiscalización Ambiental (OEFA), the government agency of record that inspects and audits mining operations to ensure compliance with environmental obligations and commitments. The OEFA contribution is calculated net of national and municipal taxes.
| 20 |
| LA ARENA PROJECT |
| FORM 43-101F1 TECHNICAL REPORT |
| 4.3.6 | Taxation and Foreign Exchange Controls |
The Tax Administration Superintendent is the entity empowered under the Peruvian Tax Code to collect federal government taxes. The Tax Administration Superintendent can enforce tax sanctions, which can result in fines, the confiscation of goods and vehicles, and the closing of a taxpayer’s offices.
The General Income Tax Regime in Peru currently imposes a 29.5% corporate income tax and a 5.0% tax rate on dividends. There are currently no restrictions on a company operating in Peru to transfer dividends, interest, royalties or foreign currency in or out of Peru or to convert Peruvian currency into foreign currency.
A Temporary Net Assets Tax applies to companies’ subject to the General Income Tax Regime. Net assets are taxed at a rate of 0.4% on the value exceeding S/.1,000,000 (approximately $345,000). Taxpayers must file a tax return during the first 12 days of April and the amounts paid can be used as a credit against Income Tax. Mining companies which have not started production or those in their first year of operation are exempt from the tax.
The Company is also subject to a Special Mining Tax (SMT) which is applied to operating income based on a sliding scale with progressive marginal rates ranging from 2% to 8.4% . The SMT is considered as an income tax for the purposes of this technical report.
Under Peruvian law, every company that generates income and has more than twenty employees on its payroll is obligated to grant a share of its profits to its workers. For mining companies, the percentage of this profit-sharing benefit is eight percent of taxable income. The profit-sharing amount made available to each worker is limited to 18 times the worker’s monthly salary, based upon their salary at the close of the previous tax year.
| 4.5 | ENVIRONMENTAL LIABILITIES |
Other than the obligations to conduct operation activities in compliance with Peruvian law and the Company’s approved permits, and conduct reclamation and closure activities pursuant to closure plans filed with the Ministry of Energy and Mines, the Company is not currently aware of any material environmental liabilities to which the property is subject.
At the effective date of this report, all permits required for the current operation of the La Arena Mine have been received. Required permits include approval of environmental impact assessments, water use license, archaeological permits, beneficiation concession (process plant operations), and implementation of the mine plan (Mining Permit), among others. Given the preliminary nature of the La Arena II study, there are no permits in place for the project as envisioned in this technical report. The following discussion summarizes the major required permits for operation activities at the La Arena property.
| 4.6.1 | Environmental Impact Assessment (EIA) |
The EIA documents the baseline environmental and socioeconomic environment of the mine/project and surrounding area and provides an analysis of the potential impacts to air quality, sound levels, surface and groundwater, soils, flora and fauna, archaeological resources and socioeconomic measures. The EIA includes an Environmental Management Plan which presents prevention and mitigation measures. The approval of an EIA allows the company to proceed with the permit applications required for construction and operation, in accordance with Peruvian regulations.
| 21 |
| LA ARENA PROJECT |
| FORM 43-101F1 TECHNICAL REPORT |
Approval of the Mining Plan authorizing the start of construction and operation activities is under the jurisdiction of the Ministry of Energy and Mine. There are provisions for commissioning activities to be conducted under a temporary commissioning permit.
| 4.6.3 | Beneficiation Concession |
The Beneficiation Concession, which is submitted and approved by the Ministry of Energy and Mines, authorizes the operation of the processing plant and major processing components pf the mine.
| 4.6.4 | Certificate for the Inexistence of Archaeological Remains (CIRA) |
Archeological surveys in the project area in support of environmental permits are necessary to conduct exploration or exploitation activities. Surveys are undertaken to determine the presence of sites considered to have potential archaeological significance and, if found, mitigation of the sites in coordination with the Ministry of Culture is required. If no archeological sites are found or if identified sites have been adequately rescued, aCertificate for the Inexistence of Archaeological Remains is granted. This certificate is a pre-requisite for the Ministry of Energy and Mines to approve the start of operations.
Mine Closure Plans are required by the Ministry of Energy and Mines. This permit specifies that all components of the project will be closed in three gradual stages (concurrent, final and post closure reclamation and monitoring). The Mine Closure Plan also includes the budget and schedule for the reclamation and closure and the amount of guarantees to be paid for the closure bond.
Water Use licenses are required for the extraction of surface or ground waters for use in operations. Water Use Licenses are issued by the National Water Authority.
| 4.6.7 | Permanent Power Concession |
A Permanent Power Concession is required for connection to the transnational power grid and for substation operations. The concession is awarded from theComité de Operación Económica del Sistema Interconectado Nacional (Committee of Economic Operation of the National Interconnected System, or COES) after acceptance of required environmental and social studies and construction plans.
| 4.6.8 | Other Operation Permits |
Additional permits required for operations include permits for fuel storage, reagent storage and use, explosive magazines, explosives handling and use, and power generation. District and/or Provincial licenses may be required for exploration, development, construction, and operating activities as well as for easements to accommodate subsidiary power lines to the project site, access roads, and roads internal to the project.
| 22 |
| LA ARENA PROJECT |
| FORM 43-101F1 TECHNICAL REPORT |
| 4.7 | RISKS THAT MAY AFFECT ACCESS, TITLE, OR THE RIGHT OR ABILITY TO PERFORM WORK |
Natural resource exploration, development, production and processing involves a number of risks, many of which are beyond the Company's control. Project and business risk factors and discussion on these are included in the Company’s quarterly Management Discussion and Analysis and the Annual Information Forms filed on SEDAR. Such risks include, but are not limited to, the following items.
| | • | Changes in the market price for mineral products. |
| | | |
| • | Community groups or non-governmental organizations that may initiate or undertake actions that could delay or interrupt the Company’s activities. |
| | | |
| • | Future construction and operating costs may differ from those costs projected in the financial study for the La Arena II Project. |
| | | |
| | • | The inability to acquire surface ownership or surface rights as they relate to the La Arena II Project. |
| | | |
| • | While the Company considers the regulatory environment in Peru to be very stable, the Company’s activities are subject to environmental laws and regulations that may change over time. |
| | | |
| • | The Company requires numerous permits in order to conduct exploration, development and mining activities at the La Arena property. Delays in obtaining permits and licenses necessary for operations or failure to comply with the terms of any such permits and licenses could have a material adverse effect on the La Arena Mine and the La Arena II Project. |
| | | |
| • | Title to the Company’s mineral properties at La Arena may be subject to prior unregistered agreements, transfers or claims or defects. |
| | | |
| | • | Changes in taxation legislation or regulations in Peru. |
The foregoing notwithstanding, the Company believes that there are no significant risks to the La Arena Mine or the La Arena II Project in regard to concession title, the ability to access the projects, the receipt of the remaining permits and licenses, or the Company’s ability to perform the work as described in this technical report.
| 23 |
| LA ARENA PROJECT |
| FORM 43-101F1 TECHNICAL REPORT |
| 5 | ACCESSIBILITY, CLIMATE, LOCAL RESOURCES, INFRASTRUCTURE AND PHYSIOGRAPHY |
| | |
| 5.1 | ACCESSIBILITY |
Access to the La Arena is via a 165-kilometer paved national highway east from the coastal city of Trujillo. Trujillo is served by several national commercial airlines. A military/municipal air strip is located in the town of Huamachuco, approximately 21 kilometers from the La Arena property. Barrick Gold also operates a private airstrip at their nearby Lagunas Norte Mine.
| 5.2 | PHYSIOGRAPHY AND CLIMATE |
The La Arena property is located in the eastern slope of the Western Cordillera, close to the continental divide, at elevations ranging from 3,000 to 3,600 meters above sea level. Topography of the project area can generally be described as undulating hills, with stable slopes varying between 15° and 30°, though there are localized unstable areas where landslides are not uncommon during the rainy season, particularly where the landscape is cut by incised drainages. Vegetation in the area is generally treeless, dominated by shrub vegetation, high-altitude grasslands known aspuna, and agricultural areas.
In Peru, the temperature normally varies according to elevation, approximately 0.8°C per 100 meters of elevation change. The average annual temperature recorded from the La Arena meteorological station is 10.6ºC, with a maximum recorded temperature of 22.6°C and minimum temperature of 0.4ºC.
Historically, total average annual rainfall is estimated at 1,124 mm with an average annual evaporation rate of 733 mm. The average relative humidity varies monthly between 77% and 88%. Maximum precipitation usually occurs during the months of October through March while the months of June to September are generally dry. The maximum daily precipitation recorded to date at the La Arena property was 246 mm during the rainy season with minimum precipitation of 0 mm common during the dry season. The climate allows for year-round operations, though proper stormwater management is critical during the rainy season.
| 5.3 | LOCAL RESOURCES AND INFRASTRUCTURE |
There are three communities, La Arena, La Ramada and Peña Colorada, in the defined direct area of influence of the La Arena Mine with a total population of about 1,500 residents. The town of Huamachuco, located about 21 kilometers from the project site, has a population of approximately 35,000. The city of Trujillo, Peru’s third most populous city, has approximately 830,000 residents. Priority for employment at the La Arena Mine is given to the local area and expanded to outlying communities whenever possible. More experienced and technical personnel have been recruited from throughout Peru. At the end of 2017, the La Arena Mine employed 633 people, with 59% of employees from La Libertad department. In addition, there were approximately 1,000 contractors working at the La Arena Mine in 2017, on average. As there is an extensive mining culture in La Libertad province and elsewhere in Peru, the Company anticipates adequate skilled human resources will be available for the La Arena II Project.
The Company has acquired approximately 2,297 hectares of surface rights, either in ownership or co-ownership, to support the current La Arena Mine and supporting infrastructure. Approximately 60 hectares of additional surface rights will be required to accommodate the full life of mine plan for the La Arena Mine. The Company estimates an additional 1,200 hectares of surface rights will be required to accommodate the proposed La Arena II infrastructure. All of the surface rights to be acquired are individually-owned, rather than community-held lands.
Supply water for processing plant, camp, workshop and other facilities at the La Arena Mine is provided from two groundwater wells capable of producing a combined 15 liters per second of water (L/s). The third authorized water well is currently not in use. Water wells are located on the Company’s property. Stormwater collected during the rainy season is utilized for process makeup water when available. Sewage and waste water management facilities are installed. Sufficient water is available for the operation of the La Arena Mine; additional water will need to be sourced for the La Arena II Project.
| 24 |
| LA ARENA PROJECT |
| FORM 43-101F1 TECHNICAL REPORT |
The La Arena Mine was connected to the transnational power grid in 2014. All facilities are connected to the internal 22.9 kV power network via the La Ramada substation built by the Company and located a few kilometers from the mine. Initial discussions with COES indicate sufficient power is available for the operation of La Arena II with increased capacity of the substation necessary.
| 25 |
| LA ARENA PROJECT |
| FORM 43-101F1 TECHNICAL REPORT |
The La Arena deposits were discovered by Cambior Inc. (Cambior) in December 1994, though it is likely that some historic artisanal mining of the surficial oxide gold occurred prior to this time. Cambior staked 1,800 hectares of mining concessions over the deposit area in January 1995 and claimed a further 70,000 hectares of concessions in 1996, most of which were allowed to lapse or were sold. The mining concessions making up the La Arena property passed to Iamgold Quebec Management Inc., a wholly-owned subsidiary of Iamgold Corporation (Iamgold) following its acquisition of Cambior in November 2006.
Rio Alto Mining Limited (Rio Alto) entered into an option and earn-in agreement with Iamgold Quebec Management Inc. in June 2009 which provided it with an option to acquire 100% of La Arena S.A., Iamgold’s Peruvian subsidiary which owned the La Arena Project, upon payment of US$47.6 million, subject to certain adjustments and the completion of expenditure commitments. In February 2011, Rio Alto announced that it had completed its expenditure commitments and exercised its option to acquire 100% of the La Arena property from Iamgold upon payment of a final price of US$49.0 million. Rio Alto initiated construction of the La Arena Mine and placed the mine into production in late 2011. The La Arena Mine has operated continuously since that time.
Tahoe acquired Rio Alto and its subsidiaries in April 2015 in an all-stock transaction valued at US$868 million, at which time the Company assumed ownership of La Arena S.A. and the La Arena Mine and property.
Exploration by previous owners of the La Arena property was conducted by Cambior, Iamgold and Rio Alto from 1996 through April 2015, the date of Tahoe’s acquisition of Rio Alto.
Cambior explored the La Arena property and surrounding prospects from 1995 through 2006, conducting detailed surface geologic mapping, geochemical sampling of outcrop and soils, trenching and drilling programs to advance their understanding and definition of the sediment-hosted oxide gold deposit and porphyry-hosted copper-gold deposit. Up to the time of their acquisition by Iamgold, Cambior drilled 313 diamond drill (core) holes and 11 reverse-circulation (RC) drill holes, totaling approximately 53,500 meters, at the La Arena property and an additional 11 core holes, totaling about 3,100 meters, at the El Alizar prospect approximately one kilometer west of the La Arena oxide deposit. As a result of their work, Cambior completed several engineering studies and economic analyses of the La Arena deposits.
In 2007, Iamgold completed a drill program of 17 diamond drill holes, totaling approximately 4,400 meters, targeting the extension of oxide gold mineralization to the east of the sediment-hosted deposit as identified by Cambior. Iamgold also completed additional resource evaluations and economic studies of the La Arena deposits, building on the studies previously completed by Cambior.
From 2009 through April 2015, the date which Tahoe assumed ownership of the La Arena property, Rio Alto completed 183 exploration and resource definition diamond drill holes, totaling approximately 86,400 meters, and 1,303 RC exploration and resource definition holes, totaling about 158,400 meters.
In 2016, following receipt of exploration drilling permits, Tahoe completed 25 diamond drill holes at the Alizar prospect, approximately one kilometer to the west of the La Arena Mine as a follow up to surface mapping and sampling and initial drill testing conducted by Cambior. While drilling identified narrow, restricted zones of anomalous gold mineralization associated with intrusive breccia, the results were insufficient to support further work at the Alizar prospect.
| 26 |
| LA ARENA PROJECT |
| FORM 43-101F1 TECHNICAL REPORT |
Tahoe also drilled two deep core holes below the Calaorco pit to test for the downdip extension of higher-grade ‘feeder’ structures and one infill hole in the La Arena II porphyry in 2016.
| 6.3 | HISTORICAL MINERAL RESOURCE AND MINERAL RESERVE ESTIMATES |
There have been numerous resource estimates for the mineral deposits on the La Arena property from 1997 through the effective date of this Technical Report. Only those historic Mineral Resource and Mineral Reserve estimates which the author can verify were presented as being in compliance with NI 43-101 and CIM Definition Standards for Mineral Resources and Mineral Reserves are discussed in this section. The author has made no attempt to validate or classify the historical Mineral Resource and Mineral Reserve estimates and is not treating the historical estimates as current Mineral Resources or Mineral Reserves. The Mineral Resource and Mineral Reserve estimates presented in this Technical Report are the current estimates for the La Arena Mine and the La Arena II Project.
Historical Mineral Resource and Mineral Reserve estimates and discussion of those estimates as presented in their respective Technical Reports are summarized below. The author makes no assurances, other than the historical information is accurately reproduced herein, as to the validity of the historical estimates or the discussions pertaining to those estimates.
Coffey Mining Pty Ltd 2008
In 2008, Coffey Mining Pty Ltd (Coffey) prepared a Technical Report on behalf of Rio Alto in support of Rio Alto’s initial listing on the Toronto Stock Exchange that included the results of Mineral Resource and Mineral Reserve estimates for the La Arena property, as summarized in Table 6-1.
Table 6-1: La Arena Au-Cu Project Mineral Resource (March 31, 2008)
| Material | Cut-off | Category | Tonnes
(M) | Au
(g/t) | Cu
(%) | Ag
(g/t) | Au
(‘000 oz) | Cu
(‘000 t) | Ag
(‘000 oz) |
| Oxide | 0.15 g/t Au | Indicated | 58 | 0.49 | - | 0.09 | 910 | - | 170 |
| Inferred | 1.7 | 0.28 | - | 0.35 | 15 | - | 20 |
Secondary
& Primary | 0.1% Cu | Indicated | 220 | 0.27 | 0.36 | - | 1900 | 790 | - |
| Inferred | 170 | 0.22 | 0.32 | - | 1200 | 540 | - |
Resources were confined within an optimized undiscounted cash flow pit shell based on $900 per ounce gold and $16 per ounce silver for copper-poor mineralization largely in oxide sandstone (Cu < 300 ppm) and a shell based on $2.50 per pound copper and $900 per ounce gold for copper-rich mineralization largely in primary and secondary porphyry.
Coffey stated that the status of the La Arena Project is pre-feasibility and sufficient work has been done to determine a Mineral Reserve. The key pit optimization economic parameters were:
| | • | Metal prices of $750 per ounce gold and $1.95 per pound copper; |
| | • | Mining costs of $1.49 per tonne ore and $1.12 per tonne waste; |
| | • | Processing costs of $2.22 per tonne dump leach ore and $3.73 per tonne of milled ore; |
| | • | G&A costs of $0.60 per tonne dump leach ore and $0.95 per tonne milled ore; |
| | • | Gold recoveries of 65% for dump leach ore and 40% for milled ore; copper recovery of 88% for milled ore; |
| | • | Cut-off grades of 0.18 Au g/t for dump leach ore and 0.10% Cu for milled ore. |
The Probable Mineral Reserve, based on the Indicated Resources only, is summarized in Table 6-2.
| 27 |
| LA ARENA PROJECT |
| FORM 43-101F1 TECHNICAL REPORT |
Table 6-2: La Arena Project Probable Mineral Reserve
| Ore Type | | Oxide Ore | Secondary Ore | Primary Ore | All Ore |
| Mt | Au
(g/t) | (Cu%) | Mt | Au
(g/t) | Cu
(%) | Mt | Au
(g/t) | Cu
(%) | Mt | Au
(g/t) | Au
(koz) | Cu% | Cu
(mlbs) |
|
| Sediments | 29.5 | 0.62 | 0.13 | 0.1 | 0.34 | 0.32 | 0.1 | 0 45 | 0.18 | 29.7 | 0.62 | 587 | 0.21 | 1.0 |
| Porphyry | 4.3 | 0.49 | 0.20 | 13.0 | 0.36 | 0.52 | 127.4 | 0.30 | 0.40 | 144.8 | 0.30 | 1,415 | 0.40 | 1,273.8 |
| Total | 33.9 | 0.61 | 0.20 | 13.1 | 0.36 | 0.52 | 127.5 | 0.30 | 0.40 | 174.4 | 0.36 | 2,002 | 0.40 | 1,274.9 |
Author’s note: mineral resources include mineral reserves
Coffey reported that the estimation and classification of the mineral resources and mineral reserves are in accordance with the guidelines set out in the Australasian Code for Reporting of Exploration Results, Mineral Resources and Ore Reserves of December 2004 as prepared by the Joint Ore Reserves Committee of the Australasian Institute of Mining and Metallurgy, Australian Institute of Geoscientists and Minerals Council of Australia (JORC). The resource and reserve classifications are also consistent with criteria laid out in Canadian National Instrument 43-101, Standards of Disclosure for Mineral Projects of December 2005 and the classifications adopted by CIM Council in November 2004.
Source:La Arena Project, Peru Technical Report, dated June 13, 2008 with an effective date of March 31, 2008, prepared by Coffey Mining Pty Ltd on behalf of Rio Alto Mining Limited.
Coffey Mining Pty Ltd 2010
In 2010, Coffey updated their 2008 Technical Report to include new drill information obtained by Rio Alto. The report included a revision to the Mineral Resource and Mineral Reserve estimates for the La Arena property, as summarized in Table 6-3.
Table 6-3: La Arena Au-Cu Project Mineral Resource (July 31, 2010)
| Material | Cut-off | Category | Tonnes
(M) | Au
(g/t) | Cu
(%) | Ag
(g/t) | Au
(‘000 oz) | Cu
(mlbs) | Ag
(‘000 oz) |
|
| Oxide | 0.11 g/t
Au | Indicated | 79.6 | 0.41 | 0.01 | 0.08 | 1,050 | - | 172 |
| Inferred | 9.2 | 0.19 | 0.01 | 0.29 | 57 | - | 66 |
Secondary
& Primary | 0.1% Cu | Indicated | 225 | 0.27 | 0.35 | - | 1,932 | 1,722 | - |
| Inferred | 178 | 0.21 | 0.30 | - | 1,216 | 1,171 | - |
Resources were confined within an optimized undiscounted cash flow pit shell based on $1,050 per ounce gold and $12 per ounce silver for copper-poor mineralization largely within oxide sandstone (Cu < 300 ppm) and a shell based on $3.00 per pound copper and $1,050 per ounce gold for copper-rich mineralization largely in primary and secondary porphyry.
Coffey reported an updated Mineral Reserve using the following pit optimization economic parameters:
| | • | Metal prices of $950 per ounce gold and $2.30 per pound copper; |
| • | Mining costs of $1.79 per tonne ore and waste in sediments, and $1.82 per tonne ore and waste in porphyry; |
| | • | Processing costs of $1.55 per tonne dump leach ore and $4.77 per tonne of milled ore; |
| | • | G&A costs of $0.72 per tonne dump leach ore and $0.95 per tonne of milled ore; |
| | • | Gold recoveries of 80% for dump leach ore and 40% for milled ore; copper recovery of 88% for milled ore; |
| 28 |
| LA ARENA PROJECT |
| FORM 43-101F1 TECHNICAL REPORT |
| | • | Cut-off grades of 0.11 Au g/t for dump leach ore and 0.13% Cu for milled ore. |
The Probable Mineral Reserve, based on the Indicated Resources only, is summarized in Table 6-4.
Table 6-4: La Arena Project – Rio Alto Mineral Reserve (31 July 2010)
| Ore Type | Oxide Ore | Secondary Ore | Primary Ore | All Ore |
| Mt | Au
(g/t) | Cu
(%) | Mt | Au
(g/t) | Cu
(%) | Mt | Au
(g/t) | Cu
(%) | Mt | Au
(g/t) | Au
(koz) | Cu
(%) | Cu
(mlbs) |
|
| Gold Oxide Pit Design |
| Sediments | 57.4 | 0.44 | - | - | - | - | - | - | - | 57.4 | 0.44 | 821 | - | - |
| Sulfide Pit Shell (excluding Oxide Pit) |
| Sediments | 2.0 | 0.57 | 0.11 | 0.1 | 0.34 | 0.32 | 0.1 | 0.81 | 0.60 | 2.1 | 0.58 | 39 | 0.14 | 7 |
| Porphyry | 13.1 | 0.30 | 0.20 | 13.3 | 0.36 | 0.52 | 160.2 | 0.28 | 0.38 | 185.2 | 0.29 | 1,709 | 0.38 | 1,567 |
| Total Shell | 15.1 | 0.34 | 0.19 | 13.3 | 0.36 | 0.52 | 160.2 | 0.28 | 0.38 | 187.3 | 0.29 | 1,748 | 0.38 | 1,574 |
Author’s note: mineral resources include mineral reserves
Coffey reported that the estimation and classification of the mineral resources and mineral reserves are in accordance with the guidelines set out in the Australasian Code for Reporting of Exploration Results, Mineral Resources and Ore Reserves of December 2004 as prepared by the Joint Ore Reserves Committee of the Australasian Institute of Mining and Metallurgy, Australian Institute of Geoscientists and Minerals Council of Australia (JORC). The resource and reserve classifications are also consistent with criteria laid out in Canadian National Instrument 43-101, Standards of Disclosure for Mineral Projects of December 2005 and the classifications adopted by CIM Council in November 2004.
Source:La Arena Project, Peru Technical Report, dated October 28, 2010 with an effective date of July 31, 2010, prepared by Coffey Mining Pty Ltd on behalf of Rio Alto Mining Limited.
Kirk Mining Consultants Pty Ltd 2011
In 2011, Kirk Mining Consultants Pty Ltd (Kirk) issued a Technical Report updating the Mineral Resources for the La Arena Property. The report did not include an update to the 2010 Coffey Mineral Reserve estimate. The 2011 Kirk Mineral Resource estimates for oxide and sulfide resources are shown in Table 6-5 and Table 6-6, respectively.
Table 6-5: Mineral Resource - Oxide Total (In Situ as at September 30, 2011)
Within Optimized Pit Shell
| Resource | Tonnes
(M) | Au
(g/t) | Cu
(%) | Ag
(ppm) | Mo
(ppm) | Au
(‘000 oz) | Cu
(Mlbs) |
|
| Measured | 10.3 | 0.67 | 0.01 | 0.6 | 8.3 | 221 | - |
| Indicated | 90.4 | 0.43 | 0.02 | 0.5 | 11.7 | 1,263 | - |
| Measured & Indicated | 100.7 | 0.46 | 0.02 | 0.5 | 11.4 | 1,484 | - |
| Inferred | 10.4 | 0.27 | 0.01 | 0.5 | 13.1 | 90 | - |
Table 6-6: Mineral Resource – Sulfide Total (In-Situ as at September 30, 2011)
Within Optimized Pit Shell
| Resource | Tonnes
(M) | Au
(g/t) | Cu
(%) | CuEq
(%) | Ag
(ppm) | Mo
(ppm) | Au
(‘000 oz) | Cu
(mlbs) |
|
| Indicated | 312.7 | 0.24 | 0.29 | 0.48 | 0.7 | 42.9 | 2,422 | 2,007 |
| Inferred | 319.7 | 0.20 | 0.30 | 0.46 | 0.6 | 46.1 | 2,075 | 2,134 |
Author’s note: mineral resources include mineral reserves
| 29 |
| LA ARENA PROJECT |
| FORM 43-101F1 TECHNICAL REPORT |
The Mineral Resources were reported within an optimized undiscounted cash flow pit shell using metal prices of $1,600 per ounce gold and $3.00 per pound copper. The effective cut-off grades used were 0.095 Au g/t for the gold oxide resource and 0.18% CuEq for the sulfide resource. CuEq grades were calculated using metal prices of $1,600 per ounce gold and $3.00 per pound copper.
Kirk stated the Resource Statement had been prepared and reported in accordance with Canadian National Instrument 43-101, Standards of Disclosure for Mineral Projects of February 2001 and the classifications adopted by CIM Council in December 2005. Furthermore, the resource classification is also consistent with the Australasian Code for the Reporting of Mineral Resources and Ore Reserves of December 2004 as prepared by the Joint Ore Reserves Committee of the Australasian Institute of Mining and Metallurgy, Australian Institute of Geoscientists and Mineral Council of Australia (JORC).
Source:La Arena Project, Peru Technical Report (NI-43-101), dated September 30, 2011 with an effective date of September 30, 2011, prepared by Kirk Mining Consultants Pty Ltd on behalf of Rio Alto Mining Limited.
Kirk Mining Consultants Pty Ltd 2013
In 2013, Kirk Mining Consultants issued a ‘major update’ to the 2011 Mineral Resource model estimate as drill programs in 2012 converted the majority of Inferred Resources within the 2011 resource pit optimization shell to Indicated Resources. Kirk also updated the Mineral Reserve estimate. The 2013 Kirk Mineral Resource estimates for oxide and sulfide resources are shown in Table 6-7 and Table 6-8, respectively.
Table 6-7: Mineral Resource – Oxide Total (In Situ as at January 1, 2013)
Within Optimized Pit Shell – 0.10 Au g/t Cut-off
| Resource | Tonnes
(M) | Au
(g/t) | Cu
(%) | Ag
(ppm) | Mo
(ppm) | Au
(‘000 oz) | Cu
(Mlbs) |
|
| Measured | 6.0 | 0.45 | 0.01 | 0.5 | 5.6 | 87 | - |
| Indicated | 116.0 | 0.42 | 0.01 | 0.5 | 4.2 | 1,571 | - |
| Measured & Indicated | 122.0 | 0.42 | 0.01 | 0.5 | 4.2 | 1,658 | - |
| Inferred | 5.4 | 0.37 | 0.01 | 0.3 | 2.7 | 65 | - |
Table 6-8: Mineral Resource – Sulfide Total (In Situ as at January 1, 2013)
Within Optimized Pit Shell – 0.13% CuEq Cut-off
| Resource | Tonnes
(M) | Au
(g/t) | Cu
(%) | CuEq
(%) | Ag
(ppm) | Mo
(ppm) | Au
(‘000 oz) | Cu
(mlbs) |
|
| Indicated | 561.7 | 0.21 | 0.30 | 0.39 | 0.4 | 42.9 | 3,829 | 3,745.5 |
| Inferred | 32.5 | 0.11 | 0.19 | 0.27 | 0.4 | 50.2 | 116 | 137.4 |
Author’s note: mineral resources include mineral reserves
The Mineral Resources were reported within an optimized undiscounted cash flow pit shell using metal prices of $1,800 per ounce gold and $3.50 per pound copper, a gold recovery in copper concentrate of 40% and all other input parameters as used for the ore reserve pit optimization. CuEq grades were calculated using metal prices of $1,800 per ounce gold and $3.50 per pound copper.
Kirk reported an updated Mineral Reserve using the following pit optimization economic parameters:
| 30 |
| LA ARENA PROJECT |
| FORM 43-101F1 TECHNICAL REPORT |
| | • | Metal prices of $1,400 per ounce gold and $3.00 per pound copper; |
| • | Mining costs of $2.38 per tonne oxide, $2.44 per tonne sulfide ore and $2.50 per tonne waste; all with incremental increases in cost with depth; |
| | • | Processing costs of $2.06 per tonne oxide ore and $3.99 per tonne of sulfide ore; |
| | • | G&A costs of $2.45 per tonne ore; |
| | • | Gold recoveries of 85% for dump leach ore and 35% for milled ore; copper recovery of 88% for milled ore; |
| | • | Average cut-off grades of 0.12 Au g/t for oxide ore and 0.15% CuEq for sulfide ore. |
Kirk’s 2013 Mineral Reserve estimate is summarized in Table 6-9.
Table 6-9: Mineral Reserve – Oxide and Sulfide (In Situ as at January 1, 2013)
Within Pit Design, Block Cut-off NSR Calculation
| | Material | Classification | Oxide Ore | Sulfide Ore | Metal Mined |
Tonnes
(M) | Au
(g/t) | Tonnes
(M) | Au
(g/t) | Cu
(%) | Au
(koz) | Cu
(mlbs) |
Likely
Oxide Pit | Sediments | Proved | 5.6 | 0.47 | - | - | - | 84 | - |
| Probable | 47.9 | 0.52 | - | - | - | 803 | - |
Final Pit
excl.
Oxide Pit | Sediments | Proved | - | - | - | - | - | - | - |
| Probable | 8.0 | 0.39 | - | - | - | 100 | - |
| Porphyry | Proved | - | - | 0.1 | 0.32 | 0.29 | 1 | 0.9 |
| Probable | - | - | 268.7 | 0.24 | 0.33 | 2,091 | 1,945.9 |
Pit
Design | All | Proved +
Probable | 61.5 | 0.50 | 268.9 | 0.24 | 0.33 | 3.080 | 1,946.9 |
Author’s note: mineral resources include mineral reserves
The estimation and classification of the mineral reserves are in accordance with the guidelines set out in the Australasian Code for Reporting of Exploration Results, Mineral Resources and Ore Reserves of December 2004 as prepared by the Joint Ore Reserves Committee of the Australasian Institute of Mining and Metallurgy, Australian Institute of Geoscientists and Minerals Council of Australia (JORC).The reserve classification is also consistent with criteria laid out in the Canadian National Instrument 43-101, Standards of Disclosure for Mineral Projects of June 2011 and the classifications adopted by CIM Council in November 2010.
Source: La Arena Project, Peru Technical Report (NI-43-101), dated January 1, 2013 with an effective date of January 1, 2013, prepared by Kirk Mining Consultants Pty Ltd on behalf of Rio Alto Mining Limited.
Mining Plus Peru S.A.C. 2014
In 2014, Mining Plus Peru S.A.C. (Mining Plus) issued a ‘material update’ to the 2013 gold oxide Mineral Resource and Mineral Reserve estimates; Mining Plus did not update the sulfide Mineral Resources or Mineral Reserves as reported by Kirk in 2013. Mining Plus’ Mineral Resource estimate for the oxide deposit at La Arena is summarized in Table 6-10.
Table 6-10: Mineral Resource – Oxide Total (In Situ as at December 31, 2013)
Within Optimized Pit Shell 0.07 Au g/t Cut-off
| Resource | Tonnes
(M) | Au
(g/t) | Cu
(%) | Ag
(g/t) | Mo
(ppm) | Au
(‘000 oz) | Cu
(mlbs) |
|
| Measured | 2 | 0.43 | 0.04 | 0.4 | 8.4 | 28 | - |
| Indicated | 98.2 | 0.41 | 0.04 | 0.5 | 8.5 | 1,299 | - |
| Measured & Indicated | 100.2 | 0.41 | 0.04 | 0.5 | 8.5 | 1,327 | - |
| Inferred | 0.3 | 0.2 | 0.01 | 0.4 | 5.7 | 2 | - |
| 31 |
| LA ARENA PROJECT |
| FORM 43-101F1 TECHNICAL REPORT |
The resource was evaluated within an undiscounted and optimized Whittle pit shell using a $1400 per ounce gold price and ‘all other relevant costs and revenues for the project’. The gold cut-off grade used was 0.07 g/t.
Oxide Mineral Reserves were reported within a final pit design based on an optimized pit shell. The Mineral Reserve has estimated using only Measured and Indicated Oxide Mineral Resources. Pit optimization input parameters included:
| | • | Metal price of $1,200 per ounce gold; |
| | • | Mining cost (direct and indirect) of $2.99 per tonne; |
| • | Processing costs of $1.53 per tonne sediment-hosted oxide ore and $1.65 per tonne intrusive-hosted oxide ore; |
| | • | G&A costs of $1.69 per tonne ore; |
| | • | Gold leaching recoveries of 85% for sediment-hosted oxide ore and 82% for intrusive-hosted oxide ore; |
All Inferred Mineral Resources contained within the designed pit was treated as waste. Mining Plus’ Mineral Reserve estimate is summarized in Table 6-11.
Table 6-11: La Arena – Oxide Mineral Reserve (In Situ as at December 31, 2013)
Within Pit Design, Cut-off Grade: 0.07 Au g/t Sediments and 0.1 Au g/t Intrusive
| Classification | Material
Type | Tonnes
(M) | Au
(g/t) | Cu
(%) | Ag
(g/t) | Au
(‘000 oz) |
| Proven | Sediments | 1.4 | 0.45 | 0.01 | 0.44 | 20 |
| Intrusive | 0.2 | 0.38 | 0.26 | 0.34 | 3 |
| Proven Stockpiled | LG Stockpile | 1.2 | 0.23 | 0.004 | 0.81 | 9 |
| Total Proven | Total | 2.8 | 0.35 | 0.03 | 0.59 | 32 |
| Probable | Sediments | 56.9 | 0.47 | 0.01 | 0.46 | 853 |
| Intrusive | 16.5 | 0.32 | 0.14 | 0.37 | 172 |
| Total Probable | Total | 73.4 | 0.43 | 0.04 | 0.43 | 1,025 |
| Proven and Probable | Sediments | 58.2 | 0.47 | 0.01 | 0.48 | 873 |
| Intrusive | 16.8 | 0.32 | 0.14 | 0.39 | 175 |
| Proven Stockpile | LG Stockpile | 1.2 | 0.23 | 0 | 0.81 | 9 |
| Total Proven and | Total | 76.2 | 0.43 | 0.04 | 0.47 | 1,056 |
Author’s note: mineral resources include mineral reserves
Mining Plus stated that the Resource Statement was prepared and reported in accordance with Canadian National Instrument 43-101, Standards of Disclosure for Mineral Projects of February 2001 and the classifications adopted by CIM Council in December 2005. The resource classification is also consistent with the Australasian Code for the Reporting of Mineral Resources and Ore Reserves of December 2012 as prepared by the Joint Ore Reserves Committee (JORC) of the Australasian Institute of Mining and Metallurgy, Australian Institute of Geoscientists and Mineral Council of Australia.
Source:La Arena Project, Peru Technical Report (NI 43-101), dated March 28, 2014 with an effective date of December 31, 2013, prepared by Mining Plus Peru S.A.C. on behalf of Rio Alto Mining Limited.
| 32 |
| LA ARENA PROJECT |
| FORM 43-101F1 TECHNICAL REPORT |
Mining Plus Peru S.A.C. 2015
Mining Plus issued updated Mineral Resource and Mineral Reserve estimates for the La Arena oxide deposit in 2015 as a result of additional RC drill data obtained since their 2013 estimates. In the same Technical Report, Mining Plus also reported the completion of a prefeasibility study by Ausenco Peru S.A.C. which included an update to the copper-gold sulfide Mineral Reserves. Mining Plus reported that no changes had been made to the Mineral Resources of the sulfide deposit. Mining Plus’ 2015 Mineral Resource estimate for the oxide and sulfide deposits at the La Arena property are summarized in Table 6-12 and Table 6-13, respectively.
Table 6-12: La Arena – Oxide Gold Mineral Resources (In Situ as at December 31, 2014)
Within Optimized Pit Shell @ $1,400/oz, Cut-off Grade 0.07 Au g/t
| Classification | Material
Type | Tonnes
(M) | Au
(g/t) | Cu
(%) | Ag
(g/t) | Mo
(ppm) | Au
(‘000 oz) |
| Measured | Sediments | 1.1 | 0.23 | 0.07 | 0.3 | 32.6 | 8 |
| Intrusive | 9.4 | 0.28 | 0.15 | 0.4 | 61.6 | 86 |
| Colluvium | - | - | - | - | - | - |
| Total | 10.5 | 0.28 | 0.01 | 0.3 | 58.5 | 94 |
| Indicated | Sediments | 100.8 | 0.38 | 0.06 | 0.5 | 4.1 | 1,234 |
| Intrusive | 19.7 | 0.22 | 0.01 | 0.7 | 9.7 | 137 |
| Colluvium | 2.6 | 0.34 | 0.02 | 0.2 | 2.5 | 28 |
| Total | 123.1 | 0.35 | 0.01 | 0.5 | 5 | 1,399 |
Measured
and
Indicated | Sediments | 102.0 | 0.38 | 0.01 | 0.5 | 4.5 | 1,243 |
| Intrusive | 29.1 | 0.24 | 0.09 | 0.6 | 26.5 | 223 |
| Colluvium | 2.6 | 0.34 | 0.01 | 0.2 | 2.5 | 28 |
| Total | 133.6 | 0.35 | 0.03 | 0.5 | 9.2 | 1,494 |
| Inferred | Sediments | 2.2 | 0.34 | 0.01 | 0.4 | 2.9 | 24 |
| Intrusive | 0.3 | 0.14 | 0.01 | 0.1 | 2.1 | 1 |
| Colluvium | - | - | - | - | - | - |
| Total | 2.5 | 0.31 | 0.01 | 0.4 | 2.8 | 25 |
The oxide resource was reported within an optimized undiscounted cash flow pit shell using metal prices of $1,400 per ounce gold and updated cost parameters.
Table 6-13: Mineral Resource – Sulfide Total (In Situ as at December 31, 2014)
Within Optimized Pit Shell ($1,400/oz Au, $3.5/lb Cu), Cut-off Grade 0.12% Cu
| Classification | Tonnes
(M) | Au
(g/t) | Cu
(%) | Ag
(g/t) | Mo
(ppm) | Au
(‘000 oz) | Cu
(mlbs) |
|
| Measured | - | - | - | - | - | - | - |
| Indicated | 274.0 | 0.24 | 0.33 | 0.4 | 38.5 | 2,124 | 2,013.9 |
| Measured & Indicated | 274.0 | 0.24 | 0.33 | 0.4 | 38.5 | 2,124 | 2,013.9 |
| Inferred | 5.4 | 0.10 | 0.19 | 0.4 | 40.7 | 18 | 22.1 |
Author’s note: mineral resources include mineral reserves
The sulfide resource was reported within an optimized undiscounted cash flow pit shell using metal prices of $1,400 per ounce gold and $3.50 per pound copper and updated cost parameters.
| 33 |
| LA ARENA PROJECT |
| FORM 43-101F1 TECHNICAL REPORT |
Mining Plus updated the oxide Mineral Reserves as a result of ‘material changes’ in the Mineral Resource estimate and updated estimating inputs. Oxide Mineral Reserves were constrained to a final pit design based on an optimized pit shell. The oxide Mineral Reserve was estimated with oxide Measured and Indicated Mineral Resources only. Pit optimization input parameters included:
| | • | Metal price of $1,200 per ounce gold; |
| | • | Mining cost (direct and indirect) of $2.08 per tonne; |
| | • | Processing costs of $1.55 per tonne for both sediment- and intrusive-hosted oxide ore; |
| | • | G&A costs of $1.22 per tonne ore leached; |
| | • | Gold leaching recoveries of 86% for sediment-hosted oxide ore and 83% for intrusive-hosted oxide ore; |
All Inferred Mineral Resources within the pit design and below the cut-off grade of 0.1 Au g/t was reported as waste. Mining Plus’ oxide Mineral Reserve estimate is summarized in Table 6-14.
Table 6-14: La Arena – Oxide Mineral Reserve (In Situ as at December 31, 2013)
Within Pit Design, Cut-off Grade: 0.07 Au g/t Sediments and 0.1 Au g/t Intrusive
| Classification | Material
Type | Tonnes
(M) | Au
(g/t) | Cu
(%) | Ag
(g/t) | Au
(‘000 oz) |
|
| Proven | Sediments | 1.2 | 0.22 | 0.07 | 0.32 | 8.6 |
| Intrusive | 8.7 | 0.28 | 0.15 | 0.33 | 77.7 |
| Proven Stockpiled | LG Stockpile | 0.3 | 0.24 | 0.14 | 0.33 | 2.3 |
| Total Proven | Total | 10.2 | 0.27 | 0.14 | 0.33 | 88.6 |
| Probable | Sediments | 80.9 | 0.42 | 0.01 | 0.42 | 1,085.2 |
| Intrusive | 12.3 | 0.27 | 0.06 | 0.84 | 105.7 |
| Total Probable | Total | 93.1 | 0.40 | 0.02 | 0.48 | 1,190.9 |
| Proven and Probable | Sediments | 82.1 | 0.41 | 0.01 | 0.42 | 1,093.8 |
| Intrusive | 21.0 | 0.27 | 0.10 | 0.63 | 183.4 |
| Proven Stockpile | LG Stockpile | 0.3 | 0.24 | 0.14 | 0.33 | 2.3 |
Total Proven and
Probable | Total | 103.3 | 0.39 | 0.03 | 0.47 | 1,279.5 |
Author’s note: mineral resources include mineral reserves
When calculating the Mineral Reserve estimate for the sulfide resources, a small capital-constrained project was considered with strict financial hurdles. The resulting reserve included only a small portion of the total resource. The primary economic assumptions used for the sulfide pit optimization are presented below:
| | • | Metal prices of $1,200 per ounce gold and $3.00 per pound copper; |
| | • | Mining cost of $1.92 per tonne mined; |
| | • | Processing costs of $4.61 per tonne milled; |
| | • | G&A costs of $22.6 million per year; |
| | • | Average process recoveries of 91.1% for copper (ranging from 75.9% to 92.0%) and 38.9% for gold (ranging from 29.5% to 45.5%); |
The sulfide Mineral Reserve estimate reported by Mining Plus is shown in Table 6-15.
| 34 |
| LA ARENA PROJECT |
| FORM 43-101F1 TECHNICAL REPORT |
Table 6-15: La Arena Mineral Reserve Statement for Sulfide
| Category | Tonnes
(M) | Au
(g/t) | Cu
(%) | Au
(‘000 oz) | Cu
(mlbs) |
|
| Probable | 63.1 | 0.312 | 0.430 | 633.2 | 579.4 |
Sulfide Mineral Reserves were reported using a cut-off grade of 0.18% copper.
Mining Plus stated the Resource Statement and Reserve Statement were prepared and reported in accordance with Canadian National Instrument 43-101, Standards of Disclosure for Mineral Projects of February 2001 and the classifications adopted by CIM Council in December 2005. The resource classification is also consistent with the Australasian Code for the Reporting of Mineral Resources and Ore Reserves of December 2012 as prepared by the Joint Ore Reserves Committee (JORC) of the Australasian Institute of Mining and Metallurgy, Australian Institute of Geoscientists and Mineral Council of Australia.
Source:La Arena Project, Peru Technical Report (NI 43-101), dated February 27, 2015 with an effective date of December 31, 2014, prepared by Mining Plus Peru S.A.C. on behalf of Rio Alto Mining Limited.
The La Arena Mine (open pit, heap leach oxide mine) has been in continuous production since the latter half of 2011. Annual mine production through the end of 2017 is summarized in Table 6-16. Annual processing production through the end of 2017 is summarized in Table 6-17. There has been no production from the La Arena II Project.
Table 6-16: La Arena Mine Annual Mine Production
| Year | Ore Mined | Waste Tonnes
Mined (M) |
Tonnes
(M) | Au Grade
(g/t) | Au Ounces
(k) |
|
| 2011 | 3.7 | 0.88 | 103.5 | 4.2 |
| 2012 | 8.3 | 0.82 | 217.1 | 13.0 |
| 2013 | 13.8 | 0.60 | 268.2 | 23.0 |
| 2014 | 15.3 | 0.52 | 256.4 | 17.3 |
| 2015 | 12.8 | 0.62 | 253.3 | 21.9 |
| 2016 | 15.7 | 0.49 | 244.3 | 32.5 |
| 2017 | 12.8 | 0.49 | 202.4 | 24.0 |
| Total | 82.2 | 0.58 | 1,545.3 | 135.8 |
Totals may not sum due to rounding
Table 6-17: La Arena Mine Annual Processing Production
| Year | Ore Processed | Au Ounces
Recovered (k) |
Tonnes
(M) | Au Grade
(g/t) | Au Ounces
Contained (k) |
| 2011 | 2.5 | 1.01 | 80.5 | 51.1 |
| 2012 | 8.0 | 0.84 | 214.1 | 201.7 |
| 2013 | 13.1 | 0.62 | 261.2 | 215.4 |
| 2014 | 16.2 | 0.50 | 263.9 | 222.5 |
| 2015 | 13.1 | 0.61 | 257.2 | 230.4 |
| 2016 | 15.3 | 0.49 | 241.0 | 204.1 |
| 2017 | 12.9 | 0.49 | 203.3 | 195.6 |
| Total | 81.1 | 0.58 | 1,521.5 | 1,320.9 |
| 35 |
| LA ARENA PROJECT |
| FORM 43-101F1 TECHNICAL REPORT |
Totals may not sum due to rounding
| 36 |
| LA ARENA PROJECT |
| FORM 43-101F1 TECHNICAL REPORT |
| 7 | GEOLOGICAL SETTING AND MINERALIZATION |
| | |
| 7.1 | REGIONAL GEOLOGY |
The La Arena property is located on the eastern flank of the Andean Western Cordillera in northern Peru. The area is underlain by sediments of the Mesozoic West Peruvian Basin which were folded and faulted during the Cenozoic deformation.
The regional stratigraphy is dominated at outcrop by the folded Upper Jurassic Chicama Formation to the Lower Cretaceous Goyllarisquizga Group, which are mainly siliciclastic sediments, with lesser amounts of younger Lower to Upper Cretaceous carbonate sediments occupying the cores of synclines. West of La Arena, the Cretaceous sediments are unconformably overlain by Cenozoic volcanics of the Calipuy Group. The regional stratigraphy is summarized below; a map and cross section of the regional geology are shown in Figure 7-1 and Figure 7-2, respectively.
From oldest to youngest, the regional stratigraphy is described as follows:
| • | Paleozoic (and Precambrian): Basement rocks to the east of La Arena in the eastern Cordillera. Paleozoic rocks are not exposed at La Arena or in the immediately surrounding area. |
| | | |
| • | Mesozoic: The oldest outcropping rocks in the region belong to the Upper Jurassic Chicama Formation and generally consist of soft, laminated marine black shales with thin sandstone intercalations. These rocks grade upwards into Lower Cretaceous shallow marine clastics of the Goyllarisquizga Group, the lowest unit of which, the Oyon Formation, consists of fine-to-medium-grained sandstone and thinly-bedded shale, with some coal seams. Overlying the Oyon Formation are thickly-bedded, medium grained quartzitic sandstones of the Chimu Formation which constitutes the principal host rock for oxide gold mineralization at La Arena. The upper units of the Goyllarisquizga Group (Santa, Carhuaz and Farrat formations) consist of generally fine-grained siliciclastic units with interbedded minor carbonates. The Carhuaz Formation is the host for gold mineralization at the Company’s Shahuindo Mine approximately 30 kilometers north of La Arena. |
| | | |
| | Overlying the Goyllarisquizga Group sediments are Lower Cretaceous shallow marine carbonates of the Inca, Chulec, Pariatambo formations and the Upper Cretaceous Yumagual Formation. |
| | | |
| | The Mesozoic sediments were folded and faulted towards the end of the Cretaceous by the early stages of the developing Andean Orogeny. |
| | | |
| • | Cenozoic: The Calipuy Group (cordilleran arc volcanics) unconformably overlie the folded and faulted Mesozoic strata south and west of La Arena. These subaerial volcanics are associated with Upper Miocene sub-volcanic intrusive bodies of andesitic to dacitic composition. The Calipuy volcanics are primarily tuffs with agglomerate horizons at the base and inter-bedded with andesitic lavas. The Calipuy volcanics are the host rocks for high-sulfidation, low-sulfidation and polymetallic mineralization at other deposits in the area, such as Lagunas Norte, Tres Cruces and Quiruvilca, respectively. |
| | | |
| | To the west of the area shown in Figure 7-1, the Coastal Batholith is emplaced in volcano-sedimentary strata of the Mesozoic Western Peruvian Trough, time equivalents of the rocks described above. Cenozoic intrusive rocks, including granodiorites, diorites and quartz–feldspar porphyries, are intruded as isolated stocks into both the Mesozoic sedimentary sequence and the overlying Calipuy volcanics. The ages of those intrusions vary from c.a. 23 to 25 Ma. One of these intrusions hosts the porphyry-style mineralization at La Arena. |
| 37 |
| LA ARENA PROJECT |
| FORM 43-101F1 TECHNICAL REPORT |
The main structural features of the region are associated with the Jurassic-Cretaceous sedimentary sequence and consist of a series of folds, reverse faults and over-thrusts trending generally northwest-southeast. Individual folds range up to 80 kilometers in length and 5 kilometers in width.
| 38 |
| LA ARENA PROJECT |
| FORM 43-101F1 TECHNICAL REPORT |
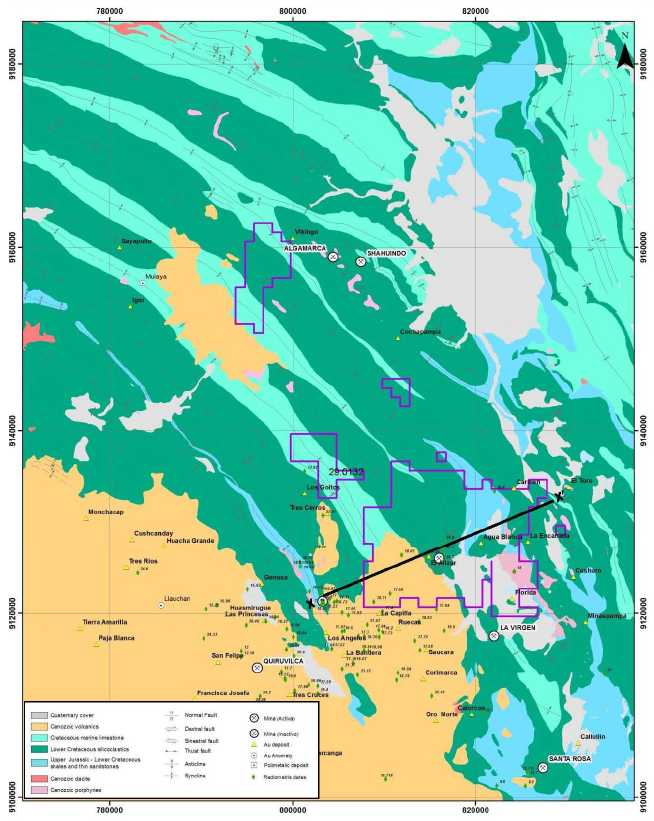
Figure 7-1:Regional Geology
| 39 |
| LA ARENA PROJECT |
| FORM 43-101F1 TECHNICAL REPORT |
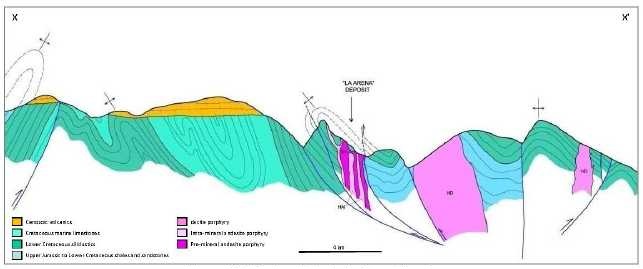
Figure 7-2: Regional Geologic Cross Section
The La Arena property is located within a regional fold and thrust belt of predominantly Mesozoic sedimentary rocks which have been intruded by intermediate to felsic porphyritic stocks which tend to occupy the cores of anticlinal structures. A map and cross section of the project geology are shown in Figure 7-3 and Figure 7-4, respectively.
Sedimentary rocks across the La Arena property consist of a lower shallow marine to deltaic siliciclastic sequence overlain by an upper carbonate-dominated sequence, all of Lower Cretaceous age. The oldest rocks exposed in the cores of anticlines are thinly-bedded and laminated mudstones, minor siltstones and fine-grained sandstones with occasional coal seams which make up the basal Lower Cretaceous Oyon Formation.
Overlying the Oyon Formation is the Goyllarisquizga Group (Chimu Formation). The Chimu Formation is the principal host rock for epithermal gold at La Arena (and elsewhere in the region) has been subdivided into the three members (from oldest to youngest):
| • | Transition Member(~130 meters thick) – laminated fine- to medium-grained sandstones intercalated with siltstones and mudstones representing transitional facies between the shale-dominant Oyon Formation and the sandstone-dominant Lower Member of the Chimu Formation. |
| | | |
| • | Lower Member(~125 m) – thickly-bedded and compact medium- to coarse-grained sandstones which, due to their brittle nature, are fractured and often brecciated, and constitute the principal sedimentary host rock for the La Arena oxide gold deposit. In addition to hosting the high-sulfidation gold mineralization, the Chimu Formation also hosts similar mineralization at the Lagunas Norte, El Toro, La Virgin and Santa Rosa deposits. |
| | | |
| • | Upper Member(~150 m) – mixed sequence of coarse-grained sandstones, laminated siltstones and carbonaceous mudstones. |
Multiple intrusions of dacitic and andesitic feldspar porphyries have intruded the Cretaceous sedimentary sequence at La Arena. The intrusive events are differentiated by texture and composition. The earliest intrusion, feldspar porphyry dacitic (FPA-1) is generally barren of mineralization. The second intrusion, FPA-2, is the primary host of the copper-gold mineralization at the La Arena II Project. The third intrusive stage, FPA-3, generally contains nil to lower-grade copper-gold mineralization. The final intrusive phase (FPA-4) consists of barren andesitic dikes.
| 40 |
| LA ARENA PROJECT |
| FORM 43-101F1 TECHNICAL REPORT |
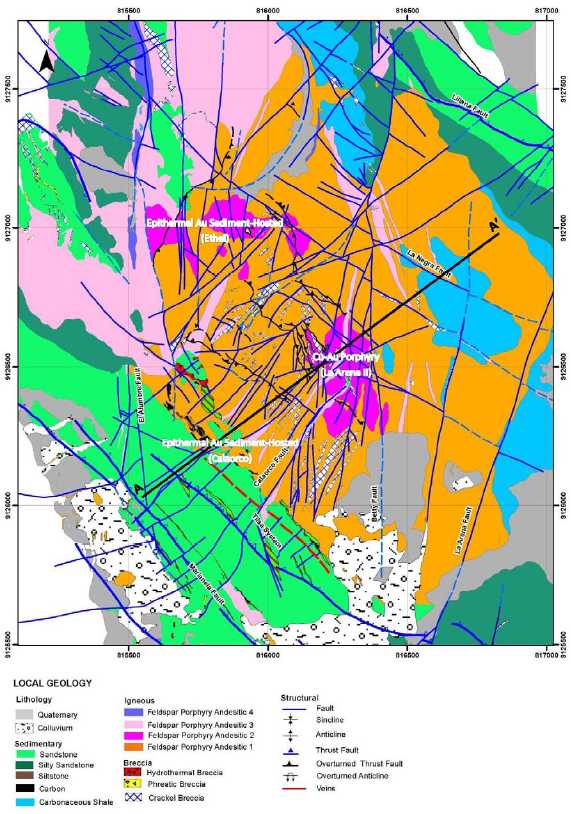
Figure 7-3: La Arena Geology
| 41 |
| LA ARENA PROJECT |
| FORM 43-101F1 TECHNICAL REPORT |
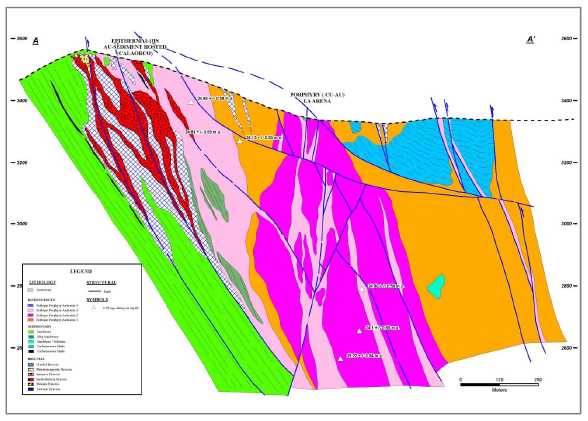
Figure 7-4: La Arena Geologic Cross Section
Age dating of zircons within the individual intrusives indicate overlapping dates at ~24.9 Ma (±0.47 Ma), suggesting all three of the primary intrusive phases were emplaced in a short period of time, likely within one to two Ma intervals. Lithology of the three primary intrusive phases, from youngest to oldest, identified at La Arena are described below:
| • | FPA-1– textures are commonly porphyritic and locally phyric, with inequigranular subhedral plagioclase phenocrysts (≤1-4 mm) embedded in a microcrystalline matrix with relicts of ferromagnesium minerals (amphiboles) and abundant pyrite in matrix and in veinlets. The FPA-1 intrusive lacks significant quartz stockwork, though can locally contain lower grade copper and gold mineralization near the contact with FPA-2. |
| | | |
| • | FPA-2– the second intrusive phase is the primary host for copper-gold mineralization and is characterized by a porphyritic texture with abundant remnant phenocrysts of plagioclase (1-3 mm) that have been altered to clay (primarily sericite). High density of stockwork, locally 15 to 30 veinlets per meter, is prevalent throughout the intrusive, with veinlets ranging from less than one centimeter to seven centimeters in width. Mineralogy consists of quartz, plagioclase, biotite, potassium feldspar, and sericite, with accessory rutile, epidote, chlorite, hematite and carbonates. |
| | | |
| • | FPA-3– the third stage of intrusion ranges from porphyritic to fine-grained phyric in texture, with subhedral plagioclase (≤1-4 mm) and subhedral biotite (≤1-3 mm). FPA-3 contains weak quartz stockwork with intensity of veining increasing proximal to the contact with FPA-2. |
Late andesitic intrusions, consisting of narrow dikes and plugs, locally crosscut the three primary intrusions. The texture of the later intrusions is generally porphyritic with coarse subhedral to inequigranular plagioclase phenocrysts and lesser pyroxene/hornblende and chlorite. The late intrusives are barren of copper or gold mineralization.
| 42 |
| LA ARENA PROJECT |
| FORM 43-101F1 TECHNICAL REPORT |
The La Arena Mine oxide-gold Calaorco open pit is situated at the western margin of the FPA-3 intrusion, which occurs as a laccolith-like structure overlying an argillically-altered heterolithic breccia with remnant sulfides.
The La Arena property lies within a regional flexion, which is characterized by the change in direction of fold axes which trend in general towards the Andean regional northwest-southeast trend; however, locally, the direction changes to a more north-south direction. This fault junction forms a dilational jog structure where the copper-gold porphyry system was emplaced. To the west portion of the porphyry lies the high-sulfidation epithermal gold deposits hosted in sandstones of the Chimu formation. The location of the gold deposits is controlled by the intersection of northwest-southeast and northeast-southwest faults.
One of the principal structural features of the project area is the La Arena anticline, the core of which hosts the porphyry intrusions. The strike of the anticlinal axis undergoes a deflection in the area immediately to the north of the Calaorco open pit. Regionally, fold axes generally trend northwest-southeast, but the La Arena anticline trends north-south in the project area, presumably influenced by north-trending structures. The apparent deflection of the anticline and the porphyry intrusions and related mineralization are considered to be inter-related.
Major faults within the project area have strikes varying from northwest-southeast to north-south, mimicking the orientation of the fold axes and likely following the same controls. The structures are generally reverse faults, probably syn-folding. Other mapped lesser structures displaying dilationary and tear movements tend to strike northeast-southwest to east-west, parallel to the main fold-related stresses.
In the Calaorco open pit, mineralization appears to be controlled by the interaction of three fault trends. The first corresponds broadly to the northwest-southeast Andean trend, with dips varying 50º to 70º to the northeast. The second trend is N10ºE, dips sub-vertical with relative movement mainly dextral tear. The third trends N40ºE and dips 70º to 80º to both the southwest and northeast and has a sinistral component. The N40ºE fault trend cuts all the others, and appears to have acted as the principal feeder channels for mineralizing fluids. Figure 7-5 illustrates the relationship between the principal mineralized structures and the FPA-3 laccolithic occurrences.
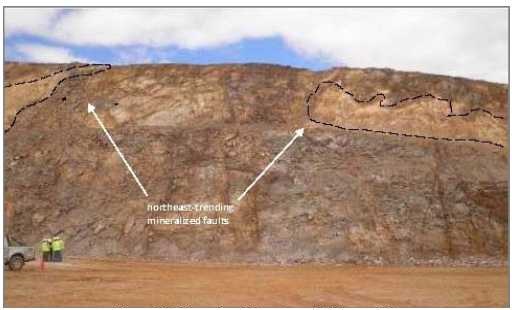
Figure 7-5: Mineralized Structures in Calaorco Pit
(Looking southwest. Northeast structures filled by higher-grade hydrothermal breccia.
Dashed lines outline low-angle intrusions which act as hydrothermal fluid traps.)
| 43 |
| LA ARENA PROJECT |
| FORM 43-101F1 TECHNICAL REPORT |
The La Arena project area contains epithermal-style gold mineralization in sandstone-hosted oxidized fractures and breccia, and porphyry copper-gold (±molybdenum) mineralization. Both styles of mineralization are spatially and genetically linked as they likely emanated from the same residual magmatic activity related to intrusions of intermediate composition.
The mineralization at La Arena as currently defined extends over a length of 2.2 kilometers north-south and 1.1 kilometers east-west, with a vertical extent of mineralization in the porphyry exceeding 1,200 meters. Drilling in the porphyry has not defined the lower limits of mineralization, as analytical results from the deepest drill holes in the deposit do not indicated a decrease in copper and gold grades at depth.
| 7.4.1 | High-Sulfidation Epithermal Gold Mineralization |
Four separate zones of breccias containing anomalous gold have been recognized around the western and northern margins of the La Arena Porphyry, two of which have demonstrated economic viability. The Ethel oxide gold deposit was exhausted by the property’s previous owner, Rio Alto, who also initiated mining of the Calaorco oxide gold deposit; Tahoe continues operations at the Calaorco pit.
High-sulfidation epithermal gold mineralization currently being mined in the Calaorco open pit occurs partly in the Calaorco Breccia located at the contact between well-fractured Chimu quartz sandstones and the overlying intrusive, within un-brecciated fractured sandstones, and within the intrusive along its contact with the sediment package. Located to the north of the Calaorco open pit, the Ethel breccia is a similar but smaller oxidized epithermal gold deposit.
Gold mineralization is both lithologically and structurally controlled, and occurs primarily in silicified fractured sandstones and locally in hydrothermal breccias. Structural control is mainly associated to the principle northwest-southeast Andean orientation and secondary to tensional fracturing, as well as to bedding planes. Tensional fracturing has acted as a principal fluid channel way, containing oxidized high sulfidation epithermal gold mineralization. Fine grained native gold is free in small proportions as is electrum.
The Calaorco breccia lies parallel to the contact between the Chimu sandstones and the porphyry. Gold mineralization occurs within the Calaorco breccia approximately 700 meters in length (southeast-northwest) with a slight deflection to the north at depth. The width of mineralization varies from 100 to 300 meters from the contact between sandstone and porphyry. Gold mineralization is most pronounced within the oxide zone, which can extend to depths of more than 250 meters below the surface.
Higher-grade zones of gold mineralization are directly controlled by the intersection of southwest-northeast faults which transverse the mineralized trend oriented to the northwest-southeast. The northwest-trending ‘feeder’ structures, locally termedTilsa structures have a strike length of approximately 300 meters and thicknesses ranging from a few centimeters to several meters, with a grade of 80 to 100 g/t of gold not uncommon. Lower grade gold mineralization occurs as thin stockwork and disseminations within the Chimu sandstone.
| 7.4.2 | Porphyry-hosted Copper-Gold Mineralization |
Copper-gold mineralization is associated with phyllic (quartz-sericite) and potassic (secondary biotite + magnetite + potassium feldspar) alterations, which is dominated principally by pyrite and chalcopyrite with lesser amounts of bornite, covellite, chalcocite and molybdenite. Mineral zoning from surface downwards below the oxidized cap is typically about 40 to 50 meters for the zone of secondary enrichment (chalcocite + covellite ± copper oxides) and ten to 40 meters for the mixed oxide-sulfide transitional zone (chalcocite + chalcopyrite ± covellite). The top of the primary sulfide mineralized zone (chalcopyrite ± bornite) which predominates at La Arena is typically located at depths in excess of 100 meters from the surface.
| 44 |
| LA ARENA PROJECT |
| FORM 43-101F1 TECHNICAL REPORT |
The copper-gold porphyry at La Arena II comprises an elongated mineralized body approximately 1,400 meters in length (oriented northwest-southeast) and 200 to 400 meters wide. Mineralization occurs as disseminations along hairline fractures as well as within larger veins. Mineralization has been identified by drilling to depths of 1,000 meters below the surface which shows the porphyry to be narrowing, but with no decrease in copper and gold grades.
Sulfide mineralization consists of pyrite, chalcopyrite and molybdenite, with accessory pyrrhotite, sphalerite, galena, arsenopyrite, marcasite and rutile. Very fine (~25 microns) particles of native gold have been observed. The FPA-2 intrusion has the most abundant copper and gold mineralization that is associated with phyllic (quartz-sericite) and potassic (secondary biotite, magnetite, K feldspar) alteration with copper grades ranging from nil to locally greater than one percent; gold grades range from nil to locally greater than one gram per tonne. Lower grade copper-gold mineralization is related to the intra-mineral FPA-3 intrusion, which locally contains copper grades up to 0.5 percent and gold grades up to 0.5 grams per tonne.
Mineralization at the La Arena property is related to linked deposits in the epithermal and porphyry environments, the former hosted by Chimu Formation sandstones, and the latter by multiple intrusions with an age of ~25 Ma (Hedenquist; 2012).
Two primary alteration assemblages are identified on the surface; illite-pyrophyllite-muscovite and kaolinite (likely supergene) in the porphyry intrusions and silica-alunite-illite-dickite with supergene kaolinite in the epithermal high-sulfidation zone. There are two northwest-oriented trends of pyrophyllite, one to the northeast of Calaorco pit and the other extending from the porphyry deposits through Ethel deposit and open to the northwest. These two alteration corridors parallel the Andean trend are likely controlled by major regional structures. Conduits of hot muscovite-stable fluids have overprinted the porphyry and have cooled as they flowed to the northwest along the structures (Hedenquist, 2012). In addition, there is a northeast orientation of pyrophyllite observed in the northern end of the Calaorco pit, parallel to a major cross structure oriented to the northeast.
The alteration distribution, both at surface and at depth is very consistent as the strong phyllic alteration (quartz-sericite) overprints the prograde potassic alteration (secondary biotite-magnetite-potassium feldspar-chlorite) with magnetite completely destroyed. In addition, there is a later argillic overprint of illite-chlorite along structures deep into the porphyry. The transition from the margins of the porphyry deposit to the west, next to and within the epithermal deposit, is marked by pyrophyllite, particularly along northwest structures, due to cooling during the phyllic stage, from muscovite to pyrophyllite, with further cooling causing dickite to form (Hedenquist, 2012).
| 45 |
| LA ARENA PROJECT |
| FORM 43-101F1 TECHNICAL REPORT |
Two types of mineralized deposits are recognized at the La Arena property – high-sulfidation epithermal gold deposits and porphyry-hosted copper-gold deposits. The epithermal gold deposits are hosted in sediments of the Lower Cretaceous Chimu Formation and the copper-gold deposit is hosed in Oligocene-age multi-stage intermediate intrusions.
Both deposits are characterized by alteration and mineralization occurrences as defined and described by Hedenquist (1987), Hedenquist and Lowenstern (1994), Arribas (1995) and Sillitoe (2010), among others. The epithermal gold deposit currently being mined is characterized by supergene oxidized high-sulfidation mineralization, which occurs in fractured sandstones and hydrothermal breccia zones. The porphyry deposit is dominated by primary copper sulfides with gold and lesser molybdenum.
High sulfidation epithermal gold deposits form in geothermal systems where hot acidic hydrothermal fluids emanate directly from an intrusive source and generally remain undiluted by ground water. As is the case at La Arena, these deposits often represent the upper parts of porphyry systems where the two types of mineralization often overlap. High-sulfidation deposits can display a wide variety of mineralization styles, including veins, hydrothermal breccias, stockwork, and disseminations or replacements.
In porphyry deposits, the sulfide ore minerals are dominantly structurally-controlled, with most mineralization occurring as close-spaced and cross-cutting vein stockwork, vein arrays, fractures, breccias and disseminations. In the hypogene portions of copper porphyry deposits, the copper occurs predominantly as chalcopyrite; other important copper ore minerals may include bornite and enargite. Supergene copper mineralization is generally dominated by chalcocite and lesser covellite.
Figure 8-1 illustrates the relationship between high-sulfidation epithermal deposits and porphyry deposits.
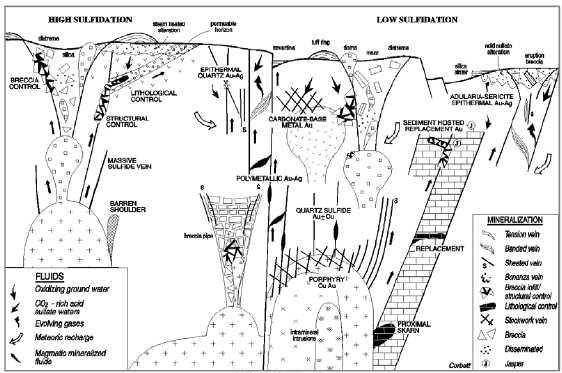
(after Corbett, 2002)
Figure 8-1: Spatial Relationship of Epithermal and Porphyry Deposits
| 46 |
| LA ARENA PROJECT |
| FORM 43-101F1 TECHNICAL REPORT |
Cambior identified mineralization at La Arena through field reconnaissance programs of geologic and alteration mapping, and rock chip and soil sampling. Rio Alto continued to characterize the La Arena deposits and applied these criteria, including structural mapping, mineral-spectral analysis (ASTER), soil geochemistry, stream sediment sampling, and aeromagnetic surveys, to acquire additional mining claims around the La Arena deposits and to identify additional prospects in the district.
Rio Alto project generation programs were carried out at the Charat, Cachachi and Serpaquino properties, located west and northwest of the La Arena concessions (Figure 9-1). Field reconnaissance programs completed included regional mapping and sampling in order to test the regional anomalies. Tahoe has not yet continued evaluation of these areas.
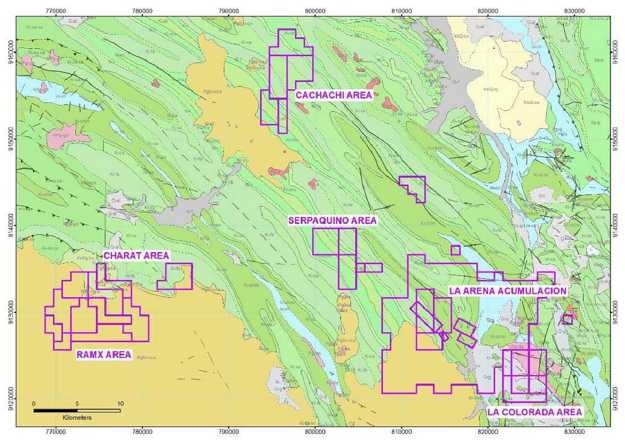
Figure 9-1: Regional Exploration Targets
In addition to the La Arena oxide gold and porphyry deposits, the La Arena property includes several prospects that have been identified by soil geochemistry sampling, with some prospects followed up by exploration diamond drilling. These prospects include the Cerro Colorado, Maria Angola, Peña Colorada and Agua Blanca epithermal occurrences, the La Florida polymetallic occurrence, and the El Alizar and Agua Blanca porphyry occurrences. A map showing La Arena property soil geochemistry results is shown in Figure 9-2.
| 47 |
| LA ARENA PROJECT |
| FORM 43-101F1 TECHNICAL REPORT |
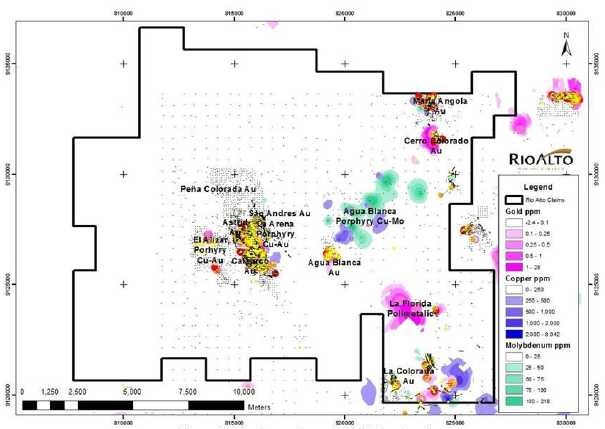
Figure 9-2: La Arena Property Soil Geochemistry
Tahoe drill tested the El Alizar prospect in 2016 with 25 drill holes totaling approximately 5,900 meters. The drilling identified spatially discontinuous irregular zones of gold mineralization related to narrow breccia occurrences. No further work at El Alizar is planned. The Company expanded on the existing exploration data at the Agua Blanca prospect in 2017, conducting detailed surface geologic mapping and soil and rock chip sampling. Encouraging results have identified targets which Tahoe plans to evaluate by drill testing in 2018.
| 48 |
| LA ARENA PROJECT |
| FORM 43-101F1 TECHNICAL REPORT |
Drilling at the La Arena property has been conducted by Cambior, Iamgold, Rio Alto and Tahoe, with 1,927 diamond drill (core) and reverse-circulation holes drilled totaling 330,082 meters completed from 1996 to the present. All drilling has been done from the surface by contractor owned and operated drill rigs. A summary of the project drilling, by company and drill type, is presented in Table 10-1.
Table 10-1: La Arena Property Drilling History
| Company | Year | Diamond Drilling | Reverse-Circulation Drilling | Total Drilling |
| No. of Holes | Meters
Drilled | No. of Holes | Meters
Drilled | No. of Holes | Meters
Drilled |
|
| Cambior | 1996–2006 | 324 | 55,323 | 11 | 1,186 | 335 | 56,509 |
| Iamgold | 2007 | 17 | 4,362 | - | - | 17 | 4,362 |
| Rio Alto | 2010– 2015 | 221 | 96,474 | 1,323 | 160,799 | 1,544 | 257,273 |
| Tahoe | 2015–2017 | 31 | 11,938 | - | - | 31 | 11,938 |
| Total | 1996–2017 | 593 | 168,097 | 1,314 | 161,985 | 1,927 | 330,082 |
The database contains six core holes (2,515 meters) drilled for metallurgical samples, 16 condemnation core holes (4,418 meters), 16 geotechnical core holes (3,125 meters) and 20 RC piezometer holes (2,435 meters) drilled by Rio Alto and three core holes (3,694 meters) drilled by Tahoe in 2017 to collect additional metallurgical samples from the La Arena II porphyry. Figure 10-1 is an airphoto illustrating the surface drill hole locations. Representative drill hole cross sections can be found in Figure 14-2, Figure 14-3, and Figure 14-4 in Section 14 – Mineral Resource Estimates.
The Mineral Resource estimates reported herein for the La Arena Mine and La Arena II Project are based on the project drill database consisting of 1,851 drill holes totaling 313,967 meters, which does not include exploration holes drilled elsewhere within the La Arena property boundary.
Drilling by Cambior and Iamgold through 2007 was primarily by diamond drill core methods, with only 11 reverse-circulation (RC) holes drilled (~3% of the total number of holes drilled through 2007), all by commercial contract drilling companies. Core holes were drilled by Sociedad Minera Cambior Peru S.A and RC holes were drilled by AK Drilling. Most core holes were drilled with HQ-diameter tools until 1999; after which, it appears that about 60% of the holes were drilled HQ-size and 40% drilled NQ-size, though drill core size was not consistently recorded in the pre-2010 drill hole database. Core recoveries were reported to be generally good (Mining Plus, 2015) except in heavily oxidized areas. Cambior reported poor recoveries from their limited RC drilling program due to extremely fractured ground and excessive water intersected by the drill holes.
From 2010 to 2015, Rio Alto used AK Drilling as their RC drill contractor and Explomin del Peru as their diamond drill contractor. RC drilling was done using 5¼-inch face-sampling hammer bits with average recovery reported to be 95%. Based on comparative studies between core holes, RC holes and bulk samples (Kirk, 2011; Kirk, 2013; Mining Plus 2013), RC drilling has generally been the preferred method of drilling to best represent the oxide mineralization at the La Arena Mine. Core drilling was generally done using HQ-size tools, with lesser NQ-size tools; core recovery was reported to generally be 90% to 95% with infrequent recovery intervals less than 80% (Mining Plus, 2015). Drilling to obtain metallurgical samples was generally done with HQ-size tools, with lesser PQ-size tools. Core drilling is the preferred method of drilling at the La Arena II porphyry deposit.
| 49 |
| LA ARENA PROJECT |
| FORM 43-101F1 TECHNICAL REPORT |
Tahoe’s limited drilling completed to date has been by diamond drill core methods, generally with HQ-size tools.
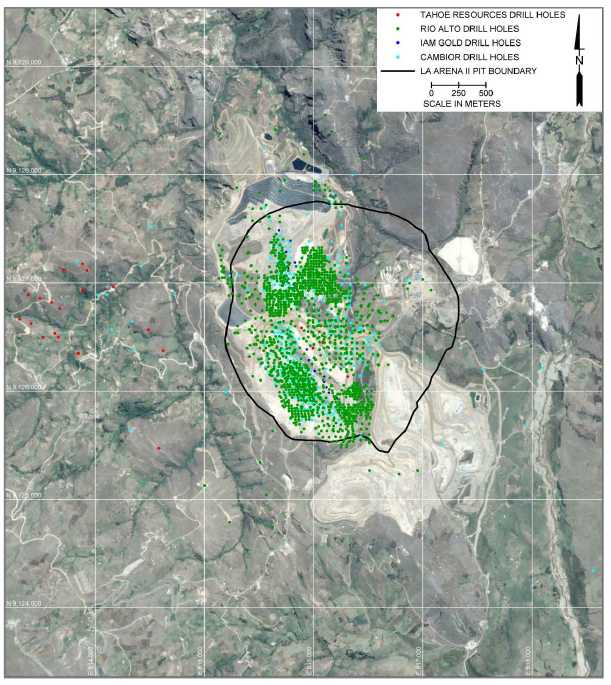
Figure 10-1: La Arena Property Drill Hole Location Map
Data collection procedures have remained generally consistent between Rio Alto and Tahoe; hence the following descriptions are applicable to both companies’ where applicable.
| 50 |
| LA ARENA PROJECT |
| FORM 43-101F1 TECHNICAL REPORT |
| 10.3.1 | Sample Collection and Handling |
Drill core is retrieved from the core barrel and placed in weather-resistant core boxes along with markers labeled with the downhole distance. Core samples are generally two meters in length, but shorter where dictated by geologic contacts. The core boxes are labeled and transported to the Company’s core logging facility at the La Arena Mine, where company geologists and technicians wash and photograph the core, record the geologic and geotechnical characteristics, and mark drill core intervals for sampling. Core from holes drilled prior to 2011 were sampled by chiseling the core in half. Core sampling since then has been by sawing the core in half longitudinally with a diamond saw. After logging and sampling are complete, the core boxes are stored on rack inside the covered, secured core storage building.
The specifics of sample handling by Cambior and Iamgold are generally unknown, though Coffey (2008) reports that “based on inspection of core trays of 5 holes and review of the available reports, Coffey Mining considers that diamond core drilling has been carried out to expected industry standards.”
RC samples are collected at 2-meter intervals and quartered at the drill site using a riffle splitter to approximate six-kilogram subsample sizes. Samples are collected in cloth-lined sample bags.
| 10.3.2 | Drill Collar Surveys |
Drill collars for holes drilled prior to 2010 were surveyed by Eagle Mapping Ltd. using total station and differential GPS. Survey accuracy was reported as +/-0.5 meters (Coffey, 2008). Hole collars from Rio Alto’s and Tahoe’s drill programs have been surveyed using a Total Station GPS. All drill hole collar coordinates are surveyed in Universal Transverse Mercator (UTM) datum PSAD-36 coordinates.
Prior to 2005, the majority of drill holes were downhole surveyed every 50 meters using the acid test method, where a glass tube containing acid is lowered down the drill hole to the desired depth. The acid etches the glass tube indicating the inclination of the drill hole. Azimuth readings are not obtained by the acid test method. A lesser number of drill holes were downhole surveyed using a Tropari directional survey instrument that provides inclination and magnetic azimuth readings; the azimuth readings require correction to account for magnetic declination.
Beginning in 2005, downhole surveys of core holes were conducted using a SingleSmart Flexit™ survey tool which records both inclination and azimuth. As with the Tropari instrument, azimuth readings require correction to account for magnetic declination. Real-time downhole recording instruments have been used from 2007 onwards.
Other than for five holes, RC drilling conducted by Rio Alto in 2010 and 2011 was not downhole due to the unavailability of a non-magnetic downhole survey tool. All RC drilling since 2011 has been downhole surveyed with a non-magnetic downhole gyroscopic instrument.
Geologic data from drill core and RC samples are originally recorded on paper logging forms and then entered into the digital project database. Data documented from the drill core and RC chips includes lithology, primary and secondary rock textures, mineralization and alteration, estimated sulfide content, degree of oxidation, and structural features (core only).
| 51 |
| LA ARENA PROJECT |
| FORM 43-101F1 TECHNICAL REPORT |
| 10.3.5 | Geotechnical Logging |
Since 2011, nearly all drill core has been logged for logged for geotechnical data. The geotechnical database contains a total of 50,635 intervals from 207 core holes which have been logged for percent recovery, fracture density, fracture and joint filling, alteration and roughness, and hardness. From this data, geomechanical classifications – rock quality designation (RQD) and rock mass rating (RMR) – are calculated and stored in the database.
| 10.4 | DRILLING SUMMARY, RESULTS AND CONCLUSIONS |
The majority of drilling conducted prior to 2008 was generally oriented from east to west at inclinations between 60° and 70°, perpendicular to the interpreted mineralization in both the gold oxide and porphyry deposits. Since then, Rio Alto geologists identified a secondary control on the oxide gold mineralization of azimuth 40° and redirected a portion of their drilling orthogonal to this trend. Recent and current drilling of the gold oxide deposit at depth is oriented to the southwest to intersect the northwest-trending Tilsa structures below the current pit bottom.
The 2012 infill drilling into the porphyry deposit by Rio Alto appears to have had no preferential orientation. There are a number of drill holes that were essentially drilled down the dip or plunge of the porphyry. Based on the geometry of the deposit – trending north-south to northwest-southeast and plunging to the east-northeast – future drilling should be oriented either vertical or to the west-southwest to drill across the deposit. While the 2012 drill hole orientations do not detract from the Mineral Resource estimate of the porphyry-hosted mineralization, holes drilled orthogonally to the deposit provide for a better understanding of the porphyry and the distribution of the associated mineralization.
Mining Plus (2015) conducted a comparative study between RC and diamond drill core assays and identified a clear bias, at all grade ranges, where diamond drill assays were systematically lower grade than RC assays and concurred with Rio Alto that the use of only RC data to estimate oxide resources was appropriate. Given the degree of oxidation and fracturing of the sediment-hosted oxide gold (with higher-grade gold mineralization occurring on the fracture surfaces which are subject to ‘washing’ with diamond drilling methods), and support from mine reconciliation data, the author concurs that the use of RC data for Mineral Resource modeling and estimation is appropriate.
The author is confident that the drilling and sampling practices in place for the oxide gold deposit and for the porphyry-hosted copper gold deposit provide for a reliable representation of the deposits to use in support of Mineral Resource estimations.
| 52 |
| LA ARENA PROJECT |
| FORM 43-101F1 TECHNICAL REPORT |
| 11 | SAMPLE PREPARATION, ANALYSES AND SECURITY |
Sampling methodology, sample security, laboratory preparation and analyses, and quality assurance/quality control (QA/QC) measures beginning in 2004 have generally been of high standards. Except where noted, sample and analysis methodology has generally been consistent since that time. No reliable documentation of sampling and QA/QC practices prior to 2004 is available. The author considers this lack of documentation to be insignificant to the Mineral Resource estimates for the La Arena Mine and La Arena II deposits, as drilling completed prior to 2004 constitutes only six percent of the total drilling completed project-to-date.
Company geologists determine drill core sample intervals once the drill core has been logged for geologic and geotechnical properties (as described in Section 10.3.1 – Sample Collection and Handling). Drill core sample intervals are generally two meters in length, but can vary to prevent samples from extending over geologic contacts. The sample lengths are appropriate for the styles of mineralization at the La Arena Mine and the La Arena II deposits. Once the core sample intervals are determined, the core is marked and sample tags inserted. All drill core is photographed prior to sampling.
Prior to 2011, drill core samples selected for analysis were split by chiseling the core in half; since then, samples have been cut lengthwise using mechanized diamond saws, with one-half of the core is placed in a plastic sample bag with a sample tag. The remaining half core is returned to the core box for future reference. The practice of submitting one-half of the drill core provides a reasonable representation of the mineralization for analysis.
RC samples are collected at two meter intervals and quartered at the drill site using a riffle splitter to approximate six kilogram subsample sizes. Samples are collected in cloth-lined sample bags.
After logging and sampling are complete, core boxes are stored on racks inside a covered, secured core storage building within the La Arena Mine property as are duplicate RC subsamples. Samples for analysis are also stored in the secured building until such time they are delivered to commercial analytical laboratories for analysis. Access to the storage building is limited.
| 11.3 | LABORATORY SAMPLE PREPARATION AND ANALYSES |
Through the end of 2004, drill samples were processed and analyzed by CIMM Peru S.A. From 2005 to 2009, ALS Chemex was the primary analytical laboratory with CIMM as the secondary (check assay) laboratory. Beginning in 2009 through to the present, CERTIMIN S.A. (formerly CIMM) has been used as the primary laboratory with ALS Chemex as the secondary lab. Both the CERTIMIN and ALS Chemex laboratories in Peru hold ISO 9001:2000 certification for physicochemical preparation and testing for geochemical, metallurgical and environmental samples. There is no relationship between the two laboratories and the Company other than that of a client-customer relationship. CERTIMIN is the contract operator of the La Arena Mine grade control laboratory, but no drill core or RC samples used for Mineral Resource estimation are processed at the mine laboratory.
Upon receipt by the laboratory, samples are digitally weighed, dried to a maximum of 120° C, crushed to 70% < 2mm (10 mesh), riffle split to create 250 gram subsamples, and pulverized to 85% < 75μm (200 mesh), with 50 gram pulps were subjected to analysis. Pulps are fire assayed with metal determinations by atomic absorption spectrometry (FA-AAS). Gold assay results that return grades greater than 5 g/t are re-analyzed by gravimetric methods. Samples are analyzed for copper and other metals (generally silver, molybdenum, lead, zinc, arsenic, antimony and bismuth) using four-acid digestion with an AAS finish. Mercury is analyzed using cold vapor AASAS.
| 53 |
| LA ARENA PROJECT |
| FORM 43-101F1 TECHNICAL REPORT |
| 11.4 | QUALITY ASSURANCE / QUALITY CONTROL |
Internal quality control by the CERTIMIN and ALS Chemex laboratories consists of two standards, two blanks, two duplicates from sample rejects and two laboratory duplicates. Both CERTIMIN and ALS Chemex provide quality control reports for each sample batch.
There are three documented programs of QA/QC for the La Arena drill samples: 2004 to 2007, 2010 to 2014, and 2015 to the present. No resource drilling was conducted in 2008 and 2009. The two historic QA/QC programs are summarized below.
| 11.4.1 | 2004 to 2007 QA/QC Procedures |
In June 2004, Cambior implemented a QA/QC program consisting of:
| | • | Standards and blanks inserted into the sample stream at 30-sample intervals; |
| | • | Field duplicates inserted at 30-sample intervals; |
| | • | Coarse (crushed) rejects submitted to the primary laboratory at 20-sample intervals; |
| | • | Pulp rejects submitted to the primary laboratory at 30-sample intervals; |
| | • | Pulp duplicates submitted to the primary laboratory at 15 sample intervals; and |
| | • | Pulp duplicates submitted to secondary laboratory at 20-sample intervals. |
After review of the 2004 to 2007 QA/QC dataset, Kirk (2011) concluded the results obtained from standards, blanks, rejects and duplicates display adequate accuracy and precision to be considered as reliable datasets.
| 11.4.2 | 2010 to 2014 QA/QC Procedures |
Beginning in 2010 through 2014, La Arena S.A. geologists collected drill core and RC field duplicates at a frequency of between 1:30 to 1:50. The duplicate results showed very good reproducibility, with 90% of the data having a precision within 15-20%, indicative of good quality sampling practices (Kirk, 2013).
Assay standards were inserted at a frequency of 1:20 to 1:25 into the sample stream. Both gold oxide and copper sulfide standards displayed little bias with a high level of precision.
Blanks for the oxide gold sample stream showed no signs of contamination. Minor contamination was noted in the copper sulfide blanks; however, this was considered unlikely to have any significant effect on the veracity of the resource data (Kirk, 2013).
| 11.4.3 | Current QA/QC Procedures |
The Company’s current QA/QC procedures consist of the use of assay standards and blanks, and blind field duplicates. Assay standards and blanks are obtained from commercial sources, Rocklabs (SCOTT® Technology Limited) and ORE Research & Exploration Pty Ltd. Separate standards and blanks are used to validate laboratory results from holes drilled in the oxide gold and porphyry copper-gold deposits; assay standards have mineralogy and gangue similar to each deposit. Results discussed below pertain to post-2014 QA/QC for the La Arena Mine and to 2011 to 2017 for the La Arena II Project.
La Arena Mine
La Arena S.A. geologists use three gold assay standards for RC samples collected from the La Arena Mine oxide gold deposit, with gold values of 0.125 g/t, 0.609 g/t and 1.019 g/t. Assay standards are inserted into the sample stream at a rate of one standard per 25 samples. Summary statistics of laboratory performance of the post-2014 assay standards analyzed are presented in Table 11-1.
| 54 |
| LA ARENA PROJECT |
| FORM 43-101F1 TECHNICAL REPORT |
Table 11-1: La Arena Mine Gold Assay Standard Results
(all values in g/t)
Standard
ID | Standard
Value | Number of
Assays | Mean | Min | Max | -3 Standard
Deviations | +3 Standard
Deviations |
| OxB130 | 0.125 | 66 | 0.117 | 0.111 | 0.123 | 0.110 | 0.124 |
| OxE113 | 0.609 | 73 | 0.603 | 0.597 | 0.615 | 0.592 | 0.613 |
| OxG103 | 1.109 | 80 | 1.004 | 0.992 | 1.043 | 0.989 | 1.020 |
The comparative results indicate a slight systematic bias with the lowest grade assay standard, OxB130, as all of the assays for this standard fall slightly below the assay standard value, suggesting either a calibration error at the laboratory or an error in calculating the round-robin results of the standard. Given the low grade of the standard and the very slight average difference between the declared gold value of the standard and the assay results (-6%), the impact of this discrepancy likely has little impact, though follow up work may be justified as the assay standard is just slightly above the current cut-off grade at the La Arena Mine. The performance of the higher-grade standards is within acceptable ranges.
Assay blanks with a gold detection limit of 5 ppb are inserted into the sample stream at a rate of one blank per 20 samples. A control chart illustrating laboratory performance for the post-2014 sample blanks is presented in Figure 11-1.
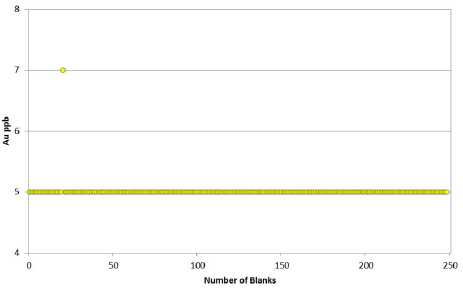
Figure 11-1: La Arena Mine Gold Assay Blanks
With the exception of a single outlier, the assay blanks demonstrate good sample preparation practices at the laboratory, with essentially no cross-contamination.
RC field duplicate samples are collected at the drill rig and inserted into the sample stream as blind samples at a rate of one duplicate per 30 samples. Statistical comparison between the post-2014 original samples and the blind duplicate samples is summarized in Table 11-2 and shown graphically in Figure 11-2.
| 55 |
| LA ARENA PROJECT |
| FORM 43-101F1 TECHNICAL REPORT |
Table 11-2: La Arena Mine Duplicate Sample Statistics - Gold
(147 Sample Pairs)
| Sample | Mean | Minimum | Maximum | Standard
Deviation | Coefficient of
Variation |
| Original | 240 | 0 | 2048 | 377 | 1.6 |
| Duplicate | 238 | 0 | 2057 | 373 | 1.6 |
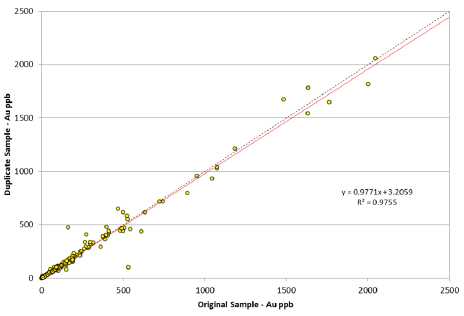
Figure 11-2: La Arena Mine Duplicate Sample Results – Gold
Duplicate sample results show excellent correlation (r2=0.98) and attests to good sampling practices at the drill rig with no sample bias.
La Arena II Project
La Arena S.A. geologists have used three copper and gold assay standards for the diamond drill and RC samples collected from the La Arena II Project porphyry deposit, with copper values of 1,660 ppm, 3,850 ppm and 7,120 ppm, and gold values of 0.042 g/t, 0.116 g/t and 0.311 g/t. Assay standards are inserted into the sample stream at a rate of one standard per 25 samples. Summary statistics of laboratory performance of the copper and gold assay standards analyzed are presented in Table 11-3 and Table 11-4, respectively.
Table 11-3: La Arena II Project Copper Assay Standard Results
| Standard ID | Standard
Value | Number of
Assays | Mean | Min | Max | -3 Standard
Deviations | +3 Standard
Deviations |
| Oreas 151a | 1660 | 492 | 1632 | 1520 | 1810 | 1519 | 1745 |
| Oreas 152a | 3850 | 616 | 3766 | 3400 | 4060 | 3594 | 3933 |
| Oreas 153a | 7120 | 62 | 7078 | 6770 | 7310 | 6691 | 7465 |
| 56 |
| LA ARENA PROJECT |
| FORM 43-101F1 TECHNICAL REPORT |
Table 11-4: La Arena II Project Gold Assay Standard Results
(all values in g/t)
| Standard ID | Standard
Value | Number of
Assays | Mean | Min | Max | -3 Standard
Deviations | +3 Standard
Deviations |
| Oreas 151a | 0.043 | 492 | 0.042 | 0.036 | 0.054 | 0.035 | 0.049 |
| Oreas 152a | 0.116 | 616 | 0.116 | 0.103 | 0.125 | 0.107 | 0.124 |
| Oreas 153a | 0.311 | 62 | 0.316 | 0.298 | 0.330 | 0.297 | 0.336 |
Overall, both the copper and gold assay standards are within acceptable ranges, with just a few outliers. There appears to be no systematic laboratory biases for the porphyry-hosted mineralization.
Assay blanks, with a copper detection limit of 5 ppm and gold detection limit of 5 ppb are inserted into the sample stream at a rate of one blank per 20 samples. Control charts illustrating laboratory performance for the copper and gold sample blanks are presented in Figure 11-3 and Figure 11-4, respectively.
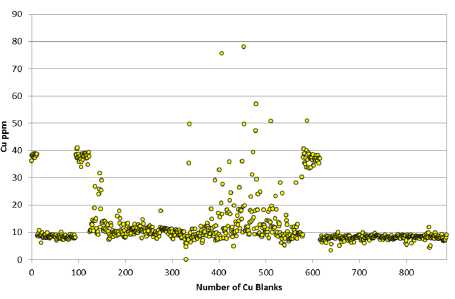
Figure 11-3: La Arena II Copper Assay Blanks
| 57 |
| LA ARENA PROJECT |
| FORM 43-101F1 TECHNICAL REPORT |

Figure 11-4: La Arena II Gold Assay Blanks
Overall, copper blanks appear to have a consistent background value of about 7 to 12 ppm. Given the very low values, this is not a concern regarding the quality of the sample preparation methods at the laboratory. There are two periods of time where the blank values cluster between 35 and 40 ppm. A review of the drill hole sample streams for which these blanks were inserted show the drilling was targeting the FPA-2 intrusive downdip. Sample smearing of higher-grade samples during the sample preparation procedures likely contributed to these occurrences. Another possibility is an alternative sample blank was used for two distinct time periods of which the author is not aware. Irrespective of the cause, these elevated values are still very low in grade and only comprise a small portion of the dataset.
Duplicate core and RC samples are inserted into the sample stream as blind samples at a rate of one duplicate per 30 samples. Statistical comparisons between the original samples and the blind duplicate samples are summarized in Table 11-5 and Table 11-6 and shown graphically in Figure 11-5 and Figure 11-6. A few very high-grade samples pairs are not shown for clarity.
Table 11-5: La Arena II Duplicate Sample Statistics – Copper
(1,520 Sample Pairs)
| Sample | Mean | Minimum | Maximum | Standard
Deviation | Coefficient of
Variation |
| Original | 1933 | 5 | 31000 | 2664 | 1.4 |
| Duplicate | 1978 | 5 | 30400 | 2775 | 1.4 |
| 58 |
| LA ARENA PROJECT |
| FORM 43-101F1 TECHNICAL REPORT |
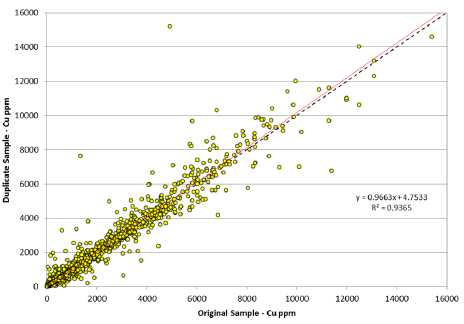
Figure 11-5: La Arena II Duplicate Sample Results - Copper
Table 11-6: La Arena II Duplicate Sample Statistics – Gold
(3,469 Sample Pairs)
| Sample | Mean | Minimum | Maximum | Standard
Deviation | Coefficient of
Variation |
| Original | 157 | 5 | 9030 | 287 | 1.8 |
| Duplicate | 157 | 5 | 9030 | 287 | 1.8 |
Note: The identical results in the table above are real, with variance of less than one ppb. This does not imply 100% correlation as shown in the figure below.
| 59 |
| LA ARENA PROJECT |
| FORM 43-101F1 TECHNICAL REPORT |
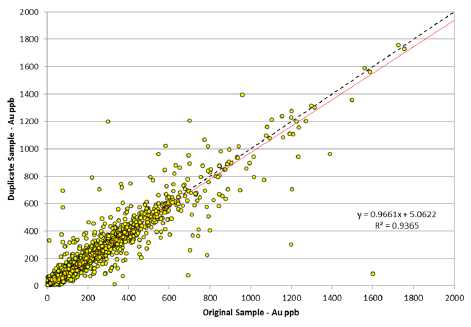
Figure 11-6: La Arena II Duplicate Sample Results – Gold
Duplicate sample results show excellent correlation for both copper and gold (each with r2=0.94) which attests to good sampling practices at the drill rig and in the core shed with no apparent sample bias.
As all but a few holes drilled prior to 2004 are core holes, and the estimate of the Mineral Resources for the La Arena Mine uses only RC drill sample data and the lack of sampling and QA/QC documentation prior to 2004 is negligible. Since approximately 95% of the drilling completed in the La Arena II porphyry deposit has occurred since 2004, the impact of a lack of sample documentation prior to 2004 is insignificant to the Mineral Resource estimate.
The author believes that the core and RC sampling procedures, sample analyses, QA/QC procedures, and sample security have provided sample results that are of sufficient quality for use in the Mineral Resource estimations presented in Section 14 of this Technical Report.
| 60 |
| LA ARENA PROJECT |
| FORM 43-101F1 TECHNICAL REPORT |
The La Arena geologic and analytical database, sample collection procedures, analytical procedures, and quality control/quality assurance (QA/QC) programs and results had undergone extensive review and validation by external third-party Qualified Persons from 2008 through 2014 as well as continual review by Rio Alto and La Arena S.A. personnel.
| 12.1 | PRIOR DATA VERIFICATION PROGRAMS |
The following is a summary of the key features of the third-party reviews conducted prior to the Mineral Resource estimate reported herein:
Coffey Mining 2008
In 2008, Coffey Mining Pty Ltd (Coffey) completed a data verification program which included review of the drill hole database, review and analysis of the QA/QC data for assay standards, blanks, drill rejects, and sample duplicates, and validation of the digital surface topography and bulk densities. Coffey reported no significant concerns about the accuracy and precision of the project data assembled since 2004 and determined the level of accuracy achieved by the commercial assay laboratories was within industry accepted limits. Coffey considered the topography model suitable for mine planning purposes and that sufficient density data had been collected to assign tonnage factors to the resource estimate. Coffey noted that the historical data (prior to 2004) lacked documented quality control procedures and results.
Coffey Mining 2010
In its 2010 Technical Report, Coffey reiterated that the historical data, prior to 2004, had a lack of documented quality control, but the post 2004 data is robust and with sufficient controls in place to ensure that the data collection is reliable and adequate for the resource estimate. It is unclear whether or not additional data verification occurred as part of the 2010 study.
Kirk Mining Consultants 2011
Kirk Mining Consultants (Kirk) reviewed the updated drill hole database and QA/QC procedures and results, completed a comparative study of diamond drill core and bulk sampling assay results, and reviewed additional bulk density determinations. Kirk identified minor discrepancies in the drill hole database, particularly for silver and molybdenum that required remediation in the database. Kirk also reported that, based on 39 sample pairs, gold values tended to be significantly higher than the grades achieved by diamond drilling and recommended a RC twinning program to validate the results of the bulk sample test. Additional bulk density measurements validated those previously used for resource estimation. Kirk concluded the project data continues to be adequate for resource estimation. Kirk also noted the drill hole database was now housed in a commercial-quality Acquire database.
Kirk Mining Consultants 2013
Kirk reviewed the Acquire drill hole database through the end of 2012 and reported that the database discrepancies concerning silver and molybdenum noted in 2011 had been corrected. Kirk also examined the QA/QC results obtained since their last review in 2011 and reviewed additional bulk density determinations made by Rio Alto, which confirmed the density values used for the resource modeling of oxide sandstone-hosted and porphyry-hosted mineralization. Kirk once again concluded that sufficient controls were in place to ensure that the data collection was reliable and adequate for resource estimation.
| 61 |
| LA ARENA PROJECT |
| FORM 43-101F1 TECHNICAL REPORT |
Mining Plus 2013
Mining Plus Peru S.A.C. (Mining Plus) concentrated their data verification on data acquired in 2013. Data review consisted of RC and blasthole sample collection procedures and QA/QC procedures. Mining Plus commented that the QA/QC process had ‘fallen away’ at the laboratory in 2013 for the blasthole (grade control) sample stream and recommended greater diligence by Rio Alto, but reported rigorous QA/QC procedures regarding RC and diamond drill samples. Mining Plus concluded the 2013 data is relatively robust and sufficient controls in place to ensure data collection is reliable and adequate for resource estimation.
Mining Plus 2015
Mining Plus emphasized validation of project data acquired since their review in 2013. Their review of the 2014 data included assessment of QA/QC data, comparison of original laboratory assay certificates to assay entries in the digital database for five drill holes (no discrepancies found), and reviewed RC versus diamond drill core assays. Mining Plus identified a clear systematic bias, at all grade ranges, where diamond drill assays were systematically lower grade than RC assays and concurred with Rio Alto that the use of only RC data to estimate oxide resources was appropriate. Mining Plus also concluded the approach and discipline of the QA/QC process had improved per their prior recommendations, making for a more reliable dataset for use in the resource estimation process.
| 12.2 | 2017 DATA VERIFICATION |
There has been no drilling at the La Arena Mine or La Arena II Project since the end of 2015, with the exception of two short RC holes drilled in the Calaorco pit and four core holes drilled in the La Arena II porphyry, three of which were drilled to obtain additional metallurgical samples. The author has reviewed all of the prior data validation reports and is comfortable with the level of rigor used by the third-party firms to verify the pre-2015 data and conducted no further data validation tests on the pre-2015 project data.
A total of 57 drill holes were completed on the La Arena property in 2015. As a check on the database integrity, the author selected data from 13 holes (23%) encompassing 2,490 individual sample intervals (28%) drilled in 2015. Entries into the drill hole database were compared against the original laboratory assay certificates received from the primary analytical laboratory, CERTIMIN S.A., with no discrepancies found.
Based on the results of prior third-party assessments of sample collection procedures, laboratory protocols, QA/QC programs, and multiple database reviews, and on the author’s 2015 dataset audit, the project database is of sufficient quality to ensure the data used in the Mineral Resource estimate is valid.
| 62 |
| LA ARENA PROJECT |
| FORM 43-101F1 TECHNICAL REPORT |
| 13 | MINERAL PROCESSING AND METALLURGICAL TESTING |
| 13.1 | LA ARENA MINE METALLURGICAL EVALUATION OF OXIDE GOLD DEPOSIT |
The La Arena Mine orebody comprises a sediment-hosted oxide gold deposit that is currently being mined.
The metallurgical evaluation of the oxide gold deposit at La Arena Mine is described in detail in Rio Alto’s 2015 NI 43-101 Technical Report (Mining Plus; 2015). It includes the following:
| | • | Column leach tests by Heap Leach Consulting S.A.A (HLC) in 2010 |
| | • | Actual heap leach production data from April 2011 through January 2013 |
| | • | Post start-up control test program that concluded in December 2012 |
| | • | Column leach tests by CERTIMIN on site and at SGS Lima in 2013 |
| | • | Pilot dump leach test onsite by CERTIMIN in 2014 |
The HLC tests obtained recoveries ranging from 82 to 96% after 47 days. These were borne out by data from the heap leach operation from 2011 to 2013, which attained almost 90% recovery with a cyanide consumption of about 0.1 kg/t and lime consumption of about 0.7 kg/t. Post-operation start-up tests obtained 87.4% Au recovery on two tests, with lime consumptions of 0.7 and 1.1 kg/t and cyanide consumption of 0.1 kg/t., which were consistent with the HLC tests and with production data.
Recoveries attained from the current heap leaching operations attest to the validity of the metallurgical testwork.
| 13.1.1 | 2014 Column Leach Tests |
Column leach tests were conducted by CERTIMIN onsite and at the SGS laboratory in Lima on material crushed to 100% finer than 25 mm, consisting of 33.3% oxide intrusive rock and 66.7% sandstone. While the two sites were intended to perform identical tests, CERTIMIN used a 283 mg/L NaCN solution, while SGS used a 150 mg/L NaCN solution. In spite of this difference, the gold extraction results were the same, as shown in Table 13-1 below. The cyanide consumption is higher for the site tests, which is consistent with the higher cyanide strength.
Table 13-1: CERTIMIN and SGS Column Tests Results
| Composite | Head Assay,
g/t Au | Head Assay,
% Cu | NaCN, mg/L | Extraction, %
Au | Lime, kg/t | NaCN, kg/t |
| Site Column C-18 | 0.44 | 0.0339 | 283 | 86.2 | 1.56 | 0.15 |
| Site Column C-19 | 0.44 | 0.0339 | 283 | 87.1 | 1.57 | 0.17 |
| SGS Column 01 | 0.49 | 0.0349 | 150 | 86.5 | 1.53 | 0.10 |
| SGS Column 02 | 0.49 | 0.0349 | 150 | 86.4 | 1.53 | 0.10 |
The kinetics of these tests are plotted in Figure 13-1 and Figure 13-2, for gold and copper, respectively. Both set of tests show fast gold dissolution in the first 5 to 7 days and levelling off thereafter. Copper, on the other hand, dissolved slower and only attained less than 1.6% recovery. In these tests and other tests, cyanide consumption due to the presence of copper was not an economic factor.
| 63 |
| LA ARENA PROJECT |
| FORM 43-101F1 TECHNICAL REPORT |
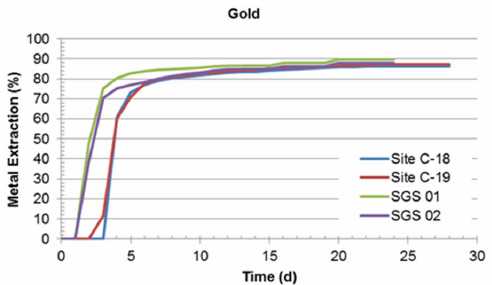
Figure 13-1: Gold Extraction Curve kinetics for Column Tests

Figure 13-2: Copper Extraction Curve Kinetics for Column Tests
| 13.1.2 | Late 2014 Oxide Intrusive Program |
Four pilot dump leach tests were performed on the composite material blended at different sandstone to intrusive ratios, namely 2.3:1, 2.6:1, 4.2:1 and 4.8:1, labeled dump leach test No. 1, 2, 3 and 4, respectively. Industrial dump leach conditions were applied to all pilot dump leach tests. The irrigation solution was 188 mg/L NaCN and pH 11. Irrigation time was in a range of 51 to 60 days. All dump leach tests were 8 meters high. The results are presented in Table 13-2 and Figure 13-3.
Gold extraction after 51 to 60 days of leaching was 80.3% to 83.6%, consuming 0.1 kg/t of cyanide and 1 kg/t of lime. Figure 13-3 shows that after the test leach periods, gold extraction had not yet levelled off, suggesting that additional leaching time would be beneficial for increased gold recovery
| 64 |
| LA ARENA PROJECT |
| FORM 43-101F1 TECHNICAL REPORT |
Table 13-2: Late 2014 Pilot Dump Leach Results
| Test | Sandstone to
Intrusive Ratio | Irrigation
Rate, L/m2/h | Irrigation
time, d | Head,
g/t Au | Head,
%Cu | NaCN,
mg/L | Final
Ext,
%Au | Ext at 51
d, %Au | Lime,
kg/t | NaCN,
kg/t |
| 1 | 2.3:1 | 5.9 | 55 | 0.46 | 0.0170 | 100 | 80.3 | 79.6 | 0.91 | 0.09 |
| 2 | 2.6:1 | 6.9 | 55 | 0.46 | 0.0170 | 100 | 82.0 | 81.1 | 1.00 | 0.10 |
| 3 | 4.2:1 | 10 | 51 | 0.30 | 0.0215 | 100 | 80.3 | 80.3 | 0.90 | 0.09 |
| 4 | 4.8:1 | 10 | 60 | 0.35 | 0.0147 | 100 | 83.6 | 78.6 | 0.90 | 0.10 |
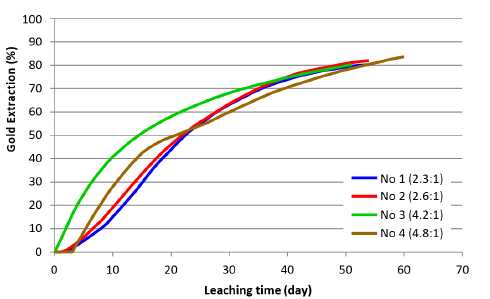
Figure 13-3: Kinetic Curve for Gold Extraction in Pilot Dump Leach Test
| 13.1.3 | Reagent Consumption |
Typical lime and cyanide consumptions are 0.675 kg/t and 0.098 kg/t, respectively, for sandstone leaching. For sandstone-intrusive blends, the lime and cyanide consumption are 0.928 kg/t and 0.090 kg/t, respectively. By deducting the proportional sandstone consumption from the blend consumption, the NaCN and lime consumption by intrusives can be estimated. The results of such estimation are shown in Table 13-3.
Table 13-3: Reagents Consumption Calculated for Each Rock Type
| Test | Blend | NaCN Consumption, 51 d, kg/t | Lime Consumption, kg/t |
| Blend | Intrusive, calc | Sandstone | Blend | Intrusive, calc | Sandstone |
| 1 | 2.3:1 | 0.090 | 0.071 | 0.098 | 0.910 | 1.455 | 0.675 |
| 2 | 2.6:1 | 0.090 | 0.069 | 0.098 | 1.000 | 1.842 | 0.675 |
| 3 | 4.2:1 | 0.090 | 0.057 | 0.098 | 0.900 | 1.834 | 0.675 |
| 4 | 4.8:1 | 0.090 | 0.052 | 0.098 | 0.900 | 1.976 | 0.675 |
| Avg. | | 0.090 | 0.062 | 0.098 | 0.928 | 1.777 | 0.675 |
| 65 |
| LA ARENA PROJECT |
| FORM 43-101F1 TECHNICAL REPORT |
| 13.2 | LA ARENA II METALLURGICAL EVALUATION |
Sulfide mineralization at the La Arena II sulfide deposit has been classified into three types based on rock alteration. These were argillic, phyllic and potassic alterations, which are briefly described below:
| • | Argillic Alteration:The alteration assemblage is kaolinite-illite. The sulfide minerals are pyrite, chalcopyrite, chalcocite, and covellite. |
| | | |
| • | Phyllic Alteration:The alteration assemblage is sericite-quartz. The sulfide minerals are pyrite, chalcopyrite, and molybdenite. |
| | | |
| • | Potassic Alteration:The alteration assemblage is secondary biotite-K-feldspars-magnetite. The sulfide minerals are chalcopyrite, bornite, and molybdenite. |
Rock samples sent to the laboratory were identified under one of these three alterations. Tahoe Resources has been reviewing core logs and checking the alteration assignments, which may be updated in the next level of study. For example, a few test samples or composites that were identified as argillic may be reassigned to the phyllic alteration. The sulfide copper-gold deposit at the La Arena II Project has been tested under six metallurgical studies commissioned by Cambior, and by Rio Alto before its merger with Tahoe. The first two studies were conducted at SGS in 2006 (SGS 2006) and 2007 (SGS 2007) for Cambior. More recent tests on composites and variability samples were conducted at the ALS Chemex laboratories in Kamloops, Canada from 2012 through 2014 for Rio Alto. The results were presented in reports KM3262 (ALS 2012), KM3526 (ALS 2012), KM3866 (ALS 2013) and KM3991 (ALS 2014). The first three tests at Kamloops were supervised by MQEs, while the fourth testing program (KM3991) was designed and managed by Ausenco.
This section of the NI 43-101 report is a revised version of metallurgy section of the unpublished feasibility study report written by Ausenco for Rio Alto in April 2015. The report has been shortened for the purpose of a preliminary economic assessment, with new interpretation of some flotation data and added details in the comminution discussion. The metallurgical evaluation was performed on a different orebody, from drill hole samples that are shallow relative to the extent of the current reserves. However, the findings of the testing programs are applicable to current study at a preliminary economic assessment level.
Tahoe has embarked in a diamond drilling program to obtain metallurgical samples for testing the porphyry sulfide deposit for the next level of study. The goal is to obtain samples that will represent the entire orebody, with deeper drill holes, and provide information on the variability of metallurgical responses within the pit shell.
Metallurgical test work considered a number of samples from six diamond drill holes (DDH), namely LA-D12-M1A, LA-D12-M16, LA-D12-M17, LA-D12-M4D, LA-D-13-M01, and LA-D-13-M02. Figure 13-4 illustrates the locations of the metallurgical drill holes in the mine pit shell.
The test programs KM3262, KM3526 and KM3866 investigated 39 composites from LA-D12-M1A, LA-D12-M16, LA D12-M17, and LA-D12-M4D. These composites were based on lithologies, relative position in the deposit and predicted copper grades. “HA” was the designation given to pre-mineral hypabyssal andesite, “HAI” was given to intra-mineral hypabyssal andesite. These lithologies were later changed such that HA became felspar porphyry dacitic 2 or “FPA-2” and HAI became felspar porphyry dacitic 3 or “FPA-3.” For consistency with the metallurgical reports, the HA and HAI nomenclature will be retained in the following discussions. Table 13-4 is the list of composites tested in KM3262, KM3526 and KM3866. All samples were used in flotation tests, and samples used for JK tests are marked in the table.
| 66 |
| LA ARENA PROJECT |
| FORM 43-101F1 TECHNICAL REPORT |

Figure 13-4: Metallurgical drill hole location superimposed on the mine pit shell
Table 13-4: Testwork Composites for KM3262, KM3526 and KM3866
| Composite | Test | Composite | Test |
| M1A Bottom HA Medium | SMC | M4D Center HAI High | |
| M1A Bottom HAI High | | M4D Center HAI Low | |
| M1A Bottom HAI Low | | M17 Bottom HAI Low | SMC |
| M1A Bottom HAI Medium | SMC | M17 Bottom HAI Medium | |
| M1A Center HA Medium | Drop Weight | M17 Center HA Low | Drop Weight |
| M1A Center HAI Medium | Drop Weight | M17 Center HA Medium | |
| M1A Center HA High | | M17 Center HAI Medium | Drop Weight |
| M1A Center HA Low | | M17 Center HAI High | |
| M1A Center HAI High | | M17 Center HAI Low | |
| M1A Center HAI Low | | M17 Top HA High | |
| M1A Top HA High | | M17 Top HA Low | |
| M1A Top HA Low | | M17 Top HA Medium | SMC |
| M1A Top HA Medium | SMC | M16 Bottom HAI Low | SMC |
| M1A Top HAI Low | SMC | M16 Bottom HAI Medium | |
| M4D Bottom HA High | | M16 Center HAI Medium | SMC |
| M4D Bottom HA Low | | M16 Center HAI Low | |
| M4D Bottom HA Medium | Drop Weight | M16 Top HA High | |
| M4D Bottom HAI High | | M16 Top HA Low | |
| M4D Bottom HAI Low | | M16 Top HA Medium | Drop Weight |
| M4D Bottom HAI Medium | Drop Weight | M16 Top HAI Low | Drop Weight |
| M4D Center HAI Medium | SMC | | |
From the testing program KM3991, three domain composites, ARC, PHC and KC, representing each of the argillic, phyllic and potassic alterations, respectively, were selected based on the average grades for the La Arena deposit of 0.30% Cu and 0.20 g/t Au. Three additional domain composites were prepared with the same criteria and were used for JK drop-weight and SMC tests. The samples were distinguished from the former three composites by the “-DW” code appended to their names, that is, ARC-DW, PHC-DW and KC-DW.
| 67 |
| LA ARENA PROJECT |
| FORM 43-101F1 TECHNICAL REPORT |
A further fifteen variability composites were prepared to ensure good spatial coverage of the deposit. The composites are summarized below in Table 13-5. The drill holes from which the samples were taken were located in the pit shell. Assays used for sample selection were from twinned drill holes located about two meters from the drill holes used in the metallurgical test work.
Table 13-5: Test Work Composites for KM3991
| Composite | Alteration | Test | Composite | Alteration | Test |
| ARC | Argillic | Flotation | VC-06 | Phyllic | SMC / Flotation |
| PHC | Phyllic | Flotation | VC-07 | Phyllic | SMC / Flotation |
| KC | Potassic | Flotation | VC-08 | Phyllic | SMC / Flotation |
| ARC-DW | Argillic | Drop Weight / SMC | VC-09 | Phyllic | SMC / Flotation |
| PHC-DW | Phyllic | Drop Weight / SMC | VC-10 | Phyllic | SMC / Flotation |
| KC-DW | Potassic | Drop Weight / SMC | VC-11 | Potassic | SMC / Flotation |
| VC-01 | Argillic | SMC / Flotation | VC-12 | Argillic | SMC / Flotation |
| VC-02 | Argillic | SMC / Flotation | VC-13 | Phyllic | SMC / Flotation |
| VC-03 | Argillic | SMC / Flotation | VC-14 | Argillic | SMC / Flotation |
| VC-04 | Argillic | SMC / Flotation | VC-15 | Potassic | Flotation |
| VC-05 | Phyllic | SMC / Flotation | | | |
The head assays for each of the domain composites and variability composites are shown in Table 13-6.
Table 13-6: Main elements for domain and variability composites head assays
| Composite | Alteration | Cu (%) | Au (g/t) | Fe (%) | S (%) |
| ARC | AR | 0.28 | 0.15 | 6.15 | 6.40 |
| PHC | PH | 0.27 | 0.18 | 6.75 | 6.72 |
| KC | K | 0.38 | 0.18 | 5.45 | 3.76 |
| VC-01 |
AR
| 0.29 | 0.24 | 8.10 | 7.13 |
| VC-02 | 0.12 | 0.16 | 6.20 | 6.74 |
| VC-03 | 0.65 | 0.70 | 6.30 | 7.28 |
| VC-04 | 0.46 | 0.42 | 7.70 | 8.74 |
| VC-12 | 0.10 | 0.13 | 6.10 | 7.05 |
| VC-14 | 0.65 | 0.60 | 7.70 | 9.44 |
| VC-05 |
PH
| 0.31 | 0.16 | 5.90 | 5.24 |
| VC-06 | 0.36 | 0.42 | 7.10 | 7.71 |
| VC-07 | 0.77 | 0.59 | 13.2 | 14.7 |
| VC-08 | 0.68 | 0.67 | 8.10 | 9.00 |
| VC-09 | 0.30 | 0.19 | 6.80 | 7.58 |
| VC-10 | 0.49 | 0.39 | 8.50 | 9.71 |
| VC-13 | 0.25 | 0.16 | 4.90 | 5.28 |
| VC-11 |
K
| 0.39 | 0.31 | 5.70 | 2.24 |
| VC-15 | 0.38 | 0.28 | 5.60 | 3.60 |
| 68 |
| LA ARENA PROJECT |
| FORM 43-101F1 TECHNICAL REPORT |
| 13.3 | LA ARENA II COMMINUTION TEST WORK |
Comminution testing was conducted under testing programs KM3526 (ALS) and KM3991 (ALS). Earlier measurements of Bond ball mill work index (BWi) by SGS in 2007 averaged lower than the ALS measurements, and were therefore not used in this study to be conservative. Table 13-7 is a summary of grindability tests results, which include 34 Axb data, 35 BWi data, and 35 abrasion index (Ai) data. Bond crushing work indices (CWi) were not measured in any of the test programs.
Samples labeled “VC-##” came from short segments of drill core and may be considered variability samples, while the rest were composites. The variability composites were taken from shallow portions of the project open pit. To take the project to the feasibility level of study, variability samples will need to be taken from deeper parts of the deposit within the pit shell.
Table 13-7: Comminution Data
Test
Program | Sample | Alteration
Type | A | b | Axb | SG | ta | BWi
kWh/t | Ai
g |
| Phase II | ARC | AR | 71.1 | 2.73 | 194 | 2.57 | 1.96 | 9.8 | 0.033 |
| KM 3991 | VC-01 | AR | 66.6 | 1.64 | 109 | 2.68 | 1.06 | 8.9 | 0.008 |
| | VC-02 | AR | 64.7 | 1.79 | 116 | 2.50 | 1.20 | 7.3 | 0.011 |
| | VC-03 | AR | 73.9 | 2.59 | 191 | 2.55 | 1.94 | 9.4 | 0.009 |
| | VC-04 | AR | 72.1 | 2.64 | 190 | 2.66 | 1.86 | 8 | 0.003 |
| | VC-12 | AR | 65.3 | 1.62 | 106 | 2.53 | 1.08 | 7.5 | 0.011 |
| | VC-14 | AR | 72.3 | 3.93 | 284 | 2.70 | 2.73 | 8.7 | 0.018 |
| | PHC | PH | 66 | 2 | 132 | 2.59 | 1.32 | 9.1 | 0.019 |
| | VC-05 | PH | 63 | 1.42 | 89 | 2.56 | 0.91 | 12.3 | 0.035 |
| | VC-06 | PH | 70.6 | 2.41 | 170 | 2.63 | 1.68 | 8.8 | 0.025 |
| | VC-07 | PH | 69.6 | 2.27 | 158 | 3.07 | 1.34 | 12.7 | 0.11 |
| | VC-08 | PH | 67.5 | 1.76 | 119 | 2.70 | 1.14 | 8 | 0.036 |
| | VC-09 | PH | 70.3 | 2.27 | 160 | 2.58 | 1.60 | 10.4 | 0.028 |
| | VC-10 | PH | 65.2 | 2.18 | 142 | 2.79 | 1.32 | 8.8 | 0.068 |
| | VC-13 | PH | 77.9 | 3.9 | 304 | 2.50 | 3.14 | 8.1 | 0.002 |
| | KC | K | 76.7 | 0.43 | 33 | 2.65 | 0.32 | 13.8 | 0.09 |
| | VC-11 | K | 76.9 | 0.41 | 32 | 2.67 | 0.30 | 13.1 | 0.121 |
| | VC-15 | K | | | | | | 13.5 | 0.098 |
| KM3526 | M1A HA Centre Medium | | 62.5 | 2.14 | 133.8 | 2.78 | 1.41 | 10.1 | 0.043 |
| Full JK | M1A HAI Centre Medium | | 65.6 | 2.18 | 143.0 | 2.64 | 1.0 | 8.8 | 0.011 |
| | M4D HA Bottom Medium | | 69.7 | 0.9 | 62.7 | 2.62 | 0.39 | 13.7 | 0.073 |
| | M4D HAI Bottom Medium | | 64.2 | 2.94 | 188.7 | 2.55 | 1.33 | 10.5 | 0.02 |
| | M16 HA Top Medium | | 69.6 | 4.08 | 284.0 | 2.58 | 2.24 | 10 | 0.012 |
| | M16 HAI Top Low | | 66.0 | 3.13 | 206.6 | 2.58 | 1.44 | 9.7 | 0.01 |
| | M17 HA Centre Low | | 67.3 | 3.05 | 205.3 | 2.53 | 1.41 | 9.3 | 0.015 |
| | M17 HAI Centre Medium | | 69.1 | 4.75 | 328.2 | 2.57 | 3.96 | 8.6 | 0.006 |
| KM3526 | M1A HA Bottom Medium | | 69.1 | 3.29 | 227.3 | 2.75 | 2.14 | 9.4 | 0.005 |
| SMC | M1A HA Top Medium | | 73 | 1.6 | 116.8 | 2.69 | 1.13 | 11.6 | 0.032 |
| | M1A HAI Bottom Medium | | 70.4 | 1.61 | 113.3 | 2.6 | 1.13 | 10 | 0.001 |
| | M1A HAI Top Low | | 64.9 | 1.66 | 107.7 | 2.58 | 1.08 | 10.9 | 0.074 |
| | M4D HAI Centre Medium | | 75.7 | 3.71 | 280.8 | 2.63 | 2.77 | 7 | 0.009 |
| | M16 HAI Bottom Low | | 69.9 | 1.98 | 138.4 | 2.56 | 1.4 | 8.9 | 0.019 |
| | M16 HAI Centre Medium | | 73 | 1.91 | 139.4 | 2.61 | 1.38 | 8.5 | 0.022 |
| | M17 HA Top Medium | | 76.9 | 5.02 | 386.0 | 2.61 | 3.83 | 8.9 | 0.013 |
| | M17 HAI Bottom Low | | 70 | 2.15 | 150.5 | 2.64 | 1.48 | 8.2 | 0.001 |
| 69 |
| LA ARENA PROJECT |
| FORM 43-101F1 TECHNICAL REPORT |
Cumulative frequency distributions of Axb and BWi are plotted in Figure 13-5 and Figure 13-6, respectively, to enable estimation of the 80th percentile hardness values on which to design the SAG mill and ball mill. The 50th percentile hardness and abrasion index were also extracted from the distribution for use in estimating average power consumption and average consumptions of steel balls and liners. These are summarized in Table 13-8 below.
Table 13-8: Summary of Comminution Design Parameters
| Parameter | 80thPercentile | 50thPercentile |
| A | 73 | 69.9 |
| b | 1.6 | 2.27 |
| Axb* | 116.8 | 158 |
| ta | 1.13 | 1.57 |
| BWi, kWh/mt | 11.4 | 9.3 |
| Ai, g | | 0.02 |
* 80th percentile hardness for Axb is actually the 20th percentile in the
Axb distribution, since hardness goes up as Axb goes down.
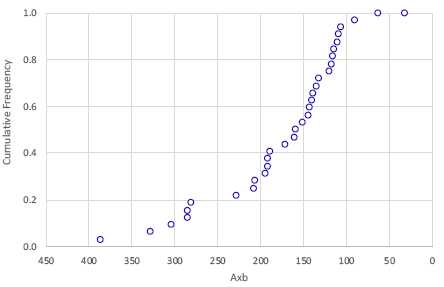
Figure 13-5: Cumulative Frequency Distribution of Axb parameters
| 70 |
| LA ARENA PROJECT |
| FORM 43-101F1 TECHNICAL REPORT |

Figure 13-6: Cumulative Frequency Distribution of Bond Ball Mill Work Indices
Tahoe has embarked on a drilling program for more metallurgical testing and to obtain variability samples that better represent the orebody. The grinding study will be updated when the complete set of variability comminution parameters becomes available.
| 13.4 | LA ARENA II FLOTATION TEST WORK |
The flotation test work program focused on optimizing flotation conditions. The objectives were to reduce mass pull to rougher concentrate, test the reagent schemes, and assess the effect of grind size on copper and gold recoveries. Locked cycle tests were performed to establish the best flowsheet and cleaner residence time. Lastly, flotation tests were performed on variability samples to determine copper recovery performance versus copper head grade.
| 13.4.1 | Slurry Density Effect in Flotation |
Rougher flotation tests were conducted 20% and 33% solids to test the effect of pulp density on mass pull and recovery. These tests show slightly better recoveries at lower mass pulls at 20% solids. However, subsequent tests, including locked cycle tests, showed better performance at 33% solids. Since the hydrodynamics of bench-top flotation machines are different from a plant-scale machine, lower grades and higher mass pulls are to be expected in the former. Without benchmarking with existing flotation plants, projections from a bench-top apparatus that involve hydrodynamic dissimilarities are not recommended.
| 13.4.2 | Effect pH in Rougher flotation |
A rougher flotation test was carried out on each of the three domain composite samples at three pH levels that is pH 9.0, 10.5 and 11.5. Test conditions used for these tests were as follows: primary grind size P80 160 µm, primary collector Aero 5100 and secondary collector was Aero 3302, rougher feed slurry density 20% w/w. Table 13-9 summarizes rougher flotation results at three pH levels for all domain composites.
Lime consumption increases considerably at high pH levels compared to low pH levels, with no improvement in recovery. On average, lime consumption increased by 2.1 kg/t to take the pH from 9.5 to 11.5. An increase in pH from 9.0 to 11.5 showed no significant gains in copper recovery for the ARC and PHC domain composites. In the case of KC domain composite, there was a 2.5 percentage point decrease in copper recovery going from pH 9.0 to pH 11.
| 71 |
| LA ARENA PROJECT |
| FORM 43-101F1 TECHNICAL REPORT |
Table 13-9: Effect of pH on Rougher Flotation
| Composite | ARC | PHC | KC |
| pH | 9.0 | 10.5 | 11.5 | 9.0 | 10.5 | 11.5 | 9.0 | 10.5 | 11.5 |
| Mass pull to Ro. con (%) | 18.3 | 16.0 | 11.6 | 19.8 | 19.2 | 15.8 | 17.2 | 14.3 | 8.6 |
| Cu recovery (%) | 88.7 | 88.1 | 88.6 | 92.8 | 93.3 | 92.4 | 91.2 | 90.3 | 88.7 |
| Cu calc. head grade (%) | 0.27 | 0.26 | 0.26 | 0.29 | 0.28 | 0.28 | 0.39 | 0.38 | 0.38 |
| Au recovery (%) | 72.8 | 74.5 | 65.9 | 76.8 | 85.6 | 74.2 | 82.5 | 73.7 | 61.8 |
| Au calc. head grade (g/t) | 0.21 | 0.20 | 0.20 | 0.17 | 0.17 | 0.16 | 0.19 | 0.21 | 0.18 |
| S recovery (%) | 95.9 | 76.7 | 64.8 | 94.9 | 97.9 | 88.8 | 97.3 | 92.9 | 49.5 |
| Fe recovery (%) | 87.7 | 72.6 | 58.1 | 92.0 | 93.1 | 83.6 | 67.4 | 63.8 | 32.3 |
| Lime consumption (kg/t) | 1.4 | 2.8 | 3.8 | 0.7 | 1.4 | 2.5 | 0.5 | 1.2 | 2.7 |
Rougher stage gold recoveries at pH 10.5 were the highest for ARC and PHC composites at 74.5% and 85.6% Au. The KC sample showed a gold recovery of 82.5% Au at a pH of 9.
The mass pull to rougher concentrate tends to increase as pH is reduced from 11.5 to 9.0. This is due to increased recoveries of pyrite minerals at lower pH levels.
Based on these results a pH of 10.5 was selected for the rougher flotation stage.
| 13.4.3 | Primary Collector Evaluation |
Rougher flotation tests were carried out on each of the three domain composite samples with six primary collectors:
| | • | Aero 238 (alkyl dithiophosphates); |
| | • | Hostaflot 3403 (30% - 40% diisobutyl dithiophosphate); |
| | • | Aero 5688 (monothiophosphates); |
| | • | Aero 8989 (50% - 70% sodium dicresyl dithiophosphate, 10% - 30% monothiophosphate); |
| | • | Aero XD-5002 (modified thionocarbamate); and |
| | • | Aero 5100/3302 (modified thionocarbamate/xanthate ester), which was used as the base line; |
| | • | Aerophine 3418A (sodium diisobutyldithiophosphinate, 50% aqueous solution) |
Rougher flotation feed, ground to 80% finer than 160 µm, conditioned with the selected collector and floated for 15 minutes at a pH of 10.5, with MIBC as a frothing agent. Table 13-10 summarizes flotation results for primary collector tests for ARC samples.
Table 13-10: Summary of Primary Collector Tests Results for ARC samples
Test | Primary Collector | Secondary Collector | Calculated heads | Recovery, % | Gross Value* |
| Type | Dosage, g/t | Type | Dosage, g/t | % Cu | g/t Au | Cu | Au | $M/day |
| KM3991-36 | A238 | 30 | - | - | 0.27 | 0.20 | 82.9 | 51.4 | 11.91 |
| KM3991-37 | 3403 | 30 | - | - | 0.30 | 0.18 | 90.8 | 76.7 | 15.84 |
| KM3991-38 | A5688 | 30 | - | - | 0.27 | 0.17 | 77.5 | 44.4 | 8.99 |
| KM3991-39 | A8989 | 30 | - | - | 0.27 | 0.17 | 85.6 | 63.3 | 12.45 |
| KM3991-40 | XD-5002 | 30 | - | - | 0.28 | 0.17 | 90.0 | 80.5 | 15.60 |
| KM3991-67 | A5100 | 40 | A3302 | 35 | 0.29 | 0.24 | 90.1 | 82.2 | 21.94 |
| KM3991-73 | A5100 | 40 | A3302 | 35 | 0.26 | 0.16 | 89.7 | 84.1 | 15.26 |
| KM3991-74 | A5688 | 50 | - | - | 0.27 | 0.17 | 79.2 | 56.5 | 11.15 |
| KM3991-75 | A238 | 50 | - | - | 0.27 | 0.17 | 85.6 | 84.8 | 16.25 |
| KM3991-77 | 3403 | 25 | A238 | 25 | 0.28 | 0.18 | 85.9 | 76.8 | 15.68 |
| KM3991-78 | A5100 | 24 | A3302 | 35 | 0.28 | 0.19 | 87.7 | 73.9 | 15.94 |
| KM3991-76 | A238 | 30 | - | - | 0.28 | 0.25 | 85.4 | 54.3 | 15.42 |
*Gross value of copper and gold recovered in a day given the head grades and recoveries at $1300/oz Au and $3.08/lb Cu.
| 72 |
| LA ARENA PROJECT |
| FORM 43-101F1 TECHNICAL REPORT |
Ausenco recommended Hostaflot 3403 as the primary collector due to “good copper recovery and better copper selectivity against pyrite.” M3’s review of the same data in Table 13-5 narrows the field to four tests, namely KM3391-40, KM3391-67, KM3391-73 and KM3391-75 (highlighted in light blue and in bold text), where both copper and gold recoveries were higher than 80% for each of the tests. The results indicate that the best collector is a modified thionocarbamate (5100 or 5002), particularly if paired with the xanthate ester (3302).
The 5100/3302 combination was one of the better schemes in the previous ALS study (KM3866). Tests KM3991-67 and KM3991-73 exhibited the best combination of high copper and high gold recovery, and high gross values for recovered metals. The better pyrite rejection by Hostaflot 3403 may be at the expense of gold that could be associated with some of the pyrite. The optimum target for this orebody is to maximize both copper and gold recovery, and only attaining concentrate copper grades to meet smelter requirements, which probably makes the 5100/3302 the best option for flotation. The effects of increased shipping cost and possible decrease in smelter payables must be considered in this grade-recovery trade-off.
Another good option appears to be A238. While it did poorly in recovering gold in Test KM3391-36, its performance improved with by increasing the dosage from 30 to 50 g/t in Tests KM3391-75, where recoveries improved, particularly for gold.
Figure 13-7 and Figure 13-8 plot the selectivity curves against pyrite and non-sulfide gangue (NSG). The plot shows that A238 shows the best pyrite rejection, but did not attain very good recoveries at 30 g/t dosage. Unfortunately, the other test at 50 g/t, which attained better copper and gold recoveries was not included in this plot. NSG rejection by 3403 and 5100/3302 are similar, with 5002 performing slightly poorer compared to the other two.
| 73 |
| LA ARENA PROJECT |
| FORM 43-101F1 TECHNICAL REPORT |
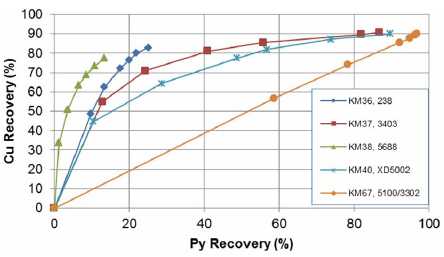
Figure 13-7: Selectivity curve for copper against pyrite for ARC samples
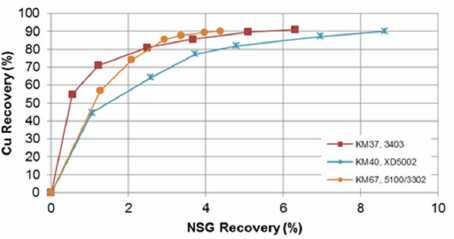
Figure 13-8: Selectivity curve for copper minerals against non-sulfide gangue
| 13.4.4 | Grind Size Sensitivity Evaluation |
The primary grind evaluation program included P80 values of 180 µm, 150 µm, 125 µm, and 75 µm. The ground material was subjected to 15 minutes of laboratory batch flotation with lime added to the milling and flotation steps to increase the slurry pH to 10.5. MIBC was used as the frother, together with 30 g/t Hostafloat 3403 collector. Rougher feed was diluted to 20% solids w/w for all rougher flotation tests.
Figure 13-9 illustrates the impact of primary grind size on copper recovery for each domain composite. Grind size shown in these plots represents the actual grind size achieved on each test.
| 74 |
| LA ARENA PROJECT |
| FORM 43-101F1 TECHNICAL REPORT |
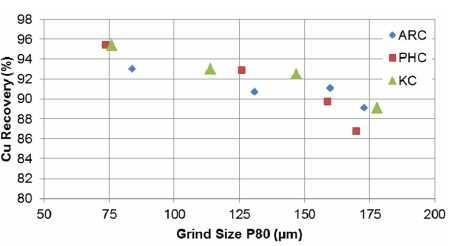
Figure 13-9: Copper Recovery Versus Grind Size
Figure 13-9 shows the best recoveries are attained at 75 microns, with essentially a flat response from 80 to 130 microns at around 92 to 93%. The recovery then decreases down to about 88% at 175 microns. On the other hand, gold recovery shows no correlation with grind size, as shown in Figure 13-10.
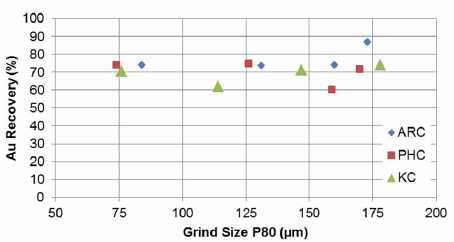
Figure 13-10: Gold Recovery Versus Grind Size
Based on these results, the optimum grind size for these samples is 100 to 125 microns.
| 13.4.5 | Comparison of Test Program Flow Sheets |
Rougher flotation test conditions using procedures developed for test programs KM3526, KM3866 and KM3991 were carried out on ARC, PHC and KC samples. The results are shown in Table 13-11.
| 75 |
| LA ARENA PROJECT |
| FORM 43-101F1 TECHNICAL REPORT |
Table 13-11: Results of Rougher Flotation Tests using KM3526, KM3866 and KM3991 Procedures
| Composite | ARC | PHC | KC |
| Procedure | KM3526 | KM3866 | KM3991 | KM3526 | KM3866 | KM3991 | KM3526 | KM3866 | KM3991 |
| P80 (µm) | 75 | 150 | 106 | 75 | 150 | 106 | 71 | 147 | 114 |
| Primary Collector | 3418A | 5100 | 3403 | 3418A | 5100 | 3403 | 3418A | 5100 | 3403 |
| Secondary Collector | | 3302 | | | 3302 | | | 3302 | |
| pH | 10.5 | 11.5 | 10.5 | 10.5 | 11.5 | 10.5 | 10.8 | 11.5 | 10.5 |
| % Solids | 33 | 33 | 20 | 33 | 33 | 20 | 33 | 33 | 20 |
| Mass Pull, % | 15.5 | 20.2 | 13.5 | 17.5 | 17.8 | 13.1 | 12 | 14.7 | 10.6 |
| Cu Recovery, % | 90.1 | 85.4 | 91.8 | 94.5 | 91.5 | 93.4 | 95.7 | 91.4 | 91.9 |
| Cu Head, calc, % | 0.26 | 0.28 | 0.27 | 0.27 | 0.28 | 0.29 | 0.39 | 0.41 | 0.42 |
| Au Recovery, % | 61.1 | 63 | 71.1 | 70.3 | 81.3 | 75.1 | 67.8 | 89.1 | 81.1 |
| Au Head, calc, g/t | 0.2 | 0.19 | 0.18 | 0.17 | 0.22 | 0.14 | 0.22 | 0.16 | 0.19 |
| Lime Dose, kg/t | 2.4 | 3.2 | 2.1 | 1.5 | 2.5 | 1.1 | 1.5 | 2 | 1.1 |
Again, using the criteria of 80% or higher recoveries for both copper and gold, the best conditions were those used in KM3866 for PHC and KC composites (bold and highlighted in blue) where the reagent combination of 5100/3302 and 33% solids were used. KM3991 also passed the criteria for the KC composite but performed worse than KM3866. This is additional proof that the 5100/3302 combination, even at the coarser grind used, is better than 3403. The results also show that the lower pulp density used in KM3991 does not necessarily attain better recoveries.
None of the ARC composite tests passed the 80% recovery criteria, but KM3526 and KM3991 behaved similarly. However, previous tests results on ARC composites reported in Table 13-10 show the best results were obtained with the 5100/3302 reagent combination. These tests were done at pH 10.5, which may explain the better flotation performance.
While Hostafloat 3403 is the collector used for the bulk of work in KM3991 and part of the reagent scheme for operating costs (Section 17), future studies should revisit the use of A238 at higher addition rates, 3418A at a lower pH, and the 5100/3302 combination.
Lime consumption was lower by 1.1 kg/t for KM3991 compared to KM3866 for ARC and PHC samples due to lower pH used, 10.5 versus 11.5.
Figure 13-11 illustrates the flow sheet used for cleaner tests. All cleaner flotation tests were carried out according to this flow sheet except tests 129 and 133 where regrinding was moved to the second cleaner feed. Flotation test conditions for all tests are as follows: rougher stage pH 10.5, cleaner stage pH 12.0, primary collector Hostaflot 3403, primary grind size target 106 µm and regrind size target 25 µm.
| 76 |
| LA ARENA PROJECT |
| FORM 43-101F1 TECHNICAL REPORT |

Figure 13-11: KM3991 Cleaner Flotation Flow Sheet
The results of these tests are shown in Table 13-12 and Table 13-13. Care should be taken when interpreting the results because the tests had an open flowsheet (no cleaner tails recycle), which therefore underestimated the flowsheet recoveries.
Table 13-12 shows the effect of dilution in the rougher feed and addition of a secondary collector (A3418A) on cleaning tests for ARC and PHC samples. The results show that mass pull to rougher concentrate increases at a higher slurry density of 33% solids w/w for all domain composites. However, copper and gold recoveries were generally better at the higher rougher slurry densities, for both rougher and overall (final) recoveries. Copper concentrate grades were above the 22% Cu minimum target, except for Test 104.
The addition of Aerophine 3418A to improve gold recovery yielded mixed results, improving gold recovery for the ARC samples but not for the PHC samples.
Table 13-12: Effect of Aerophine 3418A and rougher feed dilution on cleaner tests
| Test | 101 | 103 | 102 | 104 | 105 | 107 | 106 | 108 |
| Composite | ARC | ARC | ARC | ARC | PHC | PHC | PHC | PHC |
| Secondary Cleaner Collector | -- | -- | 3418A | 3418A | -- | -- | 3418A | 3418A |
| Ro. Solids Concentration (%) | 20 | 33 | 20 | 33 | 20 | 33 | 20 | 33 |
| Mass pull to Ro. con (%) | 16.1 | 33.4 | 17.6 | 32.8 | 17.5 | 35.8 | 14.8 | 19.0 |
| Cu Ro. recovery (%) | 91.5 | 94.0 | 91.0 | 93.1 | 94.6 | 96.2 | 94.6 | 95.8 |
| Cu final recovery (%) | 62.0 | 77.0 | 81.2 | 79.1 | 76.5 | 80.5 | 66.6 | 82.5 |
| Cu calc. head grade (%) | 0.28 | 0.28 | 0.28 | 0.27 | 0.30 | 0.30 | 0.30 | 0.30 |
| Cu concentrate grade (%) | 29.7 | 25.3 | 25.0 | 17.4 | 27.2 | 24.4 | 28.4 | 23.1 |
| Au Ro. recovery (%) | 91.5 | 85.6 | 77.7 | 85.2 | 82.6 | 86.3 | 82.2 | 86.9 |
| Au final recovery (%) | 28.1 | 27.5 | 35.7 | 33.3 | 36.4 | 36.9 | 31.1 | 35.0 |
| Au calc. head grade (g/t) | 0.19 | 0.18 | 0.18 | 0.18 | 0.14 | 0.14 | 0.14 | 0.15 |
| Au concentrate grade (g/t) | 9.21 | 5.98 | 7.14 | 4.88 | 6.02 | 5.22 | 6.34 | 5.02 |
| 77 |
| LA ARENA PROJECT |
| FORM 43-101F1 TECHNICAL REPORT |
Table 13-13 summarizes comparative cleaner flotation test results at different rougher feed densities, cleaner feed densities and which cleaner-stage feed was reground. Test conditions for these tests were: rougher pH 10.5, primary grind size target 106 µm, primary collector Hostaflot 3403, cleaner pH 11.5, regrind size target 25 µm, and secondary collector Aerophine 3418A.
The results illustrate once again that better final recoveries for copper and gold are obtained at the higher rougher slurry density of 33%.
A comparison of tests 118 and 119 with tests 129 and 133 illustrates that copper recoveries are higher for the tests when the first cleaner feed is reground compared to tests where the second cleaner feed is reground. Gold recoveries remain insensitive to regrinding the first or second cleaner feed.
Table 13-13: Effect of Slurry Density on Cleaner Tests and Regrind of 2nd Cleaner Feed (Tests 129 and 133)
| Test | 128 | 118 | 129 | 132 | 119 | 133 |
| Composite | ARC | ARC | ARC | PHC | PHC | PHC |
| Ro. Solids Concentration (%) | 20 | 33 | 33 | 20 | 33 | 33 |
| Cleaner 1 Density (%) | 8 | 16 | 33 | 8 | 16 | 33 |
| Cleaner Feed - reground | 1st | 1st | 2nd | 1st | 1st | 2nd |
| Mass pull to Ro. con (%) | 16.5 | 32.7 | 34.6 | 14.0 | 31.8 | 35.2 |
| Cu final recovery (%) | 68.2 | 84.3 | 78.2 | 64.1 | 82.7 | 61.6 |
| Cu calc. head grade (%) | 0.29 | 0.29 | 0.28 | 0.30 | 0.29 | 0.34 |
| Cu concentrate grade (%) | 28.9 | 24.9 | 26.5 | 29.6 | 26.5 | 27.9 |
| Au final recovery (%) | 26.0 | 33.3 | 33.5 | 28.9 | 31.6 | 32.8 |
| Au calc. head grade (g/t) | 0.19 | 0.21 | 0.18 | 0.14 | 0.17 | 0.14 |
| Au concentrate grade (g/t) | 7.39 | 6.96 | 7.37 | 6.48 | 5.87 | 5.93 |
Figure 13-12 displays cleaner test results at various pH levels for ARC and PHC samples. This figure shows that the overall copper recovery is 91% Cu for a final concentrate grade target of 22% Cu, with two cleaning stages. Three stages of cleaning results in higher concentrate grades for a given recovery than with two stages, but current indications are that the maximum achievable recovery is not likely to be as high as with two stages.

Figure 13-12: Copper grade-recovery relationship between two and three cleaner stages
| 78 |
| LA ARENA PROJECT |
| FORM 43-101F1 TECHNICAL REPORT |
Figure 13-13 shows the relationship between gold recovery and gold grade for the ARC and PHC samples. These results show that in addition of better copper recovery, having only two stages of cleaning can potentially improve gold recovery as well.
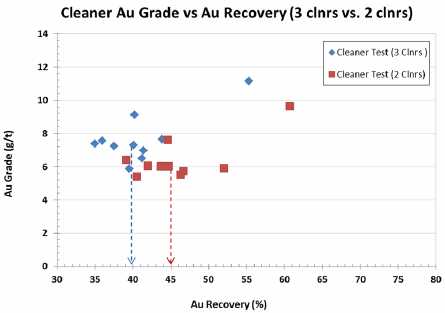
Figure 13-13: Gold Grade-Recovery Relationship Between Two and Three Cleaner Stages
Cleaner flotation tests were carried out on each of the fifteen variability composite samples at the optimum conditions of; grind size P80 of 106 µm, pH 10.5, Hostaflot 3403 with 42 g/t as primary collector and Aerophine 3418A with 3 g/t as secondary collector. Table 13-14 summarizes flotation results for each of the variability composites.
Table 13-14: Cleaner flotation tests results on variability composites
| Comp. | Alteration | Head (%) | Copper | Conc. (%) | Head (g/t) | Gold | Conc. (g/t) |
| Recovery (%) | Recovery (%) |
| VC-01 | AR | 0.29 | 83.3 | 30.3 | 0.17 | 25.3 | 5.60 |
| VC-02 | 0.12 | 68.6 | 29.1 | 0.11 | 24.0 | 10.0 |
| VC-03 | 0.65 | 88.1 | 35.3 | 0.55 | 56.2 | 19.1 |
| VC-04 | 0.47 | 88.3 | 29.6 | 0.36 | 26.7 | 6.84 |
| VC-12 | 0.09 | 69.4 | 16.3 | 0.10 | 26.9 | 7.50 |
| VC-14 | 0.68 | 88.5 | 30.0 | 0.51 | 52.9 | 13.6 |
| VC-05 | PH | 0.31 | 72.0 | 30.1 | 0.15 | 37.0 | 7.59 |
| VC-06 | 0.37 | 79.0 | 24.5 | 0.35 | 36.5 | 10.8 |
| VC-07 | 0.80 | 89.9 | 28.9 | 0.63 | 30.7 | 7.78 |
| VC-08 | 0.71 | 93.2 | 30.9 | 0.52 | 45.6 | 11.1 |
| VC-09 | 0.31 | 79.2 | 24.4 | 0.21 | 33.3 | 6.99 |
| VC-10 | 0.50 | 80.7 | 30.5 | 0.38 | 54.6 | 15.7 |
| VC-13 | 0.27 | 67.2 | 31.3 | 0.11 | 19.2 | 3.55 |
| VC-11 | K | 0.39 | 85.6 | 31.0 | 0.29 | 47.9 | 13.2 |
| VC-15 | 0.37 | 79.7 | 30.6 | 0.20 | 44.2 | 9.18 |
| 79 |
| LA ARENA PROJECT |
| FORM 43-101F1 TECHNICAL REPORT |
Figure 13-14 shows copper recovery against copper head grades for all variability tests. This figure shows a consistent trend of increased copper recovery with copper head grade for all ore types. A trend line has been included for the phyllic (PH) and argillic (AR) alterations, as well as cleaner test results from the KM3526 test program. For the potassic alteration (K) no trend was included due to limited data available, but they seem to fall along the AR trend.
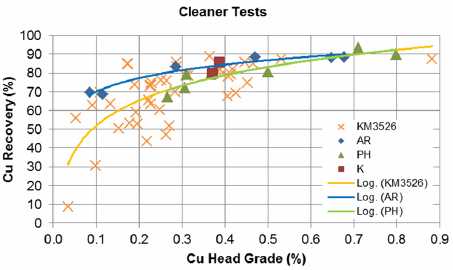
Figure 13-14: Comparative copper recovery results in variability composites
Figure 13-15 shows no clear relationship or correlation between gold recovery and gold head grade for the three composites. Similar results were observed for the previous test program KM3526.

Figure 13-15: Gold recovery results vs. Gold head grade for all variability composites
| 13.4.8 | Locked Cycle Tests and Recovery Models |
Locked cycle flotation tests using optimized conditions were carried out on each of the alteration type composites. Each locked cycle test consisted of five cycles. Two flow sheets (Flowsheets A and B) were used for the locked cycle tests as displayed in Figure 13-16 and Figure 13-17.
| 80 |
| LA ARENA PROJECT |
| FORM 43-101F1 TECHNICAL REPORT |
Flowsheet A is the ALS standard flow sheet for locked cycle tests. In this flow sheet Cleaner 2 tailing and Cleaner 3 tailing are both recycled to the Cleaner 1 feed. Flowsheet B is the Ausenco flowsheet for locked cycle tests. In this flowsheet, Cleaner 2 tailing is recycled to Cleaner 1 feed, while Cleaner 3 tailing is recycled to the Cleaner 2 feed. Flowsheet B replicates the cleaner flotation circuit design used in La Arena process design.
Flowsheet A was used for locked cycle tests on ARC, PHC and KC samples. Flowsheet B was used only for PHC and KC samples. There was insufficient sample for the ARC to conduct locked cycle tests using Flowsheet B.
Tests results demonstrate that there are no significant differences in performance between the Flowsheets (i.e. PHC 87.5 – 87.9% Cu recovery KC 89.2 – 89.9% Cu recovery).
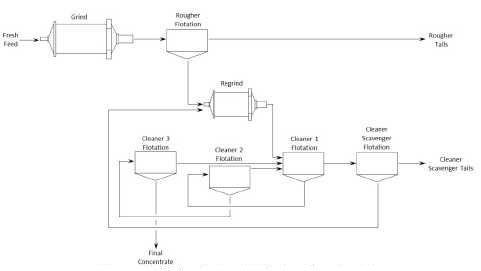
Figure 13-16: Locked Cycle Tests – Flowsheet A
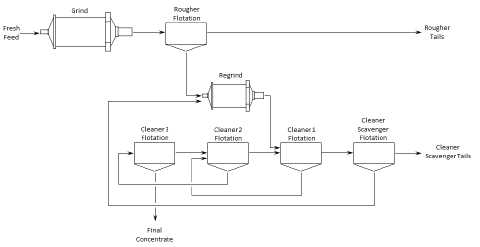
Figure 13-17: Locked Cycle Tests - Flowsheet B
Figure 13-18 and Figure 13-19 illustrate locked cycle test results for all three composites as well as KM3526 results. A central outcome from these tests is that copper metallurgical performance achieved for the KM3991 test work program is similar to that from corresponding tests conducted in the KM3526 test work program. The current copper recovery model represents previous and current test work results. The copper recovery model is described as follows:
| 81 |
| LA ARENA PROJECT |
| FORM 43-101F1 TECHNICAL REPORT |
| | • | If the copper head grade is less than 0.08%, then copper recovery is 0%. |
| | • | If the copper head grade is greater than 0.45%, then copper recovery is 92.9%. |
| • | If the copper head grade is between 0.08% and 0.45%, then copper recovery is 9.4547 x ln (% copper head grade) plus 99.79%. |
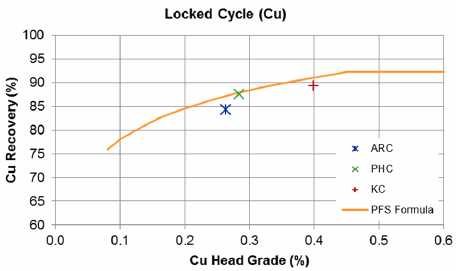
Figure 13-18: Locked Cycle Test Cu Head Grade vs. Cu Recovery
Figure 13-19 plots gold recoveries against gold head grades for all three composites. The potassic alteration achieves better gold recoveries compared to the ARC and PHC composites. Gold recoveries for ARC and PHC samples are similar to those obtained in the KM3526 testwork program.

Figure 13-19: Locked Cycle Test Au Head Grade vs. Au Recovery
The main differences between KM3991 and KM3526 testwork programs is that KM3991 used a simplified flowsheet (no rougher cleaner stage), feed at 20%, a coarser grind size (106 vs. 75 µm), lower rougher and cleaner pH (10.5), less expensive reagents in the rougher circuit (Hostafloat 3403 vs. Aerophine 3418A), and no cyanide additions.
| 82 |
| LA ARENA PROJECT |
| FORM 43-101F1 TECHNICAL REPORT |
Figure 13-20 illustrates variability test results for argillic and phyllic rock types. The gold recovery model has also been included in the figure and is described as follows:
| | • | If the gold head grade is less than 0.10 g/t, then gold recovery is 0%. |
| | • | If the gold head grade is greater than 0.55 g/t, then gold recovery is 45.5%. |
| • | If the gold head grade is between 0.10 g/t and 0.55 g/t, then gold recovery is 12.862 x ln (g/t gold head grade) plus 53.205%. |
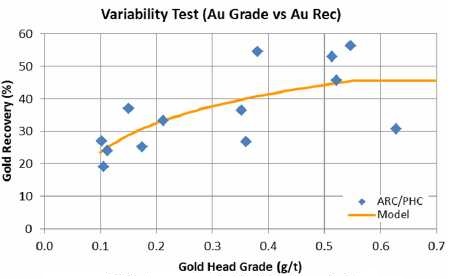
Figure 13-20: Variability Test Au Head Grade vs. Au Recovery
Table 13-15 shows copper concentrate chemical assays from locked cycle tests for each metallurgical composite.
Table 13-15: Copper Concentrate Chemical Assay – main pay and penalty elements
| Element | ARC | PHC | KC |
| Aluminum (%) | 0.30 | 0.36 | 0.37 |
| Antimony (%) | 0.044 | 0.030 | 0.017 |
| Arsenic (%) | 0.10 | 0.15 | 0.011 |
| Bismuth (g/t) | 37 | 34 | 18 |
| Chlorine (g/t) | 130 | <50 | <50 |
| Cobalt (g/t) | 24 | 46 | 62 |
| Copper (%) | 28.2 | 28.6 | 27.0 |
| Fluorine (g/t) | 170 | 170 | 120 |
| Gold (g/t) | 8.26 | 7.66 | 8.83 |
| Lead (g/t) | 1748 | 336 | 296 |
| Magnesium (%) | 0.04 | <0.01 | 0.05 |
| Mercury (g/t) | 5 | 12 | 1 |
| Molybdenum (%) | 0.012 | 0.015 | 0.42 |
| Nickel (g/t) | 58 | 62 | 58 |
| Silver (%) | 26 | 18 | 38 |
| Zinc (%) | 2.17 | 0.72 | 0.14 |
| 13.4.9 | Diagnostic Leach on Flotation Tailings |
Pyrite flotation tests were carried out on rougher flotation tailings stream from locked cycle tests for all three composites. The objective of these tests was to determine the proportion of gold associated with pyrite. The pyrite flotation concentrate and pyrite flotation tailing were analyzed by diagnostic leach to identify cyanide soluble gold, gold occluded in carbonates, gold occluded in sulfides and gold occluded in gangue. Similarly, the cleaner scavenger tailings were analyzed by diagnostic leach.
| 83 |
| LA ARENA PROJECT |
| FORM 43-101F1 TECHNICAL REPORT |
Figure 13-21, Figure 13-22, and Figure 13-23 display test results for each of these test products. Gold grades shown in these figures are based on feed grades to the flotation circuit.
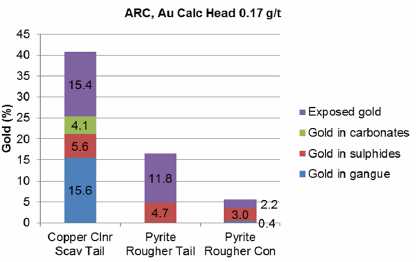
Figure 13-21: Diagnostic leach tests carried out on locked cycle flotation tailings for ARC sample
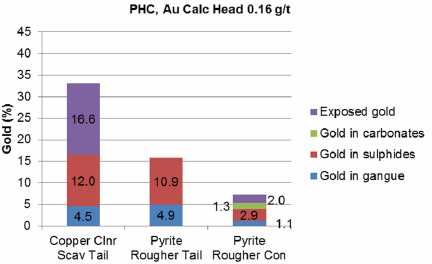
Figure 13-22: Diagnostic leach carried out on locked cycle flotation tailings for PHC sample
| 84 |
| LA ARENA PROJECT |
| FORM 43-101F1 TECHNICAL REPORT |

Figure 13-23: Diagnostic leach carried out on locked cycle flotation tailings for KC sample
Based on these results most of the gold losses occur in the cleaner scavenger tailings for the ARC and PHC composites while gold losses for the KC composite occur primarily in the pyrite rougher tailings. There is potential to recover exposed gold and occluded in sulfur minerals for these composites. Future plant investigations to reduce gold losses may include increasing regrind size (i.e. >25 µm), reducing pH (i.e. <10.5) in the cleaner circuit, using gold selective collectors or gravity gold separation on the cleaner scavenger tailings stream.
| 13.4.10 | Gravity Concentration Test |
Gravity gold was recovered via centrifugal gravity tests and panning of the concentrate carried out on each of the alteration type composites. Table 13-16 summarizes gravity gold recovery tests for ARC, PHC and KC samples.
Table 13-16: Knelson Gravity Test Results
| Composite | ARC | PHC | KC |
| Tests | KM3991-113 | KM3991-114 | KM3991-115 |
| Target grind size P80 (µm) | 106 | 106 | 106 |
| Au Assayed head grade (g/t) | 0.18 | 0.15 | 0.18 |
| Au Calculated head grade (g/t) | 0.20 | 0.29 | 0.20 |
| Au Knelson Recovery (%) | 6.4 | 41.2 | 15.4 |
| Au Grav. Con. Grade (g/t) | 1.14 | 10.62 | 2.83 |
| Au Pan Recovery (%) | 2.4 | 34.8 | 7.6 |
Gold head grades for the composite samples were in the range of 0.15 g/t to 0.18 g/t. Table 13-16 shows that PHC gave a higher calculated head grade, around double of the assayed head grade (i.e. 0.15 vs. 0.29 g/t). This was a result of the high Knelson gravity gold recovery (41.2%) for the PHC sample. A nugget effect may have been the reason for the calculated high gold grade in the concentrate and therefore high gravity gold recovery. Knelson gravity gold recovery achieved for the ARC and KC samples was 6% and 15% respectively.
Overall gravity gold recoveries for the ARC and KC samples are low, at 2% and 8% respectively from feed. A further recovery discount is applied to the laboratory data to estimate the final gravity recovery in the plant.
| 85 |
| LA ARENA PROJECT |
| FORM 43-101F1 TECHNICAL REPORT |
These results indicate negligible or very limited free gold in the feed for these samples and therefore a gravity gold circuit may not be justified for La Arena. Future plant investigations may include further gravity gold test work to determine gold recovery improvements via gravity gold separation. Streams that may be targeted are cleaner scavenger tailings and primary cyclone underflow.
| 13.5 | LA ARENA II SUPPLEMENTARY TESTS |
| 13.5.1 | Flocculant Screening Tests |
Flocculant screening tests were carried out with three flocculant reagents: A130, C496 and Magnafloc 333, at pH 11. All flocculants performed similarly.
Additional flocculant screening tests conducted during dynamic thickening tests showed that flocculant MF-338 produced improved performance compared to MF-333.
| 13.5.2 | Dynamic Thickening Test |
Thickening test work was conducted by Outotec at their laboratories in Burlington, Canada. Static and dynamic testing was conducted to evaluate the effect that flocculant dosage, feed density and solids loading rate have on the ability to meet the target parameters. The targets for the sample were to achieve an underflow density of 55% w/w solids and <250 ppm overflow clarity.
Flocculant screening tests were carried out with four flocculant reagents: MF-333, MF-10, MF-338 and Magnafloc 155. All tests were carried out on flotation tailings from each domain composite (ARC-DW, PHC-DW and KC-DW). The flotation tailings sample for each composite was generated from locked cycle tests conducted at ALS.
The average specific gravity of solids was 2.88 t/m3. The particle size distribution for tests 161 (PHC), 162 (KC) and 163 (ARC), and 166 (ARC repeat) are 110, 142, 58 and 63 microns. Test 166 is a repeat of Test 163 at a coarser particle size distribution.
Test 166 was repeated by ALS to produce a sample with a particle size of 106 microns. However, this sample did not produce a coarser particle size. Test results for this composite sample were not the basis for selection of the solids loading rate for design.
Flocculant screening results indicates that flocculant MF-338 provides the best performance with clear overflow for all composites. This flocculant was used in dynamic thickening test work for all composites. All thickening tests were conducted at a pH of 10.5.
The effect of flocculant dose was tested for all composite samples. Three tests were conducted to determine optimum flocculant (MF338) dose for each composite sample. The optimum feed dilution for PHC, KC and ARC are 14%, 16% and 13% solids w/w.
Table 13-17 summarizes optimum flocculant concentrations for all samples at specified solids loading.
| 86 |
| LA ARENA PROJECT |
| FORM 43-101F1 TECHNICAL REPORT |
Table 13-17: Optimum Flocculant Concentration for all Composite Samples
| Sample Test | Alteration Type | Flocculant
Concentration
(g/t) | Solids Loading
Rate (t/m2/h) | Underflow
Density (%w/w
solids) | OF Clarity TSS
(ppm) |
| 161 | PHC | 15 | 0.50 | 61 | 10 |
| 162 | KC | 5 | 0.65 | 58 | 40 |
| 166 | ARC | 20 | 0.50 | 56 | 30 |
The effect of solids loading rates was tested for all composite samples. Three tests were conducted to determine optimal solids loading for each composite sample.
Table 13-18 summarizes optimum solids loading for all samples.
Table 13-18: Optimum Solids Loading for all Composite Samples
Sample
Test | Alteration
Type | Flocculant
Concentration
(g/t) | Solids Loading
Rate (t/m2/h) | Underflow
Density (%w/w
solids) | OF Clarity
TSS (ppm) |
| 161 | PHC | 15 | 0.89 | 53 | 32 |
| 162 | KC | 5 | 1.00 | 53 | 320 |
| 166 | ARC | 20 | 0.99 | 53 | 40 |
The design solids loading selected for sizing of the tailings thickener is 0.89 t/h/m2 (i.e. phyllic sample solids loading). This selection assumes that on occasions feed to the plant would be dominantly phyllic ore.
Outotec's experience with test work and full-scale operation of thickeners allow for a 2 to 3% increase in thickener underflow density when scaling up laboratory test work to a full-size thickener. Therefore, the expected solids density from the tailings thickener underflow is approximately 55% solids w/w.
| 13.5.3 | Other Factors Tested |
Rheology tests were carried out over a wide range of slurry densities and at two levels of pH: 7 and 10.5.
Rheology test results at different pH levels show that the viscosity for the ARC samples increases at the higher pH. These results should be taken in consideration when designing pumping system for the tailings stream and determining appropriate solids concentration for pumping.
The effect of aging was evaluated through laboratory batch rougher flotation tests carried out on ARC and PHC samples. The samples used for these tests include:
| | • | Aged samples for 36 days (exposed to environment) – Tests 120 and 121; |
| • | Fresh samples (sourced from storage, i.e. refrigerated and maintained in an inert environment) – base line tests 122 and 123. |
| 87 |
| LA ARENA PROJECT |
| FORM 43-101F1 TECHNICAL REPORT |
The flotation tests were conducted at a grind size P80 of 106 µm, MIBC was used as frother, together with 30 g/t Hostafloat 3403 collector, rougher feed at 20% w/w solids and pH of 10.5.
The differences in copper recoveries, mass pull to concentrate and lime consumptions are insignificant between aged and fresh samples.
| 13.5.3.3 | Dispersant Effect on Flotation |
Comparative rougher flotation tests with different dispersant reagents (sodium silicate, Calgon, CMC and sodium cyanide) were carried out on ARC samples at a grind size of P80 160 µm and at 33% solids pulp density. Aero 5100 was used as primary collector and Aero 3302 as secondary collector (i.e. the test work conditions from Stage 5 Testing program - KM3866 Tests 11).
As there was no significant difference in mass pull rate between the dispersants and the base line tests, the dispersant test series was discontinued.
This section of the NI 43-101 report is a revised version of metallurgy section of the unpublished feasibility study report written by Ausenco for Rio Alto in April 2015. The report has been shortened for the purpose of a preliminary economic assessment, with new interpretation of some flotation data and added details in the comminution discussion. The metallurgical evaluation was performed on a different orebody, from drill hole samples that are shallow relative to the extent of the current reserves. However, the findings of the testing programs are applicable to current study at a preliminary economic assessment level.
Tahoe has embarked in a diamond drilling program to obtain metallurgical samples for testing the porphyry sulfide deposit for the next level of study. The goal is to obtain samples that will represent the entire orebody, with deeper drill holes, and provide information on the variability of metallurgical responses within the pit shell.
| 13.6 | FUTURE METALLURGICAL INVESTIGATION |
The available metallurgical information on the La Arena II orebody is quite detailed and contains enough information to design a process plant at a PEA level. Despite the level of detail, the samples that were used for the ALS tests came from shallow drill holes that represent a different orebody and no longer represent the extent of the current reserve pit shell. This is true particularly for the grinding and flotation variability samples.
The new diamond drilling program obtains samples of ore deeper in the orebody. They will provide composites that will better represent the orebody in space, using updated classifications for lithology and alterations. Variability samples from deeper in the orebody will augment the shallower ones from the previous studies, and fill the requirements of the next level of study.
With the new composites, the ore will be tested again to optimize flotation conditions, including flowsheet, reagent scheme, fineness of grind and regrind, pH, and residence times. The optimized conditions will be applied to variability samples to determine variability due to factors like ore sample location, lithology, alteration, and head grade. Because of the amount of pyrite present in the ore, its rejection during copper flotation will be investigated more closely, to determine the best conditions for gold recovery while meeting the smelter requirement for copper assays in the concentrate. Finally, pyrite flotation will be studied in more detail for ARD reduction in mill tailing.
| 88 |
| LA ARENA PROJECT |
| FORM 43-101F1 TECHNICAL REPORT |
| 14 | MINERAL RESOURCE ESTIMATES |
| 14.1 | MINERAL RESOURCE CLASSIFICATION DEFINITIONS |
The Company has classified the Mineral Resources for the La Arena Mine and for the La Arena II Project in order of increasing confidence into Inferred, Indicated and Measured categories as defined by CIM Definition Standards - For Mineral Resources and Mineral Reserves (2014), in compliance with NI 43-101. An Inferred Mineral Resource has a lower level of confidence than that applied to an Indicated Mineral Resource. An Indicated Mineral Resource has a higher level of confidence than an Inferred Mineral Resource but has a lower level of confidence than a Measured Mineral Resource.
Mineral Resources
A Mineral Resource is a concentration or occurrence of solid material of economic interest in or on the Earth’s crust in such form, grade or quality and quantity that there are reasonable prospects for eventual economic extraction. The location, quantity, grade or quality, continuity and other geological characteristics of a Mineral Resource are known, estimated or interpreted from specific geological evidence and knowledge, including sampling.
Inferred Mineral Resource
An Inferred Mineral Resource is that part of a Mineral Resource for which quantity and grade or quality are estimated on the basis of limited geological evidence and sampling. Geological evidence is sufficient to imply but not verify geological and grade or quality continuity. An Inferred Mineral Resource has a lower level of confidence than that applying to an Indicated Mineral Resource and must not be converted to a Mineral Reserve. It is reasonably expected that the majority of Inferred Mineral Resources could be upgraded to Indicated Mineral Resources with continued exploration.
Indicated Mineral Resource
An Indicated Mineral Resource is that part of a Mineral Resource for which quantity, grade or quality, densities, shape and physical characteristics are estimated with sufficient confidence to allow the application of mining, processing, metallurgical, infrastructure, economic, marketing, legal, environment, social, government and other relevant factors (Modifying Factors) in sufficient detail to support mine planning and evaluation of the economic viability of the deposit. Geological evidence is derived from adequately detailed and reliable exploration, sampling and testing and is sufficient to assume geological and grade or quality continuity between points of observation. An Indicated Mineral Resource has a lower level of confidence than that applying to a Measured Mineral Resource and may only be converted to a Probable Mineral Reserve.
Measured Mineral Resource
A Measured Mineral Resource is that part of a Mineral Resource for which quantity, grade or quality, densities, shape, and physical characteristics are estimated with confidence sufficient to allow the application of Modifying Factors to support detailed mine planning and final evaluation of the economic viability of the deposit. Geological evidence is derived from detailed and reliable exploration, sampling and testing and is sufficient to confirm geological and grade or quality continuity between points of observation. A Measured Mineral Resource has a higher level of confidence than that applying to either an Indicated Mineral Resource or an Inferred Mineral Resource. It may be converted to a Proven Mineral Reserve or to a Probable Mineral Reserve.
| 89 |
| LA ARENA PROJECT |
| FORM 43-101F1 TECHNICAL REPORT |
| 14.2 | DATA USED FOR MINERAL RESOURCE ESTIMATION |
Mineral Resources reported for the La Arena Mine and La Arena II Project are based on the project drill database consisting of 1,851 drill holes totaling 313,967 meters. These drilling totals do not include exploration holes drilled elsewhere within the overall La Arena property boundary. Approximately 60% of the drill holes and half of the meters drilled were by reverse-circulation (RC) methods, with the database containing information from 1,314 RC drill holes totaling 159,550 meters; the remaining 40% of the holes were drilled using diamond drilling (core) methods, with the database containing information from 537 core holes totaling 154,417 meters.
The La Arena property drill hole database contains 156,176 gold assays, 157,698 copper assays and 139,120 silver assays. The geology database includes lithologic, alteration, oxidation state, specific gravity, sulfur content, lithogeochemical and geotechnical data (from core holes only) collected from the drill holes.
| 14.3 | LA ARENA MINE MINERAL RESOURCES |
Measured and Indicated Mineral Resources for the La Arena Mine total 49.9 million tonnes with an average gold grade of 0.40 g/t containing 643.5 thousand ounces of gold; Inferred Mineral Resources total 0.4 million tonnes with an average gold grade of 0.32 g/t containing 4.3 thousand ounces of gold. The La Arena Mine Mineral Resource estimate, at a gold cut-off grade of 0.10 g/t, is shown in Table 14-1.
Table 14-1: La Arena Mine Mineral Resources
| Material Type | Classification | Tonnes
(M) | Gold
(g/t) | Gold
(koz) |
| Oxide | Measured | 0.3 | 0.38 | 3.3 |
| | Indicated | 49.6 | 0.40 | 640.2 |
| | Measured + Indicated | 49.9 | 0.40 | 643.5 |
| | Inferred | 0.4 | 0.32 | 4.3 |
Totals may not sum due to rounding
All Mineral Resources reported for the La Arena Mine are oxide resources of the Calaorco deposit within the La Arena property as of January 1, 2018. Mineral Resources are reported within a $1400 per ounce gold pit shell. The La Arena Mine Mineral Resource estimate was calculated by applying the mine topographic surface at January 1, 2018 to an updated Mineral Resource estimate completed in July 2017 to reflect mining depletion through the end of 2018.
The Mineral Resource estimate has been classified as Measured, Indicated and Inferred based on the confidence of the input data, geological interpretation and grade estimation parameters. The Mineral Resource estimate was prepared in accordance with NI 43-101, and classifications adopted by the CIM Council. The Company is not currently aware of any factors that could materially affect the Mineral Resource estimate for the La Arena Mine, including environmental, permitting, legal, title, taxation, socio-economic, marketing, political and other relevant factors.
| 14.3.1 | Geological Modeling |
The sedimentary package at the La Arena Mine is subdivided into sandstone, siltstone, slate and shale-coal. These units were modelled from cross section and drill hole data using LeapfrogTMsoftware into three-dimensional solids used to code the model by rock type.
The oxidation boundary was determined from geologic logging of the drill holes. The boundary between oxide and sulfide mineralization in the sedimentary package at the La Arena Mine area is generally very sharp with minimal transitional oxide-sulfide mineralization. The lower limits of oxide mineralization have been modeled as a hard boundary in the resource model.
| 90 |
| LA ARENA PROJECT |
| FORM 43-101F1 TECHNICAL REPORT |
Oxide mineralization at the La Arena Mine was modeled using two large low-grade domains (domain 100 for sediments and domain 400 for intrusives), and a series of higher-grade domains (500-series domains) that correspond to the sub-vertical Tilsa structures. The lower-grade domains used a nominal 0.05 g/t gold cut-off grade as a hard boundary as this represents a natural break in the gold population distribution and it is below the current open pit operational gold cut-off grade of 0.10 g/t. Tilsa-style structures typically have a core (+/-1m) of higher gold grades but are generally not well-defined by drilling due to a combination of thickness and orientation of the structures. A nominal cut-off grade of 0.5 g/t was used to ‘bulk up’ these structures into broader zones and constrain the estimate so as to not ‘smear’ the higher grades into the lower-grade portions of the model.
Core holes, RC holes and blastholes were used to form the gold domain interpretation, which was completed on cross section intervals of between 25 meters to 50 meters along strike and modelled into three-dimensional solids using LeapfrogTM software code the model. Figure 14-1 is an example cross section illustrating the gold domains used for the La Arena Mine resource estimate.
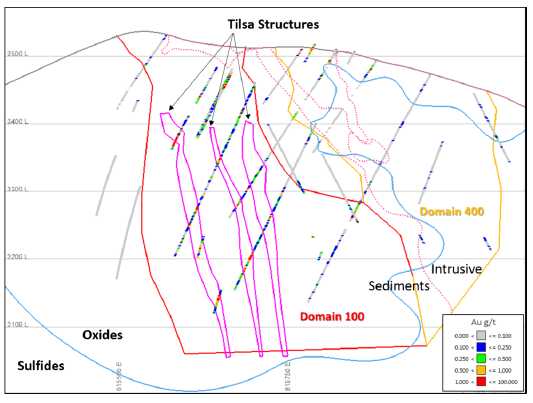
Figure 14-1: La Arena Mine Gold Mineral Domains
| 14.3.3 | Samples and Composites |
Only assays from RC drilling were used for the grade estimation of the gold oxide domains; background oxide domains used data from both RC and core drill holes. Reconciliation of mine production to the resource model at both the Ethel and Calaorco oxide deposits has shown RC drilling to be more accurate in representing the in situ mineralization, as core drilling tends to wash gold from fractures in the highly oxidized, broken sediment package.
| 91 |
| LA ARENA PROJECT |
| FORM 43-101F1 TECHNICAL REPORT |
Sample lengths range from 0.8 meters to 2.0 meters, with an average of sample length of 2.0 meters. Assays from blastholes were not used in the Mineral Resource estimate. Drill hole assays were coded to the three-dimensional gold oxide domains in order to constrain the influence of those samples during estimation to the gold domain in which they occur. Grade capping of the gold sample data was not necessary due to the close-spaced drill density, which limits the range of sample influence. Summary statistics of the gold oxide sample data are shown in Table 14-2.
Table 14-2: La Arena Mine Gold Mineral Domain Assay Statistics
| Au Domain | Number of
Samples | Au g/t
Mean | Au g/t
Minimum | Au g/t
Maximum | Standard
Deviation | Coefficient
of Variation |
| 100 | 20,198 | 0.22 | 0.003 | 22.00 | 0.54 | 2.40 |
| 400 | 4,636 | 0.18 | 0.003 | 11.71 | 0.43 | 2.47 |
| 511 | 336 | 0.89 | 0.003 | 9.70 | 1.28 | 1.43 |
| 512 | 298 | 0.96 | 0.008 | 19.40 | 1.65 | 1.73 |
| 513 | 173 | 1.02 | 0.020 | 24.46 | 2.39 | 2.34 |
| 515 | 2,120 | 1.32 | 0.003 | 108.30 | 4.04 | 3.06 |
| 516 | 512 | 0.85 | 0.008 | 17.99 | 1.59 | 1.86 |
| 517 | 234 | 0.78 | 0.010 | 6.72 | 0.95 | 1.23 |
| 518 | 45 | 0.68 | 0.060 | 2.29 | 0.53 | 0.79 |
| 519 | 263 | 0.81 | 0.007 | 5.24 | 0.97 | 1.20 |
| All 500 Domains | 3,981 | 1.11 | 0.003 | 108.30 | 3.13 | 2.81 |
There is no Au domain 514
Samples coded by gold domain were composited to nominal eight-meter downhole lengths within each respective domain. Gold composite lengths ranged from 4.0 meters to 12.0 meters, with an average composite length of 8.0 meters. Summary statistics of the sample composites by domain are shown in Table 14-3.
Table 14-3: La Arena Mine Gold Mineral Domain Composite Statistics
| Au Domain | Number of
Composites | Au g/t
Mean | Au g/t
Minimum | Au g/t
Maximum | Standard
Deviation | Coefficient
of Variation |
| 100 | 5,078 | 0.23 | 0.003 | 6.13 | 0.38 | 1.66 |
| 400 | 1,155 | 0.18 | 0.003 | 4.22 | 0.32 | 1.81 |
| 511 | 83 | 0.85 | 0.030 | 5.66 | 1.00 | 1.18 |
| 512 | 76 | 0.91 | 0.021 | 7.89 | 1.15 | 1.26 |
| 513 | 43 | 0.99 | 0.055 | 11.25 | 1.73 | 1.76 |
| 515 | 535 | 1.29 | 0.032 | 27.96 | 2.29 | 1.77 |
| 516 | 124 | 0.84 | 0.037 | 6.29 | 1.06 | 1.27 |
| 517 | 58 | 0.73 | 0.044 | 3.26 | 0.70 | 0.97 |
| 518 | 14 | 0.54 | 0.192 | 0.95 | 0.25 | 0.47 |
| 519 | 65 | 0.78 | 0.020 | 3.54 | 0.79 | 1.01 |
| All 500 Domains | 998 | 1.08 | 0.020 | 27.96 | 1.84 | 1.70 |
There is no Au domain 514
Density values used in the La Arena Mine oxide deposit Mineral Resource estimate, based on 463 density measurements collected from the sediment package through 2014 from diamond drill core, are listed in Table 14-4.
| 92 |
| LA ARENA PROJECT |
| FORM 43-101F1 TECHNICAL REPORT |
Table 14-4: Densities Used in La Arena Mine Mineral Resource Model
| Lithology | Oxidation State | Density (g/cm3) |
| Sandstone | Oxide | 2.52 |
| Siltstone | Oxide | 2.52 |
| Slate | Oxide | 2.40 |
| Shale-Coal | Oxide | 1.80 |
| 14.3.5 | Resource Model and Estimation |
The La Arena Mine resource block model was constructed using blocks with dimensions of five meters east-west by ten meters north-south by eight meters high. The three-dimensional lithologic and gold domains models were used to code the block model to replicate the geology and metal distributions and geometries observed in those models. The diffuse gold oxide mineralization, represented by domains 100 and 400, was estimated using localized uniform conditioning (LUC); the Tilsa structures (500-series domains) were estimated by Ordinary Kriging (OK) as these are more discrete zones. The grade estimates of the 100 and 400 domains used a single estimation pass, whereas multiple passes were used to estimate the 500-series domains, with decreasing search distances and number of composites to localize the higher-grade composite data. Variographic and geostatistical evaluations were made to determine directions and distances for grade estimation search criteria, as summarized in Table 14-5.
Table 14-5: La Arena Mine Resource Estimation Parameters
| Domain | Estimation
Pass | Search Ellipse Range (m) | Search Ellipse Orientation | Number of Composites |
Major
Axis | Semi-Major
Axis | Minor
Axis | Bearing | Plunge | Tilt | Minimum | Maximum |
| 100 | 1 | 340 | 270 | 100 | 150° | 0° | -70° | 9 | 24 |
| 400 | 1 | 200 | 160 | 30 | 150° | 0° | -60° | 9 | 24 |
500-
series | 1 | 80 | 100 | 30 | 150° | 0° | -70° | 9 | 16 |
| 2 | 120 | 150 | 40 | 150° | 0° | -70° | 4 | 12 |
| 3 | 300 | 400 | 50 | 150° | 0° | -70° | 3 | 10 |
An example cross section through the estimated block model is shown as Figure 14-2.
| 93 |
| LA ARENA PROJECT |
| FORM 43-101F1 TECHNICAL REPORT |
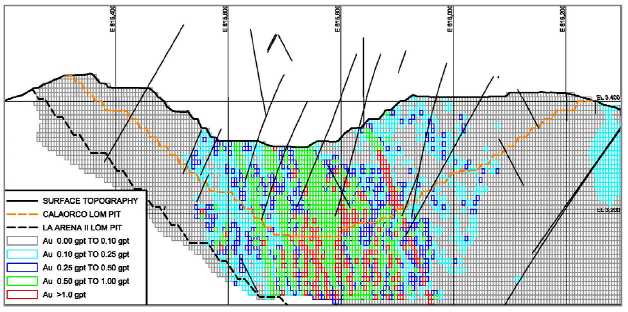
Figure 14-2: La Arena Mine Mineral Resource Block Model
| 14.3.6 | Resource Classification |
Measured, Indicated and Inferred Mineral Resources are reported for the La Arena Mine Mineral Resource estimate. Measured Resources are generally limited to the upper portions of the resource model and have a minimum drill spacing of 25 meters. Indicated Resources have drill spacing between 25 meters and 50 meters, and Inferred Resources have drill spacing greater than 50 meters. The La Arena Mine Mineral Reserve estimate was based on known inputs that include metallurgical performance, taxation/royalty obligations, geologic and geotechnical characterization, operational costs, and other economic parameters. The Company is not currently aware of any factors that are reasonably likely to have a negative material impact on the Mineral Reserve estimate for the La Arena Mine. The Mineral Reserve estimate was prepared in accordance with NI 43-101, and classifications adopted by the CIM Council. Mineral Resources are inclusive of Mineral Reserves.
| 14.4 | LA ARENA II MINERAL RESOURCES |
Measured and Indicated Mineral Resources for the La Arena II Project total 742.4 million tonnes with average gold and copper grades of 0.24 g/t and 0.35%, respectively, containing 5.6 million ounces of gold and 5.8 billion pounds of copper. Inferred Mineral Resources total 91.6 million tonnes with average gold and copper grades of 0.23 g/t and 0.17%, respectively, containing 683 thousand ounces of gold and 349 million pounds of copper. The La Arena Mine Mineral Resource estimate is summarized in Table 14-6.
| 94 |
| LA ARENA PROJECT |
| FORM 43-101F1 TECHNICAL REPORT |
Table 14-6: La Arena II Mineral Resources
| Material Type | Classification | Tonnes
(M) | Gold
(g/t) | Copper
(%) | Gold
(koz) | Copper
(mlbs) |
| Oxide | Measured | 5.9 | 0.27 | - | 51 | - |
| | Indicated | 43.2 | 0.28 | - | 388 | - |
| | Measured + Indicated | 49.1 | 0.28 | - | 440 | - |
| | Inferred | 41.3 | 0.26 | - | 349 | - |
| Sulfide1 | Measured | 149.7 | 0.25 | 0.39 | 1,214 | 1,279 |
| | Indicated | 543.5 | 0.23 | 0.38 | 3,984 | 4,511 |
| | Measured + Indicated | 693.2 | 0.23 | 0.38 | 5,197 | 5,790 |
| | Inferred | 50.4 | 0 21 | 0.31 | 344 | 349 |
| Total | Measured | 155.7 | 0.25 | 0.37 | 1,265 | 1,279 |
| | Indicated | 586.7 | 0.23 | 0.35 | 4,372 | 4,511 |
| | Measured + Indicated | 742.4 | 0.24 | 0.35 | 5,637 | 5,790 |
| | Inferred | 91.6 | 0.23 | 0.17 | 683 | 349 |
| 1includes supergene, transitional oxide-sulfide and sulfide Mineral Resources | | Totals may not sum due to rounding. |
The La Arena II Mineral Resources are reported within an optimized undiscounted cash flow pit shell using metal prices of $4.00 per pound copper and $1,500 per ounce gold and operating cost parameters developed for the La Arena II PEA. Oxide Mineral Resources are reported using a 0.10 g/t gold cut-off grade; sulfide Mineral Resources are reported using a 0.18% copper-equivalent (CuEq) cut-off grade calculated using $4.00 per pound copper and $1500 per ounce gold. The La Arena II Mineral Resource estimate is reported below the post-La Arena Mine topographic surface and below the pit shell used to report the La Arena Mine Mineral Resources.
| 14.4.1 | Geological Modeling |
The geometry and distribution of the three primary andesitic porphyry intrusions, FPA-1, FPA-2 and FPA-3, were modeled from 50 meter spaced cross sections and drill hole data using LeapfrogTM software into three-dimensional solids that were used to code the resource block model by rock type. The geologic interpretation honors the sequence of emplacement and cross-cutting relationships between the porphyry intrusions. The oxidation boundaries (oxide, supergene, transitional oxide-sulfide and sulfide) were similarly modeled and coded to the resource block model. As illustrated in Figure 14-3 and Figure 14-4, higher grade copper and gold mineralization is spatially and genetically associated with the FPA-2 intrusive phase, with lesser grades occurring within the cross-cutting FPA-3 intrusive phase and generally nil to very low grades occurring within the early FPA-1 intrusive phase.
| 95 |
| LA ARENA PROJECT |
| FORM 43-101F1 TECHNICAL REPORT |
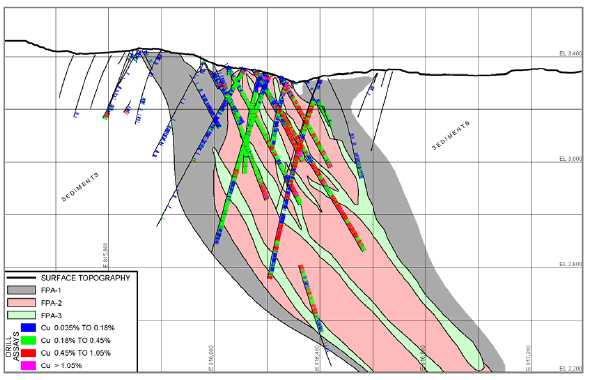
Figure 14-3: La Arena II Porphyry Model with Copper Assays
(East-West Section; Looking North)
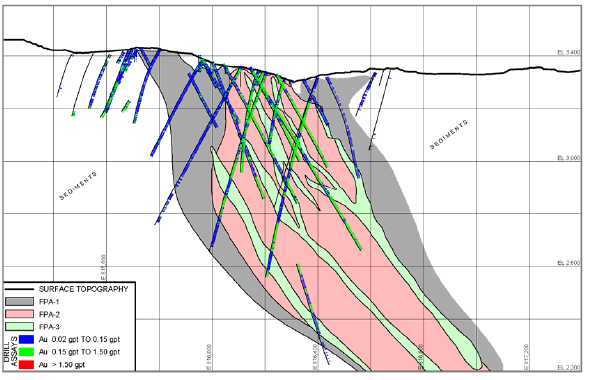
Figure 14-4: La Arena II Porphyry Model with Gold Assays
(East-West Section; Looking North)
| 96 |
| LA ARENA PROJECT |
| FORM 43-101F1 TECHNICAL REPORT |
| 14.4.2 | Copper and Gold Domain Models |
Cross-sectional mineral-domain models for each of the four metals were created for the Central and East zones. Distribution plots of copper and gold sample grades were made to help define the natural populations of metal grades to be modeled on the cross sections. The natural populations from the distribution plots were checked against the drill data and geologic model to confirm the metal grade populations represented realistic, continuous mineral types. Low-grade, moderate-grade, and high-grade mineral domains were determined for both metals. The resulting grade populations used to create the mineral domains are shown Table 14-7.
Table 14-7: La Arena II Mineral Domains
| Metal | Low-Grade Domain
(Domain 100) | Mid-Grade Domain
(Domain 200) | High-Grade Domain
(Domain 300) | High-Grade Domain
(Domain 400) |
| Copper | 0.035% – 0.18% | 0.18% – 0.45% | 0.45% – 1.05% | > 1.05% |
| Gold | 0.02 g/t – 0.15 g/t | 0.15 g/t – 1.50 g/t | > 1.50 g/t | n/a |
The mineral domains as modeled and drawn on the cross sections are not strict “grade shells” but, rather, are created using the geologic information for defining orientation, geometry, continuity, and contacts in conjunction with the metal grades. Each of these domains represents a distinct distribution of metal grades. While copper and gold are generally spatially related, they are not always exactly coincident, thereby requiring separate domain models for each metal. Mineralization peripheral to the intrusive bodies and outside of domain 100 was assigned a domain code of zero.
Each metal was modeled independently on 50 meter spaced cross sections, with each porphyry phase used to help guide the general trend of the domain modeling. A unique high-grade copper domain (domain 400) and gold domain (domain 300) were created to model narrow zones where copper grades in excess of 1.05% and gold grades in excess of 1.50 g/t displayed continuity from section to section or between drill holes on the same cross section. Anomalous, ‘outlier’ high grades for copper and gold that do not exhibit continuity were capped and/or tightly restricted during the resource estimation, as discussed further in Section 14.4.3.
The mineral domain and geologic cross sections were sliced at eight meter vertical intervals that coincide with the center of the block model’s vertical block size. Mineral domains were refined on cross section to ensure geologic boundaries and the location of drill sample assays were honored in the third dimension. The level-plan sectional slices of the mineral domains were used to code the percentage of each domain into individual blocks within the block model. The same procedure was used for both copper and gold mineral domains.
Typical cross sections through the La Arena II copper and gold domain models, with drill intercepts, are shown in Figure 14-5 and Figure 14-6, respectively.
| 97 |
| LA ARENA PROJECT |
| FORM 43-101F1 TECHNICAL REPORT |

Figure 14-5: La Arena II Copper Domains
(East-West Section; Looking North)
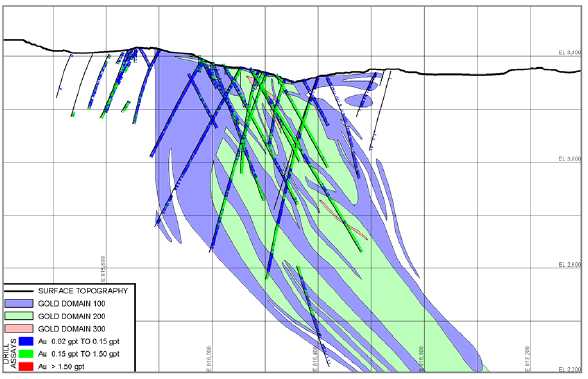
Figure 14-6: La Arena II Gold Domains
(East-West Section; Looking North)
| 98 |
| LA ARENA PROJECT |
| FORM 43-101F1 TECHNICAL REPORT |
| 14.4.3 | Samples and Composites |
Sample lengths range from 0.2 meters to locally 11.9 meters, with an average sample length of 1.90 meters. Drill hole sample assays were coded to their respective copper and gold domains from the sectional mineral domain polygons. Summary statistics of the copper and gold samples by domain are shown in Table 14-8 and Table 14-9, respectively.
Table 14-8: La Arena II Copper Mineral Domain Assay Statistics
| Cu Domain | No. of
Samples | Cu%
Mean | Cu%
Minimum | Cu%
Maximum | Standard
Deviation | Coefficient
of Variation |
| 100 | 22,481 | 0.10 | 0 | 2.51 | 0.07 | 0.67 |
| 200 | 21,580 | 0.27 | 0.002 | 3.63 | 0.11 | 0.42 |
| 300 | 13,461 | 0.59 | 0.002 | 5.42 | 0.24 | 0.40 |
| 400 | 1,452 | 1.30 | 0.047 | 11.50 | 0.74 | 0.57 |
| All Cu Domains | 58,974 | 0.30 | 0 | 11.50 | 0.30 | 1.00 |
Table 14-9: La Arena II Gold Mineral Domain Assay Statistics
| Au Domain | No. of
Samples | Au g/t
Mean | Au g/t
Minimum | Au g/t
Maximum | Standard
Deviation | Coefficientof
Variation |
| 100 | 48,258 | 0.07 | 0.003 | 2.34 | 0.06 | 0.79 |
| 200 | 31,326 | 0.32 | 0.003 | 11.71 | 0.25 | 0.78 |
| 300 | 220 | 2.62 | 0.190 | 24.46 | 2.49 | 0.95 |
| All Au Domains | 79,804 | 0.17 | 0.003 | 24.46 | 0.27 | 1.55 |
The copper and gold assay data within each domain were analyzed statistically to identify ‘outlier’ values that were determined to be beyond a given domain’s natural population of samples. A total of 65 copper samples and 33 gold samples within the porphyry domains were capped, with capping occurring within all domains for each metal. Samples outside of the porphyry model (domain 0) were capped at 0.06% copper and 0.02 g/t gold. A summary of the grade capping by domain is presented in Table 14-10.
Table 14-10: La Arena II Sample Capping
| Domain | Copper | Gold |
No. Samples
Capped | Capping Limit
Cu% | No. Samples
Capped | Capping Limit
Au g/t |
| 100 | 30 | 0.60 | 19 | 0.90 |
| 200 | 10 | 1.40 | 7 | 4.00 |
| 300 | 18 | 2.20 | 7 | 7.00 |
| 400 | 7 | 5.10 | n/a | n/a |
Samples coded by gold domain were composited to nominal eight meter downhole lengths within each respective domain. Gold composite lengths ranged from 4.0 meters to 12.0 meters, with an average composite length of 8.0 meters. Summary statistics of the sample composites by domain are shown in Table 14-3.
Compositing was made at four meter downhole lengths, honoring all mineral domain boundaries. Composite lengths range from 0.05 meters to 4.0 meters, with an average composite length of 3.8 meters. Length-weighted composites were used in the block model grade estimation and the volume inside each mineral domain was estimated using only composites from inside that domain. Summary statistics for copper composites and gold composites by domain are presented in Table 14-11 and Table 14-12, respectively.
| 99 |
| LA ARENA PROJECT |
| FORM 43-101F1 TECHNICAL REPORT |
Table 14-11: La Arena II Copper Mineral Domain Composite Statistics
| Cu Domain | No. of
Composites | Cu%
Mean | Cu%
Minimum | Cu%
Maximum | Standard
Deviation | Coefficientof
Variation |
| 100 | 11,372 | 0.10 | 0.003 | 0.60 | 0.05 | 0.50 |
| 200 | 10,832 | 0.27 | 0.005 | 1.22 | 0.09 | 0.35 |
| 300 | 6,789 | 0.59 | 0.012 | 2.20 | 0.19 | 0.32 |
| 400 | 780 | 1.29 | 0.062 | 5.10 | 0.60 | 0.46 |
| All Cu Domains | 29,773 | 0.30 | 0.003 | 5.10 | 0.28 | 0.94 |
Table 14-12: La Arena II Gold Mineral Domain Composite Statistics
| Au Domain | No. of
Composites | Au g/t
Mean | Au g/t
Minimum | Au g/t
Maximum | Standard
Deviation | Coefficient
of Variation |
| 100 | 23,595 | 0.07 | 0.003 | 0.86 | 0.04 | 0.63 |
| 200 | 15,441 | 0.32 | 0.010 | 3.47 | 0.21 | 0.65 |
| 300 | 134 | 2.42 | 0.339 | 7.00 | 1.22 | 0.50 |
| All Au Domains | 39,170 | 0.17 | 0.003 | 7.00 | 0.22 | 1.29 |
Composite grades outside of the porphyry model (domain 0) average 0.02% copper and 0.015 g/t gold.
Density measurements values used in the La Arena II Mineral Resource estimate utilized 1,794 density measurements collected through 2014 from diamond drill core in the deposit area, as summarized in Table 14-13.
Table 14-13: Densities Used in La Arena Mine Mineral Resource Model
Mineral
Domain | Density (g/cm3) |
| Mean | Minimum | Maximum | StandardDeviation | Coefficientof Variation |
| 0 | 2.49 | 1.63 | 2.93 | 0.20 | 0.08 |
| 100 | 2.52 | 2.08 | 2.93 | 0.14 | 0.06 |
| 200 | 2.51 | 2.06 | 2.96 | 0.11 | 0.04 |
| 300 | 2.52 | 2.05 | 2.80 | 0.12 | 0.05 |
| 400 | 2.54 | 2.31 | 2.84 | 0.14 | 0.05 |
There are considerable local variations in rock densities related to the reduction-oxidation (redox) of the deposit; as such, the application of an average density to the resource model is not appropriate. Density values were estimated into the resource block model using the same estimation areas and search criteria as used for grade estimation (as discussed in the following section) to ensure the appropriate density values where applied to the oxide, supergene, transitional oxide-sulfide and sulfide resources.
| 14.4.5 | Resource Model and Estimation |
The La Arena II resource model replicates the relatively complex metal distributions and geometries observed in the geologic and mineral domain models. Due to two distinct geometries of 1) moderately- to steeply-dipping sulfide mineralization generally concordant with the porphyry intrusive phases and 2) sub-horizontal zones of oxide, supergene and transitional oxide-sulfide, two separate estimation areas were created on cross section and extruded into solids which were used to code the block model. The two estimation areas allow for separate search ellipses that honor the geometry of the mineralization to be used for the grade estimation.
| 100 |
| LA ARENA PROJECT |
| FORM 43-101F1 TECHNICAL REPORT |
The La Arena II resource block model was constructed using blocks with dimensions of four meters east-west by eight meters north-south by eight meters high. The portion of each block which occurs inside each mineral domain was estimated using only composites from inside its respective domain. Grade interpolation utilized inverse distance cubed (ID3), with nearest neighbor and ordinary kriging estimates also made to check estimation results and sensitivities. Variography and geostatistical evaluations were made to determine distances for search and classification criteria.
Grade estimation within each estimation area used three search passes, with each successive search pass increasing from the prior search pass to estimate metal grades to the extent of each mineral domain. In both estimation areas, successive search passes did not overwrite previous estimation passes to better honor the local data. Search restrictions (pullbacks) were employed for the higher grade values in all metal domains to control isolated high-grade composites. The same estimation parameters were used for both copper and gold grade estimates. The La Arena II estimation parameters and search restrictions are provided in Table 14-14 and Table 14-15, respectively.
Table 14-14: La Arena II Resource Estimation Parameters
| Estimation Area 1 |
Estimation
Pass | Search Range (m) | Search Ellipse Orientation | Number of Composites |
Major
Axis | Semi-Major
Axis | Minor
Axis | Bearing | Plunge | Tilt | Min | Max | Max/Hole |
| 1 | 300 | 300 | 100 | 350° | 0° | -55° | 4 | 18 | 4 |
| 2 | 500 | 500 | 250 | 350° | 0° | -55° | 2 | 18 | 4 |
| 3 | 750 | 750 | 750 | 350° | 0° | -55° | 1 | 18 | 4 |
| Estimation Area 2 |
Estimation
Pass
| Search Range (m) | Search Ellipse Orientation | Number of Composites |
Major
Axis | Semi-Major
Axis | Minor
Axis | Bearing | Plunge | Tilt | Min | Max | Max/Hole |
| 1 | 150 | 150 | 50 | 15° | 0° | -15° | 4 | 18 | 4 |
| 2 | 300 | 300 | 150 | 15° | 0° | -15° | 2 | 18 | 4 |
| 3 | 750 | 750 | 750 | 15° | 0° | -15° | 1 | 18 | 4 |
Table 14-15: La Arena II Resource Estimation Search Restrictions
| Cu Domain | Grade Threshold | Search Restriction (m) | Au Domain | Grade Threshold | Search Restriction (m) |
| 100 | 0.18% | 50 | 100 | 0.35 g/t | 50 |
| 200 | 0.50% | 50 | 200 | 2.00 g/t | 50 |
| 300 | 1.00% | 50 | 300 | 5.00 g/t | 50 |
| 400 | 3.23% | 50 | - | - | - |
Example cross sections through the La Arena II Mineral Resource block model for copper and gold are shown in Figure 14-7 and Figure 14-8, respectively. Mineral Resources are reported within an optimized undiscounted cash flow pit shell using metal prices of $4.00 per pound copper and $1,500 per ounce gold, and below the pit shell used to report the La Arena Mine Mineral Resources.
| 101 |
| LA ARENA PROJECT |
| FORM 43-101F1 TECHNICAL REPORT |
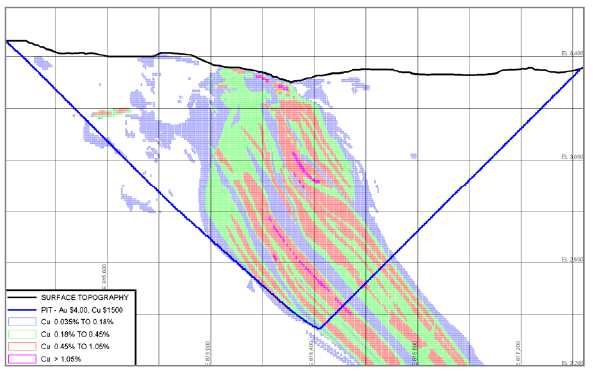
Figure 14-7: La Arena II Copper Mineral Resources
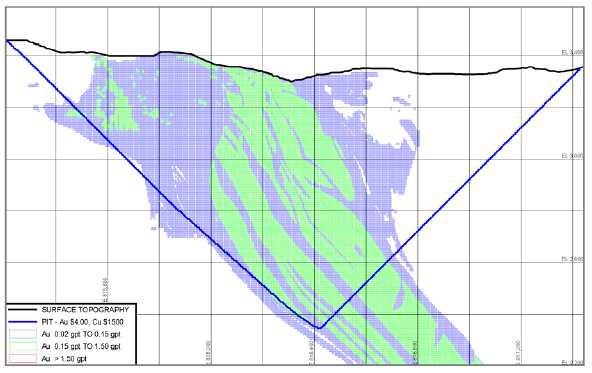
Figure 14-8: La Arena II Gold Mineral Resources
| 102 |
| LA ARENA PROJECT |
| FORM 43-101F1 TECHNICAL REPORT |
| 14.4.6 | Resource Classification |
The La Arena II Mineral Resources are classified by a combination of number of composites, distance from composite location and number of drill holes. To be classified as Measured Mineral Resources, the resource model blocks must be estimated from a minimum of three composites from at least two drill holes within 25 meters. To be classified as Indicated Mineral Resources, the resource model blocks must be estimated from a minimum of three composites from at least two drill holes within 100 meters. Inferred Mineral Resources required a minimum of one composite from a single drill hole. The geologic and mineral domain modeling methodology ensures that all Mineral Resources are properly restricted to the appropriate lithology and redox category.
NI 43-101 includes the requirement that Mineral Resources exist “in such form and quantity and of such a grade or quality that it has reasonable prospects for economic extraction.” Mineral Resources for the La Arena II Project are reported using a cut-off grade of 0.18% CuEq, calculated using metal prices of $4.00 per pound copper and $1500 per ounce gold within an optimized undiscounted cash flow pit shell generated using these same metal prices and cost and process recovery inputs from the preliminary economic assessment of the ‘mineable resources’ at the La Arena II Project. Estimation of metal grades within the porphyry intrusions above the 0.18% CuEq cut-off grade in the resource model extended below the limits of the resource pit shell and was thus, not classified nor included in the reported Mineral Resources, but represents additional potential worthy of future study.
The Mineral Resource estimate for the La Arena II Project has been classified as Measured, Indicated and Inferred based on the confidence of the input data, geological interpretation and grade estimation parameters and methodology. The Mineral Resource estimate was prepared in accordance with NI 43-101, and classifications adopted by the CIM Council. The Company is not currently aware of any factors that could materially affect the Mineral Resource estimate for the La Arena II Project, including environmental, permitting, legal, title, taxation, socioeconomic, marketing, political and other relevant factors; though further study in all of these areas is necessary to advance the project.
| 103 |
| LA ARENA PROJECT |
| FORM 43-101F1 TECHNICAL REPORT |
| 15 | MINERAL RESERVE ESTIMATES |
| 15.1 | MINERAL RESERVE CLASSIFICATION |
The Company has classified the La Arena Mine Mineral Reserves in order of increasing confidence into Probable and Proven categories as defined by CIM Definition Standards - For Mineral Resources and Mineral Reserves (2014), in compliance with NI 43-101.
| 15.1.1 | Mineral Reserve Definition |
Mineral Reserves are sub-divided in order of increasing confidence into Probable Mineral Reserves and Proven Mineral Reserves. A Probable Mineral Reserve has a lower level of confidence than a Proven Mineral Reserve.
A Mineral Reserve is the economically mineable part of a Measured and/or Indicated Mineral Resource demonstrated by studies at the prefeasibility or feasibility level as appropriate that demonstrate, at the time of reporting, that economic extraction can be justified. A Mineral Reserve includes diluting materials and allowances for losses that may occur when the material is mined.
Mineral Reserves are those parts of Mineral Resources which, after the application of all mining factors, result in an estimated tonnage and grade which, in the opinion of the Qualified Person(s) making the estimates, is the basis of an economically viable project after taking account of mining, processing, metallurgical, infrastructure, economic, marketing, legal, environment, social, government and other relevant factors (Modifying Factors). Mineral Reserves are inclusive of diluting material that will be mined in conjunction with the Mineral Reserves and delivered to the treatment plant or equivalent facility. The term Mineral Reserve need not necessarily signify that extraction facilities are in place or operative or that all governmental approvals have been received. It does signify that there are reasonable expectations of such approvals.
| • | Probable Mineral Reserve– A Probable Mineral Reserve is the economically mineable part of an Indicated and, in some circumstances, a Measured Mineral Resource demonstrated to be economic by at least a prefeasibility study. The study must incorporate adequate information on Modifying Factors that demonstrate, at the time of reporting, that economic extraction can be justified. The confidence in the Modifying Factors applied to Probable Mineral Reserve is lower than that applied to a Proven Mineral Reserve. |
| | | |
| • | Proven Mineral Reserve– A Proven Mineral Reserve is the economically mineable part of a Measured Mineral Resource demonstrated by at least a prefeasibility study. The study must incorporate adequate information on Modifying Factors that demonstrate, at the time of reporting, that economic extraction can be justified. A Proven Mineral Reserve implies a high degree of confidence in the Modifying Factors. Application of the Proven Mineral Reserve category implies that the Qualified Person has the highest degree of confidence in the estimate with the consequent expectation in the minds of the readers of the report. The term should be restricted to that part of the deposit where production planning is taking place and for which any variation in the estimate would not significantly affect potential economic viability of the deposit. |
| 15.2 | LA ARENA MINE MINERAL RESERVES |
Proven and Probable Mineral Reserves for the La Arena Mine are 44.0 million tonnes with an average gold grade of 0.40 g/t containing 568.4 thousand ounces of gold. Mineral Reserves for the La Arena Mine were developed by applying relevant economic and technical criteria to define the economically extractable portions of the Measured and Indicated Mineral Resources. The Mineral Reserve estimate for the La Arena Mine is shown in Table 15-1. The
| 104 |
| LA ARENA PROJECT |
| FORM 43-101F1 TECHNICAL REPORT |
Mineral Reserves are reported as dry tonnes within in an optimized pit shell at a gold cut-off grade of 0.10 g/t. The effective date of the La Arena Mine Mineral Reserve estimate is January 1, 2018.
Table 15-1: La Arena Mine Mineral Reserves
| Classification | Ore
Type | Tonnes
(M) | Gold Grade
(g/t) | Gold Ounces
(k) |
| Proven | Sediment | - | - | - |
| Intrusive | 0.3 | 0.38 | 3.3 |
| Probable | Sediment | 38.7 | 0.42 | 519.8 |
| Intrusive | 5.0 | 0.28 | 45.3 |
| Proven & Probable | All | 44.0 | 0.40 | 568.4 |
All Mineral Reserves reported for the La Arena Mine is oxide ore that will be mined from the Calaorco pit. Mineral Reserves were calculated by constraining the oxide Measured and Indicated Mineral Resources as of January 1, 2018 inside of a designed pit based on an optimized pit shell using $1200 per ounce gold. Process recovery factors or additional plant losses were not considered, though metallurgical recovery was incorporated into the pit optimization. As the resource block model is a diluted block model, no additional dilution or mining losses were applied. The life of mine strip ratio is 1.9 (waste:ore). The La Arena Mine Mineral Reserve estimate is based on material delivered to the leach pads and does not include process recovery factors or additional process plant losses.
The La Arena Mine Mineral Reserve estimate is based on known inputs that include metallurgical performance, taxation/royalty obligations, geologic and geotechnical characterization, operational costs, and other economic parameters. The Company is not currently aware of any factors that are reasonably likely to have a negative material impact on the Mineral Reserves at La Arena. The Mineral Reserve estimate was prepared in accordance with NI 43-101, and classifications adopted by the CIM Council. Mineral Resources are inclusive of Mineral Reserves.
The gold cut-off grade value of 0.10 g/t used to determine the economic portion of the Measured and Indicated Resources at the La Arena Mine is predicated on the assumption that mine production will feed the leach pads and processing facility at capacity throughout the mine life. All costs that are incremental with production are included in the cut-off value calculation. Costs in the cut-off value calculation include variable and fixed costs directly related to processing, smelting, refining, general and administrative (G&A) costs directly related to production, royalties, and project costs related to production and the plant facilities that do not have a measurable payback.
Costs excluded from the cut-off value calculation include exploration, capitalized development costs, capital infrastructure costs, in-mine projects having a measurable economic benefit, and non-cash charges. Sustaining capital and expansion capital costs are excluded from the cut-off value cost basis as these costs are not incremental to a specific unit of production but rather common to the overall mine as a whole.
The resulting gold cut-off grade of 0.10 g/t was used to determine the Mineral Reserves reported above in Table 15-1. Silver is not considered in the cut-off grade calculation given its insignificant contribution to the overall project economics.
| 15.2.2 | Assumptions and Parameters |
The La Arena Mine Mineral Reserves are constrained by a pit geometry that has been determined incorporating technical, process recovery and economic inputs. The list of inputs used for the Calaorco open pit design is presented in Table 15-2.
| 105 |
| LA ARENA PROJECT |
| FORM 43-101F1 TECHNICAL REPORT |
Table 15-2: La Arena Mine Pit Optimization Parameters
| Operating Cost Parameters | Mining Cost | $1.90 per tonne mined |
| Processing1 | $1.49 per tonne leached |
| General & Administration | $1.00 per tonne leached |
| Processing Parameters | Ore Processing Rate | 45,000 tonnes per day |
| Gold Recovery – Sediments | 86% |
| Gold Recovery - Intrusive | 83% |
| Economic Parameters | Gold Price | $1,200 per ounce |
| Gold Sell Cost | $12.37 per ounce |
1 includes leaching and ARD plant operations, power and sustaining leach pad construction.
| 15.3 | LA ARENA II MINERAL RESERVES |
There are no Mineral Reserves reported for the La Arena II Project. The 2018 La Arena II PEA supersedes the 2015 internal feasibility study completed by Ausenco Peru S.A.C.; a summary of the results which were published by Rio Alto (Mining Plus, 2015). The prior study included Probable Mineral Reserves of 63.1 million tonnes at average grades of 0.43% copper and 0.31 g/t gold containing 579 million pounds of copper and 633 thousand ounces of gold.
There are no Mineral Reserves reported in the 2018 La Arena PEA, as the scope of the project has changed significantly with a refined geologic model, updated Mineral Resource estimate, increased mining and processing rates, modified processing scheme, and the use of alternative tailings disposal facilities. While a portion of the data generated for the 2015 feasibility study provides support for some of the assumptions incorporated into the 2018 La Arena II PEA, much of the mining, processing, geotechnical, hydrological, social, and capital and operating cost parameters used in the 2015 study are no longer applicable to the project as envisioned in this Technical Report.
| 106 |
| LA ARENA PROJECT |
| FORM 43-101F1 TECHNICAL REPORT |
| 16.1 | LA ARENA MINE – CURRENT OXIDE OPERATIONS |
The current operation has been mining the oxide deposit at the La Arena Mine since 2011. The operation is a conventional drill, blast, shovel and truck open pit run-of-mine (ROM) operation. Mining is carried out on two 12-hour shifts, operating 7 days a week under an alliance style contract with Peruvian contractors. The oxide ore is hauled directly from the pit to the leach facility or to stockpiles. The general site layout for the La Arena Mine is shown in Figure 16-1.

Figure 16-1: La Arena Mine Site Layout
The 2018 mine plan targets delivering approximately 40,000 tonnes per day of ROM oxide ore to the leach facility
Metallurgical recoveries are derived from metallurgical test work and actual historic leach results. Recoveries vary depending on rock type. Sedimentary ore has a recovery of 86% and porphyry ore has a recovery of 83%. Please refer to Section 13 for more detail on the metallurgical test work. ROM leach recoveries are shown in Table 16-1.
| 107 |
| LA ARENA PROJECT |
| FORM 43-101F1 TECHNICAL REPORT |
Table 16-1: La Arena Mine Leach Recovery
| Heap Leach Recovery | Sediment | Porphyry |
| Gold Recovery | 86.0% | 83.0% |
The metal price used for the Calaorco pit optimization is $1,200 per gold ounce. Metal price assumptions and refining cost inputs used for pit optimization for the oxide operation are shown in Table 16-2.
Table 16-2: La Arena Mine Metal Price Assumptions
| Metal Prices | | |
| Gold Price Mineral Reserves | $/oz | $1,200 |
| Dore | | |
| Payable Au | | 99.9% |
| Refining cost Au | $/oz | $10.14 |
| Refining cost Ag | $/oz | $1.13 |
Operating cost inputs for pit optimization were compiled from actual historic costs and life of mine production schedules. Summary of the operating costs are shown in Table 16-3.
Table 16-3: La Arena Mine Operating Cost Assumptions
| Operating Costs(1) | | |
| Mining | $/t | $1.90 |
| Oxide Processing | $/t | $1.49 |
| General & Administration | $/t | $1.11 |
(1) Mining costs are $/t mined. Processing and G&A are $/t processed.
| 16.1.1.3 | Hydrogeology and Hydrology |
To date all mining in the Calaorco pit has occurred above the water table. Dewatering wells will be installed in 2018 before the pit encounters the water table. A hydrogeological study conducted in 2014 by Montgomery and Associates, estimated the need to dewater at a rate of 1.3 liters per second (Montgomery; 2014). This report also modelled the formation of a post mining pit lake. Mitigation of the pit lake is in the current La Arena Mine reclamation and closure plan.
| 16.1.1.4 | Geotechnical Assumptions |
Piteau Engineering Latin America SAC (Piteau) was commissioned to conduct a geotechnical analysis for the La Arena Mine. The geotechnical study for the Calaorco pit was completed in August 2012. Since this study, reviews have been completed by George, Orr and Associates Pty Ltd of Australia (Mining Plus; 2015).
The geotechnical conditions of the Calaorco pit were considered to be adequate and the investigations concluded that there were no signs of impending multi-bench scale instabilities. The wall slope parameters recommended by Piteau and used in the designs are shown in Table 16-4.
| 108 |
| LA ARENA PROJECT |
| FORM 43-101F1 TECHNICAL REPORT |
Table 16-4: La Arena Mine Wall Slope Criteria used in Designs
| Slope | Description | Bench
Face
Angle | Bench
Height
meters | Berm
Interval | Berm
Width
meters | Inter-ramp
Angle | Ramp
Width
meters(1) | Overall
Slope
Angle |
| 1 | Sandstone | 75 | 8 | 2 | 12 | 44° | 25 | 41° |
| 2 | Porphyry | 60 | 8 | 2 | 11 | 38° | 25 | 44° |
| (1) - Ramp width include berms and ditches |
The cut-off grades used for pit design and optimization is 0.18 gold grams per tonne.
The La Arena Mine Calaorco open pit is mined by conventional truck and shovel methods. The mining fleet consists of 90 tonne class rock trucks and 10 m3hydraulic shovels. Blasthole drilling is performed by diesel powered rotary single pass track drills. Ancillary support equipment includes motor graders, track dozers and water trucks. The typical mining fleet mix is shown in Table 16-5.
Table 16-5: La Arena Mine Typical Mining Fleet
| Equipment | Model | Units |
| Haul Trucks | 777 F/G | 19 |
| Loader | WA900 | 1 |
| Shovel | RH90C | 3 |
| Production drills | DM45 | 3 |
| Water trucks | 773D | 1 |
| Wheel dozers | 834H | 1 |
| Track dozers | D6T | 1 |
| Track dozers | D8T | 3 |
| Motor graders | 16M | 2 |
| Fuel trucks | 5000 gallons | 2 |
The bench height is 8 meters. Double benching is applied with a catch bench 11 meters wide in sandstone and 12 meters wide in porphyry. Inter-ramp wall angles are 43.5° in sandstone and 37.0° in porphyry.
Ramps are constructed 25 meters wide including berms and ditches. Leach ore is direct hauled to the leach facility or to ore stockpiles. Current mining rate is approximately 40 million tonnes per year.
Final La Arena Mine pit design is shown in Figure 16-2.
| 109 |
| LA ARENA PROJECT |
| FORM 43-101F1 TECHNICAL REPORT |
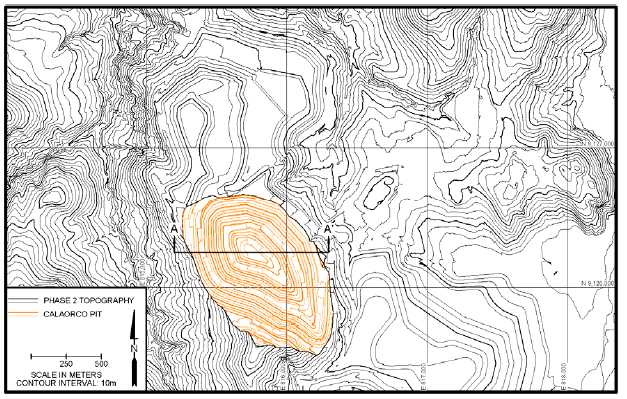
Figure 16-2: Calaorco Final Pit
Mining at the La Arena Mine is in the final stage of the Calaorco pit. The current mine schedule shows mining will be completed in 2021. Cross section view of final Calaorco pit is shown in Figure 16-3.

Figure 16-3: Calaorco LOM Pit
| 110 |
| LA ARENA PROJECT |
| FORM 43-101F1 TECHNICAL REPORT |
All waste material is hauled to the waste rock storage facility located south of the Calaorco pit. Non-Acid-Generating (NAG) waste is used to encapsulate the Potentially Acid Generating (PAG) waste.
| 16.1.4 | Production Schedule |
The production schedule for the remaining Calaorco pit is shown in Table 16-6.
Table 16-6: La Arena Mine Mining Schedule
| Mine Schedule | 2018 | 2019 | 2020 | 2021 |
| Leach Ore Mined | kt | 14,344 | 12,520 | 9,608 | 6,385 |
| Au grade | g/t | 0.42 | 0.42 | 0.39 | 0.42 |
| Au ounces | koz | 192.5 | 167.6 | 121.1 | 86.7 |
| Waste Mined | kt | 26,463 | 33,105 | 21,602 | 1,086 |
| Total Mined | kt | 40,807 | 45,625 | 31,211 | 7,472 |
| Strip Ratio | | 1.8 | 2.6 | 2.2 | 0.2 |
The La Arena II Project is a stand-alone project, independent of the La Arena Mine. Should the La Arena II Project be advanced, it would not be as an extension or expansion of the current La Arena Mine operation. None of the current mining equipment or facilities in use at the La Arena Mine are applicable to the La Arena II mining operation as envisioned in this report.
Two processing streams are envisioned for the La Arena II Project. Oxide leach material will be hauled to a ROM leach facility. Sulfide material will be hauled to a differential flotation processing facility (mill) where a copper-gold concentrate and a pyrite concentrate will be produced. Waste rock will be hauled from the pit to the dry stack tailings facility for use as a buttress or to the waste rock storage facility.
Preliminary mine schedules have been developed for the La Arena II Project based on the Mineral Resource estimate as reported in Section 14 within a designed pit.
The mine plan was developed to deliver 80,000 tonnes per day of sulfide resources to the flotation process plant. Oxide resources extracted would be hauled directly to the new oxide leach pad. Over the 21 year mine life (excluding pre-production), the mine will deliver 587.4 million tonnes of sulfide resources containing 4.98 billion pounds of copper and 4.54 million ounces of gold to the flotation plant, with an additional 46.6 million tonnes of oxide resources containing 501 thousand ounces delivered to the leach pad. The average mining rate, including waste, is 132 million tonnes per year over the first 19 years of mining with a peak of 168 million tonnes per year.
Mining starts approximately 2.5 years before mill start-up. Approximately 281 million tonnes of material will be mined before the mill is in operation, including an estimated 23 million tonnes of oxide material and 28 million tonnes of sulfide material containing 240 million pounds of copper and 215 thousand ounces of gold.
The PEA considers the La Arena II Project as a conventional drill, blast, truck and shovel operation. The study contemplates that the Owner will own and operate all equipment. Waste rock will be used in the construction of foundations for the mill facility and dry stack tailing facilities, with the remainder placed in the waste storage facilities.
Total Mineral Resources processed in the mine plan are shown in Table 16-7.
| 111 |
| LA ARENA PROJECT |
| FORM 43-101F1 TECHNICAL REPORT |
Table 16-7: La Arena II Mineral Resources in Mine Plan
| Resources | Units | Total |
| Oxide Leach Tonnes | M | 69.5 |
| Au grade | g/t | 0.30 |
| Cu grade | % | - |
| Au contained ozs | k | 669.4 |
| Cu contained lbs | M | - |
| | | |
| Sulfide Milled Tonnes | M | 616.4 |
| Au grade | g/t | 0.24 |
| Cu grade | % | 0.38 |
| Au contained ozs | k | 4,753.7 |
| Cu contained lbs | M | 5,215 |
The mine plan is a component of the preliminary economic assessment of the La Arena II Project and includes Inferred Mineral Resources that are considered too speculative geologically to have the economic considerations applied that would enable them to be categorized as Mineral Reserves and there is no certainty that the preliminary economic assessment will be realized.
Layout of the proposed site facilities for the La Arena II Project is shown in Figure 16-4.
| 112 |
| LA ARENA PROJECT |
| FORM 43-101F1 TECHNICAL REPORT |

Figure 16-4: La Arena II Proposed General Arrangement
| 113 |
| LA ARENA PROJECT |
| FORM 43-101F1 TECHNICAL REPORT |
Costs, metal prices, recoveries, design criteria and the Mineral Resource model were imported into Deswik Pseudoflow™ software package to generate possible pit limits. A series of nested pits were developed using the PseudoflowTM algorithm. Costs, metal prices, recoveries and design criteria are explained later in this section.
The algorithm began by identifying a pit shell that had a positive value at metal prices that were half the target price. Subsequent runs increased the metal prices by 5% until the target metal prices were reached. This process generated 11 pit shells that were used to identify final pit limits and internal stages for design and scheduling purposes.
Leach metallurgical assumptions were derived from test work and actual historic leach results from the La Arena Mine. Flotation metallurgical assumptions were derived from test work. Refer to Section 13 for more detail about metallurgical test work.
Metallurgical assumptions used for the La Arena II pit optimization are shown in Table 16-8.
Table 16-8: La Arena II Metallurgical Assumptions
| Heap Leach Recovery |
| | Sediments | Porphyry |
| Copper Recovery | 0.0% | 0.0% |
| Gold Recovery | 86.0% | 83.0% |
| Mill Recovery |
| | Sulfide | Supergene | Mixed | Oxide |
| Copper Recovery | 87.6% | 87.6% | 43.8% | 0.0% |
| Gold Recovery | 60.1% | 60.1% | 30.5% | 0.0% |
Smelter terms and transportation charges have been estimated by local brokers and traders based on prevailing rates as well as Tahoe’s experience in Guatemala. Refer to Section 19.
Metal price assumptions, smelter terms and transportation charges are summarized in Table 16-9.
| 114 |
| LA ARENA PROJECT |
| FORM 43-101F1 TECHNICAL REPORT |
Table 16-9: La Arena II Concentrate Inputs
| Metal Prices | | |
| Copper Price | $/lb | $3.30 |
| Gold Price | $/oz | $1,300 |
| Dore | | |
| Payable Au | | 99.9% |
| Selling cost payable Au | $/oz | $12.37 |
| Concentrate | | |
| Cu Grade | % | 23.0% |
| Au Grade | g/t | 9.90 |
| Transportation and Handling | $/wmt | $74.50 |
| Treatment | $/dmt | $85.00 |
| Cu Payable | | 96.5% |
| Au Payable | | 94.0% |
| Cu Refining(1) | $/lb | $0.085 |
| Au Refining(2) | $/oz | $5.00 |
(1) – Per payable lb Cu
(2) – Per payable ounce Au in Cu concentrate
Operating costs were derived using costs from engineering first principles and experience with similar equipment and production rates. Refer to Section 21 for more information. Summary of the pit optimization operating cost assumptions are shown in Table 16-10.
Table 16-10: La Arena II Operating Cost Assumptions
| Process Operating Costs |
| Total Oxide Processing | $/t | $1.15 |
| |
| Mill Operating | $/t | $6.22 |
| General & Administration | $/t | $0.98 |
| Total Sulfide Processing(1) | $/t | $7.20 |
| Mine Operating Costs |
| Mining | $/t | $1.33 |
| Mill elevation | m | 3495 |
| Incremental to depth | $/t/16 m | $0.03 |
(1) Includes supergene, transitional oxide-sulfide and sulfide resources
| 115 |
| LA ARENA PROJECT |
| FORM 43-101F1 TECHNICAL REPORT |
| 16.2.1.3 | Hydrogeology and Hydrology |
A hydrogeological study conducted by Montgomery and Associates, estimated the sulfide pit would encounter an inflow rate of 9.4 liters per second of ground water (Montgomery; 2014). This study also modelled the formation of a post mining pit lake (Montgomery; 2014).
Since this estimate was made on a much smaller pit, Tahoe contracted Piteau Associates USA Ltd., to compile all available hydrologic information and estimate dewatering requirements (Reidel; 2018). The formation of a pit lake was not addressed by Piteau and will need to be evaluated in the next phase of project development. The scope and cost of this work is addressed in Section 26.
Piteau Associates estimated peak dewatering rates ranging from 126 l/s to 227 l/s with an average rate of 177 l/s. This was used as the basis for dewatering capital and operating costs in this study.
Dewatering will be a major component of the La Arena II Project and a critical requirement in order to depressurize wall slopes to meet the design criteria.
Further hydrogeology test programs will be required for the next phase of project development. The scope and cost of this work is addressed in Section 26.
| 16.2.1.4 | Geotechnical Assumptions |
At the request of Rio Alto in 2013, Piteau Engineering Latin America SAC, conducted a geotechnical analysis for the La Arena deposits (Mining Plus; 2015).
These recommendations were for a much shallower pit and those parameters may not be valid for the project presented in this report.
A comprehensive geotechnical evaluation has not been undertaken for the pit configuration in this report, and will be needed for the next phase of project development. The cost and components of this work are addressed in Section 26.
Pit wall assumptions used are shown in Table 16-11.
Table 16-11: La Arena II Wall Slope Assumptions used in Designs
| Slope | Description | Bench
Face
Angle | Bench
Height
meters | Berm
Interval | Berm
Width
meters | Inter-ramp
Angle | Ramp
Width
meters(1) | Overall
Slope
Angle |
| 1 | Sediment | 60 | 16 | 2 | 10.5 | 47.8° | 34.1 | 43.5° |
| 2 | Porphyry | 60 | 16 | 2 | 9.5 | 48.8° | 34.1 | 44.2° |
(1) - Ramp width include berms and ditches
| 16.2.1.5 | Optimization Results |
Summary of Mineral Resources by PseudoflowTMpit shells is shown in Table 16-12. Shell 11 was the basis for the ultimate final designed pit.
| 116 |
| LA ARENA PROJECT |
| FORM 43-101F1 TECHNICAL REPORT |
Table 16-12: La Arena II Whittle Pit Shell Summary Positive Margin
| Shell | Leach
Mt | Leach
Au koz | Mill
Mt | Mill
Au koz | Mill
Cu Mlbs | Waste
Mt | Total
Mt | S/R |
| 1 | 23.3 | 265.2 | 94.5 | 1,004.9 | 968 | 102.2 | 220.0 | 0.9 |
| 2 | 27.7 | 305.5 | 164.9 | 1,578.0 | 1,554 | 216.6 | 409.2 | 1.1 |
| 3 | 33.2 | 354.7 | 227.6 | 2,057.8 | 2,055 | 340.5 | 601.3 | 1.3 |
| 4 | 43.1 | 445.8 | 379.8 | 3,172.8 | 3,275 | 710.6 | 1,133.6 | 1.7 |
| 5 | 47.6 | 485 | 422.4 | 3,482.0 | 3,635 | 860.9 | 1,330.9 | 1.8 |
| 6 | 51.7 | 523.2 | 453.1 | 3,701.3 | 3,892 | 990.1 | 1,495.0 | 2.0 |
| 7 | 55.9 | 557.5 | 496 | 3,976.5 | 4,246 | 1,189.7 | 1,741.6 | 2.2 |
| 8 | 63.5 | 627.2 | 560.3 | 4,401.3 | 4,770 | 1,523.6 | 2,147.4 | 2.4 |
| 9 | 66.3 | 650.9 | 595.7 | 4,646.3 | 5,068 | 1,730.8 | 2,392.8 | 2.6 |
| 10 | 69.7 | 681.2 | 620.5 | 4,811.0 | 5,276 | 1,897.0 | 2,587.2 | 2.7 |
| 11 | 72.7 | 707.8 | 641.9 | 4,952.9 | 5,451 | 2,045.5 | 2,760.2 | 2.9 |
The PEA considers the La Arena II Project open pit to be mined by conventional drill, blast, truck and shovel methods. The mining fleet will consist of 320 tonne class haul trucks, 55 m3 electric cable shovels and 20 m3 wheel loaders. Blasthole drilling will be performed by diesel powered rotary single pass track drills. Rubber tired dozers will take care of cleanup near the shovels. Haul road and dump maintenance will be performed by a fleet of motor graders, track dozers and water trucks.
The design bench height is 16 meters. Double benching will be applied with a catch bench 10.5 meters wide in sediment rock type and 9.5 meters in the porphyry rock type. Inter-ramp wall angles will be 47.8° in sediments and 48.8° in porphyry.
Ramps are designed to be 34 meters wide including berms and ditches with a driving width of 27 meters. The crusher and mill facility will be located between the pit and the leach/tailings facility at the 3495 m elevation.
The crest of the pit ranges from 3578 m elevation on the west side to 3274 m elevation on the east side. The pit bottom elevation is 2476 m. The overall final pit dimensions are 2440 m in length by 2120 m wide.
The La Arena II Project open pit will be developed in three stages. The first stage was designed to deliver the majority of the oxide material to the leach pad earlier in the mine life and at the same time deliver 80,000 tonnes per day to the mill.
Subsequent stages were designed to keep the mill fed at design capacity and minimize the size of stockpiles. Plan views of the three stages of the proposed La Arena II operation are shown in Figure 16-5, Figure 16-6 and Figure 16-7. Cross section view of all stages is shown in Figure 16-8.
| 117 |
| LA ARENA PROJECT |
| FORM 43-101F1 TECHNICAL REPORT |
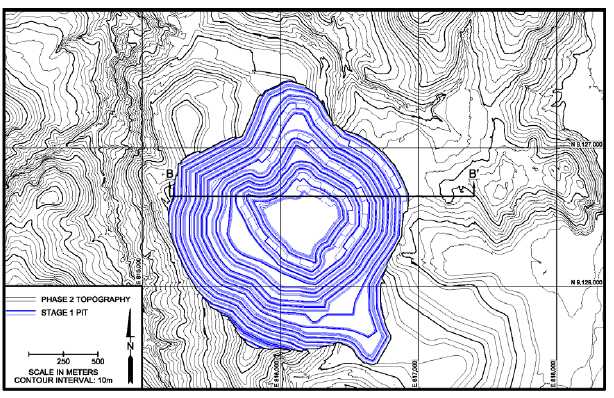
Figure 16-5: La Arena II Stage 1 Pit
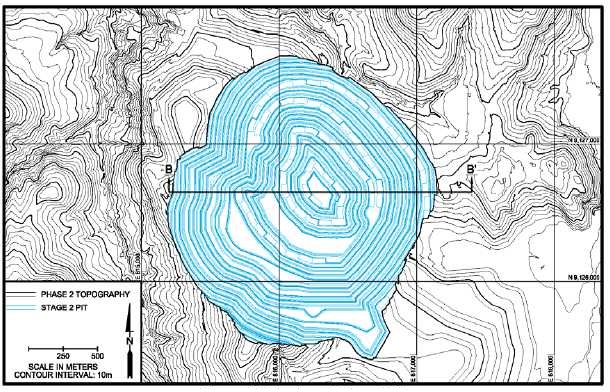
Figure 16-6: La Arena II Stage 2 Pit
| 118 |
| LA ARENA PROJECT |
| FORM 43-101F1 TECHNICAL REPORT |

Figure 16-7: La Arena II Stage 3 Final Pit
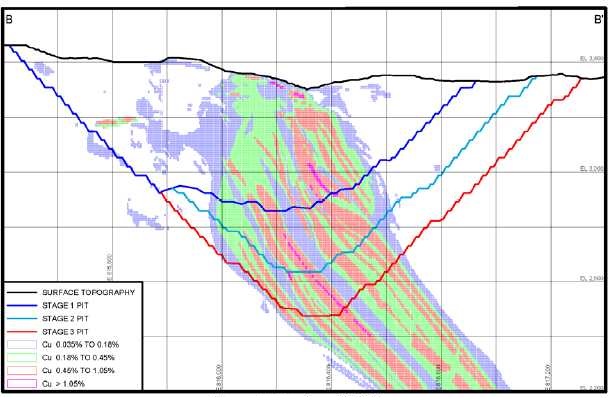
Figure 16-8: La Arena II Pit Stages
| 119 |
| LA ARENA PROJECT |
| FORM 43-101F1 TECHNICAL REPORT |
Non-Acid-Generating (NAG) waste will be used as construction fill material for the process and ancillary facilities, fill for the embankments surrounding the dry stack tailings facilities, and material to encapsulate the Potentially Acid Generating (PAG) waste stored to the west of the pit.
Current mine schedules utilize alteration types to classify waste as PAG or NAG.
Detailed test work of waste material geochemistry, including ABA, humidity cell test, meteoric water mobility tests are required to determine waste rock classification.
| 16.2.4 | Production Schedule |
The production schedule targets a mill design capacity of 80,000 tonne per day. Material would be delivered to the crusher based on “margin” criteria instead of a cut-off grade. Since the actual value of each tonne of material changes depending on rock type and depth in the pit, only blocks with a positive margin were processed.
Mining is scheduled to start approximately 2.5 years before mill start-up. An estimated 23 million tonnes of oxide and 28 million tonnes of sulfide mineral resources will be mined during this period. The oxide material will be sent to the ROM leach facility for processing. The sulfide material will be moved and stored in a stockpile until the mill is in operation. Cut-off grades were not used due to the increasing costs as the pit gets deeper. In addition to the resource mineral moved an estimated 230 million tonnes of waste will be mined.
The life of mine production schedule includes 69 million tonnes of oxide resources and 616 million tonnes of sulfide resources, containing 5.2 billion pounds of copper and 5.4 million ounces of gold. The production schedule is summarized in Table 16-13 through Table 16-14 and Figure 16-9 through Figure 16-11. Mine production is a component of the preliminary economic assessment of the La Arena II Project and includes Inferred Mineral Resources that are considered too speculative geologically to have the economic considerations applied that would enable them to be categorized as Mineral Reserves and there is no certainty that the preliminary economic assessment will be realized.
Table 16-13: La Arena II Mine Production
| Mine Schedule | Measured &
Indicated | Inferred | Total |
|
| Oxide Material Tonnes | M | 33.9 | 35.6 | 69.5 |
| Au grade | g/t | 0.30 | 0.30 | 0.30 |
| Cu grade | % | - | - | - |
| Au contained ozs | k | 328 | 341 | 670 |
| Cu contained lbs | M | - | | - |
| | | | | |
| Sulfide Material Tonnes | M | 600.2 | 16.2 | 616.4 |
| Au grade | g/t | 0.24 | 0.23 | 0.24 |
| Cu grade | % | 0.39 | 0.23 | 0.38 |
| Au contained ozs | k | 4,635 | 119 | 4,754 |
| Cu contained lbs | M | 5,133 | 82 | 5,215 |
| | | | | |
| Total Processed Tonnes | M | 634.1 | 51.8 | 686.0 |
| Au grade | g/t | 0.24 | 0.28 | 0.25 |
| Cu grade | % | 0.39 | 0.23 | 0.38 |
| Au contained ozs | k | 4,963 | 460 | 5,423 |
| Cu contained lbs | M | 5,133 | 82 | 5,215 |
| 120 |
| LA ARENA PROJECT |
| FORM 43-101F1 TECHNICAL REPORT |
Table 16-14: La Arena II Mine Production Schedule
| Mine Schedule | | Total | Year -3 | -2 | -1 | 1 | 2 | 3 | 4 | 5 | 6 | 7 | 8 | 9 |
| Oxide Tonnes | M | 69.5 | 5.4 | 9.8 | 7.7 | 8.2 | 8.9 | 7.7 | 7.8 | 7.2 | 5.9 | 0.7 | 0.0 | - |
| Au grade | g/t | 0.30 | 0.19 | 0.23 | 0.25 | 0.27 | 0.35 | 0.35 | 0.35 | 0.36 | 0.35 | 0.25 | 0.13 | - |
| Cu grade | % | - | - | - | - | - | - | - | - | - | - | - | - | - |
| Au ozs | k | 669.5 | 33.9 | 72.5 | 62.4 | 70.9 | 101.0 | 85.3 | 89.2 | 81.9 | 65.9 | 5.3 | 0.2 | - |
| Cu lbs | M | - | - | - | - | - | - | - | - | - | - | - | - | - |
| | | | | | | | | | | | | | | |
| Sulfide Tonnes | M | 616.4 | 0.4 | 14.5 | 14.2 | 25.4 | 28.3 | 28.9 | 28.6 | 28.6 | 33.4 | 27.3 | 24.3 | 28.5 |
| Au grade | g/t | 0.24 | 0.13 | 0.17 | 0.29 | 0.29 | 0.31 | 0.28 | 0.25 | 0.24 | 0.25 | 0.24 | 0.25 | 0.27 |
| Cu grade | % | 0.38 | 0.24 | 0.37 | 0.39 | 0.37 | 0.41 | 0.37 | 0.35 | 0.35 | 0.38 | 0.38 | 0.42 | 0.38 |
| Au ozs | k | 4,753.7 | 1.5 | 80.4 | 133.2 | 239.3 | 281.1 | 264.6 | 233.3 | 216.9 | 269.1 | 214.2 | 197.3 | 249.1 |
| Cu lbs | M | 5,214.7 | 1.9 | 116.8 | 120.9 | 208.9 | 253.6 | 235.8 | 217.6 | 219.3 | 279.8 | 228.5 | 224.7 | 238.3 |
| | | | | | | | | | | | | | | |
| Total Tonnes Processed | M | 686.0 | 5.8 | 24.3 | 21.9 | 33.6 | 37.2 | 36.5 | 36.4 | 35.8 | 39.2 | 27.9 | 24.3 | 28.5 |
| Au grade | g/t | 0.25 | 0.19 | 0.20 | 0.28 | 0.29 | 0.32 | 0.30 | 0.28 | 0.26 | 0.27 | 0.24 | 0.25 | 0.27 |
| Cu grade | % | 0.38 | 0.24 | 0.37 | 0.39 | 0.37 | 0.41 | 0.37 | 0.35 | 0.35 | 0.38 | 0.38 | 0.42 | 0.38 |
| Au ozs | k | 5,423.2 | 35.3 | 152.9 | 195.5 | 310.2 | 382.1 | 349.8 | 322.5 | 298.7 | 335.0 | 219.5 | 197.5 | 249.1 |
| Cu lbs | M | 5,214.7 | 1.9 | 116.8 | 120.9 | 208.9 | 253.6 | 235.8 | 217.6 | 219.3 | 279.8 | 228.5 | 224.7 | 238.3 |
| | | | | | | | | | | | | | | |
| Total Waste Tonnes | M | 1,997.8 | 76.8 | 101.7 | 85.8 | 93.0 | 84.3 | 64.1 | 61.1 | 62.3 | 87.0 | 103.4 | 108.2 | 103.6 |
| Total Mined Tonnes | M | 2,683.7 | 82.6 | 126.0 | 107.7 | 126.7 | 121.5 | 100.7 | 97.5 | 98.1 | 126.3 | 131.3 | 132.6 | 132.0 |
| SR | M | 2.9 | 13.3 | 4.2 | 3.9 | 2.8 | 2.3 | 1.8 | 1.7 | 1.7 | 2.2 | 3.7 | 4.4 | 3.6 |
| Mine Schedule | Year 10 | 11 | 12 | 13 | 14 | 15 | 16 | 17 | 18 | 19 | 20 | 21 |
| Oxide Tonnes | M | - | - | 0.0 | 0.2 | - | - | - | - | - | - | - | - |
| Au grade | g/t | - | - | 0.14 | 0.21 | - | - | - | - | - | - | - | - |
| Cu grade | % | - | - | - | - | - | - | - | - | - | - | - | - |
| Au ozs | k | - | - | 0.0 | 1.1 | - | - | - | - | - | - | - | - |
| Cu lbs | M | - | - | - | - | - | - | - | - | - | - | - | - |
| | | | | | | | | | | | | | |
| Sulfide Tonnes | M | 24.3 | 35.1 | 28.5 | 28.5 | 28.6 | 28.3 | 27.8 | 28.8 | 28.9 | 29.2 | 29.2 | 17.1 |
| Au grade | g/t | 0.24 | 0.18 | 0.23 | 0.23 | 0.24 | 0.26 | 0.16 | 0.17 | 0.22 | 0.24 | 0.26 | 0.23 |
| Cu grade | % | 0.34 | 0.31 | 0.37 | 0.41 | 0.43 | 0.47 | 0.32 | 0.32 | 0.39 | 0.43 | 0.46 | 0.44 |
| Au ozs | k | 185.0 | 205.5 | 214.2 | 208.8 | 220.2 | 235.7 | 143.5 | 161.7 | 200.6 | 227.8 | 241.8 | 129.1 |
| Cu lbs | M | 183.4 | 236.9 | 231.6 | 260.8 | 268.7 | 292.1 | 198.1 | 206.5 | 249.1 | 276.4 | 297.9 | 167.1 |
| | | | | | | | | | | | | | |
| Total Tonnes Processed | M | 24.3 | 35.1 | 28.5 | 28.7 | 28.6 | 28.3 | 27.8 | 28.8 | 28.9 | 29.2 | 29.2 | 17.1 |
| Au grade | g/t | 0.24 | 0.18 | 0.23 | 0.23 | 0.24 | 0.26 | 0.16 | 0.17 | 0.22 | 0.24 | 0.26 | 0.23 |
| Cu grade | % | 0.34 | 0.31 | 0.37 | 0.41 | 0.43 | 0.47 | 0.32 | 0.32 | 0.39 | 0.43 | 0.46 | 0.44 |
| Au ozs | k | 185.0 | 205.5 | 214.2 | 209.8 | 220.2 | 235.7 | 143.5 | 161.7 | 200.6 | 227.8 | 241.8 | 129.1 |
| Cu lbs | M | 183.4 | 236.9 | 231.6 | 260.8 | 268.7 | 292.1 | 198.1 | 206.5 | 249.1 | 276.4 | 297.9 | 167.1 |
| | | | | | | | | | | | | | |
| Total Waste Tonnes | M | 107.6 | 128.3 | 133.6 | 140.0 | 139.9 | 140.0 | 131.1 | 27.7 | 10.2 | 5.1 | 2.1 | 0.8 |
| Total Mined Tonnes | M | 131.9 | 163.3 | 162.2 | 168.7 | 168.4 | 168.3 | 158.9 | 56.5 | 39.1 | 34.3 | 31.3 | 18.0 |
| SR | | 4.43 | 3.66 | 4.68 | 4.88 | 4.90 | 4.95 | 4.72 | 0.96 | 0.35 | 0.17 | 0.07 | 0.05 |
| 121 |
| LA ARENA PROJECT |
| FORM 43-101F1 TECHNICAL REPORT |

Figure 16-9: La Arena II Material Movement by Year

Figure 16-10: La Arena II Leach and Mill Movement by Year
| 122 |
| LA ARENA PROJECT |
| FORM 43-101F1 TECHNICAL REPORT |
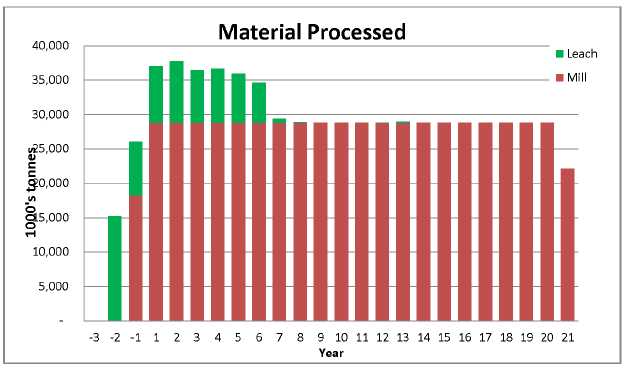
Figure 16-11: La Arena II Leach and Mill Process by Year
| 16.2.5.1 | Drilling and Blasting |
Blasthole drilling will be carried out by three single pass diesel rotary drills. Average useful life of drills will be 60,000 operated hours.
The production blast pattern used to estimate costs in this study was 7 meters by 8 meters on a 16-meter bench with 3 meters sub drill. ANFO will be used for a powder factor of 0.44 kg/m3.
Explosives will be delivered, loaded to the borehole and initiated by a supplier. Drilling and blasting will be supervised by the drill and blast foreman.
The loading fleet will consist of two 55 m3 electric rope shovels as the main production units with one 20 m3 rubber tired front-end loader for cleanup and mining drop cuts. The average useful life of the loader will be 60,000 hours and the shovels will be life of operation.
The haulage fleet will consist of 320 tonne rock trucks that will haul mill, leach and waste material. The fleet will consist of 22 haulage units by Year -2 and peak at 46 units by Year 16. Average useful life of haulage units will be 100,000 operate hours.
| 123 |
| LA ARENA PROJECT |
| FORM 43-101F1 TECHNICAL REPORT |
| 16.2.5.4 | Support Equipment |
The major support fleet will include two-wheel dozers, four track dozers, four motor graders and four water trucks. Smaller support equipment was not itemized but 10% of estimated mining equipment capital costs were included to cover remaining support equipment.
Detail of major mining equipment is shown in Table 16-15 and Table 16-16.
Table 16-15: La Arena II Major Equipment Initial Purchase
| Initial | Units |
| Shovels | 2 |
| Loaders | 1 |
| Drills | 3 |
| Haul Trucks | 22 |
| Tired Dozers | 2 |
| Track Dozers | 4 |
| Motor Graders | 4 |
| Water Trucks | 4 |
Table 16-16: La Arena II Major Equipment Sustaining Purchase
Sustaining | Units | Year |
| 8 | 9 | 10 | 11 | 12 | 13 | 14 | 15 | 16 | 17 | 18 |
| Shovels | - | - | - | - | - | - | - | - | - | - | - | - |
| Loaders | 1 | - | - | - | - | - | 1 | - | - | - | - | - |
| Drills | 6 | 3 | - | - | - | - | - | - | - | - | - | 3 |
| Haul Trucks | 44 | - | - | - | 8 | 8 | 8 | 8 | 4 | 8 | - | - |
| Tired Dozers | 4 | 2 | - | - | - | - | - | - | - | - | - | 2 |
| Track Dozers | 6 | 3 | - | - | - | - | - | - | - | - | - | 3 |
| Motor Graders | 8 | 4 | - | - | - | - | - | - | - | - | - | 4 |
| Water Trucks | 8 | 4 | - | - | - | - | - | - | - | - | - | 4 |
| 124 |
| LA ARENA PROJECT |
| FORM 43-101F1 TECHNICAL REPORT |
| 17.1 | LA ARENA MINE EXISTING FACILITY |
La Arena Mine is currently exploiting the oxide gold Mineral Reserves by open pit methods using conventional drill/blast, load and haul methods. Ore is truck dumped onto leach pads with no crushing or agglomeration required prior to leaching. La Arena S.A. reports average gold recovery of 86% to date. Figure 17-1 is the overall flowsheet of the process.
The operation has a capacity of 40,000 tonnes per day, using 90 tonne trucks to haul run-of-mine ore to the leach pad, and one Caterpillar D6T dozers to spread the ore. The side slopes of the heap are covered with HDPE to control influx of rain water for proper water balance.
Cyanide leach solution is applied by drip emitters at a rate of 0.175 kg per tonne of ore. Pregnant solution is collected in a 73,000 m3 pregnant solution pond, from which it is pumped to the ADR plant for gold recovery.
The ADR plant begins with 35 carbon adsorption columns, 2.82 m diameter by 3.75 m height that are operated in parallel in five circuits. Two other carbon columns, 2.1 m diameter by 2.7 m height, are run in series to scavenge gold from solution that is bled to the effluent treatment plant through the clarification circuit.
The target gold loading on carbon is 4,000 to 6,000 g per tonne. When this target is reached, the loaded carbon is pumped from the carbon adsorption tank to one of two pressure strip vessels (1.42 m diameter, 6.8 m height, capacity of 4 tonnes of carbon per batch), where gold is desorbed into a new cyanide solution using the standard pressure Zadra method. Gold in the new pregnant solution is precipitated as metallic gold by electrolysis, which is accomplished in 8 units of electrowinning cells with a total volume of 12 m3. Gold metal collected in the electrolytic cathodes are finally smelted and molded into bullions.
| 125 |
| LA ARENA PROJECT |
| FORM 43-101F1 TECHNICAL REPORT |

Figure 17-1:SimplifiedProcess FlowDiagram for the La Arena Mine Gold Dump LeachOperation
| 126 |
| LA ARENA PROJECT |
| FORM 43-101F1 TECHNICAL REPORT |
| 17.2.1 | La Arena II Process Description |
The La Arena II Project is a stand-alone project, independent of the La Arena Mine. Should the La Arena II Project be advanced, it would not be as an extension or expansion of the current La Arena Mine operation. With the exception of the ADR plant currently in use, no other process facilities at the La Arena Mine are included in the La Arena II Project mineral recovery facilities.
All oxide material encountered during the mining of La Arena II will be hauled directly to a new leach facility that would be built within the dry stack tailing facility. The current carbon adsorption columns will be relocated adjacent to this new facility. Loaded carbon will be transported from this facility to the current ADR plant for stripping. After stripping the carbon will be transported back to the new leach facility.
The La Arena II sulfide material would be hauled to the crusher. The material will be crushed and ground to liberate Cu and Au for flotation. Comminution begins with a gyratory crusher to crush ROM sulfide material in preparation for semi-autogenous grinding (SAG). The SAG mill discharges to a trommel-vibrating screen combination. The screen oversize is sent to a pebble crusher before being returned to the SAG mill. The SAG mill product is further ground by two ball mills, which are operated in closed circuit with hydrocyclone clusters. The hydrocyclone underflow reports back to the ball mill, while the overflow proceeds to the rougher flotation cells.
Cu is recovered with three stages of flotation: a rougher stage, followed by two stages of cleaning. Concentrate grade is limited to 23% Cu to minimize loss of Au in the tailing with pyrite. Copper concentrate is filtered and shipped to smelters for Cu revenue with gold credits. Copper flotation tailing is further processed by flotation to remove pyrite from the final mill tailing. Mill tailing and the pyrite tailing will be filtered separately and deposited by mobile conveyors to separate storage facilities.
The current process design will be based on metallurgical tests results from ALS Chemex Laboratories in Kamloops, Canada. Figure 17-2 is a simplified schematic diagram of the process for the sulfide plant. This provides the basis for the process description that follows.
| 17.2.2 | La Arena II Process Design Criteria |
Tahoe tasked M3 Engineering to design a process plant for the La Arena II Project with a nameplate capacity of 80,000 tonnes per day. For the design, M3 used an availability factor of 92%, except for the primary crushing area where an availability factor of 75% was used. These design availability factors are common for current and recent projects at M3.
The current mine plan developed for the project is based on a 360-day calendar year. The yearly tonnage is nominally 28.8 million tonnes.
Table 17-1 is a summary of the main components of the process design criteria used for the study.
The mass balance was developed for the La Arena II process using MetSim™ software. The process simulation assumed overall recoveries shown on Table 17-2 for copper and gold.
These recoveries are based on results of locked-cycle flotation tests performed by ALS Chemex Laboratories at Kamloops, Canada. A detailed discussion of these tests can be found in Section 13. The average grades used for the MetSim™ simulation were 0.38% copper and 0.24 g/t gold.
| 127 |
| LA ARENA PROJECT |
| FORM 43-101F1 TECHNICAL REPORT |
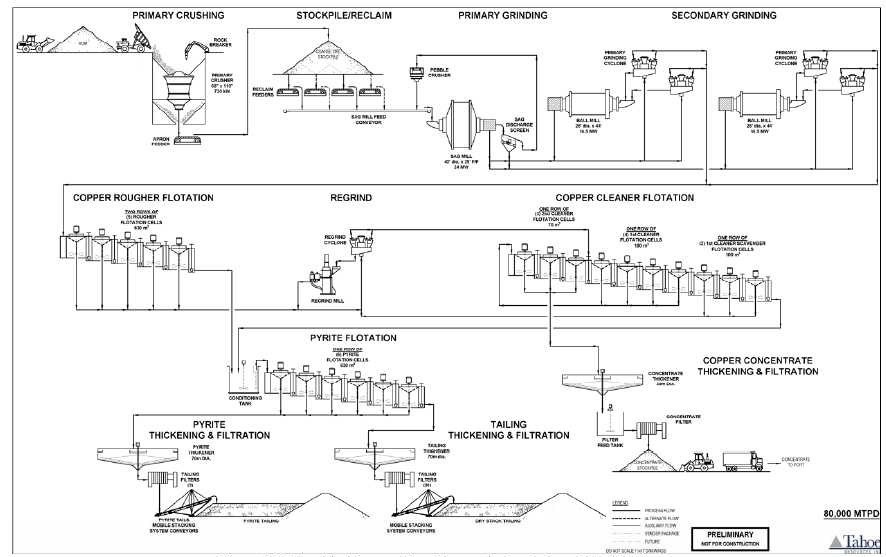
Figure 17-2:SimplifiedProcess FlowDiagram for the La Arena II Sulfide Plant
| 128 |
| LA ARENA PROJECT |
| FORM 43-101F1 TECHNICAL REPORT |
Table 17-1: Process Design Criteria
| DESCRIPTION | DESIGN |
| | |
| Primary Crusher | |
| Feed F80, mm | 423 |
| Product P80, mm | 142 |
| Crushing work index, assumed, kWh/t | 13 |
| | |
| SAG Mill Grinding | |
| Feed F80, mm | 142 |
| Product P80, mm | 1.655 |
| SAG Mill JK Parameters, 80thpercentile | |
| A | 73 |
| b | 1.6 |
| ta | 1.13 |
| | |
| Ball Mill Grinding | |
| Feed F80, microns | 1,655 |
| Product P80, microns | 106 |
| Ball Mill Work Index (80thpercentile), kWh/t | 11.04 |
| | |
| Copper Flotation | |
| Rougher Flotation Time, min | 30 |
| Rougher Flotation % solids | 30 |
| First Cleaner Flotation Time, min | 20 |
| First Cleaner Flotation % solids | 18.7 |
| Cleaner Scavenger Flotation Time, min | 10 |
| Cleaner Scavenger Flotation % solids | 14.9 |
| Second Cleaner Flotation Time, min | 15 |
| Second Cleaner Flotation % solids | 15 |
| | |
| Pyrite Flotation | |
| Flotation Time, min | 24 |
| % Solids | 25 |
Table 17-2: Metallurgical Recovery Assumptions
| Heap Leach Recovery |
| | Sediments | Porphyry |
| Copper Recovery | 0.0% | 0.0% |
| Gold Recovery | 86.0% | 83.0% |
| Mill Recovery |
| | Sulfide | Supergene | Mixed | Oxide |
| Copper Recovery | 87.6% | 87.6% | 43.8% | 0.0% |
| Gold Recovery | 60.1% | 60.1% | 30.5% | 0.0% |
| 17.2.3 | Crushing and Crushed Material Stockpile |
Run-of-mine (ROM) material will be transported by haul trucks from the mine to the primary crusher, and fed to the crusher via a dump pocket with a two-truckload capacity. The primary crusher will be a 60 inch x 110 inch gyratory crusher, with an open side setting of 180 mm (7 inches) and a feed opening of 1,524 mm (60 inches). It will be powered by a 1,000 kW motor. The crushed material will drop into a discharge bin equipped with an apron feeder. The apron feeder will meter material onto a stacking conveyor, which will feed to a coarse material stockpile. The coarse material stockpiles will have equivalent total capacity of about 240,000 tonnes and live capacity of 80,000 tonnes. This is equivalent to about 24 hours of SAG mill feed. Four belt feeders (two operating and two standby) will reclaim crushed material from the stockpile and transfer it onto the SAG mill feed conveyor.
| 129 |
| LA ARENA PROJECT |
| FORM 43-101F1 TECHNICAL REPORT |
The grinding circuit for the La Arena II Project will be a conventional semi-autogenous grinding (SAG) mill-ball mill-pebble crusher (SABC) system. The SAG mill will be in a closed circuit with a pebble screen and a pebble crusher. The ball mills will be in a closed circuit with hydrocyclone clusters.
The SAG feed conveyor will feed ore to the SAG mill, 12.19 m diameter by 7.62 m long, flange-to-flange (40 ft diameter by 25 ft long, flange-to-flange) driven by a 24 MW gearless drive. The SAG mill product will discharge to a trommel and then to a pebble wash screen. The undersize of the trommel and pebble wash screen drops into the cyclone feed pump box. This will constitute fresh feed to two ball mills. It will mix with the discharge from the ball mills and be pumped to four primary cyclone clusters. Pumping will be by four centrifugal pumps with 895 kW variable frequency drives (VFD), with a fifth pump as operating spare.
The cyclone underflows will be fed to two ball mills. Each ball mill measures 7.92 m in diameter by 13.6 m effective grinding length (26 ft diameter x 44.5 ft EGL), powered by a fixed-speed dual-pinion synchronous drive, with each motor rated at 8.2 MW. The cyclone overflows will constitute the product of the grinding circuit and will be fed to the flotation circuit. The target size distribution is 80 percent finer than 106 microns.
The pebbles separated by the pebble wash screen will be collected on the pebble crusher feed conveyor, transported to two pebble crusher feed bins, and crushed by two MP1250 type cone crushers, 1000 kW, at a 13 mm closed-side setting. The crushed pebbles are returned to the SAG mill via the SAG feed conveyor. The pebbles may also bypass the pebble crusher onto a pebble stockpile for further handling, as deemed appropriate.
Flotation of copper in the La Arena II process plant will be accomplished using two banks of rougher flotation cells to achieve recovery, and two stages of cleaning to meet smelter grade requirements.
The cyclone overflow from the grinding circuit will report to the rougher bank feed tanks. Tailing from the rougher banks will report to the flotation tails thickeners.
Rougher concentrates will be sent to one of two 300 kW vertical regrind mills. Both will be in closed circuit with hydrocyclones. Concentrate from each rougher bank will be sent to the corresponding regrind pump box where it will combine with discharge from the regrind mill. From the pump box, the slurry will be pumped to the hydrocyclones for classification. The hydrocyclone underflow will be returned to the regrind mills, while the overflow will flow to the first cleaner flotation circuit. The target particle size distribution for the reground material is 100 percent finer than 25 microns. A circuit bypass will be included such that rougher concentrates can be pumped directly to the first cleaner cells without going through the regrind step.
Two stages of cleaning will upgrade the reground concentrate to meet smelter specifications. In addition, a first cleaner scavenger stage will be installed to produce tailing that can be forwarded to the final flotation tailing without significant loss of sulfide copper.
| 130 |
| LA ARENA PROJECT |
| FORM 43-101F1 TECHNICAL REPORT |
The concentrate of the first cleaner cells will be transferred to the second cleaner flotation circuit while the tails proceed by gravity to the cleaner scavenger flotation circuit. Concentrate from the cleaner scavenger flotation circuit will be sent to the regrind circuit feed. Tailing from the cleaner scavenger circuit will be pumped to the flotation tails thickener.
The concentrate from the second cleaner flotation circuit will be pumped to the concentrate thickener as final concentrate. The tailing from the second cleaner flotation circuit will be recycled to the first cleaner flotation circuit. The sizes and number of the flotation cells that will be installed in the flotation circuit are shown in Table 17-3.
Table 17-3: Flotation Cells
| Stage | Number of Cells | Size of Cells (m3) |
| Rougher | 10 | 630 |
| First Cleaner | 4 | 100 |
| Cleaner-Scavenger | 3 | 100 |
| 2ndCleaner | 6 | 70 |
Reagents to be used in the flotation plant include sodium Hostaflot 3403 as the main collector, Aerophine 3418A as secondary collector, methyl isobutyl carbinol (MIBC) or equivalent as frother, and milk of lime for pH control.
| 17.2.6 | Copper Concentrate Thickening, Filtration and Storage |
Concentrate from the second cleaner flotation circuit will be dewatered in the 30 m diameter concentrate thickener. The thickened concentrate will be pumped to two vertical filter presses, operating in parallel. The filtered concentrate will be conveyed to a concentrate stockpile, from where it will be loaded onto trucks by a front-end loader for shipment to the smelter. Representative samples of the concentrate will be taken prior to shipment for copper, gold, silver, and moisture analysis.
| 17.2.7 | Pyrite Flotation, Thickening and Filtration |
Pyrite will be floated from the copper flotation tailing to mitigate acid-generation from the tailing. Tailing from the copper flotation process may be conditioned with sulfuric acid to lower the pH depending on results of future tests. The conditioned slurry will then be processed in a bank of six 630 m3 rougher flotation cells in series. The concentrate will be thickened and piped to the filtration building near the tailing storage facility. There, the thickened pyrite tailing will be filtered with three horizontal filter presses with 2.5 m by 3.5 m plates. The filtered pyrite tails of about 18% moisture will be deposited by mobile conveyors to a separate lined pyrite storage facility.
More flotation reagent may be required to achieve good recoveries of pyrite. However, very few tests have been conducted to define the flotation parameters. The comprehensive testing program recommended for the next phase of study will include pyrite flotation, thickening and filtration tests.
| 17.2.8 | Tailing Filtration and Storage |
Final mill tailing will be thickened in a 70 m high-rate thickener from a slurry density of 30% solids to about 50 to 55% solids. The thickened tailing will then be piped to the filtration building near the tailing storage facility. There, the thickened tailing will be filtered with 20 horizontal filter presses with 2.5 m x 3.5 m plates. The filtered tails of about 18% moisture will be deposited in the filtered tailing storage facility by mobile stacking conveyors.
| 131 |
| LA ARENA PROJECT |
| FORM 43-101F1 TECHNICAL REPORT |
| 17.2.9 | Reagents and Consumables |
Reagent storage, mixing and pumping facilities will be provided for reagents used in the processing circuits. Table 17-4 below is a list of these reagents.
Table 17-4: Process Reagents and Consumption Rates
| Reagent | Consumption, g/t |
| Hostaflot 3403 | 30 |
| Aerophine 3418A | 3 |
| Methyl Isobutyl Carbinol (MIBC) | 30 |
| Flocculant, concentrate | 15-30 |
| Flocculant, tailing | 15-30 |
| Lime, kg/tonne | 1 |
| Grinding Balls, 125 mm kg/tonne | 1.63 |
| Grinding Balls, 75 mm kg/tonne | 0.113 |
A water balance was developed for the La Arena II Project using MetSim™ modeling software. The La Arena II copper sulfide process plant is projected to require approximately 1,000 m3 per hour of fresh water make-up to sustain its operation. This includes make-up water for mineral processing, dust control, potable water, and evaporation losses. The equivalent fresh water consumption is 0.3 m3 per tonne of ore processed. This is lower than the water consumption from typical operations (approximately 0.5 m3 per tonne) because of better water recovery from tailing filtration.
| 17.2.11.1 | Mobile Equipment |
Table 17-5 lists the mobile equipment that is provided in the project capital cost estimate.
Table 17-5: La Arena II Mobile Equipment List
| Description | QTY | Duty |
| CAT 966 Front-End Loader | 3 | COS, Concentrate, Grinding Media Handling |
| Pick-Up Truck | 10 | Utility |
| Boom Truck, 45’ 10T | 1 | General Maintenance |
| Boom Truck, 50’ 15T | 1 | Water System Maintenance |
| Bob Cats | 3 | General Clean-up |
| Fork Lifts | 3 | Warehouse & General |
| Mobile Hydraulic Crane, 25T | 1 | General Maintenance |
| Mobile Hydraulic Crane, 60T | 1 | General Maintenance |
| Dump Trucks | 2 | General Maintenance |
| Flat-Bed Trucks, 2T | 2 | General Maintenance |
| Track-Type Tractor, CAT D8/D9 | 2 | General Maintenance, Stockpiles |
| Concentrate Trucks | 5 | Concentrate Delivery |
| Fuel Trucks | 2 | Fuel Delivery |
| Delivery Trucks | 2 | Miscellaneous |
| Motor Grader, CAT 140M | 1 | Maintenance |
| Ambulance, 4WD | 1 | Emergency |
| Water Truck (in Mine Equipment) | 1 | Road Maintenance |
| 132 |
| LA ARENA PROJECT |
| FORM 43-101F1 TECHNICAL REPORT |
| 17.2.11.2 | Assay and Metallurgical Laboratories |
Allowances have been made in the capital cost model for the assay and metallurgical laboratory buildings and equipment. Detailed design of both laboratories will be included in the next study.
| 17.2.11.3 | Mill Maintenance |
The cost for a mill maintenance building and maintenance tools have been allocated in the capital cost estimate. The building was assumed to be 76 m long and 40.8 m wide.
| 17.2.12 | Production Estimate |
Table 17-6 is a summary of copper and gold production by operating year. The production statistics are illustrated in Figure 17-3 and Figure 17-4. Metal production is a component of the preliminary economic assessment of the La Arena II Project which includes Inferred Mineral Resources that are considered too speculative geologically to have the economic considerations applied that would enable them to be categorized as Mineral Reserves and there is no certainty that the preliminary economic assessment will be realized.
Table 17-6: Metal Production
| | Leach Pad | | Copper Concentrator | |
| Year | Mtonnes | kOz Au | Mtonnes | Cu Conc
ktonnes | Mlbs Cu | kOz Au |
| -2 | 15.22 | 91.1 | | | | |
| -1 | 7.75 | 53.5 | 18.3 | 227 | 115 | 81 |
| 1 | 8.24 | 60.7 | 28.8 | 363 | 184 | 140 |
| 2 | 8.93 | 86.8 | 28.8 | 386 | 195 | 151 |
| 3 | 7.67 | 73.3 | 28.8 | 375 | 190 | 148 |
| 4 | 7.85 | 76.8 | 28.8 | 369 | 187 | 137 |
| 5 | 7.15 | 70.4 | 28.8 | 380 | 193 | 131 |
| 6 | 5.87 | 56.7 | 28.8 | 417 | 211 | 140 |
| 7 | 0.65 | 4.6 | 28.8 | 415 | 210 | 134 |
| 8 | 0.04 | 0.1 | 28.8 | 446 | 226 | 135 |
| 9 | | | 28.8 | 415 | 210 | 151 |
| 10 | | | 28.8 | 374 | 190 | 127 |
| 11 | | | 28.8 | 336 | 170 | 101 |
| 12 | 0.00 | 0.0 | 28.8 | 403 | 204 | 130 |
| 13 | 0.16 | 0.9 | 28.8 | 453 | 230 | 126 |
| 14 | | | 28.8 | 467 | 237 | 133 |
| 15 | | | 28.8 | 511 | 259 | 143 |
| 16 | | | 28.8 | 354 | 180 | 90 |
| 17 | | | 28.8 | 356 | 181 | 97 |
| 18 | | | 28.8 | 429 | 218 | 120 |
| 19 | | | 28.8 | 471 | 239 | 135 |
| 20 | | | 28.8 | 507 | 257 | 143 |
| 21 | | | 22.1 | 352 | 178 | 96 |
| 133 |
| LA ARENA PROJECT |
| FORM 43-101F1 TECHNICAL REPORT |
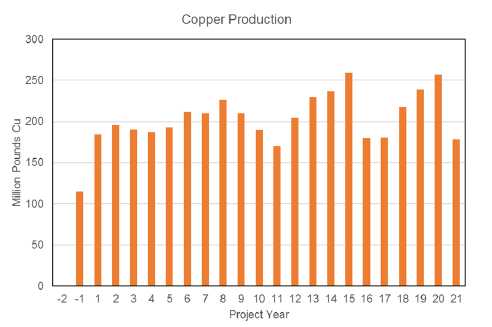
Figure 17-3: Copper Production by Year

Figure 17-4: Gold Production by Source and Year
| 134 |
| LA ARENA PROJECT |
| FORM 43-101F1 TECHNICAL REPORT |
The existing La Arena Mine includes an open pit, a waste rock storage facility, a fully lined leach pad, a lined pregnant liquor solution pond, a lined major events pond (storm water catchment), an ADR processing plant, water treatment plant and sundry facilities including a 600-person camp. Refer to Figure 18-1 for existing La Arena Mine facilities.
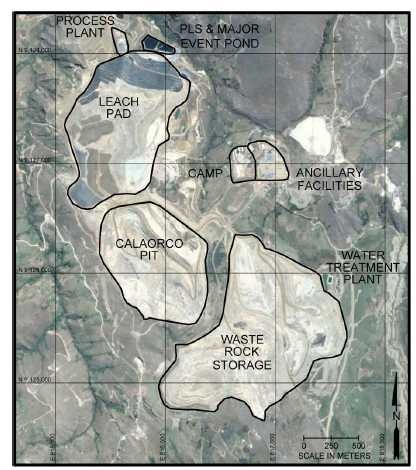
Figure 18-1: Existing La Arena Mine Facilities
Subsequent sections will discuss the existing La Arena Mine infrastructure, followed by discussion of the conceptual infrastructure for the La Arena II Project.
Access to La Arena Mine site is from Trujillo on a national highway that is dual carriage bitumen. There are no tunnels on this route however there are 5 small bridges. Typical weight restriction on these bridges is 45 tonnes unless specific reinforcement is designed and built. This is the same route used to construct Barrick’s Lagunas Norte mine. The La Arena Mine site can also be accessed from Cajamarca on a bitumen and gravel dual carriageway highway.
All construction and operating supplies and materials for the La Arena Mine have been transported from the coast via Trujillo to site by truck.
| 135 |
| LA ARENA PROJECT |
| FORM 43-101F1 TECHNICAL REPORT |
The site power for the La Arena Mine is supplied from the 220 kV national grid to the La Ramada substation built by La Arena S.A. in 2014 and commissioned in October 2014. Power is then distributed by an internal power distribution network supplying 22.9 kV to all facilities. Step down transformers are positioned at each significant installation including the PLS Pond, the offices, the workshop and the warehouse.
La Arena Mine is authorized to pump ground water from three water wells. Water is pumped to an 80 m3 holding tank positioned 200 m from the office buildings. From this tank, water is distributed to the workshop, offices, camp, and kitchen via a potable water filtration system. Water can also be delivered to the oxide processing plant for make-up water. The water quality is good and the pH is neutral.
The design of the existing La Arena Mine leach pads is based on conventional pad technology modified to accommodate the mountainous terrain as is common in Peru. The first seven phases of the pad have been built, commissioned and are in operation. Two more phases are planned over the remaining life of this operation.
All waste material is hauled to the waste rock storage facility located south of the Calaorco pit. Non-Acid Generating (NAG) waste is used to encapsulate the Potentially Acid Generating (PAG) waste.
| 18.1.6 | Surface Water Management |
Meteoric surface water is directed around the facility. Any water that comes into contact with any of the La Arena Mine facilities (Contact Water) is directed to collection ponds where it is recirculated for use in the process or sent to the water treatment facility before being released.
Existing accommodation for the La Arena Mine has been constructed out of prefabricated pressed tin and foam sandwich panels. Materials and construction are suitable for the climatic conditions experienced on site. Individual rooms are set up for two people and are inter-joined by shower and toilet facilities shared between 4 people. Messing is provided in one location with an industrial kitchen capable of producing over 2,500 meals per day. Industrial laundry facilities are also installed with capacity to support a 600-person camp.
| 18.1.7.2 | Offices, Workshops and Storage |
The existing La Arena Mine main offices and satellite office buildings have been constructed from the same material as the accommodation buildings. The workshop and warehouse are steel framed structures with sheet metal roofs. Offices inside the workshop and warehouse are constructed out of the same pressed tin foam sandwich panels as the accommodation blocks. All buildings have been designed with all appropriate storage, containment, drainage controls and are engineered for the storm and wind conditions prevailing on site.
| 136 |
| LA ARENA PROJECT |
| FORM 43-101F1 TECHNICAL REPORT |
Two laboratories are operational at the La Arena Mine site; an assay/analytical laboratory and a metallurgical laboratory. The assay laboratory analyzes all process plant and run of mine samples. The metallurgical laboratory is designed to support the gold oxide project and is operated by La Arena Mine. The assay/analytical laboratory is operated by a third-party Peruvian contractor, CERTIMIN S.A.
| 18.1.7.4 | Fuel and Lubrication |
Current La Arena Mine operations are supported by a fuel facility with a capacity of 120,000 US gallons (454.2 kL) located near the workshop and warehouse facilities. A major Peruvian fuel supplier, Primax, has been contracted to supply fuel for the gold oxide project and to manage the distribution of fuel from the site fuel facility. The fuel farm is built with sufficient spill (contingency) containment for 100% of the total tank capacity. Delivery of fuel is from the port of Salaverry in 9,000 gallon tanker trucks. All lubricants are currently supplied under contract by Mobil. Delivery is by 200 L drums warehoused on site in purpose built containment yards.
A Peruvian explosives company, Exsa S.A., is contracted to supply explosives to site for the La Arena Mine. Exsa fabricates blasting accessories and provides a down-the-hole charging and a technical analysis and monitoring service. The blasting products are trucked to site from Trujillo.
A high explosives storage magazine has been constructed inside the secured industrial area. Detonators, fuses and detonating cord are stored in a bund-protected 20 ft container; boosters are stored in a separate bund-protected 20 ft container. Bulk emulsion is stored in 5 elevated silos, each with a capacity of 60 t and positioned approximately 70 m from the class 1 explosives. Near the silos is a pad for storage of bulk ammonium nitrate.
The blasting agents are transported to the pit and pumped down the hole by a purpose built blasting truck. The blasting truck can produce and deliver down-the-hole three different blasting products; ANFO, Heavy ANFO or gassed emulsion.
The proposed La Arena II Project includes an open pit, a differential flotation processing plant, heap leach pad, dry stack tailing storage facility, lined pyrite tailing storage facility and waste rock storage facility. With the exceptions of the existing ADR plant to process pregnant solution from the new La Arena II heap leach pad and the assay laboratory (which would be relocated), none of the current La Arena Mine facilities will be used for the La Arena II Project.
Figure 18-2 shows an aerial view of the conceptual site infrastructure. Figure 18-3 shows the conceptual process plant infrastructure.
| 137 |
| LA ARENA PROJECT |
| FORM 43-101F1 TECHNICAL REPORT |

Figure 18-2: Overview of La Arena II Conceptual Site Infrastructure
| 138 |
| LA ARENA PROJECT |
| FORM 43-101F1 TECHNICAL REPORT |

Figure 18-3:La Arena II Process Plant Conceptual Infrastructure
Access to the La Arena II Project site is from Trujillo on a national highway that is dual carriage bitumen. There are no tunnels on this route however there are 5 small bridges. Typical weight restriction on these bridges is 45 tonnes unless specific reinforcement is designed and built. This is the same route used to construct the Lagunas Norte project for Barrick. The La Arena II Project site can also be accessed from Cajamarca on a bitumen and gravel dual carriageway highway.
The study envisions a 28.5 km road diversion south of the mine site will be needed early during construction to prevent the public from passing through the mining area and to open up options for waste dumps and other future mine infrastructure.
Power to the La Arena Mine is presently supplied from the 220 kV national grid to the existing La Ramada substation, adjacent to the mine.
The“Comité de Operación Económica del Sistema Interconectado Nacional” (COES SINAC or COES) is the agency that regulates the interconnected electrical power system in Peru. Per preliminary discussion with COES, the existing transmission lines feeding the La Ramada substation have a theoretical capacity of 240 MVA. The La Arena II Project’s new electrical load is envisioned to be 120 MVA.
| 139 |
| LA ARENA PROJECT |
| FORM 43-101F1 TECHNICAL REPORT |
As part of the La Arena II Project, a new 22.9 kV high voltage overhead line from the La Ramada substation would need to be added to provide power to the processing plant site and mine operations.
La Ramada substation would be relocated in Year 14 to allow for continued westward expansion of the waste rock facility.
The make-up water demand for the La Arena II Project would include water for mineral processing, dust control, potable water, and evaporation losses. Most of this water will be used for mineral processing, mainly in the crusher and concentrator. Flotation tailings will be thickened and filtered, with filtrate water returning to the process, thereby minimizing the make-up water required.
Based on work completed to date, processing facilities (with filtered tailings) require approximately 0.3 m3 of make-up water per each tonne of ore processed. The make-up water for La Arena II is estimated to be 280 L/s.
The project envisions an estimated 180 L/s can be supplied by the pit dewatering program. The remaining estimated water needs of 100 L/s will need to be supplied from groundwater sources in the dry season. During the rainy season, captured surface water runoff from the tailings and waste rock will provide the required make-up water. A field investigation will be needed to identify possible sources of water. This program is discussed in Section 26.
| 18.2.4 | Tailings, Heap Leach Pad and Waste Rock Dumps |
The proposed location of the tailings facilities, heap leach pad, and waste rock dumps are to the south and west of the open pit and mill site. There will be two tailings facilities: one for acid generating tailings (pyrite tailings); and one for non-acid generating tailings. The lined acid-generating tailings facility will be upgradient and to the west of the much larger non-acid generating tailings facility. The heap leach pad will be within the footprint of the overall tailings facility, will be operated for approximately the first nine years of mine life, and ultimately will be fully surrounded and covered by non-acid generating tailings after rinsing of the heap has been completed.
The waste rock generated from the La Arena II Project will consist of non-potential acid generating (NAG) material to PAG material. The non-PAG to low-PAG materials will be utilized to encapsulate the PAG material in the surface waste rock storage facility (WRSF). Detailed test work of waste material geochemistry, including ABA, humidity cell test, meteoric water mobility tests are required to determine waste rock classification. This test work is discussed in Section 26.
Large embankments of NAG waste rock will be constructed around the perimeter of the tailings facilities to provide for stability and tailings containment. The waste rock embankments will be located primarily along a series of natural ridges that form the primary valley that constitutes the tailings facilities. These ridges are of bedrock and constitute solid foundations for the embankments.
On the east side of the non-acid generating tailings facility is an opening from the tailings valley, just west of Rio Yamabomba. This opening is where the highest rockfill embankment (150 meters) will be constructed. Foundation preparation in the opening will include stripping of softer surficial materials and possibly installation of wick drains and/or drainage measures into the underlying clay, silt, and sand deposits. The drainage will expedite consolidation of the foundations.
| 140 |
| LA ARENA PROJECT |
| FORM 43-101F1 TECHNICAL REPORT |
The waste rock will be dumped in 15 to 25 m lifts to form a low sloped embankment. A filter zone of screened gravel and sand will be placed on the upstream side of the embankment to control potential piping of the tailings through the embankment. As needed, basal drains will be installed at the base of the embankments. At low points along the embankments, seepage will be collected, returned for process reuse, or discharged offsite with treatment, as necessary.
Tailings and pyrite thickener underflows will be pumped to the tailings filter building located alongside and to the west of the tailings storage facility. Filtrate will be returned to the process plant.
The non-acid generating thickened tailings will be filter pressed and conveyed to the tailings reservoir formed by the perimeter rockfill embankments. They will be placed in layers via a mobile conveying stacking system and allowed to drain and dewater. The placement of subsequent lifts of tailings will further consolidate the tailings, dewater them, and render them dilative.
The top surface of the filtered tailings will be sloped to an operational pond to capture precipitation runoff and allow for pump back to the plant site process water pond for reuse. Seepage from the tailings and pool will be primarily downward and eastward semi-horizontally to the large embankment at the east side of the reservoir. It is anticipated that all groundwater seepage will be to the east opening between the natural ridges, where the highest part of the embankment is constructed.
The acid generating thickened tailings will be filter pressed and conveyed to the pyrite tailings facility surrounded by rockfill embankments. The reservoir will be lined and drained to the eastern perimeter rockfill embankment. The tailings will be placed in layers via a mobile conveying stacking system and allowed to drain and dewater. The upper surface will be inclined to an operational pond to capture precipitation runoff for process reuse.
Depending on topography, there will be non-contact surface water diversion trenches upgradient of the facilities, primarily along the south west and south perimeters.
The tailings facilities would be designed such that the consequences of failure will not impact areas downgradient of the facilities. The rockfill perimeter embankments provide for both static and seismic stability. Seepage is controlled by filters and drains. Water management is facilitated by the use of filter-pressed tailings and the ability to direct runoff to small collection pools. Collection of seepage primarily at the east opening provides for control of groundwater seepage from the tailings facilities area.
The outer slopes will be concurrently reclaimed and vegetated as the tailings and waste rock advances, allowing for surface water runoff directly to native streams. At closure, the top surface of the tailings will be graded, covered if necessary, and vegetated. The outer face of the rockfill will be left as-is. It is anticipated that with time the upper surface of rockfill will develop its own climax vegetation as a result of rock degradation and infilling of void by windblown soils. The closed facilities will thus become a stable geomorphic feature of the landscape.
| 18.2.5 | Surface Water Management |
Allowances have been included in the cost estimates for contact surface water management including ponds, treatment plant, pumping and piping from the pit, waste rock, tailings and plant site areas.
Runoff water from these areas will flow through sediment ponds, discharging into the process water pond for reuse, or discharged offsite with treatment, as necessary.
Refer to Figure 18-4 for general operational control of surface contact waters. Runoff collection pond locations will vary through the mine life.
| 141 |
| LA ARENA PROJECT |
| FORM 43-101F1 TECHNICAL REPORT |
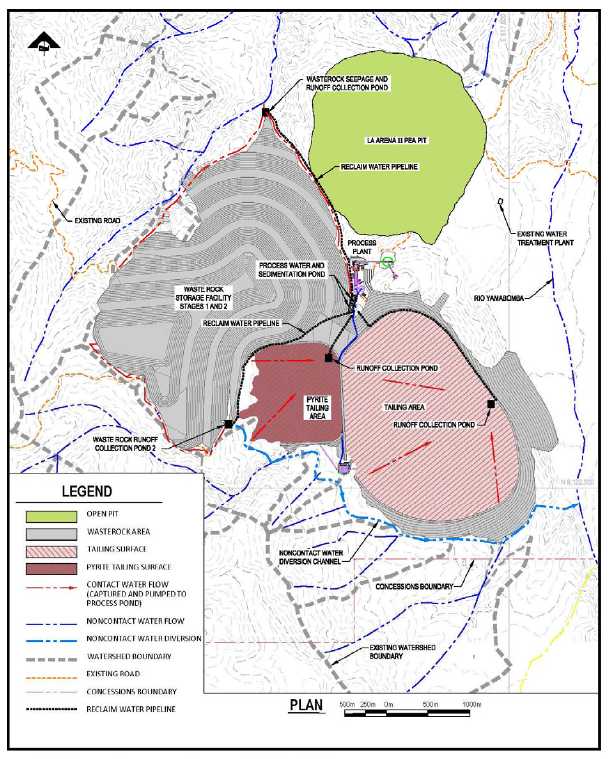
Figure 18-4: General Surface Contact Water Control
| 142 |
| LA ARENA PROJECT |
| FORM 43-101F1 TECHNICAL REPORT |
A new camp will be constructed for the La Arena II Project construction workforce. The new camp will be suitable for La Arena II operations personnel.
| 18.2.6.2 | Offices, Workshops, and Storage |
New offices, warehouses and workshops will need to be constructed for La Arena II Project as envisioned in this study.
For La Arena II, the existing assay laboratory will be relocated and expanded. A new metallurgical (flotation) laboratory would also be added.
| 18.2.6.4 | Fuel and Lubrication |
For La Arena II, a new fueling facility will be designed and constructed to handle the larger mining equipment. The PEA envisions the current Peruvian fuel supplier, Primax, will be contracted to supply and manage the distribution of fuel from the site fuel facility.
The current La Arena Mine contracts a Peruvian explosives company, Exsa S.A., to supply explosives and blasting services. The blasting products are trucked to site from Trujillo. This study envisions a similar relationship for the La Arena II Project.
| 143 |
| LA ARENA PROJECT |
| FORM 43-101F1 TECHNICAL REPORT |
| 19 | MARKET STUDIES AND CONTRACTS |
The La Arena oxide gold mine produces gold and minor amounts of silver in the form of doré bars. The average gold and silver grades of the doré are approximately 82% and 6%, respectively, with the remaining 12% grade consisting primarily of iron and copper. Doré produced from La Arena Mine is refined by Metalor Technologies S.A. at their facility in Marin, Switzerland. Refining costs for the remaining production from the La Arena Mine are estimated to be approximately $5.80 per ounce of gold refined.
Pursuant to construction financing arrangements entered into by Rio Alto, all of the La Arena Mine production from the Calaorco and Ethel oxide breccia bodies as defined in the 2010 Technical Report authored by Coffey Mining Pty Ltd Limited (Coffey Mining, 2010) on behalf of Rio Alto Mining Limited, was committed to a third-party bullion trader via an off-take arrangement. The third-party has the right to choose any single day’s London Bullion Market Association (LBMA) or COMEX settlement price between the transfer and payment dates as defined in the agreement. The pricing window is effectively a five-day period triggered with transfer to the buyer’s account at the refinery.
The requirements of the off-take arrangement are complete when the Calaorco oxide reserve is exhausted in 2021 and residual leaching is completed. The off-take arrangement associated with the prior financing is not applicable to the Company’s La Arena II Project.
Overall, 2017 supply and demand was considered to be relatively in balance, though the year-end copper price was higher than anticipated at $7,157 per tonne ($3.25 per pound). Production from anticipated mine expansions are expected to affect the market in 2018 and 2019, which may negatively impact prices in the short term. Beginning in 2020, prices are expected to see significant recovery which will result in reactivation of idled capacity and incremental expansions at existing operations. Long lead times required to bring on new production will contribute to supply deficits, further supporting long-term prices which will eventually encourage development of greenfield projects. However, once new supply begins to reach the market in 2025 and beyond, deficits are expected to be reduced, causing prices to level off. Long-term incentive pricing projected by analysts such as Wood McKenzie (2017) is anticipated near $7,275 per tonne ($3.30 per pound).
Realized terms for concentrates (treatment and refining charges (TCRC’s), as well as penalties) will ultimately depend upon world-wide mine production and smelter capacity. Long term TCRC’s have been estimated at $85 per dry metric tonne (dry tonne) of concentrate and $0.085 per payable pound of copper. Expected concentrate quality derived from simulation and prior metallurgical testing conducted on the La Arena II mineralization is well within quality ranges acceptable to smelters. Copper in concentrate has been modeled at 23% and gold content at 9.85 grams per tonne (g/t). Arsenic and other deleterious element content is expected to be negligible and no penalties have been contemplated in the La Arena II Project models. Concentrate quality will need to be confirmed by further metallurgical testing followed by pilot plant testing which will provide samples for smelter analysis.
There are no commercial contracts in place for planned production. Tahoe anticipates leveraging its relationships with smelters and traders to sell concentrates. Early phase doré production will be sold to banks and traders. Marketing of concentrates and doré is not anticipated to present undue challenges to the project.
Concentrate shipments are anticipated to be made through the port of Salaverry, near Trujillo. Transportation charges have been estimated by local brokers and traders based on prevailing rates as well as Tahoe’s experience in Guatemala. Port storage capacity and freight rates should be confirmed as part of further project studies. Table 19-1 summarizes the concentrate specifications used for the La Arena II PEA.
| 144 |
| LA ARENA PROJECT |
| FORM 43-101F1 TECHNICAL REPORT |
Table 19-1: La Arena II PEA Concentrate Specifications
| Copper Grade of Concentrate (%) | 23.0% |
| Gold Grade of Concentrate (g/t) | 9.90 |
| Payable Copper in Concentrate | 96.5% |
| Payable Gold in Concentrate | 94.0% |
| Treatment Charges ($/tonne concentrate) | $85.00 |
| Copper Refining Charges ($per payable pound in concentrate) | $0.085 |
| Combined TCRC ($per payable pound of copper in concentrate) | $0.276 |
| Au Refining Charges (per payable ounce in concentrate) | $5.80 |
| Transportation and Handling ($/wet tonne) | $74.50 |
| 145 |
| LA ARENA PROJECT |
| FORM 43-101F1 TECHNICAL REPORT |
| 20 | ENVIRONMENTAL STUDIES, PERMITTING AND SOCIAL OR COMMUNITY IMPACT |
Tahoe is dedicated to the highest standards of environmental stewardship and responsible management of effluents and waste generated from our operations. We align our policies and practices with international guidelines, and strive to meet or exceed Peruvian regulations. The Company is committed to minimizing long-term impacts through responsible environmental management.
Tahoe has established a comprehensive Environmental Management Plan that is based on North American practices and regulations. The operating plan at the La Arena Mine includes the mandate that the mine operations meet or exceed the Company’s Environmental Management Plan. The Company’s environmental management plan includes regular and systematic monitoring of air quality, surface water quality, groundwater quality, stream sediment geochemistry, blast vibration, noise levels, acid rock drainage, waste disposal practices, reagent handling and storage, and concurrent reclamation practices and progress.
| 20.1.1 | Environmental Impact Assessments |
The General Mining Law of Peru is the primary body of law with regard to the environmental regulation of exploration and mining activities. The General Mining Law is administered by the Ministry of Energy and Mines (MEM). A detailed description of Peru’s environmental regulations is found on the MEM website at www.minem.gob.pe. Depending on the level of project development, MEM requires exploration and mining companies to prepare an environmental impact study based on the level of environmental risk of the project as determined by MEM:
Environmental Impact Statement (EIA) Category I – Projects that are not expected to cause significant impacts to the environment. An EIA is generally approved for mineral exploration programs with less than 40 drill platforms within a ten hectare area.
Environmental Impact Study Semi-Detailed (EIAsd) Category II – Projects that may cause moderate negative impacts on the environment. Exploration programs with more than 40 drill platforms, exploration areas greater than ten hectares, and excavation of more than 50 meters of underground development normally require the titleholder to submit and EIAsd.
Environmental Impact Study Detailed (EIAd) Category III– Projects that have the potential to cause significant quantitative or qualitative negative impacts to the environment. The La Arena Mine operates under an EIAd.
The EIAd must incorporate planned expenditure on environmental programs at a rate that is no less than one percent of the value of annual production of the planned operation. The approval of the EIAd does not authorize the start of mine development, exploitation or processing activities. Titleholders are required to receive a series of permits, licenses, authorizations and approvals as required by national law, as summarized in Section 4.6 and Section 20.2 of this report.
Mining companies are subject to annual environmental audits of operations by the Organismo de Evaluación y Fiscalización Ambiental (OEFA). The General Mining Law has in place a system of sanctions or financial penalties that can be levied against a mining company which is not in compliance with the environmental regulations.
The La Arena Mine operates under an approved EIAd, originally approved in 2010, and includes commitments regarding water quality, air quality, and sound level monitoring as well as social management programs. The original EIAd has been periodically modified to accommodate leach pad and waste rock dump expansions. In 2017, the third modification to the EIAd was approved to increase the production rate from 36,000 to 46,000 tonnes of ore per day.
| 146 |
| LA ARENA PROJECT |
| FORM 43-101F1 TECHNICAL REPORT |
La Arena S.A. is in the preliminary stages of preparing the fourth modified EIAd to accommodate the remainder of the current oxide mine life.
Baseline studies conducted for the La Arena EIAd included all physical, biological and social aspects related to the construction and operation of the La Arena Mine. Studies included:
| | • | Meteorology and Climate |
| | • | Air Quality |
| | • | Noise and Vibration |
| | • | Geomorphology |
| | • | Geology |
| | • | Soils and Land Use |
| | • | Hydrology and Hydrogeology |
| | • | Sediment Geochemistry |
| | • | Flora and Fauna |
| | • | Hydrobiology |
| | • | Archaeology |
| | • | Landscape |
| | • | Traffic |
| | • | Environmental Liabilities |
The La Arena Mine EIAd determined that the project will have some impacts on the environment as a result of normal operation activities, although with the implementation of the designed mitigation measures and good environmental management practices, the environment will recover during the years following closure.
Rio Alto received approval of a modified EIAd in 2013 that included their proposed copper-gold sulfide project, which was, for the most part, situated inside of the current EIA boundary. While that EIAd is still valid, it is insufficient for the La Arena II Project as presented in this study, thus no environmental impact study has been completed for the La Arena II Project. Either a new EIAd or modified EIAd will be required to advance the La Arena II Project to accommodate the expanded project footprint relative to the current EIAd. Environmental baseline and impact studies related to the La Arena II Project will need to be expanded beyond the current level required for the La Arena Mine.
| 20.1.2 | Site Monitoring and Environmental Mitigation Measures |
La Arena S.A. conducts ongoing environmental monitoring programs as committed to in the EIAd environmental management plan that includes air quality (particulate matter and greenhouse gas emissions), surface water and groundwater quality, sedimentation and sediment geochemistry, noise levels, and sound pressure (vibration) monitoring. Frequency of reporting to the authorities – MEM, Organismo de Evaluación y Fiscalización Ambiental (OEFA) and the Ministry of Agriculture – is quarterly and biannual in the case of biological monitoring.
Meteoric surface water is directed around the La Arena Mine facility. Stormwater that comes into contact with the industrial facilities is directed to collection ponds where it is recirculated for use in the heap leaching process or sent to the water treatment facility, if necessary, before being released to the environment. La Arena S.A. employs the extensive use of HDPE ‘raincoats’ to cover leach pads to prevent stormwater from coming into contact with, and infiltrating, the leach pads.
A portion of the waste rock mined from the Calaorco pit has demonstrated the potential to generate acidic effluent. As part of the waste dump operational plan, waste rock with acid generating potential (as determined by sulfur content) is encapsulated non-acid generating waste rock. Effluent from the waste dump is collected and treated prior to use as dust suppression within the industrial site. Given the sulfidic nature of the porphyry-hosted mineralization at the La Arena II Project, it is likely that a portion of the waste rock and tails will be acid generating, though efficient removal of pyrite during the differential flotation process will greatly reduce the ability of the tails to generate acidic effluent. Further study is needed to fully characterize the waste rock and tails chemistry.
| 147 |
| LA ARENA PROJECT |
| FORM 43-101F1 TECHNICAL REPORT |
La Arena S.A. conducts concurrent reclamation whenever possible by grading, contouring, and vegetating disturbed areas that are no longer necessary for use at the operation.
Specific site monitoring and environmental mitigation programs would be developed for the La Arena II Project.
| 20.1.3 | Environmental Risks |
As with many mining projects, there are environmental risks associated with the operation of the La Arena Mine, particularly the potential for acid rock drainage, impaired discharge water quality, and amount of water discharged during the rainy season. These risks are mitigated by the implementation of sound environmental practices and adherence to the environmental management programs put in place by the Company and the Peruvian authorities.
The General Mining Law requires titleholders of mineral concessions to receive approval for all aspects of their operations; the primary permits, licenses and authorizations required for development, exploitation and processing activities include:
| | • | Mining Plan Authorization; |
| | • | Operations Permit; |
| | • | Beneficiation Concession (processing license); |
| | • | Water Usage Permit; |
| | • | Water Discharge Permits (industrial and domestic wastewater discharge); |
| | • | Certificate for the Inexistence of Archeological Remains; |
| | • | Mine Closure Plan; |
| | • | Explosive Storage Authorization; |
| | • | Authorization for the Operation of Fuel Storage Facilities; |
| | • | Authorization for the Use of Industrial Chemicals; and |
| | • | Authorization for the Operation of Telecom Services. |
All required permits, licenses and authorizations necessary to operate the La Arena Mine are current and in good standing. As the La Arena II Project is in a conceptual stage, no permit applications have been filed.
Tahoe is committed to making positive sustainable economic impacts in the communities in which we operate. Sustainable and successful mining operations means generating economic value through 1) economic rigor and financial discipline; 2) ethical local recruitment and local procurement practices; and 3) prioritizing economic benefits and development for neighboring communities. La Arena S.A. strives to fill needed employment positions from local and regional communities. As of the end of 2017, 59% of employees were from La Libertad department.
Perú’s strategic investment priorities include nutrition, education, agriculture, water and health infrastructure, and projects that stimulate the local economy and capacity development, particularly towards increasing female participation in the Company’s mining activities. The social investment programs at the La Arena Mine (some in conjunction with communities surround the Company’s Shahuindo Mine) focus on opportunities to increase community development.
| 148 |
| LA ARENA PROJECT |
| FORM 43-101F1 TECHNICAL REPORT |
Nutrition and Hygiene Programs
| • | Healthy Homes Program: La Arena S.A. has successfully implemented a three-year program in 14 villages intended to teach families how to improve health and nutrition by establishing healthy environments and building healthy eating habits. The program highlights the importance of proper health and sanitation techniques, including garbage disposal, food storage, handwashing, and separation of living spaces such as the kitchen, bedrooms, restrooms, and livestock spaces. The program is sponsored by the Peruvian Ministry of Health. |
| | | |
| • | Healthy Schools Program: La Arena S.A. promoted good health and hygiene practices in the schools of 14 villages near the mine. The program benefited more than 2,000 students. |
| | | |
| • | School Nutrition Program: La Arena S.A. continues to sponsor a school nutrition program aimed at promoting the consumption of a balanced diet for optimal growth. The program targets students for the purpose of improving both nutrition and educational outcomes. To date, 1,021 students from 7 villages have participated in the program. Additionally, La Arena S.A. has built school gardens to cultivate fresh vegetables and has conducted training workshops for parents focused on proper management and storage of food as well as the importance of balanced nutrition. |
Educational Programs
| • | Teacher Training and Salary Stipends: La Arena S.A. sponsored training workshops to develop and strengthen the skillsets of 126 teachers. |
| | | |
| • | Strengthening Reading Skills – Improving School Libraries: La Arena S.A. sponsored a reading comprehension contest in which 13 schools participated. Winning students received more than 200 books and educational audiovisual material for their school library. The materials included Peruvian literature of fiction and non-fiction, mathematics, reading, dictionaries and encyclopedias. |
| | | |
| • | Breeding of Guinea Pigs: During 2016, La Arena S.A. continued implementation of a four-year program to foster best breeding practices and strengthen business management skills. Shahuindo implemented 45 guinea pig breeding-sheds in three villages, and locals were trained in best breeding practices and business management skills. Small associations of individual farmers in the communities around both mines are now selling guinea pigs within local and regional markets. |
| | | |
| • | Livestock Husbandry: La Arena S.A. sponsored and conducted a campaign of vitamin dosage and application with more than 12,000 doses administered to improve livestock health conditions and prevent disease, including cattle, sheep and goats. |
| | | |
| • | Trout Breeding: La Arena S.A. conducted 13 workshops on small-scale trout farming. The training campaign also included the improvement of water harvesting processes in order to optimize water recycling in trout breeding ponds. |
Infrastructure
| • | Community infrastructure: La Arena S.A. donated 2 community buildings: one for the community of La Arena benefiting 500 families, and one for the community of La Union benefiting 90 families. |
| | | |
| • | Improving School Premises: La Arena S.A. donated a science laboratory and a sports platform to the school in La Arena. |
| 149 |
| LA ARENA PROJECT |
| FORM 43-101F1 TECHNICAL REPORT |
Local Economic Development
| • | Women’s Economic Development: 439 women from 14 villages surrounding the La Arena and Shahuindo Mines participated in workshops to develop productive capacities in the areas of product marketing, guinea pig breeding, and bakery businesses, as well as furthering leadership development, employment and home economic skills. |
| | | |
| • | Local Employment Program: La Arena S.A. continues a program of skillset strengthening among employees. In 2016, sixty local employees were trained on masonry, welding and tipper trucks operation. Additionally, 160 local residents were trained on heavy equipment operation. |
The La Arena Mine has been designed to meet and comply with the environmental standards and legislated closure requirements of Peru. In accordance with Peruvian requirements, company standards, and accepted industry practices, the development, operation, and reclamation plans are designed to:
| | • | Assure long-term physical and geochemical stability; |
| | | |
| | • | Comply with national environmental regulations; |
| | | |
| | • | Recover areas affected by project components; |
| | | |
| | • | Mitigate pre-existing risk conditions; |
| | | |
| | • | Assure that post-closure use of the altered area and its aesthetics are compatible with the environment; |
| | | |
| | • | Execute a Community Relations Plan during the operation, closure and post-closure stages; and |
| | | |
| • | Complete a Progressive Closure and Final Closure of the operation, such that post-closure conditions are reduced to a state of passive care. |
The closure plan includes the following actions to be taken during operations:
| • | Concurrent reclamation activities will be initiated as soon as portions of the project are no longer required (Progressive Closure). Progressive closure activities will be completed whenever possible, especially the covering of waste dumps to minimize infiltration from storm events. |
Closure activities will take place whenever possible on all facilities that will no longer be used in the final stage of the mine life; much of this work will occur concurrently with the rinsing of the leach pads. Actions to be taken at closure include:
| • | The open pit will remain as a permanent feature, with berms installed and roads closed to prevent public access. Any potential acid generating material on the pit floor will be covered with non-acid generating waste. It is expected that the lower portion of the pit will fill with water. Overflow, if any, will be treated in a remediation plant and/or by a passive treatment facility. |
| | | |
| • | The heap leach will be rinsed to remove trace cyanide to adequate discharge levels. The heap will undergo minor re-contouring, followed by placement of a low-permeability soil cap and revegetated. The low- permeability soil cap will be designed to prevent infiltration from precipitation, but any leach effluent which occurs will be discharged to the pit lake for treatment if necessary. |
| | | |
| • | The solution ponds will be closed following procedures established in the approved closure plan. These procedures include de-compaction, re-contouring of containment embankments and infilling of ponds back to the adjacent land level using inert material from borrow areas followed by a natural covering of low- permeability soil, then re-vegetated. |
| 150 |
| LA ARENA PROJECT |
| FORM 43-101F1 TECHNICAL REPORT |
| | • | Side slopes and other affected areas will be revegetated according to the approved closure plan. |
| | | |
| | • | Exposed leach pad berms will be graded with the exposed liner either removed or buried. |
| | | |
| | • | The processing plant and support facilities will be removed and the land revegetated. |
| | | |
| | • | Concrete pads and foundations will be demolished and foundations removed or buried. |
| | | |
| | • | Operating surfaces will be reclaimed and revegetated. |
| | | |
| | • | The waste rock facility is constructed in lifts at a natural angle of repose. The waste rock facility will be |
| | | |
| | | graded with a cap of low-permeability soil placed over the facility and revegetated. |
| | | |
| • | Road accesses to hazardous areas (open pits, waste dump and leach pad) will be closed, with access restricted to allow essential monitoring and maintenance work to be carried out. Where practical, roads will be turned over to the local communities for future use. |
| | | |
| • | A program of physical and geochemical monitoring will take place during the active closure and post-closure periods. |
The mine closure plan has been approved by MEM. At December 31, 2017, the Company had a letter of credit outstanding in the amount of $12.5 million as partial guarantee of the La Arena Mine closure obligations as required by MEM. The letter of credit was valid for one year with a renewal date of January 12, 2018. On January 3, 2018, the Company posted a renewed letter of credit under the same terms, totaling $13.3 million.
The Company estimates the undiscounted amount of asset retirement obligations for the La Arena Mine at $43.7 million for concurrent reclamation activities and post-closure reclamation. As at December 31, 2017, Tahoe had recorded the present value of this closure and reclamation obligation.
| 151 |
| LA ARENA PROJECT |
| FORM 43-101F1 TECHNICAL REPORT |
| 21 | CAPITAL AND OPERATING COSTS |
The existing facilities at the La Arena Mine have been in operation since 2011; operating costs are tracked and well understood. As these facilities have already been constructed, their initial capital costs are considered sunk and only sustaining capital expenditure will be required to maintain production.
The La Arena II Project will require the construction of new facilities and involves an open pit mine, with a differential flotation facility processing nominally 80,000 tonnes per day.
All currency values are expressed in US Dollars, based on values recorded at the end of fourth quarter 2017.
| 21.2.1 | Initial Capital Costs |
No further project capital expenditures are anticipated for the La Arena Mine.
The estimated sustaining capital requirement for the remaining life of the La Arena Mine oxide operation is $64.9 million. This includes expansion of the waste rock storage and leach pads, pit dewatering system, land purchases and water treatment facilities. Major sustaining capital items are shown in Table 21-1.
Table 21-1: La Arena Mine Sustaining Capital Expenditures Remaining LOM
| Sustaining Mine Capital | Total LOM ($M) |
| Process Expansions | $20.1 |
| Waste Rock Storage | $10.4 |
| Water Treatment | $15.3 |
| Pit Dewatering System | $5.7 |
| Land Purchase | $7.7 |
| Capitalized Mining | $5.0 |
| Other | $0.7 |
| Total | $64.9 |
| 21.2.3 | Operating Expenditures |
The La Arena Mine oxide operation has been in operation since 2011. Operating costs are tracked and well understood. The mine is operated through Peruvian contractors under alliance agreements. The agreements provide the contractors with the right to operate mining and earthmoving work.
The mine contactor operates a fleet which comprises approximately nineteen 90 tonne rock trucks, three 10 m3hydraulic shovels, three track blasthole drills and various support equipment. Table 21-2 shows the typical mining fleet mix.
| 152 |
| LA ARENA PROJECT |
| FORM 43-101F1 TECHNICAL REPORT |
Table 21-2: La Arena Mine Operating Cost Remaining LOM
| Equipment | Model | Units |
| Haul Trucks | 777 F/G | 19 |
| Loader | WA900 | 1 |
| Shovel | RH90C | 3 |
| Production drills | DM45 | 3 |
| Water trucks | 773D | 1 |
| Wheel dozers | 834H | 1 |
| Track dozers | D6T | 1 |
| Track dozers | D8T | 3 |
| Motor graders | 16M | 2 |
| Fuel trucks | 5000 gallons | 2 |
Diesel is used to power the mining and support fleet. Processing costs include reagents, electrical power and labor. Table 21-3 shows the total operating costs over the remainder of the operation and Table 21-4 shows operating costs in a cost per tonne basis.
Table 21-3: La Arena Mine Operating Cost Remaining LOM
Operating Costs | Total LOM
($M) |
|
| G&A Costs | $87.1 |
| Process Costs | $51.9 |
| Mining Costs | $213.0 |
| Total Operating Costs | $352.0 |
Table 21-4: La Arena Mine Operating Cost per Tonne
| Operating Costs | | |
| G&A Costs | $/t processed | $2.06 |
| Process Costs | $/t processed | $1.26 |
| Mining Costs | $/t processed | $4.71 |
| |
| Mining Costs | $/t mined | $1.78 |
| 21.3.1 | Initial Capital Costs |
The capital cost for initial development of the La Arena II Project is summarized in Table 21-5.
| 153 |
| LA ARENA PROJECT |
| FORM 43-101F1 TECHNICAL REPORT |
Table 21-5: La Arena II Capital Cost Summary
| Cost Item | Total ($M) |
| Process Plant and Infrastructure | |
| Project Directs | $598.7 |
| Project Indirects | $169.3 |
| Contingency | $192.0 |
| Subtotal | $960.0 |
| Mine Equipment | $260.2 |
| Owner's Costs | $145.4 |
| Pre-production Credit | ($1.7) |
| Total | $1,363.9 |
| 21.3.1.1 | Process Plant and Infrastructure Capital Cost Estimate |
The capital cost for initial development of the process plant and infrastructure is summarized in Table 21-6.
Table 21-6: La Arena II Process Plant and Infrastructure Capital Costs
| Cost Item | Total ($M) |
| Direct Costs | |
| General Site | $49.0 |
| Crushing and Grinding | $142.0 |
| Flotation, Regrind and Concentrate | $83.6 |
| Tailing Thickening, Filtering and Stacking | $206.3 |
| Heap Leach Pad | $10.4 |
| Water Systems | $21.3 |
| Substation | $14.5 |
| Reagents and Ancillaries | $38.3 |
| Freight, Taxes and Duties | $33.3 |
| Total Direct Costs | $598.7 |
| Project Indirects | $169.30 |
| Subtotal | $768.00 |
| 25% Contingency | $192.00 |
| Total | $960.0 |
Burdened crew labor rates used in the process plant and infrastructure capital cost estimate averages $12.75 per manhour.
| 154 |
| LA ARENA PROJECT |
| FORM 43-101F1 TECHNICAL REPORT |
Contingency is a cost that statically will occur based on historical data. The term is not used to cover changes in scope, errors, or lack of sufficient information to meet a desired accuracy range. Contingency is used to cover items of cost which fall within the scope of work, but are not known or sufficiently detailed at the time that the estimate is developed (e.g. geotechnical data).
| 21.3.1.4 | Estimate Accuracy |
The accuracy of this estimate for items identified in the scope of work is within the range of plus 30% to minus 25%; i.e. the costs could be 25% lower than the estimate or it could be 30% higher. Accuracy accounts for bidding climate variances from estimate date to actual construction date. Accuracy is an issue separate from contingency.
| 21.3.1.5 | Mining Capital Costs |
The La Arena II mobile mining fleet requirements have been estimated on an annual basis for the proposed production schedule. Total initial mine equipment capital was estimated at $260.2 million.
Budgetary pricing estimates for the mobile equipment were provided by Cashman Equipment of Elko, Nevada, USA. Prices were FOB to US port. Shipping prices were estimated with the help of APX – Air Parcel Express Inc. in the USA. Erection prices were estimated from similar projects escalated to 2017 prices.
Initial mine equipment capital costs are shown in Table 21-7.
Table 21-7: La Arena II Initial Mine Equipment Summary
Initial Mine Equipment
| Total ($M)
| Year |
| -4 | -3 | -2 | -1 |
| Shovels | $52.0 | $10.4 | $31.2 | $10.4 | $- |
| Loaders | $6.5 | $1.3 | $3.9 | $1.3 | $- |
| Drills | $11.1 | $2.2 | $6.7 | $2.2 | $- |
| Haul Trucks | $147.2 | 29.4 | $88.3 | 29.4 | $- |
| Tired Dozers | $5.2 | $1.0 | $3.1 | $1.1 | $- |
| Track Dozers | $6.0 | $1.2 | $3.6 | $1.2 | $- |
| Motor Graders | $5.4 | $1.1 | $3.2 | $1.1 | $- |
| Water Trucks | $3.2 | $0.6 | $1.9 | $0.7 | $- |
| Service Equipment | $23.6 | $4.7 | $14.2 | $4.7 | $- |
| Total Mining Equipment | $260.2 | 52.0 | 156.1 | 52.0 | $- |
| 21.3.1.6 | Other Initial Mining Capital Costs |
Capital costs were also estimated for pre-stripping, dewatering system and Owner’s costs. Owner’s costs include;
| | • | Owner’s project management | • | Risk Insurance |
| | • | Communications and computer equipment | • | Highway Realignment |
| | • | Initial fills | • | Land purchases |
| 155 |
| LA ARENA PROJECT |
| FORM 43-101F1 TECHNICAL REPORT |
A summary of these capital costs is shown in Table 21-8.
Table 21-8: La Arena II Other Mining Initial Capital Costs
Initial Capital (other, $M)
|
Total
| Year |
| -4 | -3 | -2 | -1 |
| Capitalized Mining | 404.4 | $- | $101.3 | $161.1 | $142.0 |
| Dewatering Wells | $1.0 | $- | $- | $- | $1.0 |
| Owner's Costs | $145.4 | $35.6 | $36.9 | $63.0 | $9.9 |
| Total Capital (other) | $550.8 | $35.6 | $138.2 | $224.1 | $152.9 |
| 21.3.2 | Sustaining Capital Costs |
| 21.3.2.1 | Mining Sustaining Capital Costs |
Mobile mining fleet additions and replacements were estimated for the life of the operation. Replacements were estimated on an average useful life in operated hours for the unit. Additions to the fleet were estimated based on the longer haul distances. The average useful life estimates are shown in Table 21-9.
Table 21-9: La Arena II Replacement Operating Hours
| Useful
Operating Life | Annual
Operating |
|
| (hrs) | (hrs) |
| Shovels(1) | NA | 6,600 |
| Loaders | 60,000 | 6,600 |
| Drills | 60,000 | 6,600 |
| Haul Trucks | 100,000 | 6,600 |
| Dozer (Rubber Tired) | 60,000 | 6,600 |
| Dozer (Track) | 60,000 | 6,600 |
| Motor Graders | 60,000 | 6,600 |
| Water Trucks | 60,000 | 6,000 |
| Service Equipment | 60,000 | 6,600 |
(1) Shovels useful life was the life of the operation.
In addition to replacement equipment, sustaining capital estimates include:
| | • | Additions to the haulage fleet |
| | • | Capitalized mining |
| | • | Dewatering system |
Total mine sustaining capital cost estimates are shown in Table 21-10.
| 156 |
| LA ARENA PROJECT |
| FORM 43-101F1 TECHNICAL REPORT |
Table 21-10: La Arena II Sustaining Mining Capital
| Sustaining Capital | Total ($M) |
| Shovels | $- |
| Loaders | $6.5 |
| Drills | $22.2 |
| Haul Trucks | $294.4 |
| Tired Dozers | $10.4 |
| Track Dozers | $9.0 |
| Motor Graders | $10.7 |
| Water Trucks | $6.4 |
| Service Equipment | $47.3 |
| Subtotal Mining Equipment | $406.9 |
| |
| Capitalized Mining | $593.7 |
| Dewatering Wells | $13.2 |
| | |
| Total Mine Sustaining | $1,013.8 |
| 21.3.2.2 | Process Plant Sustaining Capital Costs |
The process related sustaining capital costs include staged progression of both the pyrite tailing storage area and heap leach pad. Also in sustaining costs, is the relocation of the main electrical substation in Year 14, to allow for continued expansion of the waste rock storage facility. Expansions to the dry stack tailings facility are included in the operating costs. Total process sustaining capital cost estimates are shown in Table 21-11.
Table 21-11: La Arena II Process Sustaining Capital
| Process Sustaining Costs | Total ($M) |
| Pyrite Tailings Facility | $40.0 |
| Main Substation Relocation | $10.0 |
| Leach Pad | $28.9 |
| Total Process Sustaining | $78.9 |
| 21.3.3.1 | Mining Operating Costs |
Operating costs for La Arena II were determined using engineering first principles and management experience at similar size operations. Loading units were sized and selected to meet the production requirements and allow the flexibility needed to operate a mine of this size. Trucks were sized to match the loading units. The number of trucks required was determined by estimated productivity rates and cycle times.
Blasthole drill rigs were sized to allow for single pass drilling on a 16-meter production bench height. Dozers, motor graders and water trucks were sized based on experiences from similar sized operations. Mining operating costs are shown in Table 21-12.
| 157 |
| LA ARENA PROJECT |
| FORM 43-101F1 TECHNICAL REPORT |
Table 21-12: La Arena II Mine Operating Costs
| Mining Operating Costs | $/t mined |
| G&A | $0.031 |
| Engineer/Geology | $0.022 |
| Loading | $0.100 |
| Hauling(1) | $0.757 |
| Drilling | $0.066 |
| Blasting | $0.260 |
| Roads & Dumps | $0.093 |
| Total | $1.330 |
(1) Dewatering costs ($0.06/t) included in Hauling
| 21.3.3.2 | Process Plant Operating & Maintenance Costs |
The process plant operating costs are summarized by cost elements of labor, power, reagents, maintenance parts and supplies and services in Table 21-13. Table 21-14 summarizes the process plant operating cost by areas of the plant.
Table 21-13: La Arena II Process Plant Operating Cost Summary
| Processing Units Base Rate (tonnes/year mill ore) | 28,800,000 | Year 1 |
| | Annual Cost $M | $ per tonne ore |
| Labor | $14.7 | $0.51 |
| Power | $63.5 | $2.20 |
| Grinding Media & Liners | $37.8 | $1.31 |
| Reagents | $19.5 | $0.68 |
| Maintenance Parts & Services | $12.9 | $0.45 |
| Supplies and Services | $13.3 | $0.46 |
| Total Mill Process Plant | $161.6 | $5.61 |
| 158 |
| LA ARENA PROJECT |
| FORM 43-101F1 TECHNICAL REPORT |
Table 21-14: La Arena II Process Plant Operating Cost Summary by Area
| Processing Units Base Rate (tonnes/year mill ore) | 28,800,000 | Year 1 |
| | Annual Cost $M | $ per tonne ore |
| Crushing & Conveying | | |
| Operating Labor and Fringes | $0.6 | $0.02 |
| Power | $1.7 | $0.06 |
| Liners | $1.0 | $0.03 |
| Maintenance | $1.8 | $0.06 |
| Supplies & Services | $0.4 | $0.01 |
| Subtotal Crushing & Conveying | $5.4 | $0.19 |
| | | |
| Grinding, Classification and Water Systems | | |
| Operating Labor and Fringes | $0.6 | $0.02 |
| Power – Grinding | $26.1 | $0.91 |
| Power - Water Systems | $1.9 | $0.07 |
| Grinding Media | $29.9 | $1.04 |
| Liners | $6.5 | $0.23 |
| Maintenance | $5.9 | $0.20 |
| Supplies and Services | $0.3 | $0.01 |
| Subtotal Grinding & Classification | $71.2 | $2.47 |
| | | |
| Flotation & Regrind | | |
| Operating Labor and Fringes | $0.6 | $0.02 |
| Power | $16.7 | $0.58 |
| Reagents | $19.5 | $0.68 |
| Grinding Media | $0.2 | $0.01 |
| Liners | $0.1 | $0.00 |
| Maintenance | $1.4 | $0.05 |
| Supplies and Services | $0.1 | $0.00 |
| Subtotal Flotation & Regrind | $38.6 | $1.34 |
| | | |
| Concentrate & Pyrite Thickening, Filtration & Conveying | | |
| Operating Labor and Fringes | $1.6 | $0.06 |
| Power | $3.8 | $0.13 |
| Maintenance | $0.6 | $0.02 |
| Supplies and Services | $0.4 | $0.01 |
| Subtotal Concentrate Thickening, Filtration & Dewatering | $6.4 | $0.22 |
| | | |
| Tailings Thickening, Filtration & Conveying | | |
| Operating Labor and Fringes | $2.4 | $0.08 |
| Power | $13.2 | $0.46 |
| Maintenance | $6.9 | $0.24 |
| Supplies and Services | $10.6 | $0.37 |
| Subtotal Tailings Disposal | $33.1 | $1.15 |
| | | |
| Reagents and Ancillaries | | |
| Operating Labor and Fringes | $3.3 | $0.11 |
| Power | $0.1 | $0.00 |
| Maintenance | $2.2 | $0.08 |
| Supplies and Services | $1.5 | $0.05 |
| Subtotal Ancillary Services | $7.1 | $0.25 |
| Total Mill Process Plant | $161.6 | $5.61 |
| 159 |
| LA ARENA PROJECT |
| FORM 43-101F1 TECHNICAL REPORT |
Process Labor & Fringes
Process labor costs were derived from a staffing plan and based on prevailing daily or annual labor rates in the area. Labor rates and fringe benefits for employees include all applicable social security benefits as well as all applicable payroll taxes. The staffing plan summary and gross annual labor costs are shown in Table 21-15 below.
Table 21-15: La Arena II Process Plant Labor & Fringes
| Department | Number of Personnel | Annual Cost
($M) |
| Mill Operations | 104 | $9.0 |
| Mill Maintenance | 66 | $5.8 |
| Total | 170 | $14.8 |
Electrical Power
Power consumption was based on the equipment list connected kW, discounted for operating time per day and anticipated operating load level. The overall power rate is estimated at $0.071 per kWh. A summary of the power cost and consumption are shown in Table 21-16.
Table 21-16: La Arena II Power Cost Summary
Area | Annual Power
Consumption
(MWh) |
Annual Cost
($M) |
|
|
| Crushing & Conveying | 23,870 | $1.7 |
| Grinding, Classification & Pebble Crushing | 367,239 | $26.1 |
| Flotation & Regrind | 233,694 | $16.6 |
| Concentrate & Pyrite Thickening, Filtration & Conveying | 53,895 | $3.8 |
| Tailings Thickening, Filtration & Conveying | 185,849 | $13.2 |
| Fresh Water & Process Water | 26,752 | $1.9 |
| Reagents | 1,221 | $0.1 |
| Ancillaries | 1,148 | $0.1 |
| Total | 893,668 | $63.5 |
Reagents
Consumption rates were determined from the metallurgical test data or industry practice. Budget quotations were received for reagents supplied from local sources where available with an allowance for freight to site.
A summary of process reagent consumption and costs are included in Table 21-17.
| 160 |
| LA ARENA PROJECT |
| FORM 43-101F1 TECHNICAL REPORT |
Table 21-17: La Arena II Reagents Consumption Summary
| Reagent | kg/t ore | $/kg |
| Lime | 2.500 | $0.13 |
| Hostaflot 3403 | 0.040 | $3.00 |
| Cytec 3418 | 0.003 | $12.15 |
| Cytec Aerofroth 65 | 0.030 | $4.49 |
| PAX | 0.025 | $2.50 |
Maintenance Wear Parts and Consumables
Grinding media consumption and wear items (liners) were based on industry practice for the crusher and grinding operations. These consumption rates and unit prices are shown in Table 21-18.
Table 21-18: La Arena II Grinding Media and Wear Items
| Liners | kg/t ore | $/kg |
| Primary Crusher Liners | 0.006 | $5.80 |
| SAG Mill Liners | 0.051 | $2.82 |
| Ball Mill Liners | 0.030 | $2.82 |
| Regrind Mill Liners | 0.001 | $5.80 |
| Grinding Media | | |
| SAG Mill Balls - 5 inch | 0.700 | $0.96 |
| Ball Mill Balls - 3 inch | 0.386 | $0.96 |
| Regrind Mill Balls - 1 inch | 0.009 | $0.96 |
An allowance was made to cover the cost of maintenance of all items not specifically identified and the cost of maintenance of the facilities. The allowance was calculated using the direct capital cost of equipment times a percentage for each area, which totalled approximately $11.7 million for the process plant. An annual allowance was made for outside maintenance services to be performed at approximately $1.2 million.
Process Supplies & Services
Allowances were provided in process plant for outside consultants, outside contractors, vehicle maintenance, and miscellaneous supplies. The allowances were estimated using M3’s information from other operations and projects. Approximately $13.3 million will be spent annually.
| 161 |
| LA ARENA PROJECT |
| FORM 43-101F1 TECHNICAL REPORT |
No economic analysis is provided for the La Arena Mine which is currently in production. The following discussion pertains to La Arena II, which is a stand-alone project and not an expansion of the current oxide gold operation. The economic success of the La Arena Mine and the La Arena II Project are not interdependent.
The preliminary economic assessment of the La Arena II Project includes Inferred Mineral Resources that are considered too speculative geologically to have the economic considerations applied that would enable them to be categorized as Mineral Reserves and there is no certainty that the preliminary economic assessment will be realized.
The financial evaluation presents the determination of the Net Present Value (NPV), payback period (time in years to recapture the initial capital investment), and the Internal Rate of Return (IRR) for the project. Annual cash flow projections were estimated over the life of the mine based on the estimates of capital expenditures and production cost and sales revenue. The sales revenue is based on the production of copper concentrate and doré. The estimates of capital expenditures and site production costs have been developed specifically for this project and have been presented in earlier sections of this report.
| 22.2 | MINE PRODUCTION STATISTICS |
Mine production is reported as oxide and sulfide resources and waste from the mining operation. The annual production figures were obtained from the mine plan as reported earlier in this report.
The life of mine resources and waste quantities are presented in Table 22-1.
Table 22-1: Life of Mine Tonnages, Metal Grades and Contained Metal
| MTonnes | Copper
(%) | Gold
(g/t) | Copper
(Mlbs) | Gold
(Moz) |
| Oxide Resource | 69.5 | - | 0.30 | - | 0.7 |
| Sulfide Resource | 616.4 | 0.38 | 0.24 | 5,214.7 | 4,753.7 |
| Waste | 1,911.5 | | | | |
| 22.3 | PLANT PRODUCTION STATISTICS |
Sulfide Mineral Resources would be processed using crushing, grinding, and flotation technology to produce metals in a flotation concentrate. This study envisions the flotation circuits will produce a pyrite concentrate that will be stored in a dedicated lined facility and a copper concentrate containing gold. Doré would be produced from leaching oxide resources in a new heap leach facility constructed within the dry stack tailings facility.
The estimated metal recoveries are presented in Table 22-2.
Table 22-2: Metal Recovery Factors
| | Copper % | Gold % |
| Doré | | 85.9 |
| Copper Concentrate | 85.6 | 58.7 |
Estimated life of mine copper concentrate production and doré is presented in Table 22-3 with the approximate metal contained.
| 162 |
| LA ARENA PROJECT |
| FORM 43-101F1 TECHNICAL REPORT |
Table 22-3: Life of Mine Metal Production Summary
| | MTonnes | Copper (Mlbs) | Gold (koz) |
| Copper Concentrate | 8.8 | 4,465 | 2,790 |
| Doré | | | 575 |
| 22.3.1 | Smelter Return Factors |
Copper concentrates and doré would be shipped from the mine site to smelting and refining companies. Smelter and refining treatment charges are generally agreed to by long-term frame agreements between the Company and smelter customers, the terms of which are renewed annually to reflect market conditions for copper concentrates and doré.
A smelter may impose a penalty either expressed in higher treatment charges or in metal deductions to treat concentrates that contain higher than specified quantities of certain elements. La Arena concentrates are expected to be easily marketable as testwork shows they are relatively clean concentrates that do not pose special restrictions on smelting and refining.
The smelting and refining charges calculated in the financial evaluation include charges for smelting copper concentrates and refining precious metal from doré. Transportation costs to deliver the concentrates from the mine site to the smelters are also included. The off-site charges that are incurred are presented in Table 22-4.
Table 22-4: La Arena II Smelter Return Factors
| Copper Concentrate | |
| Payable copper in concentrate | 96.5 % |
| Payable gold in concentrate | 94.0 % |
| Treatment charge ($/tonne) | $85.00 |
| Refining charge – Cu ($/lb) | $0.09 |
| Refining charge – Au ($/oz) | $5.00 |
| Transportation Charges ($/dmt) | $74.50 |
| Doré | |
| Payable gold | 99.9 % |
| Refining/Selling/Transaction Charge – Au ($/oz) | $12.37 |
| 22.4.1 | Initial and Sustaining Capital |
The total capital carried in the financial model for initial and sustaining capital is shown in Table 22-5.
| 163 |
| LA ARENA PROJECT |
| FORM 43-101F1 TECHNICAL REPORT |
Table 22-5: Initial and Sustaining Capital Summary
| Period | Initial Capital ($M) | Sustaining Capital ($M) |
| Year -4 | $183.6 | |
| Year -3 | $597.4 | |
| Year -2 | $676.5 | |
| Year -1 | ($112.8) | |
| Year 1 | $19.2 | $19.7 |
| Year 2 | | $4.6 |
| Year 3 | | $4.2 |
| Year 4 | | $16.5 |
| Year 5 | | $2.4 |
| Year 6 | | $14.8 |
| Year 7 | | $41.3 |
| Year 8 | | $108.8 |
| Year 9 | | $88.3 |
| Year 10 | | $109.3 |
| Year 11 | | $89.3 |
| Year 12 | | $117.9 |
| Year 13 | | $108.7 |
| Year 14 | | $146.3 |
| Year 15 | | $83.4 |
| Year 16 | | $74.2 |
| Year 17 | | $2.1 |
| Year 18 | | $55.0 |
| Year 19 | | $2.0 |
| Year 20 | | $2.0 |
| Year 21 | | $2.0 |
| Year 22 | | |
| Total | $1,363.9 | $1,092.8 |
Initial capital includes pre-production credits
A delay of receipt of revenue from sales is used for accounts receivables and considers the provisional payment and final settlement arrangements provided in the existing smelter contracts. A delay of payment for accounts payable of 30 days is also incorporated into the financial model. VAT payable and receivable are also considered in the financial model.
No allowance for salvage value has been included in the cash flow analysis.
The average annual revenue is $844 million over the 21 year mine life with a total revenue of $17.7 billion over the same period. Annual revenue is determined by applying estimated metal prices to the annual payable metal estimated for each operating year. Sales prices have been applied to all life of mine production without escalation or hedging. The revenue is the gross value of payable metals sold before treatment and transportation charges. Metal sales prices used in the evaluation are as follows:
| | • | Copper $3.30 per pound |
| | • | Gold $1,300.00 per troy ounce |
| 164 |
| LA ARENA PROJECT |
| FORM 43-101F1 TECHNICAL REPORT |
Operating costs for the La Arena II Project were determined using engineering first principles and management experience at similar size operations. The anticipated average annual operating costs are shown in Table 22-6.
Table 22-6: La Arena II Average Annual Operating Costs
|
Total ($M) | $/tonne
processed | $/tonne
mined |
|
| Mining | $120.5 | $3.93 | $1.33 |
| Processing1 | $162.9 | $5.29 | - |
| General & Administrative | $27.9 | $0.91 | - |
| Refining & Treatment | $84.0 | $2.74 | - |
| Total | $395.3 | $12.87 | - |
(1 )Processing costs is weighted average of leaching $1.15 per leach tonne and mill $5.61per mill tonne
The average LOM production cost is $12.87 per tonne of ore processed over the 21 year mine life (excluding preproduction revenue and cost), which equates to co-product costs of $1.55 per pound of saleable copper and $600 per ounce of saleable gold.
| 22.6.1 | Total Production Cost |
Depreciation is calculated using the straight-line method starting with first full year (Year 1) of mill production. The initial capital was depreciated using a 15-year life and the sustaining capital was depreciated using a 10-year life.
No royalties are included in the cash flow.
Depreciation is calculated using the straight-line method starting with first year of production. The initial capital was depreciated using a 15-year life and the sustaining capital was depreciated using a 10-year life.
| 22.6.1.3 | Reclamation & Closure |
This study estimated the reclamation and total closure costs to be $100 million with 20% spent as concurrent reclamation and the remaining $80 million spent over the last three (3) years of the project.
The La Arena II Project is evaluated with a 36% corporate income tax.
Corporate income taxes paid is estimated to be $2,584.6 million for the life of the mine.
Net Income after Tax is approximately $4.6 billion for the life of the mine.
| 165 |
| LA ARENA PROJECT |
| FORM 43-101F1 TECHNICAL REPORT |
The base case economic analysis indicates that the project has an NPV8 of $823.8 million and IRR of 14.7% . Sensitivity analyses are presented in Table 22-7.
Table 22-7: Sensitivity Analysis after Taxes
Metal Prices | NPV @ 0% | NPV @ 5% | NPV @ 8% | NPV @ 10% | IRR% | Payback |
Base Case | $4,250 | $1,594 | $824 | $485 | 14.7% | 4.6 |
| 20% | $6,636 | $2,835 | $1,712 | $1,209 | 21.0% | 3.1 |
| 10% | $5,449 | $2,220 | $1,272 | $851 | 18.0% | 3.7 |
| 0% | $4,250 | $1,594 | $824 | $485 | 14.7% | 4.6 |
| -10% | $3,050 | $968 | $375 | $118 | 11.2% | 5.8 |
| -20% | $1,838 | $335 | ($78) | ($252) | 7.3% | 8.4 |
| | | | | | | |
Operating Cost | NPV @ 0% | NPV @ 5% | NPV @ 8% | NPV @ 10% | IRR% | Payback |
Base Case | $4,250 | $1,594 | $824 | $485 | 14.7% | 4.6 |
| 20% | $3,311 | $1,071 | $434 | $159 | 11.5% | 5.7 |
| 10% | $3,781 | $1,332 | $629 | $322 | 13.1% | 5.1 |
| 0% | $4,250 | $1,594 | $824 | $485 | 14.7% | 4.6 |
| -10% | $4,719 | $1,855 | $1,018 | $648 | 16.3% | 4.1 |
| -20% | $5,182 | $2,112 | $1,209 | $807 | 17.9% | 3.7 |
| | | | | | | |
Initial Capital | NPV @ 0% | NPV @ 5% | NPV @ 8% | NPV @ 10% | IRR% | Payback |
Base Case | $4,250 | $1,594 | $824 | $485 | 14.7% | 4.6 |
| 20% | $4,067 | $1,404 | $637 | $301 | 12.6% | 5.3 |
| 10% | $4,159 | $1,499 | $730 | $393 | 13.6% | 4.9 |
| 0% | $4,250 | $1,594 | $824 | $485 | 14.7% | 4.6 |
| -10% | $4,341 | $1,689 | $917 | $577 | 16.0% | 4.2 |
| -20% | $4,432 | $1,783 | $1,011 | $669 | 17.6% | 3.8 |
| | | | | | | |
Sustaining Capital | NPV @ 0% | NPV @ 5% | NPV @ 8% | NPV @ 10% | IRR% | Payback |
Base Case | $4,250 | $1,594 | $824 | $485 | 14.7% | 4.6 |
| 20% | $4,100 | $1,518 | $772 | $445 | 14.4% | 4.6 |
| 10% | $4,175 | $1,556 | $798 | $465 | 14.5% | 4.6 |
| 0% | $4,250 | $1,594 | $824 | $485 | 14.7% | 4.6 |
| -10% | $4,324 | $1,631 | $849 | $505 | 14.9% | 4.6 |
| -20% | $4,399 | $1,669 | $875 | $525 | 15.0% | 4.5 |
| | | | | | | |
Total Capital | NPV @ 0% | NPV @ 5% | NPV @ 8% | NPV @ 10% | IRR% | Payback |
Base Case | $4,250 | $1,594 | $824 | $485 | 14.7% | 4.6 |
| 20% | $3,918 | $1,328 | $585 | $261 | 12.3% | 5.3 |
| 10% | $4,084 | $1,461 | $705 | $373 | 13.4% | 5.0 |
| 0% | $4,250 | $1,594 | $824 | $485 | 14.7% | 4.6 |
| -10% | $4,415 | $1,726 | $943 | $597 | 16.2% | 4.2 |
| -20% | $4,581 | $1,859 | $1,062 | $709 | 17.9% | 3.8 |
The detailed financial model is shown in Table 22-8.
| 166 |
| LA ARENA PROJECT |
| FORM 43-101F1 TECHNICAL REPORT |
Table 22-8: La Arena ProjectFinancial Model – 80,000 tpd –Assumes MetalRecovered in Same Year as Mined
| 80ktpd | | Total | | | -4 | | | -3 | | | -2 | | | -1 | | | 1 | | | 2 | | | 3 | | | 4 | | | 5 | | | 6 | | | 7 | | | 8 | | | 9 | | | 10 | | | 11 | | | 12 | | | 13 | | | 14 | | | 15 | | | 16 | | | 17 | | | 18 | | | 19 | | | 20 | | | 21 | | | 22 | | | 23 | | | 24 | |
| Mining Operations | | | | | | | | | | | | | | | | | | | | | | | | | | | | | | | | | | | | | | | | | | | | | | | | | | | | | | | | | | | | | | | | | | | | | | | | | | | | | | | | | | | | | | | |
| Oxide Material | | | | | | | | | | | | | | | | | | | | | | | | | | | | | | | | | | | | | | | | | | | | | | | | | | | | | | | | | | | | | | | | | | | | | | | | | | | | | | | | | | | | | | | |
| Beginning Inventory (kt) | | 69,524 | | | 69,524 | | | 69,524 | | | 64,115 | | | 54,301 | | | 46,554 | | | 38,319 | | | 29,391 | | | 21,722 | | | 13,876 | | | 6,723 | | | 852 | | | 201 | | | 162 | | | 162 | | | 162 | | | 162 | | | 160 | | | 0 | | | 0 | | | 0 | | | 0 | | | 0 | | | 0 | | | 0 | | | 0 | | | 0 | | | 0 | | | 0 | |
| Mined (kt) | | 69,524 | | | - | | | 5,409 | | | 9,814 | | | 7,747 | | | 8,235 | | | 8,928 | | | 7,670 | | | 7,846 | | | 7,153 | | | 5,872 | | | 651 | | | 39 | | | - | | | - | | | - | | | 2 | | | 160 | | | - | | | - | | | - | | | - | | | - | | | - | | | - | | | - | | | - | | | - | | | - | |
| Ending Inventory (kt) | | - | | | 69,524 | | | 64,115 | | | 54,301 | | | 46,554 | | | 38,319 | | | 29,391 | | | 21,722 | | | 13,876 | | | 6,723 | | | 852 | | | 201 | | | 162 | | | 162 | | | 162 | | | 162 | | | 160 | | | 0 | | | 0 | | | 0 | | | 0 | | | 0 | | | 0 | | | 0 | | | 0 | | | 0 | | | 0 | | | 0 | | | 0 | |
| Gold Grade (g/t) | | 0.30 | | | - | | | 0.19 | | | 0.23 | | | 0.25 | | | 0.27 | | | 0.35 | | | 0.35 | | | 0.35 | | | 0.36 | | | 0.35 | | | 0.25 | | | 0.13 | | | - | | | - | | | - | | | 0.14 | | | 0.21 | | | - | | | - | | | - | | | - | | | - | | | - | | | - | | | - | | | - | | | - | | | - | |
| Contained Gold (kozs) | | 669 | | | - | | | 34 | | | 73 | | | 62 | | | 71 | | | 101 | | | 85 | | | 89 | | | 82 | | | 66 | | | 5 | | | 0 | | | - | | | - | | | - | | | 0 | | | 1 | | | - | | | - | | | - | | | - | | | - | | | - | | | - | | | - | | | - | | | - | | | - | |
| Sulfide Material | | | | | | | | | | | | | | | | | | | | | | | | | | | | | | | | | | | | | | | | | | | | | | | | | | | | | | | | | | | | | | | | | | | | | | | | | | | | | | | | | | | | | | | |
| Beginning Inventory (kt) | | 616,437 | | | 616,437 | | | 616,437 | | | 616,079 | | | 601,586 | | | 587,417 | | | 562,041 | | | 533,765 | | | 504,887 | | | 476,285 | | | 447,647 | | | 414,295 | | | 387,036 | | | 362,726 | | | 334,252 | | | 309,972 | | | 274,897 | | | 246,362 | | | 217,818 | | | 189,265 | | | 160,988 | | | 133,234 | | | 104,413 | | | 75,528 | | | 46,340 | | | 17,122 | | | (0 | ) | | (0 | ) | | (0 | ) |
| Mined (kt) | | 616,437 | | | - | | | 358 | | | 14,493 | | | 14,169 | | | 25,376 | | | 28,277 | | | 28,877 | | | 28,602 | | | 28,638 | | | 33,352 | | | 27,260 | | | 24,310 | | | 28,473 | | | 24,280 | | | 35,075 | | | 28,535 | | | 28,544 | | | 28,553 | | | 28,277 | | | 27,754 | | | 28,821 | | | 28,885 | | | 29,187 | | | 29,218 | | | 17,122 | | | - | | | - | | | - | |
| Ending Inventory (kt) | | - | | | 616,437 | | | 616,079 | | | 601,586 | | | 587,417 | | | 562,041 | | | 533,765 | | | 504,887 | | | 476,285 | | | 447,647 | | | 414,295 | | | 387,036 | | | 362,726 | | | 334,252 | | | 309,972 | | | 274,897 | | | 246,362 | | | 217,818 | | | 189,265 | | | 160,988 | | | 133,234 | | | 104,413 | | | 75,528 | | | 46,340 | | | 17,122 | | | (0 | ) | | (0 | ) | | (0 | ) | | (0 | ) |
| Copper Grade (%) | | 0.38 | | | - | | | 0.24 | | | 0.37 | | | 0.39 | | | 0.37 | | | 0.41 | | | 0.37 | | | 0.35 | | | 0.35 | | | 0.38 | | | 0.38 | | | 0.42 | | | 0.38 | | | 0.34 | | | 0.31 | | | 0.37 | | | 0.41 | | | 0.43 | | | 0.47 | | | 0.32 | | | 0.32 | | | 0.39 | | | 0.43 | | | 0.46 | | | 0.44 | | | - | | | - | | | - | |
| Gold Grade (g/t) | | 0.24 | | | - | | | 0.13 | | | 0.17 | | | 0.29 | | | 0.29 | | | 0.31 | | | 0.28 | | | 0.25 | | | 0.24 | | | 0.25 | | | 0.24 | | | 0.25 | | | 0.27 | | | 0.24 | | | 0.18 | | | 0.23 | | | 0.23 | | | 0.24 | | | 0.26 | | | 0.16 | | | 0.17 | | | 0.22 | | | 0.24 | | | 0.26 | | | 0.23 | | | - | | | - | | | - | |
| Contained Copper (klbs) | | 5,214,687 | | | - | | | 1,913 | | | 116,804 | | | 120,911 | | | 208,852 | | | 253,631 | | | 235,821 | | | 217,579 | | | 219,289 | | | 279,781 | | | 228,465 | | | 224,722 | | | 238,306 | | | 183,406 | | | 236,899 | | | 231,623 | | | 260,757 | | | 268,693 | | | 292,114 | | | 198,108 | | | 206,486 | | | 249,055 | | | 276,434 | | | 297,893 | | | 167,142 | | | - | | | - | | | - | |
| Contained Gold (kozs) | | 4,754 | | | - | | | 1 | | | 80 | | | 133 | | | 239 | | | 281 | | | 265 | | | 233 | | | 217 | | | 269 | | | 214 | | | 197 | | | 249 | | | 185 | | | 205 | | | 214 | | | 209 | | | 220 | | | 236 | | | 144 | | | 162 | | | 201 | | | 228 | | | 242 | | | 129 | | | - | | | - | | | - | |
| Waste | | | | | | | | | | | | | | | | | | | | | | | | | | | | | | | | | | | | | | | | | | | | | | | | | | | | | | | | | | | | | | | | | | | | | | | | | | | | | | | | | | | | | | | |
| Beginning Inventory (kt) | | 1,911,466 | | | 1,911,466 | | | 1,911,466 | | | 1,852,295 | | | 1,764,155 | | | 1,680,867 | | | 1,588,046 | | | 1,503,707 | | | 1,439,581 | | | 1,378,511 | | | 1,316,221 | | | 1,244,166 | | | 1,143,547 | | | 1,035,330 | | | 931,761 | | | 824,112 | | | 710,277 | | | 596,886 | | | 456,879 | | | 316,984 | | | 176,992 | | | 45,866 | | | 18,214 | | | 8,036 | | | 2,943 | | | 836 | | | (0 | ) | | (0 | ) | | (0 | ) |
| Mined - without Rehandle (kt) | | 1,911,466 | | | - | | | 59,171 | | | 88,140 | | | 83,288 | | | 92,821 | | | 84,338 | | | 64,126 | | | 61,070 | | | 62,290 | | | 72,054 | | | 100,619 | | | 108,217 | | | 103,569 | | | 107,649 | | | 113,835 | | | 113,391 | | | 140,007 | | | 139,895 | | | 139,992 | | | 131,126 | | | 27,652 | | | 10,178 | | | 5,092 | | | 2,108 | | | 836 | | | - | | | - | | | - | |
| Ending Inventory (kt) | | - | | | 1,911,466 | | | 1,852,295 | | | 1,764,155 | | | 1,680,867 | | | 1,588,046 | | | 1,503,707 | | | 1,439,581 | | | 1,378,511 | | | 1,316,221 | | | 1,244,166 | | | 1,143,547 | | | 1,035,330 | | | 931,761 | | | 824,112 | | | 710,277 | | | 596,886 | | | 456,879 | | | 316,984 | | | 176,992 | | | 45,866 | | | 18,214 | | | 8,036 | | | 2,943 | | | 836 | | | (0 | ) | | (0 | ) | | (0 | ) | | (0 | ) |
| Waste Rehandle (kt) | | 86,312 | | | - | | | 17,646 | | | 13,529 | | | 2,473 | | | 228 | | | - | | | - | | | - | | | - | | | 14,994 | | | 2,766 | | | - | | | - | | | - | | | 14,420 | | | 20,256 | | | - | | | - | | | - | | | - | | | - | | | - | | | - | | | - | | | - | | | - | | | - | | | - | |
| Total Material Mined (kt) | | 2,597,427 | | | - | | | 64,938 | | | 112,448 | | | 105,203 | | | 126,432 | | | 121,542 | | | 100,673 | | | 97,518 | | | 98,081 | | | 111,278 | | | 128,530 | | | 132,566 | | | 132,042 | | | 131,929 | | | 148,911 | | | 141,928 | | | 168,711 | | | 168,449 | | | 168,269 | | | 158,880 | | | 56,472 | | | 39,064 | | | 34,280 | | | 31,326 | | | 17,958 | | | - | | | - | | | - | |
| Strip Ratio (w:o) | | 2.79 | | | - | | | - | | | 3.63 | | | 3.80 | | | 2.76 | | | 2.27 | | | 1.75 | | | 1.68 | | | 1.74 | | | 1.84 | | | 3.61 | | | 4.44 | | | 3.64 | | | 4.43 | | | 3.25 | | | 3.97 | | | 4.88 | | | 4.90 | | | 4.95 | | | 4.72 | | | 0.96 | | | 0.35 | | | 0.17 | | | 0.07 | | | 0.05 | | | - | | | - | | | - | |
| Process Plant Operations | | | | | | | | | | | | | | | | | | | | | | | | | | | | | | | | | | | | | | | | | | | | | | | | | | | | | | | | | | | | | | | | | | | | | | | | | | | | | | | | | | | | | | | |
| Leach Pad | | | | | | | | | | | | | | | | | | | | | | | | | | | | | | | | | | | | | | | | | | | | | | | | | | | | | | | | | | | | | | | | | | | | | | | | | | | | | | | | | | | | | | | |
| Beginning Oxide Material Inventory (kt) | | 69,524 | | | 69,524 | | | 69,524 | | | 69,524 | | | 54,301 | | | 46,554 | | | 38,319 | | | 29,391 | | | 21,722 | | | 13,876 | | | 6,723 | | | 852 | | | 201 | | | 162 | | | 162 | | | 162 | | | 162 | | | 160 | | | 0 | | | 0 | | | 0 | | | 0 | | | 0 | | | 0 | | | 0 | | | 0 | | | 0 | | | 0 | | | 0 | |
| Mined Oxide Material to Pad (kt) | | 69,524 | | | - | | | - | | | 15,223 | | | 7,747 | | | 8,235 | | | 8,928 | | | 7,670 | | | 7,846 | | | 7,153 | | | 5,872 | | | 651 | | | 39 | | | - | | | - | | | - | | | 2 | | | 160 | | | - | | | - | | | - | | | - | | | - | | | - | | | - | | | - | | | - | | | - | | | - | |
| Ending Oxide Material Inventory (kt) | | - | | | 69,524 | | | 69,524 | | | 54,301 | | | 46,554 | | | 38,319 | | | 29,391 | | | 21,722 | | | 13,876 | | | 6,723 | | | 852 | | | 201 | | | 162 | | | 162 | | | 162 | | | 162 | | | 160 | | | 0 | | | 0 | | | 0 | | | 0 | | | 0 | | | 0 | | | 0 | | | 0 | | | 0 | | | 0 | | | 0 | | | 0 | |
| Contained Gold (kozs) | | 669 | | | - | | | - | | | 106 | | | 62 | | | 71 | | | 101 | | | 85 | | | 89 | | | 82 | | | 66 | | | 5 | | | 0 | | | - | | | - | | | - | | | 0 | | | 1 | | | - | | | - | | | - | | | - | | | - | | | - | | | - | | | - | | | - | | | - | | | - | |
| Dore | | | | | | | | | | | | | | | | | | | | | | | | | | | | | | | | | | | | | | | | | | | | | | | | | | | | | | | | | | | | | | | | | | | | | | | | | | | | | | | | | | | | | | | |
| Gold Recovery (%) | | 85.9% | | | 0.0% | | | 0.0% | | | 85.6% | | | 85.7% | | | 85.7% | | | 85.9% | | | 86.0% | | | 86.0% | | | 86.0% | | | 86.0% | | | 86.0% | | | 86.0% | | | 0.0% | | | 0.0% | | | 0.0% | | | 86.0% | | | 86.0% | | | 0.0% | | | 0.0% | | | 0.0% | | | 0.0% | | | 0.0% | | | 0.0% | | | 0.0% | | | 0.0% | | | 0.0% | | | 0.0% | | | 0.0% | |
| Recovered Gold (koz) | | 575 | | | - | | | - | | | 91 | | | 53 | | | 61 | | | 87 | | | 73 | | | 77 | | | 70 | | | 57 | | | 5 | | | 0 | | | - | | | - | | | - | | | 0 | | | 1 | | | - | | | - | | | - | | | - | | | - | | | - | | | - | | | - | | | - | | | - | | | - | |
| Concentrator | | | | | | | | | | | | | | | | | | | | | | | | | | | | | | | | | | | | | | | | | | | | | | | | | | | | | | | | | | | | | | | | | | | | | | | | | | | | | | | | | | | | | | | |
| Beginning Sulfide Material Inventory (kt) | | 616,437 | | | 616,437 | | | 616,437 | | | 616,437 | | | 616,437 | | | 598,137 | | | 569,337 | | | 540,537 | | | 511,737 | | | 482,937 | | | 454,137 | | | 425,337 | | | 396,537 | | | 367,737 | | | 338,937 | | | 310,137 | | | 281,337 | | | 252,537 | | | 223,737 | | | 194,937 | | | 166,137 | | | 137,337 | | | 108,537 | | | 79,737 | | | 50,937 | | | 22,137 | | | - | | | - | | | - | |
| Mined Sulfide Material - Processed (kt) | | 616,437 | | | - | | | - | | | - | | | 18,300 | | | 28,800 | | | 28,800 | | | 28,800 | | | 28,800 | | | 28,800 | | | 28,800 | | | 28,800 | | | 28,800 | | | 28,800 | | | 28,800 | | | 28,800 | | | 28,800 | | | 28,800 | | | 28,800 | | | 28,800 | | | 28,800 | | | 28,800 | | | 28,800 | | | 28,800 | | | 28,800 | | | 22,137 | | | - | | | - | | | - | |
| Ending Sulfide Material Inventory (kt) | | - | | | 616,437 | | | 616,437 | | | 616,437 | | | 598,137 | | | 569,337 | | | 540,537 | | | 511,737 | | | 482,937 | | | 454,137 | | | 425,337 | | | 396,537 | | | 367,737 | | | 338,937 | | | 310,137 | | | 281,337 | | | 252,537 | | | 223,737 | | | 194,937 | | | 166,137 | | | 137,337 | | | 108,537 | | | 79,737 | | | 50,937 | | | 22,137 | | | - | | | - | | | - | | | - | |
| Copper Grade (%) | | 0.38 | | | - | | | - | | | - | | | 0.38 | | | 0.37 | | | 0.41 | | | 0.37 | | | 0.35 | | | 0.35 | | | 0.38 | | | 0.38 | | | 0.41 | | | 0.38 | | | 0.35 | | | 0.31 | | | 0.37 | | | 0.41 | | | 0.43 | | | 0.47 | | | 0.32 | | | 0.32 | | | 0.39 | | | 0.43 | | | 0.46 | | | 0.42 | | | - | | | - | | | - | |
| Gold Grade (g/t) | | 0.24 | | | - | | | - | | | - | | | 0.27 | | | 0.28 | | | 0.31 | | | 0.28 | | | 0.25 | | | 0.24 | | | 0.25 | | | 0.24 | | | 0.25 | | | 0.27 | | | 0.23 | | | 0.18 | | | 0.23 | | | 0.23 | | | 0.24 | | | 0.26 | | | 0.16 | | | 0.17 | | | 0.22 | | | 0.24 | | | 0.26 | | | 0.23 | | | - | | | - | | | - | |
| Contained Copper (klbs) | | 5,214,687 | | | - | | | - | | | - | | | 153,934 | | | 236,224 | | | 257,816 | | | 235,191 | | | 219,161 | | | 220,584 | | | 241,596 | | | 241,031 | | | 261,351 | | | 240,971 | | | 220,279 | | | 194,516 | | | 233,422 | | | 262,495 | | | 270,368 | | | 295,668 | | | 205,210 | | | 206,337 | | | 248,320 | | | 272,765 | | | 293,630 | | | 203,820 | | | - | | | - | | | - | |
| Contained Gold (kozs) | | 4,754 | | | - | | | - | | | - | | | 156 | | | 258 | | | 284 | | | 264 | | | 234 | | | 218 | | | 232 | | | 224 | | | 227 | | | 251 | | | 215 | | | 169 | | | 216 | | | 210 | | | 222 | | | 239 | | | 150 | | | 162 | | | 200 | | | 225 | | | 238 | | | 160 | | | - | | | - | | | - | |
| Copper Concentrate | | | | | | | | | | | | | | | | | | | | | | | | | | | | | | | | | | | | | | | | | | | | | | | | | | | | | | | | | | | | | | | | | | | | | | | | | | | | | | | | | | | | | | | |
| Recovery Copper (%) | | 85.6% | | | 0.0% | | | 0.0% | | | 0.0% | | | 74.8% | | | 77.9% | | | 75.8% | | | 80.9% | | | 85.3% | | | 87.4% | | | 87.5% | | | 87.2% | | | 86.5% | | | 87.3% | | | 86.1% | | | 87.6% | | | 87.6% | | | 87.6% | | | 87.6% | | | 87.6% | | | 87.6% | | | 87.6% | | | 87.6% | | | 87.6% | | | 87.6% | | | 87.6% | | | 0.0% | | | 0.0% | | | 0.0% | |
| Recovery Gold (%) | | 58.7% | | | 0.0% | | | 0.0% | | | 0.0% | | | 52.1% | | | 54.2% | | | 53.1% | | | 56.1% | | | 58.3% | | | 59.9% | | | 60.1% | | | 59.9% | | | 59.5% | | | 59.9% | | | 59.3% | | | 60.1% | | | 60.1% | | | 60.1% | | | 60.1% | | | 60.1% | | | 60.1% | | | 60.1% | | | 60.1% | | | 60.1% | | | 60.1% | | | 60.1% | | | 0.0% | | | 0.0% | | | 0.0% | |
| Copper Concentrate (kt) | | 8,807 | | | - | | | - | | | - | | | 227 | | | 363 | | | 386 | | | 375 | | | 369 | | | 380 | | | 417 | | | 415 | | | 446 | | | 415 | | | 374 | | | 336 | | | 403 | | | 453 | | | 467 | | | 511 | | | 354 | | | 356 | | | 429 | | | 471 | | | 507 | | | 352 | | | - | | | - | | | - | |
| Copper Concentrate - Cu Grade (%) | | 23.0% | | | 0% | | | 0% | | | 0% | | | 23.0% | | | 23.0% | | | 23.0% | | | 23.0% | | | 23.0% | | | 23.0% | | | 23.0% | | | 23.0% | | | 23.0% | | | 23.0% | | | 23.0% | | | 23.0% | | | 23.0% | | | 23.0% | | | 23.0% | | | 23.0% | | | 23.0% | | | 23.0% | | | 23.0% | | | 23.0% | | | 23.0% | | | 23.0% | | | 0.0% | | | 0.0% | | | 0.0% | |
| Copper Concentrate - Au Grade (g/t) | | 9.85 | | | - | | | - | | | - | | | 11.13 | | | 12.00 | | | 12.16 | | | 12.27 | | | 11.52 | | | 10.68 | | | 10.42 | | | 10.08 | | | 9.42 | | | 11.28 | | | 10.59 | | | 9.38 | | | 10.00 | | | 8.67 | | | 8.87 | | | 8.74 | | | 7.89 | | | 8.47 | | | 8.72 | | | 8.92 | | | 8.78 | | | 8.52 | | | - | | | - | | | - | |
| Recovered Copper (klbs) | | 4,465,585 | | | - | | | - | | | - | | | 115,113 | | | 183,999 | | | 195,474 | | | 190,327 | | | 186,864 | | | 192,711 | | | 211,333 | | | 210,188 | | | 226,159 | | | 210,434 | | | 189,668 | | | 170,396 | | | 204,473 | | | 229,941 | | | 236,838 | | | 258,997 | | | 179,747 | | | 180,751 | | | 217,529 | | | 238,942 | | | 257,220 | | | 178,481 | | | - | | | - | | | - | |
| Recovered Gold (kozs) | | 2,790 | | | - | | | - | | | - | | | 81 | | | 140 | | | 151 | | | 148 | | | 137 | | | 131 | | | 140 | | | 134 | | | 135 | | | 151 | | | 127 | | | 101 | | | 130 | | | 126 | | | 133 | | | 143 | | | 90 | | | 97 | | | 120 | | | 135 | | | 143 | | | 96 | | | - | | | - | | | - | |
| Payable Metals | | | | | | | | | | | | | | | | | | | | | | | | | | | | | | | | | | | | | | | | | | | | | | | | | | | | | | | | | | | | | | | | | | | | | | | | | | | | | | | | | | | | | | | |
| Dore | | | | | | | | | | | | | | | | | | | | | | | | | | | | | | | | | | | | | | | | | | | | | | | | | | | | | | | | | | | | | | | | | | | | | | | | | | | | | | | | | | | | | | | |
| Payable Gold (kozs) | | 574 | | | - | | | - | | | 91 | | | 53 | | | 61 | | | 87 | | | 73 | | | 77 | | | 70 | | | 57 | | | 5 | | | 0 | | | - | | | - | | | - | | | 0 | | | 1 | | | - | | | - | | | - | | | - | | | - | | | - | | | - | | | - | | | - | | | - | | | - | |
| Copper Concentrate | | | | | | | | | | | | | | | | | | | | | | | | | | | | | | | | | | | | | | | | | | | | | | | | | | | | | | | | | | | | | | | | | | | | | | | | | | | | | | | | | | | | | | | |
| Payable Copper (klbs) | | 4,309,290 | | | - | | | - | | | - | | | 111,084 | | | 177,559 | | | 188,632 | | | 183,666 | | | 180,323 | | | 185,966 | | | 203,936 | | | 202,832 | | | 218,243 | | | 203,069 | | | 183,030 | | | 164,433 | | | 197,317 | | | 221,893 | | | 228,549 | | | 249,932 | | | 173,456 | | | 174,425 | | | 209,915 | | | 230,579 | | | 248,217 | | | 172,234 | | | - | | | - | | | - | |
| Payable Gold (kozs) | | 2,623 | | | - | | | - | | | - | | | 76 | | | 132 | | | 142 | | | 139 | | | 128 | | | 123 | | | 131 | | | 126 | | | 127 | | | 141 | | | 120 | | | 95 | | | 122 | | | 119 | | | 125 | | | 135 | | | 85 | | | 91 | | | 113 | | | 127 | | | 135 | | | 91 | | | - | | | - | | | - | |
| Income Statement ($000) | | | | | | | | | | | | | | | | | | | | | | | | | | | | | | | | | | | | | | | | | | | | | | | | | | | | | | | | | | | | | | | | | | | | | | | | | | | | | | | | | | | | | | | |
| Copper ($/lb) | $ | 3.30 | | $ | 3.30 | | $ | 3.30 | | $ | 3.30 | | $ | 3.30 | | $ | 3.30 | | $ | 3.30 | | $ | 3.30 | | $ | 3.30 | | $ | 3.30 | | $ | 3.30 | | $ | 3.30 | | $ | 3.30 | | $ | 3.30 | | $ | 3.30 | | $ | 3.30 | | $ | 3.30 | | $ | 3.30 | | $ | 3.30 | | $ | 3.30 | | $ | 3.30 | | $ | 3.30 | | $ | 3.30 | | $ | 3.30 | | $ | 3.30 | | $ | 3.30 | | $ | 3.30 | | $ | 3.30 | | $ | 3.30 | |
| Gold ($/oz) | $ | 1,300 | | $ | 1,300.00 | | $ | 1,300.00 | | $ | 1,300.00 | | $ | 1,300.00 | | $ | 1,300.00 | | $ | 1,300.00 | | $ | 1,300.00 | | $ | 1,300.00 | | $ | 1,300.00 | | $ | 1,300.00 | | $ | 1,300.00 | | $ | 1,300.00 | | $ | 1,300.00 | | $ | 1,300.00 | | $ | 1,300.00 | | $ | 1,300.00 | | $ | 1,300.00 | | $ | 1,300.00 | | $ | 1,300.00 | | $ | 1,300.00 | | $ | 1,300.00 | | $ | 1,300.00 | | $ | 1,300.00 | | $ | 1,300.00 | | $ | 1,300.00 | | $ | 1,300.00 | | $ | 1,300.00 | | $ | 1,300.00 | |
| Revenues ($000) | | | | | | | | | | | | | | | | | | | | | | | | | | | | | | | | | | | | | | | | | | | | | | | | | | | | | | | | | | | | | | | | | | | | | | | | | | | | | | | | | | | | | | | |
| Dore | $ | 558,872 | | | 0 | | | 0 | | $ | - | | $ | - | | $ | 78,851 | | $ | 112,771 | | $ | 95,237 | | $ | 99,678 | | $ | 91,432 | | $ | 73,599 | | $ | 5,939 | | $ | 177 | | $ | - | | $ | - | | $ | - | | $ | 8 | | $ | 1,179 | | $ | - | | $ | - | | $ | - | | $ | - | | $ | - | | $ | - | | $ | - | | $ | - | | $ | - | | $ | - | | $ | - | |
| Copper Concentrate - Cu | $ | 13,854,079 | | $ | - | | $ | - | | $ | - | | $ | - | | $ | 585,943 | | $ | 622,486 | | $ | 606,098 | | $ | 595,067 | | $ | 613,688 | | $ | 672,990 | | $ | 669,345 | | $ | 720,202 | | $ | 670,127 | | $ | 603,999 | | $ | 542,627 | | $ | 651,146 | | $ | 732,248 | | $ | 754,211 | | $ | 824,776 | | $ | 572,405 | | $ | 575,602 | | $ | 692,720 | | $ | 760,910 | | $ | 819,116 | | $ | 568,372 | | $ | - | | $ | - | | $ | - | |
| Copper Concentrate - Au | $ | 3,310,153 | | $ | - | | $ | - | | $ | - | | $ | - | | $ | 171,085 | | $ | 184,152 | | $ | 180,872 | | $ | 166,861 | | $ | 159,487 | | $ | 170,651 | | $ | 164,191 | | $ | 165,002 | | $ | 183,938 | | $ | 155,628 | | $ | 123,902 | | $ | 158,477 | | $ | 154,441 | | $ | 162,771 | | $ | 175,326 | | $ | 109,911 | | $ | 118,652 | | $ | 146,901 | | $ | 165,057 | | $ | 175,070 | | $ | 117,780 | | $ | - | | $ | - | | $ | - | |
| | | | | | | | | | | | | | | | | | | | | | | | | | | | | | | | | | | | | | | | | | | | | | | | | | | | | | | | | | | | | | | | | | | | | | | | | | | | | | | | | | | | | | | | |
| Total Revenues | $ | 17,723,104 | | $ | - | | $ | - | | $ | - | | $ | - | | $ | 835,880 | | $ | 919,409 | | $ | 882,207 | | $ | 861,606 | | $ | 864,607 | | $ | 917,240 | | $ | 839,475 | | $ | 885,381 | | $ | 854,065 | | $ | 759,627 | | $ | 666,529 | | $ | 809,630 | | $ | 887,869 | | $ | 916,982 | | $ | 1,000,101 | | $ | 682,316 | | $ | 694,254 | | $ | 839,621 | | $ | 925,967 | | $ | 994,186 | | $ | 686,152 | | $ | - | | $ | - | | $ | - | |
| 167 |
| LA ARENA PROJECT |
| FORM 43-101F1 TECHNICAL REPORT |
| 80ktpd | | Total | | | -4 | | | -3 | | | -2 | | | -1 | | | 1 | | | 2 | | | 3 | | | 4 | | | 5 | | | 6 | | | 7 | | | 8 | | | 9 | | | 10 | | | 11 | | | 12 | | | 13 | | | 14 | | | 15 | | | 16 | | | 17 | | | 18 | | | 19 | | | 20 | | | 21 | | | 22 | | | 23 | | | 24 | |
| Operating Cost ($000) | | | | | | | | | | | | | | | | | | | | | | | | | | | | | | | | | | | | | | | | | | | | | | | | | | | | | | | | | | | | | | | | | | | | | | | | | | | | | | | | | | | | | | | |
| Mining | $ | 2,529,796 | | $ | - | | $ | - | | $ | - | | $ | - | | $ | 168,155 | | $ | 161,651 | | $ | 133,895 | | $ | 129,699 | | $ | 130,448 | | $ | 148,000 | | $ | 140,560 | | $ | 122,624 | | $ | 143,395 | | $ | 122,277 | | $ | 176,643 | | $ | 143,714 | | $ | 144,558 | | $ | 143,798 | | $ | 142,404 | | $ | 139,773 | | $ | 75,108 | | $ | 51,955 | | $ | 45,592 | | $ | 41,663 | | $ | 23,884 | | $ | - | | $ | - | | $ | - | |
| Stockpile Rehandle | $ | 6,761 | | $ | - | | $ | - | | $ | - | | $ | - | | $ | 1,027 | | $ | 157 | | $ | - | | $ | 59 | | $ | 49 | | $ | - | | $ | 462 | | $ | 1,347 | | $ | 98 | | $ | 1,356 | | $ | - | | $ | 79 | | $ | 77 | | $ | 74 | | $ | 157 | | $ | 314 | | $ | - | | $ | - | | $ | - | | $ | - | | $ | 1,504 | | $ | - | | $ | - | | $ | - | |
| Heap Leach | $ | 53,537 | | $ | - | | $ | - | | $ | - | | $ | - | | $ | 9,470 | | $ | 10,267 | | $ | 8,820 | | $ | 9,023 | | $ | 8,225 | | $ | 6,752 | | $ | 748 | | $ | 45 | | $ | - | | $ | - | | $ | - | | $ | 2 | | $ | 184 | | $ | - | | $ | - | | $ | - | | $ | - | | $ | - | | $ | - | | $ | - | | $ | - | | $ | - | | $ | - | | $ | - | |
| Concentrator | $ | 3,361,683 | | $ | - | | $ | - | | $ | - | | $ | - | | $ | 161,692 | | $ | 161,692 | | $ | 161,692 | | $ | 161,692 | | $ | 161,692 | | $ | 161,692 | | $ | 161,692 | | $ | 161,692 | | $ | 161,692 | | $ | 161,692 | | $ | 161,692 | | $ | 161,692 | | $ | 161,692 | | $ | 161,692 | | $ | 161,692 | | $ | 161,692 | | $ | 161,692 | | $ | 161,692 | | $ | 161,692 | | $ | 161,692 | | $ | 127,844 | | $ | - | | $ | - | | $ | - | |
| General Administration | $ | 586,174 | | $ | - | | $ | - | | $ | - | | $ | - | | $ | 28,224 | | $ | 28,224 | | $ | 28,224 | | $ | 28,224 | | $ | 28,224 | | $ | 28,224 | | $ | 28,224 | | $ | 28,224 | | $ | 28,224 | | $ | 28,224 | | $ | 28,224 | | $ | 28,224 | | $ | 28,224 | | $ | 28,224 | | $ | 28,224 | | $ | 28,224 | | $ | 28,224 | | $ | 28,224 | | $ | 28,224 | | $ | 28,224 | | $ | 21,694 | | $ | - | | $ | - | | $ | - | |
| Treatment & Refining Charges | $ | - | | $ | - | | $ | - | | $ | - | | $ | - | | | - | | | 0 | | | 0 | | $ | - | | $ | - | | $ | - | | $ | - | | $ | - | | $ | - | | $ | - | | $ | - | | $ | - | | $ | - | | $ | - | | $ | - | | $ | - | | $ | - | | $ | - | | $ | - | | $ | - | | $ | - | | $ | - | | $ | - | | $ | - | |
| Dore | | | | | | | | | | | | | | | | | | | | | | | | | | | | | | | | | | | | | | | | | | | | | | | | | | | | | | | | | | | | | | | | | | | | | | | | | | | | | | | | | | | | | | | |
| Gold Refining Charges | $ | 5,318 | | $ | - | | $ | - | | $ | - | | $ | - | | $ | 750 | | $ | 1,073 | | $ | 906 | | $ | 948 | | $ | 870 | | $ | 700 | | $ | 57 | | $ | 2 | | $ | - | | $ | - | | $ | - | | $ | 0 | | $ | 11 | | $ | - | | $ | - | | $ | - | | $ | - | | $ | - | | $ | - | | $ | - | | $ | - | | $ | - | | $ | - | | $ | - | |
| Copper Concentrates | | | | | | | | | | | | | | | | | | | | | | | | | | | | | | | | | | | | | | | | | | | | | | | | | | | | | | | | | | | | | | | | | | | | | | | | | | | | | | | | | | | | | | | |
| Treatment Charges | $ | 729,279 | | $ | - | | $ | - | | $ | - | | $ | - | | $ | 30,844 | | $ | 32,768 | | $ | 31,905 | | $ | 31,324 | | $ | 32,305 | | $ | 35,426 | | $ | 35,234 | | $ | 37,911 | | $ | 35,276 | | $ | 31,795 | | $ | 28,564 | | $ | 34,276 | | $ | 38,546 | | $ | 39,702 | | $ | 43,416 | | $ | 30,131 | | $ | 30,300 | | $ | 36,465 | | $ | 40,054 | | $ | 43,118 | | $ | 29,919 | | $ | - | | $ | - | | $ | - | |
| Gold Refining Charges | $ | 12,731 | | $ | - | | $ | - | | $ | - | | $ | - | | $ | 658 | | $ | 708 | | $ | 696 | | $ | 642 | | $ | 613 | | $ | 656 | | $ | 632 | | $ | 635 | | $ | 707 | | $ | 599 | | $ | 477 | | $ | 610 | | $ | 594 | | $ | 626 | | $ | 674 | | $ | 423 | | $ | 456 | | $ | 565 | | $ | 635 | | $ | 673 | | $ | 453 | | $ | - | | $ | - | | $ | - | |
| Cu Refining Charges | $ | 377,839 | | $ | - | | $ | - | | $ | - | | $ | - | | $ | 15,980 | | $ | 16,977 | | $ | 16,530 | | $ | 16,229 | | $ | 16,737 | | $ | 18,354 | | $ | 18,255 | | $ | 19,642 | | $ | 18,276 | | $ | 16,473 | | $ | 14,799 | | $ | 17,759 | | $ | 19,970 | | $ | 20,569 | | $ | 22,494 | | $ | 15,611 | | $ | 15,698 | | $ | 18,892 | | $ | 20,752 | | $ | 22,340 | | $ | 15,501 | | $ | - | | $ | - | | $ | - | |
| Transportation | $ | 639,192 | | $ | - | | $ | - | | $ | - | | $ | - | | $ | 27,034 | | $ | 28,720 | | $ | 27,964 | | $ | 27,455 | | $ | 28,314 | | $ | 31,050 | | $ | 30,882 | | $ | 33,228 | | $ | 30,918 | | $ | 27,867 | | $ | 25,035 | | $ | 30,042 | | $ | 33,784 | | $ | 34,797 | | $ | 38,053 | | $ | 26,409 | | $ | 26,557 | | $ | 31,960 | | $ | 35,106 | | $ | 37,792 | | $ | 26,223 | | $ | - | | $ | - | | $ | - | |
| Penalties | $ | - | | $ | - | | $ | - | | $ | - | | $ | - | | $ | - | | $ | - | | $ | - | | $ | - | | $ | - | | $ | - | | $ | - | | $ | - | | $ | - | | $ | - | | $ | - | | $ | - | | $ | - | | $ | - | | $ | - | | $ | - | | $ | - | | $ | - | | $ | - | | $ | - | | $ | - | | $ | - | | $ | - | | $ | - | |
| Total Operating Cost | $ | 8,302,311 | | $ | - | | | - | | | - | | | - | | | 443,835 | | | 442,237 | | | 410,632 | | | 405,296 | | | 407,477 | | | 430,855 | | | 416,746 | | | 405,350 | | | 418,586 | | | 390,282 | | | 435,434 | | | 416,398 | | | 427,640 | | | 429,483 | | | 437,115 | | | 402,577 | | | 338,035 | | | 329,753 | | | 332,056 | | | 335,502 | | | 247,023 | | | - | | | - | | | - | |
| Reclamation & Closure | $ | 100,000 | | $ | - | | $ | - | | $ | - | | $ | - | | $ | 4,762 | | $ | 4,762 | | $ | 4,762 | | $ | 4,762 | | $ | 4,762 | | $ | 4,762 | | $ | 4,762 | | $ | 4,762 | | $ | 4,762 | | $ | 4,762 | | $ | 4,762 | | $ | 4,762 | | $ | 4,762 | | $ | 4,762 | | $ | 4,762 | | $ | 4,762 | | $ | 4,762 | | $ | 4,762 | | $ | 4,762 | | $ | 4,762 | | $ | 4,762 | | $ | - | | $ | - | | $ | - | |
| Total Production Cost | $ | 8,402,311 | | $ | - | | $ | - | | $ | - | | $ | - | | $ | 448,597 | | $ | 446,999 | | $ | 415,394 | | $ | 410,057 | | $ | 412,239 | | $ | 435,617 | | $ | 421,508 | | $ | 410,112 | | $ | 423,348 | | $ | 395,043 | | $ | 440,195 | | $ | 421,160 | | $ | 432,402 | | $ | 434,244 | | $ | 441,877 | | $ | 407,339 | | $ | 342,797 | | $ | 334,515 | | $ | 336,817 | | $ | 340,264 | | $ | 251,785 | | $ | - | | $ | - | | $ | - | |
| Operating Income | $ | 9,320,793 | | $ | - | | $ | - | | $ | - | | $ | - | | $ | 387,283 | | $ | 472,410 | | $ | 466,813 | | $ | 451,549 | | $ | 452,369 | | $ | 481,623 | | $ | 417,967 | | $ | 475,269 | | $ | 430,717 | | $ | 364,584 | | $ | 226,334 | | $ | 388,470 | | $ | 455,466 | | $ | 482,738 | | $ | 558,225 | | $ | 274,977 | | $ | 351,457 | | $ | 505,107 | | $ | 589,149 | | $ | 653,922 | | $ | 434,367 | | $ | - | | $ | - | | $ | - | |
| Existing Asset Depreciation | $ | - | | $ | - | | $ | - | | $ | - | | $ | - | | $ | - | | $ | - | | $ | - | | $ | - | | $ | - | | $ | - | | $ | - | | $ | - | | $ | - | | $ | - | | $ | - | | $ | - | | $ | - | | $ | - | | $ | - | | $ | - | | $ | - | | $ | - | | $ | - | | $ | - | | $ | - | | $ | - | | $ | - | | $ | - | |
| Expansion Capital Depreciation | $ | 1,182,399 | | $ | - | | $ | - | | $ | - | | $ | - | | $ | 80,459 | | $ | 80,459 | | $ | 80,459 | | $ | 80,459 | | $ | 80,459 | | $ | 80,459 | | $ | 80,459 | | $ | 80,459 | | $ | 80,459 | | $ | 80,459 | | $ | 80,459 | | $ | 80,459 | | $ | 80,459 | | $ | 68,217 | | $ | 68,217 | | $ | - | | $ | - | | $ | - | | $ | - | | $ | - | | $ | - | | $ | - | | $ | - | | $ | - | |
| Sustaining Capital Depreciation | $ | 959,063 | | $ | - | | $ | - | | $ | - | | $ | - | | $ | 1,972 | | $ | 2,436 | | $ | 2,854 | | $ | 4,502 | | $ | 4,739 | | $ | 6,221 | | $ | 10,352 | | $ | 21,230 | | $ | 30,060 | | $ | 40,987 | | $ | 47,944 | | $ | 59,267 | | $ | 69,715 | | $ | 82,699 | | $ | 90,810 | | $ | 96,743 | | $ | 92,822 | | $ | 87,446 | | $ | 78,816 | | $ | 68,089 | | $ | 59,359 | | $ | - | | $ | - | | $ | - | |
| Total Depreciation | $ | 2,141,461 | | $ | - | | $ | - | | $ | - | | $ | - | | $ | 82,431 | | $ | 82,895 | | $ | 83,313 | | $ | 84,960 | | $ | 85,198 | | $ | 86,680 | | $ | 90,811 | | $ | 101,689 | | $ | 110,519 | | $ | 121,446 | | $ | 128,403 | | $ | 139,725 | | $ | 150,173 | | $ | 150,916 | | $ | 159,028 | | $ | 96,743 | | $ | 92,822 | | $ | 87,446 | | $ | 78,816 | | $ | 68,089 | | $ | 59,359 | | $ | - | | $ | - | | $ | - | |
| Taxable Income | $ | 7,179,332 | | | - | | | - | | | - | | | - | | | 304,851 | | | 389,515 | | | 383,500 | | | 366,588 | | $ | 367,171 | | $ | 394,943 | | $ | 327,156 | | $ | 373,580 | | $ | 320,198 | | $ | 243,138 | | $ | 97,931 | | $ | 248,745 | | $ | 305,293 | | $ | 331,821 | | $ | 399,197 | | $ | 178,234 | | $ | 258,635 | | $ | 417,661 | | $ | 510,333 | | $ | 585,833 | | $ | 375,008 | | $ | - | | $ | - | | $ | - | |
| Income Taxes | $ | 2,584,559 | | | - | | | - | | | - | | | - | | | 109,746 | | | 140,225 | | | 138,060 | | | 131,972 | | | 132,181 | | | 142,180 | | | 117,776 | | | 134,489 | | | 115,271 | | | 87,530 | | | 35,255 | | | 89,548 | | | 109,906 | | | 119,456 | | | 143,711 | | | 64,164 | | | 93,109 | | | 150,358 | | | 183,720 | | | 210,900 | | | 135,003 | | | - | | | - | | | - | |
| Net Income After Taxes | $ | 4,594,772 | | | - | | | - | | | - | | | - | | | 195,105 | | | 249,290 | | | 245,440 | | | 234,617 | | | 234,989 | | | 252,764 | | | 209,380 | | | 239,091 | | | 204,927 | | | 155,608 | | | 62,676 | | | 159,197 | | | 195,388 | | | 212,366 | | | 255,486 | | | 114,070 | | | 165,526 | | | 267,303 | | | 326,613 | | | 374,933 | | | 240,005 | | | - | | | - | | | - | |
| Cash Flow ($000) | | | | | | | | | | | | | | | | | | | | | | | | | | | | | | | | | | | | | | | | | | | | | | | | | | | | | | | | | | | | | | | | | | | | | | | | | | | | | | | | | | | | | | | |
| Operating Income | $ | 9,320,793 | | $ | - | | $ | - | | $ | - | | $ | - | | $ | 387,283 | | $ | 472,410 | | $ | 466,813 | | $ | 451,549 | | $ | 452,369 | | $ | 481,623 | | $ | 417,967 | | $ | 475,269 | | $ | 430,717 | | $ | 364,584 | | $ | 226,334 | | $ | 388,470 | | $ | 455,466 | | $ | 482,738 | | $ | 558,225 | | $ | 274,977 | | $ | 351,457 | | $ | 505,107 | | $ | 589,149 | | $ | 653,922 | | $ | 434,367 | | $ | - | | $ | - | | $ | - | |
| Working Capital | | | | | | | | | | | | | | | | | | | | | | | | | | | | | | | | | | | | | | | | | | | | | | | | | | | | | | | | | | | | | | | | | | | | | | | | | | | | | | | | | | | | | | | |
| Account Receivable (10 days) | $ | 0 | | $ | - | | $ | - | | $ | - | | $ | - | | $ | (6,570 | ) | | (7,241 | ) | | (372 | ) | | 463 | | | 151 | | | (412 | ) | | 247 | | | 297 | | | (120 | ) | | 970 | | | 1,476 | | | (385 | ) | | (1,717 | ) | | (826 | ) | | (873 | ) | | 1,833 | | | 2,381 | | | (1,230 | ) | | (1,806 | ) | | (1,203 | ) | | 1,869 | | | 7,734 | | | 5,336 | | | - | |
| Accounts Payable (30 days) | $ | - | | $ | 33,454 | | $ | 84,944 | | $ | 21,264 | | $ | (132,613 | ) | $ | 32,620 | | $ | (6,622 | ) | $ | (2,572 | ) | $ | 1,878 | | $ | (2,509 | ) | $ | 3,796 | | $ | 3,693 | | $ | 11,021 | | $ | (2,320 | ) | $ | 1,938 | | $ | 484 | | $ | 2,917 | | $ | (1,284 | ) | $ | 6,865 | | $ | (11,287 | ) | $ | (2,862 | ) | $ | (18,457 | ) | $ | 8,182 | | $ | (9,923 | ) | $ | (102 | ) | $ | (5,607 | ) | $ | (16,897 | ) | $ | - | | $ | - | |
| VAT Payable | $ | (1,141,807 | ) | $ | (23,136 | ) | $ | (75,267 | ) | $ | (100,136 | ) | $ | (53,238 | ) | $ | (47,788 | ) | $ | (42,639 | ) | $ | (38,882 | ) | $ | (39,935 | ) | $ | (38,151 | ) | $ | (41,739 | ) | $ | (43,441 | ) | $ | (49,705 | ) | $ | (49,579 | ) | $ | (49,719 | ) | $ | (53,881 | ) | $ | (53,342 | ) | $ | (52,312 | ) | $ | (56,937 | ) | $ | (48,855 | ) | $ | (47,367 | ) | $ | (30,101 | ) | $ | (33,851 | ) | $ | (26,370 | ) | $ | (25,875 | ) | $ | (19,559 | ) | $ | - | | $ | - | | $ | - | |
| VAT Receivable | $ | 1,141,807 | | $ | - | | $ | - | | $ | 98,403 | | $ | 100,136 | | $ | 53,238 | | $ | 47,788 | | $ | 42,639 | | $ | 38,882 | | $ | 39,935 | | $ | 38,151 | | $ | 41,739 | | $ | 43,441 | | $ | 49,705 | | $ | 49,579 | | $ | 49,719 | | $ | 53,881 | | $ | 53,342 | | $ | 52,312 | | $ | 56,937 | | $ | 48,855 | | $ | 47,367 | | $ | 30,101 | | $ | 33,851 | | $ | 26,370 | | $ | 25,875 | | $ | 19,559 | | $ | - | | $ | - | |
| Inventory - Parts, Supplies | $ | (30,000 | ) | $ | - | | $ | (5,000 | ) | $ | (12,500 | ) | $ | (12,500 | ) | $ | - | | $ | - | | $ | - | | $ | - | | $ | - | | $ | - | | $ | - | | $ | - | | $ | - | | $ | - | | $ | - | | $ | - | | $ | - | | $ | - | | $ | - | | $ | - | | $ | - | | $ | - | | $ | - | | $ | - | | $ | - | | $ | - | | $ | - | | $ | - | |
| Total Working Capital | $ | (30,000 | ) | | 10,318 | | | 4,677 | | | 7,031 | | | (98,215 | ) | | 31,499 | | | (8,715 | ) | | 812 | | | 1,288 | | | (574 | ) | | (204 | ) | | 2,237 | | | 5,054 | | | (2,314 | ) | | 2,768 | | | (2,202 | ) | | 3,071 | | | (1,971 | ) | | 1,414 | | | (4,078 | ) | | 459 | | | 1,191 | | | 3,202 | | | (4,248 | ) | | (810 | ) | | 2,577 | | | 10,396 | | | 5,336 | | | - | |
| Capital Expenditures | | | | | | | | | | | | | | | | | | | | | | | | | | | | | | | | | | | | | | | | | | | | | | | | | | | | | | | | | | | | | | | | | | | | | | | | | | | | | | | | | | | | | | | |
| Project Capital | | | | | | | | | | | | | | | | | | | | | | | | | | | | | | | | | | | | | | | | | | | | | | | | | | | | | | | | | | | | | | | | | | | | | | | | | | | | | | | | | | | | | | | |
| Mine | $ | 260,194 | | $ | 52,039 | | $ | 156,116 | | $ | 52,039 | | $ | - | | $ | - | | $ | - | | $ | - | | $ | - | | $ | - | | $ | - | | $ | - | | $ | - | | $ | - | | $ | - | | $ | - | | $ | - | | $ | - | | $ | - | | $ | - | | $ | - | | $ | - | | $ | - | | $ | - | | $ | - | | $ | - | | $ | - | | $ | - | | $ | - | |
| Process Plant, Tailings Facility, | | | | | | | | | | | | | | | | | | | | | | | | | | | | | | | | | | | | | | | | | | | | | | | | | | | | | | | | | | | | | | | | | | | | | | | | | | | | | | | | | | | | | | | |
| Infrastructure | $ | 960,000 | | $ | 96,000 | | $ | 288,000 | | $ | 480,000 | | $ | 76,800 | | $ | 19,200 | | $ | - | | $ | - | | $ | - | | $ | - | | $ | - | | $ | - | | $ | - | | $ | - | | $ | - | | $ | - | | $ | - | | $ | - | | $ | - | | $ | - | | $ | - | | $ | - | | $ | - | | $ | - | | $ | - | | $ | - | | $ | - | | $ | - | | $ | - | |
| Owners Cost | $ | 145,406 | | $ | 35,580 | | $ | 36,872 | | $ | 63,005 | | $ | 9,949 | | $ | - | | $ | - | | $ | - | | $ | - | | $ | - | | $ | - | | $ | - | | $ | - | | $ | - | | $ | - | | $ | - | | $ | - | | $ | - | | $ | - | | $ | - | | $ | - | | $ | - | | $ | - | | $ | - | | $ | - | | $ | - | | $ | - | | $ | - | | $ | - | |
| Pre-Production Cost/Credit | $ | (1,731 | ) | $ | - | | $ | 116,367 | | $ | 81,438 | | $ | (199,536 | ) | $ | - | | $ | - | | $ | - | | $ | - | | $ | - | | $ | - | | $ | - | | $ | - | | $ | - | | $ | - | | $ | - | | $ | - | | $ | - | | $ | - | | $ | - | | $ | - | | $ | - | | $ | - | | $ | - | | $ | - | | $ | - | | $ | - | | $ | - | | $ | - | |
| Sustaining Capital | | | | | | | | | | | | | | | | | | | | | | | | | | | | | | | | | | | | | | | | | | | | | | | | | | | | | | | | | | | | | | | | | | | | | | | | | | | | | | | | | | | | | | | |
| Equipment, dewatering, pyrite tails, | | | | | | | | | | | | | | | | | | | | | | | | | | | | | | | | | | | | | | | | | | | | | | | | | | | | | | | | | | | | | | | | | | | | | | | | | | | | | | | | | | | | | | | |
| leach pad | $ | 499,053 | | $ | - | | $ | - | | $ | - | | $ | - | | $ | 19,530 | | $ | 4,637 | | $ | 4,182 | | $ | 16,474 | | $ | 2,375 | | $ | 2,075 | | $ | 8,575 | | $ | 55,089 | | $ | 56,078 | | $ | 56,084 | | $ | 55,628 | | $ | 55,595 | | $ | 28,835 | | $ | 66,078 | | $ | 2,096 | | $ | 2,614 | | $ | 2,096 | | $ | 55,014 | | $ | 2,000 | | $ | 2,000 | | $ | 2,000 | | $ | - | | $ | - | | $ | - | |
| Stripping | $ | 593,703 | | $ | - | | $ | - | | $ | - | | $ | - | | $ | 194 | | $ | - | | $ | - | | $ | - | | $ | - | | $ | 12,745 | | $ | 32,735 | | $ | 53,688 | | $ | 32,222 | | $ | 53,189 | | $ | 33,665 | | $ | 62,268 | | $ | 79,828 | | $ | 80,238 | | $ | 81,393 | | $ | 71,538 | | $ | - | | $ | - | | $ | - | | $ | - | | $ | - | | $ | - | | $ | - | | $ | - | |
| Total Capital Expenditures | $ | 2,456,625 | | $ | 183,619 | | $ | 597,355 | | $ | 676,481 | | $ | (112,786 | ) | $ | 38,924 | | $ | 4,637 | | $ | 4,182 | | $ | 16,474 | | $ | 2,375 | | $ | 14,820 | | $ | 41,310 | | $ | 108,777 | | $ | 88,300 | | $ | 109,272 | | $ | 89,293 | | $ | 117,863 | | $ | 108,663 | | $ | 146,316 | | $ | 83,489 | | $ | 74,152 | | $ | 2,096 | | $ | 55,014 | | $ | 2,000 | | $ | 2,000 | | $ | 2,000 | | $ | - | | $ | - | | $ | - | |
| Add back: Reclaimation Accretion | $ | 100,000 | | $ | - | | $ | - | | $ | - | | $ | - | | $ | 4,762 | | $ | 4,762 | | $ | 4,762 | | $ | 4,762 | | $ | 4,762 | | $ | 4,762 | | $ | 4,762 | | $ | 4,762 | | $ | 4,762 | | $ | 4,762 | | $ | 4,762 | | $ | 4,762 | | $ | 4,762 | | $ | 4,762 | | $ | 4,762 | | $ | 4,762 | | $ | 4,762 | | $ | 4,762 | | $ | 4,762 | | $ | 4,762 | | $ | 4,762 | | $ | - | | $ | - | | $ | - | |
| Deduct: Cash Reclamation | $ | (100,000 | ) | $ | - | | $ | - | | $ | - | | $ | - | | $ | - | | $ | - | | $ | - | | $ | - | | $ | - | | $ | - | | $ | (2,000 | ) | $ | (2,000 | ) | $ | (2,000 | ) | $ | - | | $ | - | | $ | (2,000 | ) | $ | (2,000 | ) | $ | - | | $ | (2,000 | ) | $ | (2,000 | ) | $ | (2,000 | ) | $ | - | | $ | - | | $ | (2,000 | ) | $ | (2,000 | ) | $ | (26,667 | ) | $ | (26,667 | ) | $ | (26,667 | ) |
| Cash Flow before Taxes | $ | 6,834,168 | | $ | (173,301 | ) | $ | (592,678 | ) | $ | (669,450 | ) | $ | 14,572 | | $ | 384,620 | | $ | 463,820 | | $ | 468,206 | | $ | 441,124 | | $ | 454,181 | | $ | 471,362 | | $ | 381,656 | | $ | 374,307 | | $ | 342,865 | | $ | 262,841 | | $ | 139,601 | | $ | 276,440 | | $ | 347,595 | | $ | 342,597 | | $ | 473,419 | | $ | 204,047 | | $ | 353,314 | | $ | 458,057 | | $ | 587,663 | | $ | 653,873 | | $ | 437,706 | | $ | (16,271 | ) | $ | (21,331 | ) | $ | (26,667 | ) |
| Cumulative Cash Flow before Taxes | $ | - | | $ | (173,301 | ) | $ | (765,979 | ) | $ | (1,435,430 | ) | $ | (1,420,858 | ) | $ | (1,036,238 | ) | $ | (572,418 | ) | $ | (104,213 | ) | $ | 336,912 | | $ | 791,093 | | $ | 1,262,455 | | $ | 1,644,111 | | $ | 2,018,418 | | $ | 2,361,283 | | $ | 2,624,124 | | $ | 2,763,725 | | $ | 3,040,165 | | $ | 3,387,760 | | $ | 3,730,357 | | $ | 4,203,776 | | $ | 4,407,823 | | $ | 4,761,137 | | $ | 5,219,194 | | $ | 5,806,857 | | $ | 6,460,731 | | $ | 6,898,437 | | $ | 6,882,166 | | $ | 6,860,835 | | $ | 6,834,168 | |
| Taxes | | | | | | | | | | | | | | | | | | | | | | | | | | | | | | | | | | | | | | | | | | | | | | | | | | | | | | | | | | | | | | | | | | | | | | | | | | | | | | | | | | | | | | | |
| Income Taxes | $ | 2,584,559 | | $ | - | | $ | - | | $ | - | | $ | - | | $ | 109,746 | | $ | 140,225 | | $ | 138,060 | | $ | 131,972 | | $ | 132,181 | | $ | 142,180 | | $ | 117,776 | | $ | 134,489 | | $ | 115,271 | | $ | 87,530 | | $ | 35,255 | | $ | 89,548 | | $ | 109,906 | | $ | 119,456 | | $ | 143,711 | | $ | 64,164 | | $ | 93,109 | | $ | 150,358 | | $ | 183,720 | | $ | 210,900 | | $ | 135,003 | | $ | - | | $ | - | | $ | - | |
| Cash Flow after Taxes | $ | 4,249,609 | | $ | (173,301 | ) | $ | (592,678 | ) | $ | (669,450 | ) | $ | 14,572 | | $ | 274,873 | | $ | 323,594 | | $ | 330,146 | | $ | 309,153 | | $ | 322,000 | | $ | 329,182 | | $ | 263,880 | | $ | 239,819 | | $ | 227,594 | | $ | 175,311 | | $ | 104,346 | | $ | 186,892 | | $ | 237,689 | | $ | 223,141 | | $ | 329,708 | | $ | 139,883 | | $ | 260,205 | | $ | 307,699 | | $ | 403,943 | | $ | 442,973 | | $ | 302,703 | | $ | (16,271 | ) | $ | (21,331 | ) | $ | (26,667 | ) |
| Cumulative Cash Flow after Taxes | | - | | $ | (173,301 | ) | $ | (765,979 | ) | $ | (1,435,430 | ) | $ | (1,420,858 | ) | $ | (1,145,984 | ) | $ | (822,390 | ) | $ | (492,245 | ) | $ | (183,092 | ) | $ | 138,908 | | $ | 468,090 | | $ | 731,970 | | $ | 971,788 | | $ | 1,199,382 | | $ | 1,374,693 | | $ | 1,479,039 | | $ | 1,665,931 | | $ | 1,903,620 | | $ | 2,126,762 | | $ | 2,456,470 | | $ | 2,596,353 | | $ | 2,856,558 | | $ | 3,164,257 | | $ | 3,568,201 | | $ | 4,011,174 | | $ | 4,313,877 | | $ | 4,297,606 | | $ | 4,276,275 | | $ | 4,249,609 | |
| Economic Indicators before Taxes ($000) | | | | | | | | | | | | | | | | | | | | | | | | | | | | | | | | | | | | | | | | | | | | | | | | | | | | | | | | | | | | | | | | | | | | | | | | | | | | | | | | | | | | | | | |
| NPV @ 0% | | 0% | | $ | 6,834,168 | | | | | | | | | | | | | | | | | | | | | | | | | | | | | | | | | | | | | | | | | | | | | | | | | | | | | | | | | | | | | | | | | | | | | | | | | | | | | | | | | | |
| NPV @ 5% | | 5% | | $ | 2,879,845 | | | | | | | | | | | | | | | | | | | | | | | | | | | | | | | | | | | | | | | | | | | | | | | | | | | | | | | | | | | | | | | | | | | | | | | | | | | | | | | | | | |
| NPV @ 8% | | 8% | | $ | 1,721,131 | | | | | | | | | | | | | | | | | | | | | | | | | | | | | | | | | | | | | | | | | | | | | | | | | | | | | | | | | | | | | | | | | | | | | | | | | | | | | | | | | | |
| NPV @ 10% | | 10% | | $ | 1,205,510 | | | | | | | | | | | | | | | | | | | | | | | | | | | | | | | | | | | | | | | | | | | | | | | | | | | | | | | | | | | | | | | | | | | | | | | | | | | | | | | | | | |
| IRR | | | | | 20.5% | | | | | | | | | | | | | | | | | | | | | | | | | | | | | | | | | | | | | | | | | | | | | | | | | | | | | | | | | | | | | | | | | | | | | | | | | | | | | | | | | | |
| Payback | | Years | | | 3.2 | | | | | | | | | | | | | | | | | | | | | | | | | | | | | | | | | | | | | | | | | | | | | | | | | | | | | | | | | | | | | | | | | | | | | | | | | | | | | | | | | | |
| Economic Indicators after Taxes ($000) | | | | | | | | | | | | | | | | | | | | | | | | | | | | | | | | | | | | | | | | | | | | | | | | | | | | | | | | | | | | | | | | | | | | | | | | | | | | | | | | | | | | | | | |
| NPV @ 0% | | 0% | | $ | 4,249,609 | | | | | | | | | | | | | | | | | | | | | | | | | | | | | | | | | | | | | | | | | | | | | | | | | | | | | | | | | | | | | | | | | | | | | | | | | | | | | | | | | | |
| NPV @ 5% | | 5% | | $ | 1,593,680 | | | | | | | | | | | | | | | | | | | | | | | | | | | | | | | | | | | | | | | | | | | | | | | | | | | | | | | | | | | | | | | | | | | | | | | | | | | | | | | | | | |
| NPV @ 8% | | 8% | | $ | 823,800 | | | | | | | | | | | | | | | | | | | | | | | | | | | | | | | | | | | | | | | | | | | | | | | | | | | | | | | | | | | | | | | | | | | | | | | | | | | | | | | | | | |
| NPV @ 10% | | 10% | | $ | 484,719 | | | | | | | | | | | | | | | | | | | | | | | | | | | | | | | | | | | | | | | | | | | | | | | | | | | | | | | | | | | | | | | | | | | | | | | | | | | | | | | | | | |
| IRR | | | | | 14.7% | | | | | | | | | | | | | | | | | | | | | | | | | | | | | | | | | | | | | | | | | | | | | | | | | | | | | | | | | | | | | | | | | | | | | | | | | | | | | | | | | | |
| Payback | | Years | | | 4.6 | | | | | | | | | | | | | | | | | | | | | | | | | | | | | | | | | | | | | | | | | | | | | | | | | | | | | | | | | | | | | | | | | | | | | | | | | | | | | | | | | | |
| 168 |
| LA ARENA PROJECT |
| FORM 43-101F1 TECHNICAL REPORT |
The region displays a particularly rich endowment of precious and base metals occurring in epithermal and porphyry settings, including the Shahuindo mine, Lagunas Norte mine, Quiruvilca mine, La Virgen mine and Cerro El Toro mine. See Figure 23-1.
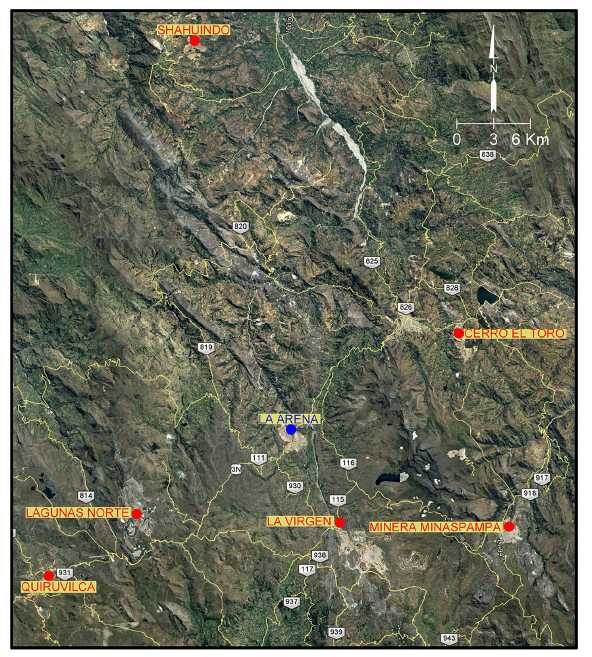
Figure 23-1: Adjacent Properties
Barrick Gold operates and owns the Lagunas Norte mine which is located 13 km from La Arena deposit. According with Barrick’s website, Lagunas Norte produced 387 thousand ounces of gold in 2017. Production in 2018 is anticipated to be 230 to 270 thousand ounces of gold at an all-in sustaining costs of $670-$780 per ounce. Proven and Probable Mineral Reserves as of December 31, 2017 were estimated at 4.0 million ounces of gold.
| 169 |
| LA ARENA PROJECT |
| FORM 43-101F1 TECHNICAL REPORT |
Tahoe owns and operates the Shahuindo Mine located 30 km north of the La Arena Mine. As reported in Tahoe’s February 15, 2018 Mineral Reserves and Mineral Resources update, the Proven and Probable Mineral Reserves as of January 1, 2018 at Shahuindo are estimated at 1.9 million ounces of gold and 23.1 million ounces of silver.
| 170 |
| LA ARENA PROJECT |
| FORM 43-101F1 TECHNICAL REPORT |
| 24 | OTHER RELEVANT DATA AND INFORMATION |
There is no additional information or explanation necessary to make the Technical Report understandable and not misleading.
| 171 |
| LA ARENA PROJECT |
| FORM 43-101F1 TECHNICAL REPORT |
| 25 | INTERPRETATION AND CONCLUSIONS |
The La Arena Project is registered in the name La Arena S.A., which is a wholly-owned subsidiary of Tahoe Resources Inc. The La Arena Project consists of the currently operating sediment-hosted oxide gold heap leach La Arena Mine and the La Arena II porphyry copper-gold project. While both the La Arena Mine and the La Arena II Project occur within the overall La Arena property, they are stand-alone projects and independent of each other. The La Arena II Project would not be an expansion of the current operation; rather it would be a separate operation constructed at the end of the La Arena Mine life. There are no shared facilities between the La Arena Mine and the proposed La Arena II Project except for the existing ADR plant, which would be used to recover gold from the oxide portion of La Arena II, and the assay laboratory, which would be relocated and expanded for use at the La Arena II Project.
Conclusions of this study relevant to both the La Arena Mine and the La Arena Project:
| • | Drilling and sampling practices are appropriate for the La Arena Mine oxide gold deposit and for the La Arena II porphyry-hosted copper-gold deposit. Data collection and geologic interpretation provide for a reliable representation of the deposits to use in support of Mineral Resource estimations. |
| • | The results of multiple data verification programs found that the analytical data and QA/QC is sufficient to ensure the dataset used for Mineral Resource estimation is reliable for estimation purposes and the assignment of Measured, Indicated and Inferred Mineral Resource classifications. |
The results of this study conclude:
| • | The La Arena Mine, including the gold oxide Mineral Resources and Mineral Reserves contained within, is situated entirely within valid mineral concessions owned by the Company. Only minor additions to the Company’s surface land holdings are necessary to complete the current life of mine plans. |
| | | |
| • | The La Arena Mine entered production in 2011 and has been successfully operated at design levels, particularly in terms of mining rate and process recovery. Through the end of 2017, the mine had extracted 82.2 million tonnes of oxide ore at an average gold grade of 0.58 g/t, producing over 1.5 million ounces of saleable gold. |
| | | |
| • | Measured and Indicated Mineral Resources at January 1, 2018 total 49.9 million tonnes at an average gold grade of 0.40 g/t containing 643.5 thousand ounces of gold. Inferred Mineral Resources at January 1, 2018 total 0.4 million tonnes at an average gold grade of 0.32 g/t containing 4.3 thousand ounces of gold. |
| | | |
| • | Proven and Probable Mineral Reserves at January 1, 2018 for the La Arena Mine total 44.0 million tonnes with an average gold grade of 0.40 g/t containing 568.4 thousand ounces of gold. |
| | | |
| • | The La Arena Mine is a mature operation. There is good understanding of the geology and geologic controls on mineralization, optimal mining practices, process recoveries, and operating and sustaining capital costs. |
| | | |
| • | Increasingly positive production reconciliations are likely the result of the pit nearing the limits of the tightly- spaced definition drilling. Geologic mapping has revealed an increase in the density and extent of higher- grade Tilsa and associated structures that were not evident with the current drill density in the lower portions of the resource. Drilling to better define the resource with the potential to extend the mine life was initiated in late 2017. |
| 172 |
| LA ARENA PROJECT |
| FORM 43-101F1 TECHNICAL REPORT |
| • | All permits required for the current operation of the La Arena Mine are current. A modified Environmental Impact Study (EIAd) will likely be required to accommodate the life of mine waste dump and leach pads. |
| | | |
| • | Assuming the La Arena mine operates within its permit requirements, the authors do not reasonably foresee any risks on the project’s continued economic viability. |
The results of the preliminary economic analysis conclude:
| • | The preliminary economic assessment for the La Arena II Project indicates the potential economic viability of the porphyry-hosted copper-gold deposit. The PEA of the project shows a life of mine after-tax net income of $4.6 billion, with an NPV8 of $824 million, an IRR of 14.7% and payback of 4.6 years. Average annual after-tax cash flow is estimated to be $273 million. |
| | | |
| • | The La Arena II Project, including the copper-gold Mineral Resources and Mineral Reserves, is situated within valid mineral concessions owned by the Company. Additional surface lands of approximately 1,200 hectares would need to be acquired to fully execute the life of mine plan as envisioned in this study. |
| | | |
| • | Measured and Indicated Mineral Resources at January 1, 2018 for the La Arena II Project total 742.4 million tonnes with average gold and copper grades of 0.24 g/t and 0.35%, respectively, containing 5.6 million ounces of gold and 5.8 billion pounds of copper. Inferred Mineral Resources at January 1, 2018 total 91.6 million tonnes with average gold and copper grades of 0.23 g/t and 0.17%, respectively, containing 683 thousand ounces of gold and 349 million pounds of copper. |
| | | |
| • | There are no Mineral Reserves reported in the 2018 La Arena PEA, as the scope of the project has changed significantly with a refined geologic model, updated Mineral Resource estimate, increased mining and processing rates, modified processing scheme, and the use of alternative tailings disposal facilities. While a portion of the data generated for the 2015 feasibility study provides support for some of the assumptions incorporated into the 2018 La Arena II PEA, much of the mining, processing, geotechnical, hydrological, social, and capital and operating cost parameters used in the prior study are no longer applicable to the project as envisioned in this Technical Report. |
| | | |
| • | The La Arena II PEA mine plan extracts a total of 616.4 million tonnes of sulfide resources (including supergene and transitional oxide-sulfide resources) with an average copper grade of 0.38% and average gold grade of 0.24 g/t containing 5.2 billion pounds of copper and 4.8 million ounces of gold to be delivered for processing into a copper-gold concentrate. An additional 69.5 million tonnes of oxide resources with an average gold grade of 0.30 g/t containing 669.4 thousand ounces of gold to delivered to the leach pads. |
| | | |
| • | Sulfide resources would be processed using conventional crushing, grinding, and flotation. This study envisions the flotation circuits will produce a pyrite concentrate that will be stored in a dedicated lined facility and a copper concentrate containing gold. Doré would be produced from leaching oxide mineral resources in a new heap leach facility constructed within the dry stack tailings facility. |
| | | |
| • | Average annual production (excluding pre-production) is estimated to be 207 million pounds of saleable copper and 150 thousand ounces of saleable gold over the 21 year mine life, with additional pre-production recovery of 115 million pounds of copper and 226 thousand ounces of gold. |
| | | |
| • | The estimated initial capital costs of $1.36 billion, life of mine sustaining capital costs of $1.09 billion, and operating costs of $12.87 per tonne processed are reasonable estimates based on the level of study and comparisons to similarly sized operations. The average co-product cost is estimated to be $546 per ounce of saleable gold and $1.52 per pound of saleable copper. |
| 173 |
| LA ARENA PROJECT |
| FORM 43-101F1 TECHNICAL REPORT |
| • | The La Arena S.A. geologists have a good understanding of the deposit geology, particularly regarding the delineation of the different intrusive phases, which is key to understanding the distribution of copper and gold mineralization and applying the use of grade domains to properly constrain the resource modeling to the appropriate intrusive phases. |
| | | |
| • | The La Arena II porphyry system is open at depth. While the porphyry bodies appear to be narrowing, the deepest drilling in the deposit does not show a decrease in grades within the FPA-2 porphyry phase with depth. |
| | | |
| • | Metallurgical assumptions used in the LA Arena PEA are reasonable and based on the results of existing test work; however, as the processing scheme has changed significantly, additional test work needs to be done to validate and improve on the METSIM™ processing model. |
| | | |
| • | Hydrology and hydrogeology of the La Arena II Project is poorly understood and considerable work is necessary to understand the hydrology as it relates to pit dewatering, waste dump and tailings storage areas, and the availability of process make-up water. |
| | | |
| • | While the geotechnical parameters used in the La Arena II pit design are reasonable, they were extrapolated from existing data which focused on the Calaorco pit and the shallow pit considered by the previous operator of the property. Additional geotechnical assessment is necessary for the pit wall slope design. |
| | | |
| • | There is limited data regarding the geochemistry of the waste rock and tailings. The creation of pyrite concentrate/tailings will greatly reduce the potential for the tailings to create acidic effluent, but test work is needed to adequately characterize the waste rock and tailings produced over the life of the mine. |
While the authors have confidence in the level of study completed and the results of the La Arena II PEA, it is with the understanding that the La Arena II PEA is preliminary in nature and includes Inferred Mineral Resources that are considered too speculative geologically to have the economic considerations applied to them that would enable them to be categorized as Mineral Reserves, and there is no certainty that the preliminary economic assessment will be realized.
| 174 |
| LA ARENA PROJECT |
| FORM 43-101F1 TECHNICAL REPORT |
The La Arena Mine is a mature operation and well understood in terms of geology, resources, mining, processing and capital and operating costs. As the open pit is in the early stages of its final phase, and nearing the depth extent of the existing resource definition drilling, positive production reconciliation of ore tonnes and gold grades to those predicted have prompted the Company to drill below the currently designed pit limits to evaluate the potential to expand resources and reserves and extend the life of the mine. The current resource expansion program includes drilling approximately 4,400 meters to target the higher-grade Tilsa-style structures. If initial results of this program are successful, it is recommended to expand the drilling program to a level where increased drill density will support a re-evaluation of the Mineral Resources with potential for economic extraction. The amount of drilling and specific locations of drill holes is best determined by the mine geologists, but it is reasonable to recommend that an additional 10,000 meters of drilling would be necessary to support another phase of the pit. The cost of the additional drilling would total approximately $2.5 million.
The La Arena II Project is in the early stages of conceptualization and design, though with a considerable amount of data to support the project as envisioned in this PEA which needs to be expanded on should the Company choose to advance the La Arena II Project to the pre-feasibility or feasibility level. Primary areas in need of further study are discussed below.
| 26.2.1 | Resource Definition |
The majority of the La Arena II porphyry deposit has been drilled at nominal 50-meter drill spacing. However, there are areas in the central portion of the deposit where the drill spacing is wider and additional drilling is needed. The existing drilling in this area demonstrates the continuity of the porphyry and associated mineralization, but is inadequate for Measured or Indicated Mineral Resource classification. Likewise, Inferred Mineral Resources occur within the lower limits of the PEA designed pit and it is recommended that drilling within the pit shell be conducted to upgrade these resources to Measured or Indicated Mineral Resource classification. A total of 24 core holes, ranging from 800 meters to 1,200 meters for a total of 24,800 meters, are recommended to accomplish this goal.
| | • | Drilling | $5,650,000 |
| | • | Logging and sample processing | $195,000 |
| | • | Assay Sample | $430,000 |
Estimated cost of this work is $6,275,000.
| 26.2.2 | Metallurgical Testing |
The current metallurgical database includes data from five test work programs. Two series of test performed by SGS Lakefield Research Ltd. of Ontario, Canada and three performed by G&T Metallurgical Services Ltd. (ALS Metallurgy) of Kamloops, British Columbia, Canada.
Blue Coast Metallurgy of British Columbia, Canada reviewed the results of this test and proposed a testing strategy for the next phase of this project. Testing strategy includes:
| | • | Sample prep | $70,000 |
| | • | Grindability testing | $90,000 |
| 175 |
| LA ARENA PROJECT |
| FORM 43-101F1 TECHNICAL REPORT |
| | • | Variability study | $215,000 |
| | • | Flotation | $223,000 |
| | • | Tails dewatering | $47,000 |
| | • | Project management | $155,000 |
| | • | Reports, IGV and contingency | $300,000 |
The estimated cost of this work is $1,100,000.
| 26.2.3 | Waste and Tails Storage Facilities |
Geotechnical testing is needed to evaluate the foundation of the waste/tailings storage facilities. Evaluation includes:
| | • | Excavate and log approximately 120 test pits | $150,000 |
| | • | Drill, sample, test, and log approximately 25 boreholes | $200,000 |
| | • | Geotechnical testing of samples | $80,000 |
| | • | Consultant and reporting | $150,000 |
The cost of this work is estimated to be $580,000.
| 26.2.4 | Hydrology and Hydrogeology |
As most studies conducted to date were focused on the La Arena Mine, further work is needed to characterize the hydrology and hydrogeology of the La Arena II Project area, given its expansive dimensions and depth. Such investigations include: Groundwater studies of the area of the waste and tailings storage facilities. Recommendations evaluations includes:
| | • | Drill. Sample, log, and instrument boreholes | $200,000 |
| | • | Water sampling and testing | $100,000 |
| | • | Groundwater modeling | $250,000 |
| | • | Consultants and reporting | $150,000 |
The cost of this work is estimated to be $700,000.
The current hydrologic data is inadequate to support the evaluation of dewatering requirements to the proposed depth of the pit. Therefore, additional dewatering investigations will involve the construction of several piezometers and small diameter test wells. Recommended test work includes:
| | • | Test holes and piezometers | $1,200,000 |
| | • | Production wells | $2,300,000 |
| | • | Pumping test | $200,000 |
| | • | Consults and reporting | $600,000 |
The estimated cost of this work would be $4,300,000.
In addition to dewatering, testing is needed to identify an adequate supply of process make-up water. Recommended testing includes:
| | • | Test holes and piezometers | $720,000 |
| | • | Production wells | $2,250,000 |
| 176 |
| LA ARENA PROJECT |
| FORM 43-101F1 TECHNICAL REPORT |
| | • | Pumping test | $300,000 |
| | • | Consults and reporting | $450,000 |
The estimated cost of this work would be $3,720,000.
After mining, the formation of a pit lake is expected. Recommended pit lake testing includes:
| | • | Pit lake refill model | $750,000 |
| | • | Pit lake water quality model | $300,000 |
| | • | Project management and reports | $100,000 |
The approximate cost of this work $1,150,000.
Geochemistry work is needed to better understand and classify the characteristics of the waste rock and tailings from the La Arena II project. Sufficient fresh material would be provided from the resource definition drilling program described above. Recommended geochemical testing includes:
| | • | Meteoric Water Mobility Procedure (MWMP) | $111,000 |
| | • | Acid-Base Accounting (ABA) | $63,000 |
| | • | Geochem Kinetic analysis | $426,000 |
| | • | Consultants and reporting | $400,000 |
The estimated cost of this work would be $1,000,000.
Pit design parameters used for the La Arena II PEA were extrapolated from existing data which focused on the smaller pit considered by the previous operator. Geotechnical assessment should be undertaken to provide detailed recommendations for pit wall slope design for the pit considered in the PEA. Recommended work for this study includes:
| | • | Drilling of oriented core holes | $2,304,000 |
| | • | Logging and processing of core | $206,000 |
| | • | Consultants and reporting | $90,000 |
The approximate cost of this work $2,600,000.
Pre-operability and Operability studies should be completed as perComité de Operación Económica del Sistema Interconectado Nacional (Committee of Economic Operation of the National Interconnected System, or COES) Procedure 20 “PR20” and approved by COES as the La Arena II Project increases the load on the La Ramada Substation. This study would cost approximately $50,000.
An Environmental Impact Assessment (EIA) will be required to permit the La Arena II Project. While there is considerable baseline data for the La Arena Mine that can be expanded upon, additional studies will be required to accommodate the footprint and operation of the La Arena II Project. It is recommended that Tahoe initiate the following studies;
| 177 |
| LA ARENA PROJECT |
| FORM 43-101F1 TECHNICAL REPORT |
| | • | Baseline Studies | $1,000,000 |
| | • | Modeling and Report preparation | $500,000 |
| | • | Cultural resource mitigation | $500,000 |
| | • | Post EIA Permits | $250,000 |
The estimated cost to complete permitting would be $2,250,000.
| 26.2.9 | Community Engagement |
Tahoe enjoys considerable support for the La Arena Mine from the surrounding communities and the prospect of a long-life operation will bring numerous benefits, and some challenges, to the area. Should the decision be made to proceed with the La Arena II Project, it is recommended that Tahoe engage with the communities early in the process. There is no specific cost estimate for this program, as Tahoe would likely conduct community engagement activities with their existing community relations personnel.
Land acquisition costs included in the owners’ costs of the La Arena II PEA financial model are based on in-house and third-party estimates. As part of its community engagement efforts, it is recommended that Tahoe begin a dialogue with land owners to understand expectations and any commitments that may be involved in land acquisitions.
| 26.2.11 | Additional Studies |
The Mineral Resource estimate for the La Arena II Project is contained within a pit shell, but the mineralized porphyry deposit continues at depth as demonstrated by drill intercepts below the resource pit limits. While the porphyry appears to be narrowing somewhat at depth, the deepest drill holes in the deposit do not show signs of decreasing copper and gold grades with depth. While this is not a specific recommendation necessary to advance the La Arena II Project as envisioned in this report, Tahoe should consider scoping-level studies to evaluate the potential for underground bulk mining, such as block cave or sublevel cave mining methods that could extend the mine life beyond the life of the open pit.
| 178 |
| LA ARENA PROJECT |
| FORM 43-101F1 TECHNICAL REPORT |
Arribas, Antonio Jr., 1995, Characteristics of High-Sulfidation Epithermal Deposits and their Relation to Magmatic Fluid, inMagmas, Fluids, and Ore Deposits, Mineralogic Association of Canada Short Course vol. 23 p. 419-454, Ed: J.F.H Thompson.
Ausenco Peru S.A.C., 2015, La Arena S.A. La Arena Project - Phase II Feasibility Study Final Report, unpublished. Ausenco Peru S.A.C., 2015, La Arena Project – Phase 2, Feasibility Study Report, Ausenco Peru S.A.C. for Rio Alto Mining Limited, April 1, 2015.
Barrick Gold Corporation 2018 Website. www.barrick.com
Canadian Institute of Mining, Metallurgy and Petroleum, 2014, CIM Definition Standards - For Mineral Resources and Mineral Reserves, prepared by the CIM Standing Committee on Reserve Definitions and adopted by the CIM Council on December 11, 2005.
Corbett, G.J., 2002, Epithermal Gold for Explorationists, AIG News No. 67, 8p.
Coffey Mining Pty Ltd., 2008, La Arena Project, Peru Technical Report, NI 43-101 Technical Report prepared on behalf of Rio Alto Mining Limited.
Coffey Mining Pty Ltd., 2010, La Arena Project, Peru Technical Report, NI 43-101 Technical Report prepared on behalf of Rio Alto Mining Limited.
G&T Metallurgical Services Ltd. (ALS Metallurgy), 2012, Further Metallurgical Assessment of the La Arena Deposit, Peru, ALS Report KM3526, internal report for Rio Alto Mining Ltd, April 19, 2012.
G&T Metallurgical Services Ltd. (ALS Metallurgy), Preliminary Metallurgical Assessment of The La Arena Project, Peru, ALS Report KM3262, FINAL REPORT, internal report for Rio Alto Mining Ltd, August 10, 2012.
G&T Metallurgical Services Ltd. (ALS Metallurgy), 2013, Metallurgical Assessment on The M1a Center Ha High Composite from The La Arena Deposit, ALS Report KM3866, internal report for Rio Alto Mining Ltd, May 15, 2013.
G&T Metallurgical Services Ltd. (ALS Metallurgy), 2014, La Arena Phase II Sulphide Project, internal report for Rio Alto Mining Ltd., ALS Report KM3991, June 12, 2014.
Hedenquist, J.W., 1987, Mineralization associated with volcanic-related hydrothermal systems in the Circum-Pacific basin, in Transactions of the Fourth Circum-Pacific Energy and Mineral Resources Conference, p. 513-524, Ed: M.K. Horn.
Hedenquist, J.W. and Lowenstern, J.B., 1994, The role of magmas in the formation of hydrothermal ore deposits inNature vol. 370 p. 519-527.
Hedenquist, J.W., 2012, Observations on the La Arena epithermal Au mine and porphyry Cu-Au deposit, and prospects in the district, La Libertad, Peru.
Kirk Mining Consultants Pty Ltd., 2011, La Arena Project, Peru Technical Report (NI-43-101), prepared on behalf of Rio Alto Mining Limited.
| 179 |
| LA ARENA PROJECT |
| FORM 43-101F1 TECHNICAL REPORT |
Kirk Mining Consultants Pty Ltd., 2013, La Arena Project, Peru Technical Report (NI-43-101), prepared on behalf of Rio Alto Mining Limited.
Mining Plus Peru S.A.C, 2013, La Arena Project, Peru Technical Report (NI 43-101), prepared on behalf of Rio Alto Mining Limited.
Mining Plus Peru S.A.C, 2015, La Arena Project, Peru Technical Report (NI 43-101), prepared on behalf of Rio Alto Mining Limited.
Montgomery and Associates Inc., 2014, Phase I and II Hydrogeologic Characterization Report, prepared on behalf of Rio Alto Mining Limited.
Reidel, J., 2018, 3789 La Arena II Preliminary Dewatering Estimate_23 JAN18.pdf internal report prepared by Piteau Associates USA Limited on behalf of Tahoe Resources Incorporated.
Rio Alto Mining Limited, 2014, La Arena Project, Peru, Technical Report (NI 43-101), December 31, 2014.
SGS Lakefield Research Ltd, 2006, The Development of a Flow Sheet for the La Arena Porphyry Copper Deposit, SGS Report. 11162-001, Cambior Inc., December 2006.
SGS Lakefield Research Ltd, 2007, Variability Testing of Samples from the La Arena Porphyry Deposit, SGS Report 11162-002, Cambior Inc., February 2007.
Sillitoe, R.H., 2010, Porphyry Copper Systems inEconomic Geology vol. 105 p. 3-41.
Tahoe Resources Inc., Tahoe Resources 2016 Sustainability Report.
Wood Mackenzie, 2017, Global Copper Long-Term Outlook Q2-2017.
| 180 |
| LA ARENA PROJECT |
| FORM 43-101F1 TECHNICAL REPORT |
APPENDIX A: FEASIBILITY STUDY CONTRIBUTORS AND PROFESSIONAL QUALIFICATIONS
| 181 |
CERTIFICATE OF QUALIFIED PERSON
I, Daniel K. Roth, P. Eng. do hereby certify that:
| 1. | I am currently employed as a project manager and civil engineer at M3 Engineering & Technology Corp. located at 2051 West Sunset Rd, Suite 101, Tucson, AZ 85704. |
| | |
| 2. | I graduated with a Bachelor’s of Science degree in Civil Engineering from The University of Manitoba in 1990. |
| | |
| 3. | I am a registered professional engineer in good standing in the following jurisdictions: |
| | • | British Columbia, Canada (No. 38037) |
| | • | Alberta, Canada (No. 62310) |
| | • | Ontario, Canada (No. 100156213) |
| | • | Yukon, Canada (No. 1998) |
| | • | New Mexico, USA (No. 17342) |
| | • | Arizona, USA (No. 37319) |
| | • | Alaska, USA (No. 102317) |
| | • | Minnesota, USA (No. 54138) |
| 4. | I have practiced engineering and project management for 25 years. I joined M3 Engineering in November 2003. |
| | |
| 5. | I have read National Instrument 43-101 (“NI 43-101”) and certify that by reason of my education, affiliation with a professional association as defined in NI 43-101 and past relevant work experience, I fulfil the requirements to be a “Qualified Person” for the purposes of NI 43-101. |
| | |
| 6. | I am one of the authors of this Technical Report titledTechnical Report on the La Arena Project, Peruprepared for Tahoe Resources Inc., with an effective date of January 1, 2018 and issue date of February 20, 2018. I am responsible for Sections 2, 18.2, 21.1, 21.3 (process & infrastructure), 22, 24, 27 and corresponding sections of 1, 25 and 26 of this Technical Report. This Technical Report has been prepared in compliance with NI 43-101 and Form 43-101F1. |
| | |
| 7. | I have no prior involvement with the property that is the subject of the Technical Report. |
| | |
| 8. | I visited the property that is the subject of this Technical Report on 26 April 2017. |
| | |
| 9. | At the effective date of this Technical Report, to the best of my knowledge, information and belief, the Technical Report contains all scientific and technical information that is required to be disclosed to make the Technical Report not misleading. |
| | |
| 10. | I am independent of Tahoe Resources Inc. and all their subsidiaries as defined by Section 1.5 of NI 43-101. |
| | |
| 11. | I consent to the filing of the Technical Report with any stock exchange and other regulatory authority and any publication by them for regulatory purposes, including electronic publication in the public company files on their website accessible by the public, of the Technical Report. |
Dated 20 February, 2018.
/s/ Daniel K. Roth
Daniel K. Roth, P.Eng.
CERTIFICATE OF QUALIFIED PERSON
I, Art S. Ibrado, PhD, PE, do hereby certify that:
| 1. | I am employed as a project manager and metallurgist at M3 Engineering & Technology Corp., 2051 W Sunset Rd, Suite 101, Tucson, AZ 85704, USA. |
| | |
| 2. | I hold the following academic degrees: |
| | |
| Bachelor of Science in Metallurgical Engineering, University of the Philippines, 1980
Master of Science (Metallurgy), University of California at Berkeley, 1986
Doctor of Philosophy (Metallurgy), University of California at Berkeley, 1993 |
| | |
| 3. | I am a registered professional engineer in the State of Arizona (No. 58140) and a Qualified Professional (QP) member of the Mining and Metallurgical Society of America (MMSA). |
| | |
| 4. | I have worked as a metallurgist in the academic and research setting for five years, excluding graduate school research, and in the mining industry for 13 years, and in engineering since I joined M3 Engineering in July 2009. |
| | |
| 5. | I have read National Instrument 43-101 (“NI 43-101) and certify that by reason of my education, affiliation with a professional association as defined in NI 43-101 and past relevant experience, I fulfill the requirements to be a “Qualified Person” for the purposes of NI 43-101. |
| | |
| 6. | I am one of the authors of the Technical Report titledTechnical Report on the La Arena Project, Peruprepared for Tahoe Resources Inc. with an effective date of January 1, 2018 and issue date of February 20, 2018. I am responsible for Sections 13, 17 and corresponding items of Sections 1, 25 and 26 of this Technical Report. This Technical Report has been prepared in compliance with NI 43-101 and Form 43-101F1. |
| | |
| 7. | I have no prior involvement with the property that is the subject of the Technical Report. |
| | |
| 8. | I visited the property that is the subject of this Technical Report on 26 April 2017. |
| | |
| 9. | At the effective date of this Technical Report, to the best of my knowledge, information and belief, the Technical Report contains all scientific and technical information that is required to be disclosed to make the Technical Report not misleading. |
| | |
| 10. | I am independent of Tahoe Resources Inc. and all their subsidiaries as defined by Section 1.5 of NI 43-101. |
| | |
| 11. | I consent to the filing of the Technical Report with any stock exchange and other regulatory authority and any publication by them for regulatory purposes, including electronic publication in the public company files on their website accessible by the public, of the Technical Report. |
Dated this 20thday of February 2018.
/s/ Art S. Ibrado
Art S. Ibrado, PhD, PE
CERTIFICATE OF QUALIFIED PERSON
I, Terry G. Munson do hereby certify that:
| 1. | I am currently employed as Senior Engineer for Tahoe Resources Inc., 5310 Kietzke Lane, Reno, Nevada 89511, USA. |
| | |
| 2. | I graduated with a Bachelor’s of Science degree in Mining Engineering from The University of Nevada Reno in 1984. |
| | |
| 3. | I am a Registered Member in good standing of the Society for Mining, Metallurgy and Exploration (4229745RM). |
| | |
| 4. | I have practiced my profession in the mining industry continuously since 1984. |
| | |
| 5. | I have read National Instrument 43-101 (“NI 43-101”) and certify that by reason of my education, affiliation with a professional association as defined in NI 43-101 and past relevant work experience, I fulfil the requirements to be a “Qualified Person” for the purposes of NI 43-101. |
| | |
| 6. | I am one of the authors of this Technical Report titledTechnical Report on the La Arena Project, Peruprepared for Tahoe Resources Inc., with an effective date of January 1, 2018 and issue date of February 20, 2018. I am responsible for Sections 16, 18.1, 21.2, 21.3 (mining) and corresponding sections of 1, 25 and 26 of this Technical Report. This Technical Report has been prepared in compliance with NI 43-101 and Form 43-101F1. |
| | |
| 7. | I have had prior involvement with the property that is the subject of the Technical Report as a result of my employment with Tahoe Resources Inc. |
| | |
| 8. | I visited the property that is the subject of this Technical Report on April 26, 2017. |
| | |
| 9. | At the effective date of this Technical Report, to the best of my knowledge, information and belief, the Technical Report contains all scientific and technical information that is required to be disclosed to make the Technical Report not misleading. |
| | |
| 10. | I am not independent of Tahoe Resources Inc. and its related companies, as independence is described in Section 1.5 of NI 43-101. |
| | |
| 11. | I consent to the filing of the Technical Report with any stock exchange and other regulatory authority and any publication by them, including electronic publication in the public company files on their website accessible by the public, of the Technical Report. |
Dated this 20thday of February 2018.
/s/Terry G Munson
Terry G. Munson, SME Registered Member
CERTIFICATE OF QUALIFIED PERSON
I, Charles V. Muerhoff, B.Sc., do hereby certify that:
| 1. | I am employed as Vice President Technical Services for Tahoe Resources Inc., 5310 Kietzke Lane, Reno, Nevada 89511, USA. |
| | |
| 2. | I graduated with a Bachelor of Science Degree in Geology and Geophysics from the University of Missouri- Rolla in 1989. |
| | |
| 3. | I am a Registered Member in good standing of the Society for Mining, Metallurgy and Exploration (4182272RM). |
| | |
| 4. | I have practiced my profession in the mining industry continuously since 1990. |
| | |
| 5. | I have read National Instrument 43-101 (“NI 43-101”) and certify that by reason of my education, affiliation with a professional association as defined in NI 43-101 and past relevant work experience, I fulfil the requirements to be a “Qualified Person” for the purposes of NI 43-101. |
| | |
| 6. | I am one of the authors of this Technical Report titledTechnical Report on the La Arena Project, Peruprepared for Tahoe Resources Inc., with an effective date of January 1, 2018 and issue date of February 20, 2018. I am responsible for Sections 3 through 12, 14, 15, 19, 20, 23 and corresponding sections of 1, 25 and 26 of this Technical Report. This Technical Report has been prepared in compliance with NI 43-101 and Form 43-101F1. |
| | |
| 7. | I have had prior involvement with the property that is the subject of the Technical Report, having been involved at the property since April 2015 in a technical and managerial capacity as it relates to my employment with Tahoe Resources Inc. |
| | |
| 8. | I have visited and worked at the property that is the subject of this Technical Report on numerous occasions from April 2015 to the present. |
| | |
| 9. | At the effective date of this Technical Report, to the best of my knowledge, information and belief, the Technical Report contains all scientific and technical information that is required to be disclosed to make the Technical Report not misleading. |
| | |
| 10. | I am not independent of Tahoe Resources Inc. and its related companies, as independence is described in Section 1.5 of NI 43-101. |
| | |
| 11. | I consent to the filing of this Technical Report with any stock exchange and other regulatory authority and any publication by them, including electronic publication in the public company files on their website accessible by the public, of the Technical Report. |
Dated this 20thday of February 2018.
/s/Charles V. Muerhoff
Charles V Muerhoff, SME Registered Member