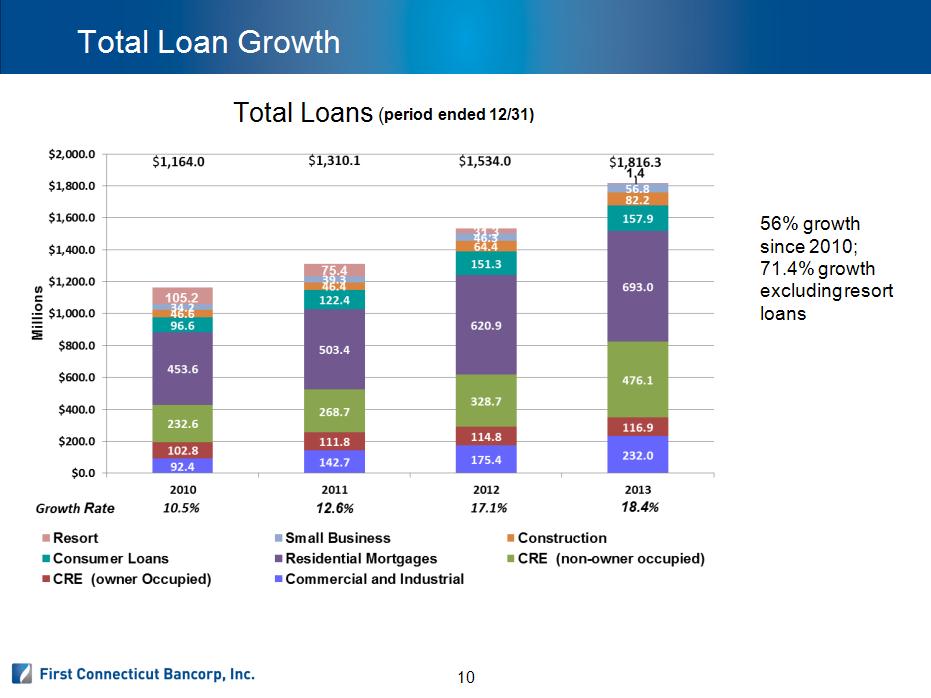
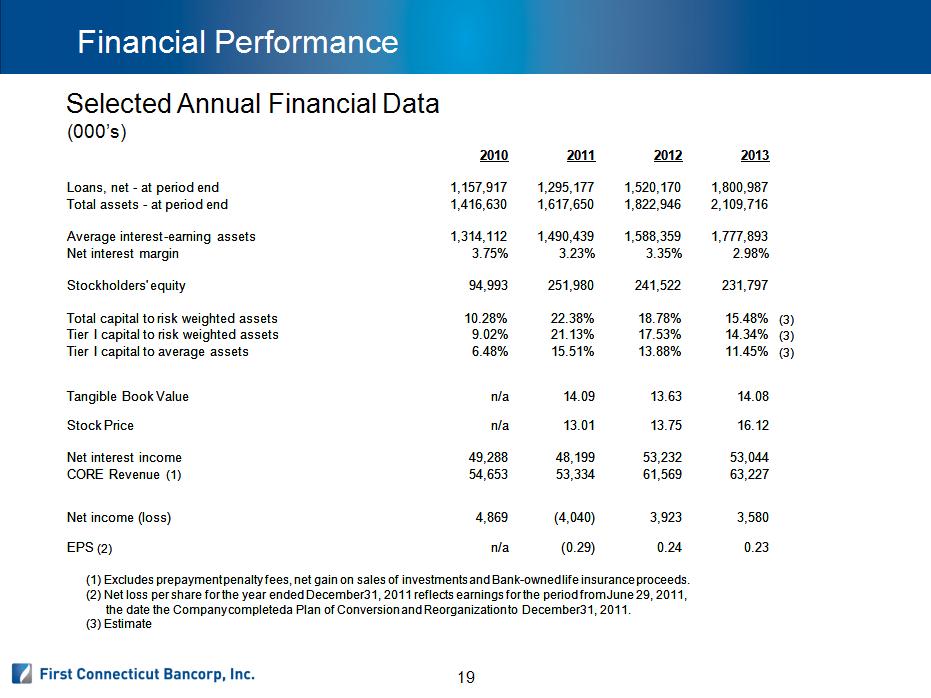
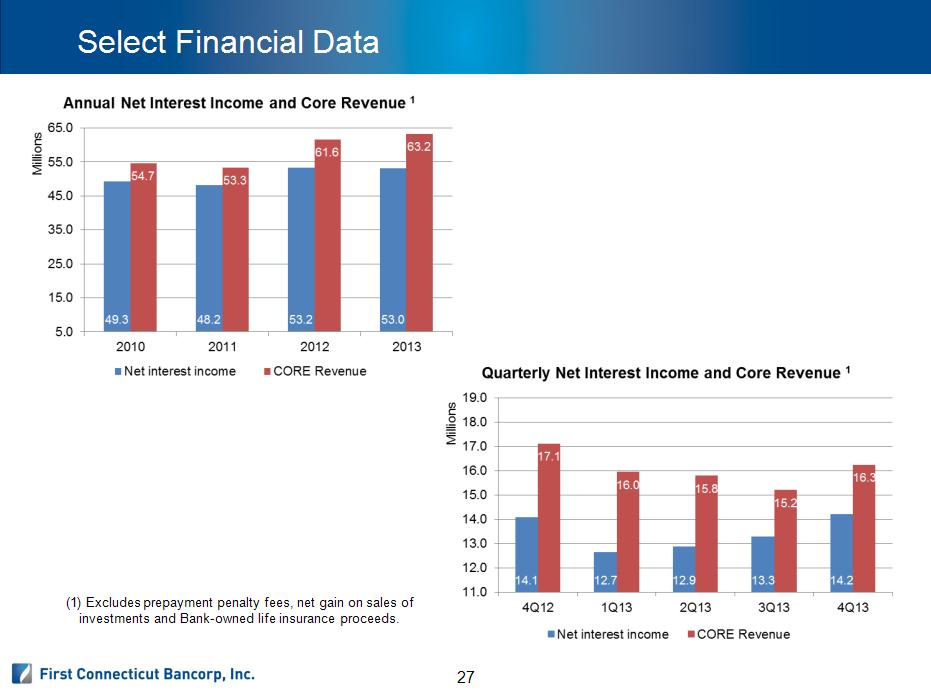
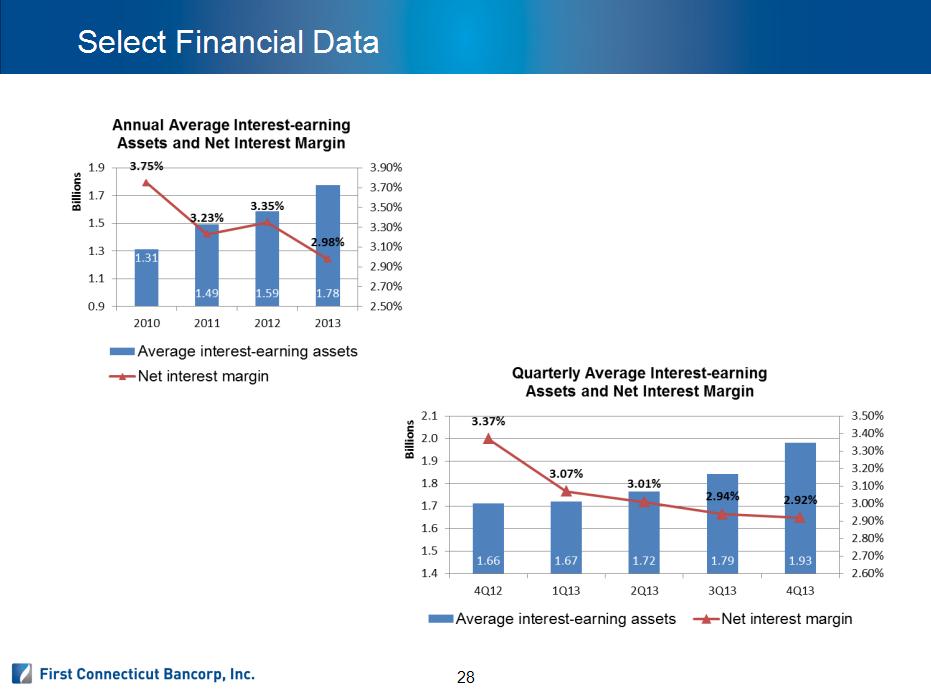
Financial Performance * Selected Annual Financial Data (000’s) 2010 2011 2012 2013 Loans, net - at period end Loans, net - at period end Loans, net - at period end 1,157,917 1,295,177 1,520,170 1,800,987 Total assets - at period end Total assets - at period end Total assets - at period end 1,416,630 1,617,650 1,822,946 2,109,716 Average interest-earning assets Average interest-earning assets Average interest-earning assets Average interest-earning assets 1,314,112 1,490,439 1,588,359 1,777,893 Net interest margin Net interest margin Net interest margin 3.75% 3.23% 3.35% 2.98% Stockholders' equity Stockholders' equity Stockholders' equity 94,993 251,980 241,522 231,797 Total capital to risk weighted assets Total capital to risk weighted assets Total capital to risk weighted assets Total capital to risk weighted assets 10.28% 22.38% 18.78% 15.48% (3) Tier I capital to risk weighted assets Tier I capital to risk weighted assets Tier I capital to risk weighted assets Tier I capital to risk weighted assets 9.02% 21.13% 17.53% 14.34% (3) Tier I capital to average assets Tier I capital to average assets Tier I capital to average assets Tier I capital to average assets 6.48% 15.51% 13.88% 11.45% (3) Tangible Book Value Tangible Book Value Tangible Book Value n/a 14.09 13.63 14.08 Stock Price Stock Price n/a 13.01 13.75 16.12 Net interest income Net interest income Net interest income 49,288 48,199 53,232 53,044 CORE Revenue (1) CORE Revenue (1) CORE Revenue (1) 54,653 53,334 61,569 63,227 Net income (loss) Net income (loss) Net income (loss) 4,869 (4,040) 3,923 3,580 EPS (2) EPS (2) n/a (0.29) 0.24 0.23 (1) Excludes prepayment penalty fees, net gain on sales of investments and Bank-owned life insurance proceeds. (1) Excludes prepayment penalty fees, net gain on sales of investments and Bank-owned life insurance proceeds. (1) Excludes prepayment penalty fees, net gain on sales of investments and Bank-owned life insurance proceeds. (1) Excludes prepayment penalty fees, net gain on sales of investments and Bank-owned life insurance proceeds. (1) Excludes prepayment penalty fees, net gain on sales of investments and Bank-owned life insurance proceeds. (1) Excludes prepayment penalty fees, net gain on sales of investments and Bank-owned life insurance proceeds. (1) Excludes prepayment penalty fees, net gain on sales of investments and Bank-owned life insurance proceeds. (1) Excludes prepayment penalty fees, net gain on sales of investments and Bank-owned life insurance proceeds. (2) Net loss per share for the year ended December 31, 2011 reflects earnings for the period from June 29, 2011, (2) Net loss per share for the year ended December 31, 2011 reflects earnings for the period from June 29, 2011, (2) Net loss per share for the year ended December 31, 2011 reflects earnings for the period from June 29, 2011, (2) Net loss per share for the year ended December 31, 2011 reflects earnings for the period from June 29, 2011, (2) Net loss per share for the year ended December 31, 2011 reflects earnings for the period from June 29, 2011, (2) Net loss per share for the year ended December 31, 2011 reflects earnings for the period from June 29, 2011, (2) Net loss per share for the year ended December 31, 2011 reflects earnings for the period from June 29, 2011, (2) Net loss per share for the year ended December 31, 2011 reflects earnings for the period from June 29, 2011, the date the Company completed a Plan of Conversion and Reorganization to December 31, 2011. the date the Company completed a Plan of Conversion and Reorganization to December 31, 2011. the date the Company completed a Plan of Conversion and Reorganization to December 31, 2011. the date the Company completed a Plan of Conversion and Reorganization to December 31, 2011. the date the Company completed a Plan of Conversion and Reorganization to December 31, 2011. the date the Company completed a Plan of Conversion and Reorganization to December 31, 2011. the date the Company completed a Plan of Conversion and Reorganization to December 31, 2011. (3) Estimate