Exhibit 99.2
Investor April 2017 Presentation RLJ Lodging Trust And FelCor Lodging Trust Combine to Create Third Largest Pure-Play Public Lodging REIT
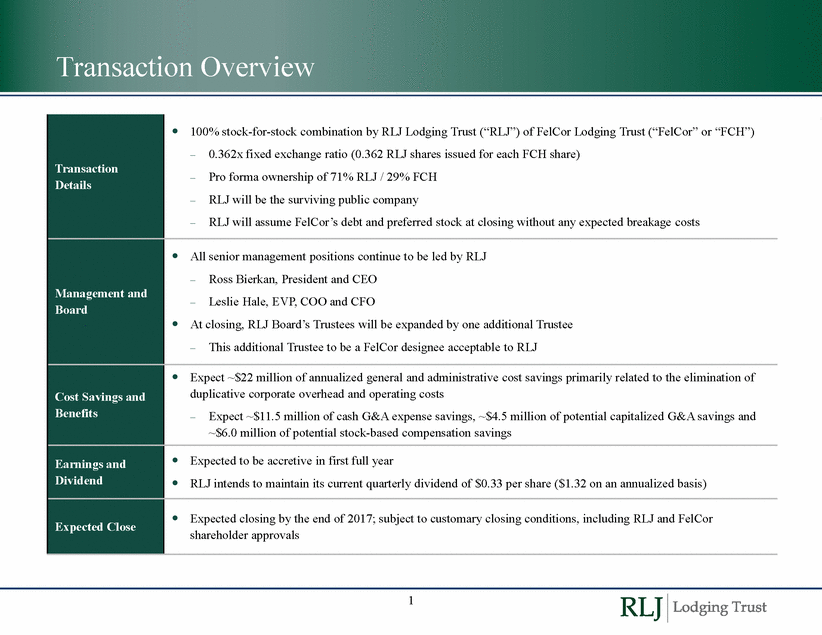
Transaction Overview shareholder approvals 1 Transaction Details 100% stock-for-stock combination by RLJ Lodging Trust (“RLJ”) of FelCor Lodging Trust (“FelCor” or “FCH”) – 0.362x fixed exchange ratio (0.362 RLJ shares issued for each FCH share) – Pro forma ownership of 71% RLJ / 29% FCH – RLJ will be the surviving public company – RLJ will assume FelCor’s debt and preferred stock at closing without any expected breakage costs Management and Board All senior management positions continue to be led by RLJ – Ross Bierkan, President and CEO – Leslie Hale, EVP, COO and CFO At closing, RLJ Board’s Trustees will be expanded by one additional Trustee – This additional Trustee to be a FelCor designee acceptable to RLJ Cost Savings and Benefits Expect ~$22 million of annualized general and administrative cost savings primarily related to the elimination of duplicative corporate overhead and operating costs – Expect ~$11.5 million of cash G&A expense savings, ~$4.5 million of potential capitalized G&A savings and ~$6.0 million of potential stock-based compensation savings Earnings and Dividend Expected to be accretive in first full year RLJ intends to maintain its current quarterly dividend of $0.33 per share ($1.32 on an annualized basis) Expected Close Expected closing by the end of 2017; subject to customary closing conditions, including RLJ and FelCor
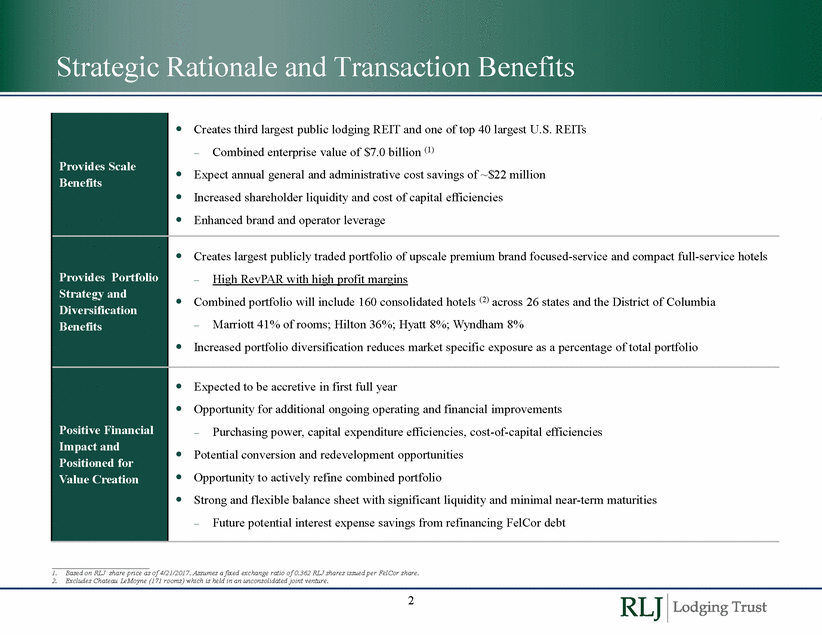
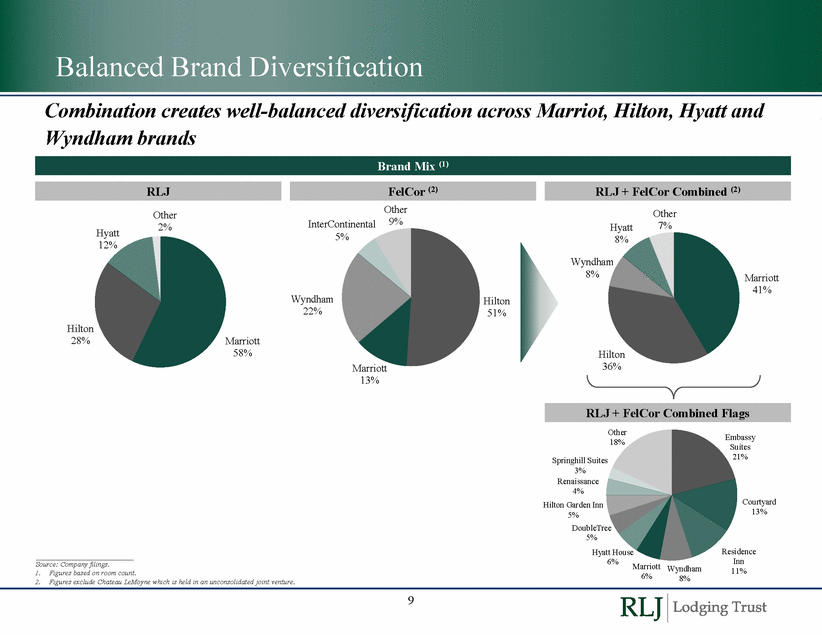
Strategic Rationale and Transaction Benefits Combined portfolio will include 160 consolidated hotels across 26 states and the District of Columbia 1. Based on RLJ share price as of 4/21/2017. Assumes a fixed exchange ratio of 0.362 RLJ shares issued per FelCor share. 2. Excludes Chateau LeMoyne (171 rooms) which is held in an unconsolidated joint venture. 2 Provides Scale Benefits Creates third largest public lodging REIT and one of top 40 largest U.S. REITs – Combined enterprise value of $7.0 billion (1) Expect annual general and administrative cost savings of ~$22 million Increased shareholder liquidity and cost of capital efficiencies Enhanced brand and operator leverage Provides Portfolio Strategy and Diversification Benefits Creates largest publicly traded portfolio of upscale premium brand focused-service and compact full-service hotels – High RevPAR with high profit margins (2) – Marriott 41% of rooms; Hilton 36%; Hyatt 8%; Wyndham 8% Increased portfolio diversification reduces market specific exposure as a percentage of total portfolio Positive Financial Impact and Positioned for Value Creation Expected to be accretive in first full year Opportunity for additional ongoing operating and financial improvements – Purchasing power, capital expenditure efficiencies, cost-of-capital efficiencies Potential conversion and redevelopment opportunities Opportunity to actively refine combined portfolio Strong and flexible balance sheet with significant liquidity and minimal near-term maturities – Future potential interest expense savings from refinancing FelCor debt
Combination Creates Third Largest Public Lodging REIT Enhanced size and scale allow for significant cost savings • • • Meaningful overhead (G&A) efficiencies Increased negotiating leverage with brands, managers, and vendors Ongoing cost-of-capital efficiencies (refinancing FelCor debt, greater shareholder liquidity) ($ in millions) ($ in billions) $17.8 Top 10 REITs $2,109 Top 11 - 20 $1,185 Top 21 - 30 $727 PF RLJ + FCH $600+ $549 Top 31 - 40 Top 41 - 50 $417 $368 Top 51 - 60 Top 61 - 70 $313 $272 $232 Top 71 - 80 $5.6 Top 81 - 90 $3.4 Top 91 - 100 $187 $149 $108 $3.0 Top 101 - 110 Top 111 - 120 $65 Top 121 - 130 + FCH Sources: Company filings, FactSet, NAREIT REITWatch, and SNL Financial. Market data as of 4/21/2017. 1. 2. 3. Enterprise value as of 4/21/2017 (excludes HPT given lease structure). Pro Forma RLJ / FelCor reflects 2016 reported corporate EBITDA. Peer deciles reflect average LTM 12/31/2016 adjusted EBITDA for companies in each decile. Based on RLJ share price as of 4/21/2017. Assumes a fixed exchange ratio of 0.362 RLJ shares issued per FelCor share. 3 $8.7 $7.0 $4.0 $4.1 $4.5$4.9 $2.2$2.3$2.4 $2.7 $2.8 $1.1$1.5 AHP CLDT HT CHSP INN FCH XHR DRH PEB SHO RLJ LHO AHT APLEPF (3) PKHST RLJ Creates A Top U.S. REIT by EBITDA (2) Creates Third Largest Public Lodging REIT (Enterprise Value) (1)
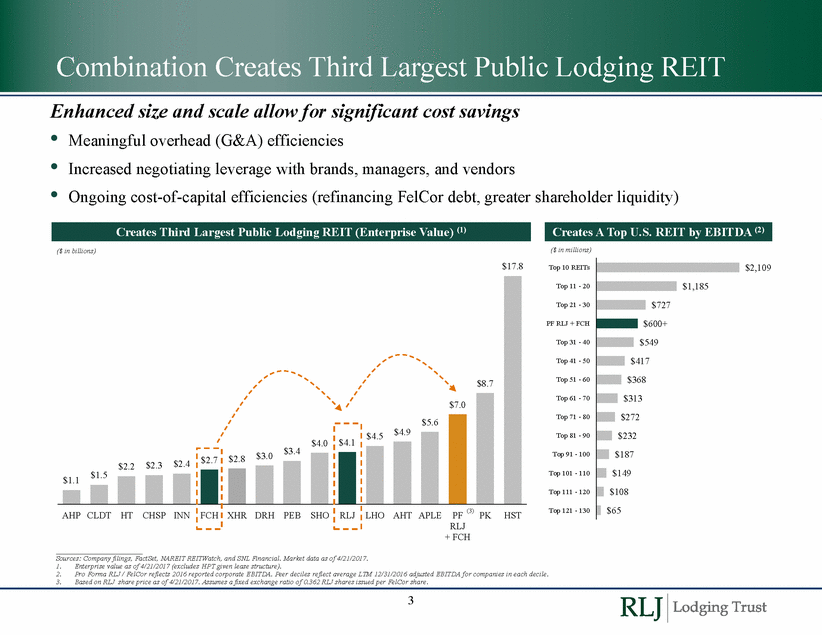
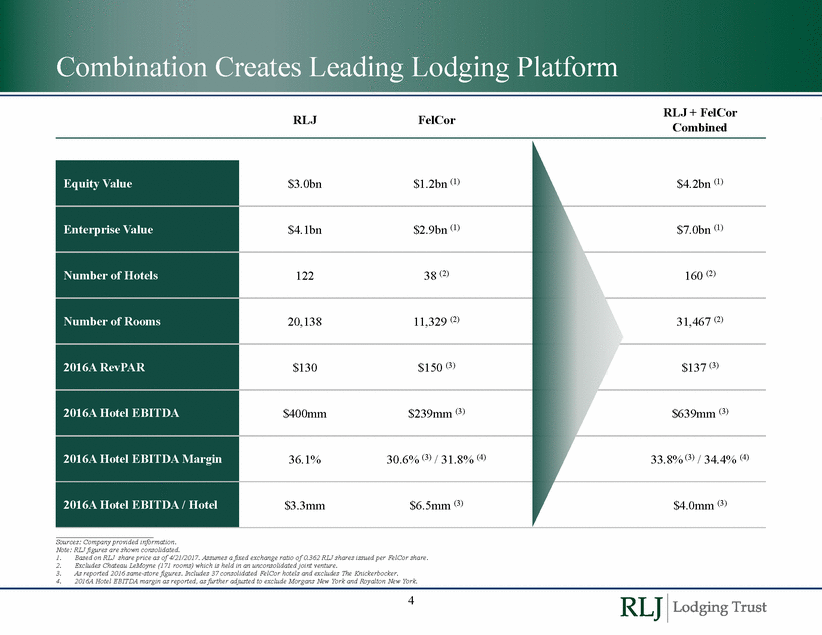
Combination Creates Leading Lodging Platform RLJ + FelCor Combined RLJ FelCor Sources: Company provided information. Note: RLJ figures are shown consolidated. 1. 2. 3. 4. Based on RLJ share price as of 4/21/2017. Assumes a fixed exchange ratio of 0.362 RLJ shares issued per FelCor share. Excludes Chateau LeMoyne (171 rooms) which is held in an unconsolidated joint venture. As reported 2016 same-store figures. Includes 37 consolidated FelCor hotels and excludes The Knickerbocker. 2016A Hotel EBITDA margin as reported, as further adjusted to exclude Morgans New York and Royalton New York. 4 Equity Value $3.0bn$1.2bn (1)$4.2bn (1) Enterprise Value $4.1bn$2.9bn (1)$7.0bn (1) Number of Hotels 12238 (2)160 (2) Number of Rooms 20,13811,329 (2)31,467 (2) 2016A RevPAR $130$150 (3)$137 (3) 2016A Hotel EBITDA $400mm$239mm (3)$639mm (3) 2016A Hotel EBITDA Margin 36.1%30.6% (3) / 31.8% (4)33.8% (3) / 34.4% (4) 2016A Hotel EBITDA / Hotel $3.3mm$6.5mm (3)$4.0mm (3)
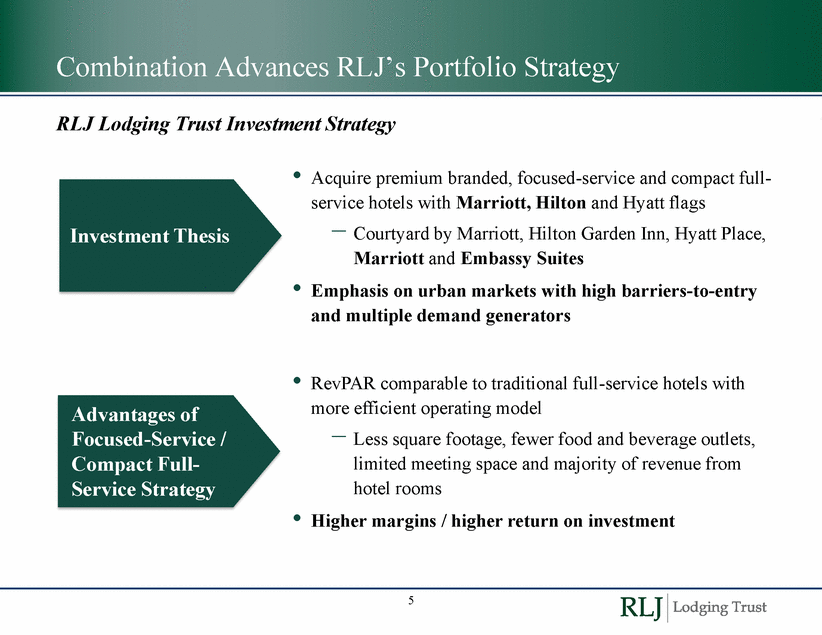
Combination Advances RLJ’s Portfolio Strategy RLJ Lodging Trust Investment Strategy • Acquire premium branded, focused-service and compact full-service hotels with Marriott, Hilton and Hyatt flags - Courtyard by Marriott, Hilton Garden Inn, Hyatt Place, Marriott and Embassy Suites Emphasis on urban markets with high barriers-to-entry and multiple demand generators Investment Thesis • • RevPAR comparable to traditional full-service hotels with more efficient operating model Advantages of Focused-Service / Compact Full-Service Strategy - Less square footage, fewer food and beverage outlets, limited meeting space and majority of revenue from hotel rooms • Higher margins / higher return on investment 5
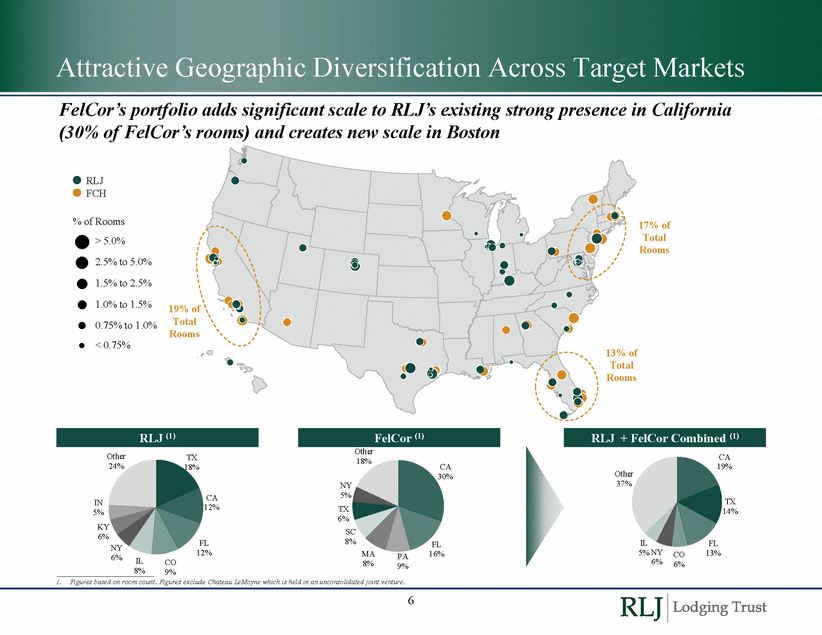
Attractive Geographic Diversification Across Target Markets FelCor’s portfolio adds significant scale to RLJ’s existing strong presence in California (30% of FelCor’s rooms) and creates new scale in Boston RLJ FCH % of Rooms 17% of Total Rooms = > 5.0% = 2.5% to 5.0% = 1.5% to 2.5% = = = 1.0% to 1.5% 19% of Total Rooms 0.75% to 1.0% < 0.75% 13% of Total Rooms RLJ (1) FelCor (1) RLJ + FelCor Combined (1) Other 18% Other 24% TX 18% CA 19% CA 30% Other 37% NY 5% TX 6% SC 8% CA 12% TX 14% IN 5% KY 6% FL 12% IL 5% NY 6% FL 13% FL 16% NY 6% MA 8% CO 6% PA 9% IL CO 9% 8_% 1. Figures based on room count. Figures exclude Chateau LeMoyne which is held in an unconsolidated joint venture. 6
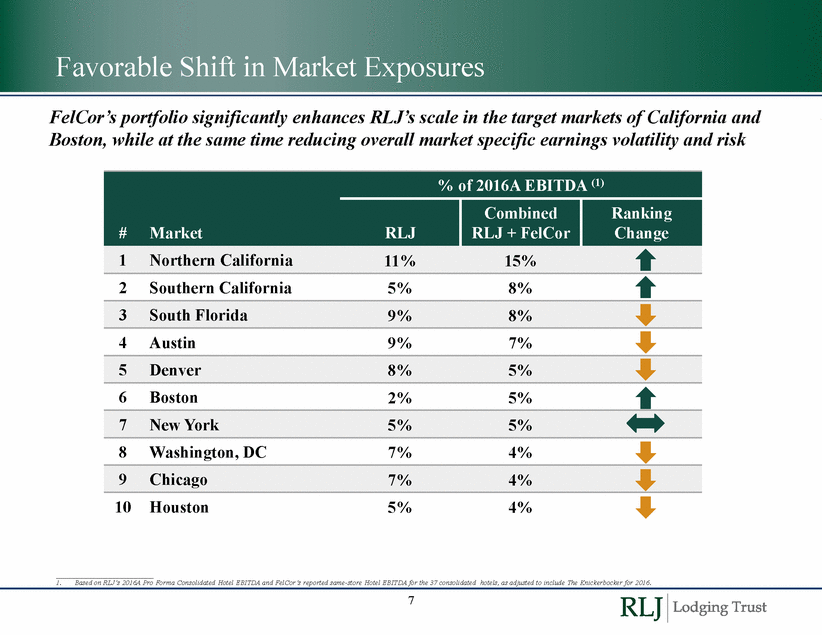
Favorable Shift in Market Exposures FelCor’s portfolio significantly enhances RLJ’s scale in the target markets of California and Boston, while at the same time reducing overall market specific earnings volatility and risk 2 Southern California 5% 8% 4 Austin 9% 7% 6 Boston 2% 5% 8 Washington, DC 7% 4% 10 Houston 5% 4% 1. Based on RLJ’s 2016A Pro Forma Consolidated Hotel EBITDA and FelCor’s reported same-store Hotel EBITDA for the 37 consolidated hotels, as adjusted to include The Knickerbocker for 2016. 7 9Chicago7%4% 7New York5%5% 5Denver8%5% 3South Florida9%8% #Market % of 2016A EBITDA (1) RLJ Combined RLJ + FelCor Ranking Change 1Northern California11%15%
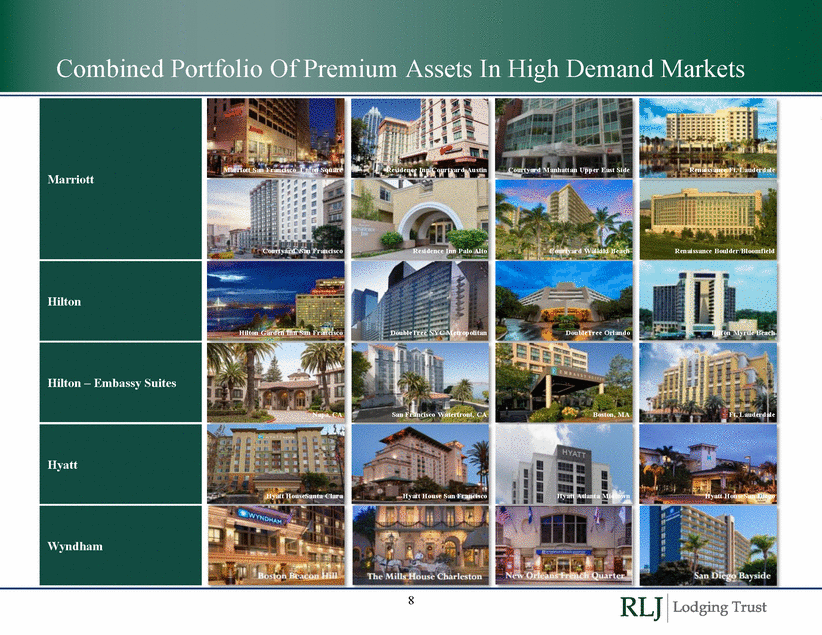
Combined Portfolio Of Premium Assets In High Demand Markets Marriott San Francisco Union Square Residence Inn/Courtyard Austin Courtyard Manhattan Upper East Side Renaissance Ft. Lauderdale Courtyard San Francisco Residence Inn Palo Alto Courtyard Waikiki Beach Renaissance Boulder/Bloomfield Hilton Garden Inn San Francisco DoubleTree NYC Metropolitan DoubleTree Orlando Hilton Myrtle Beach Napa, CA San Francisco Waterfront, CA Boston, MA Ft. Lauderdale Hyatt HouseSanta Clara Hyatt House San Francisco Hyatt Atlanta Midtown Hyatt HouseSan Diego 8 Marriott Hilton Hilton – Embassy Suites Hyatt Wyndham
Balanced Brand Diversification Combination creates well-balanced diversification across Marriot, Hilton, Hyatt and Wyndham brands Other 9% Other 7% Other 2% InterContinental 5% Hyatt 8% Hyatt 12% Wyndham 8% Marriott 41% Wyndham 22% Hilton 51% Hilton 28% Marriott 58% Hilton 36% Marriott 13% Other 18% Embassy Suites 21% Springhill Suites 3% Renaissance 4% Hilton Garden Inn 5% DoubleTree 5% Hyatt House Courtyard 13% Residence Inn 11% 6% Source: Company filings. 1. Figures based on room count. 2. Figures exclude Chateau LeMoyne which is held in an unconsolidated joint venture. Marriott 6% Wyndham 8% 9 RLJ + FelCor Combined Flags RLJ + FelCor Combined (2) RLJ FelCor (2) Brand Mix (1)
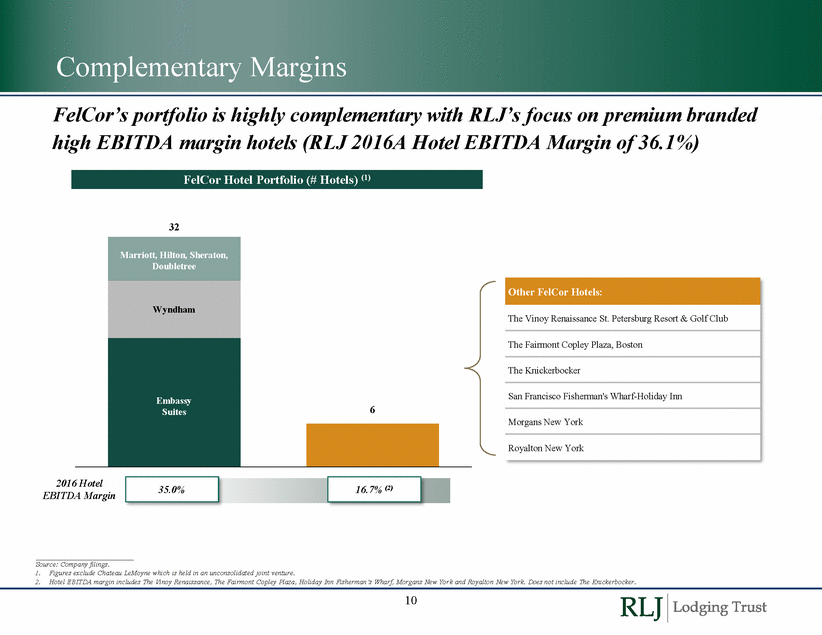
Complementary Margins FelCor’s portfolio is highly complementary with RLJ’s focus on premium branded high EBITDA margin hotels (RLJ 2016A Hotel EBITDA Margin of 36.1%) 32 The Vinoy Renaissance St. Petersburg Resort & Golf Club The Fairmont Copley Plaza, Boston The Knickerbocker San Francisco Fisherman's Wharf-Holiday Inn Suites Morgans New York Royalton New York 2016 Hotel EBITDA Margin Source: Company filings. 1. Figures exclude Chateau LeMoyne which is held in an unconsolidated joint venture. 2. Hotel EBITDA margin includes The Vinoy Renaissance, The Fairmont Copley Plaza, Holiday Inn Fisherman’s Wharf, Morgans New York and Royalton New York. Does not include The Knickerbocker. 10 16.7% (2) 35.0% Other FelCor Hotels: Marriott, Hilton, Sheraton, Doubletree 6 Wyndham Embassy FelCor Hotel Portfolio (# Hotels) (1)
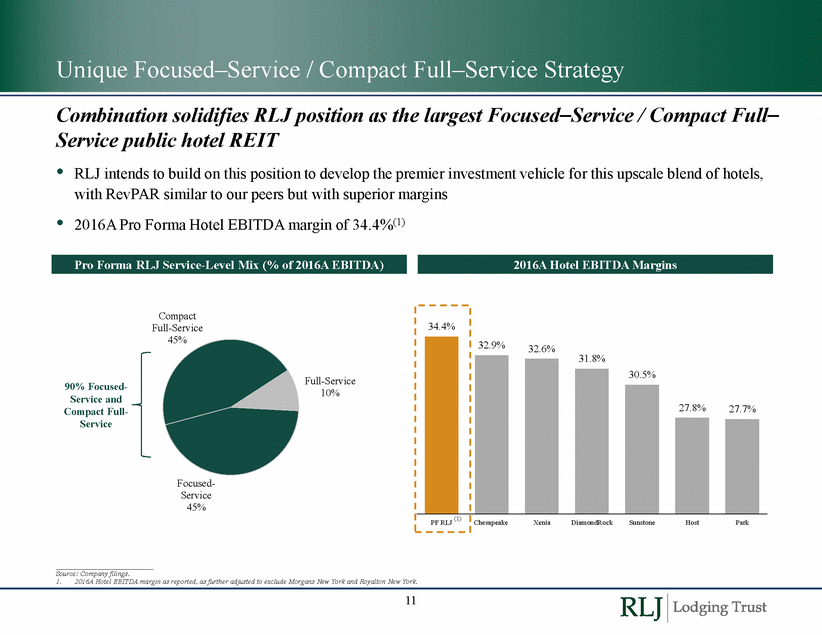
Unique Focused–Service / Compact Full–Service Strategy Combination solidifies RLJ position as the largest Focused–Service / Compact Full– Service public hotel REIT • RLJ intends to build on this position to develop the premier investment vehicle for this upscale blend of hotels, with RevPAR similar to our peers but with superior margins 2016A Pro Forma Hotel EBITDA margin of 34.4%(1) • Compact Full-Service 45% 31.8% Full-Service 10% 90% Focused-Service and Compact Full-Service Focused-Service 45% Source: Company filings. 1. 2016A Hotel EBITDA margin as reported, as further adjusted to exclude Morgans New York and Royalton New York. 11 34.4% 32.9%32.6% 30.5% 27.8%27.7% PF RLJ (1) ChesapeakeXeniaDiamondRockSunstoneHostPark Pro Forma RLJ Service-Level Mix (% of 2016A EBITDA) 2016A Hotel EBITDA Margins
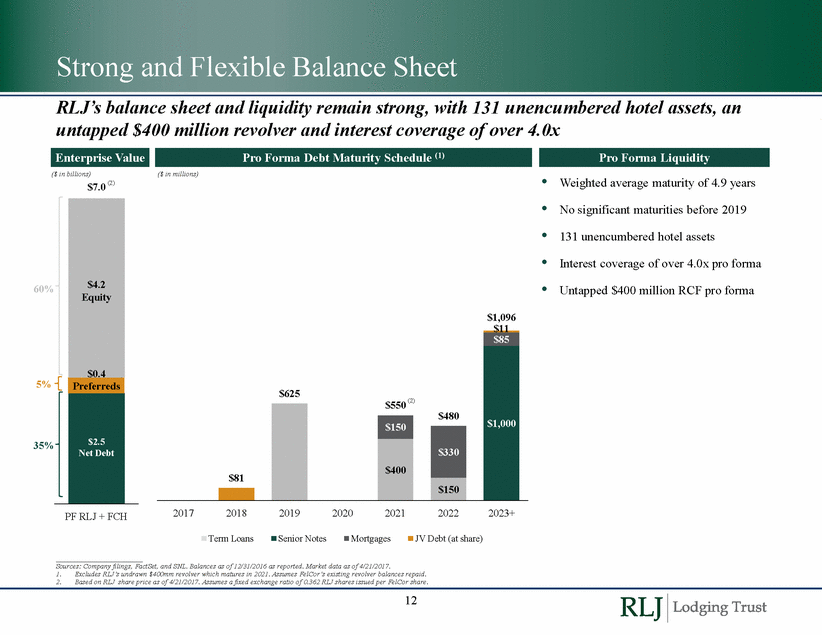
Strong and Flexible Balance Sheet RLJ’s balance sheet and liquidity remain strong, with 131 unencumbered hotel assets, an untapped $400 million revolver and interest coverage of over 4.0x ($ in billions) $7.0 (2) ($ in millions) • • • • • Weighted average maturity of 4.9 years No significant maturities before 2019 131 unencumbered hotel assets Interest coverage of over 4.0x pro forma 60% Untapped $400 million RCF pro forma $1,096 $11 5% $550 (2) $480 35% 2017 2018 2019 2020 2021 2022 2023+ PF RLJ + FCH Term Loans Senior Notes Mortgages JV Debt (at share) Sources: Company filings, FactSet, and SNL. Balances as of 12/31/2016 as reported. Market data as of 4/21/2017. 1. 2. Excludes RLJ’s undrawn $400mm revolver which matures in 2021. Assumes FelCor’s existing revolver balances repaid. Based on RLJ share price as of 4/21/2017. Assumes a fixed exchange ratio of 0.362 RLJ shares issued per FelCor share. 12 $625 $85 $1,000 $81 $150 $330 $400 $150 $4.2 Equity $0.4 Preferreds $2.5 Net Debt Pro Forma Liquidity Enterprise Value Pro Forma Debt Maturity Schedule (1)
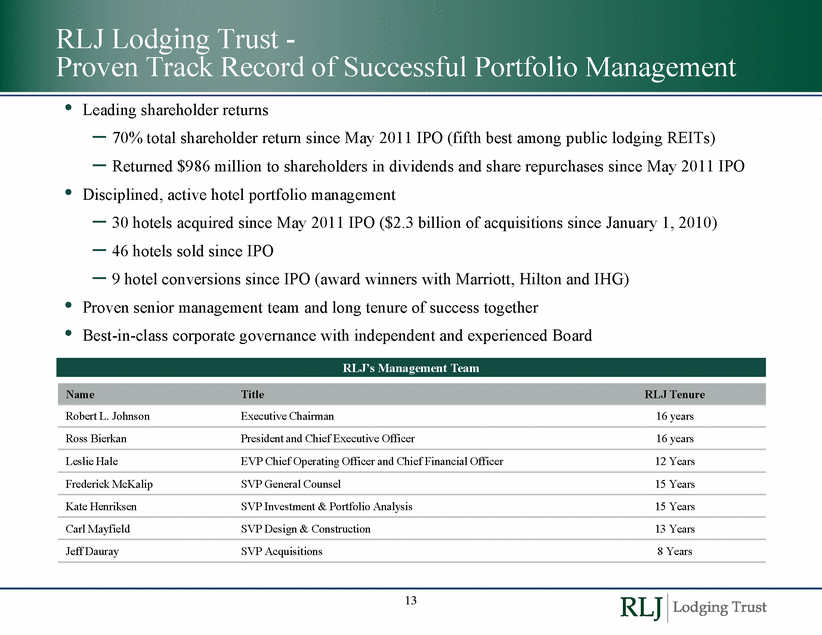
RLJ Lodging Trust - Proven Track Record of Successful Portfolio Management • Leading shareholder returns – 70% total shareholder return since May 2011 IPO (fifth best among public lodging REITs) – Returned $986 million to shareholders in dividends and share repurchases since May 2011 IPO Disciplined, active hotel portfolio management • – – – 30 hotels acquired since May 2011 IPO ($2.3 billion of acquisitions since January 1, 2010) 46 hotels sold since IPO 9 hotel conversions since IPO (award winners with Marriott, Hilton and IHG) • • Proven senior management team and long tenure of success together Best-in-class corporate governance with independent and experienced Board Robert L. Johnson Executive Chairman 16 years Ross Bierkan President and Chief Executive Officer 16 years Leslie Hale EVP Chief Operating Officer and Chief Financial Officer 12 Years Frederick McKalip SVP General Counsel 15 Years Kate Henriksen SVP Investment & Portfolio Analysis 15 Years Carl Mayfield SVP Design & Construction 13 Years Jeff Dauray SVP Acquisitions 8 Years 13 NameTitleRLJ Tenure RLJ’s Management Team
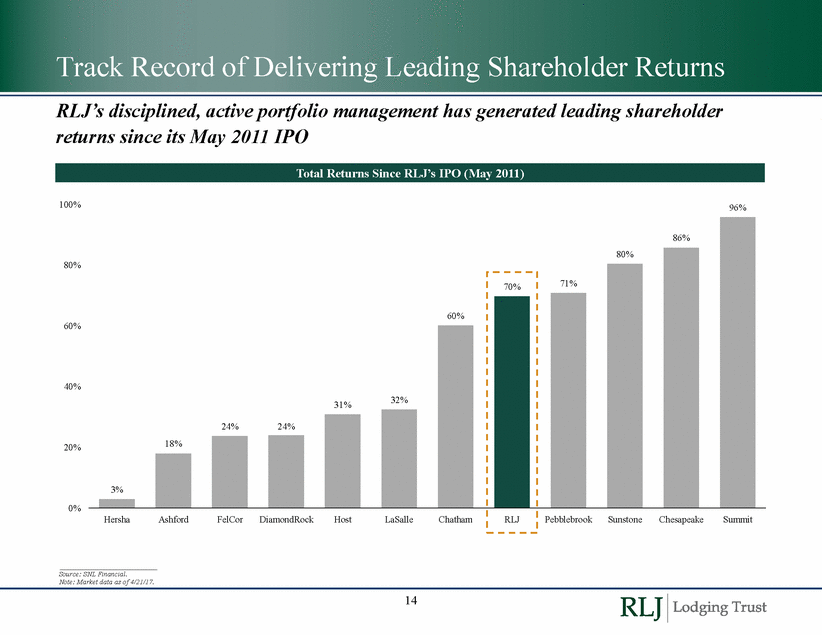
Track Record of Delivering Leading Shareholder Returns RLJ’s disciplined, active portfolio management has generated leading shareholder returns since its May 2011 IPO 100% 96% 80% 60% 40% 20% 0% Source: SNL Financial. Note: Market data as of 4/21/17. 14 86% 80% 60% 70% 71% 31%32% 24%24% 18% 3% HershaAshfordFelCorDiamondRockHostLaSalleChatham RLJ PebblebrookSunstoneChesapeakeSummit Total Returns Since RLJ’s IPO (May 2011)
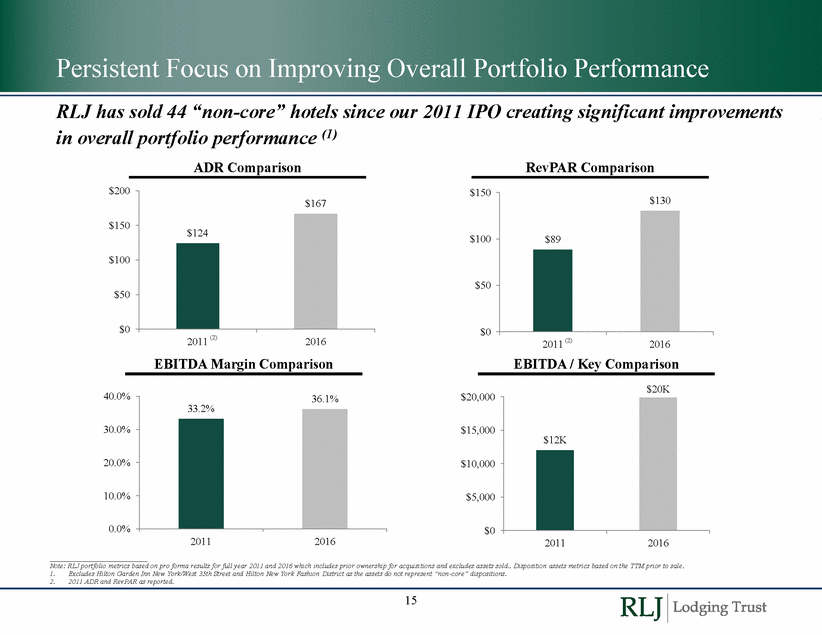
Persistent Focus on Improving Overall Portfolio Performance RLJ has sold 44 “non-core” hotels since our 2011 IPO creating significant improvements in overall portfolio performance (1) ADR Comparison RevPAR Comparison $200 $150 $150 $100 $100 $50 $50 $0 $0 (2) 2011 2016 (2) 2011 2016 EBITDA Margin Comparison EBITDA / Key Comparison $20K 40.0% $20,000 33.2% 30.0% $15,000 20.0% $10,000 10.0% $5,000 0.0% $0 2011 2016 2011 2016 Note: RLJ portfolio metrics based on pro forma results for full year 2011 and 2016 which includes prior ownership for acquisitions and excludes assets sold.. Disposition assets metrics based on the TTM prior to sale. 1. 2. Excludes Hilton Garden Inn New York/West 35th Street and Hilton New York Fashion District as the assets do not represent “non-core” dispositions. 2011 ADR and RevPAR as reported. 15 36.1% $12K $167 $124 $130 $89
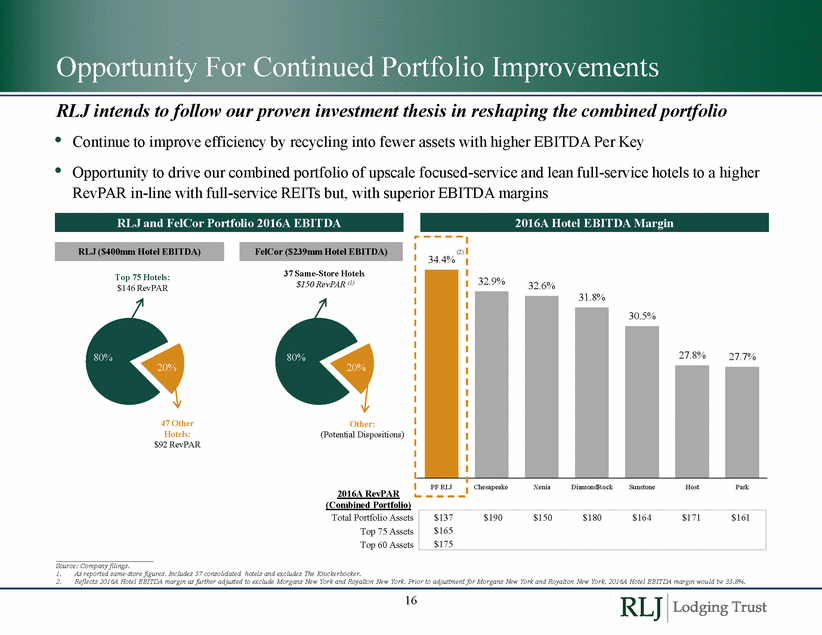
Opportunity For Continued Portfolio Improvements RLJ intends to follow our proven investment thesis in reshaping the combined portfolio • • Continue to improve efficiency by recycling into fewer assets with higher EBITDA Per Key Opportunity to drive our combined portfolio of upscale focused-service and lean full-service hotels to a higher RevPAR in-line with full-service REITs but, with superior EBITDA margins 34.4% 37 Same-Store Hotels $150 RevPAR (1) Top 75 Hotels: $146 RevPAR 31.8% 80% 80% 20% 20% 47 Other Hotels: $92 RevPAR Other: (Potential Dispositions) 2016A RevPAR (Combined Portfolio) Total Portfolio Assets Top 75 Assets Top 60 Assets Source: Company filings. 1. 2. As reported same-store figures. Includes 37 consolidated hotels and excludes The Knickerbocker. Reflects 2016A Hotel EBITDA margin as further adjusted to exclude Morgans New York and Royalton New York. Prior to adjustment for Morgans New York and Royalton New York, 2016A Hotel EBITDA margin would be 33.8%. 16 $137$190$150$180$164$171$161 $165 $175 FelCor ($239mm Hotel EBITDA) RLJ ($400mm Hotel EBITDA) (2) 32.9%32.6% 30.5% 27.8%27.7% PF RLJ ChesapeakeXeniaDiamondRockSunstoneHostPark 2016A Hotel EBITDA Margin RLJ and FelCor Portfolio 2016A EBITDA
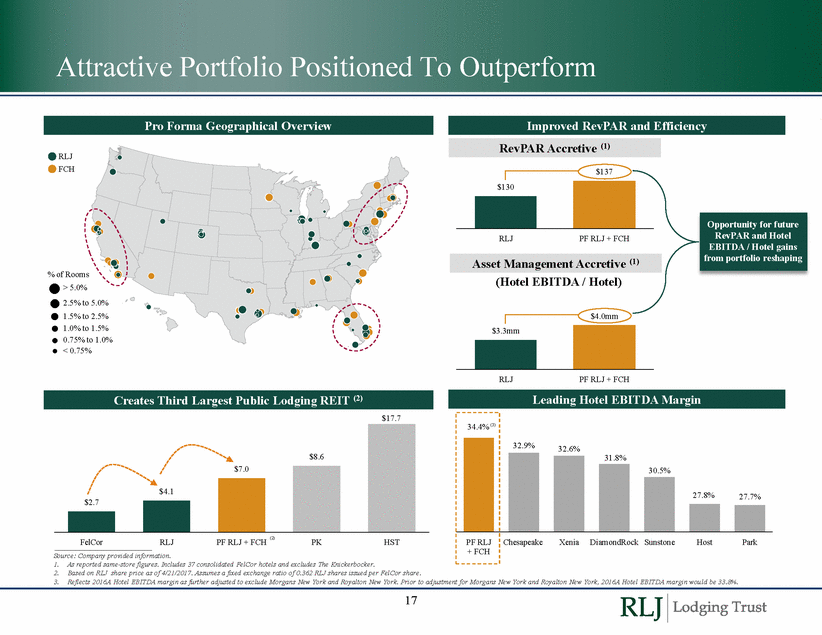
Attractive Portfolio Positioned To Outperform RLJ FCH $137 RLJ PF RLJ + FCH Asset Management Accretive (1) % of Rooms (Hotel EBITDA / Hotel) => 5.0% =2.5% to 5.0% = 1.5% to 2.5% = 1.0% to 1.5% = 0.75% to 1.0% = < 0.75% $4.0mm $3.3mm RLJ PF RLJ + FCH Creates Third Largest Public Lodging REIT (2) Leading Hotel EBITDA Margin $17.7 34.4% (3) 32.9% 32.6% $8.6 31.8% $7.0 30.5% $4.1 27.8% 27.7% $2.7 (2) FelCor RLJ PF RLJ + FCH PK HST PF RLJ + FCH Chesapeake Xenia DiamondRock Sunstone Host Park Source: Company provided information. 1. 2. 3. As reported same-store figures. Includes 37 consolidated FelCor hotels and excludes The Knickerbocker. Based on RLJ share price as of 4/21/2017. Assumes a fixed exchange ratio of 0.362 RLJ shares issued per FelCor share. Reflects 2016A Hotel EBITDA margin as further adjusted to exclude Morgans New York and Royalton New York. Prior to adjustment for Morgans New York and Royalton New York, 2016A Hotel EBITDA margin wou ld be 33.8%. 17 Opportunity for future RevPAR and Hotel EBITDA / Hotel gains from portfolio reshaping $130 RevPAR Accretive (1) Improved RevPAR and Efficiency Pro Forma Geographical Overview
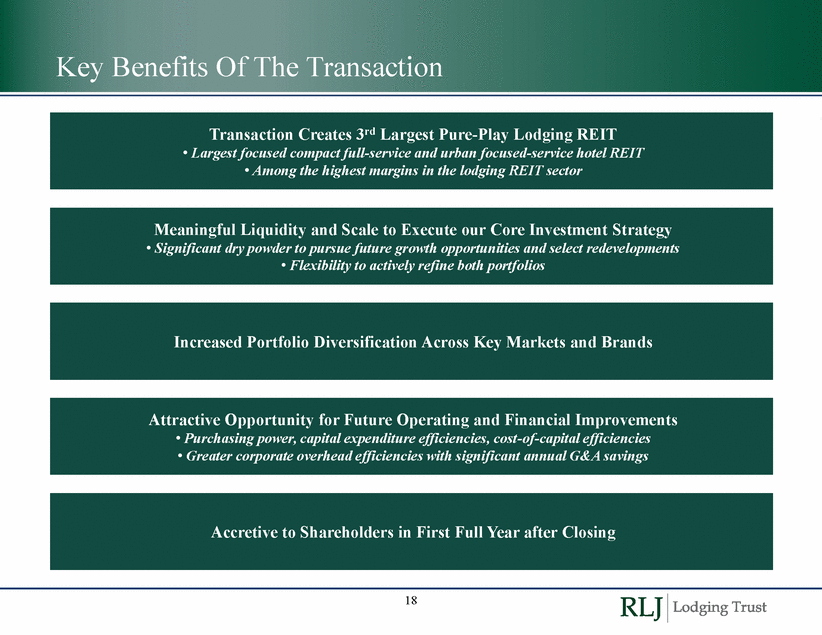
Key Benefits Of The Transaction 18 Accretive to Shareholders in First Full Year after Closing Attractive Opportunity for Future Operating and Financial Improvements • Purchasing power, capital expenditure efficiencies, cost-of-capital efficiencies • Greater corporate overhead efficiencies with significant annual G&A savings Increased Portfolio Diversification Across Key Markets and Brands Meaningful Liquidity and Scale to Execute our Core Investment Strategy • Significant dry powder to pursue future growth opportunities and select redevelopments • Flexibility to actively refine both portfolios Transaction Creates 3rd Largest Pure-Play Lodging REIT • Largest focused compact full-service and urban focused-service hotel REIT •Among the highest margins in the lodging REIT sector
Non-GAAP Financial Measures 19
Non-GAAP Financial Measures RLJ and FelCor refer in this Investor Presentation to certain non-GAAP financial measures. These measures, including variations of EBITDA and EBITDA margin, are measures of financial performance that are not calculated and presented in accordance with generally accepted accounting principles, or GAAP. RLJ and FelCor consider these measures useful to investors as key supplemental measures of performance. These non-GAAP financial measures should be considered along with, but not as alternatives to, net income or loss as a measure of operating performance. The non-GAAP financial measures, as calculated in this Investor Presentation, may not be comparable to similar non-GAAP measures as reported by other companies that do not define such terms exactly the same way. The tables on the following pages reconcile these non-GAAP measures to the most comparable GAAP financial measures. RLJ and FelCor consider EBITDA useful to an investor in evaluating and facilitating comparisons of RLJ and FelCor’s operating performance between periods and between REITs by removing the impact of our capital structure (primarily interest expense) and asset base (primarily depreciation and amortization) from RLJ and FelCor’s operating results. In addition, EBITDA is used as one measure in determining the value of hotel acquisitions and disposals. Hotel EBITDA and Hotel EBITDA margin are commonly used measures of performance in the hotel industry and give investors a more complete understanding of the operating results over which RLJ and FelCor’s individual hotels and operating managers have direct control. RLJ and FelCor believe that Hotel EBITDA and Hotel EBITDA margin are useful to investors by providing greater transparency with respect to two significant measures used by RLJ and FelCor in financial and operational decision-making. Additionally, using these measures facilitates comparisons with other hotel REITs and hotel owners. 20
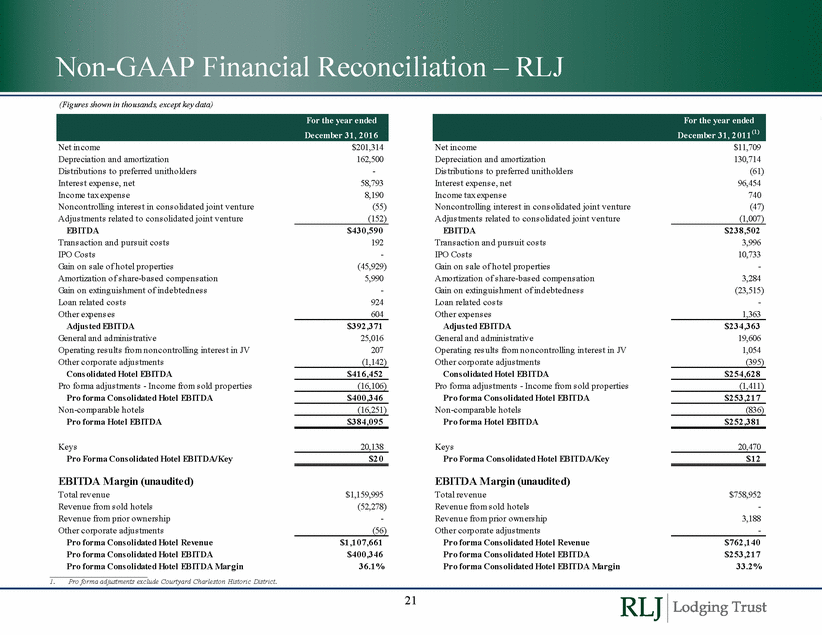
Non-GAAP Financial (Figures shown in thousands, except key data) Reconciliation – RLJ Net income Depreciation and amortization Dis tributions to preferred unitholders Interest expense, net Income tax expense Noncontrolling interest in consolidated joint venture Adjustments related to consolidated joint venture EBITDA Transaction and pursuit costs IPO Costs Gain on s ale of hotel properties Amortization of s hare-based compensation Gain on extinguishment of indebtedness Loan related costs Other expenses Adjusted EBITDA General and administrative Operating results from noncontrolling interest in JV Other corporate adjustments Consolidated Hotel EBITDA Pro forma adjustments - Income from s old properties Pro forma Consolidated Hotel EBITDA Non-comparable hotels Pro forma Hotel EBITDA $201,314 162,500 - 58,793 8,190 (55) (152) Net income Depreciation and amortization Dis tributions to preferred unitholders Interest expense, net Income tax expense Noncontrolling interest in Consolidated joint venture Adjustments related to Consolidated joint venture EBITDA Trans action and pursuit costs IPO Costs Gain on s ale of hotel properties Amortization of s hare-based compensation Gain on extinguishment of indebtedness Loan related costs Other expenses Adjusted EBITDA General and administrative Operating results from noncontrolling interest in JV Other corporate adjustments Consolidated Hotel EBITDA Pro forma adjustments - Income from s old properties Pro forma Consolidated Hotel EBITDA Non-comparable hotels Pro forma Hotel EBITDA $11,709 130,714 (61) 96,454 740 (47) (1,007) $430,590 192 - (45,929) 5,990 - 924 604 $238,502 3,996 10,733 - 3,284 (23,515) - 1,363 $392,371 25,016 207 (1,142) $234,363 19,606 1,054 (395) $416,452 $254,628 (16,106) (1,411) $400,346 $253,217 (16,251) (836) $384,095 $252,381 Keys Pro Forma Consolidated Hotel EBITDA/Key 20,138 Keys Pro Forma Consolidated Hotel EBITDA/Key 20,470 $20 $12 EBITDA Margin (unaudited) Total revenue Revenue from s old hotels Revenue from prior owners hip Other corporate adjustments Pro forma Consolidated Hotel Revenue Pro forma Consolidated Hotel EBITDA Pro forma Consolidated Hotel EBITDA Margin EBITDA Margin (unaudited) Total revenue Revenue from s old hotels Revenue from prior owners hip Other corporate adjustments Pro forma Consolidated Hotel Revenue Pro forma Consolidated Hotel EBITDA Pro forma Consolidated Hotel EBITDA Margin $1,159,995 (52,278) - (56) $758,952 - 3,188 - $1,107,661 $400,346 36.1% $762,140 $253,217 33.2% 1. Pro forma adjustments exclude Courtyard Charleston Historic District. 21 For the year ended December 31, 2011(1) For the year ended December 31, 2016
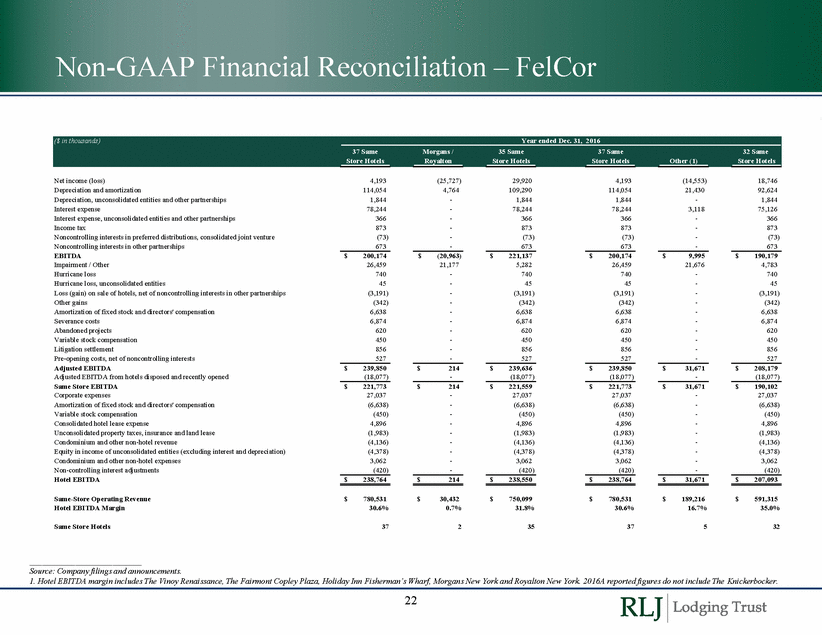
Non-GAAP Financial Reconciliation – FelCor Net income (loss) Depreciation and amortization Depreciation, unconsolidated entities and other partnerships Interest expense Interest expense, unconsolidated entities and other partnerships Income tax Noncontrolling interests in preferred distributions, consolidated joint venture Noncontrolling interests in other partnerships EBITDA Impairment / Other Hurricane loss Hurricane loss, unconsolidated entities Loss (gain) on sale of hotels, net of noncontrolling interests in other partnerships Other gains Amortization of fixed stock and directors' compensation Severance costs Abandoned projects Variable stock compensation Litigation settlement Pre-opening costs, net of noncontrolling interests Adjusted EBITDA Adjusted EBITDA from hotels disposed and recently opened Same Store EBITDA Corporate expenses Amortization of fixed stock and directors' compensation Variable stock compensation Consolidated hotel lease expense Unconsolidated property taxes, insurance and land lease Condominium and other non-hotel revenue Equity in income of unconsolidated entities (excluding interest and depreciation) Condominium and other non-hotel expenses Non-controlling interest adjustments Hotel EBITDA 4,193 114,054 1,844 78,244 366 873 (73) 673 (25,727) 4,764 - - - - - - 29,920 109,290 1,844 78,244 366 873 (73) 673 4,193 114,054 1,844 78,244 366 873 (73) 673 (14,553) 21,430 - 3,118 - - - - 18,746 92,624 1,844 75,126 366 873 (73) 673 $ 200,174 26,459 740 45 (3,191) (342) 6,638 6,874 620 450 856 527 $ (20,963) 21,177 - - - - - - - - - - $ 221,137 5,282 740 45 (3,191) (342) 6,638 6,874 620 450 856 527 $ 200,174 26,459 740 45 (3,191) (342) 6,638 6,874 620 450 856 527 $ 9,995 21,676 - - - - - - - - - - $ 190,179 4,783 740 45 (3,191) (342) 6,638 6,874 620 450 856 527 $ 239,850 (18,077) $ 214 - $ 239,636 (18,077) $ 239,850 (18,077) $ 31,671 - $ 208,179 (18,077) $ 221,773 27,037 (6,638) (450) 4,896 (1,983) (4,136) (4,378) 3,062 (420) $ 214 - - - - - - - - - $ 221,559 27,037 (6,638) (450) 4,896 (1,983) (4,136) (4,378) 3,062 (420) $ 221,773 27,037 (6,638) (450) 4,896 (1,983) (4,136) (4,378) 3,062 (420) $ 31,671 - - - - - - - - - $ 190,102 27,037 (6,638) (450) 4,896 (1,983) (4,136) (4,378) 3,062 (420) $ 238,764 $ 214 $ 238,550 $ 238,764 $ 31,671 $ 207,093 Same-Store Operating Revenue Hotel EBITDA Margin $ 780,531 30.6% $ 30,432 0.7% $ 750,099 31.8% $ 780,531 30.6% $ 189,216 16.7% $ 591,315 35.0% Same Store Hotels 37 2 35 37 5 32 Source: Company filings and announcements. 1. Hotel EBITDA margin includes The Vinoy Renaissance, The Fairmont Copley Plaza, Holiday Inn Fisherman’s Wharf, Morgans New York and Royalton New York. 2016A reported figures do not include The Knickerbocker. 22 ($ in thousands) Year ended Dec. 31, 2016 37 Same Morgans / 35 Same 37 Same 32 Same Store Hotels Royalton Store Hotels Store Hotels Other (1) Store Hotels
Forward-Looking Statements Certain statements in this presentation that are not in the present or past tense or that discuss the expectations of RLJ Lodging Trust (“RLJ”) and/or FelCor Lodging Trust Incorporated (“FelCor”), and the assumptions upon which those statements are based, are forward-looking statements within the meaning of the Private Securities Litigation Reform Act of 1995, Section 27A of the U.S. Securities Act of 1933, as amended, and Section 21E of the U.S. Securities Exchange Act of 1934, as amended. These forward looking statements, which are based on current expectations, estimates and projections about the industry and markets in which RLJ and FelCor operate and beliefs of and assumptions made by RLJ management and FelCor management, involve significant risks and uncertainties, which are difficult to predict and are not guarantees of future performances, that could significantly affect the financial results of RLJ or FelCor or the combined company. Words such as “projects,” “will,” “could,” “continue,” "expects," "anticipates," "intends," "plans," "believes," "seeks," "estimates," “forecast,” “guidance,” “outlook,” “may,” and “might” and variations of such words and similar expressions are intended to identify such forward looking statements, which generally are not historical in nature. Such forward-looking statements may include, but are not limited to, statements about the anticipated benefits of the proposed merger between RLJ and FelCor, including future financial and operating results, the attractiveness of the value to be received by FelCor stockholders, the attractiveness of the value to be received by RLJ, the combined company's plans, objectives, expectations and intentions, the timing of future events, anticipated administrative and operating synergies, the anticipated impact of the merger on net debt ratios, cost of capital, future dividend payment rates, forecasts of FFO accretion, projected capital improvements, expected sources of financing, and descriptions relating to these expectations. All statements that address operating performance, events or developments that we expect or anticipate will occur in the future — including statements relating to expected synergies, improved liquidity and balance sheet strength — are forward looking statements. These statements are not guarantees of future performance and involve certain risks, uncertainties and assumptions that are difficult to predict. Our ability to predict results or the actual effect of future events, actions, plans or strategies is inherently uncertain. Although we believe the expectations reflected in any forward-looking statements are based on reasonable assumptions, we can give no assurance that our expectations will be attained and therefore, actual outcomes and results may differ materially from what is expressed or forecasted in such forward looking statements. Some of the factors that may materially and adversely affect our business, financial condition, liquidity, results of operations and prospects, as well as our ability to make distributions to our shareholders, include, but are not limited to: (i) national, regional and local economic climates, (ii) changes in the real estate industry, financial markets and interest rates, or to the business or financial condition of either company or business, (iii) increased or unanticipated competition for the companies' properties, (iv) risks associated with acquisitions, including the integration of the combined companies' businesses, (v) the potential liability for the failure to meet regulatory requirements, including the maintenance of REIT status, (vi) availability of financing and capital, (vii) risks associated with achieving expected revenue synergies or cost savings, (viii) risks associated with the companies' ability to consummate the merger and the timing of the closing of the merger, (ix) the outcome of claims and litigation involving or affecting either company, (x) applicable regulatory changes, and (xi) those additional risks and factors discussed in reports filed with the Securities and Exchange Commission ("SEC") by RLJ and FelCor from time to time, including those discussed under the heading "Risk Factors" in their respective most recently filed reports on Forms 10K and 10Q. Neither RLJ nor FelCor, except as required by law, undertakes any duty to update any forward looking statements appearing in this document, whether as a result of new information, future events or otherwise. Readers are cautioned not to place undue reliance on these forward-looking statements, which speak only as of the date hereof. 23
Additional Information Additional Information about the Proposed Transaction and Where to Find It This communication relates to the proposed merger transaction pursuant to the terms of the Agreement and Plan of Merger, dated as of April 23, 2017, by and among RLJ Lodging Trust (“RLJ”), RLJ Lodging Trust, L.P., Rangers Sub I, LLC, Rangers Sub II, LP, FelCor Lodging Trust Incorporated (“FelCor”) and FelCor Limited Partnership. In connection with the proposed merger, RLJ expects to file with the SEC a registration statement on Form S4 that will include a joint proxy statement of RLJ and FelCor that also constitutes a prospectus of RLJ, which joint proxy statement/prospectus will be mailed or otherwise disseminated to RLJ shareholders and FelCor stockholders when it becomes available. RLJ and FelCor also plan to file other relevant documents with the SEC regarding the proposed transaction. INVESTORS ARE URGED TO READ THE JOINT PROXY STATEMENT/PROSPECTUS AND OTHER RELEVANT DOCUMENTS FILED WITH THE SEC IF AND WHEN THEY BECOME AVAILABLE BECAUSE THEY WILL CONTAIN IMPORTANT INFORMATION. You may obtain a free copy of the joint proxy statement/prospectus and other relevant documents (if and when they become available) filed by RLJ and FelCor with the SEC at the SEC's website at www.sec.gov. Copies of the documents filed by RLJ with the SEC will be available free of charge on RLJ's website at www.rljlodgingtrust.com or by emailing RLJ Investor Relations at ir@rljlodgingtrust.com or at 301-280-7774. Copies of the documents filed by FelCor with the SEC will be available free of charge on FelCor's website at www.felcor.com or by contacting FelCor Investor Relations at asalami@felcor.com or at 972-444-4967. RLJ and FelCor and their respective trustees, directors and executive officers and other members of management and employees may be deemed to be participants in the solicitation of proxies in respect of the proposed merger. You can find information about RLJ’s executive officers and Trustees in RLJ's definitive proxy statement filed with the SEC on March 28, 2017 in connection with its 2017 annual meeting of shareholders and in Form 4s of RLJ's trustees and executive officers filed with the SEC. You can find information about FelCor's executive officers and directors in FelCor's preliminary proxy statement filed with the SEC on March 24, 2017 in connection with its 2017 annual meeting of stockholders. Additional information regarding the interests of such potential participants will be included in the joint proxy statement/prospectus and other relevant documents filed with the SEC if and when they become available. You may obtain free copies of these documents from RLJ or FelCor using the sources indicated above. This document shall not constitute an offer to sell or the solicitation of an offer to buy any securities, nor shall there be any sale of securities in any jurisdiction in which such offer, solicitation or sale would be unlawful prior to registration or qualification under the securities laws of any such jurisdiction. No offering of securities shall be made except by means of a prospectus meeting the requirements of Section 10 of the U.S. Securities Act of 1933, as amended. 24
