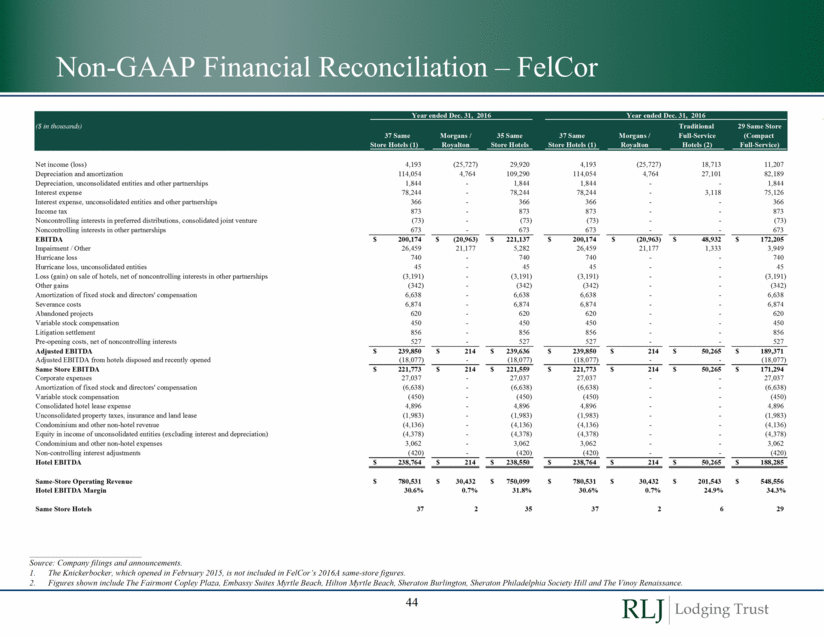
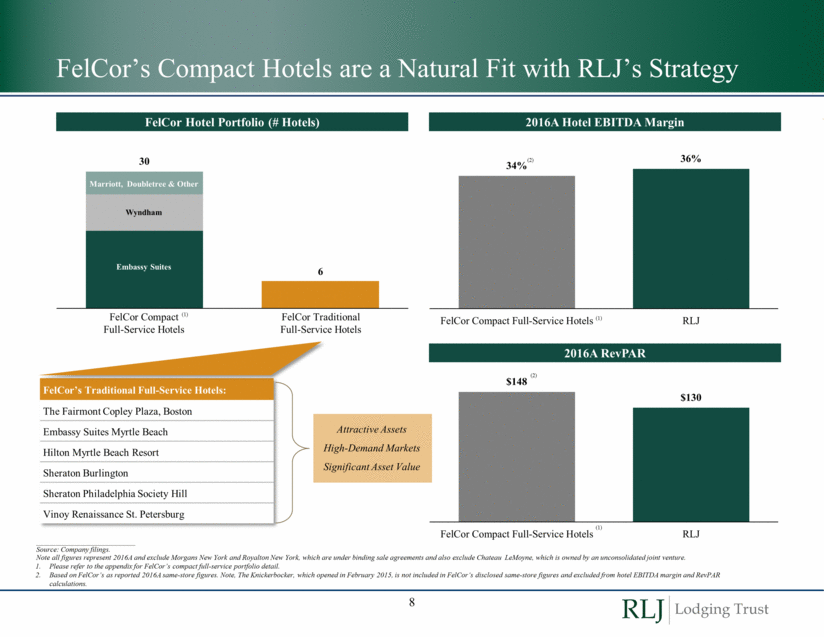
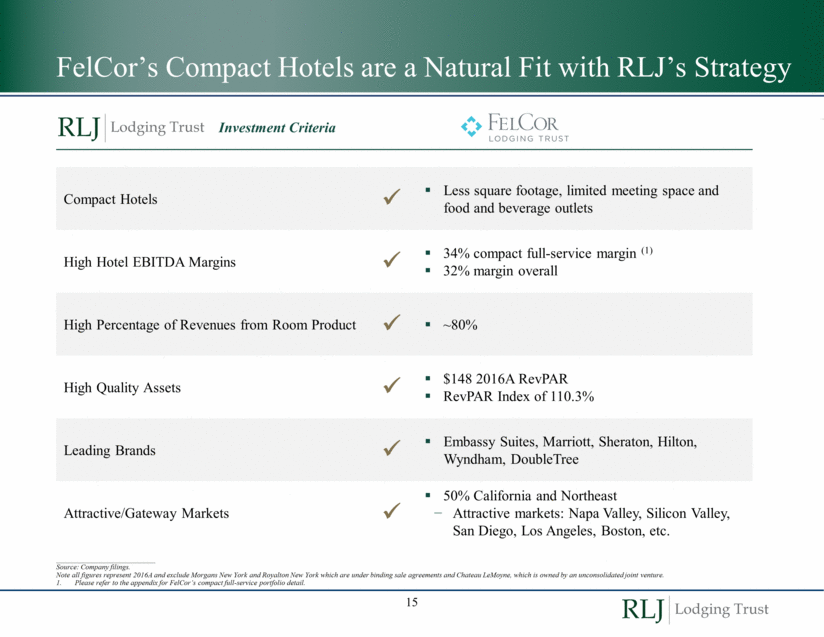
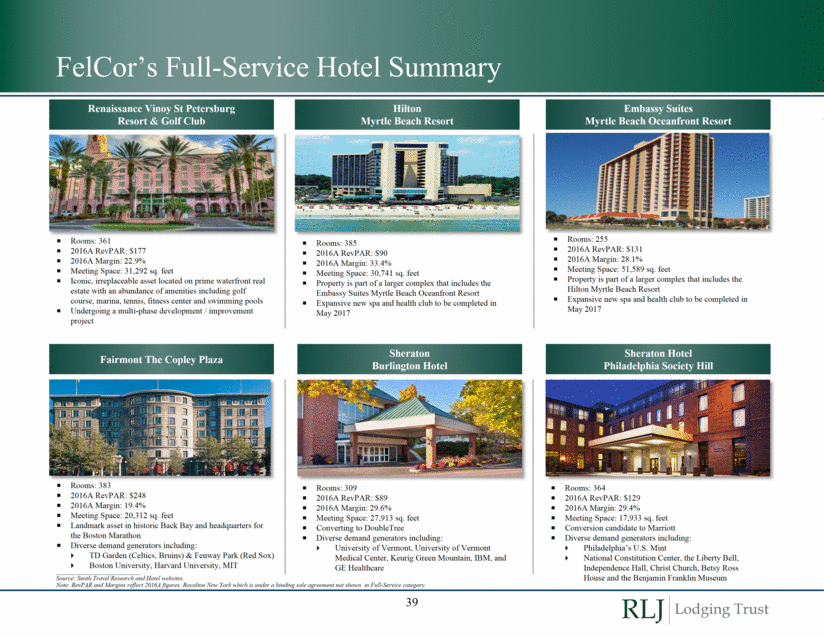
Non-GAAP Financial Reconciliation – FelCor ___________________________ Source: Company filings and announcements. The Knickerbocker, which opened in February 2015, is not included in FelCor’s 2016A same-store figures. Figures shown include The Fairmont Copley Plaza, Embassy Suites Myrtle Beach, Hilton Myrtle Beach, Sheraton Burlington, Sheraton Philadelphia Society Hill and The Vinoy Renaissance. 15 Year ended Dec. 31, 2016 Year ended Dec. 31, 2016 ($ in thousands) Traditional 29 Same Store 37 Same Morgans / 35 Same 37 Same Morgans / Full-Service (Compact Store Hotels (1) Royalton Store Hotels Store Hotels (1) Royalton Hotels (2) Full-Service) Net income (loss) 4,193 (25,727) 29,920 4,193 (25,727) 18,713 11,207 Depreciation and amortization 114,054 4,764 109,290 114,054 4,764 27,101 82,189 Depreciation, unconsolidated entities and other partnerships 1,844 - 1,844 1,844 - - 1,844 Interest expense 78,244 - 78,244 78,244 - 3,118 75,126 Interest expense, unconsolidated entities and other partnerships 366 - 366 366 - - 366 Income tax 873 - 873 873 - - 873 Noncontrolling interests in preferred distributions, consolidated joint venture (73) - (73) (73) - - (73) Noncontrolling interests in other partnerships 673 - 673 673 - - 673 EBITDA 200,174 $ (20,963) $ 221,137 $ 200,174 $ (20,963) $ 48,932 $ 172,205 $ Impairment / Other 26,459 21,177 5,282 26,459 21,177 1,333 3,949 Hurricane loss 740 - 740 740 - - 740 Hurricane loss, unconsolidated entities 45 - 45 45 - - 45 Loss (gain) on sale of hotels, net of noncontrolling interests in other partnerships (3,191) - (3,191) (3,191) - - (3,191) Other gains (342) - (342) (342) - - (342) Amortization of fixed stock and directors' compensation 6,638 - 6,638 6,638 - - 6,638 Severance costs 6,874 - 6,874 6,874 - - 6,874 Abandoned projects 620 - 620 620 - - 620 Variable stock compensation 450 - 450 450 - - 450 Litigation settlement 856 - 856 856 - - 856 Pre-opening costs, net of noncontrolling interests 527 - 527 527 - - 527 Adjusted EBITDA 239,850 $ 214 $ 239,636 $ 239,850 $ 214 $ 50,265 $ 189,371 $ Adjusted EBITDA from hotels disposed and recently opened (18,077) - (18,077) (18,077) - - (18,077) Same Store EBITDA 221,773 $ 214 $ 221,559 $ 221,773 $ 214 $ 50,265 $ 171,294 $ Corporate expenses 27,037 - 27,037 27,037 - - 27,037 Amortization of fixed stock and directors' compensation (6,638) - (6,638) (6,638) - - (6,638) Variable stock compensation (450) - (450) (450) - - (450) Consolidated hotel lease expense 4,896 - 4,896 4,896 - - 4,896 Unconsolidated property taxes, insurance and land lease (1,983) - (1,983) (1,983) - - (1,983) Condominium and other non-hotel revenue (4,136) - (4,136) (4,136) - - (4,136) Equity in income of unconsolidated entities (excluding interest and depreciation) (4,378) - (4,378) (4,378) - - (4,378) Condominium and other non-hotel expenses 3,062 - 3,062 3,062 - - 3,062 Non-controlling interest adjustments (420) - (420) (420) - - (420) Hotel EBITDA 238,764 $ 214 $ 238,550 $ 238,764 $ 214 $ 50,265 $ 188,285 $ Same-Store Operating Revenue 780,531 $ 30,432 $ 750,099 $ 780,531 $ 30,432 $ 201,543 $ 548,556 $ Hotel EBITDA Margin 30.6% 0.7% 31.8% 30.6% 0.7% 24.9% 34.3% Same Store Hotels 37 2 35 37 2 6 29 44
