UNITED STATES
SECURITIES AND EXCHANGE COMMISSION
Washington, D.C. 20549
SECURITIES AND EXCHANGE COMMISSION
Washington, D.C. 20549
FORM N-CSR
CERTIFIED SHAREHOLDER REPORT OF REGISTERED
MANAGEMENT INVESTMENT COMPANIES
Investment Company Act file number 811-22525
Managed Portfolio Series
(Exact name of Registrant as specified in charter)
(Exact name of Registrant as specified in charter)
615 East Michigan Street
Milwaukee, WI 53202
(Address of principal executive offices) (Zip code)
(Address of principal executive offices) (Zip code)
Brian R. Wiedmeyer, President
Managed Portfolio Series
c/o U.S. Bancorp Fund Services, LLC
777 East Wisconsin Ave, 5th Fl
Milwaukee, WI 53202
(Name and address of agent for service)
(Name and address of agent for service)
(414) 765-6844
Registrant's telephone number, including area code
Date of fiscal year end: July 31, 2021
Date of reporting period: January 31, 2021
Item 1. Report to Stockholders.
| (a) | [Insert full text of semi-annual report here] |
Coho Relative Value Equity Fund
cohox
Coho Relative Value ESG Fund
cesgx
Semi-Annual Report
January 31, 2021
COHO FUNDS
Dear Fellow Shareholders:
As January 31, 2021 marks the end of the Funds’ most recent semi-annual period, we are pleased to provide you with an update. At Coho Partners, Ltd., we remain committed to achieving each Fund’s investment objective and providing our shareholders with open and active communication so they may gain a clear understanding of our investment process, Fund performance results, and our most recent thoughts on the economy and the equity markets.
Fund Performance Review
From August 1, 2020 to January 31, 2021, the Coho Relative Value Equity Fund (the “Equity Fund”) returned 9.23% and the Coho Relative Value ESG Fund (the “ESG Fund”) returned 8.97% versus 14.47% for the S&P 500® Index and 17.00% for the Russell 1000® Value Index. The Funds’ relative underperformance for the period was driven by both allocation and selection effect.
From a sector perspective versus the S&P 500® Index, the Equity Fund’s overweight positions in Consumer Staples and Healthcare along with the underweight in Technology were the largest detractors to relative performance. Stock selection in both Financials and Industrials also had a negative impact on the relative performance.
The top five contributors to the Equity Fund’s performance were Microchip Technology Incorporated, Sysco Corporation, Ross Stores, Inc., Aflac Inc., and Automatic Data Processing, Inc. The five largest individual detractors during the period were Marsh & McLennan Companies, Kroger Co., ConAgra Brands, Inc., Amgen Inc., and Merck & Co., Inc.
Market Review
2020 was a most unusual year of market volatility due to the COVID pandemic, the race to develop vaccines, and the Presidential election. As such, we took advantage of the volatility and had one of the most active trading years in the portfolio since our inception. Our focus remains on trying to improve prospective returns while simultaneously reducing risk.
The downturn caused by the pandemic in 1Q was more than offset by investor enthusiasm such that the S&P 500® Index would close near its all-time high by year end. Throughout 2020, the Fund’s largest sector weighting was Health Care and the sector’s return of about 13% lagged that of the S&P 500® Index return. The Equity Fund is typically underweight in the Information Technology sector, given its cyclical growth bias, and this was a performance headwind because Information Technology was the best performing sector for the S&P 500® Index with a 43.9% return this year. Our conviction for the Health Care holdings and the sector in general is based on fundamental factors and our valuation discipline. Over the past two years, the Information Technology sector has dramatically outperformed the Health Care sector, but the primary reason for this is price-to-earnings (“P/E”) expansion in the Information Technology sector. Health Care has shown the best revenue growth and change in forward earnings of any sector in each of the last two years. Despite Health Care’s strong revenue and earnings growth, the sector has lagged the S&P 500® Index in each of the last two years. The forward P/E for Information Technology is towards the upper end of its historic range and the Health Care multiple is at a historic low. As such, we see a better risk/return for Health Care than in Information Technology.
We recently published an ESG white paper on the topic of active proxy voting. At Coho Partners, proxy voting is fully integrated into the investment process. In 2019, the Investment Team formally adopted customized ESG proxy voting guidelines which include best practices for governance and sustainability. We developed these based on in-depth research, years of experience voting proxies, and engagement with corporate officers, directors, and governance experts. The guidelines reflect our proprietary views and are used as a framework for decision making by portfolio managers when voting proxies. Proxy reviews performed for each of the portfolio companies include governance and sustainability research using a materiality lens and are supplemented by engagement with management. Engagement
2
COHO FUNDS
meetings help us influence and advocate for commitment to environmental and social responsibility, discuss corporate governance practices, and collect insights for proxy voting and sustainability research. We completed our first annual update of the guidelines at the end of 2020 to further reflect our proprietary corporate governance views, new proxy voting topics, and best practices.
The guidelines cover topics such as director elections, executive compensation, shareholder rights, and sustainability. These have all received increased attention from shareholders in recent years. For director elections, we have focused on increasing accountability for corporate results and improving board diversity. When reviewing executive compensation plans for say-on-pay proposals, we seek to align management interests with the creation of shareholder value. The guidelines promote shareholder interests through the expansion of shareholder rights. As it relates to sustainability, we continue to generally support environmental and social shareholder proposals to benefit stakeholders.
Fund Advisor Outlook
Growth has dominated value since 2009, but for the preceding ten years, growth and value posted similar returns. The current gap of “growth over value” is nearly as large as it was back in 2000 during the dot.com boom. We are not anticipating a reversal of that magnitude to begin in 2021, but we do believe there are cycles for growth and value and the likelihood of a “value” cycle beginning soon seems reasonable.
We believe that investing is a marathon and not a sprint. Adherence to disciplines with a keen eye on risk mitigation is what we believe ultimately separates us from other investment managers. Another integral part of our investment strategy is to have a rising income stream each year. The companies in which we invest tend to have appropriate dividend payouts given their future growth prospects and the Boards of these companies tend to increase the dividend on an annual basis. 2020 was a stressful year for most Boards as business models were disrupted in various degrees by the pandemic. However, for the year, income growth in the portfolio was about 9% versus flat for the S&P 500® Index and a negative 9% for the Russell 1000® Value Index.
Our overall focus remains on trying to improve prospective returns while simultaneously reducing risk. Our companies had good execution in 2020 and we do believe the portfolio is well positioned as we begin 2021. As always, we expect valuations to eventually catch up with fundamentals and we like the portfolios’ positioning as we move into this new year.
We thank you for your investment and continued confidence in the Coho Funds and we look forward to serving your interests over the many quarters and years to come.
Sincerely,
Coho Partners, Ltd.
3
COHO FUNDS
Past performance does not guarantee future results.
Opinions expressed are subject to change at any time, are not guaranteed and should not be considered investment advice.
Mutual fund investing involves risk. Principal loss is possible. The Funds may have a relatively high concentration of assets in a single or small number of issuers, which may reduce their diversification and result in increased volatility. The Funds may invest in smaller companies, which involve additional risks such as limited liquidity and greater volatility than larger capitalization companies. Investments in securities of foreign issuers involve risks not ordinarily associated with investment in securities and instruments of U.S. issuers, including risks relating to political, social and economic developments abroad, differences between U.S. and foreign regulatory and accounting requirements, tax risks, and market practices, as well as fluctuations in foreign currencies. The principal value and investment return of an investment will fluctuate so an investor’s shares, when redeemed, may be worth more or less than the initial investment.
Fund holdings and sector allocations are subject to change at any time and should not be considered a recommendation to buy or sell any security. Please see the schedule of investments section in this report for a full listing of each Fund’s holdings.
Growth stocks typically are more volatile than value stocks; however, value stocks have a lower expected growth rate in earnings and sales.
Price-to-earnings (P/E) is the ratio for valuing a company that measures its current share price relative to its per-share earnings.
The S&P 500® Index is a stock market index based on the market capitalizations of 500 leading companies publicly traded in the U.S. stock market, as determined by Standard & Poor’s. One cannot invest directly in an index.
The Russell 1000® Value Index measures the performance of equity securities of Russell 1000® Index issuers with lower price-to-book ratios and lower forecasted growth. One cannot invest directly in an index.
Permitted Use of the Russell 1000® Value Index
Source: London Stock Exchange Group plc and its group undertakings (collectively, the “LSE Group”). © LSE Group 2020.
The Coho Relative Value Equity and Coho Relative Value ESG strategies have been developed solely by Coho Partners, Ltd. The strategies are not in any way connected to or sponsored, endorsed, sold or promoted by the London Stock Exchange Group plc and its group undertakings. FTSE Russell is a trading name of certain of the LSE Group companies.
All rights in the Russell 1000® Value Index vest in the relevant LSE Group company which owns the Russell 1000® Value Index. Russell is a trademark of the relevant LSE Group company and is/are used by any other LSE Group company under license.
The Russell 1000® Value Index is calculated by or on behalf of FTSE International Limited or its affiliate, agent or partner. The LSE Group does not accept any liability whatsoever to any person arising out of (a) the use of, reliance on or any error in the Russell 1000® Value Index or (b) investment in or operation of the Coho Relative Value Equity and Coho Relative Value ESG strategies. The LSE Group makes no claim, prediction, warranty or representation either as to the results to be obtained from the Coho Relative Value Equity and Coho Relative Value ESG strategies or the suitability of the Russell 1000® Value Index for the purpose to which it is being put by Coho Partners, Ltd.
The Coho Funds are distributed by Compass Distributors, LLC.
4
COHO RELATIVE VALUE EQUITY FUND
Value of $10,000 Investment (Unaudited)

The chart assumes an initial investment of $10,000. Performance reflects waivers of fee and operating expenses in effect. In the absence of such waivers, total return would be reduced. Performance data quoted represents past performance and does not guarantee future results. Investment returns and principal value will fluctuate, and when sold, may be worth more or less than their original cost. Performance current to the most recent month-end may be lower or higher than the performance quoted and can be obtained by calling 866-COHO-234. Performance assumes the reinvestment of capital gains and income distributions. The performance does not reflect the deduction of taxes that a shareholder would pay on Fund distributions or the redemption of Fund shares.
Annualized Rates Of Return (%) — January 31, 2021
1 Year | 3 Year | 5 Year | Since Inception(1) | |
Coho Relative Value Equity Fund(2) | 10.77% | 5.74% | 10.93% | 9.71% |
S&P 500® Index(3) | 17.25% | 11.70% | 16.16% | 13.42% |
Russell 1000® Value Index(4) | 4.09% | 4.41% | 10.71% | 8.75% |
(1) | Period from Fund inception through January 31, 2021. The Fund commenced operations on August 14, 2013. |
(2) | On November 22, 2019, the Fund’s Institutional Class shares were merged into the Advisor Class shares. The Advisor Class name was subsequently discontinued following the merger. |
(3) | The S&P 500® Index is an unmanaged, capitalization-weighted index generally representative of the U.S. market for large capitalization stocks. One cannot invest directly in an Index. |
(4) | The Russell 1000® Value Index measures the performance of the small cap value segment of U.S. equity securities. It includes those Russell 1000® Index companies with lower price-to-book ratios and lower forecasted growth values. One cannot invest directly in an Index. |
The following is expense information for the Coho Relative Value Equity Fund as disclosed in the Fund’s most recent prospectus dated November 29, 2020:
Gross Expenses: 0.82%; Net Expenses: 0.79%. Coho Partners, Ltd. (the “Adviser” or “Coho”) has contractually agreed to waive its management fees and pay Fund expenses in order to ensure that Total Annual Fund Operating Expenses (excluding acquired fund fee and expenses, leverage/borrowing interest, interest expense, dividends paid on short sales, taxes, brokerage commissions and extraordinary expenses) do not exceed 0.79% of the average daily net assets of the Fund. Fees waived and expenses paid by the Adviser may be recouped by the Adviser for a period of 36 months following the month during which such fee waiver and expense payment was made if such recoupment can be achieved without exceeding the expense limit in effect at the time the fee waiver and expense payment occurred and the expense limit in place at the time of recoupment. The Operating Expenses Limitation Agreement is indefinite but cannot be terminated through at least November 29, 2021. Thereafter, the agreement may be terminated at any time upon 60 days’ written notice by the Trust’s Board of Trustees (the “Board”) or the Adviser, with the consent of the Board.
5
COHO RELATIVE VALUE ESG FUND
Value of $10,000 Investment (Unaudited)
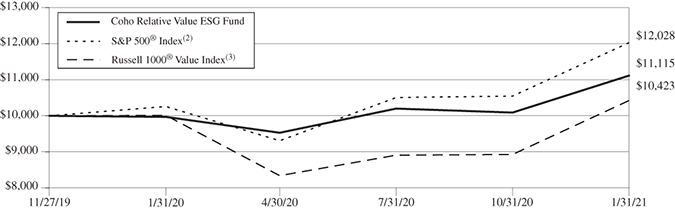
The chart assumes an initial investment of $10,000. Performance reflects waivers of fee and operating expenses in effect. In the absence of such waivers, total return would be reduced. Performance data quoted represents past performance and does not guarantee future results. Investment returns and principal value will fluctuate, and when sold, may be worth more or less than their original cost. Performance current to the most recent month-end may be lower or higher than the performance quoted and can be obtained by calling 866-COHO-234. Performance assumes the reinvestment of capital gains and income distributions. The performance does not reflect the deduction of taxes that a shareholder would pay on Fund distributions or the redemption of Fund shares.
Annualized Rates Of Return (%) — January 31, 2021
1 Year | Since Inception(1) | |
| Coho Relative Value ESG Fund | 11.48% | 9.39% |
S&P 500® Index(2) | 17.25% | 16.97% |
Russell 1000® Value Index(3) | 4.09% | 3.57% |
(1) | Period from Fund inception through January 31, 2021. The Fund commenced operations on November 27, 2019. |
(2) | The S&P 500® Index is an unmanaged, capitalization-weighted index generally representative of the U.S. market for large capitalization stocks. One cannot invest directly in an Index. |
(3) | The Russell 1000® Value Index measures the performance of the small cap value segment of U.S. equity securities. It includes those Russell 1000® Index companies with lower price-to-book ratios and lower forecasted growth values. One cannot invest directly in an Index. |
The following is expense information for the Coho Relative Value ESG Fund as disclosed in the Fund’s most recent prospectus dated November 29, 2020:
Gross Expenses: 9.78%; Net Expenses: 0.79%. Coho Partners, Ltd. (the “Adviser” or “Coho”) has contractually agreed to waive its management fees and pay Fund expenses in order to ensure that Total Annual Fund Operating Expenses (excluding acquired fund fee and expenses, leverage/borrowing interest, interest expense, dividends paid on short sales, taxes, brokerage commissions and extraordinary expenses) do not exceed 0.79% of the average daily net assets of the Fund. Fees waived and expenses paid by the Adviser may be recouped by the Adviser for a period of 36 months following the month during which such fee waiver and expense payment was made if such recoupment can be achieved without exceeding the expense limit in effect at the time the fee waiver and expense payment occurred and the expense limit in place at the time of recoupment. The Operating Expenses Limitation Agreement is indefinite in term but cannot be terminated through at least November 29, 2021. Thereafter, the agreement may be terminated at any time upon 60 days’ written notice by the Trust’s Board of Trustees (the “Board”) or the Adviser, with the consent of the Board.
6
COHO FUNDS
Expense Examples (Unaudited)
January 31, 2021
As a shareholder of a Fund, you incur two types of costs: (1) transaction costs, including brokerage commissions on purchases and sales of Fund shares, and (2) ongoing costs, including management fees and other Fund expenses. This Example is intended to help you understand your ongoing costs (in dollars) of investing in a Fund and to compare these costs with the ongoing costs of investing in other mutual funds. The Example is based on an investment of $1,000 invested at the beginning of the period and held for the entire period (August 1, 2020 – January 31, 2021).
ACTUAL EXPENSES
The first line of each table below provides information about actual account values and actual expenses. You may use the information in this line, together with the amount you invested, to estimate the expenses that you paid over the period. Simply divide your account value by $1,000 (for example, an $8,600 account value divided by $1,000 = 8.6), then multiply the result by the number in the first line under the heading entitled “Expenses Paid During Period” to estimate the expenses you paid on your account during this period.
HYPOTHETICAL EXAMPLE FOR COMPARISON PURPOSES
The second line of each table below provides information about hypothetical account values and hypothetical expenses based on the Fund’s actual expense ratio and an assumed rate of return of 5% per year before expenses, which is not the Fund’s actual return. The hypothetical account values and expenses may not be used to estimate the actual ending account balance or expenses you paid for the period. You may use this information to compare the ongoing costs of investing in the Fund and other funds. To do so, compare this 5% hypothetical example with the 5% hypothetical examples that appear in the shareholder reports of the other funds.
Please note that the expenses shown in the tables are meant to highlight your ongoing costs only and do not reflect any transactional costs. Therefore, the second line of each table is useful in comparing ongoing costs only and will not help you determine the relative total costs of owning different funds. In addition, if transactional costs were included, your costs may have been higher.
Coho Relative Value Equity Fund
| Beginning | Ending | Expenses Paid | |
| Account Value | Account Value | During Period(1) | |
(8/1/2020) | (1/31/2021) | (8/1/2020 to 1/31/2021) | |
Actual(2) | $1,000.00 | $1,092.30 | $4.17 |
| Hypothetical (5% return before expenses) | $1,000.00 | $1,021.22 | $4.02 |
(1) | Expenses are equal to the Fund’s annualized expense ratio for the most recent six-month period of 0.79%, multiplied by the average account value over the period, multiplied by 184/365 to reflect the one-half year period. |
(2) | Based on the actual return for the six-month period ended January 31, 2021 of 9.23%. |
Coho Relative Value ESG Fund
| Beginning | Ending | Expenses Paid | |
| Account Value | Account Value | During Period(3) | |
(8/1/2020) | (1/31/2021) | (8/1/2020 to 1/31/2021) | |
Actual(4) | $1,000.00 | $1,089.70 | $4.16 |
| Hypothetical (5% return before expenses) | $1,000.00 | $1,021.22 | $4.02 |
(3) | Expenses are equal to the Fund’s annualized expense ratio for the most recent six-month period of 0.79%, multiplied by the average account value over the period, multiplied by 184/365 to reflect the one-half year period. |
(4) | Based on the actual return for the six-month period ended January 31, 2021 of 8.97%. |
7
COHO RELATIVE VALUE EQUITY FUND
Sector Allocation(1) (Unaudited)
as of January 31, 2021
(% of net assets)
Top Ten Equity Holdings(1) (Unaudited)
as of January 31, 2021
(% of net assets)
| Lowe’s Companies | 4.8% | ||
| Ross Stores | 4.8% | ||
| Johnson & Johnson | 4.5% | ||
| U.S. Bancorp | 4.4% | ||
| UnitedHealth Group | 4.4% | ||
| Global Payments | 4.2% | ||
| Amgen | 4.1% | ||
| CVS Health | 4.1% | ||
| AmerisourceBergen | 3.8% | ||
| Coca-Cola | 3.6% |
(1) | Fund holdings and sector allocations are subject to change at any time and are not recommendations to buy or sell any security. |
8
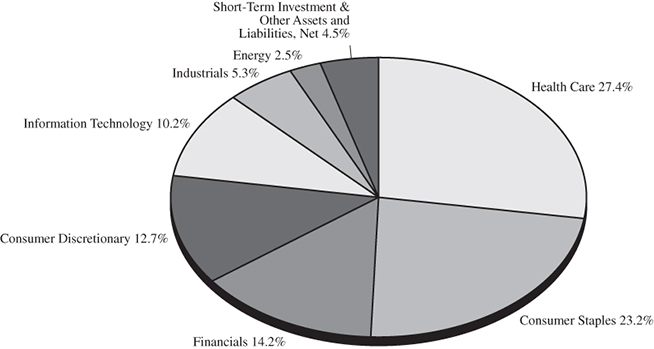
COHO RELATIVE VALUE ESG FUND
Sector Allocation(1) (Unaudited)
as of January 31, 2021
(% of net assets)

Top Ten Equity Holdings(1) (Unaudited)
as of January 31, 2021
(% of net assets)
| Ross Stores | 5.0% | ||
| Johnson & Johnson | 4.8% | ||
| Lowe’s Companies | 4.8% | ||
| U.S. Bancorp | 4.6% | ||
| UnitedHealth Group | 4.5% | ||
| Global Payments | 4.2% | ||
| Amgen | 4.1% | ||
| Coca-Cola | 4.1% | ||
| CVS Health | 4.1% | ||
| Quest Diagnostics | 3.9% |
(1) | Fund holdings and sector allocations are subject to change at any time and are not recommendations to buy or sell any security. |
9
COHO RELATIVE VALUE EQUITY FUND
Schedule of Investments (Unaudited)
January 31, 2021
| Shares | Value | |||||||
| COMMON STOCKS — 95.5% | ||||||||
| Consumer Discretionary — 12.7% | ||||||||
| Dollar General | 136,210 | $ | 26,507,828 | |||||
| Lowe’s Companies | 244,858 | 40,854,557 | ||||||
| Ross Stores | 366,540 | 40,792,237 | ||||||
| 108,154,622 | ||||||||
| Consumer Staples — 23.2% | ||||||||
| Altria Group | 483,437 | 19,859,592 | ||||||
| Coca-Cola | 638,461 | 30,741,897 | ||||||
| Conagra Brands | 798,718 | 27,635,643 | ||||||
| JM Smucker | 165,291 | 19,241,525 | ||||||
| Kroger | 668,702 | 23,070,219 | ||||||
| Philip Morris International | 292,106 | 23,266,243 | ||||||
| Sysco | 402,623 | 28,791,571 | ||||||
| Unilever | 420,565 | 24,535,762 | ||||||
| 197,142,452 | ||||||||
| Energy — 2.5% | ||||||||
| Chevron | 245,706 | 20,934,151 | ||||||
| Financials — 14.2% | ||||||||
| Aflac | 486,826 | 21,994,799 | ||||||
| Marsh & McLennan Companies | 279,123 | 30,678,409 | ||||||
| State Street | 429,312 | 30,051,840 | ||||||
| U.S. Bancorp | 881,683 | 37,780,116 | ||||||
| 120,505,164 | ||||||||
Health Care — 27.4%# | ||||||||
| AmerisourceBergen | 307,805 | 32,073,281 | ||||||
| Amgen | 145,853 | 35,213,290 | ||||||
| CVS Health | 490,464 | 35,141,746 | ||||||
| Johnson & Johnson | 234,891 | 38,317,769 | ||||||
| Medtronic | 260,732 | 29,027,293 | ||||||
| Merck & Co. | 336,362 | 25,923,419 | ||||||
| UnitedHealth Group | 112,686 | 37,589,796 | ||||||
| 233,286,594 | ||||||||
| Industrials — 5.3% | ||||||||
| Stanley Black & Decker | 106,032 | 18,395,492 | ||||||
| W.W. Grainger | 74,185 | 27,032,272 | ||||||
| 45,427,764 | ||||||||
See Notes to the Financial Statements
10
COHO RELATIVE VALUE EQUITY FUND
Schedule of Investments (Unaudited) – Continued
January 31, 2021
| Shares | Value | |||||||
| Information Technology — 10.2% | ||||||||
| Automatic Data Processing | 145,480 | $ | 24,021,658 | |||||
| Global Payments | 203,774 | 35,970,186 | ||||||
| Microchip Technology | 195,817 | 26,652,652 | ||||||
| 86,644,496 | ||||||||
| Total Common Stocks | ||||||||
| (Cost $695,216,409) | 812,095,243 | |||||||
| SHORT-TERM INVESTMENT — 4.4% | ||||||||
| U.S. Bank N.A., 0.00%^ | ||||||||
| (Cost $37,652,191) | 37,652,191 | 37,652,191 | ||||||
| Total Investments — 99.9% | ||||||||
| (Cost $732,868,600) | 849,747,434 | |||||||
| Other Assets and Liabilities, Net — 0.1% | 975,210 | |||||||
| Total Net Assets — 100.0% | $ | 850,722,644 | ||||||
| # | As of January 31, 2021, the Fund had a significant portion of its assets invested in this sector and therefore is subject to additional risks. See Note 8 in Notes to the Financial Statements. |
| ^ | The Money Market Deposit Account (“MMDA”) is a short-term investment vehicle in which the Fund holds cash balances. The MMDA will bear interest at a variable rate that is determined based on market conditions and may change daily and by any amount. The rate shown is as of January 31, 2021. |
The Global Industry Classification Standard (“GICS®”) was developed by and/or is the exclusive property of MSCI, Inc. (“MSCI”) and Standard & Poor Financial Services LLC (“S&P”). GICS® is a service mark of MSCI and S&P and has been licensed for use.
See Notes to the Financial Statements
11
COHO RELATIVE VALUE ESG FUND
Schedule of Investments (Unaudited)
January 31, 2021
| Shares | Value | |||||||
| COMMON STOCKS — 94.7% | ||||||||
| Consumer Discretionary — 12.9% | ||||||||
| Dollar General | 2,518 | $ | 490,028 | |||||
| Lowe’s Companies | 4,568 | 762,171 | ||||||
| Ross Stores | 7,182 | 799,285 | ||||||
| 2,051,484 | ||||||||
| Consumer Staples — 23.4% | ||||||||
| Coca-Cola | 13,401 | 645,258 | ||||||
| Colgate-Palmolive | 6,166 | 480,948 | ||||||
| Conagra Brands | 15,760 | 545,296 | ||||||
| JM Smucker | 4,807 | 559,583 | ||||||
| Kroger | 12,408 | 428,076 | ||||||
| Sysco | 7,515 | 537,398 | ||||||
| Unilever | 8,837 | 515,550 | ||||||
| 3,712,109 | ||||||||
| Financials — 14.3% | ||||||||
| Aflac | 8,723 | 394,105 | ||||||
| Marsh & McLennan Companies | 5,159 | 567,026 | ||||||
| State Street | 8,371 | 585,970 | ||||||
| U.S. Bancorp | 17,051 | 730,635 | ||||||
| 2,277,736 | ||||||||
Health Care — 28.3%# | ||||||||
| Amgen | 2,713 | 654,999 | ||||||
| CVS Health | 8,972 | 642,844 | ||||||
| Johnson & Johnson | 4,710 | 768,342 | ||||||
| Medtronic | 4,875 | 542,734 | ||||||
| Merck & Co. | 7,367 | 567,775 | ||||||
| Quest Diagnostics | 4,798 | 619,662 | ||||||
| UnitedHealth Group | 2,122 | 707,857 | ||||||
| 4,504,213 | ||||||||
| Industrials — 5.2% | ||||||||
| Stanley Black & Decker | 1,932 | 335,183 | ||||||
| W.W. Grainger | 1,337 | 487,189 | ||||||
| 822,372 | ||||||||
See Notes to the Financial Statements
12
COHO RELATIVE VALUE ESG FUND
Schedule of Investments (Unaudited) – Continued
January 31, 2021
| Shares | Value | |||||||
| Information Technology — 10.6% | ||||||||
| Automatic Data Processing | 3,256 | $ | 537,631 | |||||
| Global Payments | 3,774 | 666,186 | ||||||
| Microchip Technology | 3,475 | 472,982 | ||||||
| 1,676,799 | ||||||||
| Total Common Stocks | ||||||||
| (Cost $14,694,611) | 15,044,713 | |||||||
| SHORT-TERM INVESTMENT — 4.6% | ||||||||
| U.S. Bank N.A., 0.00%^ | ||||||||
| (Cost $741,272) | 741,272 | 741,272 | ||||||
| Total Investments — 99.3% | ||||||||
| (Cost $15,435,883) | 15,785,985 | |||||||
| Other Assets and Liabilities, Net — 0.7% | 104,042 | |||||||
| Total Net Assets — 100.0% | $ | 15,890,027 | ||||||
| # | As of January 31, 2021, the Fund had a significant portion of its assets invested in this sector and therefore is subject to additional risks. See Note 8 in Notes to the Financial Statements. |
| ^ | The Money Market Deposit Account (“MMDA”) is a short-term investment vehicle in which the Fund holds cash balances. The MMDA will bear interest at a variable rate that is determined based on market conditions and may change daily and by any amount. The rate shown is as of January 31, 2021. |
The Global Industry Classification Standard (“GICS®”) was developed by and/or is the exclusive property of MSCI, Inc. (“MSCI”) and Standard & Poor Financial Services LLC (“S&P”). GICS® is a service mark of MSCI and S&P and has been licensed for use.
See Notes to the Financial Statements
13
COHO FUNDS
Statements of Assets and Liabilities (Unaudited)
January 31, 2021
| Coho | Coho | |||||||
| Relative Value | Relative Value | |||||||
| Equity Fund | ESG Fund | |||||||
| ASSETS: | ||||||||
| Investments, at value | ||||||||
| (Cost: $732,868,600 & $15,435,883, respectively) | $ | 849,747,434 | $ | 15,785,985 | ||||
| Dividends and interest receivable | 740,675 | 16,677 | ||||||
| Receivable for capital shares sold | 4,477,822 | 96,000 | ||||||
| Receivable from investment adviser | — | 2,591 | ||||||
| Prepaid expenses | 11,093 | 15,391 | ||||||
| Total assets | 854,977,024 | 15,916,644 | ||||||
| LIABILITIES: | ||||||||
| Payable for capital shares redeemed | 3,567,159 | — | ||||||
| Payable to investment adviser | 527,344 | — | ||||||
| Payable for fund administration & accounting fees | 117,718 | 6,191 | ||||||
| Payable for compliance fees | 3,132 | 3,132 | ||||||
| Payable for custody fees | 7,402 | 1,520 | ||||||
| Payable for transfer agent fees & expenses | 13,823 | 4,139 | ||||||
| Payable for trustee fees | 2,622 | 2,058 | ||||||
| Payable for audit fees | 9,569 | 8,279 | ||||||
| Accrued expenses | 5,611 | 1,298 | ||||||
| Total liabilities | 4,254,380 | 26,617 | ||||||
| NET ASSETS | $ | 850,722,644 | $ | 15,890,027 | ||||
| NET ASSETS CONSIST OF: | ||||||||
| Paid-in capital | $ | 717,268,174 | $ | 15,432,766 | ||||
| Total distributable earnings | 133,454,470 | 457,261 | ||||||
| Net Assets | $ | 850,722,644 | $ | 15,890,027 | ||||
| Net Assets | $ | 850,722,644 | $ | 15,890,027 | ||||
Shares issued and outstanding(1) | 56,192,216 | 1,457,174 | ||||||
Net asset value, redemption price and offering price per share(2) | $ | 15.14 | $ | 10.90 | ||||
(1) | Unlimited shares authorized without par value. |
(2) | Prior to November 29, 2020, a redemption fee of 2.00% was assessed against shares redeemed within 60 days of purchase. |
See Notes to the Financial Statements
14
COHO FUNDS
Statements of Operations (Unaudited)
For the Six Months Ended January 31, 2021
| Coho | Coho | |||||||
| Relative Value | Relative Value | |||||||
| Equity Fund | ESG Fund | |||||||
| INVESTMENT INCOME: | ||||||||
| Dividend income | $ | 10,255,866 | $ | 74,589 | ||||
| Less: Foreign taxes withheld | (59,410 | ) | (346 | ) | ||||
| Interest income | 1,580 | 18 | ||||||
| Total investment income | 10,198,036 | 74,261 | ||||||
| EXPENSES: | ||||||||
| Investment adviser fees (See Note 4) | 2,902,492 | 25,526 | ||||||
| Fund administration & accounting fees (See Note 4) | 217,279 | 12,155 | ||||||
| Custody fees (See Note 4) | 30,271 | 4,873 | ||||||
| Transfer agent fees & expenses (See Note 4) | 29,631 | 8,224 | ||||||
| Federal & state registration fees | 26,022 | 14,815 | ||||||
| Audit fees | 9,568 | 8,280 | ||||||
| Trustee fees | 6,737 | 6,167 | ||||||
| Compliance fees (See Note 4) | 6,256 | 6,256 | ||||||
| Postage & printing fees | 4,588 | 279 | ||||||
| Legal fees | 3,763 | 3,763 | ||||||
| Insurance expense | 1,543 | 546 | ||||||
| Other expenses | 3,217 | 1,929 | ||||||
| Total expenses before waiver/reimbursement | 3,241,367 | 92,813 | ||||||
| Adviser recoupment (See Note 4) | 34,303 | — | ||||||
| Less: reimbursement from investment adviser (See Note 4) | — | (64,005 | ) | |||||
| Net expenses | 3,275,670 | 28,808 | ||||||
| NET INVESTMENT INCOME | 6,922,366 | 45,453 | ||||||
| REALIZED AND UNREALIZED | ||||||||
| GAIN (LOSS) ON INVESTMENTS | ||||||||
| Net realized gain on investments | 34,431,785 | 158,815 | ||||||
| Net change in unrealized | ||||||||
| appreciation/depreciation on investments | 30,614,885 | (7,128 | ) | |||||
| Net realized and unrealized gain on investments | 65,046,670 | 151,687 | ||||||
| NET INCREASE IN NET ASSETS | ||||||||
| RESULTING FROM OPERATIONS | $ | 71,969,036 | $ | 197,140 | ||||
See Notes to the Financial Statements
15
COHO RELATIVE VALUE EQUITY FUND
Statements of Changes in Net Assets
| Six-Months Ended | ||||||||
| January 31, 2021 | Year Ended | |||||||
| (Unaudited) | July 31, 2020 | |||||||
| OPERATIONS: | ||||||||
| Net investment income | $ | 6,922,366 | $ | 11,047,468 | ||||
| Net realized gain on investments | 34,431,785 | 24,466,283 | ||||||
| Net change in unrealized appreciation/depreciation on investments | 30,614,885 | 27,217,688 | ||||||
| Net increase in net assets resulting from operations | 71,969,036 | 62,731,439 | ||||||
| CAPITAL SHARE TRANSACTIONS: | ||||||||
Advisor Class(1): | ||||||||
| Proceeds from shares sold | 125,963,398 | 297,343,269 | ||||||
| Cost of shares issued in exchange for Institutional Class shares | — | 414,609,967 | ||||||
| Proceeds from reinvestment of distributions | 16,518,865 | 7,893,859 | ||||||
| Payments for shares redeemed | (71,573,007 | ) | (169,131,030 | ) | ||||
| Payments for transfer-in-kind | — | (100,000 | ) | |||||
| Redemption fees | 41,654 | 124,307 | ||||||
| Increase in net assets resulting from Advisor Class transactions | 70,950,910 | 550,740,372 | ||||||
Institutional Class(1): | ||||||||
| Proceeds from shares sold | — | 27,805,323 | ||||||
| Proceeds from reinvestment of distributions | — | 13,408,787 | ||||||
| Payments for shares redeemed | — | (34,599,798 | ) | |||||
| Cost of shares exchanged for Advisor Class shares | — | (414,609,967 | ) | |||||
| Redemption fees | — | 778 | ||||||
| Decrease in net assets resulting | ||||||||
| from Institutional Class transactions | — | (407,994,877 | ) | |||||
| Net increase in net assets resulting | ||||||||
| from capital share transactions | 70,950,910 | 142,745,495 | ||||||
| DISTRIBUTIONS TO SHAREHOLDERS | ||||||||
Advisor Class(1) | (34,023,745 | ) | (11,706,188 | ) | ||||
Institutional Class(1) | — | (26,579,014 | ) | |||||
| Total distributions to shareholders | (34,023,745 | ) | (38,285,202 | ) | ||||
| TOTAL INCREASE IN NET ASSETS | 108,896,201 | 167,191,732 | ||||||
| NET ASSETS: | ||||||||
| Beginning of period | 741,826,443 | 574,634,711 | ||||||
| End of period | $ | 850,722,644 | $ | 741,826,443 | ||||
(1) | On November 22, 2019, the Fund’s Institutional Class shares were merged into the Advisor Class shares. The Advisor Class name was subsequently discontinued following the merger. |
See Notes to the Financial Statements
16
COHO RELATIVE VALUE ESG FUND
Statements of Changes in Net Assets
| Six-Months Ended | Period Inception(1) | |||||||
| January 31, 2021 | Through | |||||||
| (Unaudited) | July 31, 2020 | |||||||
| OPERATIONS: | ||||||||
| Net investment income | $ | 45,453 | $ | 14,764 | ||||
| Net realized gain on investments | 158,815 | 10,515 | ||||||
| Net change in unrealized appreciation/depreciation on investments | (7,128 | ) | 357,230 | |||||
| Net increase in net assets resulting from operations | 197,140 | 382,509 | ||||||
| CAPITAL SHARE TRANSACTIONS: | ||||||||
| Proceeds from shares sold | 12,089,351 | 3,224,228 | ||||||
| Proceeds from transfer-in-kind | — | 100,000 | ||||||
| Proceeds from reinvestment of distributions | 117,541 | 210 | ||||||
| Payments for shares redeemed | (98,564 | ) | — | |||||
| Net increase in net assets resulting from capital share transactions | 12,108,328 | 3,324,438 | ||||||
| DISTRIBUTIONS TO SHAREHOLDERS | (122,178 | ) | (210 | ) | ||||
| TOTAL INCREASE IN NET ASSETS | 12,183,290 | 3,706,737 | ||||||
| NET ASSETS: | ||||||||
| Beginning of period | 3,706,737 | — | ||||||
| End of period | $ | 15,890,027 | $ | 3,706,737 | ||||
(1) | Inception date for the Fund was November 27, 2019. |
See Notes to the Financial Statements
17
COHO RELATIVE VALUE EQUITY FUND
Financial Highlights
For a Fund share outstanding throughout the periods.
| Six-Months Ended | Year Ended | Year Ended | Year Ended | Year Ended | Year Ended | |||||||||||||||||||
| January 31, 2021 | July 31, | July 31, | July 31, | July 31, | July 31, | |||||||||||||||||||
Advisor Class(1) | (Unaudited) | 2020 | 2019 | 2018 | 2017 | 2016 | ||||||||||||||||||
| PER SHARE DATA: | ||||||||||||||||||||||||
| Net asset value, | ||||||||||||||||||||||||
| beginning of period | $ | 14.42 | $ | 14.20 | $ | 14.87 | $ | 13.71 | $ | 12.86 | $ | 12.33 | ||||||||||||
| INVESTMENT OPERATIONS: | ||||||||||||||||||||||||
| Net investment income | 0.13 | (2) | 0.25 | (2) | 0.28 | 0.22 | 0.17 | 0.19 | ||||||||||||||||
| Net realized and unrealized | ||||||||||||||||||||||||
| gain on investments | 1.21 | 0.93 | 0.06 | 1.49 | 0.92 | 0.65 | ||||||||||||||||||
| Total from investment operations | 1.34 | 1.18 | 0.34 | 1.71 | 1.09 | 0.84 | ||||||||||||||||||
| LESS DISTRIBUTIONS: | ||||||||||||||||||||||||
| From net investment income | (0.22 | ) | (0.26 | ) | (0.23 | ) | (0.17 | ) | (0.19 | ) | (0.13 | ) | ||||||||||||
| From net realized gains | (0.40 | ) | (0.70 | ) | (0.78 | ) | (0.38 | ) | (0.05 | ) | (0.19 | ) | ||||||||||||
| Total distributions | (0.62 | ) | (0.96 | ) | (1.01 | ) | (0.55 | ) | (0.24 | ) | (0.32 | ) | ||||||||||||
| Paid-in capital from redemption fees | — | (3) | — | (3) | — | (3) | — | (3) | — | (3) | 0.01 | |||||||||||||
| Net asset value, end of period | $ | 15.14 | $ | 14.42 | $ | 14.20 | $ | 14.87 | $ | 13.71 | $ | 12.86 | ||||||||||||
TOTAL RETURN(4) | 9.23 | % | 8.45 | % | 2.55 | % | 12.63 | % | 8.63 | % | 7.14 | % | ||||||||||||
| SUPPLEMENTAL DATA AND RATIOS: | ||||||||||||||||||||||||
| Net assets, end | ||||||||||||||||||||||||
| of period (in 000’s) | $ | 850,723 | $ | 741,826 | $ | 171,070 | $ | 214,614 | $ | 225,343 | $ | 195,536 | ||||||||||||
| Ratio of expenses to average net assets: | ||||||||||||||||||||||||
Before expense waiver/recoupment(5) | 0.78 | % | 0.82 | % | 0.93 | % | 0.94 | % | 0.96 | % | 1.01 | % | ||||||||||||
After expense waiver/recoupment(5) | 0.79 | % | 0.81 | %(6) | 0.94 | % | 0.94 | % | 0.94 | % | 0.94 | % | ||||||||||||
| Ratio of net investment income | ||||||||||||||||||||||||
| to average net assets: | ||||||||||||||||||||||||
After expense waiver/recoupment(5) | 1.67 | % | 1.76 | % | 1.71 | % | 1.44 | % | 1.39 | % | 1.50 | % | ||||||||||||
Portfolio turnover rate(4) | 19 | % | 27 | % | 20 | % | 21 | % | 23 | % | 24 | % | ||||||||||||
(1) | On November 22, 2019, the Fund’s Institutional Class shares were merged into the Advisor Class shares. The Advisor Class name was subsequently discontinued following the merger. |
(2) | Per share amounts calculated using the average shares method. |
(3) | Amount per share is less than $0.01. |
(4) | Not annualized for period less than one year. |
(5) | Annualized for period less than one year. |
(6) | Prior to November 22, 2019, the annual expense limitation was 0.94% of the average daily net assets for the Advisor Class. Thereafter it was 0.79% for the existing class. |
See Notes to the Financial Statements
18
COHO RELATIVE VALUE ESG FUND
Financial Highlights
For a Fund share outstanding throughout the periods.
| Six-Months Ended | Since Inception(1) | |||||||
| January 31, 2021 | through | |||||||
| (Unaudited) | July 31, 2020 | |||||||
| PER SHARE DATA: | ||||||||
| Net asset value, beginning of period | $ | 10.19 | $ | 10.00 | ||||
| INVESTMENT OPERATIONS: | ||||||||
| Net investment income | 0.01 | 0.05 | ||||||
| Net realized and unrealized gain on investments | 0.90 | 0.15 | ||||||
| Total from investment operations | 0.91 | 0.20 | ||||||
| LESS DISTRIBUTIONS: | ||||||||
| From net investment income | (0.04 | ) | (0.01 | ) | ||||
| From net realized gains | (0.16 | ) | — | |||||
| Total distributions | (0.20 | ) | (0.01 | ) | ||||
| Net asset value, end of period | $ | 10.90 | $ | 10.19 | ||||
TOTAL RETURN(2) | 8.97 | % | 2.00 | % | ||||
| SUPPLEMENTAL DATA AND RATIOS: | ||||||||
| Net assets, end of period (in 000’s) | $ | 15,890 | $ | 3,707 | ||||
| Ratio of expenses to average net assets: | ||||||||
Before expense waiver/reimbursement(3) | 2.55 | % | 9.78 | % | ||||
After expense waiver/reimbursement(3) | 0.79 | % | 0.79 | % | ||||
| Ratio of net investment income to average net assets: | ||||||||
After expense waiver/reimbursement(3) | 1.25 | % | 1.48 | % | ||||
Portfolio turnover rate(2) | 11 | % | 10 | % | ||||
(1) | Inception date for the Fund was November 27, 2019. |
(2) | Not annualized for period less than one year. |
(3) | Annualized for period less than one year. |
See Notes to the Financial Statements
19
COHO FUNDS
Notes to the Financial Statements (Unaudited)
January 31, 2021
1. ORGANIZATION
Managed Portfolio Series (the “Trust”) was organized as a Delaware statutory trust on January 27, 2011. The Trust is registered under the Investment Company Act of 1940, as amended (the “1940 Act”), as an open-end management investment company. Both the Coho Relative Value Equity Fund (the “Equity Fund”) and Coho Relative Value ESG Fund (the “ESG Fund”) (each a “Fund” and collectively, the “Funds”) are diversified series, each with their own investment objectives and policies within the Trust. The investment objective of both Funds is total return. The Funds are investment companies and accordingly follow the investment company accounting and reporting guidance of the Financial Accounting Standards Board (“FASB”) Accounting Standards Codification Topic 946, Financial Services — Investment Companies. The Equity Fund commenced operations on August 14, 2013 and currently offers only one class of shares. Effective November 22, 2019, the Fund ceased offering its Institutional Class shares. The remaining Institutional Class shares were converted to Advisor Class shares at the close of business on November 22, 2019 and the Advisor Class name was subsequently discontinued. The Advisor Class shares were previously subject up to a maximum 0.15% shareholder servicing fee which is not applicable to the existing share class. Each class of shares had identical rights and privileges except with respect to shareholder servicing fees and voting rights on matters affecting a single class. The ESG Fund commenced operations on November 27, 2019, and currently offers only one class of shares. Both Funds may issue an unlimited number of shares of beneficial interest, with no par value.
2. SIGNIFICANT ACCOUNTING POLICIES
The following is a summary of significant accounting policies consistently followed by the Funds in the preparation of their financial statements. These policies are in conformity with generally accepted accounting principles in the United States of America (“GAAP”).
Security Valuation — All investments in securities are recorded at their estimated fair value, as described in Note 3.
Federal Income Taxes — The Funds comply with the requirements of Subchapter M of the Internal Revenue Code of 1986, as amended, necessary to qualify as a regulated investment companies and distribute substantially all net taxable investment income and net realized gains to shareholders in a manner which results in no tax cost to the Funds. Therefore, no federal income or excise tax provision is required. As of and during the period ended January 31, 2021, the Funds did not have any tax positions that did not meet the “more-likely-than-not” threshold of being sustained by the applicable tax authority. As of and during the period ended January 31, 2021, the Funds did not have any liabilities for any unrecognized tax benefits. The Funds recognize interest and penalties, if any, related to unrecognized tax benefits on uncertain tax positions as income tax expense in the Statement of Operations. As of and during the period ended January 31, 2021, the Funds did not incur any interest or penalties. The Funds are not subject to examination by U.S. tax authorities for tax years prior to the fiscal year ended July 31, 2017.
Security Transactions, Income and Distributions — The Funds follow industry practice and record security transactions on the trade date. Realized gains and losses on sales of securities are calculated on the basis of identified cost. Dividend income is recorded on the ex-dividend date and interest income and expense is recorded on an accrual basis. Withholding taxes on foreign dividends have been provided for in accordance with each Fund’s understanding of the applicable country’s tax rules and regulations. Discounts and premiums on securities purchased are amortized over the expected life of the respective securities using the constant yield method.
The Funds distribute substantially all net investment income and net realized capital gains, if any, at least annually. Distributions to shareholders are recorded on the ex-dividend date. The treatment for financial reporting purposes of distributions made to shareholders during the year from net investment income or net realized capital gains may differ
20
COHO FUNDS
Notes to the Financial Statements (Unaudited) – Continued
January 31, 2021
from their ultimate treatment for federal income tax purposes. These differences are caused primarily by differences in the timing of the recognition of certain components of income, expense or realized capital gain for federal income tax purposes. Where such differences are permanent in nature, GAAP requires that they be reclassified in the components of the net assets based on their ultimate characterization for federal income tax purposes. Any such reclassifications will have no effect on net assets, results of operations or net asset value (“NAV”) per share of the Funds.
Expenses — Expenses associated with a specific fund in the Trust are charged to that fund. Common Trust expenses are typically allocated evenly between the funds of the Trust, or by other equitable means.
Use of Estimates — The preparation of financial statements in conformity with GAAP requires management to make estimates and assumptions that affect the reported amounts of assets and liabilities and disclosure of contingent assets and liabilities at the date of the financial statements and the reported amounts of revenues and expenses during the reporting period. Actual results could differ from those estimates.
3. SECURITIES VALUATION
The Funds have adopted authoritative fair value accounting standards which establish an authoritative definition of fair value and set out a hierarchy for measuring fair value. These standards require additional disclosures about the various inputs and valuation techniques used to develop the measurements of fair value, a discussion of changes in valuation techniques and related inputs during the period and expanded disclosure of valuation Levels for major security types. These inputs are summarized in the three broad Levels listed below:
| Level 1 — | Unadjusted quoted prices in active markets for identical assets or liabilities that the Funds has the ability to access. |
| Level 2 — | Observable inputs other than quoted prices included in Level 1 that are observable for the asset or liability, either directly or indirectly. These inputs may include quoted prices for the identical instrument on an inactive market, prices for similar instruments, interest rates, prepayment speeds, credit risk, yield curves, default rates and similar data. |
| Level 3 — | Unobservable inputs for the asset or liability, to the extent relevant observable inputs are not available, representing the Funds’ own assumptions about the assumptions a market participant would use in valuing the asset or liability, and would be based on the best information available. |
Following is a description of the valuation techniques applied to the Funds’ major categories of assets and liabilities measured at fair value on a recurring basis. The Funds’ investments are carried at fair value.
Equity Securities — Equity securities that are primarily traded on a national securities exchange are valued at the last sale price on the exchange on which they are primarily traded on the day of valuation or, if there has been no sale on such day, at the mean between the bid and ask prices. Securities traded primarily in the Nasdaq Global Market System for which market quotations are readily available are valued using the Nasdaq Official Closing Price (“NOCP”). If the NOCP is not available, such securities are valued at the last sale price on the day of valuation, or if there has been no sale on such day, at the mean between the bid and ask prices. To the extent these securities are actively traded and valuation adjustments are not applied, they are categorized in Level 1 of the fair value hierarchy.
Short-Term Investments — Investments in other mutual funds, including money market funds, are valued at their net asset value per share. Deposit accounts are valued at acquisition cost, which approximates fair value. To the extent valuation adjustments are not applied, these securities are categorized in Level 1 of the fair value hierarchy.
Securities for which market quotations are not readily available, or if the closing price does not represent fair value, are valued following procedures approved by the Board of Trustees (the “Board”). These procedures consider many
21
COHO FUNDS
Notes to the Financial Statements (Unaudited) – Continued
January 31, 2021
factors, including the type of security, size of holding, trading volume and news events. There can be no assurance that the Funds could obtain the fair value assigned to a security if they were to sell the security at approximately the time at which the Funds determine their net asset value per share. The Board has established a Valuation Committee to administer, implement, and oversee the fair valuation process, and to make fair value decisions when necessary. The Board regularly reviews reports of the Valuation Committee that describe any fair value determinations and methods.
The inputs or methodology used for valuing securities are not an indication of the risk associated with investing in those securities. The following is a summary of the inputs used to value the Funds’ securities as of January 31, 2021:
| Equity Fund | ||||||||||||||||
| Level 1 | Level 2 | Level 3 | Total | |||||||||||||
| Common Stocks | $ | 812,095,243 | $ | — | $ | — | $ | 812,095,243 | ||||||||
| Short-Term Investment | 37,652,191 | — | — | 37,652,191 | ||||||||||||
| Total Investments* | $ | 849,747,434 | $ | — | $ | — | $ | 849,747,434 | ||||||||
| ESG Fund | ||||||||||||||||
| Level 1 | Level 2 | Level 3 | Total | |||||||||||||
| Common Stocks | $ | 15,044,713 | $ | — | $ | — | $ | 15,044,713 | ||||||||
| Short-Term Investment | 741,272 | — | — | 741,272 | ||||||||||||
| Total Investments* | $ | 15,785,985 | $ | — | $ | — | $ | 15,785,985 | ||||||||
| * | Refer to the Schedule of Investments for further information on the classification of investments. |
4. INVESTMENT ADVISORY FEE AND OTHER TRANSACTIONS WITH AFFILIATES
The Trust has an agreement with the Adviser to furnish investment advisory services to the Funds. For its services, the Funds pay the Adviser, on a monthly basis, an annual advisory fee equal to 0.70% of the daily net assets of the Funds.
The Adviser has contractually agreed to waive a portion or all of its management fees and/or reimburse each Fund for their expenses to ensure total annual operating expenses (excluding shareholder servicing fees, acquired fund fees and expenses, brokerage commissions, interest, taxes, and extraordinary expenses) do not exceed 0.79% of each Fund’s average daily net assets.
Fees waived and expenses reimbursed by the Adviser may be recouped by the Adviser for a period of thirty-six months following the month during which such waiver or reimbursement was made if such recoupment can be achieved without exceeding the expense limit in effect at the time the waiver or reimbursement occurred. The Operating Expense Limitation Agreement is indefinite in term but cannot be terminated within a year after the effective date of the Funds’ prospectus. After that date, the agreement may be terminated at any time upon 60 days’ written notice by the Board or the Adviser, with the consent of the Board. During the period ended January 31, 2021, the Adviser was able to recoup $34,303 relating to fees waived in prior fiscal years for the Equity Fund. Waived fees and reimbursed expenses for the Funds subject to potential recovery by month of expiration are as follows:
| Expiration | Equity Fund | ESG Fund | |||||
| February 2021 – July 2021 | $ | 136,149 | $ | — | |||
| August 2021 – July 2022 | 303,299 | — | |||||
| August 2022 – July 2023 | 151,217 | 89,779 | |||||
| August 2023 – January 2024 | — | 64,005 | |||||
22
COHO FUNDS
Notes to the Financial Statements (Unaudited) – Continued
January 31, 2021
U.S. Bancorp Fund Services, LLC (the “Administrator”), doing business as U.S. Bank Global Fund Services, acts as the Funds’ Administrator, Transfer Agent, and Fund Accountant. U.S. Bank N.A. (the “Custodian”) serves as the custodian to the Funds. The Custodian is an affiliate of the Administrator. The Administrator performs various administrative and accounting services for the Funds. The Administrator prepares various federal and state regulatory filings, reports and returns for the Funds; prepares reports and materials to be supplied to the Trustees; monitors the activities of the Custodian; coordinates the payment of the Funds’ expenses and reviews the Funds’ expense accruals. The officers of the Trust, including the Chief Compliance Officer, are employees of the Administrator. As compensation for its services, the Administrator is entitled to a monthly fee at an annual rate based upon the average daily net assets of the Funds, subject to annual minimums. Fees paid by the Funds for administration and accounting, transfer agency, custody and compliance services for the period ended January 31, 2021, are disclosed in the Statement of Operations.
5. CAPITAL SHARE TRANSACTIONS
Transactions in shares of the Funds were as follows:
Equity Fund
| Six-Months Ended | Year Ended | |||||||
| January 31, 2021 | July 31, 2020 | |||||||
Advisor Class(1): | ||||||||
| Shares sold | 8,388,570 | 22,605,351 | ||||||
| Shares issued in exchange for Institutional Class shares | — | 28,875,174 | ||||||
| Shares issued to holders in reinvestment of distributions | 1,072,939 | 557,174 | ||||||
| Shares redeemed | (4,699,843 | ) | (12,646,413 | ) | ||||
Shares delivered by an in-kind transfer(2) | — | (6,922 | ) | |||||
| Net increase in Advisor Class shares | 4,761,666 | 39,384,364 | ||||||
| Institutional Class: | ||||||||
| Shares sold | — | 1,941,416 | ||||||
| Shares issued to holders in reinvestment of distributions | — | 947,617 | ||||||
| Shares redeemed | — | (2,430,869 | ) | |||||
| Shares issued in exchange for Advisor Class shares | — | (28,791,559 | ) | |||||
| Net decrease in Institutional Class shares | — | (28,333,395 | ) | |||||
| Net increase in shares outstanding | 4,761,666 | 11,050,969 | ||||||
| (1) | On November 22, 2019, the Equity Fund’s Institutional Class shares were merged into the Advisor Class shares. The Advisor Class name was subsequently discontinued following the merger. |
| (2) | On November 27, 2019, the Equity Fund made an in-kind transfer of $100,000. |
23
COHO FUNDS
Notes to the Financial Statements (Unaudited) – Continued
January 31, 2021
ESG Fund
Period Inception(3) | ||||||||
| Six-Months Ended | through | |||||||
| January 31, 2021 | July 31, 2020 | |||||||
| Shares sold | 1,091,763 | 353,791 | ||||||
Shares received from an in-kind transfer(4) | — | 10,000 | ||||||
| Shares issued to holders in reinvestment of dividends | 10,641 | 21 | ||||||
| Shares redeemed | (9,042 | ) | — | |||||
| Net increase in shares outstanding | 1,093,362 | 363,812 | ||||||
| (3) | Inception date for the Fund was November 27, 2019. |
| (4) | On November 27, 2019, the ESG Fund was seeded through an in-kind transfer of $100,000. |
6. INVESTMENT TRANSACTIONS
The aggregate purchases and sales, excluding short-term investments, of the Funds for the period ended January 31, 2021, were as follows:
| Equity Fund | ESG Fund | |||||||||||||||
| Purchases | Sales | Purchases | Sales | |||||||||||||
| U.S. Government Securities | $ | — | $ | — | $ | — | $ | — | ||||||||
| Other Securities | $ | 174,043,487 | $ | 146,812,218 | $ | 12,118,664 | $ | 839,436 | ||||||||
7. INCOME TAX INFORMATION
The aggregate gross unrealized appreciation and depreciation of securities held by the Funds and the total cost of securities for federal income tax purposes at July 31, 2020, the Funds’ most recently completed fiscal year end, were as follows:
| Aggregate | Aggregate | Net | Federal | |||||||||||||
| Gross | Gross | Unrealized | Income | |||||||||||||
| Appreciation | Depreciation | Appreciation | Tax Cost | |||||||||||||
| Equity Fund | $ | 124,513,394 | $ | (44,579,934 | ) | $ | 79,933,460 | $ | 662,142,766 | |||||||
| ESG Fund | 409,165 | (52,321 | ) | 356,844 | 3,371,138 | |||||||||||
Any difference between book-basis and tax-basis unrealized appreciation is attributable primarily to the tax deferral of losses on wash sales in the Fund.
At July 31, 2020, components of distributable earnings on a tax-basis were as follows:
| Undistributed | Undistributed | Net | Total | |||||||||||||
| Ordinary | Long-Term | Unrealized | Distributable | |||||||||||||
| Income | Capital Gains | Appreciation | Earnings | |||||||||||||
| Equity Fund | $ | 5,626,213 | $ | 9,949,506 | $ | 79,933,460 | $ | 95,509,179 | ||||||||
| ESG Fund | 25,455 | — | 356,844 | 382,299 | ||||||||||||
As of July 31, 2020, the Funds did not have any capital loss carryovers. A regulated investment company may elect for any taxable year to treat any portion of any qualified late year loss as arising on the first day of the next taxable year. Qualified late year losses are certain capital, and ordinary losses which occur during the portion of a fund’s
24
COHO FUNDS
Notes to the Financial Statements (Unaudited) – Continued
January 31, 2021
taxable year subsequent to October 31 and December 31, respectively. For the taxable period ended July 31, 2020, the Funds did not defer any qualified late year losses.
The tax character of distributions paid by the Funds for the period ended January 31, 2021, were as follows:
| Ordinary | Long-Term | |||||||||||
| Income* | Capital Gains | Total | ||||||||||
| Equity Fund | $ | 12,457,443 | $ | 21,566,302 | $ | 34,023,745 | ||||||
| ESG Fund | 122,178 | — | 122,178 | |||||||||
The tax character of distributions paid for the year ended July 31, 2020, were as follows:
| Ordinary | Long-Term | |||||||||||
| Income* | Capital Gains | Total | ||||||||||
| Equity Fund | $ | 12,921,008 | $ | 25,364,194 | $ | 38,285,202 | ||||||
| ESG Fund | 210 | — | 210 | |||||||||
| * | For federal income tax purposes, distributions of short-term capital gains are treated as ordinary income distributions. |
8. SECTOR RISK
As of January 31, 2021, each Fund had a significant portion of its assets invested in the health care sector. Companies in this sector are subject to risks such as litigation, intellectual property issues, competition, government regulation, product approval or rejection and product obsolescence.
9. CONTROL OWNERSHIP
The beneficial ownership, either directly or indirectly, of more than 25% of the voting securities of a Fund creates a presumption of control of the Fund, under Section 2(a)(9) of the Investment Company Act of 1940. As of January 31, 2021, Wells Fargo Bank, for the benefit of its customers, owned 48.81% of the outstanding shares of the Equity Fund. As of January 31, 2021, National Financial Services and Charles Schwab, for the benefit of their customers, owned 42.85% and 34.21% of the outstanding shares of the ESG Fund, respectively.
10. LINE OF CREDIT
The Equity Fund has established an unsecured Line of Credit (“LOC”) in the amount of $25,000,000 or 33.33% of the fair value of the Fund’s investments, whichever is less. The LOC matures, unless renewed, on July 24, 2021. This LOC is intended to provide short-term financing, if necessary, subject to certain restrictions, in connection with shareholder redemptions and other short-term liquidity needs of the Fund. The LOC is with the Custodian. Interest is charged at the prime rate which was 3.25% as of January 31, 2021. The interest rate during the period was 3.25%. The Equity Fund has authorized the Custodian to charge any of the Fund’s accounts for any missed payments. For the period ended January 31, 2021, the Fund did not have any borrowings under the LOC.
11. IN-KIND TRANSFER
On November 27, 2019, a shareholder of the Equity Fund redeemed $100,000 in an in-kind transaction which consisted of securities and cash. The $100,000 in securities and cash were then used to seed the ESG Fund in an in-kind transaction whereby the shareholder received 10,000 shares of the ESG Fund. The transaction was determined
25
COHO FUNDS
Notes to the Financial Statements (Unaudited) – Continued
January 31, 2021
to be a taxable transaction by management and the cost basis of securities recorded by the ESG Fund was equal to the fair market value of the securities at the time of the in-kind transaction. The cost of the securities recorded by the ESG Fund on November 27, 2019, was $85,470 and cash was $14,530.
12. COVID-19
The global outbreak of COVID-19 (commonly referred to as “coronavirus”) has disrupted economic markets and the prolonged economic impact is uncertain. The ultimate economic fallout from the pandemic, and the long-term impact on economies, markets, industries and individual issuers, are not known. The operational and financial performance of the issuers of securities in which the Funds invest depend on future developments, including the duration and spread of the outbreak, and such uncertainty may in turn adversely affect the value and liquidity of the Funds’ investments, impair the Funds’ ability to satisfy redemption requests, and negatively impact the Funds’ performance.
26
COHO FUNDS
Additional Information (Unaudited)
January 31, 2021
AVAILABILITY OF FUNDS PORTFOLIO INFORMATION
Each Fund files complete schedules of portfolio holdings with the SEC for the first and third quarters of each fiscal year on Form N-Q or Part F of Form N-PORT (beginning with filings after March 31, 2020). Each Fund’s Form N-Q or Part F of Form N-PORT are available on the SEC’s website at www.sec.gov and may be reviewed and copied at the SEC’s Public Reference Room in Washington, D.C. For information on the Public Reference Room call 1-800-SEC-0330. In addition, each Fund’s Form N-Q or Part F of Form N-PORT is available without charge upon request by calling 1-866-264-6234.
AVAILABILITY OF PROXY VOTING INFORMATION
A description of the Funds’ Proxy Voting Policies and Procedures is available without charge, upon request, by calling 1-866-264-6234. Information regarding how the Funds voted proxies relating to portfolio securities during the most recent 12-month year ended June 30, is available (1) without charge, upon request, by calling 1-866-264-6234, or (2) on the SEC’s website at www.sec.gov.
27
COHO FUNDS
Privacy Notice (Unaudited)
The Funds collect only relevant information about you that the law allows or requires it to have in order to conduct its business and properly service you. The Funds collect financial and personal information about you (“Personal Information”) directly (e.g., information on account applications and other forms, such as your name, address, and social security number, and information provided to access account information or conduct account transactions online, such as password, account number, e-mail address, and alternate telephone number), and indirectly (e.g., information about your transactions with us, such as transaction amounts, account balance and account holdings).
The Funds do not disclose any non-public personal information about its shareholders or former shareholders other than for everyday business purposes such as to process a transaction, service an account, respond to court orders and legal investigations or as otherwise permitted by law. Third parties that may receive this information include companies that provide transfer agency, technology and administrative services to the Funds, as well as the Funds’ investment adviser who is an affiliate of the Funds. If you maintain a retirement/educational custodial account directly with the Funds, we may also disclose your Personal Information to the custodian for that account for shareholder servicing purposes. The Funds limit access to your Personal Information provided to unaffiliated third parties to information necessary to carry out their assigned responsibilities to the Funds. All shareholder records will be disposed of in accordance with applicable law. The Funds maintains physical, electronic and procedural safeguards to protect your Personal Information and require its third-party service providers with access to such information to treat your Personal Information with the same high degree of confidentiality.
In the event that you hold shares of the Funds through a financial intermediary, including, but not limited to, a broker-dealer, credit union, bank or trust company, the privacy policy of your financial intermediary governs how your non-public personal information is shared with unaffiliated third parties.
28
(This Page Intentionally Left Blank.)
INVESTMENT ADVISER
Coho Partners, Ltd.
300 Berwyn Park
801 Cassatt Road, Suite 100
Berwyn, PA 19312
DISTRIBUTOR
Compass Distributors, LLC
Three Canal Plaza, Suite 100
Portland, ME 04101
CUSTODIAN
U.S. Bank N.A.
1555 North Rivercenter Drive, Suite 302
Milwaukee, WI 53212
ADMINISTRATOR, FUNDS ACCOUNTANT
AND TRANSFER AGENT
U.S. Bancorp Fund Services, LLC
615 East Michigan Street
Milwaukee, WI 53202
INDEPENDENT REGISTERED PUBLIC ACCOUNTING FIRM
Cohen & Company, Ltd.
1350 Euclid Avenue, Suite 800
Cleveland, OH 44115
LEGAL COUNSEL
Stradley Ronon Stevens & Young LLP
2005 Market Street, Suite 2600
Philadelphia, PA 19103
This report should be accompanied or preceded by a prospectus.
The Funds’ Statement of Additional Information contains additional information about the
Funds’ trustees and is available without charge upon request by calling 1-866-264-6234.
| (b) | Not applicable. |
Item 2. Code of Ethics.
Not applicable for semi-annual reports.
Item 3. Audit Committee Financial Expert.
Not applicable for semi-annual reports.
Item 4. Principal Accountant Fees and Services.
Not applicable for semi-annual reports.
Item 5. Audit Committee of Listed Registrants.
Not applicable to Registrants who are not listed as issuers (as defined in Rule 10A-3 under the Securities Exchange Act of 1934).
Item 6. Schedule of Investments.
(a) Schedule of Investments is included as part of the report to shareholders filed under Item 1 of this Form.
(b) Not applicable.
Item 7. Disclosure of Proxy Voting Policies and Procedures for Closed-End Management Investment Companies.
Not applicable to open-end investment companies.
Item 8. Portfolio Managers of Closed-End Management Investment Companies.
Not applicable to open-end investment companies.
Item 9. Purchases of Equity Securities by Closed‑End Management Investment Company and Affiliated Purchases.
Not applicable to open-end investment companies.
Item 10. Submission of Matters to a Vote of Security Holders.
There have been no material changes to the procedures by which shareholders may recommend nominees to the Registrant’s board of trustees.
Item 11. Controls and Procedures.
(a) | The Registrant’s President and Treasurer have reviewed the Registrant's disclosure controls and procedures (as defined in Rule 30a-3(c) under the Investment Company Act of 1940 (the “Act”)) as of a date within 90 days of the filing of this report, as required by Rule 30a-3(b) under the Act and Rules 13a-15(b) or 15d‑15(b) under the Securities Exchange Act of 1934. Based on their review, such officers have concluded that the disclosure controls and procedures are effective in ensuring that information required to be disclosed in this report is appropriately recorded, processed, summarized and reported and made known to them by others within the Registrant and by the Registrant’s service provider. |
(b) | There were no significant changes in the Registrant's internal control over financial reporting (as defined in Rule 30a-3(d) under the Act) that occurred during the period covered by this report that has materially affected, or is reasonably likely to materially affect, the Registrant's internal control over financial reporting. |
Item 12. Disclosure of Securities Lending Activities for Closed-End Management Investment Companies
Not applicable to open-end investment companies
Item 13. Exhibits.
| (a) | (1) Any code of ethics or amendment thereto, that is the subject of the disclosure required by Item 2, to the extent that the Registrant intends to satisfy Item 2 requirements through filing an exhibit. 1) Not applicable for semi-annual reports. |
(3) Any written solicitation to purchase securities under Rule 23c‑1 under the Act sent or given during the period covered by the report by or on behalf of the Registrant to 10 or more persons. Not applicable to open-end investment companies.
(4) Change in the Registrant’s independent public accountant. There was no change in the Registrant’s independent public accountant for the period covered by this report.
SIGNATURES
Pursuant to the requirements of the Securities Exchange Act of 1934 and the Investment Company Act of 1940, the Registrant has duly caused this report to be signed on its behalf by the undersigned, thereunto duly authorized.
(Registrant) Managed Portfolio Series
By (Signature and Title) /s/Brian R. Wiedmeyer
Brian R. Wiedmeyer, President
Date April 8, 2021
Pursuant to the requirements of the Securities Exchange Act of 1934 and the Investment Company Act of 1940, this report has been signed below by the following persons on behalf of the Registrant and in the capacities and on the dates indicated.
By (Signature and Title) /s/Brian R. Wiedmeyer
Brian R. Wiedmeyer, President
Date April 8, 2021
By (Signature and Title) /s/Benjamin J. Eirich
Benjamin J. Eirich, Treasurer
Date April 8, 2021