UNITED STATES
SECURITIES AND EXCHANGE COMMISSION
Washington, D.C. 20549
SECURITIES AND EXCHANGE COMMISSION
Washington, D.C. 20549
FORM N-CSR
CERTIFIED SHAREHOLDER REPORT OF REGISTERED
MANAGEMENT INVESTMENT COMPANIES
Investment Company Act file number 811-22525
Managed Portfolio Series
(Exact name of Registrant as specified in charter)
(Exact name of Registrant as specified in charter)
615 East Michigan Street
Milwaukee, WI 53202
(Address of principal executive offices) (Zip code)
(Address of principal executive offices) (Zip code)
Brian R. Wiedmeyer, President
Managed Portfolio Series
c/o U.S. Bancorp Fund Services, LLC
777 East Wisconsin Ave, 5th Fl
Milwaukee, WI 53202
(Name and address of agent for service)
(Name and address of agent for service)
(414) 516-1712
Registrant's telephone number, including area code
Date of fiscal year end: August 31, 2024
Date of reporting year: February 29, 2024
Item 1. Report to Stockholders.
| (a) |
Principal Street High Income Municipal Fund
A Class Shares — GSTFX
Institutional Class Shares — GSTAX
Investor Class Shares — GSTEX
Principal Street Short Term Municipal Fund
Institutional Class Shares — PSTYX
Investor Class Shares — PSTEX
Semi-Annual Report
| https://principalstreetfunds.com | February 29, 2024 |
(This Page Intentionally Left Blank.)
PRINCIPAL STREET HIGH INCOME MUNICIPAL FUND
Value of $25,000 Investment (Unaudited)
The chart assumes an initial investment of $25,000. Performance reflects waivers of fee and operating expenses in effect. In the absence of such waivers, total return would be reduced. Performance data quoted represents past performance and does not guarantee future results. Investment returns and principal value will fluctuate, and when sold, may be worth more or less than their original cost. Performance current to the most recent month-end may be lower or higher than the performance quoted and can be obtained by calling 1-877-914-7343. Performance assumes the reinvestment of capital gains and income distributions. The performance does not reflect the deduction of taxes that a shareholder would pay on Fund distributions or the redemption of Fund shares.
Annualized Rates of Return as of February 29, 2024
1-Year | 3-Year | 5-Year | Since Inception(1) | |
| Institutional Class | 8.06% | -0.41% | -0.05% | 1.64% |
| Investor Class | 7.62% | -0.95% | -0.46% | 1.20% |
A Class (with sales load)(2) | 5.40% | -1.54% | -0.82% | 0.98% |
| A Class (without sales load) | 7.86% | -0.78% | -0.37% | 1.33% |
Bloomberg High Yield Municipal Bond Index(3) | 8.30% | 0.52% | 3.31% | 3.72% |
| (1) | Period since the Fund’s inception. The Institutional Class, Investor Class, and A Class commenced operations on September 15, 2017, March 23, 2020, and February 16, 2022, respectively. Performance for the Investor Class and A Class prior to the inception of the Investor Class and A Class is based on the performance of the Institutional Class, adjusted for the higher expenses applicable to the Investor Class and A Class. |
| (2) | Reflects a sales load of 2.25%. |
| (3) | The Bloomberg High Yield Municipal Bond Index covers the high yield portion of the USD-denominated long-term tax-exempt bond market. The Index has four main sectors: state and local general obligation bonds, revenue bonds, insured bonds, and pre-refunded bonds. One cannot invest directly in an Index. |
3
PRINCIPAL STREET HIGH INCOME MUNICIPAL FUND
The following is expense information for the Principal Street High Income Municipal Fund as disclosed in the Fund’s most recent prospectus dated December 29, 2023:
| Institutional Class | Gross Expenses: 1.04%; Net Expenses: 1.03%. |
| Investor Class | Gross Expenses: 1.54%; Net Expenses: 1.53%. |
| A Class | Gross Expenses: 1.29%; Net Expenses: 1.28%. |
Principal Street Partners, LLC (the “Adviser”) has contractually agreed to reduce its management fees, and may reimburse the Fund for its operating expenses, in order to ensure that Total Annual Fund Operating Expenses (excluding certain expenses such as Rule 12b-1 fees, taxes, leverage/borrowing interest, interest expense, dividends paid on short sales, brokerage commissions and other transactional expenses, acquired fund fees and expenses, or extraordinary expenses) do not exceed 0.80% of the Fund’s average daily net assets. Fees waived and expenses paid by the Adviser may be recouped by the Adviser for a period of 36 months following the month during which such fee waiver and/or expense payment was made, if such recoupment can be achieved without exceeding the expense limit in effect at the time the fee waiver and/or expense payment occurred and the expense limit in place at the time of recoupment. The Operating Expense Limitation Agreement is indefinite but cannot be terminated through at least December 29, 2024. Thereafter, the agreement may be terminated at any time upon 60 days’ written notice by the Trust’s Board of Trustees (the “Board”) or the Adviser.
4
PRINCIPAL STREET SHORT TERM MUNICIPAL FUND
Value of $25,000 Investment (Unaudited)

The chart assumes an initial investment of $25,000. Performance reflects waivers of fee and operating expenses in effect. In the absence of such waivers, total return would be reduced. Performance data quoted represents past performance and does not guarantee future results. Investment returns and principal value will fluctuate, and when sold, may be worth more or less than their original cost. Performance current to the most recent month-end may be lower or higher than the performance quoted and can be obtained by calling 1-877-914-7343. Performance assumes the reinvestment of capital gains and income distributions. The performance does not reflect the deduction of taxes that a shareholder would pay on Fund distributions or the redemption of Fund shares.
Annualized Rates of Return as of February 29, 2024
1-Year | Since Inception(1) | |
| Institutional Class | 4.00% | 3.20% |
| Investor Class | 3.75% | 2.82% |
Bloomberg 3-Year Municipal Bond Index(2) | 3.55% | 2.41% |
| (1) | Period since the Fund’s inception. The Institutional Class and Investor Class both commenced operations on April 27, 2022. |
| (2) | The Bloomberg 3-Year Municipal Bond Index measures the performance of USD-denominated long-term, tax-exempt bond market with maturities of 1-3 years, including state and local general obligation bonds, revenue bonds, insured bonds, and pre-refunded bonds. One cannot invest directly in an Index. |
5
PRINCIPAL STREET SHORT TERM MUNICIPAL FUND
The following is expense information for the Principal Street Short Term Municipal Fund as disclosed in the Fund’s most recent prospectus dated December 29, 2023:
| Institutional Class | Gross Expenses: 1.09%; Net Expenses: 0.71%. |
| Investor Class | Gross Expenses: 1.37%; Net Expenses: 0.95%. |
Principal Street Partners, LLC (the “Adviser”) has contractually agreed to reduce its management fees, and may reimburse the Fund for its operating expenses, in order to ensure that Total Annual Fund Operating Expenses (excluding certain expenses such as Rule 12b-1 fees, taxes, leverage/borrowing interest, interest expense, dividends paid on short sales, brokerage commissions and other transactional expenses, acquired fund fees and expenses, or extraordinary expenses) do not exceed 0.70% of the Fund’s average daily net assets. Fees waived and expenses paid by the Adviser may be recouped by the Adviser for a period of 36 months following the month during which such fee waiver and/or expense payment was made, if such recoupment can be achieved without exceeding the expense limit in effect at the time the fee waiver and/or expense payment occurred and the expense limit in place at the time of recoupment. The Operating Expense Limitation Agreement is indefinite but cannot be terminated through at least December 29, 2024. Thereafter, the agreement may be terminated at any time upon 60 days’ written notice by the Trust’s Board of Trustees (the “Board”) or the Adviser.
6
PRINCIPAL STREET HIGH INCOME MUNICIPAL FUND
Allocation of Portfolio(1) (Unaudited)
As of February 29, 2024
(% of Net Assets)
Top Ten Holdings(1) (Unaudited)
As of February 29, 2024
(% of Net Assets)
| Sunland Medical Foundation, 12.000%, 4/30/2024 | 4.1% | ||
| Sunland Medical Foundation, 12.000%, 10/20/2024 | 3.2% | ||
| Sunland Medical Foundation, 12.000%, 4/30/2024 | 2.8% | ||
| Falmouth Solid Waste Disposal Facilities Revenue, 8.500%, 6/1/2040 | 2.7% | ||
| Angelina & Neches River Authority, 7.500%, 12/1/2045 | 2.7% | ||
| Children’s Trust Fund, 0.000%, 5/15/2057 | 2.5% | ||
| Erie Tobacco Asset Securitization Corp., 0.000%, 6/1/2060 | 2.4% | ||
| Capital Trust Agency, 10.000%, 6/30/2024 | 2.4% | ||
| Atoka Industrial Development Authority, 8.000%, 8/1/2039 | 2.3% | ||
| Port Beaumont Navigation District, 8.000%, 2/1/2039 | 2.2% |
(1) | Fund holdings and allocations are subject to change at any time and are not recommendations to buy or sell any security. |
7
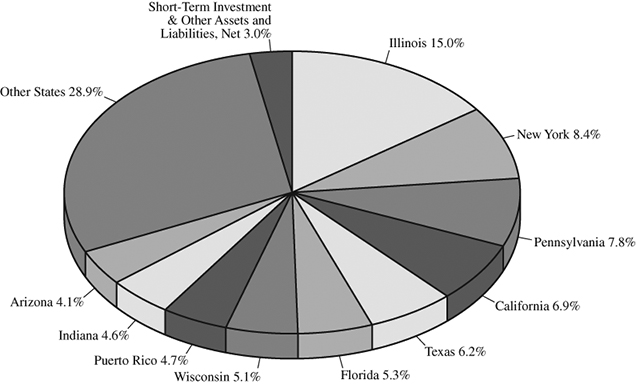
PRINCIPAL STREET SHORT TERM MUNICIPAL FUND
Allocation of Portfolio(1) (Unaudited)
As of February 29, 2024
(% of Net Assets)
Top Ten Holdings(1) (Unaudited)
As of February 29, 2024
(% of Net Assets)
| Sweetwater Union High School District Public Financing Authority, 5.000%, 9/1/2025 | 3.6% | ||
| Commonwealth of Pennsylvania, 5.000%, 10/15/2026 | 3.5% | ||
| State of Illinois, 5.250%, 2/1/2029 | 3.2% | ||
| Metropolitan Pier & Exposition Authority, 7.000%, 7/1/2026 | 3.1% | ||
| Riverside Regional Jail Authority, 5.000%, 7/1/2025 | 2.7% | ||
| County of Miami-Dade Aviation Revenue, 5.000%, 10/1/2028 | 2.6% | ||
| Port Authority of New York & New Jersey, 5.000%, 9/1/2032 | 2.4% | ||
| Wisconsin Public Finance Authority, 5.750%, 6/1/2025 | 2.3% | ||
| Indianapolis Local Public Improvement Bond Bank, 5.000%, 1/1/2030 | 2.2% | ||
| Chicago O’Hare International Airport, 5.000%, 1/1/2031 | 2.0% |
(1) | Fund holdings and allocations are subject to change at any time and are not recommendations to buy or sell any security. |
8
PRINCIPAL STREET FUNDS
Expense Example (Unaudited)
February 29, 2024
As a shareholder of a Fund, you incur two types of costs: (1) transaction costs, including brokerage commissions on purchases and sales of Fund shares, and (2) ongoing costs, including management fees, distribution and/or service (12b-1) fees, interest expense, and other Fund expenses. This Example is intended to help you understand your ongoing costs (in dollars) of investing in a Fund and to compare these costs with the ongoing costs of investing in other mutual funds. The Example is based on an investment of $1,000 invested at the beginning of the period and held for the entire period (September 1, 2023 – February 29, 2024).
ACTUAL EXPENSES
For each class, the first line of each table provides information about actual account values and actual expenses. You may use the information in this line, together with the amount you invested, to estimate the expenses that you paid over the period. Simply divide your account value by $1,000 (for example, an $8,600 account value divided by $1,000 = 8.6), then multiply the result by the number in the first line under the heading entitled “Expenses Paid During Period” to estimate the expenses you paid on your account during this period.
HYPOTHETICAL EXAMPLE FOR COMPARISON PURPOSES
For each class, the second line of each table below provides information about hypothetical account values and hypothetical expenses based on the Fund’s actual expense ratio and an assumed rate of return of 5% per year before expenses, which is not the Fund’s actual return. The hypothetical account values and expenses may not be used to estimate the actual ending account balance or expenses you paid for the period. You may use this information to compare the ongoing costs of investing in the Fund and other funds. To do so, compare this 5% hypothetical example with the 5% hypothetical examples that appear in the shareholder reports of the other funds.
Please note that the expenses shown in the tables are meant to highlight your ongoing costs only and do not reflect any transactional costs. Therefore, the second line of each table for each class is useful in comparing ongoing costs only and will not help you determine the relative total costs of owning different funds. In addition, if transactional costs were included, your costs may have been higher.
HIGH INCOME MUNICIPAL FUND
| Beginning | Ending | Expenses Paid | |
| Account Value | Account Value | During Period(1) | |
(9/1/2023) | (2/29/2024) | (9/1/2023 to 2/29/2024) | |
Institutional Actual(2)(3) | $1,000.00 | $1,063.20 | $4.62 |
Institutional Hypothetical(4) (5% return before expenses) | $1,000.00 | $1,020.39 | $4.52 |
(1) | Expenses for the Institutional Class are equal to the annualized expense ratio for the most recent six-month period of 0.90%, multiplied by the average account value over the period, multiplied by 182/366 to reflect the one-half year period. |
(2) | Based on the actual Institutional Class return for the six-month period ended February 29, 2024 of 6.32%. |
(3) | Excluding interest expense, the actual expenses would be $4.10. |
(4) | Excluding interest expense, the hypothetical expenses would be $4.02. |
9
PRINCIPAL STREET FUNDS
Expense Example (Unaudited) – Continued
February 29, 2024
| Beginning | Ending | Expenses Paid | |
| Account Value | Account Value | During Period(5) | |
(9/1/2023) | (2/29/2024) | (9/1/2023 to 2/29/2024) | |
Investor Actual(6)(7) | $1,000.00 | $1,061.70 | $7.13 |
Investor Hypothetical(8) (5% return before expenses) | $1,000.00 | $1,017.95 | $6.97 |
(5) | Expenses for the Investor Class are equal to the annualized expense ratio for the most recent six-month period of 1.39%, multiplied by the average account value over the period, multiplied by 182/366 to reflect the one-half year period. |
(6) | Based on the actual Investor Class return for the six-month period ended February 29, 2024 of 6.17%. |
(7) | Excluding interest expense, the actual expenses would be $6.66. |
(8) | Excluding interest expense, the hypothetical expenses would be $6.52. |
| Beginning | Ending | Expenses Paid | |
| Account Value | Account Value | During Period(9) | |
(9/1/2023) | (2/29/2024) | (9/1/2023 to 2/29/2024) | |
A Class Actual(10)(11) | $1,000.00 | $1,071.10 | $5.92 |
A Class Hypothetical(12) (5% return before expenses) | $1,000.00 | $1,019.14 | $5.77 |
(9) | Expenses for the A Class are equal to the annualized expense ratio for the most recent six-month period of 1.15%, multiplied by the average account value over the period, multiplied by 182/366 to reflect the one-half year period. |
(10) | Based on the actual A Class return for the six-month period ended February 29, 2024 of 7.11%. |
(11) | Excluding interest expense, the actual expenses would be $5.41. |
(12) | Excluding interest expense, the hypothetical expenses would be $5.27. |
SHORT TERM MUNICIPAL FUND
| Beginning | Ending | Expenses Paid | |
| Account Value | Account Value | During Period(1) | |
(9/1/2023) | (2/29/2024) | (9/1/2023 to 2/29/2024) | |
Institutional Actual(2)(3) | $1,000.00 | $1,024.80 | $3.62 |
Institutional Hypothetical(4) (5% return before expenses) | $1,000.00 | $1,021.28 | $3.62 |
(1) | Expenses for the Institutional Class are equal to the annualized expense ratio for the most recent six-month period of 0.72%, multiplied by the average account value over the period, multiplied by 182/366 to reflect the one-half year period. |
(2) | Based on the actual Institutional Class return for the six-month period ended February 29, 2024 of 2.48%. |
(3) | Excluding interest expense, the actual expenses would be $3.52. |
(4) | Excluding interest expense, the hypothetical expenses would be $3.52. |
| Beginning | Ending | Expenses Paid | |
| Account Value | Account Value | During Period(5) | |
(9/1/2023) | (2/29/2024) | (9/1/2023 to 2/29/2024) | |
Investor Actual(6)(7) | $1,000.00 | $1,023.60 | $4.88 |
Investor Hypothetical(8) (5% return before expenses) | $1,000.00 | $1,020.04 | $4.87 |
(5) | Expenses for the Investor Class are equal to the annualized expense ratio for the most recent six-month period of 0.97%, multiplied by the average account value over the period, multiplied by 184/365 to reflect the one-half year period. |
(6) | Based on the actual Investor Class return for the six-month period ended February 29, 2024 of 2.36%. |
(7) | Excluding interest expense, the actual expenses would be $4.78. |
(8) | Excluding interest expense, the hypothetical expenses would be $4.77. |
10
PRINCIPAL STREET HIGH INCOME MUNICIPAL FUND
Schedule of Investments (Unaudited)
February 29, 2024
Description | Par | Value | ||||||
| MUNICIPAL BONDS — 82.5% | ||||||||
| Arizona — 2.9% | ||||||||
| Arizona Industrial Development Authority | ||||||||
6.00%, 07/01/2049 (Obligor: Empower College Prep) (a) | $ | 1,000,000 | $ | 1,001,702 | ||||
Series A, 7.75%, 07/01/2050 (Obligor: Legacy Cares, Inc,) (a)(b) | 1,600,000 | 96,000 | ||||||
Series A, 6.00%, 07/01/2051 (Obligor: Legacy Cares, Inc.) (a)(b) | 540,000 | 32,400 | ||||||
Series C, 6.75%, 07/01/2030 (Obligor: Legacy Cares, Inc.) (a)(b) | 2,000,000 | 120,000 | ||||||
| La Paz County Industrial Development Authority, 7.00%, 12/01/2040 | ||||||||
| (Obligor: Imperial Valley Gateway Center) | 1,535,000 | 854,495 | ||||||
| Maricopa County Industrial Development Authority, 6.00%, 01/01/2048 | ||||||||
(Obligor: Christian Care Surprise) (a) | 1,595,000 | 1,152,483 | ||||||
| Pima County Industrial Development Authority, 6.63%, 05/15/2031 | ||||||||
(Obligor: La Posada Park Centre) (a) | 2,000,000 | 2,024,151 | ||||||
| Sierra Vista Industrial Development Authority | ||||||||
| Series A, 0.00%, 10/01/2056 (Obligor: Georgetown Community | ||||||||
Development Authority) (a)(c) | 2,200,000 | 1,694,859 | ||||||
| Series A, 0.00%, 10/01/2056 (Obligor: Georgetown Community | ||||||||
Development Authority) (a)(c) | 1,000,000 | 926,661 | ||||||
| Series B, 6.25%, 10/01/2036 (Obligor: Georgetown Community | ||||||||
Development Authority) (a) | 1,500,000 | 1,227,413 | ||||||
| 9,130,164 | ||||||||
| California — 0.0%(d) | ||||||||
| California Pollution Control Financing Authority | ||||||||
7.00%, 07/01/2024 (Obligor: CalPlant I) (a)(b)(e) | 1,000,000 | 13,500 | ||||||
7.50%, 07/01/2032 (Obligor: CalPlant I) (a)(b)(e) | 5,065,000 | 68,378 | ||||||
8.00%, 07/01/2039 (Obligor: CalPlant I) (a)(b)(e) | 3,845,000 | 51,908 | ||||||
7.50%, 12/01/2039 (Obligor: CalPlant I) (a)(b)(e) | 2,500,000 | 33,750 | ||||||
| 167,536 | ||||||||
| Colorado — 6.0% | ||||||||
| Aurora Highlands Community Authority Board, 5.75%, 12/01/2051 | 4,000,000 | 3,730,772 | ||||||
Banning Lewis Ranch Metropolitan District No. 8, 4.88%, 12/01/2051 (a) | 2,500,000 | 1,976,543 | ||||||
| Canyon Pines Metropolitan District, Series A-1, 5.25%, 12/01/2051 | 2,000,000 | 1,790,450 | ||||||
| Cascade Ridge Metropolitan District, 5.00%, 12/01/2051 | 1,000,000 | 869,159 | ||||||
| Cottonwood Hollow Residential Metropolitan District, 5.00%, 12/01/2051 | 750,000 | 633,278 | ||||||
| Four Corners Business Improvement District, 6.00%, 12/01/2052 | 1,000,000 | 954,047 | ||||||
| Grandview Reserve Metropolitan District No. 3 | ||||||||
| Series A, 6.25%, 12/01/2052 | 1,500,000 | 1,470,624 | ||||||
| Series B, 9.00%, 12/15/2052 | 1,000,000 | 995,291 | ||||||
| Ledge Rock Center Commercial Metropolitan District | ||||||||
Series A, 7.38%, 11/01/2052 (a) | 1,000,000 | 1,016,983 | ||||||
Series A, 7.00%, 11/01/2052 (a) | 1,000,000 | 1,008,284 | ||||||
See Notes to the Financial Statements
11
PRINCIPAL STREET HIGH INCOME MUNICIPAL FUND
Schedule of Investments (Unaudited) – Continued
February 29, 2024
Description | Par | Value | ||||||
| MUNICIPAL BONDS — 82.5% (Continued) | ||||||||
| Colorado — 6.0% (Continued) | ||||||||
| Legato Community Authority, Series B, 8.25%, 12/15/2051 | $ | 2,000,000 | $ | 1,857,620 | ||||
| Peak Metropolitan District No. 3, Series A-1, 7.50%, 12/01/2052 | 1,500,000 | 1,522,747 | ||||||
| Waters’ Edge Metropolitan District No. 2, 5.00%, 12/01/2051 | 1,000,000 | 866,752 | ||||||
| 18,692,550 | ||||||||
| Connecticut — 0.8% | ||||||||
| Connecticut Housing Finance Authority, 4.60%, 11/15/2049 | 2,500,000 | 2,507,179 | ||||||
| District of Columbia — 0.3% | ||||||||
| Metropolitan Washington Airports Authority Aviation Revenue, | ||||||||
5.00%, 10/01/2030 (e) | 750,000 | 754,692 | ||||||
| Florida — 6.3% | ||||||||
| Capital Trust Agency, Inc. | ||||||||
10.00%, 06/30/2024 (Obligor: Voans SW Florida Healthcare) (a) | 7,950,000 | 7,552,500 | ||||||
5.00%, 01/01/2056 (Obligor: Wfcs Holdings Ii Llc) (a) | 900,000 | 706,410 | ||||||
| Series A, 6.50%, 10/01/2032 (Obligor: Tuscan Gardens of | ||||||||
Palm Coast Obligated Group) (a) | 1,090,000 | 566,800 | ||||||
| Series A, 6.75%, 10/01/2037 (Obligor: Tuscan Gardens of | ||||||||
Palm Coast Obligated Group) (a) | 1,290,000 | 670,800 | ||||||
| Series A, 7.00%, 10/01/2040 (Obligor: Tuscan Gardens of | ||||||||
Palm Coast Obligated Group) (a) | 1,525,000 | 793,000 | ||||||
Series A, 7.00%, 12/01/2045 (Obligor: Tallahassee NHHI) (a)(b) | 150,000 | 49,125 | ||||||
| Series A, 7.00%, 10/01/2049 (Obligor: Tuscan Gardens of | ||||||||
Palm Coast Obligated Group) (a) | 1,700,000 | 884,000 | ||||||
Series A, 7.13%, 12/01/2050 (Obligor: Tallahassee NHHI) (a)(b) | 2,000,000 | 655,000 | ||||||
| Series A, 7.00%, 07/01/2052 (Obligor: Tapestry Senior | ||||||||
Housing Walden) (a)(b) | 2,200,000 | 484,000 | ||||||
Greater Orlando Aviation Authority, 5.00%, 10/01/2054 (e) | 1,500,000 | 1,539,923 | ||||||
| Lake Country, Series A1, 7.13%, 01/01/2052 | ||||||||
(Obligor: Village Veranda at Lady Lake Obligated Group) (a) | 5,800,000 | 4,350,000 | ||||||
| Palm Beach County Health Facilities Authority, 7.63%, 05/15/2058 | ||||||||
| (Obligor: Lifespace Communities Obl) | 500,000 | 539,942 | ||||||
William G King, 12.00%, 10/01/2024 (f) | 780,377 | 780,377 | ||||||
| 19,571,877 | ||||||||
| Idaho — 0.7% | ||||||||
| Spring Valley Community Infrastructure | ||||||||
| District No 1, 6.25%, 09/01/2053 | 2,000,000 | 2,016,821 | ||||||
See Notes to the Financial Statements
12
PRINCIPAL STREET HIGH INCOME MUNICIPAL FUND
Schedule of Investments (Unaudited) – Continued
February 29, 2024
Description | Par | Value | ||||||
| MUNICIPAL BONDS — 82.5% (Continued) | ||||||||
| Illinois — 1.9% | ||||||||
| Illinois Finance Authority | ||||||||
| Series A, 6.50%, 05/15/2047 (Obligor: Plymouth Place) | $ | 1,000,000 | $ | 1,022,513 | ||||
Series A, 6.13%, 04/01/2049 (Obligor: Roosevelt University) (a) | 2,500,000 | 2,438,917 | ||||||
Series A, 5.00%, 07/01/2051 (Obligor: Aim Art in Motion) (a) | 3,000,000 | 2,187,738 | ||||||
Series B, 5.00%, 07/01/2024 (Obligor: Aim Art in Motion) (a) | 305,000 | 301,313 | ||||||
| 5,950,481 | ||||||||
| Indiana — 3.7% | ||||||||
| Anderson Industrial Economic Development Revenue, | ||||||||
| 6.00%, 10/01/2042 (Obligor: Anderson University, Inc.) | 1,000,000 | 875,287 | ||||||
| Evansville Manufacturing Housing Revenue, 5.45%, 01/01/2038 | ||||||||
| (Obligor: Evansville RCF LP) | 1,500,000 | 1,230,135 | ||||||
| Goshen Manufacturing Housing Revenue, Series A, 5.00%, 08/01/2041 | ||||||||
(Obligor: Green Oaks of Goshen, LLC) (a) | 1,500,000 | 1,226,812 | ||||||
| Indiana Finance Authority, 7.00%, 03/01/2039 | ||||||||
(Obligor: Brightmark Plastics Renewal) (a)(e) | 6,160,000 | 4,673,801 | ||||||
| Indiana Housing & Community Development Authority, | ||||||||
| 6.75%, 01/01/2043 (Obligor: Vita of New Whiteland, LLC) | 500,000 | 501,253 | ||||||
| Valparaiso Manufactured Housing Revenue, 5.38%, 12/01/2041 | ||||||||
(Obligor: Green Oaks of Valparaiso) (a) | 3,500,000 | 2,756,282 | ||||||
| 11,263,570 | ||||||||
| Iowa — 1.3% | ||||||||
| Iowa Finance Authority | ||||||||
| 6.75%, 05/15/2033 (Obligor: Lifespace Communities Obl) | 500,000 | 540,814 | ||||||
| 5.00%, 09/01/2051 (Obligor: Sunrise Manor) | 1,000,000 | 749,592 | ||||||
5.00%, 12/01/2051 (Obligor: Riserville Holdings) (a)(e) | 3,495,000 | 2,761,338 | ||||||
| 4,051,744 | ||||||||
| Kentucky — 2.7% | ||||||||
| Falmouth Solid Waste Disposal Facilities Revenue, 8.50%, 06/01/2040 | ||||||||
(Obligor: Texas Bluegrass Biofuels, LLC) (a) | 8,875,000 | 8,447,219 | ||||||
| Louisiana — 0.7% | ||||||||
| Louisiana Public Facilities Authority | ||||||||
Series A, 6.00%, 06/01/2037 (Obligor: Jefferson Rise Charter School) (a) | 480,000 | 470,512 | ||||||
Series A, 6.25%, 06/01/2052 (Obligor: Jefferson Rise Charter School) (a) | 1,000,000 | 975,299 | ||||||
Series A, 6.38%, 06/01/2052 (Obligor: Grambling High Foundation) (a) | 770,000 | 758,495 | ||||||
| 2,204,306 | ||||||||
| Maine — 1.4% | ||||||||
| Maine Finance Authority, 8.00%, 12/01/2051 | ||||||||
(Obligor: Go Lab Madison, LLC) (a)(e) | 5,500,000 | 4,338,011 | ||||||
See Notes to the Financial Statements
13
PRINCIPAL STREET HIGH INCOME MUNICIPAL FUND
Schedule of Investments (Unaudited) – Continued
February 29, 2024
Description | Par | Value | ||||||
| MUNICIPAL BONDS — 82.5% (Continued) | ||||||||
| Massachusetts — 0.3% | ||||||||
| Massachusetts Development Finance Agency, 5.00%, 07/01/2051 | ||||||||
(Obligor: Ascentria Care Alliance) (a) | $ | 1,250,000 | $ | 1,029,506 | ||||
| Michigan — 0.3% | ||||||||
| Michigan Finance Authority, 5.00%, 05/01/2046 | ||||||||
| (Obligor: Aquinas College) | 1,000,000 | 797,282 | ||||||
| Mississippi — 1.5% | ||||||||
Mississippi Development Bank, 3.63%, 11/01/2036 (a) | 1,000,000 | 929,033 | ||||||
| Tunica County, 6.00%, 10/01/2040 | 3,850,000 | 3,505,690 | ||||||
| 4,434,723 | ||||||||
New Jersey — 0.0% (d) | ||||||||
| New Jersey Economic Development Authority, 7.00%, 09/01/2047 | ||||||||
(Obligor: Kintock Obligated Group) (a) | 65,000 | 66,304 | ||||||
| New York — 5.7% | ||||||||
| Build NYC Resource Corp. | ||||||||
| Series A-1, 7.63%, 02/01/2053 (Obligor: Voices of | ||||||||
| Community Activists) | 1,815,000 | 1,823,522 | ||||||
| Series A-2, 8.13%, 02/01/2026 (Obligor: Voices of | ||||||||
| Community Activists) | 300,000 | 298,731 | ||||||
| Series B, 7.63%, 02/01/2026 (Obligor: Voices of | ||||||||
Community Activists) (a) | 1,690,000 | 1,692,036 | ||||||
| Erie Tobacco Asset Securitization Corp. | ||||||||
0.00%, 06/01/2055 (b) | 6,000,000 | 481,458 | ||||||
0.00%, 06/01/2060 (a)(b) | 115,000,000 | 7,568,058 | ||||||
| New York Counties Tobacco Trust IV, Series F, | ||||||||
0.00%, 06/01/2060 (b)(g) | 50,000,000 | 3,654,795 | ||||||
| New York Transportation Development Corp., | ||||||||
6.00%, 06/30/2054 (Obligor: Jfk Nto Llc) (e) | 1,000,000 | 1,101,469 | ||||||
| Ulster County Capital Resource Corp. | ||||||||
| 5.25%, 09/15/2047 (Obligor: Woodland Pond) | 550,000 | 416,618 | ||||||
| 5.25%, 09/15/2053 (Obligor: Woodland Pond) | 920,000 | 670,282 | ||||||
| 17,706,969 | ||||||||
| Ohio — 0.9% | ||||||||
| Southern Ohio Port Authority, Series A, 7.00%, 12/01/2042 | ||||||||
(Obligor: PureCycle Ohio) (a)(e) | 2,600,000 | 2,730,000 | ||||||
| Oklahoma — 2.5% | ||||||||
| Atoka Industrial Development Authority | ||||||||
8.00%, 08/01/2039 (Obligor: Gladieux Metals Recycling) (a)(e) | 6,900,000 | 7,044,218 | ||||||
Series A, 8.00%, 08/01/2039 (Obligor: Gladieux Metals Recycling) (a) | 750,000 | 765,676 | ||||||
| 7,809,894 | ||||||||
See Notes to the Financial Statements
14
PRINCIPAL STREET HIGH INCOME MUNICIPAL FUND
Schedule of Investments (Unaudited) – Continued
February 29, 2024
Description | Par | Value | ||||||
| MUNICIPAL BONDS — 82.5% (Continued) | ||||||||
| Pennsylvania — 3.3% | ||||||||
| Pennsylvania Economic Development Financing Authority | ||||||||
5.75%, 12/31/2062 (e) | $ | 1,000,000 | $ | 1,117,129 | ||||
Series A, 6.50%, 12/01/2038 (Obligor: Tapestry Moon) (a)(b) | 2,950,000 | 1,124,688 | ||||||
Series A, 9.00%, 04/01/2051 (Obligor: Consol Energy) (a)(e)(h) | 4,000,000 | 4,435,405 | ||||||
Series A, 6.75%, 12/01/2053 (Obligor: Tapestry Moon) (a)(b) | 2,650,000 | 1,010,313 | ||||||
| Pennsylvania Economic Development Financing Authority | ||||||||
| Parking System Revenue | ||||||||
| Series A, 4.00%, 01/01/2042 | 1,000,000 | 971,330 | ||||||
| Series A, 4.13%, 01/01/2043 | 750,000 | 733,740 | ||||||
| Series A, 4.13%, 01/01/2044 | 1,000,000 | 975,470 | ||||||
| 10,368,075 | ||||||||
| Puerto Rico — 3.7% | ||||||||
| Children’s Trust Fund | ||||||||
0.00%, 05/15/2057 (b) | 42,000,000 | 3,465,004 | ||||||
Series B, 0.00%, 05/15/2057 (b) | 120,000,000 | 7,776,575 | ||||||
| 11,241,579 | ||||||||
| South Carolina — 4.4% | ||||||||
City of Hardeeville, 4.00%, 05/01/2052 (a) | 700,000 | 504,498 | ||||||
| South Carolina Jobs-Economic Development Authority | ||||||||
| 4.00%, 11/15/2027 (Obligor: Upstate Senior Living Obligated Group) | 25,000 | 24,469 | ||||||
6.00%, 02/01/2035 (Obligor: Repower S. Berkeley) (a)(b)(e) | 1,000,000 | 100,000 | ||||||
Series A, 7.00%, 11/01/2038 (Obligor: Jasper Pellets) (a)(b)(e) | 1,500,000 | 354,000 | ||||||
Series A, 7.00%, 05/01/2039 (Obligor: AAC East) (a)(e) | 3,500,000 | 3,014,125 | ||||||
Series A, 6.50%, 06/01/2051 (Obligor: Last Step Recycling, LLC) (a)(e) | 2,000,000 | 1,214,423 | ||||||
Series A, 5.00%, 06/15/2051 (Obligor: Virtus Academy) (a) | 1,330,000 | 1,062,283 | ||||||
Series A, 5.00%, 06/15/2056 (Obligor: Virtus Academy) (a) | 1,100,000 | 859,989 | ||||||
| Series A, 7.75%, 10/01/2057 (Obligor: CR River Park) | 6,150,000 | 6,546,791 | ||||||
| 13,680,578 | ||||||||
| Tennessee — 1.0% | ||||||||
| Knox County Industrial Development Board, 9.50%, 11/01/2052 | ||||||||
(Obligor: TomPaul Knoxville, LLC) (a)(e) | 1,000,000 | 1,014,176 | ||||||
| Metropolitan Government Nashville & Davidson County Health & | ||||||||
| Educational Facilities Board, Series B-1, 7.50%, 04/01/2049 | ||||||||
(Obligor: Trousdale Foundation Obligated Group) (a)(b) | 1,140,000 | 11,400 | ||||||
| Shelby County Health Educational & Housing Facilities Board, | ||||||||
| Series A, 5.75%, 10/01/2059 (Obligor: Luke Obligated Group) | 3,000,000 | 2,091,649 | ||||||
| 3,117,225 | ||||||||
See Notes to the Financial Statements
15
PRINCIPAL STREET HIGH INCOME MUNICIPAL FUND
Schedule of Investments (Unaudited) – Continued
February 29, 2024
Description | Par | Value | ||||||
| MUNICIPAL BONDS — 82.5% (Continued) | ||||||||
| Texas — 17.5% | ||||||||
| Angelina & Neches River Authority, 7.50%, 12/01/2045 | ||||||||
(Obligor: Jefferson Enterprises Energy) (e) | $ | 11,900,000 | $ | 8,364,551 | ||||
| Arlington Higher Education Finance Corp. | ||||||||
6.13%, 02/15/2053 (Obligor: Odyssey 2020 Academy) (a) | 500,000 | 499,641 | ||||||
6.38%, 06/01/2062 (Obligor: The Magellan School) (a) | 1,000,000 | 1,028,566 | ||||||
6.25%, 06/01/2063 (Obligor: Cypress Christian School) (a) | 1,200,000 | 1,234,286 | ||||||
| Brazoria County Industrial Development Corp. | ||||||||
9.00%, 03/01/2039 (Obligor: Gladieux Metals Recycling) (a)(e) | 4,275,000 | 4,500,694 | ||||||
| Series A, 9.00%, 03/01/2039 | ||||||||
(Obligor: Gladieux Metals Recycling) (a)(e) | 3,330,000 | 3,505,804 | ||||||
| Series B, 7.00%, 03/01/2039 | ||||||||
(Obligor: Gladieux Metals Recycling) (e) | 1,250,000 | 1,192,131 | ||||||
| Calhoun County Navigation Industrial Development Authority | ||||||||
| Series A, 3.63%, 07/01/2026 | ||||||||
(Obligor: Max Midstream Texas, LLC) (a)(e) | 1,500,000 | 1,405,154 | ||||||
Series B, 6.50%, 07/01/2026 (Obligor: Max Midstream Texas, LLC) (a) | 1,000,000 | 950,330 | ||||||
| Jefferson County Industrial Development Corp., 7.75%, 04/01/2039 | ||||||||
(Obligor: TRP Crude Marketing) (a) | 900,000 | 817,667 | ||||||
| Kountze Economic Development Corp., 15.00%, 11/01/2027 | ||||||||
(Obligor: Allegiant Industrial) (a) | 4,050,000 | 4,630,389 | ||||||
| New Hope Cultural Education Facilities Finance Corp. | ||||||||
| Series A, 6.50%, 10/01/2033 (Obligor: Outlook At Windhaven) | 1,500,000 | 1,498,844 | ||||||
| Series A-2, 6.50%, 01/01/2031 (Obligor: Sanctuary LTC, LLC) | 2,500,000 | 1,977,636 | ||||||
| Series B, 2.00%, 11/15/2061 (Obligor: Buckingham Senior | ||||||||
Living Obligated Group) (b)(h) | 2,365,425 | 882,755 | ||||||
| Port Beaumont Navigation District, 8.00%, 02/01/2039 | ||||||||
(Obligor: Allegiant Industrial Island) (a)(e) | 7,010,000 | 6,836,982 | ||||||
| San Antonio Education Facilities Corp. | ||||||||
| Series A, 5.00%, 10/01/2041 (Obligor: Hallmark University) | 840,000 | 715,358 | ||||||
| Series A, 5.00%, 10/01/2051 (Obligor: Hallmark University) | 2,000,000 | 1,589,586 | ||||||
| Series B, 5.25%, 10/01/2028 (Obligor: Hallmark University) | 275,000 | 268,799 | ||||||
| Tarrant County Cultural Education Facilities Finance Corp. | ||||||||
| 6.88%, 11/15/2055 (Obligor: MRC Senior Living Fort Worth) | 2,600,000 | 2,415,726 | ||||||
| Series A, 6.75%, 11/15/2051 (Obligor: MRC Senior Living Fort Worth) | 5,000,000 | 4,607,798 | ||||||
| Series B, 6.38%, 02/15/2041 (Obligor: CC Young Memorial Home) | 550,000 | 302,500 | ||||||
| Texas Department of Housing & Community Affairs, 5.13%, 09/01/2053 | 5,000,000 | 5,170,321 | ||||||
| Woodloch Health Facilities Development Corp., | ||||||||
Series A1, 6.75%, 12/01/2051 (Obligor: Senior Care Living VII) (a)(b) | 3,573,081 | 71,462 | ||||||
| 54,466,980 | ||||||||
See Notes to the Financial Statements
16
PRINCIPAL STREET HIGH INCOME MUNICIPAL FUND
Schedule of Investments (Unaudited) – Continued
February 29, 2024
Description | Par | Value | ||||||
| MUNICIPAL BONDS — 82.5% (Continued) | ||||||||
| Utah — 1.8% | ||||||||
Chelsey Public Infrastructure District No 1, 7.00%, 12/01/2042 (a) | $ | 1,350,000 | $ | 1,395,786 | ||||
| Jordanelle Ridge Public Infrastructure | ||||||||
District No 2, 7.75%, 03/01/2054 (a) | 2,000,000 | 2,026,955 | ||||||
| Utah Charter School Finance Authority | ||||||||
| Series A, 5.38%, 07/15/2042 | ||||||||
(Obligor: Rockwell Charter High School) (a) | 905,000 | 797,789 | ||||||
| Series A, 5.50%, 07/15/2047 | ||||||||
(Obligor: Rockwell Charter High School) (a) | 1,460,000 | 1,281,558 | ||||||
| Series B, 6.63%, 07/15/2047 | ||||||||
(Obligor: Rockwell Charter High School) (a) | 300,000 | 270,255 | ||||||
| 5,772,343 | ||||||||
| Washington — 1.1% | ||||||||
| Washington State Housing Finance Commission | ||||||||
6.38%, 07/01/2063 (Obligor: Seattle Academy of Arts) (a) | 900,000 | 983,248 | ||||||
| Series A, 5.00%, 07/01/2038 (Obligor: Lutheran Retirement | ||||||||
Home Obligated Group) (a) | 1,075,000 | 887,480 | ||||||
Series A, 4.00%, 01/01/2057 (Obligor: Eliseo Obligated Group) (a) | 2,000,000 | 1,369,137 | ||||||
| 3,239,865 | ||||||||
| West Virginia — 2.0% | ||||||||
| West Virginia Economic Development Authority | ||||||||
8.75%, 02/01/2036 (Obligor: Ansorge West Virginia) (a)(e) | 1,000,000 | 800,000 | ||||||
7.63%, 12/01/2040 (Obligor: Empire Trimodal Terminal) (a) | 6,600,000 | 5,447,594 | ||||||
| 6,247,594 | ||||||||
| Wisconsin — 7.8% | ||||||||
| Public Finance Authority | ||||||||
5.50%, 05/01/2039 (Obligor: Cedars Obligated Group) (a) | 1,210,000 | 1,040,954 | ||||||
5.75%, 05/01/2054 (Obligor: Cedars Obligated Group) (a) | 7,950,000 | 6,529,414 | ||||||
| 5.75%, 07/01/2062 | 2,000,000 | 2,131,983 | ||||||
Series A, 7.50%, 06/01/2025 (Obligor: Dreamhouse ‘Ewa Beach) (a) | 1,000,000 | 980,912 | ||||||
Series A, 5.75%, 06/01/2025 (Obligor: Dreamhouse ‘Ewa Beach) (a) | 675,000 | 675,614 | ||||||
Series A, 7.05%, 09/01/2046 (Obligor: Austin FBO LLC) (a)(e)(h) | 6,735,000 | 6,643,365 | ||||||
| Series A, 6.85%, 10/01/2047 | ||||||||
(Obligor: Proton International Alabama LLC) (a)(b) | 400,000 | 40,000 | ||||||
Series A, 6.13%, 02/01/2048 (Obligor: Explore Academy) (a) | 1,525,000 | 1,366,192 | ||||||
Series A, 6.63%, 06/01/2052 (Obligor: Discovery Charter School) (a) | 900,000 | 889,121 | ||||||
Series A, 5.88%, 06/01/2052 (Obligor: Coral Academy of Science) (a) | 600,000 | 600,401 | ||||||
| Series A, 6.00%, 06/15/2052 (Obligor: Shining Rock Classical) | 900,000 | 859,892 | ||||||
See Notes to the Financial Statements
17
PRINCIPAL STREET HIGH INCOME MUNICIPAL FUND
Schedule of Investments (Unaudited) – Continued
February 29, 2024
Description | Par | Value | ||||||
| MUNICIPAL BONDS — 82.5% (Continued) | ||||||||
| Wisconsin — 7.8% (Continued) | ||||||||
| Wisconsin Health & Educational Facilities Authority | ||||||||
| Series C, 7.00%, 07/01/2043 (Obligor: Chiara Communities, Inc.) | $ | 505,000 | $ | 384,389 | ||||
| Series C, 7.50%, 07/01/2053 (Obligor: Chiara Communities, Inc.) | 2,500,000 | 1,889,863 | ||||||
| 24,032,100 | ||||||||
| TOTAL MUNICIPAL BONDS | ||||||||
| (Cost $305,268,789) | 255,837,166 | |||||||
| CORPORATE BONDS — 13.2% | ||||||||
CalPlant I LLC, 15.00%, 07/01/2025 (a)(f) | 1,290,000 | 1,290,000 | ||||||
CalPlant I, LLC, 9.50%, 08/21/2024 (a)(f) | 3,000,000 | 3,000,000 | ||||||
Convival 2022 III, 12.00%, 11/15/2056 (a)(f) | 5,025,000 | 5,273,738 | ||||||
LSC Estero Prime, 12.00%, 04/30/2024 (f) | 1,250,000 | 1,250,000 | ||||||
Sunland Medical Foundation, 12.00%, 10/20/2024 (f) | 10,000,000 | 10,000,000 | ||||||
Sunland Medical Foundation, 7.38%, 04/30/2024 (f) | 12,425,000 | 8,753,413 | ||||||
Sunland Medical Foundation, 12.00%, 04/30/2024 (f) | 11,500,261 | 11,500,260 | ||||||
| 41,067,411 | ||||||||
| TOTAL CORPORATE BONDS | ||||||||
| (Cost $44,418,074) | 41,067,411 | |||||||
| Shares | ||||||||
| CONVERTIBLE PREFERRED STOCKS — 1.6% | ||||||||
Next Renewable Fuels, Series A (f) | 7 | 5,083,502 | ||||||
| TOTAL CONVERTIBLE PREFERRED STOCKS | ||||||||
| (Cost $5,083,650) | 5,083,502 | |||||||
See Notes to the Financial Statements
18
PRINCIPAL STREET HIGH INCOME MUNICIPAL FUND
Schedule of Investments (Unaudited) – Continued
February 29, 2024
Description | Shares | Value | ||||||
| SHORT-TERM INVESTMENTS — 4.1% | ||||||||
| Money Market Funds — 4.1% | ||||||||
First American Government Obligations Fund — Class X, 5.23% (i) | 12,768,791 | $ | 12,768,791 | |||||
| TOTAL SHORT-TERM INVESTMENTS | ||||||||
| (Cost $12,768,791) | 12,768,791 | |||||||
| TOTAL INVESTMENTS — 101.4% | ||||||||
| (Cost $367,539,304) | 314,756,871 | |||||||
| Liabilities in Excess of Other Assets — (1.4)% | (4,658,770 | ) | ||||||
| TOTAL NET ASSETS — 100.0% | $ | 310,098,101 | ||||||
Percentages are stated as a percent of net assets.
(a) | Security is exempt from registration pursuant to Rule 144A under the Securities Act of 1933, as amended. These securities may only be resold in transactions exempt from registration to qualified institutional investors. As of February 29, 2024, the value of these securities total $166,093,008 or 53.6% of the Fund’s net assets. |
(b) | Issuer is currently in default. |
(c) | Step coupon bond. The rate disclosed is as of February 29, 2024. |
(d) | Represents less than 0.05% of net assets. |
(e) | Security subject to the Alternative Minimum Tax (“AMT”). As of February 29, 2024, the total value of securities subject to the AMT was $69,608,927 or 22.5% of net assets. |
(f) | Fair value determined using significant unobservable inputs in accordance with procedures established by and under the supervision of the Adviser, acting as Valuation Designee. These securities represented $46,931,290 or 15.1% of net assets as of February 29, 2024. |
(g) | Zero coupon bonds make no periodic interest payments but are issued at a discount from par value. |
(h) | Coupon rate is variable, or floats based on components including but not limited to reference rate and spread. These securities may not indicate a reference rate and/or spread in their description. The rate disclosed is as of February 29, 2024. |
(i) | The rate shown represents the 7-day effective yield as of February 29, 2024. |
See Notes to the Financial Statements
19
PRINCIPAL STREET SHORT TERM MUNICIPAL FUND
Schedule of Investments (Unaudited)
February 29, 2024
Description | Par | Value | ||||||
| MUNICIPAL BONDS — 97.0% | ||||||||
| Alabama — 3.4% | ||||||||
| Black Belt Energy Gas District No. 7, Series C-1, 5.25%, 12/01/2025 | $ | 1,000,000 | $ | 1,022,390 | ||||
| Houston County Health Care Authority, Series A, 5.00%, 10/01/2030 | 100,000 | 102,102 | ||||||
| Russell County Public Building Authority, 4.50%, 01/01/2033 | 425,000 | 425,289 | ||||||
Southeast Energy Authority A Cooperative District, 5.00%, 05/01/2053 (a) | 350,000 | 363,932 | ||||||
| 1,913,713 | ||||||||
| Alaska — 1.8% | ||||||||
| CIVICVentures/AK, 5.00%, 09/01/2029 | 1,000,000 | 1,007,539 | ||||||
| Arizona — 4.1% | ||||||||
| Maricopa County Industrial Development Authority, | ||||||||
Series B, 4.00%, 07/01/2029 (b) | 1,000,000 | 986,744 | ||||||
| Pima County Industrial Development Authority | ||||||||
5.25%, 12/01/2026 (Obligor: P.L.C. Charter Schools) (b) | 360,000 | 360,151 | ||||||
Series B-3, 5.13%, 11/15/2029 (Obligor: La Posada Park Centre) (b) | 500,000 | 504,382 | ||||||
Series B-3, 5.63%, 11/15/2030 (Obligor: La Posada Park Centre) (b) | 500,000 | 506,120 | ||||||
| 2,357,397 | ||||||||
| California — 6.9% | ||||||||
| California Enterprise Development Authority, | ||||||||
Series A, 4.00%, 06/01/2036 (Obligor: Rocklin Academy) (b) | 500,000 | 464,581 | ||||||
| California Municipal Finance Authority, 4.00%, 07/15/2029 | ||||||||
(Obligor: United Airlines Inc) (c) | 100,000 | 98,691 | ||||||
| California School Finance Authority, 5.00%, 07/01/2025 | ||||||||
(Obligor: Hawking STEAM Charter Schools) (b) | 400,000 | 405,503 | ||||||
| City & County of San Francisco CA, 5.00%, 09/01/2024 | 100,000 | 100,141 | ||||||
| M-S-R Energy Authority, 6.13%, 11/01/2029 | 165,000 | 177,310 | ||||||
Palomar Community College District, Series B, 0.00%, 08/01/2029 (d) | 100,000 | 83,684 | ||||||
| San Ysidro School District, 4.00%, 08/01/2029 | 130,000 | 130,068 | ||||||
| Southern California Logistics Airport Authority, 4.50%, 12/01/2031 | 300,000 | 302,297 | ||||||
| Stockton Unified School District, 5.00%, 07/01/2028 | 145,000 | 145,062 | ||||||
| Sweetwater Union High School District Public | ||||||||
| Financing Authority, 5.00%, 09/01/2025 | 2,040,000 | 2,050,576 | ||||||
| 3,957,913 | ||||||||
| Colorado — 0.7% | ||||||||
| Denver City & County Airport Revenue | ||||||||
Series A, 5.00%, 12/01/2032 (c) | 300,000 | 319,586 | ||||||
Series C, 6.13%, 11/15/2025 (c) | 55,000 | 57,105 | ||||||
| 376,691 | ||||||||
See Notes to the Financial Statements
20
PRINCIPAL STREET SHORT TERM MUNICIPAL FUND
Schedule of Investments (Unaudited) – Continued
February 29, 2024
Description | Par | Value | ||||||
| MUNICIPAL BONDS — 97.0% (Continued) | ||||||||
| District of Columbia — 0.9% | ||||||||
| Metropolitan Washington Airports Authority | ||||||||
Aviation Revenue, 5.00%, 10/01/2030 (c) | $ | 500,000 | $ | 503,128 | ||||
| Florida — 5.3% | ||||||||
| Capital Trust Agency, Inc., 10.00%, 06/30/2024 | ||||||||
(Obligor: Voans SW Florida Healthcare) (b)(e) | 750,000 | 712,500 | ||||||
County of Miami-Dade FL Aviation Revenue, 5.00%, 10/01/2028 (c) | 1,475,000 | 1,481,379 | ||||||
| Miami-Dade County Industrial Development Authority | ||||||||
| 5.00%, 09/15/2024 (Obligor: Pinecrest Academy) | 245,000 | 245,653 | ||||||
6.75%, 07/01/2029 (Obligor: Academir Charter Schools) (b) | 100,000 | 96,991 | ||||||
| Viera East Community Development District, 5.00%, 05/01/2026 | 490,000 | 490,616 | ||||||
| 3,027,139 | ||||||||
| Illinois — 15.0% | ||||||||
| Chicago Board of Education, 5.00%, 12/01/2031 | 150,000 | 159,178 | ||||||
| Chicago O’Hare International Airport | ||||||||
| 5.00%, 01/01/2032 | 500,000 | 500,394 | ||||||
Series B, 5.00%, 01/01/2031 (c) | 1,140,000 | 1,140,488 | ||||||
| City of Blue Island IL, 4.75%, 12/01/2024 | 100,000 | 100,064 | ||||||
| DeKalb & La Salle High School District No 432, 4.00%, 02/01/2032 | 515,000 | 515,393 | ||||||
| Illinois Finance Authority | ||||||||
| 5.00%, 03/01/2032 (Obligor: Southern IL Healthcare) | 845,000 | 876,402 | ||||||
| Series B-2, 5.25%, 11/15/2027 (Obligor: Plymouth Place) | 210,000 | 209,287 | ||||||
| Metropolitan Pier & Exposition Authority, 7.00%, 07/01/2026 | 1,665,000 | 1,740,691 | ||||||
| Pulaski Massac Alexander & Johnson Counties | ||||||||
| Community Unit School District No 10 | ||||||||
| 4.00%, 12/01/2027 | 165,000 | 165,039 | ||||||
| 4.00%, 12/01/2028 | 170,000 | 170,034 | ||||||
| Sales Tax Securitization Corp., Series A, 5.00%, 01/01/2030 | 200,000 | 224,362 | ||||||
| State of Illinois | ||||||||
| 6.00%, 11/01/2026 | 260,000 | 267,954 | ||||||
| 5.25%, 02/01/2029 | 1,795,000 | 1,798,645 | ||||||
| State of Illinois Sales Tax Revenue, 5.00%, 06/15/2025 | 325,000 | 325,553 | ||||||
| Village of Villa Park IL, 4.00%, 12/15/2028 | 350,000 | 350,080 | ||||||
| 8,543,564 | ||||||||
| Indiana — 4.6% | ||||||||
| Indiana Finance Authority, 5.00%, 10/01/2032 (Obligor: Earlham College) | 765,000 | 765,412 | ||||||
Indianapolis Local Public Improvement Bond Bank, 5.00%, 01/01/2030 (c) | 1,250,000 | 1,262,169 | ||||||
| University Of Southern Indiana Foundation, 4.50%, 10/01/2024 | 575,000 | 575,905 | ||||||
| 2,603,486 | ||||||||
See Notes to the Financial Statements
21
PRINCIPAL STREET SHORT TERM MUNICIPAL FUND
Schedule of Investments (Unaudited) – Continued
February 29, 2024
Description | Par | Value | ||||||
| MUNICIPAL BONDS — 97.0% (Continued) | ||||||||
| Iowa — 1.6% | ||||||||
| Iowa Finance Authority, 5.00%, 08/15/2027 | ||||||||
| (Obligor: Mercy Medical Center) | $ | 245,000 | $ | 245,188 | ||||
PEFA, Inc., 5.00%, 09/01/2049 (a) | 630,000 | 643,467 | ||||||
| 888,655 | ||||||||
| Kansas — 0.4% | ||||||||
| Topeka, Series B, 5.13%, 12/01/2026 (Obligor: Congregational Home) | 250,000 | 249,506 | ||||||
| Massachusetts — 0.8% | ||||||||
| Massachusetts Development Finance Agency, 5.00%, 10/01/2029 | ||||||||
| (Obligor: Provident Commonwealth) | 150,000 | 154,260 | ||||||
Massachusetts Educational Financing Authority, 4.38%, 07/01/2024 (c) | 175,000 | 175,023 | ||||||
| North Reading, 5.00%, 05/15/2030 | 120,000 | 120,208 | ||||||
| 449,491 | ||||||||
| Michigan — 1.2% | ||||||||
| Healthsource Saginaw, Inc., 4.00%, 05/01/2027 | 80,000 | 80,066 | ||||||
| Michigan Finance Authority, Series MI-2, 5.00%, 12/01/2044 | ||||||||
(Obligor: Trinity Health Corp.) (a) | 100,000 | 101,306 | ||||||
| Michigan State Building Authority, 5.00%, 04/15/2032 | 500,000 | 515,154 | ||||||
| 696,526 | ||||||||
| Missouri — 1.1% | ||||||||
| Missouri Development Finance Board | ||||||||
| 5.00%, 06/01/2024 | 400,000 | 400,405 | ||||||
| Series A, 5.00%, 06/01/2027 | 200,000 | 200,166 | ||||||
| 600,571 | ||||||||
| New Jersey — 0.2% | ||||||||
| New Jersey Economic Development Authority, 5.25%, 01/01/2025 | ||||||||
(Obligor: NY/NJ Link Borrower) (c) | 100,000 | 100,103 | ||||||
| New York — 8.4% | ||||||||
| Build NYC Resource Corp., Series A-2, 7.63%, 02/01/2026 | ||||||||
(Obligor: Voices of Community Activists) (b) | 1,000,000 | 1,001,205 | ||||||
| Hudson, 4.00%, 04/15/2028 | 95,000 | 95,078 | ||||||
| Metropolitan Transportation Authority, Series C-1, 5.00%, 11/15/2030 | 1,000,000 | 1,046,303 | ||||||
| Monroe County Industrial Development Corp./NY, 5.00%, 10/01/2031 | ||||||||
| (Obligor: Nazareth Clergy of Rochester) | 925,000 | 965,765 | ||||||
| New York State Dormitory Authority, Series A, 4.00%, 07/01/2033 | ||||||||
| (Obligor: St John’s University) | 100,000 | 106,153 | ||||||
See Notes to the Financial Statements
22
PRINCIPAL STREET SHORT TERM MUNICIPAL FUND
Schedule of Investments (Unaudited) – Continued
February 29, 2024
Description | Par | Value | ||||||
| MUNICIPAL BONDS — 97.0% (Continued) | ||||||||
| New York — 8.4% (Continued) | ||||||||
| Oneida County Local Development Corp., 5.00%, 07/01/2027 | ||||||||
| (Obligor: Hamilton College) | $ | 200,000 | $ | 200,164 | ||||
Port Authority of New York & New Jersey, 5.00%, 09/01/2032 (c) | 1,385,000 | 1,390,976 | ||||||
| 4,805,644 | ||||||||
| North Carolina — 2.0% | ||||||||
| North Carolina Capital Facilities Finance Agency, | ||||||||
| Series A, 5.00%, 10/01/2027 (Obligor: Arc Of North Carolina) | 100,000 | 100,754 | ||||||
| North Carolina Medical Care Commission | ||||||||
| Series B, 5.00%, 12/01/2024 (Obligor: Wake Forest Baptist) | 650,000 | 650,682 | ||||||
| Series C, 5.00%, 03/01/2024 (Obligor: Lutheran Aging Services) | 395,000 | 395,000 | ||||||
| 1,146,436 | ||||||||
| Ohio — 3.4% | ||||||||
City of Dayton OH Airport Revenue, 5.00%, 12/01/2024 (c) | 780,000 | 780,628 | ||||||
| RiverSouth Authority, 5.00%, 06/01/2024 | 185,000 | 185,234 | ||||||
| State of Ohio | ||||||||
5.00%, 12/31/2029 (c) | 100,000 | 100,874 | ||||||
5.00%, 12/31/2035 (c) | 885,000 | 891,149 | ||||||
| 1,957,885 | ||||||||
| Oklahoma — 0.4% | ||||||||
| Norman Regional Hospital Authority, 5.00%, 09/01/2025 | ||||||||
| (Obligor: Norman Regional Hospital Authority) | 235,000 | 235,814 | ||||||
| Oregon — 0.6% | ||||||||
| Portland Water Revenue, 5.00%, 10/01/2024 | 350,000 | 350,762 | ||||||
| Pennsylvania — 7.8% | ||||||||
| Butler County Hospital Authority, 5.00%, 07/01/2028 | ||||||||
| (Obligor: Butler Health System) | 300,000 | 301,937 | ||||||
| Commonwealth of Pennsylvania, 5.00%, 10/15/2026 | 2,000,000 | 2,001,211 | ||||||
| Lycoming County Authority, Series S2, 4.50%, 11/01/2035 | ||||||||
(Obligor: Lycoming College) (a) | 500,000 | 498,104 | ||||||
| Montgomery County Higher Education and Health Authority, | ||||||||
| Series UU1, 5.00%, 05/01/2029 (Obligor: Gwynedd Mercy University) | 240,000 | 248,136 | ||||||
| Northeastern Pennsylvania Hospital and Education Authority, | ||||||||
| 5.00%, 05/01/2025 (Obligor: Kings College) | 600,000 | 601,656 | ||||||
| Philadelphia Authority for Industrial Development, Series A, | ||||||||
| 5.00%, 05/01/2030 (Obligor: Russell Byers Charter School) | 770,000 | 788,663 | ||||||
| 4,439,707 | ||||||||
See Notes to the Financial Statements
23
PRINCIPAL STREET SHORT TERM MUNICIPAL FUND
Schedule of Investments (Unaudited) – Continued
February 29, 2024
Description | Par | Value | ||||||
| MUNICIPAL BONDS — 97.0% (Continued) | ||||||||
| Puerto Rico — 4.7% | ||||||||
| Children’s Trust Fund, 5.50%, 05/15/2039 | $ | 720,000 | $ | 722,035 | ||||
Commonwealth of Puerto Rico, Series A, 0.00%, 07/01/2024 (d) | 487,180 | 480,743 | ||||||
| Puerto Rico Electric Power Authority | ||||||||
| 5.00%, 07/01/2024 | 140,000 | 140,028 | ||||||
| 5.00%, 07/01/2025 | 385,000 | 385,078 | ||||||
| 5.25%, 07/01/2026 | 200,000 | 198,370 | ||||||
| Series UU, 5.00%, 07/01/2024 | 745,000 | 745,072 | ||||||
| 2,671,326 | ||||||||
| South Carolina — 1.2% | ||||||||
| South Carolina Jobs-Economic Development Authority | ||||||||
| 4.00%, 11/15/2027 (Obligor: Upstate Senior Living) | 175,000 | 171,283 | ||||||
| 5.25%, 11/15/2028 (Obligor: Kiawah Life Plan Village) | 500,000 | 503,013 | ||||||
| 674,296 | ||||||||
| Tennessee — 3.0% | ||||||||
| Greeneville, 4.00%, 06/01/2029 | 165,000 | 175,848 | ||||||
| Tennessee Energy Acquisition Corp. | ||||||||
| Series A, 5.25%, 09/01/2024 | 1,000,000 | 1,005,179 | ||||||
| Series C, 5.00%, 02/01/2027 | 500,000 | 507,234 | ||||||
| 1,688,261 | ||||||||
| Texas — 6.2% | ||||||||
| Arlington Higher Education Finance Corp., | ||||||||
| Series A, 5.00%, 08/15/2027 (Obligor: Wayside Schools) | 200,000 | 203,155 | ||||||
| Bacliff Municipal Utility District, 4.50%, 09/01/2029 | 340,000 | 340,291 | ||||||
| Central Texas Turnpike System, 5.00%, 08/15/2028 | 295,000 | 296,686 | ||||||
| County of Wise TX, 5.00%, 08/15/2026 | 200,000 | 206,310 | ||||||
| Harris County Cultural Education Facilities Finance Corp., Series A, | ||||||||
| 5.00%, 01/01/2033 (Obligor: Brazos Presbyterian Obligated Group) | 225,000 | 215,079 | ||||||
| Kountze Economic Development Corp., 15.00%, 11/01/2027 | ||||||||
(Obligor: Allegiant Industrial, LLC) (b) | 100,000 | 114,331 | ||||||
| Lower Colorado River Authority, 5.00%, 05/15/2030 | 140,000 | 140,388 | ||||||
| North Harris County Regional Water Authority, 5.00%, 12/15/2026 | 100,000 | 100,105 | ||||||
| Port Beaumont Navigation District, 8.00%, 02/01/2039 | ||||||||
(Obligor: Allegiant Industrial Island) (b)(c) | 265,000 | 258,459 | ||||||
| San Antonio, 5.00%, 02/01/2027 | 140,000 | 140,170 | ||||||
| San Antonio Education Facilities Corp., Series B, 5.25%, 10/01/2028 | ||||||||
| (Obligor: Hallmark University, Inc.) | 100,000 | 97,745 | ||||||
| San Juan Higher Education Finance Authority, 8.25%, 08/15/2029 | ||||||||
| (Obligor: Idea Public Schools) | 450,000 | 458,565 | ||||||
| Texas Municipal Gas Acquisition and Supply Corp. I, 6.25%, 12/15/2026 | 935,000 | 971,000 | ||||||
| 3,542,284 | ||||||||
See Notes to the Financial Statements
24
PRINCIPAL STREET SHORT TERM MUNICIPAL FUND
Schedule of Investments (Unaudited) – Continued
February 29, 2024
Description | Par | Value | ||||||
| MUNICIPAL BONDS — 97.0% (Continued) | ||||||||
| Virginia — 2.7% | ||||||||
| Riverside Regional Jail Authority, 5.00%, 07/01/2025 | $ | 1,550,000 | $ | 1,556,311 | ||||
| Washington — 2.7% | ||||||||
| Spokane County School District No 81 Spokane, 5.25%, 06/01/2024 | 285,000 | 285,263 | ||||||
| Tobacco Settlement Authority, 5.00%, 06/01/2024 | 480,000 | 480,350 | ||||||
| Washington Health Care Facilities Authority, 5.00%, 10/01/2026 | ||||||||
| (Obligor: Providence St Joseph) | 290,000 | 290,969 | ||||||
| Washington State Housing Finance Commission, 4.75%, 07/01/2027 | ||||||||
| (Obligor: Eastside Retirement) | 500,000 | 500,052 | ||||||
| 1,556,634 | ||||||||
| West Virginia — 0.8% | ||||||||
| Monongalia County Building Commission, 5.00%, 07/01/2028 | ||||||||
| (Obligor: Vandalia Health Obligation Group) | 455,000 | 458,288 | ||||||
| Wisconsin — 5.1% | ||||||||
| Public Finance Authority | ||||||||
6.50%, 06/01/2045 (Obligor: Noorda College of Osteopathic) (b) | 200,000 | 175,946 | ||||||
Series A, 5.75%, 06/01/2025 (Obligor: Dreamhouse ‘Ewa Beach) (b) | 1,325,000 | 1,326,206 | ||||||
| Series A, 5.00%, 12/01/2027 (Obligor: Prime Healthcare Foundation) | 530,000 | 539,586 | ||||||
| Wisconsin Health & Educational Facilities Authority | ||||||||
| 5.00%, 08/15/2025 (Obligor: Aspirus) | 100,000 | 100,100 | ||||||
| 5.00%, 12/01/2027 (Obligor: Iowa Health Systems) | 740,000 | 745,059 | ||||||
| 2,886,897 | ||||||||
| TOTAL MUNICIPAL BONDS | ||||||||
| (Cost $54,765,251) | 55,245,967 | |||||||
See Notes to the Financial Statements
25
PRINCIPAL STREET SHORT TERM MUNICIPAL FUND
Schedule of Investments (Unaudited) – Continued
February 29, 2024
Description | Shares | Value | ||||||
| SHORT-TERM INVESTMENTS — 1.8% | ||||||||
| Money Market Funds — 1.8% | ||||||||
First American Government Obligations Fund — Class X, 5.23% (e) | 1,021,715 | $ | 1,021,715 | |||||
| TOTAL SHORT-TERM INVESTMENTS | ||||||||
| (Cost $1,021,715) | 1,021,715 | |||||||
| TOTAL INVESTMENTS — 98.8% | ||||||||
| (Cost $55,786,966) | 56,267,682 | |||||||
| Other Assets in Excess of Liabilities — 1.2% | 681,599 | |||||||
| TOTAL NET ASSETS — 100.0% | $ | 56,949,281 | ||||||
Percentages are stated as a percent of net assets.
(a) | Coupon rate is variable, or floats based on components including but not limited to reference rate and spread. These securities may not indicate a reference rate and/or spread in their description. The rate disclosed is as of February 29, 2024. |
(b) | Security is exempt from registration pursuant to Rule 144A under the Securities Act of 1933, as amended. These securities may only be resold in transactions exempt from registration to qualified institutional investors. As of February 29, 2024, the value of these securities total $6,913,118 or 12.1% of the Fund’s net assets. |
(c) | Security subject to the Alternative Minimum Tax (“AMT”). As of February 29, 2024, the total value of securities subject to the AMT was $8,559,758 or 15.0% of net assets. |
(d) | Zero coupon bonds make no periodic interest payments but are issued at a discount from par value. |
(e) | The rate shown represents the 7-day effective yield as of February 29, 2024. |
See Notes to the Financial Statements
26
PRINCIPAL STREET FUNDS
(This Page Intentionally Left Blank.)
27
PRINCIPAL STREET FUNDS
Statement of Assets and Liabilities (Unaudited)
February 29, 2024
| High Income | Short Term | |||||||
| Municipal Fund | Municipal Fund | |||||||
| ASSETS: | ||||||||
| Investments, at value (Cost: $367,539,304 | ||||||||
| and $55,786,966, respectively) | $ | 314,756,871 | $ | 56,267,682 | ||||
| Interest receivable | 9,639,876 | 761,053 | ||||||
| Receivable for capital shares sold | 2,963,917 | 143,517 | ||||||
| Receivable for investment securities sold | 1,078,548 | — | ||||||
Receivable for shareholder reprocessing(1) | 333,577 | — | ||||||
| Prepaid expenses | 53,322 | 16,465 | ||||||
| Total Assets | 328,826,111 | 57,188,717 | ||||||
| LIABILITIES: | ||||||||
| Payable for bank overdraft | 10,377,523 | — | ||||||
| Payable for investment securities purchased | 7,177,523 | — | ||||||
| Payable for capital shares redeemed | 868,413 | 120,687 | ||||||
| Payable for fund administration & accounting fees | 142,022 | 63,259 | ||||||
| Payable to investment adviser | — | 3,936 | ||||||
| Payable for distribution fees | 49,162 | 4,621 | ||||||
| Payable for transfer agent fees & expenses | 46,787 | 20,460 | ||||||
| Payable for audit fees | 24,718 | 11,096 | ||||||
| Payable for custody fees | 6,279 | 1,764 | ||||||
| Payable for compliance fees | 5,152 | 5,150 | ||||||
| Accrued expenses | 30,431 | 8,463 | ||||||
| Total Liabilities | 18,728,010 | 239,436 | ||||||
| NET ASSETS | $ | 310,098,101 | $ | 56,949,281 | ||||
| NET ASSETS CONSIST OF: | ||||||||
| Paid-in capital | $ | 390,550,127 | $ | 57,187,385 | ||||
| Total accumulated loss | (80,452,026 | ) | (238,104 | ) | ||||
| Net Assets | $ | 310,098,101 | $ | 56,949,281 | ||||
(1) | Please see Note 10 for additional details. |
See Notes to the Financial Statements
28
PRINCIPAL STREET FUNDS
Statements of Assets and Liabilities (Unaudited) – Continued
February 29, 2024
| High Income | Short Term | |||||||
| Municipal Fund | Municipal Fund | |||||||
| A Class: | ||||||||
| Net Assets | $ | 6,820,197 | $ | — | ||||
Shares issued and outstanding(1) | 921,952 | — | ||||||
Net asset value, redemption price, and offering price per share(2) | $ | 7.40 | $ | — | ||||
Maximum offering price per share(2)(3) | $ | 7.57 | $ | — | ||||
| Institutional Class: | ||||||||
| Net Assets | $ | 259,718,149 | $ | 45,436,067 | ||||
Shares issued and outstanding(1) | 34,971,318 | 10,711,420 | ||||||
| Net asset value, redemption price, and offering price per share | $ | 7.43 | $ | 4.24 | ||||
| Investor Class: | ||||||||
| Net Assets | $ | 43,559,755 | $ | 11,513,214 | ||||
Shares issued and outstanding(1) | 5,831,646 | 2,719,482 | ||||||
| Net asset value, redemption price, and offering price per share | $ | 7.47 | $ | 4.23 | ||||
(1) | Unlimited shares authorized without par value. |
(2) | May be subject to a contingent deferred sales charge of 1.00% on certain shares redeemed within 12 months of purchase. |
(3) | The offering price is calculated by dividing the net asset value by 1 minus the maximum front-end sales charge of 2.25%. |
See Notes to the Financial Statements
29
PRINCIPAL STREET FUNDS
Statement of Operations (Unaudited)
For the Six Months Ended February 29, 2024
| High Income | Short Term | |||||||
| Municipal Fund | Municipal Fund | |||||||
| INVESTMENT INCOME: | ||||||||
| Interest income | $ | 12,167,273 | $ | 1,244,240 | ||||
| Total investment income | 12,167,273 | 1,244,240 | ||||||
| EXPENSES: | ||||||||
| Investment adviser fees (See Note 4) | 772,925 | 119,535 | ||||||
| Fund administration & accounting fees (See Note 4) | 169,958 | 77,245 | ||||||
| Transfer agent fees & expenses (See Note 4) | 56,228 | 24,388 | ||||||
| Federal & state registration fees | 30,562 | 19,244 | ||||||
| Audit fees | 24,714 | 11,102 | ||||||
| Custody fees (See Note 4) | 17,022 | 4,014 | ||||||
| Legal fees | 15,648 | 10,528 | ||||||
| Trustee fees | 10,652 | 10,652 | ||||||
| Compliance fees (See Note 4) | 6,188 | 6,188 | ||||||
| Postage & printing fees | 5,748 | 1,112 | ||||||
| Other expenses | 3,554 | 1,648 | ||||||
| Insurance expense | 1,820 | 1,274 | ||||||
| Distribution and shareholder servicing fees - | ||||||||
| A Class (See Note 5) | 8,118 | — | ||||||
| Investor Class (See Note 5) | 90,209 | 9,995 | ||||||
| Total expense before interest expense | 1,213,346 | 296,925 | ||||||
| Interest expense (See Note 9) | 136,820 | 4,087 | ||||||
| Total expenses before recoupment/waiver | 1,350,166 | 301,012 | ||||||
| Adviser recoupment (See Note 4) | 15,297 | — | ||||||
| Less: waiver from investment adviser (See Note 4) | (6,062 | ) | (100,986 | ) | ||||
| Net expenses | 1,359,401 | 200,026 | ||||||
| NET INVESTMENT INCOME | 10,807,872 | 1,044,214 | ||||||
| REALIZED AND UNREALIZED | ||||||||
| GAIN (LOSS) ON INVESTMENTS | ||||||||
| Net realized loss on investments | (1,020,162 | ) | (387,450 | ) | ||||
| Net change in unrealized appreciation/depreciation on investments | 7,175,977 | 530,680 | ||||||
| Net realized and unrealized gain on investments | 6,155,815 | 143,230 | ||||||
| NET INCREASE IN NET ASSETS | ||||||||
| RESULTING FROM OPERATIONS | $ | 16,963,687 | $ | 1,187,444 | ||||
See Notes to the Financial Statements
30
PRINCIPAL STREET HIGH INCOME MUNICIPAL FUND
Statements of Changes in Net Assets
| For the | ||||||||
| Six Months Ended | For the | |||||||
| February 29, 2024 | Year Ended | |||||||
| (Unaudited) | August 31, 2023 | |||||||
| OPERATIONS: | ||||||||
| Net investment income | $ | 10,807,872 | $ | 15,757,168 | ||||
| Net realized loss on investments | (1,020,162 | ) | (14,501,142 | ) | ||||
| Net change in unrealized appreciation/depreciation on investments | 7,175,977 | (11,030,242 | ) | |||||
| Net increase (decrease) in net assets resulting from operations | 16,963,687 | (9,774,216 | ) | |||||
| CAPITAL SHARE TRANSACTIONS: | ||||||||
| A Class: | ||||||||
| Proceeds from shares sold | 2,002,390 | 5,512,512 | ||||||
| Proceeds from reinvestment of distributions | 180,539 | 157,461 | ||||||
| Payments for shares redeemed | (1,448,155 | ) | (116,320 | ) | ||||
| Net increase in net assets resulting from A Class transactions | 734,774 | 5,553,653 | ||||||
| Institutional Class: | ||||||||
| Proceeds from shares sold | 100,710,877 | 130,446,143 | ||||||
| Proceeds from reinvestment of distributions | 7,425,685 | 14,883,107 | ||||||
| Payments for shares redeemed | (95,372,087 | ) | (153,392,207 | ) | ||||
| Net increase (decrease) in net assets | ||||||||
| resulting from Institutional Class transactions | 12,764,475 | (8,062,957 | ) | |||||
| Investor Class: | ||||||||
| Proceeds from shares sold | 21,197,076 | 13,182,731 | ||||||
| Proceeds from reinvestment of distributions | 495,784 | 571,576 | ||||||
| Payments for shares redeemed | (8,164,867 | ) | (3,484,484 | ) | ||||
| Net increase in net assets resulting from Investor Class transactions | 13,527,993 | 10,269,823 | ||||||
| Net increase in net assets from capital share transactions | 27,027,242 | 7,760,519 | ||||||
| DISTRIBUTIONS TO SHAREHOLDERS | ||||||||
| A Class | (195,991 | ) | (189,908 | ) | ||||
| Institutional Class | (7,444,007 | ) | (15,335,281 | ) | ||||
| Investor Class | (1,028,032 | ) | (1,440,870 | ) | ||||
| Total distributions to shareholders | (8,668,030 | ) | (16,966,059 | ) | ||||
| TOTAL INCREASE (DECREASE) IN NET ASSETS | 35,322,899 | (18,979,756 | ) | |||||
| NET ASSETS: | ||||||||
| Beginning of period | 274,775,202 | 293,754,958 | ||||||
| End of period | $ | 310,098,101 | $ | 274,775,202 | ||||
See Notes to the Financial Statements
31
PRINCIPAL STREET SHORT TERM MUNICIPAL FUND
Statements of Changes in Net Assets
| For the | ||||||||
| Six Months Ended | For the | |||||||
| February 29, 2024 | Year Ended | |||||||
| (Unaudited) | August 31, 2023 | |||||||
| OPERATIONS: | ||||||||
| Net investment income | $ | 1,044,214 | $ | 1,752,652 | ||||
| Net realized loss on investments | (387,450 | ) | (395,830 | ) | ||||
| Net change in unrealized appreciation/depreciation on investments | 530,680 | (52,691 | ) | |||||
| Net increase in net assets resulting from operations | 1,187,444 | 1,304,131 | ||||||
| CAPITAL SHARE TRANSACTIONS: | ||||||||
| Institutional Class: | ||||||||
| Proceeds from shares sold | 12,351,581 | 48,683,163 | ||||||
| Proceeds from reinvestment of distributions | 886,575 | 1,678,005 | ||||||
| Payments for shares redeemed | (21,116,448 | ) | (26,736,332 | ) | ||||
| Net increase (decrease) in net assets resulting from | ||||||||
| Institutional Class transactions | (7,878,292 | ) | 23,624,836 | |||||
| Investor Class: | ||||||||
| Proceeds from shares sold | 11,325,000 | 101,225 | ||||||
| Proceeds from reinvestment of distributions | 149,375 | 1,573 | ||||||
| Payments for shares redeemed | (126,000 | ) | (2,494 | ) | ||||
| Net increase in net assets resulting from Investor Class transactions | 11,348,375 | 100,304 | ||||||
| Net increase in net assets from capital share transactions | 3,470,083 | 23,725,140 | ||||||
| DISTRIBUTIONS TO SHAREHOLDERS | ||||||||
| Institutional Class | (896,160 | ) | (1,688,232 | ) | ||||
| Investor Class | (149,901 | ) | (1,573 | ) | ||||
| Total distributions to shareholders | (1,046,061 | ) | (1,689,805 | ) | ||||
| TOTAL INCREASE IN NET ASSETS | 3,611,466 | 23,339,466 | ||||||
| NET ASSETS: | ||||||||
| Beginning of period | 53,337,815 | 29,998,349 | ||||||
| End of period | $ | 56,949,281 | $ | 53,337,815 | ||||
See Notes to the Financial Statements
32
PRINCIPAL STREET HIGH INCOME MUNICIPAL FUND
Statement of Cash Flows
| For the | ||||
| Six Months Ended | ||||
| February 29, 2024 | ||||
| (Unaudited) | ||||
| Increase (Decrease) in Cash: | ||||
| Cash flows provided by (used for) operating activities: | ||||
| Net increase in net assets resulting from operations | $ | 16,963,687 | ||
| Adjustments to reconcile net increase in net assets from | ||||
| operations to net cash used for operating activities: | ||||
| Purchases of investments | (36,246,247 | ) | ||
| Proceeds from sales of investments | 22,813,041 | |||
| Purchases and sales of short-term investments, net | (24,563,127 | ) | ||
| Decrease in receivable for shareholder reprocessing | 265,268 | |||
| Amortization (accretion) of market premium (discount), net | (958,953 | ) | ||
| Changes in operating assets and liabilities | ||||
| Increase in payable for investment securities purchased | 7,177,523 | |||
| Increase in receivable for investment securities sold | (1,078,548 | ) | ||
| Increase in interest receivable | (1,571,793 | ) | ||
| Increase in prepaid expenses | (20,135 | ) | ||
| Decrease in payable to investment adviser | (122,547 | ) | ||
| Decrease in accrued distributions payable | (116,234 | ) | ||
| Increase in other expenses | 121,963 | |||
| Net change in unrealized depreciation of investments | (7,175,977 | ) | ||
| Net realized loss | 1,020,162 | |||
| Net cash provided by operating activities | (23,491,917 | ) | ||
| Cash flows provided by (used for) financing activities: | ||||
Proceeds from shares sold(a) | 121,799,038 | |||
Cost of shares redeemed(b) | (105,093,622 | ) | ||
| Loan borrowings | 48,959,000 | |||
| Loan repayments | (48,959,000 | ) | ||
| Dividends paid to shareholders, net of reinvestments | (566,022 | ) | ||
| Net cash used for financing activities | 16,139,394 | |||
| Net change in cash | (7,352,523 | ) | ||
| Cash: | ||||
| Beginning of period | (3,025,000 | ) | ||
| End of period | $ | (10,377,523 | ) | |
| Supplemental disclosure of cash flow and non-cash information: | ||||
| Interest paid | $ | 136,820 | ||
| Reinvested distributions | $ | 8,102,008 | ||
(a) | Includes an increase in receivable for capital shares sold of $2,111,305. |
(b) | Includes a decrease in payable for capital shares redeemed of $108,513. |
See Notes to the Financial Statements
33
PRINCIPAL STREET HIGH INCOME MUNICIPAL FUND
Financial Highlights
For a Fund share outstanding throughout the periods.
A Class
| For the | For the Period | |||||||||||
| Period Ended | Inception(1) | |||||||||||
| February 29, 2024 | Year Ended | Through | ||||||||||
| (Unaudited) | August 31, 2023 | August 31, 2022 | ||||||||||
| PER SHARE DATA: | ||||||||||||
| Net asset value, beginning of period | $ | 7.11 | $ | 7.87 | $ | 8.74 | ||||||
| Investment operations: | ||||||||||||
| Net investment income | 0.27 | 0.43 | 0.24 | |||||||||
| Net realized and unrealized gain (loss) on investments | 0.24 | (0.74 | ) | (0.87 | ) | |||||||
| Total from investment operations | 0.51 | (0.31 | ) | (0.63 | ) | |||||||
| Less distributions from: | ||||||||||||
| Net investment income | (0.22 | ) | (0.45 | ) | (0.24 | ) | ||||||
| Net realized gains | — | — | — | |||||||||
| Total distributions | (0.22 | ) | (0.45 | ) | (0.24 | ) | ||||||
| Net asset value, end of period | $ | 7.40 | $ | 7.11 | $ | 7.87 | ||||||
TOTAL RETURN(2)(3) | 7.11 | % | -4.02 | % | -7.27 | % | ||||||
| SUPPLEMENTAL DATA AND RATIOS: | ||||||||||||
| Net assets, end of period (in 000’s) | $ | 6,820 | $ | 5,739 | $ | 375 | ||||||
| Ratio of expenses to average net assets: | ||||||||||||
Before expense waiver/recoupment(4) | 1.15 | % | 1.27 | % | 1.27 | % | ||||||
After expense waiver/recoupment(4) | 1.15 | % | 1.23 | % | 1.20 | % | ||||||
| Ratio of expenses excluding interest expense | ||||||||||||
| to average net assets: | ||||||||||||
Before expense waiver/recoupment(4) | 1.05 | % | 1.07 | % | 1.06 | % | ||||||
After expense waiver/recoupment(4) | 1.05 | % | 1.03 | % | 0.98 | % | ||||||
| Ratio of net investment income to average net assets: | ||||||||||||
After expense waiver/recoupment(4) | 7.50 | % | 5.52 | % | 5.44 | % | ||||||
Portfolio turnover rate(2)(5) | 9 | % | 21 | % | 53 | % | ||||||
(1) | Inception date for the A Class was February 16, 2022. |
(2) | Not annualized for period less than one year. |
(3) | Return does not include sales load. |
(4) | Annualized for period less than one year. |
(5) | Portfolio turnover disclosed is for the Fund as a whole. |
See Notes to the Financial Statements
34
PRINCIPAL STREET HIGH INCOME MUNICIPAL FUND
Financial Highlights
For a Fund share outstanding throughout the periods.
Institutional Class
| For the | ||||||||||||||||||||||||
| Period Ended | Year | Year | Year | Year | Year | |||||||||||||||||||
| February 29, | Ended | Ended | Ended | Ended | Ended | |||||||||||||||||||
| 2024 | August 31, | August 31, | August 31, | August 31, | August 31, | |||||||||||||||||||
| (Unaudited) | 2023 | 2022 | 2021 | 2020 | 2019 | |||||||||||||||||||
| PER SHARE DATA: | ||||||||||||||||||||||||
| Net asset value, beginning of period | $ | 7.21 | $ | 7.91 | $ | 9.27 | $ | 9.12 | $ | 10.36 | $ | 10.34 | ||||||||||||
| Investment operations: | ||||||||||||||||||||||||
| Net investment income | 0.28 | 0.43 | 0.46 | 0.51 | 0.60 | 0.60 | ||||||||||||||||||
| Net realized and unrealized | ||||||||||||||||||||||||
| gain (loss) on investments | 0.17 | (0.67 | ) | (1.35 | ) | 0.15 | (1.24 | ) | 0.22 | |||||||||||||||
| Total from | ||||||||||||||||||||||||
| investment operations | 0.45 | (0.24 | ) | (0.89 | ) | 0.66 | (0.64 | ) | 0.82 | |||||||||||||||
| Less distributions from: | ||||||||||||||||||||||||
| Net investment income | (0.23 | ) | (0.46 | ) | (0.47 | ) | (0.51 | ) | (0.56 | ) | (0.60 | ) | ||||||||||||
| Net realized gains | — | — | — | — | (0.04 | ) | (0.20 | ) | ||||||||||||||||
| Total distributions | (0.23 | ) | (0.46 | ) | (0.47 | ) | (0.51 | ) | (0.60 | ) | (0.80 | ) | ||||||||||||
| Net asset value, end of period | $ | 7.43 | $ | 7.21 | $ | 7.91 | $ | 9.27 | $ | 9.12 | $ | 10.36 | ||||||||||||
TOTAL RETURN(1) | 6.32 | % | -2.94 | % | -9.88 | % | 7.49 | % | -6.34 | % | 8.36 | % | ||||||||||||
| SUPPLEMENTAL DATA AND RATIOS: | ||||||||||||||||||||||||
| Net assets, end of | ||||||||||||||||||||||||
| period (in 000’s) | $ | 259,718 | $ | 240,235 | $ | 272,640 | $ | 289,438 | $ | 201,763 | $ | 155,658 | ||||||||||||
| Ratio of expenses to | ||||||||||||||||||||||||
| average net assets: | ||||||||||||||||||||||||
| Before expense | ||||||||||||||||||||||||
waiver/recoupment(2) | 0.89 | % | 1.04 | % | 0.86 | % | 0.78 | % | 0.80 | % | 0.83 | % | ||||||||||||
| After expense | ||||||||||||||||||||||||
waiver/recoupment(2) | 0.90 | % | 1.00 | % | 0.83 | % | 0.73 | % | 0.74 | % | 0.74 | % | ||||||||||||
| Ratio of expenses excluding interest | ||||||||||||||||||||||||
| expense to average net assets: | ||||||||||||||||||||||||
| Before expense | ||||||||||||||||||||||||
waiver/recoupment(2) | 0.79 | % | 0.81 | % | 0.76 | % | 0.77 | % | 0.79 | % | 0.82 | % | ||||||||||||
| After expense | ||||||||||||||||||||||||
waiver/recoupment(2) | 0.80 | % | 0.77 | % | 0.73 | % | 0.73 | % | 0.73 | % | 0.73 | % | ||||||||||||
| Ratio of net investment income | ||||||||||||||||||||||||
| to average net assets: | ||||||||||||||||||||||||
| After expense | ||||||||||||||||||||||||
waiver/recoupment(2) | 7.76 | % | 5.75 | % | 5.35 | % | 5.70 | % | 6.28 | % | 5.82 | % | ||||||||||||
Portfolio turnover rate(1)(3) | 9 | % | 21 | % | 53 | % | 64 | % | 41 | % | 33 | % | ||||||||||||
(1) | Not annualized for periods less than one year. |
(2) | Annualized for periods less than one year. |
(3) | Portfolio turnover disclosed is for the Fund as a whole. |
See Notes to the Financial Statements
35
PRINCIPAL STREET HIGH INCOME MUNICIPAL FUND
Financial Highlights
For a Fund share outstanding throughout the periods.
Investor Class
| For the | For the Period | |||||||||||||||||||
| Period Ended | Year | Year | Year | Inception(1) | ||||||||||||||||
| February 29, | Ended | Ended | Ended | Through | ||||||||||||||||
| 2024 | August 31, | August 31, | August 31, | August 31, | ||||||||||||||||
| (Unaudited) | 2023 | 2022 | 2021 | 2020 | ||||||||||||||||
| PER SHARE DATA: | ||||||||||||||||||||
| Net asset value, beginning of period | $ | 7.23 | $ | 7.96 | $ | 9.32 | $ | 9.18 | $ | 8.66 | ||||||||||
| Investment operations: | ||||||||||||||||||||
| Net investment income | 0.26 | 0.40 | 0.41 | 0.48 | 0.22 | |||||||||||||||
| Net realized and unrealized | ||||||||||||||||||||
| gain (loss) on investments | 0.19 | (0.70 | ) | (1.35 | ) | 0.13 | 0.51 | (5) | ||||||||||||
| Total from investment operations | 0.45 | (0.30 | ) | (0.94 | ) | 0.61 | 0.73 | |||||||||||||
| Less distributions from: | ||||||||||||||||||||
| Net investment income | (0.21 | ) | (0.43 | ) | (0.42 | ) | (0.47 | ) | (0.21 | ) | ||||||||||
| Net realized gains | — | — | — | — | — | |||||||||||||||
| Total distributions | (0.21 | ) | (0.43 | ) | (0.42 | ) | (0.47 | ) | (0.21 | ) | ||||||||||
| Net asset value, end of period | $ | 7.47 | $ | 7.23 | $ | 7.96 | $ | 9.32 | $ | 9.18 | ||||||||||
TOTAL RETURN(2) | 6.17 | % | -3.81 | % | -10.28 | % | 6.82 | % | 8.56 | % | ||||||||||
| SUPPLEMENTAL DATA AND RATIOS: | ||||||||||||||||||||
| Net assets, end of period (in 000’s) | $ | 43,560 | $ | 28,801 | $ | 20,740 | $ | 12,420 | $ | 278 | ||||||||||
| Ratio of expenses to average net assets: | ||||||||||||||||||||
Before expense waiver/recoupment(3) | 1.39 | % | 1.54 | % | 1.38 | % | 1.28 | % | 1.32 | % | ||||||||||
After expense waiver/recoupment(3) | 1.39 | % | 1.50 | % | 1.35 | % | 1.24 | % | 1.23 | % | ||||||||||
| Ratio of expenses excluding interest | ||||||||||||||||||||
| expense to average net assets: | ||||||||||||||||||||
Before expense waiver/recoupment(3) | 1.29 | % | 1.31 | % | 1.26 | % | 1.27 | % | 1.32 | % | ||||||||||
After expense waiver/recoupment(3) | 1.30 | % | 1.27 | % | 1.23 | % | 1.23 | % | 1.23 | % | ||||||||||
| Ratio of net investment income | ||||||||||||||||||||
| to average net assets: | ||||||||||||||||||||
After expense waiver/recoupment(3) | 7.26 | % | 5.25 | % | 4.89 | % | 5.20 | % | 6.21 | % | ||||||||||
Portfolio turnover rate(2)(4) | 9 | % | 21 | % | 53 | % | 64 | % | 41 | % | ||||||||||
(1) | Inception date for the Investor Class was March 23, 2020. |
(2) | Not annualized for periods less than one year. |
(3) | Annualized for periods less than one year. |
(4) | Portfolio turnover disclosed is for the Fund as a whole. |
(5) | The realized and unrealized gain per share in this caption is a balancing amount necessary to reconcile the change in net asset value per share for the period, and may not reconcile with the aggregate gains on the Statement of Operations due to share transactions for the period. |
See Notes to the Financial Statements
36
PRINCIPAL STREET SHORT TERM MUNICIPAL FUND
Financial Highlights
For a Fund share outstanding throughout the periods.
Institutional Class
| For the | For the Period | |||||||||||
| Period Ended | Inception(1) | |||||||||||
| February 29, 2024 | Year Ended | Through | ||||||||||
| (Unaudited) | August 31, 2023 | August 31, 2022 | ||||||||||
| PER SHARE DATA: | ||||||||||||
| Net asset value, beginning of period | $ | 4.22 | $ | 4.26 | $ | 4.25 | ||||||
| Investment operations: | ||||||||||||
| Net investment income | 0.08 | 0.14 | 0.03 | |||||||||
| Net realized and unrealized gain (loss) on investments | 0.02 | (0.04 | ) | 0.01 | (5) | |||||||
| Total from investment operations | 0.10 | 0.10 | 0.04 | |||||||||
| Less distributions from: | ||||||||||||
| Net investment income | (0.08 | ) | (0.14 | ) | (0.03 | ) | ||||||
| Net realized gains | — | — | — | |||||||||
| Total distributions | (0.08 | ) | (0.14 | ) | (0.03 | ) | ||||||
| Net asset value, end of period | $ | 4.24 | $ | 4.22 | $ | 4.26 | ||||||
TOTAL RETURN(2) | 2.48 | % | 2.36 | % | 1.02 | % | ||||||
| SUPPLEMENTAL DATA AND RATIOS: | ||||||||||||
| Net assets, end of period (in 000’s) | $ | 45,436 | $ | 53,211 | $ | 29,970 | ||||||
| Ratio of expenses to average net assets: | ||||||||||||
Before expense waiver(3) | 1.10 | % | 1.09 | % | 4.41 | % | ||||||
After expense waiver(3) | 0.72 | % | 0.71 | % | 0.70 | % | ||||||
| Ratio of expenses excluding interest expense | ||||||||||||
| to average net assets: | ||||||||||||
Before expense waiver(3) | 1.08 | % | 1.09 | % | 4.41 | % | ||||||
After expense waiver(3) | 0.70 | % | 0.70 | % | 0.70 | % | ||||||
| Ratio of net investment income to average net assets: | ||||||||||||
After expense waiver(3) | 3.97 | % | 3.42 | % | 2.52 | % | ||||||
Portfolio turnover rate(2)(4) | 41 | % | 75 | % | 24 | % | ||||||
(1) | Inception date for the Fund was April 27, 2022. |
(2) | Not annualized for period less than one year. |
(3) | Annualized for period less than one year. |
(4) | Portfolio turnover disclosed is for the Fund as a whole. |
(5) | The realized and unrealized gain per share in this caption is a balancing amount necessary to reconcile the change in net asset value per share for the period, and may not reconcile with the aggregate gains on the Statement of Operations due to share transactions for the period. |
See Notes to the Financial Statements
37
PRINCIPAL STREET SHORT TERM MUNICIPAL FUND
Financial Highlights
For a Fund share outstanding throughout the periods.
Investor Class
| For the | For the Period | |||||||||||
| Period Ended | Inception(1) | |||||||||||
| February 29, 2024 | Year Ended | Through | ||||||||||
| (Unaudited) | August 31, 2023 | August 31, 2022 | ||||||||||
| PER SHARE DATA: | ||||||||||||
| Net asset value, beginning of period | $ | 4.21 | $ | 4.26 | $ | 4.25 | ||||||
| Investment operations: | ||||||||||||
| Net investment income | 0.08 | 0.13 | 0.03 | |||||||||
| Net realized and unrealized gain (loss) on investments | 0.02 | (0.05 | ) | 0.01 | (5) | |||||||
| Total from investment operations | 0.10 | 0.08 | 0.04 | |||||||||
| Less distributions from: | ||||||||||||
| Net investment income | (0.08 | ) | (0.13 | ) | (0.03 | ) | ||||||
| Net realized gains | — | — | — | |||||||||
| Total distributions | (0.08 | ) | (0.13 | ) | (0.03 | ) | ||||||
| Net asset value, end of period | $ | 4.23 | $ | 4.21 | $ | 4.26 | ||||||
TOTAL RETURN(2) | 2.36 | % | 1.87 | % | 0.94 | % | ||||||
| SUPPLEMENTAL DATA AND RATIOS: | ||||||||||||
| Net assets, end of period (in 000’s) | $ | 11,513 | $ | 127 | $ | 28 | ||||||
| Ratio of expenses to average net assets: | ||||||||||||
Before expense waiver(3) | 1.35 | % | 1.37 | % | 5.60 | % | ||||||
After expense waiver(3) | 0.97 | % | 0.95 | % | 0.96 | % | ||||||
| Ratio of expenses excluding interest expense | ||||||||||||
| to average net assets: | ||||||||||||
Before expense waiver(3) | 1.33 | % | 1.36 | % | 5.59 | % | ||||||
After expense waiver(3) | 0.95 | % | 0.95 | % | 0.95 | % | ||||||
| Ratio of net investment income to average net assets: | ||||||||||||
After expense waiver(3) | 3.72 | % | 3.18 | % | 2.27 | % | ||||||
Portfolio turnover rate(2)(4) | 41 | % | 75 | % | 24 | % | ||||||
(1) | Inception date for the Fund was April 27, 2022. |
(2) | Not annualized for period less than one year. |
(3) | Annualized for period less than one year. |
(4) | Portfolio turnover disclosed is for the Fund as a whole. |
(5) | The realized and unrealized gain per share in this caption is a balancing amount necessary to reconcile the change in net asset value per share for the period, and may not reconcile with the aggregate gains on the Statement of Operations due to share transactions for the period. |
See Notes to the Financial Statements
38
PRINCIPAL STREET FUNDS
Notes to the Financial Statements (Unaudited)
February 29, 2024
1. ORGANIZATION
Managed Portfolio Series (the “Trust”) was organized as a Delaware statutory trust on January 27, 2011. The Trust is registered under the Investment Company Act of 1940, as amended (the “1940 Act”), as an open-end management investment company. The Principal Street High Income Municipal Fund (the “High Income Fund”) is a diversified series with its own investment objectives and policies within the Trust. The Principal Street Short Term Municipal Fund (the “Short Term Fund”) is a non-diversified series with its own investment objectives and policies within the Trust. Each series is considered a “Fund” and collectively, the “Funds”. Prior to October 15, 2019, the High Income Fund was known as the Green Square High Income Municipal Fund. The investment objective of both Funds is to provide current income exempt from regular federal income tax. The Funds are investment companies and accordingly follow the investment company accounting and reporting guidance of the Financial Accounting Standards Board (“FASB”) Accounting Standards Codification Topic 946, Financial Services – Investment Companies. The High Income Fund currently offers three classes of shares for purchase. The High Income Fund’s Institutional Class commenced operations on September 15, 2017, the Investor Class commenced operations on March 23, 2020, and the A Class commenced operations on February 16, 2022. The Short Term Fund commenced operations on April 27, 2022 and currently offers two classes of shares, Institutional Class and Investor Class. Each class of shares for the Funds has identical rights and privileges except with respect to 12b-1 fees and voting rights on matters affecting a single share class. For the High Income Fund, the Investor Class and A Class shares are subject to a 0.50% and 0.25% Rule 12b-1 distribution and servicing fee, respectively. For the Short Term Fund, the Investor Class shares are subject to a 0.25% Rule 12b-1 distribution and servicing fee. The Funds may issue an unlimited number of shares of beneficial interest, with no par value.
2. SIGNIFICANT ACCOUNTING POLICIES
The following is a summary of significant accounting policies consistently followed by the Funds in preparation of its financial statements. These policies are in conformity with generally accepted accounting principles in the United States of America (“GAAP”).
Security Valuation – All investments in securities are recorded at their estimated fair value, as described in Note 3.
Federal Income Taxes – The Funds comply with the requirements of subchapter M of the Internal Revenue Code of 1986, as amended, necessary to qualify as a regulated investment companies and distribute substantially all net taxable investment income and net realized gains to shareholders in a manner which results in no tax cost to the Funds. Therefore, no federal income or excise tax provision is required. As of and during the period ended February 29, 2024, the Funds did not have any tax positions that did not meet the “more-likely-than-not” threshold of being sustained by the applicable tax authority. The Funds recognize interest and penalties, if any, related to unrecognized tax benefits on uncertain tax positions as income tax expense in the Statement of Operations. As of and during the period ended February 29, 2024, the Funds did not incur any interest or penalties. The High Income Fund is not subject to examination by U.S. tax authorities for tax years prior to the year ended August 31, 2020. The Short Term fund is not subject to examination by U.S. Tax Authorities prior to the year ended August 31, 2022.
Security Transactions, Income, and Distributions – The Funds follow industry practice and record security transactions on the trade date. Realized gains and losses on sales of securities are calculated on the basis of identified cost. Dividend income is recorded on the ex-dividend date and interest income is recorded on an accrual basis. Withholding taxes on foreign dividends have been provided for in accordance with the Funds’ understanding of the applicable country’s tax rules and regulations. Discounts and premiums on securities purchased are amortized over the expected life of the respective securities using the constant yield method.
39
PRINCIPAL STREET FUNDS
Notes to the Financial Statements (Unaudited) – Continued
February 29, 2024
The Funds will declare daily and pay monthly distributions of net investment income. The Funds will also distribute net realized capital gains, if any, at least annually. Distributions to shareholders are recorded on the ex-dividend date. The treatment for financial reporting purposes of distributions made to shareholders during the year from net investment income or net realized capital gains may differ from their ultimate treatment for federal income tax purposes. These differences are caused primarily by differences in the timing of the recognition of certain components of income, expense or realized capital gain for federal income tax purposes. Where such differences are permanent in nature, GAAP requires that they be reclassified in the components of the net assets based on their ultimate characterization for federal income tax purposes. Any such reclassifications will have no effect on net assets, results of operations or net asset values per share of the Funds.
Allocation of Expenses — Income, expenses (other than those deemed attributable to a specific share class), and gains and losses of the Funds are allocated daily to each class of shares based upon the ratio of net assets represented by each class as a percentage of the net assets of the Funds. Expenses deemed directly attributable to a class of shares are recorded by the specific class. Most Fund expenses are allocated by class based on relative net assets. For the High Income Fund, 12b-1 fees are expensed at annual rates of 0.50% and 0.25% of average daily net assets of the Investor Class and A Class shares, respectively (See Note 5). For the Short Term Fund, 12b-1 fees are expensed at an annual rate 0.25% of average daily net assets of the Investor Class (See Note 5). Expenses associated with a specific fund in the Trust are charged to that fund. Common Trust expenses are typically allocated evenly between the funds of the Trust, or by other equitable means.
Use of Estimates – The preparation of financial statements in conformity with GAAP requires management to make estimates and assumptions that affect the reported amounts of assets and liabilities and disclosure of contingent assets and liabilities at the date of the financial statements and the reported amounts of revenues and expenses during the reporting period. Actual results could differ from those estimates.
3. SECURITIES VALUATION
The Funds have adopted authoritative fair value accounting standards which establish an authoritative definition of fair value and set out a hierarchy for measuring fair value. These standards require additional disclosures about the various inputs and valuation techniques used to develop the measurements of fair value, a discussion of changes in valuation techniques and related inputs during the period and expanded disclosure of valuation Levels for major security types. These inputs are summarized in the three broad Levels listed below:
| Level 1 – | Unadjusted quoted prices in active markets for identical assets or liabilities that the Funds have the ability to access. |
| Level 2 – | Observable inputs other than quoted prices included in Level 1 that are observable for the asset or liability, either directly or indirectly. These inputs may include quoted prices for the identical instrument on an inactive market, prices for similar instruments, interest rates, prepayment speeds, credit risk, yield curves, default rates and similar data. |
| Level 3 – | Unobservable inputs for the asset or liability, to the extent relevant observable inputs are not available, representing the Funds’ own assumptions about the assumptions a market participant would use in valuing the asset or liability and would be based on the best information available. |
Following is a description of the valuation techniques applied to the Funds’ major categories of assets and liabilities measured at fair value on a recurring basis. The Funds’ investments are carried at fair value.
40
PRINCIPAL STREET FUNDS
Notes to the Financial Statements (Unaudited) – Continued
February 29, 2024
Short-Term Investments – Investments in other mutual funds, including money market funds, are valued at their net asset value per share. To the extent these securities are actively traded and valuation adjustments are not applied, they are categorized in Level 1 of the fair value hierarchy.
Fixed Income Securities – Municipal and corporate bonds are valued on the basis of valuations furnished by an independent pricing service which utilizes both dealer-supplied valuations and formula-based techniques. The pricing service may consider recently executed transactions in securities of the issuer or comparable issuer, market price quotations (where observable), bond spreads, and fundamental data relating to the issuer. Fixed income securities are categorized in the Level 2 of the fair value hierarchy.
The Board of Trustees (the “Board”) has adopted a pricing and valuation policy for use by the Funds and their Valuation Designee (as defined below) in calculating each Fund’s NAV. Pursuant to Rule 2a-5 under the 1940 Act, the Funds have designated Principal Street Partners, LLC. (the “Adviser”) as its “Valuation Designee” to perform all of the fair value determinations as well as to perform all of the responsibilities that may be performed by the Valuation Designee in accordance with Rule 2a-5. The Valuation Designee is authorized to make all necessary determinations of the fair values of portfolio securities and other assets for which market quotations are not readily available or if it is deemed the prices obtained from brokers, dealers or independent pricing services are unreliable.
The inputs or methodology used for valuing securities are not an indication of the risk associated with investing in those securities. The following is a summary of the inputs used to value the Funds’ securities as of February 29, 2024:
| High Income Fund | ||||||||||||||||
| Level 1 | Level 2 | Level 3 | Total | |||||||||||||
| Municipal Bonds | $ | — | $ | 255,056,790 | $ | 780,377 | $ | 255,837,167 | ||||||||
| Corporate Bonds | — | — | 41,067,411 | 41,067,411 | ||||||||||||
| Convertible Preferred Stock | — | — | 5,083,502 | 5,083,502 | ||||||||||||
| Short-Term Investment | 12,768,791 | — | — | 12,768,791 | ||||||||||||
| Total Investments in Securities* | $ | 12,768,791 | $ | 255,056,790 | $ | 46,931,290 | $ | 314,756,871 | ||||||||
| Short Term Fund | ||||||||||||||||
| Level 1 | Level 2 | Level 3 | Total | |||||||||||||
| Municipal Bonds | $ | — | $ | 55,245,967 | $ | — | $ | 55,245,967 | ||||||||
| Short-Term Investment | 1,021,715 | — | — | 1,021,715 | ||||||||||||
| Total Investments in Securities* | $ | 1,021,715 | $ | 55,245,967 | $ | — | $ | 56,267,682 | ||||||||
| * | Refer to the Schedule of Investments for further information on the classification of investments. |
41
PRINCIPAL STREET FUNDS
Notes to the Financial Statements (Unaudited) – Continued
February 29, 2024
The following is a reconciliation of Level 3 assets in the High Income Fund for which significant unobservable inputs were used to determine fair value:
| Investments | ||||
| in Securities | ||||
| Balance as of August 31, 2023 | $ | 33,360,652 | ||
| Accrued discounts/premiums | — | |||
| Realized gain (loss) | — | |||
| Change in net unrealized appreciation/depreciation | — | |||
| Net purchases | 13,570,638 | |||
| Transfers into and/or out of Level 3 | — | |||
| Balance as of February 29, 2024 | $ | 46,931,290 | ||
| Change in unrealized appreciation/depreciation during the | ||||
| period for Level 3 investments as of February 29, 2024 | $ | — | ||
The Level 3 investments as of February 29, 2024 for the High Income Fund represented 15.1% of the Fund’s net assets.
The following provides information regarding the valuation techniques, unobservable inputs used, and other information related to the fair value of Level 3 investments for the High Income Fund as of February 29, 2024:
| Security | Fair Value as of | Valuation | Unobservable | Weighted | |||||||||
| Security Description | Type | February 29, 2024 | Technique | Input* | Range | Average | |||||||
| CalPlant I, LLC, | Liquidation | ||||||||||||
| 9.50%, 08/21/2024 | Corporate Bond | $ | 3,000,000 | Approach | Recovery Rate | 100 | % | 100 | % | ||||
| CalPlant I, LLC, | Liquidation | ||||||||||||
| 15.00%, 07/01/2025 | Corporate Bond | 1,290,000 | Approach | Recovery Rate | 100 | % | 100 | % | |||||
| Convival Funding 2022 III, | Discounted | ||||||||||||
| 12.00%, 11/15/2056 | Corporate Bond | 5,273,738 | Cash Flow | Discount Rate | 11.4 | % | 100 | % | |||||
| LSC Estero Prime, | Refinance | ||||||||||||
| 12.00%, 04/30/2024 | Corporate Bond | 1,250,000 | Approach | Recovery Rate | 100 | % | 100 | % | |||||
| Next Renewable Fuels, | Convertible | Acquisition | |||||||||||
| Series A | Preferred Stock | 5,083,502 | Cost | Recovery Rate | 100 | % | 100 | % | |||||
| Sunland Medical | |||||||||||||
| Foundation, | Liquidation | ||||||||||||
| 12.00%, 02/29/2024 | Corporate Bond | 11,500,260 | Approach | Recovery Rate | 100 | % | 100 | % | |||||
| Sunland Medical | |||||||||||||
| Foundation, | Liquidation | ||||||||||||
| 12.00%, 10/20/2024 | Corporate Bond | 10,000,000 | Approach | Recovery Rate | 100 | % | 100 | % | |||||
| Sunland Medical | |||||||||||||
| Foundation, | Liquidation | ||||||||||||
| 7.38%, 04/30/2024 | Corporate Bond | 8,753,413 | Approach | Recovery Rate | 70.5 | % | 100 | % | |||||
| William G King, | Acquisition | ||||||||||||
| 12.00%, 10/01/2024 | Municipal Bond | 780,377 | Cost | Recovery Rate | 100 | % | 100 | % | |||||
| * | Significant increases and decreases in the unobservable inputs used to determine fair value of Level 3 assets could result in significantly higher or lower fair value measurements. An increase to the unobservable input would result in an increase to the fair value. A decrease to the unobservable input would have the opposite effect. |
42
PRINCIPAL STREET FUNDS
Notes to the Financial Statements (Unaudited) – Continued
February 29, 2024
4. INVESTMENT ADVISORY FEE AND OTHER TRANSACTIONS WITH AFFILIATES
The Trust has an agreement with the Adviser to furnish investment advisory services to the Funds. Pursuant to the Investment Advisory Agreement between the Trust and the Adviser, the Adviser is entitled to receive, on a monthly basis, an annual advisory fee equal to 0.55% and 0.45% of the High Income Fund and Short Term Fund average daily net assets, respectively.
The Funds’ Adviser has contractually agreed to reduce its management fees, and may reimburse the Funds for their operating expenses in order to ensure that Total Annual Fund Operating Expenses (excluding certain expenses such as Rule 12b-1 fees, taxes, leverage/borrowing interest, interest expense, dividends paid on short sales, brokerage commissions and other transactional expenses, acquired fund fees and expenses, or extraordinary expenses) for the Funds do not exceed 0.80% and 0.70% of the High Income Fund and Short Term Fund average daily net assets, respectively. Prior to February 15, 2023, the rate was 0.73% for the High Income Fund.
Fees waived and expenses reimbursed by the Adviser may be recouped by the Adviser for a period of thirty-six months following the month during which such waiver or reimbursement was made if such recoupment can be achieved without exceeding the expense limit in effect at the time the waiver or reimbursement occurred and at the time of recoupment. The Operating Expenses Limitation Agreement is indefinite in term but cannot be terminated within a year after the effective date of the Funds’ prospectuses. After that date, the agreement may be terminated at any time upon 60 days’ written notice by the Board or the Adviser. Total fee recoupment for the High Income Fund in the period ended February 29, 2024, was $15,297. The Short Term Fund did not recoup any fee waivers in the current fiscal year. Additional waived fees and reimbursed expenses subject to potential recovery by month of expiration for the Funds are as follows:
| High Income Fund | Short Term Fund | ||||||||||
| Expiration | Amount | Amount | |||||||||
| March 2024 – August 2024 | $ | 52,836 | $ | — | |||||||
| September 2024 – August 2025 | $ | 89,955 | $ | 128,142 | * | ||||||
| September 2025 – August 2026 | $ | 100,965 | $ | 198,611 | |||||||
| September 2026 – August 2027 | $ | 6,062 | $ | 100,986 | |||||||
| * | The potential recovery by month of expiration for this amount is April 2025 – August 2025. |
U.S. Bancorp Fund Services, LLC (the “Administrator”), doing business as U.S. Bank Global Fund Services, acts as the Funds’ Administrator, Transfer Agent, and Fund Accountant. U.S. Bank N.A. (the “Custodian”) serves as the Custodian to the Funds. The Custodian is an affiliate of the Administrator. The Administrator performs various administrative and accounting services for the Funds. The Administrator prepares various federal and state regulatory filings, reports and returns for the Funds; prepares reports and materials to be supplied to the Trustees; monitors the activities of the Custodian; coordinates the payment of the Funds’ expenses and reviews the Funds’ expense accruals. The officers of the Trust, including the Chief Compliance Officer, are employees of the Administrator. As compensation for its services, the Administrator is entitled to a monthly fee at an annual rate based upon the average daily net assets of the Funds, subject to annual minimums. Fees paid by the Funds for administration and accounting, transfer agency, custody and compliance services for the period ended February 29, 2024, are disclosed in the Statements of Operations.
43
PRINCIPAL STREET FUNDS
Notes to the Financial Statements (Unaudited) – Continued
February 29, 2024
5. DISTRIBUTION & SHAREHOLDER SERVICING FEES
The Funds have adopted a Distribution Plan pursuant to Rule 12b-1 (the “Plan”) in both the Investor Class and A Class. For the High Income Fund, the Plan permits the Fund to pay for distribution and related expenses at an annual rate of 0.50% and 0.25% of the Investor Class and A Class average daily net assets, respectively. For the Short Term Fund, the Plan permits the Fund to pay for distribution and related expenses at an annual rate of 0.25% of the Investor Class average daily net assets. The expenses covered by the Plan may include the cost of preparing and distributing prospectuses and other sales material, advertising and public relations expenses, payments to financial intermediaries and compensation of personnel involved in selling shares of the Funds. For the period ended February 29, 2024, the High Income Fund’s Investor and A Class incurred expenses of $90,209 and $8,118, respectively, pursuant to the Plan. For the period ended February 29, 2024, the Short Term Fund’s Investor Class incurred expenses of $9,995 pursuant to the Plan.
6. CAPITAL SHARE TRANSACTIONS
Transactions in shares of the Funds were as follows:
High Income Fund
| Period Ended | Year Ended | |||||||
| February 29, 2024 | August 31, 2023 | |||||||
| A Class: | ||||||||
| Shares sold | 298,265 | 753,758 | ||||||
| Shares issued to holders in reinvestment of distributions | 25,170 | 21,255 | ||||||
| Shares redeemed | (202,128 | ) | (15,644 | ) | ||||
| Net increase in A Class shares | 121,307 | 759,369 | ||||||
| Institutional Class: | ||||||||
| Shares sold | 14,022,674 | 17,435,877 | ||||||
| Shares issued to holders in reinvestment of distributions | 1,029,603 | 2,002,360 | ||||||
| Shares redeemed | (13,332,304 | ) | (20,581,450 | ) | ||||
| Net increase (decrease) in Institutional Class shares | 1,719,973 | (1,142,941 | ) | |||||
| Investor Class: | ||||||||
| Shares sold | 2,902,166 | 1,763,934 | ||||||
| Shares issued to holders in reinvestment of distributions | 67,809 | 76,413 | ||||||
| Shares redeemed | (1,113,593 | ) | (465,309 | ) | ||||
| Net increase in Investor Class shares | 1,856,382 | 1,375,038 | ||||||
| Net increase in capital shares | 3,697,662 | 991,466 | ||||||
44
PRINCIPAL STREET FUNDS
Notes to the Financial Statements (Unaudited) – Continued
February 29, 2024
Short Term Fund
| Period Ended | Year Ended | |||||||
| February 29, 2024 | August 31, 2023 | |||||||
| Institutional Class: | ||||||||
| Shares sold | 2,926,715 | 11,495,466 | ||||||
| Shares issued to holders in reinvestment of distributions | 210,330 | 396,536 | ||||||
| Shares redeemed | (5,039,379 | ) | (6,315,320 | ) | ||||
| Net increase (decrease) in Institutional Class shares | (1,902,334 | ) | 5,576,682 | |||||
| Investor Class: | ||||||||
| Shares sold | 2,683,652 | 23,930 | ||||||
| Shares issued to holders in reinvestment of distributions | 35,391 | 373 | ||||||
| Shares redeemed | (29,787 | ) | (587 | ) | ||||
| Net increase in Investor Class shares | 2,689,256 | 23,716 | ||||||
| Net increase in capital shares | 786,922 | 5,600,398 | ||||||
7. INVESTMENT TRANSACTIONS
The aggregate purchases and sales, excluding short-term investments, by the Funds for the period ended February 29, 2024, were as follows:
| High Income Fund | Short Term Fund | |||||||||||||||
| Purchases | Sales | Purchases | Sales | |||||||||||||
| U.S. Government Securities | $ | — | $ | — | $ | — | $ | — | ||||||||
| Other Securities | $ | 36,246,247 | $ | 22,813,041 | $ | 23,420,615 | $ | 20,009,941 | ||||||||
8. FEDERAL TAX INFORMATION
The aggregate gross unrealized appreciation and depreciation of securities held by the Funds and the total cost of securities for federal income tax purposes at August 31, 2023, were as follows:
| Aggregate | Aggregate | Net Unrealized | Federal | |||||||||||||
| Gross | Gross | Appreciation | Income | |||||||||||||
| Appreciation | Depreciation | (Depreciation) | Tax Cost | |||||||||||||
| High Income Fund | $ | 2,798,699 | $ | (63,623,379 | ) | $ | (60,824,680 | ) | $ | 330,470,450 | ||||||
| Short Term Fund | $ | 153,315 | $ | (203,279 | ) | $ | (49,964 | ) | $ | 52,860,588 | ||||||
Any difference between book-basis and tax-basis unrealized appreciation (depreciation) would be attributable primarily to the tax deferral of losses on wash sales.
At August 31, 2023, components of distributable earnings on a tax-basis were as follows:
| Undistributed | Undistributed | Other | Net Unrealized | |||||||||||||||||
| Ordinary | Long-Term | Accumulated | Appreciation | Total | ||||||||||||||||
| Income | Capital Gains | Losses | (Depreciation) | Accumulated Loss | ||||||||||||||||
| High Income Fund | $ | — | $ | — | $ | (27,923,002 | ) | $ | (60,824,680 | ) | $ | (88,747,682 | ) | |||||||
| Short Term Fund | $ | 72,583 | $ | — | $ | (402,106 | ) | $ | (49,964 | ) | $ | (379,487 | ) | |||||||
45
PRINCIPAL STREET FUNDS
Notes to the Financial Statements (Unaudited) – Continued
February 29, 2024
As of August 31, 2023, the High Income Fund and Short Term Fund had long-term capital loss carryovers of $19,431,618 and $32,572, respectively, and short-term capital loss carryovers of $8,375,150 and $367,948 respectively. A regulated investment company may elect for any taxable year to treat any portion of any qualified late year loss as arising on the first day of the next taxable year. Qualified late year losses are certain capital, and ordinary losses which occur during the portion of a Fund’s taxable year subsequent to October 31 and December 31, respectively. For the taxable period ended August 31, 2023, the Funds did not defer any qualified late year losses.
The tax character of distributions paid for the period ended February 29, 2024, were as follows:
| Ordinary | Tax Exempt | Long Term | ||||||||||||||
| Income* | Income | Capital Gains | Total | |||||||||||||
| High Income Fund | $ | — | $ | 8,668,030 | $ | — | $ | 8,668,030 | ||||||||
| Short Term Fund | $ | — | $ | 1,046,061 | $ | — | $ | 1,046,061 | ||||||||
The tax character of distributions paid for the year ended August 31, 2023, were as follows:
| Ordinary | Tax Exempt | Long Term | ||||||||||||||
| Income* | Income | Capital Gains | Total | |||||||||||||
| High Income Fund | $ | 1,978,091 | $ | 14,987,968 | $ | — | $ | 16,966,059 | ||||||||
| Short Term Fund | $ | 72,132 | $ | 1,617,673 | $ | — | $ | 1,689,805 | ||||||||
| * | For federal income tax purposes, distributions of short-term capital gains are treated as ordinary income distributions. |
9. LINE OF CREDIT
The High Income Fund has established a secured line of credit (“LOC”) in the amount of $30,000,000, 10% of gross market value of the Fund, or 33.33% of the gross market value of the Fund’s unencumbered assets, whichever is less. The LOC matures unless renewed on July 19, 2024. This LOC is intended for investment purposes. The LOC is with the Custodian. Interest is charged at the prime rate minus 1.50% on any used portion of the LOC, which was 7.00% as of February 29, 2024. The interest rate during the period was 7.00%. The weighted average interest rate paid on outstanding borrowings during the period for the High Income Fund was 7.00%. Interest is also charged at 0.25% on any unused portion of this LOC. All securities for the High Income Fund have been pledged as collateral at February 29, 2024.
The High Income Fund has established an unsecured line of credit (“LOC”) in the amount of $30,000,000, 15% of gross market value of the Fund, or 33.33% of the market value of the Fund’s unencumbered assets, whichever is less. The LOC matures unless renewed on July 19, 2024. This LOC is intended to provide short-term financing, if necessary, subject to certain restrictions and covenants in connection with shareholder redemptions and other short-term liquidity needs of the Fund. The LOC is with the Custodian. Interest is charged at the prime rate which was 8.50% as of February 29, 2024. The interest rate during the period was 8.50%. For the period ended February 29, 2024, the Fund did not have any borrowings under this LOC.
The Short Term Fund has established an unsecured line of credit (“LOC”) in the amount of $10,000,000, 10% of gross market value of the Fund, or 33.33% of the fair value of the Fund’s unencumbered assets, whichever is less. The LOC matures unless renewed on July 19, 2024. This LOC is intended to provide short-term financing, if necessary, subject to certain restrictions and covenants in connection with shareholder redemptions and other short-term liquidity needs of the Fund. The LOC is with the Custodian. Interest is charged at the prime rate which was 8.50% as of February 29, 2024. The interest rate during the period was 8.50%. The weighted average interest rate paid on outstanding borrowings during the period for the Fund was 8.50%.
46
PRINCIPAL STREET FUNDS
Notes to the Financial Statements (Unaudited) – Continued
February 29, 2024
The Funds have authorized the Custodian to charge any of the Funds’ accounts for any missed payments. For the period ended, February 29, 2024, LOC activity for the Funds was as follows:
| Amount | ||||||||||||||||||||
| Outstanding | Date of | |||||||||||||||||||
| Average | as of | Interest | Maximum | Maximum | ||||||||||||||||
| Fund | Loan Type | LOC Agent | Borrowings | February 29, 2024 | Expense | Borrowing | Borrowing | |||||||||||||
| High Income | Secured | U.S. Bank N.A. | $ | 2,897,841 | $ | — | $ | 136,820 | $ | 15,836,000 | 11/09/2023 | |||||||||
| High Income | Unsecured | U.S. Bank N.A. | $ | — | $ | — | $ | — | $ | — | N/A | |||||||||
| Short Term | Unsecured | U.S. Bank N.A. | $ | 95,110 | $ | — | $ | 4,087 | $ | 1,807,000 | 10/12/2023 | |||||||||
10. REPROCESSING OF SHAREHOLDER TRADES
It was determined that several of the High Income Fund’s securities were mispriced for the period January 25, 2023 through October 27, 2023 resulting in an overstatement of the Fund’s net assets and net asset value (NAV) per share for each class. Since the amount of the overstatement was concluded to be material, the Fund’s daily net assets and NAV per share were revised for the period shareholder transactions were reprocessed. As a result of reprocessing shareholder trades, the Fund incurred a loss of $853,716. The Fund’s Adviser is reimbursing the Fund for these losses. The amount remaining to be reimbursed is shown as a receivable on the Fund’s Statement of Assets and Liabilities.
11. CONTROL OWNERSHIP
The beneficial ownership, either directly or indirectly, of more than 25% of the voting securities of a fund creates a presumption of control of that fund, under Section 2(a)(9) of the Investment Company Act of 1940. As of February 29, 2024, Charles Schwab & Co., Inc. and National Financial Services LLC, for the benefit of their customers, owned 38.02% and 34.77% of the outstanding shares of the High Income Fund, respectively. As of February 29, 2024 National Financial Services LLC and Charles Schwab & Co., Inc., for the benefit of their customers, owned 43.30% and 54.67% of the outstanding shares of the Short Term Fund, respectively.
47
PRINCIPAL STREET FUNDS
Additional Information (Unaudited)
February 29, 2024
APPROVAL OF INVESTMENT ADVISORY AGREEMENT
At the regular meeting of the Board of Trustees of Managed Portfolio Series (“Trust”) on February 21-22, 2024, the Trust’s Board of Trustees (“Board”), each of whom was present in person, including all of the Trustees who are not “interested persons” of the Trust, as that term is defined in Section 2(a)(19) of the Investment Company Act of 1940, as amended (“Independent Trustees”), considered and approved the continuation of the Investment Advisory Agreement between the Trust and Principal Street Partners, LLC (“Principal Street” or the “Adviser”) regarding the Principal Street High Income Municipal Fund and the Principal Street Short Term Municipal Fund (each a “Fund” or collectively, the “Funds”) (the “Investment Advisory Agreement”) for another annual term.
Prior to the meeting and at a meeting held on January 4, 2024, the Trustees received and considered information from Principal Street and the Trust’s administrator designed to provide the Trustees with the information necessary to evaluate the continuance of the Investment Advisory Agreement (“Support Materials”). Before voting to approve the continuance of the Investment Advisory Agreement, the Trustees reviewed the Support Materials with Trust management and with counsel to the Independent Trustees, and received a memorandum and advice from such counsel discussing the legal standards for the Trustees’ consideration of the renewal of the Investment Advisory Agreement. This information, together with the information provided to the Board throughout the course of the year, formed the primary (but not exclusive) basis for the Board’s determinations.
In determining whether to continue the Investment Advisory Agreement, the Trustees considered all factors they believed relevant, including the following with respect to each Fund: (1) the nature, extent, and quality of the services provided by Principal Street with respect to the Fund; (2) the Fund’s historical performance and the performance of other investment accounts managed by Principal Street, as applicable; (3) the costs of the services provided and the profits realized by Principal Street, from services rendered to the Fund; (4) comparative fee and expense data for the Fund and other investment companies with similar investment objectives; (5) the extent to which economies of scale may be realized as the Fund grows, and whether the advisory fee for the Fund reflects such economies of scale for the Fund’s benefit; and (6) other benefits to Principal Street resulting from its relationship with the Fund. In their deliberations, the Trustees weighed to varying degrees the importance of the information provided to them, did not identify any particular information that was all-important or controlling, and considered the information and made its determinations for each Fund separately and independently of the other Fund.
Based upon the information provided to the Board throughout the course of the year, including a presentation to the Board by representatives from Principal Street, and the Support Materials, the Board concluded that the overall arrangements between the Trust and Principal Street as set forth in the Investment Advisory Agreement, as it relates to each Fund, continue to be fair and reasonable in light of the services that Principal Street performs, the investment advisory fees that each Fund pays, and such other matters as the Trustees considered relevant in the exercise of their reasonable business judgment. The material factors and conclusions that formed the basis of the Trustees’ determination to approve the continuation of the Investment Advisory Agreement, as it relates to each Fund, are summarized below.
Nature, Extent and Quality of Services Provided. The Trustees considered the scope of services that Principal Street provides under the Investment Advisory Agreement with respect to each Fund, noting that such services include, but are not limited to, the following: (1) investing the Fund’s assets consistent with the Fund’s investment objective and investment policies; (2) determining the portfolio securities to be purchased, sold, or otherwise disposed of and the timing of such transactions; (3) voting all proxies, if any, with respect to the Fund’s portfolio securities; (4) maintaining the required books and records for transactions effected by Principal Street on behalf of the Fund; (5) selecting broker-dealers to execute orders on behalf of the Fund; and (6) monitoring and maintaining the Fund’s
48
PRINCIPAL STREET FUNDS
Additional Information (Unaudited) – Continued
February 29, 2024
compliance with the Trust’s policies and procedures and with applicable securities laws. The Trustees noted the significant experience and expertise of the portfolio managers that Principal Street utilizes in managing each Fund’s assets, as well as Principal Street’s constructive response to compliance matters. The Trustees reviewed Principal Street’s financials, assets under management and capitalization. In that regard, the Trustees concluded that Principal Street had sufficient resources to support the management of each Fund. The Trustees concluded that they were satisfied with the nature, extent, and quality of services that Principal Street provides to each Fund under the Investment Advisory Agreement.
Fund Historical Performance and the Overall Performance of Principal Street. In assessing the quality of the portfolio management delivered by Principal Street, the Trustees reviewed the short-term and long-term performance of each Fund on both an absolute basis and in comparison to the Fund’s Morningstar category (“Category”) as well as a smaller sub-set of peer funds (“Cohort”), and an appropriate benchmark index. When comparing each Fund’s performance against its Category and Cohort, the Trustees took into account that the investment objective and strategies of the Fund, as well as the Fund’s level of risk tolerance, may differ significantly from the funds in the Category and Cohort. The Trustees noted that Principal Street manages other accounts with a somewhat similar strategy as the Principal Street High Income Municipal Fund, but that there are enough differences between these accounts and the Fund for a performance comparison to be meaningful.
| • | Principal Street High Income Municipal Fund. The Trustees noted that the Fund had outperformed the Category and Cohort averages over the year-to-date and one-year periods ended September 30, 2023, as well as the Category average over the three-year period ended September 30, 2023, while underperforming the Cohort average over the three-year period and the Category and Cohort averages over the five-year period, in each case as of September 30, 2023. The Trustees also noted that the Fund had underperformed its benchmark index over all periods presented as of September 30, 2023. | |
| • | Principal Street Short Term Municipal Fund. The Trustees noted that the Fund had outperformed the Category and Cohort averages as well as its benchmark index for all periods presented as of September 30, 2023. |
Cost of Advisory Services and Profitability. The Trustees considered the management fee that each Fund pays to Principal Street under the Investment Advisory Agreement, as well as Principal Street’s profitability analysis for services rendered to each Fund during the 12 months ending September 30, 2023. The Trustees also considered the effect of an expense limitation agreement on Principal Street’s compensation and that Principal Street has contractually agreed to reduce its advisory fees and, if necessary, reimburse each Fund for operating expenses, as specified in the Funds’ prospectus. In that regard, the Trustees noted that Principal Street waived a portion of its management fees for each Fund during its most recent fiscal year. The Trustees noted that the management fees charged to Principal Street’s separately managed accounts are equal to or greater than the management fee charged by Principal Street to the Funds. The Trustees considered the reasonableness of Principal Street’s profits from its service relationship with the Funds, noting that the service relationship with the Principal Street Short Term Municipal Fund has not been profitable for the 12-month period ended September 30, 2023.
Comparative Fee and Expense Data. The Trustees considered a comparative analysis of the contractual expenses borne by each Fund and those of funds in the same Category and Cohort.
| • | Principal Street High Income Municipal Fund. The Trustees noted that the Fund’s management fee and total expenses (after waivers and expense reimbursements) were each higher than the Category and Cohort averages. In connection with their review of the management fee, the Board considered the research-intensive nature of |
49
PRINCIPAL STREET FUNDS
Additional Information (Unaudited) – Continued
February 29, 2024
| the Fund’s investment strategy. While recognizing that it is difficult to compare advisory fees because the scope of advisory services provided may vary from one investment adviser to another, the Trustees concluded that Principal Street’s advisory fee is reasonable. | ||
| • | Principal Street Short Term Municipal Fund. The Trustees noted that the Fund’s management fee and total expenses (after waivers and expense reimbursements) were each higher than the Category and Cohort averages. In connection with their review of the management fee, the Board considered the research-intensive nature of the Fund’s investment strategy. The Trustees further took into account that the average net assets of the funds comprising the Cohort were significantly higher than the assets of the Fund. While recognizing that it is difficult to compare advisory fees because the scope of advisory services provided may vary from one investment adviser to another, the Trustees concluded that Principal Street’s advisory fee is reasonable. |
Economies of Scale. The Trustees considered whether the Funds would benefit from any economies of scale, noting that the investment advisory fee for each Fund does not contain breakpoints. The Trustees noted that Principal Street had agreed to consider breakpoints in the future in response to asset growth in the Funds and determined to revisit the issue in the future as circumstances change and Fund asset levels increase.
Other Benefits. The Trustees considered the direct and indirect benefits that could be realized by Principal Street from its relationship with the Funds. The Trustees noted that Principal Street does not use affiliated brokers to execute the Funds’ portfolio transactions. While the Trustees noted that each Fund utilizes Rule 12b-1 fees to pay for shareholder and distribution services related to Investor Class and A Class shareholders of the Funds, as applicable, the Trustees also observed that Principal Street was incurring its own distribution expenses on behalf of the Funds. The Trustees considered that Principal Street may receive some form of reputational benefit from services rendered to the Funds, but that such benefits are immaterial and cannot otherwise be quantified. The Trustees concluded that Principal Street does not receive additional material benefits from its relationship with the Funds.
50
PRINCIPAL STREET FUNDS
Additional Information (Unaudited) – Continued
February 29, 2024
AVAILABILITY OF FUND PORTFOLIO INFORMATION
The Funds file complete schedules of portfolio holdings with the SEC for the first and third quarters of each fiscal year on Part F of Form N-PORT. The Funds’ Part F of Form N-PORT is available on the SEC’s website at https://www.sec.gov/ and may be reviewed and copied at the SEC’s Public Reference Room in Washington, D.C. For information on the Public Reference Room call 1-800-SEC-0330. In addition, the Funds’ Part F of Form N-PORT is available without charge upon request by calling 1-877-914-7343.
AVAILABILITY OF PROXY VOTING INFORMATION
A description of the Funds’ Proxy Voting Policies and Procedures is available without charge, upon request, by calling 1-877-914-7343. Information regarding how the Fund voted proxies relating to portfolio securities during the most recent 12 month period ended June 30, is available (1) without charge, upon request, by calling 1-877-914-7343, or (2) on the SEC’s website at https://www.sec.gov/.
51
PRINCIPAL STREET FUNDS
Privacy Notice (Unaudited)
The Funds collect only relevant information about you that the law allows or requires it to have in order to conduct its business and properly service you. The Funds collect financial and personal information about you (“Personal Information”) directly (e.g., information on account applications and other forms, such as your name, address, and social security number, and information provided to access account information or conduct account transactions online, such as password, account number, e-mail address, and alternate telephone number), and indirectly (e.g., information about your transactions with us, such as transaction amounts, account balance and account holdings).
The Funds do not disclose any non-public personal information about its shareholders or former shareholders other than for everyday business purposes such as to process a transaction, service an account, respond to court orders and legal investigations or as otherwise permitted by law. Third parties that may receive this information include companies that provide transfer agency, technology and administrative services to the Funds, as well as the Funds’ investment adviser who is an affiliate of the Funds. If you maintain a retirement/educational custodial account directly with the Funds, we may also disclose your Personal Information to the custodian for that account for shareholder servicing purposes. The Funds limit access to your Personal Information provided to unaffiliated third parties to information necessary to carry out their assigned responsibilities to the Funds. All shareholder records will be disposed of in accordance with applicable law. The Funds maintain physical, electronic and procedural safeguards to protect your Personal Information and requires its third-party service providers with access to such information to treat your Personal Information with the same high degree of confidentiality.
In the event that you hold shares of the Funds through a financial intermediary, including, but not limited to, a broker-dealer, credit union, bank or trust company, the privacy policy of your financial intermediary governs how your non-public personal information is shared with unaffiliated third parties.
52
(This Page Intentionally Left Blank.)
INVESTMENT ADVISER
Principal Street Partners, LLC
949 South Shady Grove Road, Suite 402
Memphis, TN 38120
DISTRIBUTOR
Quasar Distributors, LLC
111 East Kilbourn Avenue, Suite 2200
Milwaukee, WI 53202
CUSTODIAN
U.S. Bank N.A.
1555 North Rivercenter Drive, Suite 302
Milwaukee, WI 53212
ADMINISTRATOR, FUND ACCOUNTANT
AND TRANSFER AGENT
U.S. Bancorp Fund Services, LLC
615 East Michigan Street
Milwaukee, WI 53202
INDEPENDENT REGISTERED PUBLIC ACCOUNTING FIRM
Cohen & Company, Ltd.
342 North Water Street, Suite 830
Milwaukee, WI 53202
LEGAL COUNSEL
Stradley Ronon Stevens & Young, LLP
2005 Market Street, Suite 2600
Philadelphia, PA 19103
This report should be accompanied or preceded by a prospectus.
The Funds’ Statements of Additional Information contain additional information about the
Funds’ trustees and is available without charge upon request by calling 1-877-914-7343.
| (b) | Not applicable. |
Item 2. Code of Ethics.
Not applicable for semi – annual reports.
Item 3. Audit Committee Financial Expert.
Not applicable for semi – annual reports.
Item 4. Principal Accountant Fees and Services.
Not applicable for semi – annual reports.
Item 5. Audit Committee of Listed Registrants.
Not applicable to Registrants who are not listed issuers (as defined in Rule 10A-3 under the Securities Exchange Act of 1934).
Item 6. Schedule of Investments.
(a) Schedule of Investments is included as part of the report to shareholders filed under Item 1 of this Form.
(b) Not applicable.
Item 7. Disclosure of Proxy Voting Policies and Procedures for Closed-End Management Investment Companies.
Not applicable to open-end investment companies.
Item 8. Portfolio Managers of Closed-End Management Investment Companies.
Not applicable to open-end investment companies.
Item 9. Purchases of Equity Securities by Closed‑End Management Investment Company and Affiliated Purchases.
Not applicable to open-end investment companies.
Item 10. Submission of Matters to a Vote of Security Holders.
There have been no material changes to the procedures by which shareholders may recommend nominees to the Registrant’s Board of Trustees.
Item 11. Controls and Procedures.
| (a) | The Registrant’s President and Treasurer have reviewed the Registrant's disclosure controls and procedures (as defined in Rule 30a-3(c) under the Investment Company Act of 1940 (the “Act”)) as of a date within 90 days of the filing of this report, as required by Rule 30a-3(b) under the Act and Rules 13a-15(b) or 15d‑15(b) under the Securities Exchange Act of 1934. Based on their review, such officers have concluded that the disclosure controls and procedures are effective in ensuring that information required to be disclosed in this report is appropriately recorded, processed, summarized and reported and made known to them by others within the Registrant and by the Registrant’s service provider. |
| (b) | There were no significant changes in the Registrant's internal control over financial reporting (as defined in Rule 30a-3(d) under the Act) that occurred during the period covered by this report that has materially affected, or is reasonably likely to materially affect, the Registrant's internal control over financial reporting. |
Item 12. Disclosure of Securities Lending Activities for Closed-End Management Investment Companies
Not applicable to open-end investment companies.
Item 13. Exhibits.
| (a) | (1) Any code of ethics or amendment thereto, that is subject of the disclosure required by Item 2, to the extent that the Registrant intends to satisfy Item 2 requirements through filing an exhibit. Not applicable for semi-annual reports. |
(3) Any written solicitation to purchase securities under Rule 23c‑1 under the Act sent or given during the period covered by the report by or on behalf of the Registrant to 10 or more persons. Not applicable to open-end investment companies.
(4) Change in the Registrant’s independent public accountant. There was no change in the Registrant’s independent public accountant for the period covered by this report.
SIGNATURES
Pursuant to the requirements of the Securities Exchange Act of 1934 and the Investment Company Act of 1940, the Registrant has duly caused this report to be signed on its behalf by the undersigned, thereunto duly authorized.
(Registrant) Managed Portfolio Series
By (Signature and Title) /s/Brian R. Wiedmeyer
Brian R. Wiedmeyer, President
Date May 7, 2024
Pursuant to the requirements of the Securities Exchange Act of 1934 and the Investment Company Act of 1940, this report has been signed below by the following persons on behalf of the Registrant and in the capacities and on the dates indicated.
By (Signature and Title) /s/Brian R. Wiedmeyer
Brian R. Wiedmeyer, President
Date May 7, 2024
By (Signature and Title) /s/Benjamin J. Eirich
Benjamin J. Eirich, Treasurer
Date May 7, 2024