UNITED STATES
SECURITIES AND EXCHANGE COMMISSION
Washington, D.C. 20549
FORM N-CSR
CERTIFIED SHAREHOLDER REPORT OF REGISTERED
MANAGEMENT INVESTMENT COMPANIES
Investment Company Act file number 811-22525
Managed Portfolio Series
(Exact name of registrant as specified in charter)
615 East Michigan Street
Milwaukee, WI 53202
(Address of principal executive offices) (Zip code)
Brian Wiedmeyer, President
Managed Portfolio Series
c/o U.S. Bank Global Fund Services
777 East Wisconsin Ave., 6th Floor
Milwaukee, WI 53202
(Name and address of agent for service)
(414) 516-1712
Registrant’s telephone number, including area code
Date of fiscal year end: 11/30/2024
Date of reporting period: 05/31/2024
Item 1. Reports to Stockholders.
| | |
| Tortoise Energy Infrastructure Total Return Fund | |
| Class A | TORTX |
| Semi-Annual Shareholder Report | May 31, 2024 |
This semi-annual shareholder report contains important information about the Tortoise Energy Infrastructure Total Return Fund for the period of December 1, 2023, to May 31, 2024. You can find additional information about the Fund at https://etp.tortoiseadvisors.com/resource-center/fund-documents/. You can also request this information by contacting us at
1-913-981-1020 or info@tortoiseadvisors.com.
This report describes changes to the Fund that occurred during the reporting period.
WHAT WERE THE FUND COSTS FOR THE LAST SIX MONTHS? (based on a hypothetical $10,000 investment)
| | |
Class Name | Costs of a $10,000 investment | Costs paid as a percentage of a $10,000 investment |
| Class A | $63 | 1.18% |
KEY FUND STATISTICS (as of May 31, 2024)
| |
Net Assets | $2,499,678,888 |
Number of Holdings | 29 |
Portfolio Turnover | 10% |
Visit https://etp.tortoiseadvisors.com/resource-center/fund-documents/ for more recent performance information.
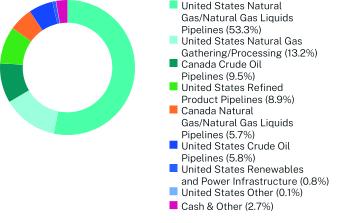
WHAT DID THE FUND INVEST IN? (as of May 31, 2024)
| |
Top 10 Issuers | (%)* |
Targa Resources Corp. | 11.1% |
Cheniere Energy, Inc. | 8.5% |
The Williams Companies, Inc. | 7.8% |
ONEOK, Inc. | 7.6% |
MPLX LP | 7.6% |
Energy Transfer LP | 7.2% |
Kinder Morgan, Inc. | 4.8% |
Plains GP Holdings L.P. | 4.9% |
Pembina Pipeline Corporation | 4.8% |
Enbridge, Inc. | 4.7% |
| * | Percentages are listed as a % of net assets. |
| Tortoise Energy Infrastructure Total Return Fund | PAGE 1 | TSR_SAR_56166Y305 |
Managed Distributions
The Fund may distribute more than its income and net realized capital gains; therefore, a portion of distributions may be a return of capital. A return of capital may occur, for example, when some or all of the money a shareholder has invested in the Fund is paid back to the shareholder. A return of capital distribution does not necessarily reflect the Fund’s investment performance and should not be confused with “yield” or “income.”
For additional information about the Fund; including its prospectus, financial information, holdings and proxy information, scan the QR code or visit https://etp.tortoiseadvisors.com/resource-center/fund-documents/
The Tortoise Energy Infrastructure Total Return Fund is distributed by Quasar Distributors, LLC.
HOUSEHOLDING
To reduce Fund expenses, only one copy of most shareholder documents may be mailed to shareholders with multiple accounts at the same address (Householding). If you would prefer that your Tortoise Capital Advisors, LLC documents not be householded, please contact Tortoise Capital Advisors, LLC at 1-913-981-1020, or contact your financial intermediary. Your instructions will typically be effective within 30 days of receipt by Tortoise Capital Advisors, LLC or your financial intermediary.
| Tortoise Energy Infrastructure Total Return Fund | PAGE 2 | TSR_SAR_56166Y305 |
53.313.29.58.95.75.80.80.12.7
| | |
| Tortoise Energy Infrastructure Total Return Fund | |
| Class C | TORCX |
| Semi-Annual Shareholder Report | May 31, 2024 |
This semi-annual shareholder report contains important information about the Tortoise Energy Infrastructure Total Return Fund for the period of December 1, 2023, to May 31, 2024. You can find additional information about the Fund at https://etp.tortoiseadvisors.com/resource-center/fund-documents/. You can also request this information by contacting us at
1-913-981-1020 or info@tortoiseadvisors.com.
This report describes changes to the Fund that occurred during the reporting period.
WHAT WERE THE FUND COSTS FOR THE LAST SIX MONTHS? (based on a hypothetical $10,000 investment)
| | |
Class Name | Costs of a $10,000 investment | Costs paid as a percentage of a $10,000 investment |
| Class C | $102 | 1.92% |
KEY FUND STATISTICS (as of May 31, 2024)
| |
Net Assets | $2,499,678,888 |
Number of Holdings | 29 |
Portfolio Turnover | 10% |
Visit https://etp.tortoiseadvisors.com/resource-center/fund-documents/ for more recent performance information.
WHAT DID THE FUND INVEST IN? (as of May 31, 2024)
| |
Top 10 Issuers | (%)* |
Targa Resources Corp. | 11.1% |
Cheniere Energy, Inc. | 8.5% |
The Williams Companies, Inc. | 7.8% |
ONEOK, Inc. | 7.6% |
MPLX LP | 7.6% |
Energy Transfer LP | 7.2% |
Kinder Morgan, Inc. | 4.8% |
Plains GP Holdings L.P. | 4.9% |
Pembina Pipeline Corporation | 4.8% |
Enbridge, Inc. | 4.7% |
| * | Percentages are listed as a % of net assets. |
| Tortoise Energy Infrastructure Total Return Fund | PAGE 1 | TSR_SAR_56166Y826 |
Managed Distributions
The Fund may distribute more than its income and net realized capital gains; therefore, a portion of distributions may be a return of capital. A return of capital may occur, for example, when some or all of the money a shareholder has invested in the Fund is paid back to the shareholder. A return of capital distribution does not necessarily reflect the Fund’s investment performance and should not be confused with “yield” or “income.”
For additional information about the Fund; including its prospectus, financial information, holdings and proxy information, scan the QR code or visit https://etp.tortoiseadvisors.com/resource-center/fund-documents/
The Tortoise Energy Infrastructure Total Return Fund is distributed by Quasar Distributors, LLC.
HOUSEHOLDING
To reduce Fund expenses, only one copy of most shareholder documents may be mailed to shareholders with multiple accounts at the same address (Householding). If you would prefer that your Tortoise Capital Advisors, LLC documents not be householded, please contact Tortoise Capital Advisors, LLC at 1-913-981-1020, or contact your financial intermediary. Your instructions will typically be effective within 30 days of receipt by Tortoise Capital Advisors, LLC or your financial intermediary.
| Tortoise Energy Infrastructure Total Return Fund | PAGE 2 | TSR_SAR_56166Y826 |
53.313.29.58.95.75.80.80.12.7
| | |
| Tortoise Energy Infrastructure Total Return Fund | |
| Institutional Class | TORIX |
| Semi-Annual Shareholder Report | May 31, 2024 |
This semi-annual shareholder report contains important information about the Tortoise Energy Infrastructure Total Return Fund for the period of December 1, 2023, to May 31, 2024. You can find additional information about the Fund at https://etp.tortoiseadvisors.com/resource-center/fund-documents/. You can also request this information by contacting us at
1-913-981-1020 or info@tortoiseadvisors.com.
This report describes changes to the Fund that occurred during the reporting period.
WHAT WERE THE FUND COSTS FOR THE LAST SIX MONTHS? (based on a hypothetical $10,000 investment)
| | |
Class Name | Costs of a $10,000 investment | Costs paid as a percentage of a $10,000 investment |
| Institutional Class | $50 | 0.93% |
KEY FUND STATISTICS (as of May 31, 2024)
| |
Net Assets | $2,499,678,888 |
Number of Holdings | 29 |
Portfolio Turnover | 10% |
Visit https://etp.tortoiseadvisors.com/resource-center/fund-documents/ for more recent performance information.
WHAT DID THE FUND INVEST IN? (as of May 31, 2024)
| |
Top 10 Issuers | (%)* |
Targa Resources Corp. | 11.1% |
Cheniere Energy, Inc. | 8.5% |
The Williams Companies, Inc. | 7.8% |
ONEOK, Inc. | 7.6% |
MPLX LP | 7.6% |
Energy Transfer LP | 7.2% |
Kinder Morgan, Inc. | 4.8% |
Plains GP Holdings L.P. | 4.9% |
Pembina Pipeline Corporation | 4.8% |
Enbridge, Inc. | 4.7% |
| * | Percentages are listed as a % of net assets. |
| Tortoise Energy Infrastructure Total Return Fund | PAGE 1 | TSR_SAR_56166Y404 |
Managed Distributions
The Fund may distribute more than its income and net realized capital gains; therefore, a portion of distributions may be a return of capital. A return of capital may occur, for example, when some or all of the money a shareholder has invested in the Fund is paid back to the shareholder. A return of capital distribution does not necessarily reflect the Fund’s investment performance and should not be confused with “yield” or “income.”
For additional information about the Fund; including its prospectus, financial information, holdings and proxy information, scan the QR code or visit https://etp.tortoiseadvisors.com/resource-center/fund-documents/
The Tortoise Energy Infrastructure Total Return Fund is distributed by Quasar Distributors, LLC.
HOUSEHOLDING
To reduce Fund expenses, only one copy of most shareholder documents may be mailed to shareholders with multiple accounts at the same address (Householding). If you would prefer that your Tortoise Capital Advisors, LLC documents not be householded, please contact Tortoise Capital Advisors, LLC at 1-913-981-1020, or contact your financial intermediary. Your instructions will typically be effective within 30 days of receipt by Tortoise Capital Advisors, LLC or your financial intermediary.
| Tortoise Energy Infrastructure Total Return Fund | PAGE 2 | TSR_SAR_56166Y404 |
53.313.29.58.95.75.80.80.12.7
| | |
| Tortoise Energy Infrastructure and Income Fund | |
| Class A | INFRX |
| Semi-Annual Shareholder Report | May 31, 2024 |
This semi-annual shareholder report contains important information about the Tortoise Energy Infrastructure and Income Fund for the period of December 1, 2023, to May 31, 2024. You can find additional information about the Fund at https://etp.tortoiseadvisors.com/resource-center/fund-documents/. You can also request this information by contacting us at
1-913-981-1020 or info@tortoiseadvisors.com.
This report describes changes to the Fund that occurred during the reporting period.
WHAT WERE THE FUND COSTS FOR THE LAST SIX MONTHS? (based on a hypothetical $10,000 investment)
| | |
Class Name | Costs of a $10,000 investment | Costs paid as a percentage of a $10,000 investment |
| Class A | $72 | 1.37% |
KEY FUND STATISTICS (as of May 31, 2024)
| |
Net Assets | $524,659,321 |
Number of Holdings | 43 |
Portfolio Turnover | 11% |
Visit https://etp.tortoiseadvisors.com/resource-center/fund-documents/ for more recent performance information.
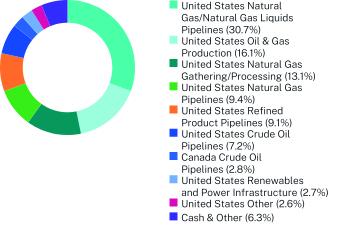
WHAT DID THE FUND INVEST IN? (as of May 31, 2024)
| |
Top 10 Issuers | (%)* |
MPLX LP | 7.2% |
Cheniere Energy, Inc. | 7.1% |
Targa Resources Corp. | 5.0% |
Energy Transfer LP | 4.9% |
ONEOK, Inc. | 4.9% |
Plains GP Holdings L.P. | 4.7% |
The Williams Companies, Inc. | 4.7% |
Enterprise Products Partners LP | 4.5% |
EQT Corporation | 3.7% |
ConocoPhillips | 3.6% |
| * | Percentages are listed as a % of net assets. |
| Tortoise Energy Infrastructure and Income Fund | PAGE 1 | TSR_SAR_56167N530 |
Managed Distributions
The Fund may distribute more than its income and net realized capital gains; therefore, a portion of distributions may be a return of capital. A return of capital may occur, for example, when some or all of the money a shareholder has invested in the Fund is paid back to the shareholder. A return of capital distribution does not necessarily reflect the Fund’s investment performance and should not be confused with “yield” or “income.”
For additional information about the Fund; including its prospectus, financial information, holdings and proxy information, scan the QR code or visit https://etp.tortoiseadvisors.com/resource-center/fund-documents/
The Tortoise Energy Infrastructure and Income Fund is distributed by Quasar Distributors, LLC.
HOUSEHOLDING
To reduce Fund expenses, only one copy of most shareholder documents may be mailed to shareholders with multiple accounts at the same address (Householding). If you would prefer that your Tortoise Capital Advisors, LLC documents not be householded, please contact Tortoise Capital Advisors, LLC at 1-913-981-1020, or contact your financial intermediary. Your instructions will typically be effective within 30 days of receipt by Tortoise Capital Advisors, LLC or your financial intermediary.
| Tortoise Energy Infrastructure and Income Fund | PAGE 2 | TSR_SAR_56167N530 |
30.716.113.19.49.17.22.82.72.66.3
| | |
| Tortoise Energy Infrastructure and Income Fund | |
| Class C | INFFX |
| Semi-Annual Shareholder Report | May 31, 2024 |
This semi-annual shareholder report contains important information about the Tortoise Energy Infrastructure and Income Fund for the period of December 1, 2023, to May 31, 2024. You can find additional information about the Fund at https://etp.tortoiseadvisors.com/resource-center/fund-documents/. You can also request this information by contacting us at
1-913-981-1020 or info@tortoiseadvisors.com.
This report describes changes to the Fund that occurred during the reporting period.
WHAT WERE THE FUND COSTS FOR THE LAST SIX MONTHS? (based on a hypothetical $10,000 investment)
| | |
Class Name | Costs of a $10,000 investment | Costs paid as a percentage of a $10,000 investment |
| Class C | $111 | 2.12% |
KEY FUND STATISTICS (as of May 31, 2024)
| |
Net Assets | $524,659,321 |
Number of Holdings | 43 |
Portfolio Turnover | 11% |
Visit https://etp.tortoiseadvisors.com/resource-center/fund-documents/ for more recent performance information.
WHAT DID THE FUND INVEST IN? (as of May 31, 2024)
| |
Top 10 Issuers | (%)* |
MPLX LP | 7.2% |
Cheniere Energy, Inc. | 7.1% |
Targa Resources Corp. | 5.0% |
Energy Transfer LP | 4.9% |
ONEOK, Inc. | 4.9% |
Plains GP Holdings L.P. | 4.7% |
The Williams Companies, Inc. | 4.7% |
Enterprise Products Partners LP | 4.5% |
EQT Corporation | 3.7% |
ConocoPhillips | 3.6% |
| * | Percentages are listed as a % of net assets. |
| Tortoise Energy Infrastructure and Income Fund | PAGE 1 | TSR_SAR_56167N514 |
Managed Distributions
The Fund may distribute more than its income and net realized capital gains; therefore, a portion of distributions may be a return of capital. A return of capital may occur, for example, when some or all of the money a shareholder has invested in the Fund is paid back to the shareholder. A return of capital distribution does not necessarily reflect the Fund’s investment performance and should not be confused with “yield” or “income.”
For additional information about the Fund; including its prospectus, financial information, holdings and proxy information, scan the QR code or visit https://etp.tortoiseadvisors.com/resource-center/fund-documents/
The Tortoise Energy Infrastructure and Income Fund is distributed by Quasar Distributors, LLC.
HOUSEHOLDING
To reduce Fund expenses, only one copy of most shareholder documents may be mailed to shareholders with multiple accounts at the same address (Householding). If you would prefer that your Tortoise Capital Advisors, LLC documents not be householded, please contact Tortoise Capital Advisors, LLC at 1-913-981-1020, or contact your financial intermediary. Your instructions will typically be effective within 30 days of receipt by Tortoise Capital Advisors, LLC or your financial intermediary.
| Tortoise Energy Infrastructure and Income Fund | PAGE 2 | TSR_SAR_56167N514 |
30.716.113.19.49.17.22.82.72.66.3
| | |
| Tortoise Energy Infrastructure and Income Fund | |
| Institutional Class | INFIX |
| Semi-Annual Shareholder Report | May 31, 2024 |
This semi-annual shareholder report contains important information about the Tortoise Energy Infrastructure and Income Fund for the period of December 1, 2023, to May 31, 2024. You can find additional information about the Fund at https://etp.tortoiseadvisors.com/resource-center/fund-documents/. You can also request this information by contacting us at
1-913-981-1020 or info@tortoiseadvisors.com.
This report describes changes to the Fund that occurred during the reporting period.
WHAT WERE THE FUND COSTS FOR THE LAST SIX MONTHS? (based on a hypothetical $10,000 investment)
| | |
Class Name | Costs of a $10,000 investment | Costs paid as a percentage of a $10,000 investment |
| Institutional Class | $59 | 1.12% |
KEY FUND STATISTICS (as of May 31, 2024)
| |
Net Assets | $524,659,321 |
Number of Holdings | 43 |
Portfolio Turnover | 11% |
Visit https://etp.tortoiseadvisors.com/resource-center/fund-documents/ for more recent performance information.
WHAT DID THE FUND INVEST IN? (as of May 31, 2024)
| |
Top 10 Issuers | (%)* |
MPLX LP | 7.2% |
Cheniere Energy, Inc. | 7.1% |
Targa Resources Corp. | 5.0% |
Energy Transfer LP | 4.9% |
ONEOK, Inc. | 4.9% |
Plains GP Holdings L.P. | 4.7% |
The Williams Companies, Inc. | 4.7% |
Enterprise Products Partners LP | 4.5% |
EQT Corporation | 3.7% |
ConocoPhillips | 3.6% |
| * | Percentages are listed as a % of net assets. |
| Tortoise Energy Infrastructure and Income Fund | PAGE 1 | TSR_SAR_56167N522 |
Managed Distributions
The Fund may distribute more than its income and net realized capital gains; therefore, a portion of distributions may be a return of capital. A return of capital may occur, for example, when some or all of the money a shareholder has invested in the Fund is paid back to the shareholder. A return of capital distribution does not necessarily reflect the Fund’s investment performance and should not be confused with “yield” or “income.”
For additional information about the Fund; including its prospectus, financial information, holdings and proxy information, scan the QR code or visit https://etp.tortoiseadvisors.com/resource-center/fund-documents/
The Tortoise Energy Infrastructure and Income Fund is distributed by Quasar Distributors, LLC.
HOUSEHOLDING
To reduce Fund expenses, only one copy of most shareholder documents may be mailed to shareholders with multiple accounts at the same address (Householding). If you would prefer that your Tortoise Capital Advisors, LLC documents not be householded, please contact Tortoise Capital Advisors, LLC at 1-913-981-1020, or contact your financial intermediary. Your instructions will typically be effective within 30 days of receipt by Tortoise Capital Advisors, LLC or your financial intermediary.
| Tortoise Energy Infrastructure and Income Fund | PAGE 2 | TSR_SAR_56167N522 |
30.716.113.19.49.17.22.82.72.66.3
| | |
| Ecofin Global Renewables Infrastructure Fund | |
| Class A | ECOAX |
| Semi-Annual Shareholder Report | May 31, 2024 |
This semi-annual shareholder report contains important information about the Ecofin Global Renewables Infrastructure Fund for the period of December 1, 2023, to May 31, 2024. You can find additional information about the Fund at https://etp.tortoiseadvisors.com/resource-center/fund-documents/. You can also request this information by contacting us at
1-913-981-1020 or info@tortoiseadvisors.com.
This report describes changes to the Fund that occurred during the reporting period.
WHAT WERE THE FUND COSTS FOR THE LAST SIX MONTHS? (based on a hypothetical $10,000 investment)
| | |
Class Name | Costs of a $10,000 investment | Costs paid as a percentage of a $10,000 investment |
| Class A | $63 | 1.18% |
KEY FUND STATISTICS (as of May 31, 2024)
| |
Net Assets | $272,591,946 |
Number of Holdings | 32 |
Portfolio Turnover | 25% |
Visit https://etp.tortoiseadvisors.com/resource-center/fund-documents/ for more recent performance information.
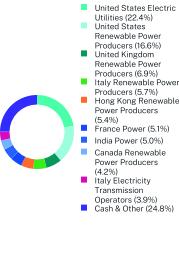
WHAT DID THE FUND INVEST IN? (as of May 31, 2024)
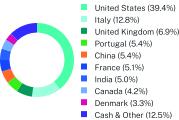
Geographic Breakdown (%)*
| |
Top 10 Issuers | (%)* |
Clearway Energy, Inc. | 5.9% |
ERG SpA | 5.7% |
NextEra Energy Partners LP | 5.4% |
Dominion Energy, Inc. | 5.3% |
NextEra Energy, Inc. | 5.2% |
Neoen SA | 5.1% |
ReNew Energy Global PLC | 5.0% |
Exelon Corp. | 5.0% |
Edison International | 4.9% |
Avista Corp. | 4.4% |
| * | Percentages are listed as a % of net assets. |
| Ecofin Global Renewables Infrastructure Fund | PAGE 1 | TSR_SAR_56167N480 |
Managed Distributions
The Fund may distribute more than its income and net realized capital gains; therefore, a portion of distributions may be a return of capital. A return of capital may occur, for example, when some or all of the money a shareholder has invested in the Fund is paid back to the shareholder. A return of capital distribution does not necessarily reflect the Fund’s investment performance and should not be confused with “yield” or “income.”
For additional information about the Fund; including its prospectus, financial information, holdings and proxy information, scan the QR code or visit https://etp.tortoiseadvisors.com/resource-center/fund-documents/
The Ecofin Global Renewables Infrastructure Fund is distributed by Quasar Distributors, LLC.
HOUSEHOLDING
To reduce Fund expenses, only one copy of most shareholder documents may be mailed to shareholders with multiple accounts at the same address (Householding). If you would prefer that your Tortoise Capital Advisors, LLC documents not be householded, please contact Tortoise Capital Advisors, LLC at 1-913-981-1020, or contact your financial intermediary. Your instructions will typically be effective within 30 days of receipt by Tortoise Capital Advisors, LLC or your financial intermediary.
| Ecofin Global Renewables Infrastructure Fund | PAGE 2 | TSR_SAR_56167N480 |
22.416.66.95.75.45.15.04.23.924.839.412.86.95.45.45.15.04.23.312.5
| | |
| Ecofin Global Renewables Infrastructure Fund | |
| Institutional Class | ECOIX |
| Semi-Annual Shareholder Report | May 31, 2024 |
This semi-annual shareholder report contains important information about the Ecofin Global Renewables Infrastructure Fund for the period of December 1, 2023, to May 31, 2024. You can find additional information about the Fund at https://etp.tortoiseadvisors.com/resource-center/fund-documents/. You can also request this information by contacting us at
1-913-981-1020 or info@tortoiseadvisors.com.
This report describes changes to the Fund that occurred during the reporting period.
WHAT WERE THE FUND COSTS FOR THE LAST SIX MONTHS? (based on a hypothetical $10,000 investment)
| | |
Class Name | Costs of a $10,000 investment | Costs paid as a percentage of a $10,000 investment |
| Institutional Class | $50 | 0.93% |
KEY FUND STATISTICS (as of May 31, 2024)
| |
Net Assets | $272,591,946 |
Number of Holdings | 32 |
Portfolio Turnover | 25% |
Visit https://etp.tortoiseadvisors.com/resource-center/fund-documents/ for more recent performance information.
WHAT DID THE FUND INVEST IN? (as of May 31, 2024)
Geographic Breakdown (%)*
| |
Top 10 Issuers | (%)* |
Clearway Energy, Inc. | 5.9% |
ERG SpA | 5.7% |
NextEra Energy Partners LP | 5.4% |
Dominion Energy, Inc. | 5.3% |
NextEra Energy, Inc. | 5.2% |
Neoen SA | 5.1% |
ReNew Energy Global PLC | 5.0% |
Exelon Corp. | 5.0% |
Edison International | 4.9% |
Avista Corp. | 4.4% |
| * | Percentages are listed as a % of net assets. |
| Ecofin Global Renewables Infrastructure Fund | PAGE 1 | TSR_SAR_56167N472 |
Managed Distributions
The Fund may distribute more than its income and net realized capital gains; therefore, a portion of distributions may be a return of capital. A return of capital may occur, for example, when some or all of the money a shareholder has invested in the Fund is paid back to the shareholder. A return of capital distribution does not necessarily reflect the Fund’s investment performance and should not be confused with “yield” or “income.”
For additional information about the Fund; including its prospectus, financial information, holdings and proxy information, scan the QR code or visit https://etp.tortoiseadvisors.com/resource-center/fund-documents/
The Ecofin Global Renewables Infrastructure Fund is distributed by Quasar Distributors, LLC.
HOUSEHOLDING
To reduce Fund expenses, only one copy of most shareholder documents may be mailed to shareholders with multiple accounts at the same address (Householding). If you would prefer that your Tortoise Capital Advisors, LLC documents not be householded, please contact Tortoise Capital Advisors, LLC at 1-913-981-1020, or contact your financial intermediary. Your instructions will typically be effective within 30 days of receipt by Tortoise Capital Advisors, LLC or your financial intermediary.
| Ecofin Global Renewables Infrastructure Fund | PAGE 2 | TSR_SAR_56167N472 |
22.416.66.95.75.45.15.04.23.924.839.412.86.95.45.45.15.04.23.312.5
Item 2. Code of Ethics.
Not applicable for semi-annual reports.
Item 3. Audit Committee Financial Expert.
Not applicable for semi-annual reports.
Item 4. Principal Accountant Fees and Services.
Not applicable for semi-annual reports.
Item 5. Audit Committee of Listed Registrants.
Not applicable
Item 6. Investments.
| (a) | Schedule of Investments is included within the financial statements filed under Item 7 of this form. |
Item 7. Financial Statements and Financial Highlights for Open-End Investment Companies.
MANAGED PORTFOLIO SERIES
TORTOISE OPEN END FUNDS
Core Financial Statements
May 31, 2024
Back to Table of Contents
Tortoise Energy Infrastructure Total Return Fund
Schedule of Investments
as of May 31, 2024 (Unaudited)
| | | | | | | | |
COMMON STOCKS - 74.1%
| |
Canada Crude Oil Pipelines - 9.5%
| | | | |
Enbridge, Inc. | | | 3,219,085 | | | $117,754,129 | |
Pembina Pipeline Corporation | | | 3,236,279 | | | 120,219,235 | |
| | | | | | 237,973,364 | |
Canada Natural Gas/Natural Gas Liquids Pipelines - 5.7%
| | | | |
Keyera Corp. | | | 2,873,032 | | | 76,075,956 | |
TC Energy Corporation | | | 1,739,291 | | | 67,067,061 | |
| | | | | | 143,143,017 | |
United States Crude Oil Pipelines - 4.9%
| |
Plains GP Holdings L.P. | | | 6,704,273 | | | 120,743,957 | |
United States Natural Gas Gathering/Processing - 10.0%
| |
Antero Midstream Corporation | | | 2,610,185 | | | 38,239,210 | |
EnLink Midstream, LLC | | | 4,318,100 | | | 54,796,689 | |
Equitrans Midstream Corp. | | | 5,485,143 | | | 78,327,842 | |
Hess Midstream LP | | | 1,771,401 | | | 61,556,185 | |
Kinetik Holdings, Inc. | | | 210,428 | | | 8,625,443 | |
Kodiak Gas Services, Inc. | | | 270,976 | | | 7,465,389 | |
| | | | | | 249,010,758 | |
United States Natural Gas/Natural Gas Liquids
Pipelines - 41.9%
| |
Cheniere Energy, Inc. | | | 1,340,507 | | | 211,518,600 | |
DT Midstream, Inc. | | | 487,496 | | | 32,701,232 | |
Excelerate Energy, Inc. | | | 373,516 | | | 6,652,320 | |
Kinder Morgan, Inc. | | | 6,215,530 | | | 121,140,680 | |
NextDecade Corp.(a) | | | 1,909,915 | | | 13,674,991 | |
ONEOK, Inc. | | | 2,341,148 | | | 189,632,988 | |
Targa Resources Corp. | | | 2,343,850 | | | 277,113,385 | |
The Williams Companies, Inc. | | | 4,694,194 | | | 194,855,993 | |
| | | | | | 1,047,290,189 | |
United States Refined Product Pipelines - 1.3%
| |
Sunoco LP | | | 632,304 | | | 32,247,504 | |
United States Renewables and Power Infrastructure - 0.8%
| |
Clearway Energy, Inc. | | | 343,302 | | | 9,612,456 | |
Sempra Energy | | | 143,558 | | | 11,058,273 | |
| | | | | | 20,670,729 | |
TOTAL COMMON STOCKS
(Cost $1,146,222,658) | | | | | | 1,851,079,518 | |
| | | | | | | | |
| | | | | | | |
MASTER LIMITED PARTNERSHIPS - 23.2%
|
United States Crude Oil Pipelines - 0.9%
|
Plains All American Pipeline LP | | | 1,308,099 | | | $22,250,764 |
United States Natural Gas Gathering/Processing - 3.3%
|
Western Midstream Partners LP | | | 2,172,529 | | | 81,078,782 |
United States Natural Gas/Natural Gas Liquids
Pipelines - 11.4%
|
Energy Transfer LP | | | 11,512,483 | | | 180,400,609 |
Enterprise Products Partners LP | | | 3,695,576 | | | 105,323,916 |
| | | | | | 285,724,525 |
United States Other - 0.1%
| | | | | | |
Westlake Chemical Partners LP | | | 127,871 | | | 2,988,345 |
United States Refined Product Pipelines - 7.6%
|
MPLX LP | | | 4,649,802 | | | 189,153,946 |
TOTAL MASTER LIMITED PARTNERSHIPS
(Cost $363,231,004) | | | | | | 581,196,362 |
| | | Shares | | | |
SHORT-TERM INVESTMENTS - 2.5%
|
Money Market Funds - 2.5%
| |
First American Government Obligations Fund - Class X, 5.24%(b) | | | 61,459,325 | | | 61,459,325 |
TOTAL SHORT-TERM INVESTMENTS
(Cost $61,459,325) | | | | | | 61,459,325 |
TOTAL
INVESTMENTS - 99.8%
(Cost $1,570,912,987) | | | | | | $2,493,735,205 |
Other Assets in Excess of
Liabilities - 0.2% | | | | | | 5,943,683 |
TOTAL NET ASSETS - 100.0% | | | | | | $2,499,678,888 |
| | | | | | | |
Percentages are stated as a percent of net assets.
(a)
| Non-income producing security. |
(b)
| The rate shown represents the 7-day effective yield as of May 31, 2024. |
The accompanying notes are an integral part of these financial statements.
Back to Table of Contents
Tortoise Energy Infrastructure and Income Fund
Schedule of Investments
as of May 31, 2024 (Unaudited)
| | | | | | | |
COMMON STOCKS - 57.4%
| |
Canada Crude Oil Pipelines - 2.1%
| | | | |
Enbridge, Inc. | | | 304,484 | | | $11,138,025 |
Canada Oil & Gas Production - 1.9%
|
Ovintiv, Inc. | | | 187,315 | | | 9,678,566 |
United States Crude Oil Pipelines - 4.7%
|
Plains GP Holdings L.P. | | | 1,370,563 | | | 24,683,840 |
United States Natural Gas Gathering/Processing - 4.7%
|
Equitrans Midstream Corp. | | | 661,408 | | | 9,444,906 |
Hess Midstream LP - Class A | | | 276,274 | | | 9,600,522 |
Kinetik Holdings, Inc. | | | 40,684 | | | 1,667,637 |
Kodiak Gas Services, Inc. | | | 145,707 | | | 4,014,228 |
| | | | | | 24,727,293 |
United States Natural Gas/Natural Gas
Liquids Pipelines - 24.2%
|
Cheniere Energy, Inc. | | | 235,544 | | | 37,166,488 |
Kinder Morgan, Inc. | | | 670,842 | | | 13,074,711 |
ONEOK, Inc. | | | 315,901 | | | 25,587,981 |
Targa Resources Corp. | | | 222,480 | | | 26,303,810 |
The Williams Companies, Inc. | | | 589,845 | | | 24,484,466 |
| | | | | | 126,617,456 |
United States Oil & Gas Production - 15.2%
|
ConocoPhillips | | | 162,747 | | | 18,956,771 |
Coterra Energy, Inc. | | | 432,396 | | | 12,331,934 |
Devon Energy Corporation | | | 170,926 | | | 8,389,048 |
Diamondback Energy, Inc. | | | 64,482 | | | 12,848,683 |
EQT Corporation | | | 472,972 | | | 19,434,419 |
Exxon Mobil Corp. | | | 67,539 | | | 7,919,623 |
| | | | | | 79,880,478 |
United States Refined Product Pipelines - 1.9%
|
Phillips 66 | | | 71,185 | | | 10,116,100 |
United States Renewables and Power Infrastructure - 2.7%
|
Clearway Energy, Inc. - Class C | | | 154,878 | | | 4,336,584 |
Vistra Corp. | | | 97,935 | | | 9,703,400 |
| | | | | | 14,039,984 |
TOTAL COMMON STOCKS (Cost $193,805,875) | | | | | | 300,881,742 |
| | | | | | | |
| | | | | | | |
MASTER LIMITED PARTNERSHIPS - 22.2%
|
United States Crude Oil Pipelines - 2.5%
|
Plains All American Pipeline LP | | | 781,293 | | | 13,289,794 |
United States Natural Gas Gathering/Processing - 3.1%
|
Western Midstream Partners LP | | | 432,087 | | | 16,125,487 |
United States Natural Gas Pipelines - 9.4%
|
Energy Transfer LP | | | 1,639,077 | | | 25,684,337 |
Enterprise Products Partners LP | | | 825,395 | | | 23,523,757 |
| | | | | | 49,208,094 |
| | | | | | | |
| | | | | | | |
United States Refined Product Pipelines - 7.2%
|
MPLX LP | | | 936,118 | | | $38,081,280 |
TOTAL MASTER LIMITED PARTNERSHIPS
(Cost $60,752,936) | | | | | | 116,704,655 |
| | | | | | | |
| | | | | | | |
CORPORATE BONDS - 18.4%
|
Canada Crude Oil Pipelines - 0.7%
|
Enbridge, Inc., 5.50% to 07/15/2027 then 3 mo. Term SOFR +
3.68%, 07/15/2077 | | | 4,000,000 | | | 3,768,644 |
United States Natural Gas Gathering/Processing - 5.3%
|
Antero Midstream Partners LP / Antero Midstream Finance Corp., 5.75%, 03/01/2027(a) | | | 6,370,000 | | | 6,287,426 |
Blue Racer Midstream LLC / Blue Racer Finance Corp.,
6.63%, 07/15/2026(a) | | | 3,800,000 | | | 3,799,225 |
EnLink Midstream, LLC,
5.38%, 06/01/2029 | | | 4,455,000 | | | 4,337,321 |
Hess Midstream Operations LP, 5.63%, 02/15/2026(a) | | | 8,125,000 | | | 8,080,489 |
Kodiak Gas Services LLC,
7.25%, 02/15/2029(a) | | | 5,000,000 | | | 5,081,343 |
| | | | | | 27,585,804 |
United States Natural Gas/Natural Gas
Liquids Pipelines - 6.5%
|
DT Midstream, Inc.,
4.38%, 06/15/2031(a) | | | 6,100,000 | | | 5,482,525 |
EQM Midstream Partners LP,
5.50%, 07/15/2028 | | | 4,250,000 | | | 4,157,212 |
NGPL PipeCo LLC,
7.77%, 12/15/2037(a) | | | 9,125,000 | | | 10,422,429 |
Tallgrass Energy Partners LP / Tallgrass Energy Finance Corp., 5.50%, 01/15/2028(a) | | | 7,925,000 | | | 7,564,640 |
Venture Global LNG, Inc.,
9.88%, 02/01/2032 (a) | | | 6,000,000 | | | 6,437,338 |
| | | | | | 34,064,144 |
United States Oil & Gas Production - 0.9%
|
Comstock Resources, Inc.,
6.75%, 03/01/2029(a) | | | 5,000,000 | | | 4,835,945 |
United States Oil Field Services - 1.2%
|
Archrock Partners LP / Archrock Partners Finance Corp.,
6.88%, 04/01/2027(a) | | | 6,575,000 | | | 6,597,342 |
United States Other - 2.6%
|
New Fortress Energy, Inc.
|
6.75%, 09/15/2025(a) | | | 5,708,000 | | | 5,645,218 |
6.50%, 09/30/2026(a) | | | 8,400,000 | | | 7,910,646 |
| | | | | | 13,555,864 |
| | | | | | | |
The accompanying notes are an integral part of these financial statements.
Back to Table of Contents
Tortoise Energy Infrastructure and Income Fund
Schedule of Investments
as of May 31, 2024 (Unaudited) (Continued)
| | | | | | | |
CORPORATE BONDS - (Continued)
|
United States Refining - 1.2%
|
PBF Holding Co. LLC / PBF Finance Corp.,
7.88%, 09/15/2030(a) | | | 6,000,000 | | | $ 6,171,546 |
TOTAL CORPORATE BONDS (Cost $96,572,160) | | | | | | 96,579,289 |
| | | | | | | |
| | | | | | | |
SHORT-TERM INVESTMENTS - 1.2%
|
Money Market Funds - 1.2%
|
First American Government Obligations Fund - Class X, 5.24%(b) | | | 6,462,322 | | | 6,462,322 |
TOTAL SHORT-TERM INVESTMENTS
(Cost $6,462,322) | | | | | | 6,462,322 |
TOTAL INVESTMENTS - 99.2% (Cost $357,593,293) | | | | | | $520,628,008 |
Other Assets in Excess of
Liabilities - 0.8% | | | | | | 4,031,313 |
TOTAL NET ASSETS - 100.0% | | | | | | $524,659,321 |
| | | | | | | |
Percentages are stated as a percent of net assets.
SOFR - Secured Overnight Financing Rate
(a)
| Security is exempt from registration pursuant to Rule 144A under the Securities Act of 1933, as amended. These securities may only be resold in transactions exempt from registration to qualified institutional investors. As of May 31, 2024, the value of these securities total $84,316,112 or 16.1% of the Fund’s net assets. |
(b)
| The rate shown represents the 7-day effective yield as of May 31, 2024. |
The accompanying notes are an integral part of these financial statements.
Back to Table of Contents
Ecofin Global Renewables Infrastructure Fund
Schedule of Investments
as of May 31, 2024 (Unaudited)
| | | | | | | |
COMMON STOCKS - 95.3%
|
Belgium Electricity Transmission Operators - 1.3%
|
Elia Group SA/NV | | | 34,498 | | | $ 3,513,732 |
Canada Renewable Power Producers - 4.2%
|
Innergex Renewable Energy, Inc. | | | 1,588,895 | | | 11,377,978 |
Denmark Infrastructure, Utilities and Renewables - 3.3%
|
Orsted AS(a) | | | 144,630 | | | 8,871,138 |
France Power - 5.1%
|
Neoen SA | | | 335,648 | | | 13,844,305 |
Hong Kong Renewable Power Producers - 5.4%
|
China Longyuan Power Group Corp. Ltd. | | | 8,135,898 | | | 7,434,102 |
China Suntien Green Energy Corp. Ltd. | | | 11,889,782 | | | 5,596,257 |
Xinyi Energy Holdings Ltd. | | | 12,103,729 | | | 1,722,112 |
| | | | | | 14,752,471 |
India Power - 5.0%
|
ReNew Energy Global PLC - Class A(a) | | | 2,279,867 | | | 13,656,403 |
Italy Electricity Transmission Operators - 3.9%
|
Terna - Rete Elettrica Nazionale SpA | | | 1,271,294 | | | 10,699,797 |
Italy Power - 3.2%
|
Enel SpA | | | 1,205,983 | | | 8,756,266 |
Italy Renewable Power Producers - 5.7%
|
ERG SpA | | | 558,853 | | | 15,659,484 |
Japan Renewable Power Producers - 1.6%
|
RENOVA, Inc.(a) | | | 677,792 | | | 4,420,810 |
Portugal Electric Utilities - 3.7%
|
EDP - Energias de Portugal, S.A. | | | 2,488,275 | | | 10,124,843 |
Portugal Renewables Power Producer - 1.7%
|
Greenvolt-Energias Renovaveis, S.A.(a) | | | 519,343 | | | 4,679,959 |
Spain Integrated Utilities - 2.2%
|
EDP Renovaveis SA | | | 379,947 | | | 6,105,887 |
Switzerland Integrated Utilities - 2.2%
|
BKW Energie AG | | | 38,075 | | | 5,999,943 |
Thailand Renewable Power Producers - 0.9%
|
Super Energy Corporation PLC(a) | | | 301,831,784 | | | 2,379,212 |
| | | | | | | |
| | | | | | | |
United Kingdom Renewable Power Producers - 6.9%
|
Atlantica Sustainable Infrastructure PLC | | | 472,850 | | | $10,393,243 |
Greencoat UK Wind PLC/Funds | | | 2,439,888 | | | 4,380,594 |
National Grid PLC | | | 365,579 | | | 4,110,539 |
| | | | | | 18,884,376 |
United States Electric Utilities - 22.4%
|
Avista Corp. | | | 324,134 | | | 11,986,475 |
Constellation Energy Corp. | | | 11,303 | | | 2,455,577 |
Edison International | | | 176,174 | | | 13,538,972 |
Exelon Corp. | | | 362,666 | | | 13,618,108 |
NextEra Energy, Inc. | | | 176,346 | | | 14,111,207 |
Public Service Enterprise Group Incorporated | | | 71,566 | | | 5,421,840 |
| | | | | | 61,132,179 |
United States Renewable Power Producers - 16.6%
|
Clearway Energy, Inc. | | | 578,010 | | | 16,184,280 |
Dominion Energy, Inc. | | | 267,392 | | | 14,417,776 |
NextEra Energy
Partners LP | | | 431,715 | | | 14,553,113 |
| | | | | | 45,155,169 |
TOTAL COMMON STOCKS
(Cost $268,306,069) | | | | | | 260,013,952 |
SHORT-TERM INVESTMENTS - 0.3%
| | | |
Money Market Funds - 0.3%
|
First American Government Obligations Fund - Class X, 5.24%(b) | | | 709,026 | | | 709,026 |
TOTAL SHORT-TERM
INVESTMENTS
(Cost $709,026) | | | | | | 709,026 |
TOTAL INVESTMENTS - 95.6%
(Cost $269,015,095) | | | | | | $ 260,722,978 |
Other Assets in Excess of Liabilities - 4.4% | | | | | | 11,868,968 |
TOTAL NET
ASSETS - 100.0% | | | | | | $272,591,946 |
| | | | | | | |
Percentages are stated as a percent of net assets.
AG - Aktiengesellschaft
NV - Naamloze Vennootschap
PLC - Public Limited Company
SA - Sociedad Anónima
SA/NV - Societe Anonime/Naamloze Vennootschap
(a)
| Non-income producing security. |
(b)
| The rate shown represents the 7-day effective yield as of May 31, 2024. |
The accompanying notes are an integral part of these financial statements.
Back to Table of Contents
Ecofin Global Renewables Infrastructure Fund
Schedule of Total Return Swap Contracts
as of May 31, 2024 (Unaudited)
| | | | | | | | | | | | | | | | | | | | | | | | | |
Drax Group LLC | | | Morgan Stanley | | | Long | | | 08/15/2024 | | | 0.21% | | | Month | | | $9,193,659 | | | $3,239,113 | | | $216,585 |
| | | | | | | | | $3,239,113 | | | $216,585 |
| | | | | | | | | | | | | |
The accompanying notes are an integral part of these financial statements.
Back to Table of Contents
Statement of Assets & Liabilities
May 31, 2024 (Unaudited)
| | | | | | | | | | |
Assets:
|
Investments, at fair value (cost $1,570,912,987, $357,593,293,and $269,015,095, respectively) | | | $ 2,493,735,205 | | | $520,628,008 | | | $ 260,722,978 |
Foreign Cash (cost $0, $0, and $77,659, respectively) | | | — | | | — | | | 77,725 |
Cash held as collateral | | | — | | | — | | | 10,009,146 |
Dividends & interest receivable | | | 1,917,095 | | | 2,825,772 | | | 1,232,927 |
Receivable for investment securities sold | | | 3,726,613 | | | 11,442,237 | | | 3,944,726 |
Receivable for swap contracts | | | — | | | — | | | 216,585 |
Receivable for capital shares sold | | | 3,379,921 | | | 89,835 | | | 1,224,537 |
Prepaid expenses and other assets | | | 68,078 | | | 35,360 | | | 20,136 |
Total assets | | | 2,502,826,912 | | | 535,021,212 | | | 277,526,424 |
Liabilities:
|
Payable for investment securities purchased | | | — | | | 9,679,464 | | | 4,112,759 |
Payable for capital shares redeemed | | | 700,345 | | | 87,031 | | | 525,626 |
Payable to Adviser | | | 1,777,042 | | | 444,665 | | | 169,297 |
Payable for fund administration & accounting fees | | | 76,251 | | | 23,254 | | | 9,206 |
Payable for compliance fees | | | 641 | | | 640 | | | 542 |
Payable for custody fees | | | 19,278 | | | 2,930 | | | 7,642 |
Payable for audit & tax | | | 26,898 | | | 15,915 | | | 15,635 |
Payable for transfer agent fees & expenses | | | 59,579 | | | 13,505 | | | 13,876 |
Accrued expenses | | | 133,860 | | | 29,251 | | | — |
Accrued distribution fees | | | 354,130 | | | 65,236 | | | 2,231 |
Total liabilities | | | 3,148,024 | | | 10,361,891 | | | 4,934,478 |
Net Assets | | | $ 2,499,678,888 | | | $524,659,321 | | | $ 272,591,946 |
Net Assets Consist of:
|
Capital Stock | | | $ 2,670,246,860 | | | $782,537,864 | | | $ 316,201,662 |
Total accumulated loss | | | (170,567,972) | | | (257,878,543) | | | (43,609,716) |
Net assets | | | $ 2,499,678,888 | | | $524,659,321 | | | $ 272,591,946 |
Institutional Class
|
Net assets | | | $ 2,257,483,132 | | | $454,557,442 | | | $ 271,382,976 |
Shares issued and outstanding(1) | | | 142,187,921 | | | 55,201,739 | | | 27,825,033 |
Net asset value, redemption price and minimum offering price per share | | | $15.88 | | | $8.23 | | | $9.75 |
A Class
|
Net assets | | | $223,208,298 | | | $51,852,696 | | | $1,208,970 |
Shares issued and outstanding(1) | | | 14,291,889 | | | 6,153,180 | | | 124,191 |
Net asset value, redemption price and minimum offering price per share | | | $15.62 | | | $8.43 | | | $9.73 |
Maximum offering price per share(2) | | | $16.53 | | | $8.92 | | | $10.30 |
| | | | | | | | | | |
See accompanying Notes to Financial Statements.
Back to Table of Contents
Statement of Assets & Liabilities
May 31, 2024 (Unaudited) (Continued)
| | | | | | | | | | |
C Class
|
Net assets | | | $ 18,987,458 | | | $ 18,249,183 | | | $ — |
Shares issued and outstanding(1) | | | 1,249,270 | | | 2,188,573 | | | — |
Net asset value, redemption price and minimum offering
price per share | | | $15.20 | | | $8.34 | | | $— |
| | | | | | | | | | |
(1)
| Unlimited shares authorized. |
(2)
| The offering price is calculated by dividing the net asset value by 1 minus the maximum sales charge of 5.50%. |
See accompanying Notes to Financial Statements.
Back to Table of Contents
Statements of Operations
For the Six Months Ended May 31, 2024 (Unaudited)
| | | | | | | | | | |
Investment Income:
| | | | | | | | | |
Dividends income | | | $32,274,786 | | | $4,954,396 | | | $2,945,051 |
Less: foreign taxes withheld | | | (1,892,536) | | | (6,1410) | | | (412,464) |
Interest income | | | 1,161,496 | | | 3,241,352 | | | 374,040 |
Total investment income | | | 31,543,746 | | | 8,134,338 | | | 2,906,627 |
Expenses:
| | | | | | | | | |
Advisory fees (See Note 6) | | | 9,657,159 | | | 2,529,251 | | | 942,563 |
Fund administration & accounting fees (See Note 6) | | | 438,261 | | | 153,824 | | | 94,486 |
Transfer agent fees & expenses (See Note 6) | | | 137,693 | | | 55,032 | | | 36,714 |
Shareholder communication fees | | | 103,950 | | | 21,384 | | | 9,849 |
Custody fees (See Note 6) | | | 58,058 | | | 9,907 | | | 19,628 |
Registration fees | | | 39,250 | | | 28,328 | | | 20,017 |
Audit & tax fees | | | 26,901 | | | 15,911 | | | 15,639 |
Trustee fees | | | 11,341 | | | 10,515 | | | 10,428 |
Other | | | 12,538 | | | 4,886 | | | 3,480 |
Legal fees | | | 9,053 | | | 6,321 | | | 6,385 |
Insurance fees | | | 8,222 | | | 2,301 | | | 1,652 |
Compliance fees (See Note 6) | | | 5,227 | | | 5,225 | | | 5,225 |
Distribution fees (See Note 7):
| | | | | | | | | |
A Class | | | 258,112 | | | 61,953 | | | 1,828 |
C Class | | | 93,030 | | | 90,492 | | | — |
Total expenses before interest expense | | | 10,858,795 | | | 2,995,330 | | | 1,167,894 |
Interest expense on line of credit (See Note 11) | | | 7,932 | | | 132 | | | 7,792 |
Total expenses | | | 10,866,727 | | | 2,995,462 | | | 1,175,686 |
Net Investment Income | | | 20,677,019 | | | 5,138,876 | | | 1,730,941 |
Realized and Unrealized Gain (Loss) on Investments and Translations of Foreign Currency
| | | | | | | | | |
Net realized gain (loss) on:
| | | | | | | | | |
Unaffiliated Investments, including foreign currency gain (loss) | | | 72,887,191 | | | 9,787,708 | | | (7,883,574) |
Swap contracts | | | — | | | — | | | 1,785,198 |
Net change in unrealized appreciation (depreciation) of:
| | | | | | | | | |
Unaffiliated investments and translations of foreign currency | | | 193,049,018 | | | 36,231,918 | | | 36,054,109 |
Swap contracts | | | — | | | — | | | 5,292 |
Net realized and unrealized gain on investments and translations of foreign currency | | | 265,936,209 | | | 46,019,626 | | | 29,961,025 |
Net increase in net assets resulting from operations | | | $286,613,228 | | | $51,158,502 | | | $31,691,966 |
| | | | | | | | | | |
See accompanying Notes to Financial Statements.
Back to Table of Contents
Statements of Changes in Net Assets
| | | | | | | |
Operations
| | | | | | | | | | | | |
Net investment income | | | $20,677,019 | | | $39,541,790 | | | $5,138,876 | | | $10,445,969 |
Net realized gain on unaffiliated investments and foreign currency | | | 72,887,191 | | | 273,202,779 | | | 9,787,708 | | | 36,995,944 |
Net change in unrealized appreciation (depreciation) of unaffiliated investments and translations of foreign currency | | | 193,049,018 | | | (140,489,303) | | | 36,231,918 | | | (19,344,072) |
Net increase in net assets resulting from operations | | | 286,613,228 | | | 172,255,266 | | | 51,158,502 | | | 28,097,841 |
|
Capital Share Transactions
| | | | | | | | | | | | |
Institutional Class:
| | | | | | | | | | | | |
Proceeds from shares sold | | | 286,204,321 | | | 390,902,199 | | | 22,345,920 | | | 61,090,754 |
Proceeds from reinvestment of distributions | | | 54,706,268 | | | 67,615,673 | | | 7,186,059 | | | 14,174,851 |
Payments for shares redeemed | | | (254,794,517) | | | (767,963,098) | | | (37,309,246) | | | (99,940,873) |
Increase (decrease) in net assets from Institutional Class transactions | | | 86,116,072 | | | (309,445,226) | | | (7,777,267) | | | (24,675,268) |
A Class:
| | | | | | | | | | | | |
Proceeds from shares sold(1) | | | 7,321,809 | | | 15,773,373 | | | 4,651,628 | | | 10,535,192 |
Proceeds from reinvestment of distributions | | | 7,426,435 | | | 7,537,237 | | | 426,540 | | | 764,939 |
Payments for shares redeemed | | | (8,045,866) | | | (22,963,720) | | | (5,309,383) | | | (8,409,091) |
Increase (decrease) in net assets from A Class transactions | | | 6,702,378 | | | 346,890 | | | (231,215) | | | 2,891,040 |
C Class:
| | | | | | | | | | | | |
Proceeds from shares sold | | | 415,803 | | | 1,234,184 | | | 597,061 | | | 1,342,526 |
Proceeds from reinvestment of distributions | | | 575,871 | | | 712,895 | | | 224,827 | | | 539,456 |
Payments for shares
redeemed(1) | | | (3,068,469) | | | (5,286,444) | | | (2,923,976) | | | (6,664,453) |
Decrease in net assets from C Class transactions | | | (2,076,795) | | | (3,339,365) | | | (2,102,088) | | | (4,782,471) |
Net increase (decrease) in net assets resulting from capital share transactions | | | 90,741,655 | | | (312,437,701) | | | (10,110,570) | | | (26,566,699) |
| | | | | | | | | | | | | |
See accompanying Notes to Financial Statements.
Back to Table of Contents
Statements of Changes in Net Assets (Continued)
| | | | | | | |
Distributions to Shareholders
| | | | | | | | | | | | |
From distributable earnings
| | | | | | | | | | | | |
Institutional Class | | | (21,830,037) | | | (56,646,159) | | | (555,812) | | | (10,850,004) |
A Class | | | (2,167,549) | | | (4,969,028) | | | (51,112) | | | (1,120,812) |
C Class | | | (197,664) | | | (545,949) | | | (7,484) | | | (474,534) |
From tax return of capital
| | | | | | | | | | | | |
Institutional Class | | | (54,578,191) | | | (32,455,237) | | | (12,921,374) | | | (16,282,380) |
A Class | | | (5,567,101) | | | (2,885,841) | | | (1,424,493) | | | (1,681,978) |
C Class | | | (499,333) | | | (313,735) | | | (494,560) | | | (712,126) |
Total distributions to shareholders | | | (84,839,875) | | | (97,815,949) | | | (15,454,835) | | | (31,121,834) |
Total Increase (Decrease) in Net Assets | | | 292,515,008 | | | (237,998,384) | | | 25,593,097 | | | (29,590,692) |
Net Assets
| | | | | | | | | | | | |
Beginning of period | | | 2,207,163,880 | | | 2,445,162,264 | | | 499,066,224 | | | 528,656,916 |
End of period | | | $2,499,678,888 | | | $2,207,163,880 | | | $ 524,659,321 | | | $ 499,066,224 |
Transactions in Shares:
| | | | | | | | | | | | |
Institutional Class:
| | | | | | | | | | | | |
Shares sold | | | 18,862,212 | | | 29,251,670 | | | 2,837,855 | | | 8,342,522 |
Shares issued to holders in reinvestment of dividends | | | 3,681,211 | | | 5,084,727 | | | 907,572 | | | 1,946,926 |
Shares redeemed | | | (17,187,982) | | | (57,258,977) | | | (4,735,495) | | | (13,667,360) |
Increase (Decrease) in Institutional Class shares outstanding | | | 5,355,441 | | | (22,922,580) | | | (990,068) | | | (3,377,912) |
A Class:
| | | | | | | | | | | | |
Shares sold(1) | | | 502,940 | | | 1,180,887 | | | 577,967 | | | 1,402,538 |
Shares issued to holders in reinvestment of dividends | | | 507,820 | | | 572,589 | | | 52,554 | | | 102,478 |
Shares redeemed | | | (553,204) | | | (1,792,412) | | | (664,014) | | | (1,121,693) |
Increase (Decrease) in A Class shares outstanding | | | 457,556 | | | (38,936) | | | (33,493) | | | 383,323 |
C Class:
| | | | | | | | | | | | |
Shares sold | | | 27,932 | | | 96,653 | | | 74,856 | | | 179,078 |
Shares issued to holders in reinvestment of dividends | | | 40,392 | | | 55,315 | | | 27,954 | | | 72,782 |
Shares redeemed(1) | | | (215,589) | | | (402,800) | | | (370,285) | | | (890,571) |
Decrease in C Class shares outstanding | | | (147,265) | | | (250,832) | | | (267,475) | | | (638,711) |
Net Increase (Decrease) in shares outstanding | | | 5,665,732 | | | (23,212,348) | | | (1,291,036) | | | (3,633,300) |
| | | | | | | | | | | | | |
(1)
| Includes exchanges between share classes of the fund. |
See accompanying Notes to Financial Statements.
Back to Table of Contents
Statements of Changes in Net Assets (Continued)
| | | | |
Operations
| | | | | | |
Net investment income | | | $1,730,941 | | | $5,849,574 |
Net realized gain (loss) on investments, swaps contracts and foreign currency | | | (6,098,376) | | | (28,153,809) |
Net change in unrealized depreciation of investments, swap contracts and translations of foreign currency | | | 36,059,401 | | | (38,913,093) |
Net Increase (Decrease) in net assets resulting from operations | | | 31,691,966 | | | (61,217,328) |
|
Capital Share Transactions
| | | | | | |
Institutional Class:
| | | | | | |
Proceeds from shares sold | | | 66,194,208 | | | 132,111,089 |
Proceeds from reinvestment of distributions | | | 4,445,795 | | | 7,277,724 |
Payments for shares redeemed | | | (54,677,851) | | | (191,448,918) |
Increase (Decrease) in net assets from Institutional Class
transactions | | | 15,962,152 | | | (52,060,105) |
A Class:
| | | | | | |
Proceeds from shares sold | | | 82,079 | | | 624,487 |
Proceeds from reinvestment of distributions | | | 34,599 | | | 64,558 |
Payments for shares redeemed | | | (870,047) | | | (662,108) |
Increase (Decrease) in net assets from A Class transactions | | | (753,369) | | | 26,937 |
Net Increase (Decrease) in net assets resulting from capital share transactions | | | 15,208,783 | | | (52,033,168) |
|
Distributions to Shareholders
| | | | | | |
From distributable earnings
| | | | | | |
Institutional Class | | | (2,163,672) | | | (1,792,623) |
A Class | | | (15,497) | | | (11,439) |
From tax return of capital
| | | | | | |
Institutional Class | | | (3,982,424) | | | (8,054,111) |
A Class | | | (19,163) | | | (53,174) |
Total distributions to shareholders | | | (6,180,756) | | | (9,911,347) |
Total Increase (Decrease) in Net Assets | | | 40,719,993 | | | (123,161,843) |
|
Net Assets
| | | | | | |
Beginning of period | | | 231,871,953 | | | 355,033,796 |
End of period | | | $272,591,946 | | | 231,871,953 |
|
Transactions in Shares:
| | | | | | |
Institutional Class:
| | | | | | |
Shares sold | | | 7,431,949 | | | 13,550,530 |
Shares issued to holders in reinvestment of dividends | | | 472,689 | | | 745,840 |
Shares redeemed | | | (6,156,198) | | | (19,329,343) |
Increase (Decrease) in Institutional Class shares outstanding | | | 1,748,440 | | | (5,032,973) |
| | | | | | | |
See accompanying Notes to Financial Statements.
Back to Table of Contents
Statements of Changes in Net Assets (Continued)
| | | | |
A Class:
| | | | | | |
Shares sold | | | $9,227 | | | $62,638 |
Shares issued to holders in reinvestment of dividends | | | 3,679 | | | 6,694 |
Shares redeemed | | | (96,172) | | | (65,349) |
Increase (Decrease) in A Class shares outstanding | | | (83,266) | | | 3,983 |
Net Increase (Decrease) in shares outstanding | | | 1,665,174 | | | (5,028,990) |
| | | | | | | |
See accompanying Notes to Financial Statements.
Back to Table of Contents
Tortoise Energy Infrastructure Total Return Fund
Financial Highlights
Institutional Class
| | | | | | | |
Per Common Share Data(1)
| | | | | | | | | | | | | | | |
Net asset value, beginning of period | | | $14.54 | | | $13.97 | | | $11.20 | | | $8.33 | | | $11.61 | | | $12.29 |
|
Investment operations:
| | | | | | | | | | | | | | | |
Net investment income(2) | | | 0.15 | | | 0.19 | | | 0.02 | | | 0.06 | | | 0.12 | | | 0.14 |
Net realized and unrealized gain (loss) on investments and translations of foreign
currency(2) | | | 1.74 | | | 0.97 | | | 3.31 | | | 3.27 | | | (2.96) | | | (0.26) |
Total from investment operations | | | 1.89 | | | 1.16 | | | 3.33 | | | 3.33 | | | (2.84) | | | (0.12) |
|
Less distributions from:
| | | | | | | | | | | | | | | |
Net investment income | | | (0.15) | | | (0.37) | | | (0.10) | | | (0.16) | | | (0.14) | | | (0.20) |
Net realized gains | | | — | | | — | | | — | | | — | | | — | | | — |
Return of capital | | | (0.40) | | | (0.22) | | | (0.46) | | | (0.30) | | | (0.30) | | | (0.36) |
Total distributions | | | (0.55) | | | (0.59) | | | (0.56) | | | (0.46) | | | (0.44) | | | (0.56) |
Net asset value, end of period | | | $15.88 | | | $14.54 | | | $13.97 | | | $11.20 | | | $8.33 | | | $11.61 |
Total Return(3) | | | 13.35% | | | 8.73% | | | 31.52% | | | 40.51% | | | (24.70)% | | | (1.09)% |
|
Supplemental Data and Ratios
| | | | | | | | | | | | | | | |
Net assets, end of period (in 000’s) | | | $ 2,257,483 | | | $ 1,989,434 | | | $ 2,231,400 | | | $ 1,680,834 | | | $ 1,493,621 | | | $ 3,226,450 |
Ratio of expenses to average net assets(4) | | | 0.92% | | | 0.93% | | | 0.93% | | | 0.94% | | | 0.94% | | | 0.93% |
Ratio of expenses excluding interest expense to average net assets(4) | | | 0.92% | | | 0.93% | | | 0.93% | | | 0.93% | | | 0.94% | | | 0.93% |
Ratio of net investment income to average net assets(4) | | | 1.85% | | | 1.78% | | | 1.10% | | | 0.92% | | | 1.64% | | | 1.01% |
Portfolio turnover rate(3) | | | 10% | | | 7% | | | 20% | | | 32% | | | 39% | | | 19% |
| | | | | | | | | | | | | | | | | | | |
(1)
| For an Institutional Class Share outstanding for the entire period. |
(2)
| The per common share data for the years ended November 30, 2023, 2022, 2021, 2020, and 2019 do not reflect the change in estimate of investment income and return of capital. See Note 2 to the financial statements for further disclosure.
|
(3)
| Not annualized for periods less than one year.
|
(4)
| Annualized for periods less than one year. |
See accompanying Notes to Financial Statements.
Back to Table of Contents
Tortoise Energy Infrastructure Total Return Fund
Financial Highlights (Continued)
A Class
| | | | | | | |
Per Common Share Data(1)
|
Net asset value, beginning of period | | | $14.33 | | | $13.80 | | | $11.07 | | | $8.25 | | | $11.50 | | | $12.18 |
Investment operations:
|
Net investment income (loss)(2) | | | 0.13 | | | 0.21 | | | (0.03) | | | 0.08 | | | 0.16 | | | 0.11 |
Net realized and unrealized gain (loss) on investments and translations of foreign currency(2) | | | 1.71 | | | 0.90 | | | 3.30 | | | 3.19 | | | (3.01) | | | (0.26) |
Total from investment operations | | | 1.84 | | | 1.11 | | | 3.27 | | | 3.27 | | | (2.85) | | | (0.15) |
Less distributions from:
|
Net investment income | | | (0.15) | | | (0.37) | | | (0.10) | | | (0.16) | | | (0.11) | | | (0.18) |
Net realized gains | | | — | | | — | | | — | | | — | | | — | | | — |
Return of capital | | | (0.40) | | | (0.21) | | | (0.44) | | | (0.29) | | | (0.29) | | | (0.35) |
Total distributions | | | (0.55) | | | (0.58) | | | (0.54) | | | (0.45) | | | (0.40) | | | (0.53) |
Net asset value, end of period | | | $15.62 | | | $14.33 | | | $13.80 | | | $11.07 | | | $8.25 | | | $11.50 |
Total Return(3)(4) | | | 13.17% | | | 8.48% | | | 31.26% | | | 40.12% | | | (24.94)% | | | (1.38)% |
Supplemental Data and Ratios
| | | | | | | | | | | | | | | |
Net assets, end of period
(in 000’s) | | | $ 223,208 | | | $ 198,181 | | | $ 191,407 | | | $ 168,259 | | | $ 132,882 | | | $ 469,882 |
Ratio of expenses to average net assets(5) | | | 1.17% | | | 1.18% | | | 1.18% | | | 1.19% | | | 1.19% | | | 1.18% |
Ratio of expenses excluding interest expense to average net assets(5) | | | 1.17% | | | 1.18% | | | 1.18% | | | 1.18% | | | 1.18% | | | 1.18% |
Ratio of net investment income to average net assets(5) | | | 1.60% | | | 1.53% | | | 0.85% | | | 0.67% | | | 1.40% | | | 0.76% |
Portfolio turnover rate(4) | | | 10% | | | 7% | | | 20% | | | 32% | | | 39% | | | 19% |
| | | | | | | | | | | | | | | | | | | |
(1)
| For an A Class Share outstanding for the entire period. Prior to March 30, 2019, A Class Shares were known as Investor Class Shares. |
(2)
| The per common share data for the years ended November 30, 2023, 2022, 2021, 2020, and 2019 do not reflect the change in estimate of investment income and return of capital. See Note 2 to the financial statements for further disclosure. |
(3)
| Total return does not reflect sales charges. |
(4)
| Not annualized for periods less than one year. |
(5)
| Annualized for periods less than one year. |
See accompanying Notes to Financial Statements.
Back to Table of Contents
Tortoise Energy Infrastructure Total Return Fund
Financial Highlights (Continued)
C Class
| | | | | | | |
Per Common Share Data(1)
| | | | | | | | | | | | | | | | | | |
Net asset value, beginning of period | | | $14.00 | | | $13.57 | | | $10.92 | | | $8.18 | | | $11.39 | | | $12.05 |
Investment operations:
| | | | | | | | | | | | | | | | | | |
Net investment income (loss)(2) | | | — | | | 0.01 | | | (0.15) | | | (0.07) | | | 0.05 | | | (0.01) |
Net realized and unrealized gain (loss) on investments and translations of foreign currency(2) | | | 1.74 | | | 0.98 | | | 3.28 | | | 3.23 | | | (2.94) | | | (0.23) |
Total from investment operations | | | 1.74 | | | 0.99 | | | 3.13 | | | 3.16 | | | (2.89) | | | (0.24) |
Less distributions from:
| | | | | | | | | | | | | | | | | | |
Net investment income | | | (0.14) | | | (0.35) | | | (0.08) | | | (0.16) | | | (0.11) | | | (0.15) |
Net realized gains | | | — | | | — | | | — | | | — | | | — | | | — |
Return of capital | | | (0.40) | | | (0.21) | | | (0.40) | | | (0.26) | | | (0.21) | | | (0.27) |
Total distributions | | | (0.54) | | | (0.56) | | | (0.48) | | | (0.42) | | | (0.32) | | | (0.42) |
Net asset value, end of period | | | $15.20 | | | $14.00 | | | $13.57 | | | $10.92 | | | $8.18 | | | $11.39 |
Total Return(3)(4) | | | 12.76% | | | 7.68% | | | 30.22% | | | 39.00% | | | (25.41)% | | | (2.13)% |
Supplemental Data and Ratios
| | | | | | | | | | | | | | | |
Net assets, end of period (in 000’s) | | | $ 18,987 | | | $ 19,548 | | | $ 22,356 | | | $ 20,625 | | | $ 19,530 | | | $ 37,888 |
Ratio of expenses to average net
assets(5) | | | 1.92% | | | 1.93% | | | 1.93% | | | 1.94% | | | 1.94% | | | 1.93% |
Ratio of expenses excluding interest expense to average net assets(5) | | | 1.92% | | | 1.93% | | | 1.93% | | | 1.93% | | | 1.94% | | | 1.93% |
Ratio of net investment income (loss) to average net assets(5) | | | 0.85% | | | 0.78% | | | 0.11% | | | (0.08)% | | | 0.64% | | | 0.01% |
Portfolio turnover rate(4) | | | 10% | | | 7% | | | 20% | | | 32% | | | 39% | | | 19% |
| | | | | | | | | | | | | | | | | | | |
(1)
| For a C Class Share outstanding for the entire period. |
(2)
| The per common share data for the years ended November 30, 2023, 2022, 2021, 2020, and 2019 do not reflect the change in estimate of investment income and return of capital. See Note 2 to the financial statements for further disclosure. |
(3)
| Total return does not reflect sales charges. |
(4)
| Not annualized for periods less than one year. |
(5)
| Annualized for periods less than one year. |
See accompanying Notes to Financial Statements.
Back to Table of Contents
Tortoise Energy Infrastructure and Income Fund
Financial Highlights (Continued)
Institutional Class
| | | | | | | |
Per Common Share Data(1)
|
Net asset value, beginning of period | | | $7.68 | | | $7.70 | | | $6.45 | | | $5.44 | | | $6.74 | | | $7.43 |
Investment operations:
|
Net investment income | | | 0.07 | | | 0.16(2) | | | 0.22 | | | 0.10 | | | 0.11(2) | | | 0.81 |
Net realized and unrealized gain (loss) on investments and translations of foreign currency | | | 0.72 | | | 0.29 | | | 1.50 | | | 1.38 | | | (0.91) | | | (0.82) |
Total from investment operations | | | 0.79 | | | 0.45 | | | 1.72 | | | 1.48 | | | (0.80) | | | (0.01) |
Less distributions from:
|
Net investment income | | | (0.03) | | | (0.19) | | | (0.14) | | | (0.07) | | | (0.08) | | | (0.01) |
Net realized gains | | | — | | | — | | | — | | | — | | | — | | | — |
Return of capital | | | (0.21) | | | (0.28) | | | (0.33) | | | (0.40) | | | (0.42) | | | (0.67) |
Total distributions | | | (0.24) | | | (0.47) | | | (0.47) | | | (0.47) | | | (0.50) | | | (0.68) |
Redemption fee proceeds | | | — | | | — | | | — | | | — | | | — | | | —(3) |
Net asset value, end of period | | | $8.23 | | | $7.68 | | | $7.70 | | | $6.45 | | | $5.44 | | | $6.74 |
Total Return(4) | | | 10.50% | | | 6.32% | | | 27.03% | | | 27.63% | | | (11.83)% | | | (0.29)% |
Supplemental Data and Ratios
| | | | | | | | | | | | | | | |
Net assets, end of period (in 000’s) | | | $ 454,557 | | | $ 431,332 | | | $ 458,578 | | | $ 353,595 | | | $ 291,420 | | | $ 628,295 |
Ratio of expenses to average net assets(5) | | | 1.12% | | | 1.13% | | | 1.13% | | | 1.16% | | | 1.14% | | | 1.17% |
Ratio of expenses excluding interest expense to average net assets(5) | | | 1.12% | | | 1.13% | | | 1.13% | | | 1.16% | | | 1.13% | | | 1.17% |
Ratio of net investment income to average net assets(5) | | | 2.09% | | | 2.17% | | | 1.83% | | | 1.00% | | | 2.02% | | | 1.68% |
Portfolio turnover rate(4) | | | 11% | | | 6% | | | 10% | | | 22% | | | 43% | | | 48% |
| | | | | | | | | | | | | | | | | | | |
(1)
| For an Institutional Class Share outstanding for the entire period.
|
(2)
| Per share amounts calculated using average shares method.
|
(3)
| Amount per share is less than $0.01.
|
(4)
| Not annualized for periods less than one year.
|
(5)
| Annualized for periods less than one year. |
See accompanying Notes to Financial Statements.
Back to Table of Contents
Tortoise Energy Infrastructure and Income Fund
Financial Highlights (Continued)
A Class
| | | | | | | |
Per Common Share Data(1)
|
Net asset value, beginning of period | | | $7.86 | | | $7.88 | | | $6.60 | | | $5.56 | | | $6.87 | | | $7.56 |
Investment operations:
|
Net investment income | | | 0.07 | | | 0.14(2) | | | 0.13 | | | 0.05 | | | 0.10(2) | | | 0.79 |
Net realized and unrealized gain (loss) on investments and translations of foreign currency | | | 0.74 | | | 0.30 | | | 1.61 | | | 1.44 | | | (0.93) | | | (0.80) |
Total from investment operations | | | 0.81 | | | 0.44 | | | 1.74 | | | 1.49 | | | (0.83) | | | (0.01) |
Less distributions from:
|
Net investment income | | | (0.03) | | | (0.18) | | | (0.14) | | | (0.06) | | | (0.07) | | | (0.01) |
Net realized gains | | | — | | | — | | | — | | | — | | | — | | | — |
Return of capital | | | (0.21) | | | (0.28) | | | (0.32) | | | (0.39) | | | (0.41) | | | (0.67) |
Total distributions | | | (0.24) | | | (0.46) | | | (0.46) | | | (0.45) | | | (0.48) | | | (0.68) |
Redemption fee proceeds | | | — | | | — | | | — | | | — | | | — | | | —(3) |
Net asset value, end of period | | | $8.43 | | | $7.86 | | | $7.88 | | | $6.60 | | | $5.56 | | | $6.87 |
Total Return(4)(5) | | | 10.45% | | | 6.10% | | | 26.67% | | | 27.19% | | | (11.96)% | | | (0.41)% |
Supplemental Data and Ratios
|
Net assets, end of period (in 000’s) | | | $51,853 | | | $48,599 | | | $45,741 | | | $38,146 | | | $32,256 | | | $45,492 |
Ratio of expenses to average net assets(6) | | | 1.37% | | | 1.38% | | | 1.38% | | | 1.41% | | | 1.39% | | | 1.42% |
Ratio of expenses excluding interest expense to average net assets(6) | | | 1.37% | | | 1.38% | | | 1.38% | | | 1.41% | | | 1.38% | | | 1.42% |
Ratio of net investment income to average net assets(6) | | | 1.84% | | | 1.92% | | | 1.58% | | | 0.75% | | | 1.76% | | | 1.43% |
Portfolio turnover rate(5) | | | 11% | | | 6% | | | 10% | | | 22% | | | 43% | | | 48% |
| | | | | | | | | | | | | | | | | | | |
(1)
| For an A Class Share outstanding for the entire period. |
(2)
| Per share amounts calculated using average shares method. |
(3)
| Amount per share is less than $0.01. |
(4)
| Total return does not reflect sales charges. |
(5)
| Not annualized for periods less than one year. |
(6)
| Annualized for periods less than one year. |
See accompanying Notes to Financial Statements.
Back to Table of Contents
Tortoise Energy Infrastructure and Income Fund
Financial Highlights (Continued)
C Class
| | | | | | | |
Per Common Share Data(1)
| | | | | | | | | | | | | | | | | | |
Net asset value, beginning of
period | | | $7.79 | | | $7.86 | | | $6.60 | | | $5.57 | | | $6.89 | | | $7.59 |
|
Investment operations:
| | | | | | | | | | | | | | | | | | |
Net investment income (loss) | | | (0.14) | | | 0.09(3) | | | (0.11) | | | (0.18) | | | 0.06(3) | | | 0.67 |
Net realized and unrealized gain (loss) on investments and translations of foreign currency | | | 0.92 | | | 0.29 | | | 1.79 | | | 1.63 | | | (0.94) | | | (0.75) |
Total from investment operations | | | 0.78 | | | 0.38 | | | 1.68 | | | 1.45 | | | (0.88) | | | (0.08) |
|
Less distributions from:
| | | | | | | | | | | | | | | | | | |
Net investment income | | | (0.02) | | | (0.18) | | | (0.12) | | | (0.06) | | | (0.07) | | | (0.01) |
Net realized gains | | | — | | | — | | | — | | | — | | | — | | | — |
Return of capital | | | (0.21) | | | (0.27) | | | (0.30) | | | (0.36) | | | (0.37) | | | (0.61) |
Total distributions | | | (0.23) | | | (0.45) | | | 0.42 | | | 0.42 | | | (0.44) | | | (0.62) |
Redemption fee proceeds | | | — | | | — | | | — | | | — | | | — | | | —(2) |
Net asset value, end of period | | | $8.34 | | | $7.79 | | | $7.86 | | | $6.60 | | | $5.57 | | | $6.89 |
Total Return(4)(5) | | | 10.10% | | | 5.27% | | | 25.76% | | | 26.35% | | | (12.72)% | | | (1.30)% |
Supplemental Data and Ratios
| | | | | | | | | | | | | | | |
Net assets, end of period
(in 000’s) | | | $ 18,249 | | | $ 19,135 | | | $ 24,339 | | | $ 23,303 | | | $ 23,650 | | | $ 46,979 |
Ratio of expenses to average net assets(6) | | | 2.12% | | | 2.13% | | | 2.13% | | | 2.16% | | | 2.14% | | | 2.17% |
Ratio of expenses excluding interest expense to average net assets(6) | | | 2.12% | | | 2.13% | | | 2.13% | | | 2.16% | | | 2.13% | | | 2.17% |
Ratio of net investment income to average net assets(6) | | | 1.09% | | | 1.17% | | | 0.83% | | | (0.00)% | | | 1.02% | | | 0.68% |
Portfolio turnover rate(5) | | | 11% | | | 6% | | | 10% | | | 22% | | | 43% | | | 48% |
| | | | | | | | | | | | | | | | | | | |
(1)
| For a C Class Share outstanding for the entire period.
|
(2)
| Amount per share is less than $0.01. |
(3)
| Per share amounts calculated using the average shares method. |
(4)
| Total return does not reflect sales charges. |
(5)
| Not annualized for periods less than one year. |
(6)
| Annualized for periods less than one year. |
See accompanying Notes to Financial Statements
Back to Table of Contents
Ecofin Global Renewables Infrastructure Fund
Financial Highlights (Continued)
Institutional Class
| | | | | | | | | | |
Per Common Share Data(2)
| | | | | | | | | | | | | | | |
Net asset value, beginning of period | | | $8.82 | | | $11.34 | | | $12.64 | | | $11.42 | | | $10.00 |
Investment operations:
| | | | | | | | | | | | | | | |
Net investment income | | | 0.07 | | | 0.19 | | | 0.11 | | | 0.15(3) | | | 0.04 |
Net realized and unrealized gain (loss) on investments and translations of foreign currency | | | 1.09 | | | (2.37) | | | (0.84) | | | 1.43 | | | 1.40 |
Total from investment operations | | | 1.16 | | | (2.18) | | | (0.73) | | | 1.58 | | | 1.44 |
Less distributions from:
| | | | | | | | | | | | | | | |
Net investment income | | | (0.09) | | | (0.12) | | | (0.24) | | | (0.31) | | | (0.02) |
Net realized gains | | | — | | | — | | | (0.21) | | | (0.05) | | | — |
Return of capital | | | (0.14) | | | (0.22) | | | (0.12) | | | — | | | — |
Total distributions | | | (0.23) | | | (0.34) | | | (0.57) | | | (0.36) | | | (0.02) |
Net asset value, end of period | | | $9.75 | | | $8.82 | | | $11.34 | | | $12.64 | | | $11.42 |
Total Return(4) | | | 13.22% | | | (19.47)% | | | (5.97)% | | | 14.02% | | | 14.43% |
Supplemental Data and Ratios
| | | | | | | | | | | | |
Net assets, end of period (in 000’s) | | | $271,383 | | | $230,043 | | | $352,726 | | | $368,864 | | | $108,048 |
Ratio of expenses to average net assets:
|
Before expense waiver/recoupment(5) | | | 0.93% | | | 0.93% | | | 0.90% | | | 0.96% | | | 1.46% |
After expense waiver/recoupment(5) | | | 0.93% | | | 0.93% | | | 0.91% | | | 1.00% | | | 1.00% |
Ratio of expenses excluding interest
expenses to average net assets:
|
Before expense waiver/recoupment(5) | | | 0.93% | | | 0.92% | | | 0.90% | | | 0.96% | | | 1.46% |
After expense waiver/recoupment(5) | | | 0.93% | | | 0.92% | | | 0.91% | | | 1.00% | | | 1.00% |
Ratio of net investment income to
average net assets:
|
Before expense waiver/recoupment(5) | | | 1.37% | | | 1.95% | | | 0.88% | | | 1.30% | | | 1.05% |
After expense waiver/recoupment(5) | | | 1.37% | | | 1.95% | | | 0.87% | | | 1.26% | | | 1.51% |
Portfolio turnover rate(4) | | | 25% | | | 61% | | | 40% | | | 41% | | | 20% |
| | | | | | | | | | | | | | | | |
(2)
| For an Institutional Class Share outstanding for the entire period. |
(3)
| Per share amounts calculated using average shares method. |
(4)
| Not annualized for periods less than one year. |
(5)
| Annualized for period less than one year. |
See accompanying Notes to Financial Statements.
Back to Table of Contents
Ecofin Global Renewables Infrastructure Fund
Financial Highlights (Continued)
A Class
| | | | | | | | | | | |
Per Common Share Data(2)
| |
Net asset value, beginning of period | | | $8.81 | | | $11.34 | | | $ 12.65 | | | $11.44 | | | $9.72 | |
Investment operations:
| |
Net investment income | | | 0.21 | | | 0.17 | | | 0.16 | | | 0.13(3) | | | 0.03 | |
Net realized and unrealized gain (loss) on investments and translations of foreign currency | | | 0.93 | | | (2.37) | | | (0.92) | | | 1.44 | | | 1.70 | |
Total from investment operations | | | 1.14 | | | (2.20) | | | (0.76) | | | 1.57 | | | 1.73 | |
Less distributions from:
| |
Net investment income | | | (0.08) | | | (0.12) | | | (0.23) | | | (0.31) | | | (0.01) | |
Net realized gains | | | — | | | — | | | (0.21) | | | (0.05) | | | — | |
Return of capital | | | (0.14) | | | (0.21) | | | (0.11) | | | — | | | — | |
Total distributions | | | (0.22) | | | (0.33) | | | (0.55) | | | (0.36) | | | (0.01) | |
Net asset value, end of period | | | $9.73 | | | $8.81 | | | $11.34 | | | $ 12.65 | | | $11.44 | |
Total Return(4)(5) | | | 13.10% | | | (19.66)% | | | (6.21)% | | | 13.66% | | | 17.82% | |
Supplemental Data and Ratios
| | | | | | | | | | | | | | | | |
Net assets, end of period (in 000’s) | | | $ 1,209 | | | $1,829 | | | $ 2,308 | | | $ 4,983 | | | $ 1,338 | |
Ratio of expenses to average net assets:
| |
Before expense waiver/recoupment(5) | | | 1.18% | | | 1.19% | | | 1.15% | | | 1.21% | | | 2.08% | |
After expense waiver/recoupment(5) | | | 1.18% | | | 1.19% | | | 1.16% | | | 1.25% | | | 1.25% | |
Ratio of expenses excluding interest
expenses to average net assets:
| |
Before expense waiver | | | 1.17% | | | 1.18% | | | 1.15% | | | 1.21% | | | 2.08% | |
After expense waiver | | | 1.17% | | | 1.18% | | | 1.16% | | | 1.25% | | | 1.25% | |
Ratio of net investment income to
average net assets:
| | | | | | | |
Before expense waiver/recoupment(5) | | | 1.13% | | | 1.70% | | | 0.63% | | | 1.05% | | | 2.43% | |
After expense waiver/recoupment(5) | | | 1.13% | | | 1.70% | | | 0.62% | | | 1.01% | | | 3.26% | |
Portfolio turnover rate(4) | | | 25% | | | 61% | | | 40% | | | 41% | | | 20% | |
| | | | | | | | | | | | | | | | | |
(2)
| For an A Class Share outstanding for the entire period. |
(3)
| Per share amounts calculated using average shares method. |
(4)
| Total return does not reflect sales charges. |
(5)
| Not annualized for periods less than one year. |
(6)
| Annualized for period less than one year. |
See accompanying Notes to Financial Statements.
Back to Table of Contents
Tortoise Funds
Notes to Financial Statements
May 31, 2024 (Unaudited)
1. Organization
Managed Portfolio Series (the “Trust”) was organized as a Delaware statutory trust on January 27, 2011. The Trust is registered under the Investment Company Act of 1940, as amended (the “1940 Act”), as an open-end management investment company. The Tortoise Energy Infrastructure Total Return Fund (“Energy Infrastructure Total Return Fund”, f/k/a Tortoise MLP & Pipeline Fund), the Tortoise Energy Infrastructure and Income Fund (“Energy Infrastructure and Income Fund and the Ecofin Global Renewables Infrastructure Fund (“Global Renewables Infrastructure Fund”) are each a non-diversified series with their own investment objectives and policies within the Trust. The Trust has evaluated the structure, objective and activities of the Funds and determined that they meet the characteristics of an investment company. As such, these financial statements have applied the guidance as set forth in the Accounting Standards Codifications (“ASC”) 946, Financial Services Investment Companies.
The investment objective of the Energy Infrastructure Total Return Fund is total return. The Energy Infrastructure Total Return Fund seeks to achieve its objective by investing primarily in equity securities of master limited partnerships (“MLPs”) and pipeline companies that own and operate a network of energy infrastructure asset systems that transport, store, distribute, gather and/or process crude oil, refined petroleum products (including biodiesel and ethanol), natural gas or natural gas liquids. The Energy Infrastructure Total Return Fund commenced operations on May 31, 2011.
The investment objective of the Energy Infrastructure and Income Fund is primarily to seek current income and secondarily to seek long-term capital appreciation. The Energy Infrastructure and Income Fund primarily invests in equity and debt securities of MLPs focused in the energy infrastructure sector and in equity and debt securities of other companies focused in the energy infrastructure sector. The Energy Infrastructure and Income Fund commenced operations on December 27, 2010.
The investment objective of the Global Renewables Infrastructure Fund is to generate long-term total return derived principally from a combination of capital appreciation and income over time. the Fund will principally focus its investment activities in equity securities of companies who are developers, owners and operators, in full or in part, of renewable electricity technology plants and systems, and related infrastructure investments. The Fund will typically emphasize those companies achieving measurable improvements in overall emissions, as defined as those gases and particles that are exhausted into the air as a result of fuel combustion-related activities, relative to their market peers. The Fund’s investments in equity securities may include investments in other investment companies, real estate investment trusts, foreign investment funds, preferred stocks, rights, warrants, convertible securities, and initial public offerings. The Fund will be invested in a range of both developed and non-developed markets, commensurate with its investment criteria. The Fund considers non-developed market countries to be those countries defined as such by the MSCI Market Classification Framework. The Global Renewables Infrastructure Fund commenced operations on August 7, 2020.
The Energy Infrastructure Total Return Fund and the Energy Infrastructure and Income Fund offers three classes of shares: the Institutional Class, the A Class and the C Class. The Global Renewables Infrastructure Fund offer two classes of shares: The Institutional Class and the A Class. Institutional Class shares have no sales charge and are offered only to qualifying institutional investors and certain other qualifying accounts. A Class shares may be subject to a front-end sales charge of up to 5.50%. C Class shares may be subject to a deferred sales charge of up to 1.00%.
2. Significant Accounting Policies
The Funds are investment companies and follows accounting and reporting guidance under Financial Accounting Standards Board Accounting Standards Codification (“ASC”) Topic 946, “Financial Services-Investment Companies. The following is a summary of significant accounting policies followed by the Fund in the preparation of its financial statements. These policies are in conformity with generally accepted accounting principles in the United States of America (“GAAP”).
Securities Valuation – All investments in securities are recorded at their estimated fair value, as described in Note 3.
Back to Table of Contents
Tortoise Funds
Notes to Financial Statements
May 31, 2024 (Unaudited) (Continued)
Foreign Currency Translation – The books and records relating to the Funds’ non-U.S. dollar denominated investments are maintained in U.S. dollars on the following bases: (1) market value of investment securities, assets, and liabilities are translated at the current rate of exchange; and (2) purchases and sales of investment securities, income, and expenses are translated at the relevant rates of exchange prevailing on the respective dates of such transactions. The Funds do not isolate the portion of gains and losses on investments in equity securities that is due to changes in the foreign exchange rates from that which is due to changes in market prices of equity securities. The Funds report certain foreign currency-related transactions as components of realized gains for financial reporting purposes, whereas such components are treated as ordinary income for federal income tax purposes.
Federal Income Taxes The Funds intend to meet the requirements of subchapter M of the Internal Revenue Code applicable to regulated investment companies and to distribute substantially all net taxable investment income and net realized gains to shareholders in a manner which results in no tax cost to the Funds. Therefore, no federal income or excise tax provision is required. As of November 30, 2023, the Funds did not have any tax positions that did not meet the “more-likely-than-not” threshold of being sustained by the applicable tax authority. The Funds recognize interest and penalties, if any, related to unrecognized tax benefits on uncertain tax positions as income tax expense in the Statements of Operations. During the period ended May 31, 2024, the Funds did not incur any excise tax expense. . The Global Renewables Infrastructure Fund, Energy Infrastructure Total Return Fund and the Energy Infrastructure and Income Fund are subject to examination by U.S. taxing authorities for the tax years ended November 30, 2020 through 2023.
Securities Transactions, Income and Distributions - Securities transactions are accounted for on the date the securities are purchased or sold (trade date). Realized gains and losses are reported on a specific identified cost basis. Interest income is recognized on an accrual basis, including amortization of premiums and accretion of discounts. Dividend income and distributions are recorded on the ex-dividend date. Withholding taxes on foreign dividends have been provided for in accordance with the Funds’ understanding of the applicable country’s tax rules and regulations. Distributions received from the Funds’ investments generally are comprised of ordinary income and return of capital. The Funds allocate distributions between investment income and return of capital based on estimates made at the time such distributions are received. Such estimates are based on information provided by each portfolio company and other industry sources. These estimates may subsequently be revised based on actual allocations received from the portfolio companies after their tax reporting periods are concluded, as the actual character of these distributions is not known until after the fiscal year end of the Funds.
During the period ended May 31, 2024, the Energy Infrastructure Total Return Fund reallocated the amount of return of capital recognized based on the 2023 tax reporting information received. The impact of this adjustment is a decrease to return of capital by approximately $1,097,522.
During the period ended May 31, 2024, the Energy Infrastructure and Income Fund reallocated the amount of return of capital recognized based on the 2023 tax reporting information received. The impact of this adjustment is an decrease to return of capital by approximately $346,008.
During the period ended May 31, 2024, the Global Renewables Infrastructure Fund reallocated the amount of return of capital recognized based on the 2023 information received. The impact of this adjustment is a increase to return of capital by approximately $899,789.
Use of Estimates – The preparation of financial statements in conformity with GAAP requires management to make estimates and assumptions that affect the reported amounts of assets and liabilities and disclosure of contingent assets and liabilities at the date of the financial statements and the reported amounts of revenues and expenses during the reporting period. Actual results could differ from those estimates.
Allocation of Income, Expenses and Gains/Losses – Income, expenses (other than those deemed attributable to a specific share class), and gains and losses of the Funds are allocated daily to each class of shares based upon the ratio of net assets represented by each class as a percentage of the net assets of each Fund. Expenses deemed directly attributable to a class of shares are recorded by the specific class. Most Fund expenses are allocated by class based on
Back to Table of Contents
Tortoise Funds
Notes to Financial Statements
May 31, 2024 (Unaudited) (Continued)
relative net assets. 12b-1 fees are expensed at 0.25% and 1.00% of average daily net assets of A Class shares and C Class shares, respectively. Trust expenses associated with a specific fund in the Trust are charged to that fund. Common Trust expenses are typically allocated evenly between the funds of the Trust, or by other equitable means.
Illiquid or Restricted Securities – A security may be considered illiquid if it lacks a readily available market. Securities are generally considered liquid if they can be sold or disposed of in the ordinary course of business within seven days at approximately the price at which the security is valued by the Funds. Illiquid securities may be valued under methods approved by the Board of Trustees as reflecting fair value. Each Fund will not hold more than 15% of the value of its net assets in illiquid securities. Certain restricted securities may be considered illiquid. Restricted securities are often purchased in private placement transactions, are not registered under the Securities Act of 1933, may have contractual restrictions on resale, and may be valued under methods approved by the Board of Trustees as reflecting fair value. At May 31, 2024, the Funds did not hold any illiquid securities.
Indemnifications – Under the Trust’s organizational documents, its officers and trustees are indemnified against certain liabilities arising out of the performance of their duties to the Trust. In addition, in the normal course of business, the Trust may enter into contracts that provide general indemnification to other parties. The Trust’s maximum exposure under these arrangements is unknown, as this would involve future claims that may be made against the Trust that have not yet occurred and may not occur. However, the Trust has not had prior claims or losses pursuant to these contracts and expects the risk of loss to be remote.
Cash and Cash Equivalents – Cash and cash equivalents include short-term, liquid investments with an original maturity of three months or less and include money market fund accounts.
3. Securities Valuation
The Funds have adopted fair value accounting standards, which establish an authoritative definition of fair value and set out a hierarchy for measuring fair value. These standards require additional disclosures about the various inputs and valuation techniques used to develop the measurements of fair value, a discussion of changes in valuation techniques and related inputs during the period and expanded disclosure of valuation levels for major security types. These inputs are summarized in the three broad levels listed below:
Level 1 –
| Quoted prices in active markets for identical assets or liabilities. |
Level 2 –
| Observable inputs other than quoted prices included in Level 1. These inputs may include quoted prices for similar instruments, interest rates, prepayment speeds, credit risk, yield curves, default rates and similar data. |
Level 3 –
| Significant unobservable inputs for the asset or liability, representing the Fund’s view of assumptions a market participant would use in valuing the asset or liability. |
Following is a description of the valuation techniques applied to each Fund’s major categories of assets and liabilities measured at fair value on a recurring basis. Each Fund’s investments are carried at fair value.
Common stock (including MLPs) – Securities that are primarily traded on a national securities exchange are valued at the last sale price on the exchange on which they are primarily traded on the day of valuation or, if there has been no sale on such day, at the mean between the bid and ask prices. Securities traded primarily on the Nasdaq Global Market System for which market quotations are readily available are valued using the Nasdaq Official Closing Price (“NOCP”). If the NOCP is not available, such securities are valued at the last sale price on the day of valuation, or if there has been no sale on such day, at the mean between the bid and ask prices. To the extent these securities are actively traded and valuation adjustments are not applied, they are categorized in Level 1 of the fair value hierarchy.
In the case of foreign securities, the occurrence of events after the close of foreign markets, but prior to the time the Funds’ NAV is calculated will result in an adjustment to the trading prices of foreign securities when foreign markets open on the following business day. The Fund will value foreign securities at fair value, taking into account such events in calculating the NAV. In such cases, use of fair valuation can reduce an investor’s ability to seek to profit by estimating
Back to Table of Contents
Tortoise Funds
Notes to Financial Statements
May 31, 2024 (Unaudited) (Continued)
the Funds’ NAV in advance of the time the NAV is calculated. All foreign securities, with the exception of Canadian securities and those listed on a U.S. exchange, have an adjustment applied to their trade price and therefore are automatically deemed to be in Level 2 of the fair value hierarchy.
Corporate and Municipal Bonds – Corporate and municipal bonds, including listed issues, are valued at fair value on the basis of valuation furnished by an independent pricing service which utilized both dealer-supplied valuations and formula-based techniques. The pricing service may consider recently executed transactions in securities of the issuer or comparable issuers, market price quotations (where observable), bond spreads, and fundamental data relating to the issuer. Most corporate and municipal bonds are categorized in Level 2 of the fair value hierarchy.
Investment Companies – Investments in other mutual funds, including money market funds, are valued at their net asset value per share. To the extent these securities are actively traded and valuation adjustments are not applied, they are categorized in Level 1 of the fair value hierarchy.
Restricted Securities – Restricted securities are subject to statutory or contractual restrictions on their public resale, which may make it more difficult to obtain a valuation and may limit a Fund’s ability to dispose of them. Investments in private placement securities and other securities for which market quotations are not readily available are valued in good faith by using fair value procedures. Such fair value procedures may consider factors such as discounts to publicly traded issues and time until conversion date.
Derivative Instruments – Listed derivatives, including options, rights, swaps, warrants and futures that are actively traded are valued based on quoted prices from the exchange and categorized in Level 1 of the fair value hierarchy.
The Board of Trustees (the “Board”) has adopted a pricing and valuation policy for use by the Funds and their Valuation Designee (as defined below) in calculating the Funds’ NAV. Pursuant to Rule 2a-5 under the 1940 Act, the Funds have designated Tortoise Capital Advisors, LLC (the “Adviser”) as their “Valuation Designee” to perform all of the fair value determinations as well as to perform all of the responsibilities that may be performed by the Valuation Designee in accordance with Rule 2a-5. The Valuation Designee is authorized to make all necessary determinations of the fair values of portfolio securities and other assets for which market quotations are not readily available or if it is deemed that the prices obtained from brokers and dealers or independent pricing services are unreliable.
The inputs or methodology used for valuing securities are not an indication of the risk associated with investing in those securities.
The following table is a summary of the inputs used to value each Fund’s securities by level within the fair value hierarchy as of May 31, 2024:
| |
Common stock | | | $1,851,079,518 | | | $ — | | | $ — | | | $1,851,079,518 |
Master limited partnerships | | | 581,196,362 | | | — | | | — | | | 581,196,362 |
Short-term investment | | | 61,459,325 | | | — | | | — | | | 61,459,325 |
Total investments in securities | | | $2,493,735,205 | | | $— | | | $— | | | $2,493,735,205 |
| | | | | | | | | | | | | |
| |
Common stock | | | $300,881,742 | | | $— | | | $ — | | | $300,881,742 |
Master limited partnerships | | | 116,704,655 | | | — | | | — | | | 116,704,655 |
Corporate bonds | | | — | | | 96,579,289 | | | — | | | 96,579,289 |
Short-term investment | | | 6,462,322 | | | — | | | — | | | 6,462,322 |
Total investments in securities | | | $424,048,719 | | | $96,579,289 | | | $— | | | $520,628,008 |
| | | | | | | | | | | | | |
Back to Table of Contents
Tortoise Funds
Notes to Financial Statements
May 31, 2024 (Unaudited) (Continued)
| |
Common stock
| | | | | | | | | | | | |
Belgium | | | $— | | | $3,513,732 | | | $ — | | | $3,513,732 |
Canada | | | 11,377,978 | | | — | | | — | | | 11,377,978 |
Denmark | | | | | | 8,871,138 | | | — | | | 8,871,138 |
France | | | — | | | 13,844,305 | | | — | | | 13,844,305 |
Hong Kong | | | — | | | 14,752,471 | | | — | | | 14,752,471 |
India | | | 13,656,403 | | | — | | | — | | | 13,656,403 |
Italy | | | — | | | 35,115,547 | | | — | | | 35,115,547 |
Japan | | | — | | | 4,420,810 | | | — | | | 4,420,810 |
Portugal | | | — | | | 14,804,802 | | | — | | | 14,804,802 |
Spain | | | — | | | 6,105,887 | | | — | | | 6,105,887 |
Switzerland | | | 5,999,943 | | | — | | | — | | | 5,999,943 |
Thailand | | | 2,379,212 | | | — | | | — | | | 2,379,212 |
United Kingdom | | | 18,884,376 | | | — | | | — | | | 18,884,376 |
United States | | | 106,287,348 | | | — | | | — | | | 106,287,348 |
Short-term investment | | | 709,026 | | | — | | | — | | | 709,026 |
Total investments in securities | | | $159,294,286 | | | $101,428,692 | | | $— | | | $260,722,978 |
| | | | | | | | | | | | | |
As of May 31, 2024, the Fund’s investments in other financial instruments* were classified as follows:
| | | | | | | | | | | | | |
Swap Contracts | | | $ — | | | $ 216,585 | | | $ — | | | $ 216,585 |
Total Other Financial Instruments | | | $ — | | | $ 216,585 | | | $ — | | | $ 216,585 |
| | | | | | | | | | | | | |
*
| Other financial instruments are derivative instruments not reflected in the Schedule of Investments, such as futures, swap contracts and written options. Swap contracts are presented at the unrealized appreciation (depreciation) on the instruments. |
Refer to each Fund’s Schedule of Investments for additional industry information.
4. Derivatives Transactions
The Funds may use derivatives for different purposes, such as a substitute for taking a position in the underlying asset and/or as part of a strategy designed to reduce exposure to other risks, such as interest rate or currency risk. The various derivative instruments that the Funds may use are options, futures contracts and options on futures contracts and other derivative securities. The Funds may also use derivatives for leverage, in which case their use would involve leveraging risk. A Fund investing in a derivative instrument could lose more than the principal amount invested.
FASB Accounting Standards Codification 815, Derivatives and Hedging (“ASC 815”) requires enhanced disclosures about each Fund’s use of, and accounting for, derivative instruments and the effect of derivative instruments on each Fund’s results of operations and financial position. Tabular disclosure regarding derivative fair value and gain/loss by contract type (e.g., interest rate contracts, foreign exchange contracts, credit contracts, etc.) is required and derivatives accounted for as hedging instruments under ASC 815 must be disclosed separately from those that do not qualify for hedge accounting. Even though the Funds may use derivatives in an attempt to achieve an economic hedge, the Funds’ derivatives are not accounted for as hedging instruments under ASC 815 because investment companies account for their derivatives at fair value and record any changes in fair value in current period earnings.
For the year ended May 31, 2024, the Funds’ average quarterly notional values are as follows:
| | | | |
Global Renewables Infrastructure Fund | | | 9,939,332 |
| | | | |
Back to Table of Contents
Tortoise Funds
Notes to Financial Statements
May 31, 2024 (Unaudited) (Continued)
The locations on the Statements of Assets and Liabilities of the Funds’ derivative positions by type of exposure, all of which are not accounted for as hedging instruments under ASC 815, are as follows:
Values of Derivative Instruments as of May 31, 2024, on the Statements of Assets and Liabilities:
Global Renewables Infrastructure Fund
| | | | | | | |
Equity Contracts – Swap Contracts | | | Net Assets – unrealized appreciation on swap contracts** | | | $216,585 | | | Net Assets – unrealized depreciation on swap contracts** | | | $ — |
| | | | | | | | | | | | | |
**
| Includes cumulative appreciation/depreciation on swap contracts as reported in the Schedule of Open Swap Contracts. |
The effect of Derivative Instruments on the Statements of Operations for the period ended May 31, 2024:
Amount of Realized Gain (Loss) on Derivatives
| | | | |
Equity Contracts | | | $1,785,198 |
| | | | |
Change in Unrealized Appreciation or (Depreciation) on Derivatives
Balance Sheet Offsetting Information
The following table provides a summary of offsetting financial liabilities and derivatives and the effect of derivative instruments on the Statements of Assets and Liabilities as of May 31, 2024.
| | | | | | | |
Assets:
| |
Swap Contracts | | | $216,585 | | | $ — | | | $216,585 | | | $ — | | | $216,585 | | | $ — |
Liabilities:
| | | | | | | | | | | | | | | | | | |
Swap Contracts | | | $— | | | $— | | | $— | | | $— | | | $— | | | $— |
| | | | | | | | | | | | | | | | | | | |
During the ordinary course of business, the Funds may enter into transactions subject to enforceable netting agreements or other similar arrangements (“netting agreements”). Generally, the right to offset in netting agreements allows the Funds to offset any exposure to a specific counterparty with any collateral received or delivered to that counterparty based on the terms of the agreement. Generally, each fund manages its cash collateral and securities collateral on a counterparty basis. As of May 31, 2024, the Funds did not enter into any netting agreements which would require any portfolio securities to be netted.
Back to Table of Contents
Tortoise Funds
Notes to Financial Statements
May 31, 2024 (Unaudited) (Continued)
5. Concentration Risk & General Risk
The Energy Infrastructure Total Return Fund seeks to achieve its investment objective by investing, under normal market conditions, at least 80% of its net assets in securities of MLP and pipeline companies. Funds that primarily invest in a particular sector may experience greater volatility than funds investing in a broad range of industry sectors.
The Energy Infrastructure and Income Fund seeks to achieve their investment objective by investing, under normal market conditions, at least 80% of its net assets in securities of companies focused in the energy infrastructure sector. Funds that primarily invest in a particular sector may experience greater volatility than funds investing in a broad range of industry sectors.
The Global Renewables Infrastructure Fund seeks to achieve its investment objective by investing, under normal market conditions, at least 80% of its net assets in securities of renewable infrastructure companies. Funds that primarily invest in a particular sector may experience greater volatility than funds investing in a broad range of industry sectors.
6. Investment Advisory Fee and Other Transactions with Affiliates
The Trust has an agreement with Tortoise Capital Advisors, L.L.C. (the “Adviser”) to furnish investment advisory services to the Funds. Pursuant to an Investment Advisory Agreement between the Trust and the Adviser, the Adviser is entitled to receive, on a monthly basis, an annual advisory fee equal to 0.75% for the Global Renewables Infrastructure Fund, 0.85% for the Energy Infrastructure Total Return Fund, and 1.00% for the Energy Infrastructure and Income Fund of each Fund’s average daily net assets.
The Funds’ Adviser has contractually agreed to reimburse the Fund for its expenses to ensure that total annual operating expenses (excluding distribution fees, acquired fund fees and expenses, interest, taxes, brokerage commissions and extraordinary expenses) for each Fund do not exceed 1.00% for the Global Renewables Infrastructure Fund, 1.10% for the Energy Infrastructure Total Return Fund and 1.25% for the Energy Infrastructure and Income Fund of the average daily net assets of each Fund. Expenses reimbursed by the Adviser may be recouped by the Adviser for a period of thirty-six months following the date on which such reimbursement was made if such recoupment can be achieved without exceeding the expense limit in effect at the time the expense reimbursement occurred and at the time of recoupment. The Operating Expense Limitation Agreement is intended to be continual in nature and cannot be terminated within a year after the effective date of the Fund’s prospectus.
U.S. Bancorp Fund Services, LLC, doing business as U.S. Bank Global Fund Services (“Fund Services” or the “Administrator”) acts as the Funds’ Administrator, Transfer Agent and fund accountant. U.S. Bank, N.A. (the “Custodian”) serves as the custodian to the Funds. The Custodian is an affiliate of the Administrator. The Administrator performs various administrative and accounting services for the Funds. The Administrator prepares various federal and state regulatory filings, reports and returns for the Funds; prepares reports and materials to be supplied to the Trustees; monitors the activities of the Funds’ custodian; coordinates the payment of the Funds’ expenses and reviews the Funds’ expense accruals. The officers of the Trust including the Chief Compliance Officer are employees of the Administrator. As compensation for its services, the Administrator is entitled to a monthly fee at an annual rate of 0.07% of the first $125 million of the average daily net assets of each fund, 0.05% on the next $250 million of the average daily net assets and 0.0325% of the daily average net assets in excess of $375 million, subject to an annual minimum of $60,000 per fund. Fees paid by the Funds for administration and accounting, transfer agency, custody and compliance services for the year ended May 31, 2024 are disclosed in the Statements of Operations.
7. Distribution Costs
The Energy Infrastructure Total Return Fund and Energy Infrastructure and Income Fund have adopted a Distribution Plan pursuant to Rule 12b-1 (the “Plan”) in the A Class and the C Class. The Global Renewables Infrastructure Fund have adopted a Distribution Plan pursuant to Rule 12b-1 in the A Class. The Plan permits each Fund to pay for distribution and related expenses at an annual rate of 0.25% of the A Class and 1.00% of the C Class average
Back to Table of Contents
Tortoise Funds
Notes to Financial Statements
May 31, 2024 (Unaudited) (Continued)
daily net assets. The expenses covered by the Plan may include the cost of preparing and distributing prospectuses and other sales material, advertising and public relations expenses, payments to financial intermediaries and compensation of personnel involved in selling shares of the Funds. For the period ended May 31, 2024, expenses incurred by the A Class and C Class pursuant to the Plan were as follows:
| | | | | | | |
Energy Infrastructure Total Return Fund | | | $ 258,112 | | | $ 93,030 |
Energy Infrastructure and Income Fund | | | 61,953 | | | 90,492 |
Global Renewables Infrastructure Fund | | | 1,828 | | | N/A |
| | | | | | | |
8. Investment Transactions
The aggregate purchases and sales, excluding U.S. government securities and short-term investments, by the Funds for the period ended May 31, 2024, were as follows:
| | | | | | | |
Energy Infrastructure Total Return Fund | | | $ 304,592,656 | | | $ 225,364,303 |
Energy Infrastructure and Income Fund | | | 56,305,183 | | | 75,206,467 |
Global Renewables Infrastructure Fund | | | 75,727,701 | | | 58,632,901 |
| | | | | | | |
9. Federal Tax Information
As of November 30, 2023, the Funds’ most recent fiscal year end, cost basis of investments for federal income tax purposes and the components of accumulated losses on a tax basis were as follows:
| | | | | | | | | | |
Cost of investments | | | $1,548,910,672 | | | $299,010,430 | | | $276,883,011 |
Gross unrealized appreciation | | | $853,270,738 | | | $220,995,244 | | | $8,043,920 |
Gross unrealized depreciation | | | (417,475,033) | | | (84,208,167) | | | (65,114,992) |
Net unrealized appreciation (depreciation) | | | 435,795,705 | | | 136,787,057 | | | (57,071,072) |
Undistributed ordinary income | | | — | | | — | | | — |
Undistributed long-term capital gain | | | — | | | — | | | — |
Total distributable earnings | | | — | | | — | | | — |
Other accumulated losses | | | (808,137,030) | | | (430,369,267) | | | (12,049,854) |
Total accumulated gain (loss) | | | $(372,341,325) | | | $(293,582,210) | | | $(69,120,926) |
| | | | | | | | | | |
The difference between book and tax-basis cost is attributable primarily to wash sales and MLP adjustments, if any.
As of November 30, 2023, the Energy Infrastructure Total Return Fund and the Energy Infrastructure and Income Fund had short-term capital loss carryforwards of $55,033,781 and $149,606,972, respectively, and the Energy Infrastructure Total Return Fund, Energy Infrastructure and Income Fund and Ecofin Global Renewables Infrastructure Fund had long-term capital loss carryforwards of $753,103,249, $148,997,698 and $12,049,854, respectively, which may be carried forward for an unlimited period under the Regulated Investment Company Modernization Act of 2010. In addition to the total capital loss carryforward, the Energy Infrastructure and Income Fund has a short-term carryforward of $60,744,580 and a long-term carryforward of $71,019,832 that it inherited as the result of the merger with Tortoise MLP & Energy Infrastructure Fund. These capital loss carryforwards are further subject to an initial annual limitation of $147,395 and $175,344 in short-term and long-term carryforwards, respectively, pursuant to Section 382. To the extent the Funds realize future net capital gains, those gains will be offset by any unused capital loss carryforwards. Capital loss carryforwards will retain their character as either short-term or long-term capital losses.
Back to Table of Contents
Tortoise Funds
Notes to Financial Statements
May 31, 2024 (Unaudited) (Continued)
Thus, such losses must be used first to offset gains of the same character; for example, long-term loss carryforwards will first offset long-term gains, before they can be used to offset short-term gains. For the Energy Infrastructure Total Return Fund and Energy Infrastructure and Income Fund, the capital gains and losses have been estimated based on information currently available and are subject to revision upon receipt of the 2023 tax reporting information from the individual MLPs.
In order to meet certain excise tax distribution requirements, the Funds are required to measure and distribute annually net capital gains realized during a twelve month period ending November 30 and net investment income earned during a twelve month period ending December 31. In connection with this, the Funds are permitted for tax purposes to defer into their next fiscal year qualified late year losses. Qualified late year ordinary losses are any net ordinary capital losses incurred between January 1 and the end of their fiscal year, November 30, 2023. For the taxable year ended November 30, 2023, The Energy Infrastructure Total Return Fund, the Energy Infrastructure and Income Fund and the Global Renewables Infrastructure Fund do not plan to defer any late year losses.
During the period ended May 31, 2024, the Funds paid the following distributions to shareholders:
| | | | | | | | | | |
Ordinary income* | | | $24,195,250 | | | $614,408 | | | $2,179,169 |
Long-term capital gains** | | | — | | | — | | | — |
Return of capital | | | 60,644,625 | | | 14,840,427 | | | 4,001,587 |
Total distributions | | | $84,839,875 | | | $15,454,835 | | | $6,180,756 |
| | | | | | | | | | |
During the year ended November 30, 2023, the Funds paid the following distributions to shareholders:
| | | | | | | | | | |
Ordinary income* | | | $62,161,136 | | | $12,445,350 | | | $1,804,062 |
Long-term capital gains** | | | — | | | — | | | — |
Return of capital | | | 35,654,813 | | | 18,676,484 | | | 8,107,285 |
Total distributions | | | $97,815,949 | | | $31,121,834 | | | $9,911,347 |
| | | | | | | | | | |
*
| For federal income tax purposes, distributions of short-term capital gains are treated as ordinary income distributions.
|
**
| The Funds designate as long-term capital gain distributions, pursuant to Internal Revenue Code Section 852(b)(3)(c). |
10. Line of Credit
The Funds have established a line of credit (“LOC”) in the amount of $150,000,000. Borrowings under the loan agreement are charged an interest rate equal to prime, 8.50% as of May 31, 2024. This LOC is intended to provide short-term financing, if necessary, subject to certain restrictions, in connection with shareholder redemptions. The credit facility is with the Funds custodian, U.S. Bank, N.A. During the period ended May 31, 2024, the Energy Infrastructure Total Return Fund did not draw upon its LOC. During the period ended May 31, 2024, the LOC activity in the Energy Infrastructure and Income Fund and Global Renewables Infrastructure Fund was as follows:
| | | | | | | | | | |
Energy Infrastructure and Income Fund | | | $3,049 | | | 8.50% | | | $ — |
Global Renewables Infrastructure Fund | | | 157,197 | | | 8.50% | | | $— |
| | | | | | | | | | |
Back to Table of Contents
Tortoise Funds
Notes to Financial Statements
May 31, 2024 (Unaudited) (Continued)
11. Control Ownership
The beneficial ownership, either directly or indirectly, of more than 25% of the voting securities of a fund creates a presumption of control of the fund, under Section 2(a)(9) of the Investment Company Act of 1940. As of May 31, 2024, each Fund’s percentage of control ownership positions greater than 25% are as follows:
| | | | | | | |
Energy Infrastructure and Income Fund | | | Merrill Lynch, Pierce, Fenner & Smith Inc. | | | 37.71% |
Global Renewables Infrastructure Fund | | | Charles Schwab & Co Inc. | | | 30.26% |
Global Renewables Infrastructure Fund | | | JP Morgan Securities, LLC | | | 28.57% |
Global Renewables Infrastructure Fund | | | National Financial Services, LLC | | | 28.17% |
| | | | | | | |
Back to Table of Contents
APPROVAL OF INVESTMENT ADVISORY AGREEMENT – Tortoise Capital Advisors, L.L.C.
APPROVAL OF INVESTMENT SUB-ADVISORY AGREEMENT — Ecofin Advisors Limited (Unaudited)
At the regular meeting of the Board of Trustees of Managed Portfolio Series (“Trust”) on February 21-22, 2024, the Trust’s Board of Trustees (“Board”), including all of the Trustees who are not “interested persons” of the Trust, as that term is defined in Section 2(a)(19) of the Investment Company Act of 1940, as amended (“Independent Trustees”), considered and approved the continuation of the Investment Advisory Agreement between the Trust and Tortoise Capital Advisors, L.L.C. (“Tortoise” or the “Adviser”) regarding the Tortoise Energy Infrastructure Total Return Fund, Tortoise Energy Infrastructure and Income Fund and Ecofin Global Renewables Infrastructure Fund (each a “Fund” or collectively, the “Funds”) (the “Investment Advisory Agreement”), and the investment sub-advisory agreement between Tortoise and Ecofin Advisors Limited (“Ecofin” or the “Sub-Adviser”) regarding the Ecofin Global Renewables Infrastructure Fund (the “Investment Sub-Advisory Agreement), each for another annual term.
Prior to this meeting and at a meeting held on January 4, 2024, the Trustees received and considered information from Tortoise, Ecofin and the Trust’s administrator designed to provide the Trustees with the information necessary to evaluate the continuance of the Investment Advisory Agreement and the Investment Sub-Advisory Agreement (“Support Materials”). Before voting to approve the continuance of the Investment Advisory Agreement and the Investment Sub-Advisory Agreement, the Trustees reviewed the Support Materials with Trust management and with counsel to the Independent Trustees, and received a memorandum and advice from such counsel discussing the legal standards for the Trustees’ consideration of the renewal of the Investment Advisory Agreement and the Investment Sub-Advisory Agreement. This information, together with the information provided to the Board throughout the course of the year, formed the primary (but not exclusive) basis for the Board’s determinations.
In determining whether to continue the Investment Advisory Agreement and the Investment Sub-Advisory Agreement, the Trustees considered all factors they believed relevant, including the following with respect to each Fund: (1) the nature, extent, and quality of the services provided by Tortoise with respect to the Fund and the Sub-Adviser with respect to the Ecofin Global Renewables Infrastructure Fund; (2) the Fund’s historical performance and the performance of other investment accounts managed by Tortoise and Ecofin; (3) the costs of the services provided by Tortoise and the profits realized by Tortoise from services rendered to the Fund; (4) comparative fee and expense data for the Fund and other investment companies with similar investment objectives; (5) the extent to which economies of scale may be realized as the Fund grows, and whether the advisory fee for the Fund reflects such economies of scale for the Fund’s benefit; and (6) other benefits to Tortoise and its affiliates, and the Sub-Adviser as applicable, resulting from services rendered to the Fund. The Trustees also weighed to varying degrees the importance of the information provided to them, did not identify any particular information that was all-important or controlling, and considered the information and made its determinations for each Fund separately and independently of the other Funds.
Based upon the information provided to the Board throughout the course of the year, including a presentation to the Board by representatives of Tortoise, and the Support Materials, the Board concluded that the overall arrangements between the Trust and Tortoise as set forth in the Investment Advisory Agreement, as it relates to each Fund, and between Tortoise and Ecofin as set forth in the Investment Sub-Advisory Agreement, as it relates to the Ecofin Global Renewables Infrastructure Fund, continue to be fair and reasonable in light of the services that Tortoise and Ecofin perform, the investment advisory fees that each Fund pays, and such other matters as the Trustees considered relevant in the exercise of their reasonable business judgment. The material factors and conclusions that formed the basis of the Trustees’ determination to approve the continuation of the Investment Advisory Agreement, as it relates to each Fund, and the Investment Sub-Advisory Agreement, as it relates to the Ecofin Global Renewables Infrastructure Fund, are summarized below.
Nature, Extent and Quality of Services Provided. The Trustees considered the scope of services that Tortoise provides under the Investment Advisory Agreement with respect to each Fund, noting that such services include, but are not limited to, the following: (1) providing for, and supervising through the use of the Sub-Adviser where applicable, the general management and investment of the Fund’s investment portfolio; (2) determining, or where applicable overseeing the determination by the Sub-Adviser, the portfolio securities to be purchased, sold, or otherwise disposed of, and the timing of such transactions; (3) voting proxies, if any, with respect to the Fund’s portfolio securities; (4) maintaining the required books and records for transactions that Tortoise or the Sub-Adviser effect on behalf of the Fund; (5) selecting, or where applicable overseeing the selection by the Sub-Adviser of, broker-dealers to execute orders on behalf of the Fund; and (6) monitoring and maintaining the Fund’s compliance with policies and procedures of the Trust and with applicable securities laws. The Trustees reviewed Tortoise’s assets under management, financial
Back to Table of Contents
APPROVAL OF INVESTMENT ADVISORY AGREEMENT – Tortoise Capital Advisors, L.L.C.
APPROVAL OF INVESTMENT SUB-ADVISORY AGREEMENT — Ecofin Advisors Limited (Unaudited) (Continued)
statements, and capitalization. In that regard, the Trustees concluded that Tortoise had sufficient resources to support the management of the Funds. The Trustees considered the specialized investment strategies that Tortoise uses to manage the Funds, Tortoise’s experience in implementing similar strategies, and the significant investment experience of Tortoise and its portfolio managers in the energy industry. The Trustees concluded that they were satisfied with the nature, extent, and quality of services that Tortoise provides to the Funds under the Investment Advisory Agreement.
Similar to the review of Tortoise, the Trustees considered the scope of services that Ecofin provides under its Investment Sub-Advisory Agreement, noting that such services include, but are not limited to, the following with respect to the assets managed for the Ecofin Global Renewables Infrastructure Fund: (1) investing the Fund’s assets consistent with the Fund’s investment objective and investment policies; (2) maintaining the required books and records for transactions that the Sub-Adviser effects on behalf of the Fund; (3) selecting broker-dealers to execute orders on behalf of the Fund; and (4) monitoring and maintaining the Fund’s compliance with policies and procedures of the Trust and with applicable securities laws. The Trustees considered Ecofin’s capitalization as well as other affiliated investment advisers in the TortoiseEcofin family of advisers. In that regard, the Trustees concluded that Ecofin had sufficient resources to support the management of the Fund. The Trustees concluded that they are satisfied with the nature, extent and quality of services that Ecofin provides to the Ecofin Global Renewables Infrastructure Fund under the Investment Sub-Advisory Agreement.
Fund Historical Performance and the Overall Performance of Tortoise. In assessing the quality of the portfolio management delivered by Tortoise and Ecofin, the Trustees reviewed the short-term and longer-term performance of each Fund on both an absolute basis and in comparison to an appropriate securities benchmark index, each Fund’s Morningstar category (“Category”) as well as a smaller sub-set of peer funds (“Cohort”), and each Fund’s respective composite of separate accounts that Tortoise or Ecofin, as applicable, manages utilizing similar investment strategies as that of the Fund. When reviewing each Fund’s performance against its respective Category and Cohort, the Trustees took into account that the investment objective and strategies of each Fund, as well as the Fund’s level of risk tolerance, may differ significantly from funds in its Category and Cohort.
| • | Tortoise Energy Infrastructure Total Return Fund. The Trustees noted that the Fund had outperformed its Category and Cohort averages over the ten-year period ended September 30, 2023, and its Category average over the five-year period ended September 30, 2023, but had underperformed its Category and Cohort averages for all other periods presented. The Trustees also noted that the Fund’s A Class and Institutional Class had outperformed its benchmark index over the three-year period ended September 30, 2023, but had underperformed for all other periods presented. The Trustees noted that the Fund’s C Class did not perform as well against the benchmark index, but that this class has a 12b-1 fee, which is not necessarily the case for the funds included in the Category and Cohort. The Trustees observed that the Fund’s performance was generally consistent with the performance of a composite of similar accounts managed by Tortoise over all relevant time periods. |
| • | Tortoise Energy Infrastructure and Income Fund. The Trustees noted that the Fund had outperformed its Category and Cohort averages for the five-year and ten-year periods ended September 30, 2023, but had underperformed the Category and Cohort averages over all other periods presented. The Trustees also noted that the Fund’s A Class and Institutional Class had outperformed its benchmark index over the ten-year and since inception periods ended September 30, 2023, but had underperformed for all other periods presented. The Trustees noted that the Fund’s C Class did not perform as well against the benchmark index, but that this class has a 12b-1 fee, which is not necessarily the case for the funds included in the Category and Cohort. The Trustees observed that the Fund’s performance was generally consistent with the performance of a composite of similar accounts managed by Tortoise over all relevant time periods. The Trustees noted that the Fund’s performance included performance of a predecessor fund that was reorganized into to the Fund. |
| • | Ecofin Global Renewables Infrastructure Fund. The Trustees noted that the Fund had underperformed the Category and Cohort averages for all periods presented as of September 30, 2023. The Trustees also noted that the Fund had outperformed its benchmark index for the five-year and since inception periods ended September 30, 2023, but had underperformed during more recent periods. The Trustees observed that the |
Back to Table of Contents
APPROVAL OF INVESTMENT ADVISORY AGREEMENT – Tortoise Capital Advisors, L.L.C.
APPROVAL OF INVESTMENT SUB-ADVISORY AGREEMENT — Ecofin Advisors Limited (Unaudited) (Continued)
Fund’s performance was generally consistent with the performance of a composite of similar accounts managed by Ecofin over all relevant time periods. The Trustees noted that the Fund’s performance included performance of a predecessor fund that was reorganized into to the Fund.
Cost of Advisory Services and Profitability. The Trustees considered the annual advisory fees that each Fund pays to Tortoise under the Investment Advisory Agreement, as well as Tortoise’s profitability from services that Tortoise and its affiliates rendered to each Fund during the 12-month period ended September 30, 2023. The Trustees also noted favorably that Tortoise had agreed to continue the expense limitation agreement under which Tortoise contractually agreed to reimburse each Fund for operating expenses, as specified in the Funds’ prospectus. The Trustees further noted that Tortoise had recouped a portion of previously reimbursed expenses for the Ecofin Global Renewables Infrastructure Fund during the most recent fiscal year. The Trustees also considered that while the management fees that Tortoise charges to other client accounts, each with similar investment strategies to those of the Funds, may be higher or lower than the advisory fee for the Funds (depending upon the type of account or vehicle, size of the account, relationship and/or nature and level of services provided, among other factors), Tortoise has additional responsibilities with respect to the Funds. The Trustees considered the reasonableness of the profits from Tortoise’s service relationship with each of the Tortoise Energy Infrastructure Total Return Fund and Tortoise Energy Infrastructure and Income Fund, and noted that its service relationship with the Ecofin Global Renewables Infrastructure Fund has not been profitable.
The Trustees also considered the annual sub-advisory fee that Tortoise pays to Ecofin under its Investment Sub-Advisory Agreement. The Trustees noted that because the sub-advisory fees are paid by Tortoise, the overall advisory fee paid by the Ecofin Global Renewables Infrastructure Fund is not directly affected by the sub-advisory fees paid to Ecofin. Consequently, the Trustees did not consider the costs of services provided by Ecofin or the profitability of its relationship with the Fund to be material factors for consideration.
Comparative Fee and Expense Data. The Trustees considered a comparative analysis of contractual expenses borne by each Fund and those of funds in the same Category and Cohort as of September 30, 2023.
| • | Tortoise Energy Infrastructure Total Return Fund. The Trustees noted that the Fund’s management fee and total expenses for A Class, T Class and Institutional Class were each lower than the Category and Cohort averages. The Trustees also noted that while the total expenses of the C Class were above the Category and Cohort averages, the C Class has a Rule 12b-1 fee, which is not necessarily the case for the funds included in the Category and Cohort. |
| • | Tortoise Energy Infrastructure and Income Fund. The Trustee’s noted that the Fund’s management fee was lower than the Cohort average, although higher than the Category average. The Trustees also noted that the Fund’s total expenses for Institutional Class were lower than the Category and Cohort averages, but that the total expenses of the C Class were above the Category and Cohort averages and the total expenses of A Class were above the Cohort average but below the Category average. The Trustees further noted that A Class and C Class each have a Rule 12b-1 fee, which is not necessarily the case for the funds included in the Category and Cohort |
| • | Ecofin Global Renewables Infrastructure Fund. The Trustees noted that the Fund’s management fee and total expenses for Institutional Class were each less than or equal to the Category and Cohort averages. The Trustees also noted that while the total expenses of the A Class were above the Category and Cohort averages, the A Class has a Rule 12b-1 fee, which is not necessarily the case for the funds included in the Category and Cohort. |
While recognizing that it is difficult to compare advisory fees because the scope of advisory services provided may vary from one investment adviser to another, the Trustees concluded that Tortoise’s advisory fee with respect to each Fund continues to be reasonable and that the portion of Tortoise’s advisory fee for the Ecofin Global Renewables Infrastructure Fund that it allocates to the Sub-Adviser continues to be reasonable.
Economies of Scale. The Trustees considered whether the Funds may benefit from any economies of scale, noting that the investment advisory fees for the Funds do not contain breakpoints. The Trustees also considered that the
Back to Table of Contents
APPROVAL OF INVESTMENT ADVISORY AGREEMENT – Tortoise Capital Advisors, L.L.C.
APPROVAL OF INVESTMENT SUB-ADVISORY AGREEMENT — Ecofin Advisors Limited (Unaudited) (Continued)
investment advisory fee for each Fund was in the 1st or 2nd quartile of its Category and Cohort. The Trustees further noted that with the current advisory fees set at a competitive level for each Fund, breakpoints were not necessary at this time, but that they would revisit the issue in the future for each of the Funds as circumstances change and asset levels increase.
Other Benefits. The Trustees considered the direct and indirect benefits that could be realized by the Adviser and its affiliates from its relationship with each Fund. The Trustees also considered the direct and indirect benefits that could be realized by the Sub-Adviser from its relationship with the Ecofin Global Renewables Infrastructure Fund. The Trustees noted that Tortoise and Ecofin do not utilize soft dollar arrangements with respect to portfolio transactions and that Tortoise and Ecofin do not use affiliated brokers to execute any Fund portfolio transactions. While the Trustees noted Rule 12b-1 fees may be paid for shareholder and distribution services performed on behalf of the Funds, the Trustees also observed that Tortoise was incurring its own distribution expenses on behalf of the Funds. The Trustees considered that Tortoise or Ecofin may receive some form of reputational benefit from services rendered to the Funds, but that such benefits are immaterial and cannot otherwise be quantified. The Trustees concluded that Tortoise and Ecofin do not receive additional material benefits from their relationships with the Funds.
Back to Table of Contents
Additional Information (unaudited)
Availability of Fund Portfolio Information
The Fund files complete schedules of portfolio holdings with the SEC for the first and third quarters of each fiscal year on Part F of Form N-PORT. The Funds’ Part F of Form N-PORT is available on the SEC’s website at www.sec.gov and may be reviewed and copied at the SEC’s Public Reference Room in Washington, D.C. Information on the operation of the Public Reference Room may be obtained by calling 1-800-732-0330. The Funds’ Part F of Form N-PORT may also be obtained by calling toll-free 1-855-TCA-Fund or 1-855-822-3863.
Availability of Proxy Voting Information
A description of the Funds’ Proxy Voting Policies and Procedures is available without charge, upon request, by calling 1-855-TCA-Fund or 1-855-822-3863. Information regarding how the Funds voted proxies relating to portfolio securities during the most recent 12 month period ended June 30, is available (1) without charge, upon request, by calling 1-855-TCA-Fund or 1-855-822-3863, or (2) on the SEC’s website at www.sec.gov.
Back to Table of Contents
Contacts
Board of Trustees
David Massart
Leonard Rush, CPA
David Swanson
Robert Kern
Investment Adviser
Tortoise Capital Advisors, L.L.C.
6363 College Boulevard, Suite 100A
Overland Park, KS 66211
Independent Registered Public
Accounting Firm
Ernst & Young, LLP
700 Nicollet Mall, Suite 500
Minneapolis, MN 55402
Transfer Agent, Fund Accountant
And Fund Administrator
U.S. Bancorp Fund Services, LLC
777 East Wisconsin Avenue
Milwaukee, WI 53202
Distributor
Quasar Distributors, LLC
3 Canal Plaza, Suite 100
Portland, ME 04101
Custodian
U.S. Bank, N.A.
1555 North Rivercenter Drive
Milwaukee, WI 53212
Fund Counsel
Stradley Ronon Stevens & Young, LLP
2005 Market Street, Suite 2600
Philadelphia, PA 19103-7096
855-TCA-FUND
(855-822-3863)
This report must be accompanied or preceded by a prospectus.
The Fund’s Statement of Additional Information contains additional information about the Fund’s trustees and is
available without charge upon request by calling 1-855-TCA-Fund or 1-855-822-3863.
| (b) | Financial Highlights are included within the financial statements filed under Item 7 of this Form. |
Item 8. Changes in and Disagreements with Accountants for Open-End Investment Companies.
There were no changes in or disagreements with accountants during the period covered by this report.
Item 9. Proxy Disclosure for Open-End Investment Companies.
There were no matters submitted to a vote of shareholders during the period covered by this report.
Item 10. Remuneration Paid to Directors, Officers, and Others of Open-End Investment Companies.
See Item 7(a).
Item 11. Statement Regarding Basis for Approval of Investment Advisory Contract.
See Item 7(a).
Item 12. Disclosure of Proxy Voting Policies and Procedures for Closed-End Management Investment Companies.
Not applicable to open-end investment companies.
Item 13. Portfolio Managers of Closed-End Management Investment Companies.
Not applicable to open-end investment companies.
Item 14. Purchases of Equity Securities by Closed-End Management Investment Company and Affiliated Purchasers.
Not applicable to open-end investment companies.
Item 15. Submission of Matters to a Vote of Security Holders.
There have been no material changes to the procedures by which shareholders may recommend nominees to the registrant’s board of trustees.
Item 16. Controls and Procedures.
| (a) | The Registrant’s President and Treasurer have reviewed the Registrant’s disclosure controls and procedures (as defined in Rule 30a-3(c) under the Investment Company Act of 1940 (the “Act”)) as of a date within 90 days of the filing of this report, as required by Rule 30a-3(b) under the Act and Rules 13a-15(b) or 15d-15(b) under the Securities Exchange Act of 1934. Based on their review, such officers have concluded that the disclosure controls and procedures are effective in ensuring that information required to be disclosed in this report is appropriately recorded, processed, summarized and reported and made known to them by others within the Registrant and by the Registrant’s service provider. |
| (b) | There were no changes in the Registrant’s internal control over financial reporting (as defined in Rule 30a-3(d) under the Act) that occurred during the period covered by this report that have materially affected, or are reasonably likely to materially affect, the Registrant’s internal control over financial reporting. |
Item 17. Disclosure of Securities Lending Activities for Closed-End Management Investment Companies
Not applicable to open-end investment companies.
Item 18. Recovery of Erroneously Awarded Compensation.
Not applicable
Item 19. Exhibits.
Pursuant to the requirements of the Securities Exchange Act of 1934 and the Investment Company Act of 1940, the registrant has duly caused this report to be signed on its behalf by the undersigned, thereunto duly authorized.
| | (Registrant) | Managed Portfolio Series | |
| | By (Signature and Title)* | /s/ Brian R. Wiedmeyer | |
| | | Brian R. Wiedmeyer, President | |
Pursuant to the requirements of the Securities Exchange Act of 1934 and the Investment Company Act of 1940, this report has been signed below by the following persons on behalf of the registrant and in the capacities and on the dates indicated.
| | By (Signature and Title)* | /s/ Brian R. Wiedmeyer | |
| | | Brian R. Wiedmeyer, President | |
| | By (Signature and Title)* | /s/ Benjamin J. Eirich | |
| | | Benjamin J. Eirich, Treasurer | |
* Print the name and title of each signing officer under his or her signature.