UNITED STATES
SECURITIES AND EXCHANGE COMMISSION
Washington, D.C. 20549
FORM N-CSR
CERTIFIED SHAREHOLDER REPORT OF REGISTERED
MANAGEMENT INVESTMENT COMPANIES
Investment Company Act file number 811-22525
Managed Portfolio Series
(Exact name of registrant as specified in charter)
615 East Michigan Street
Milwaukee, WI 53202
(Address of principal executive offices) (Zip code)
Brian Wiedmeyer, President
Managed Portfolio Series
c/o U.S. Bank Global Fund Services
777 East Wisconsin Ave., 6th Floor
Milwaukee, WI 53202
(Name and address of agent for service)
(414) 516-1712
Registrant’s telephone number, including area code
Date of fiscal year end: 11/30/2024
Date of reporting period: 11/30/2024
Item 1. Reports to Stockholders.
| | |
| Tortoise Global Water ESG Fund | |
| TBLU (Principal U.S. Listing Exchange: NYSE) |
| Annual Shareholder Report | November 30, 2024 |
This annual shareholder report contains important information about the Tortoise Global Water ESG Fund for the period of December 1, 2023, to November 30, 2024. You can find additional information about the Fund at https://etp.tortoiseadvisors.com/resource-center/fund-documents/. You can also request this information by contacting us at 1-913-981-1020 or info@tortoiseadvisors.com.
WHAT WERE THE FUND COSTS FOR THE PAST YEAR? (based on a hypothetical $10,000 investment)
| | |
Fund Name | Costs of a $10,000 investment | Costs paid as a percentage of a $10,000 investment |
| Tortoise Global Water ESG Fund | $45 | 0.40% |
HOW DID THE FUND PERFORM LAST YEAR AND WHAT AFFECTED ITS PERFORMANCE?
The Tortoise Global Water ESG Fund generated a NAV return of 23.8% during the fiscal year ending November 30, 2024. Fiscal year 2024 was a positive period for the fund, as prospects of a substantial economic slowdown waned, central bank rate cuts occurred, and U.S. equities gained momentum post-election. Market sentiment fluctuated with mixed economic data and Fed hawkishness, but September’s rate cut provided tailwinds for growth equities and utilities overall. Despite these gains, water utilities underperformed, particularly post-election, as pro-business policies favored industrials over traditional utilities. Overall, the Fund navigated a bifurcated market environment, achieving strong returns despite challenges for water utilities.
| |
Top Contributors |
| | Aris Water Solutions, Inc. |
| | Xylem, Inc. |
| | Ecolab, Inc. |
| | Pentair, Inc. |
| | Ferguson Enterprises, Inc. |
| |
Top Detractors |
| | Montrose Environmental Group |
| | Energy Recovery, Inc. |
| | Fortune Brands Innovations, Inc. |
| | Genuit Group PLC |
| | American States Water Company |
| Tortoise Global Water ESG Fund | PAGE 1 | TSR-AR-56167N753 |
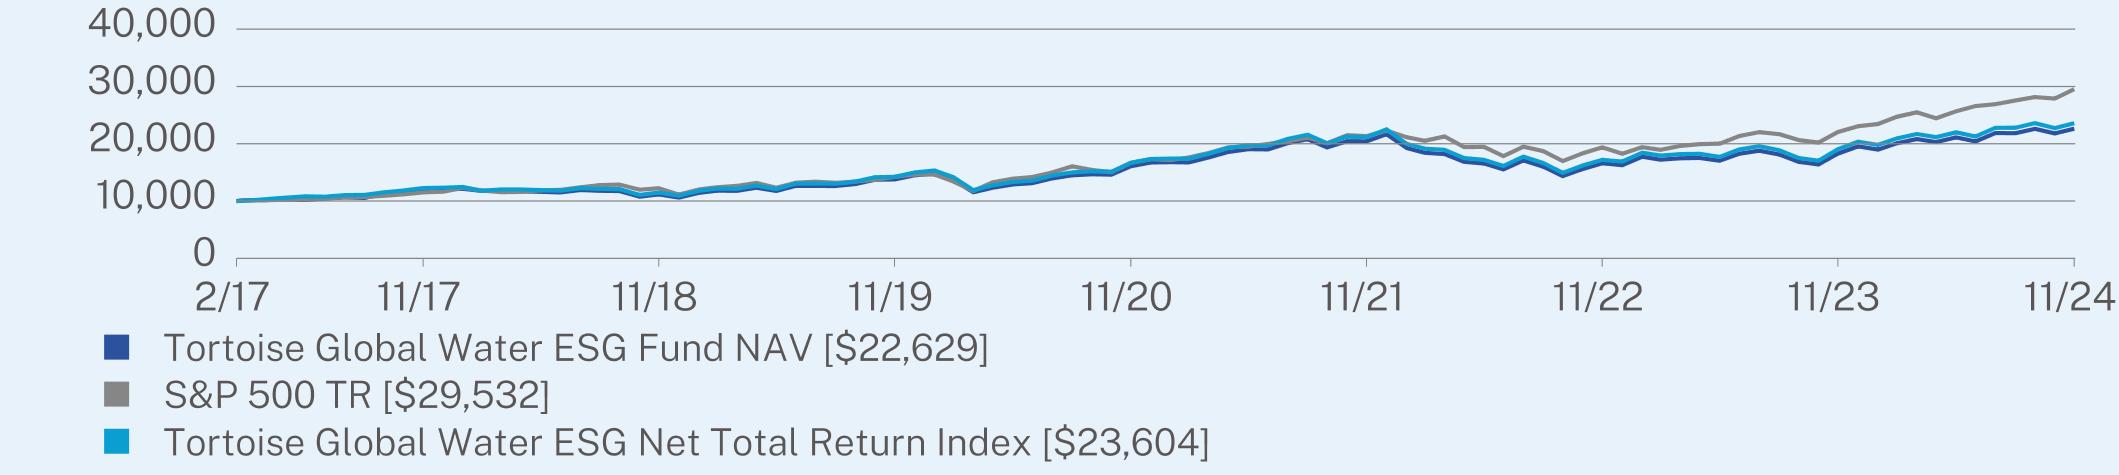
HOW DID THE FUND PERFORM SINCE INCEPTION?*
The $10,000 chart reflects a hypothetical $10,000 investment in the class of shares noted and assumes the maximum sales charge. The chart uses total return NAV performance and assumes reinvestment of dividends and capital gains. Fund expenses, including 12b-1 fees, management fees and other expenses were deducted.
CUMULATIVE PERFORMANCE (Initial Investment of $10,000)
ANNUAL AVERAGE TOTAL RETURN (%)
| | | |
| | 1 Year | 5 Year | Since Inception
(02/14/2017) |
Tortoise Global Water ESG Fund NAV | 23.80 | 10.44 | 11.05 |
S&P 500 TR | 33.89 | 15.77 | 14.91 |
Tortoise Global Water ESG Net Total Return Index | 23.92 | 10.66 | 11.65 |
Visit https://etp.tortoiseadvisors.com/resource-center/fund-documents/ for more recent performance information.
* The Fund’s past performance is not a good indicator of how the Fund will perform in the future. The graph and table do not reflect the deduction of taxes that a shareholder would pay on Fund distributions or redemption of Fund shares.
KEY FUND STATISTICS (as of November 30, 2024)
| |
Net Assets | $57,959,434 |
Number of Holdings | 41 |
Net Advisory Fee | $214,006 |
Portfolio Turnover | 55% |
30-Day SEC Yield | 1.29% |
30-Day SEC Yield Unsubsidized | 1.29% |
Visit https://etp.tortoiseadvisors.com/resource-center/fund-documents/ for more recent performance information.
| Tortoise Global Water ESG Fund | PAGE 2 | TSR-AR-56167N753 |
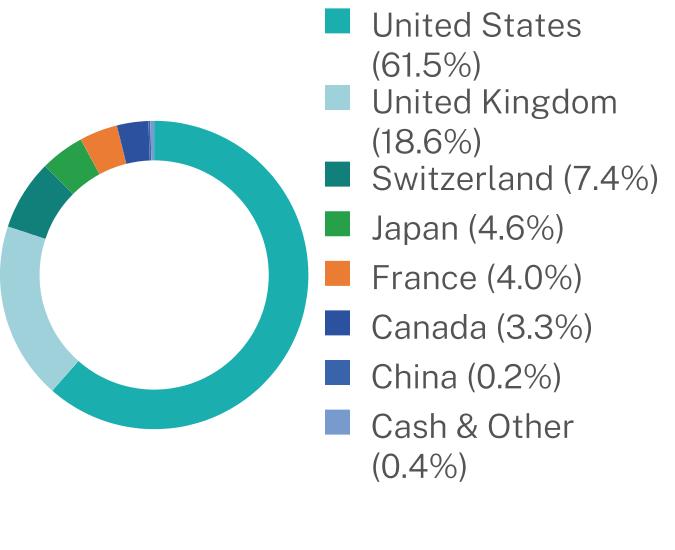
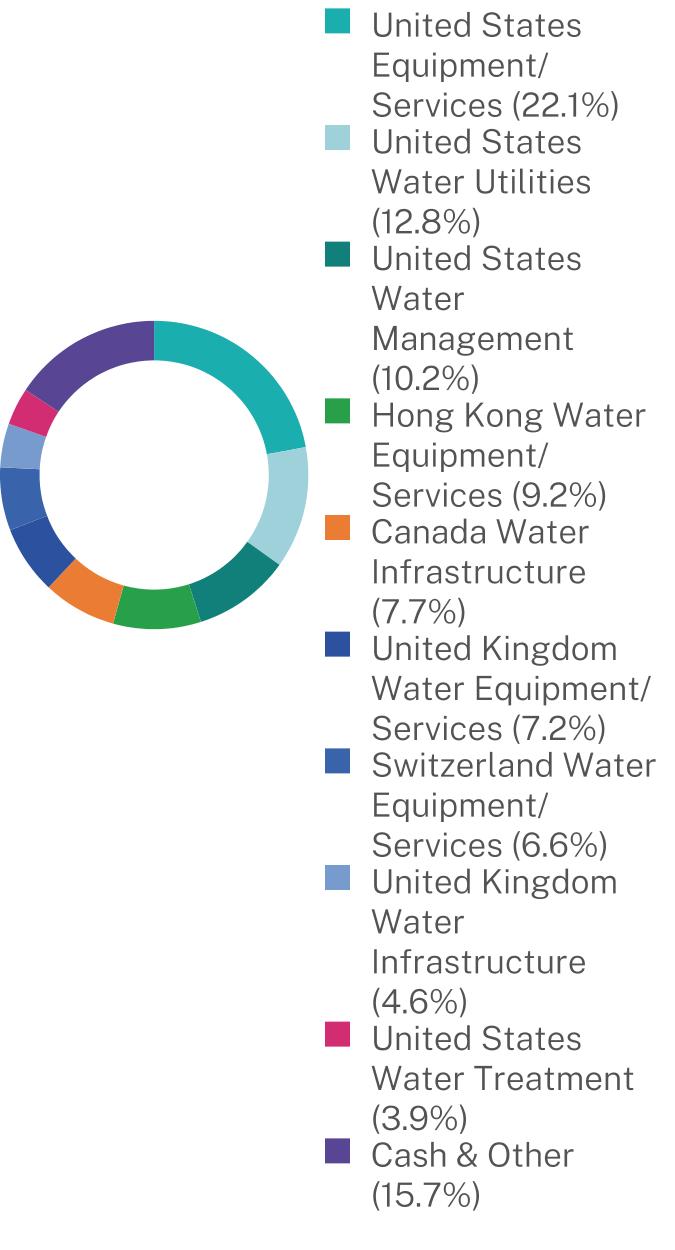
WHAT DID THE FUND INVEST IN? (as of November 30, 2024)
| |
Top 10 Issuers | (%) |
Xylem, Inc. | 8.0% |
Ecolab Inc. | 7.4% |
Ferguson PLC | 7.2% |
American Water Works Co., Inc. | 6.6% |
Veralto Corp. | 5.6% |
Geberit AG | 5.3% |
Advanced Drainage Systems, Inc. | 4.0% |
Tetra Tech, Inc. | 4.0% |
Veolia Environnement SA | 4.0% |
Pentair PLC | 3.9% |
Sector Breakdown (% of net assets)
HOW HAS THE FUND CHANGED?
Effective September 30, 2024, the Fund’s name changed from Ecofin Global Water ESG Fund to Tortoise Global Water ESG Fund. As of this same effective date, the Fund’s ticker also changed from EBLU to TBLU.
For additional information about the Fund; including its prospectus, financial information, holdings and proxy information, scan the QR code or visit https://etp.tortoiseadvisors.com/resource-center/fund-documents/.
HOUSEHOLDING
To reduce Fund expenses, only one copy of most shareholder documents may be mailed to shareholders with multiple accounts at the same address (Householding). If you would prefer that your Tortoise Capital Advisors, LLC documents not be householded, please contact Tortoise Capital Advisors, LLC at 1-913-981-1020, or contact your financial intermediary. Your instructions will typically be effective within 30 days of receipt by Tortoise Capital Advisors, LLC or your financial intermediary.
| Tortoise Global Water ESG Fund | PAGE 3 | TSR-AR-56167N753 |
10000120961115813770160832042316597182792262910000115101223214203166822134019375220562953210000122581147914223166642114417189190482360461.518.67.44.64.03.30.20.422.112.810.29.27.77.26.64.63.915.7
| | |
| Tortoise North American Pipeline Fund | |
| TPYP (Principal U.S. Listing Exchange: NYSE) |
| Annual Shareholder Report | November 30, 2024 |
This annual shareholder report contains important information about the Tortoise North American Pipeline Fund for the period of December 1, 2023, to November 30, 2024. You can find additional information about the Fund at https://etp.tortoiseadvisors.com/resource-center/fund-documents/. You can also request this information by contacting us at 1-913-981-1020 or info@tortoiseadvisors.com.
WHAT WERE THE FUND COSTS FOR THE PAST YEAR? (based on a hypothetical $10,000 investment)
| | |
Fund Name | Costs of a $10,000 investment | Costs paid as a percentage of a $10,000 investment |
| Tortoise North American Pipeline Fund | $49 | 0.40% |
HOW DID THE FUND PERFORM LAST YEAR AND WHAT AFFECTED ITS PERFORMANCE?
The Tortoise North American Pipeline Fund achieved a 46.7% increase during the fiscal year ending November 30, 2024. This robust performance stemmed from several factors. Performance for the fiscal year stemmed from disciplined capital allocation, with company management teams maintaining healthy balance sheets, increasing dividends, repurchasing shares, and focusing on high-return projects. Pipeline companies capitalized on surging power demand fueled by data center growth and advancements in AI, prompting approvals for new natural gas projects. Strong U.S. LNG demand and slower EV adoption reduced terminal value risks for fossil fuel assets. In sum, for energy infrastructure companies, cash flow growth accelerated, with expectations for prolonged durability.
| |
Top Contributors |
| | ONEOK, Inc. |
| | Williams Companies, Inc. |
| | Kinder Morgan, Inc. |
| | Targa Resources Corp. |
| | TC Energy Corp. |
| |
Top Detractors |
| | New Fortress Energy, Inc. |
| | Cheniere Energy Partners, L.P. |
| | Delek Logistics Partners LP |
| | CrossAmerica Partners LP |
| | Genesis Energy LP |
| Tortoise North American Pipeline Fund | PAGE 1 | TSR-AR-56167N720 |
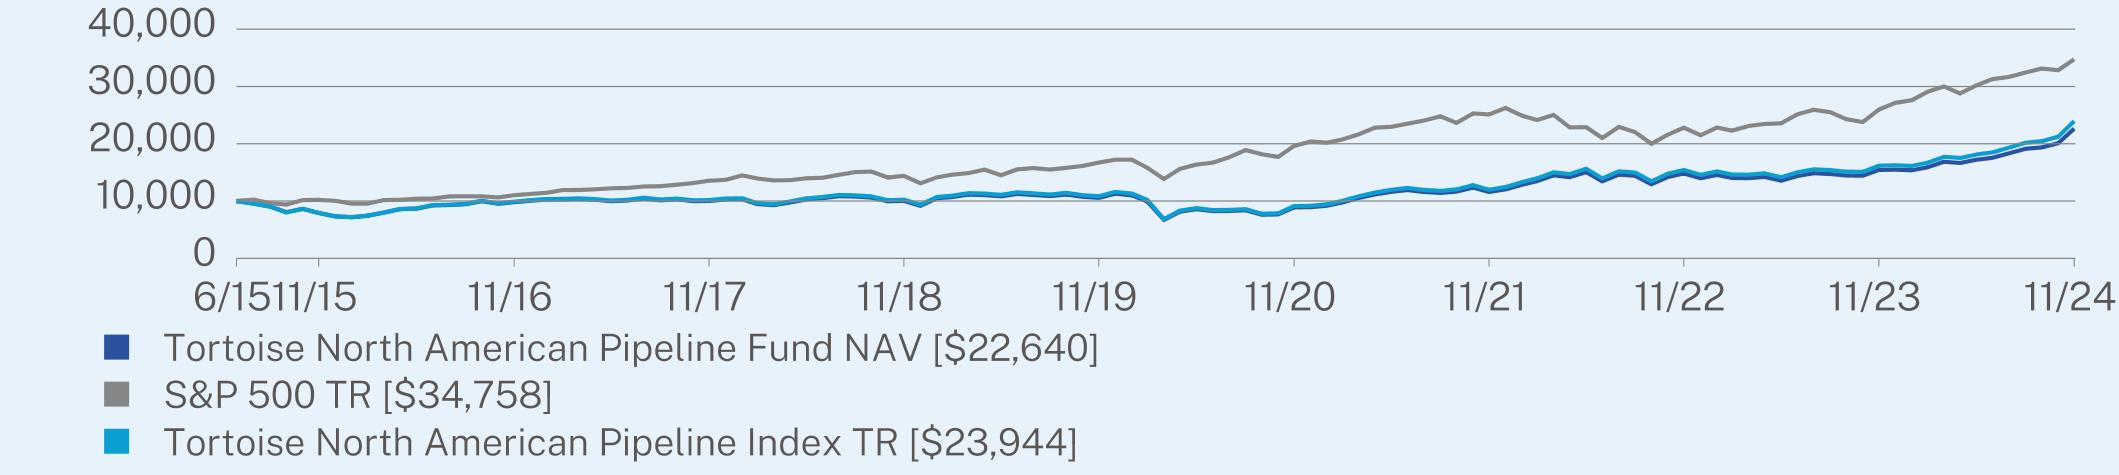
HOW DID THE FUND PERFORM SINCE INCEPTION?*
The $10,000 chart reflects a hypothetical $10,000 investment in the class of shares noted and assumes the maximum sales charge. The chart uses total return NAV performance and assumes reinvestment of dividends and capital gains. Fund expenses, including 12b-1 fees, management fees and other expenses were deducted.
CUMULATIVE PERFORMANCE (Initial Investment of $10,000)
ANNUAL AVERAGE TOTAL RETURN (%)
| | | |
| | 1 Year | 5 Year | Since Inception
(06/29/2015) |
Tortoise North American Pipeline Fund NAV | 46.73 | 16.48 | 9.06 |
S&P 500 TR | 33.89 | 15.77 | 14.14 |
Tortoise North American Pipeline Index TR | 48.04 | 17.16 | 9.71 |
Visit https://etp.tortoiseadvisors.com/resource-center/fund-documents/ for more recent performance information.
* The Fund’s past performance is not a good indicator of how the Fund will perform in the future. The graph and table do not reflect the deduction of taxes that a shareholder would pay on Fund distributions or redemption of Fund shares.
KEY FUND STATISTICS (as of November 30, 2024)
| |
Net Assets | $690,040,179 |
Number of Holdings | 44 |
Net Advisory Fee | $2,215,509 |
Portfolio Turnover | 9% |
30-Day SEC Yield | 4.62% |
30-Day SEC Yield Unsubsidized | 4.62% |
Visit https://etp.tortoiseadvisors.com/resource-center/fund-documents/ for more recent performance information.
| Tortoise North American Pipeline Fund | PAGE 2 | TSR-AR-56167N720 |
WHAT DID THE FUND INVEST IN? (as of November 30, 2024)
| |
Top 10 Issuers | (%) |
The Williams Companies, Inc. | 8.1% |
ONEOK, Inc. | 7.4% |
Enbridge, Inc. | 7.4% |
Kinder Morgan, Inc. | 7.1% |
Cheniere Energy, Inc. | 6.9% |
TC Energy Corp. | 6.8% |
Targa Resources Corp. | 4.3% |
NiSource Inc. | 4.1% |
Pembina Pipeline Corporation | 4.0% |
Energy Transfer LP | 3.9% |
Sector Breakdown (% of net assets)
Managed Distributions
The Fund may distribute more than its income and net realized capital gains; therefore, a portion of distributions may be a return of capital. A return of capital may occur, for example, when some or all of the money a shareholder has invested in the Fund is paid back to the shareholder. A return of capital distribution does not necessarily reflect the Fund’s investment performance and should not be confused with “yield” or “income.”
For additional information about the Fund; including its prospectus, financial information, holdings and proxy information, scan the QR code or visit https://etp.tortoiseadvisors.com/resource-center/fund-documents/.
HOUSEHOLDING
To reduce Fund expenses, only one copy of most shareholder documents may be mailed to shareholders with multiple accounts at the same address (Householding). If you would prefer that your Tortoise Capital Advisors, LLC documents not be householded, please contact Tortoise Capital Advisors, LLC at 1-913-981-1020, or contact your financial intermediary. Your instructions will typically be effective within 30 days of receipt by Tortoise Capital Advisors, LLC or your financial intermediary.
| Tortoise North American Pipeline Fund | PAGE 3 | TSR-AR-56167N720 |
10000791998071002110037105618899115781480715430226401000010203110251354714397167171963525117228042596034758100007929989610172102431084691291197015415161742394448.014.311.711.07.24.62.50.7
Item 2. Code of Ethics.
The registrant has adopted a code of ethics that applies to the registrant’s principal executive officer and principal financial officer. The registrant has not made any substantive amendments to its code of ethics during the period covered by this report. The registrant has not granted any waivers from any provisions of the code of ethics during the period covered by this report.
A copy of the registrant’s Code of Ethics is filed herewith.
Item 3. Audit Committee Financial Expert.
The registrant’s board of trustees has determined that there is at least one audit committee financial expert serving on its audit committee. Leonard M. Rush is the “audit committee financial expert” and is considered to be “independent” as each term is defined in Item 3 of Form N-CSR.
Item 4. Principal Accountant Fees and Services.
The registrant has engaged its principal accountant to perform audit services, audit-related services, tax services and other services during the past two fiscal years. “Audit services” refer to performing an audit of the registrant’s annual financial statements or services that are normally provided by the accountant in connection with statutory and regulatory filings or engagements for those fiscal years. “Audit-related services” refer to the assurance and related services by the principal accountant that are reasonably related to the performance of the audit. “Tax services” refer to professional services rendered by the principal accountant for tax compliance, tax advice, and tax planning. There were no “Other Services” provided by the principal accountant. The following table details the aggregate fees billed or expected to be billed for each of the last two fiscal years for audit fees, audit-related fees, tax fees and other fees by the principal accountant.
| | FYE 11/30/2024 | FYE 11/30/2023 |
| (a) Audit Fees | $149,250 | $139,200 |
| (b) Audit-Related Fees | $0 | $0 |
| (c) Tax Fees | $61,910 | $87,960 |
| (d) All Other Fees | $0 | $0 |
(e)(1) The audit committee has adopted pre-approval policies and procedures that require the audit committee to pre-approve all audit and non-audit services of the registrant, including services provided to any entity affiliated with the registrant.
(e)(2) The percentage of fees billed by Ernst & Young LLP applicable to non-audit services pursuant to waiver of pre-approval requirement were as follows:
| | FYE 11/30/2024 | FYE 11/30/2023 |
| Audit-Related Fees | 0% | 0% |
| Tax Fees | 0% | 0% |
| All Other Fees | 0% | 0% |
(f) Not applicable
(g) The following table indicates the non-audit fees billed or expected to be billed by the registrant’s accountant for services to the registrant and to the registrant’s investment adviser (and any other controlling entity, etc.—not sub-adviser) for the last two years.
| Non-Audit Related Fees | FYE 11/30/2024 | FYE 11/30/2023 |
| Registrant | $61,910 | $87,960 |
| Registrant’s Investment Adviser | $35,300 | $33,850 |
(h) The audit committee of the board of trustees/directors has considered whether the provision of non-audit services that were rendered to the registrant’s investment adviser is compatible with maintaining the principal accountant’s independence and has concluded that the provision of such non-audit services by the accountant has not compromised the accountant’s independence.
(i) Not applicable
(j) Not applicable
Item 5. Audit Committee of Listed Registrants.
| (a) | The registrant is an issuer as defined in Rule 10A-3 under the Securities Exchange Act of 1934, (the “Act”) and has a separately-designated standing audit committee established in accordance with Section 3(a)(58)(A) of the Act. The independent members of the committee, consisting of the entire Board, are as follows: Leonard M. Rush, David A. Massart, David M. Swanson and Robert J. Kern. |
Item 6. Investments.
| (a) | Schedule of Investments is included within the financial statements filed under Item 7 of this Form. |
Item 7. Financial Statements and Financial Highlights for Open-End Investment Companies.
Tortoise Funds
Tortoise Global Water ESG Fund
Tortoise North American Pipeline Fund
Core Financial Statements
November 30, 2024
TABLE OF CONTENTS
Tortoise Global Water ESG Fund
Schedule of Investments
November 30, 2024
| | | | | | | |
COMMON STOCKS - 99.3%
| | | | | | |
Canada Water Infrastructure - 7.7%
| | | | | | |
Stantec, Inc. | | | 51,561 | | | $4,466,128 |
France Water Infrastructure - 3.0%
| | | | | | |
Veolia Environnement SA | | | 60,566 | | | 1,764,561 |
Hong Kong Water Equipment/
Services - 9.2%
| | | | | | |
China Lesso Group Holdings Ltd. | | | 6,515,000 | | | 2,939,287 |
Guangdong Investment Limited | | | 3,770,000 | | | 2,364,730 |
| | | | | | 5,304,017 |
Hong Kong Water Infrastructure - 0.0%(a)
| |
CT Environmental Group Limited(b)(c) | | | 113,060 | | | 0 |
Japan Water Equipment/Services - 2.5%
| |
Kitz Corp. | | | 72,600 | | | 526,976 |
Kurita Water Industries Ltd. | | | 12,300 | | | 468,603 |
Lixil Corp. | | | 30,600 | | | 349,431 |
Rinnai Corp. | | | 4,000 | | | 85,232 |
| | | | | | 1,430,242 |
Japan Water Infrastructure - 0.5%
| | | | | | |
METAWATER Co, Ltd. | | | 15,800 | | | 186,920 |
Organo Corp. | | | 2,300 | | | 130,976 |
| | | | | | 317,896 |
Switzerland Water Equipment/
Services - 6.6%
| | | | | | |
Georg Fischer AG | | | 49,162 | | | 3,811,527 |
Switzerland Water Management - 3.5%
| |
Geberit AG | | | 3,416 | | | 2,056,696 |
United Kingdom Water Equipment/
Services - 7.2%
| | | | | | |
Ferguson Enterprises, Inc. | | | 9,996 | | | 2,153,384 |
Genuit Group PLC | | | 224,305 | | | 1,157,359 |
Pentair PLC | | | 8,064 | | | 878,895 |
| | | | | | 4,189,638 |
United Kingdom Water Infrastructure - 4.6%
| | | |
Pennon Group PLC | | | 137,474 | | | 1,054,815 |
Severn Trent PLC | | | 25,590 | | | 878,192 |
United Utilities Group PLC | | | 53,365 | | | 760,184 |
| | | | | | 2,693,191 |
United States Equipment/Services - 22.1%
| |
Advanced Drainage Systems, Inc. | | | 14,831 | | | 2,006,486 |
Aris Water Solutions, Inc. - Class A | | | 137,951 | | | 3,710,882 |
Energy Recovery Inc.(c) | | | 145,022 | | | 2,256,542 |
Franklin Electric Co., Inc. | | | 18,730 | | | 2,028,459 |
IDEX Corporation | | | 7,195 | | | 1,659,383 |
Select Water Solutions, Inc. | | | 56,217 | | | 830,325 |
Veralto Corp. | | | 1,682 | | | 181,976 |
Xylem, Inc. | | | 1,275 | | | 161,606 |
| | | | | | 12,835,659 |
| | | | | | | |
| | | | | | | |
United States Water Equipment & Services - 3.2%
| | | | | | |
Fortune Brands Innovations, Inc. | | | 23,452 | | | $1,836,292 |
United States Water Infrastructure - 2.3%
| | | |
Mueller Water Products, Inc. - Class A | | | 44,355 | | | 1,110,649 |
Tetra Tech, Inc. | | | 5,098 | | | 211,618 |
| | | | | | 1,322,267 |
United States Water Management - 10.2%
| | | |
A.O. Smith Corporation | | | 27,042 | | | 2,014,359 |
Badger Meter, Inc. | | | 10,599 | | | 2,298,075 |
Lindsay Corporation | | | 9,669 | | | 1,283,753 |
Watts Water Technologies, Inc. - Class A | | | 887 | | | 191,406 |
Zurn Elkay Water Solutions Corp. | | | 2,414 | | | 96,125 |
| | | | | | 5,883,718 |
United States Water Treatment - 3.9%
| | | | | | |
Ecolab Inc. | | | 9,006 | | | 2,240,423 |
United States Water Utilities - 12.8%
| |
American Water Works Co., Inc. | | | 14,429 | | | 1,975,907 |
Core & Main, Inc. - Class A(c) | | | 57,897 | | | 2,810,900 |
Essential Utilities, Inc. | | | 49,011 | | | 1,961,910 |
Montrose Environmental Group, Inc.(c) | | | 36,117 | | | 679,722 |
| | | | | | 7,428,439 |
TOTAL COMMON STOCKS
(Cost $51,594,313) | | | | | | 57,580,694 |
SHORT-TERM INVESTMENTS - 0.4%
|
Money Market Funds - 0.4%
| | | | | | |
First American Government Obligations Fund - Class X, 4.56%(d) | | | 225,900 | | | 225,900 |
TOTAL SHORT-TERM INVESTMENTS
(Cost $225,900) | | | 225,900 |
TOTAL INVESTMENTS - 99.7%
(Cost $51,820,213) | | | | | | $57,806,594 |
Other Assets in Excess of
Liabilities - 0.3% | | | | | | 152,840 |
TOTAL NET ASSETS - 100.0% | | | | | | $57,959,434 |
| | | | | | | |
Percentages are stated as a percent of net assets.
AG - Aktiengesellschaft
PLC - Public Limited Company
SA - Sociedad Anónima
(a)
| Represents less than 0.05% of net assets. |
(b)
| Fair value determined using significant unobservable inputs in accordance with procedures established by and under the supervision of the Adviser, acting as Valuation Designee. These securities represented $0 or 0.0% of net assets as of November 30, 2024. |
(c)
| Non-income producing security. |
(d)
| The rate shown represents the 7-day annualized effective yield as of November 30, 2024. |
The accompanying notes are an integral part of these financial statements.
TABLE OF CONTENTS
Tortoise North American Pipeline Fund
Schedule of Investments
November 30, 2024
| | | | | | | |
COMMON STOCKS - 82.8%
|
Canada Crude Oil Pipelines - 11.7%
|
Enbridge, Inc. | | | 1,069,251 | | | $46,384,108 |
Gibson Energy, Inc. | | | 331,207 | | | 5,585,370 |
Pembina Pipeline Corporation | | | 569,301 | | | 23,454,364 |
South Bow Corp.(a) | | | 187,568 | | | 4,886,146 |
| | | | | | 80,309,988 |
Canada Natural Gas/Natural Gas Liquids Pipelines - 11.0%
| | | | | | |
AltaGas Ltd. | | | 605,940 | | | 14,819,032 |
Keyera Corp. | | | 466,870 | | | 15,396,155 |
TC Energy Corp. | | | 937,803 | | | 45,886,701 |
| | | | | | 76,101,888 |
United States Crude Oil Pipelines - 0.7%
| | | |
Plains GP Holdings LP | | | 229,241 | | | 4,589,405 |
United States Local Distribution Companies - 14.3%
| | | | | | |
Atmos Energy Corporation | | | 170,266 | | | 25,764,651 |
Chesapeake Utilities Corporation | | | 45,745 | | | 6,026,904 |
New Jersey Resources Corporation | | | 202,043 | | | 10,421,378 |
NiSource Inc. | | | 683,777 | | | 26,045,066 |
Northwest Natural Holding Co. | | | 78,787 | | | 3,452,446 |
ONE Gas, Inc. | | | 115,433 | | | 9,000,311 |
Southwest Gas Corporation | | | 122,654 | | | 9,586,636 |
Spire Inc. | | | 117,662 | | | 8,611,682 |
| | | | | | 98,909,074 |
United States Natural Gas Gathering/Processing - 5.6%
| | | | | | |
Antero Midstream Corp. | | | 686,350 | | | 10,961,010 |
Archrock, Inc. | | | 344,191 | | | 8,818,173 |
EnLink Midstream LLC | | | 514,743 | | | 8,241,035 |
Hess Midstream LP - Class A | | | 119,025 | | | 4,511,048 |
Kinetik Holdings, Inc. | | | 76,682 | | | 4,525,772 |
Kodiak Gas Services, Inc. | | | 37,655 | | | 1,522,768 |
| | | | | | 38,579,806 |
United States Natural Gas/Natural Gas Liquids Pipelines - 39.5%
| | | | | | |
Cheniere Energy, Inc. | | | 220,540 | | | 49,403,166 |
DT Midstream, Inc. | | | 112,852 | | | 11,975,854 |
Excelerate Energy, Inc. - Class A | | | 19,802 | | | 613,268 |
Kinder Morgan, Inc. | | | 1,881,968 | | | 53,203,236 |
National Fuel Gas Company | | | 186,126 | | | 11,906,480 |
New Fortress Energy, Inc. | | | 215,136 | | | 2,295,501 |
ONEOK, Inc. | | | 476,800 | | | 54,164,480 |
Targa Resources Corp. | | | 158,571 | | | 32,396,055 |
The Williams Companies, Inc. | | | 965,158 | | | 56,481,046 |
| | | | | | 272,439,086 |
TOTAL COMMON STOCKS
(Cost $401,200,489) | | | | | | 570,929,247 |
| | | | | | | |
| | | | | | | |
MASTER LIMITED PARTNERSHIPS - 16.5%
|
United States Crude Oil Pipelines - 1.8%
|
Delek Logistics Partners LP | | | 14,280 | | | $576,055 |
Genesis Energy L.P. | | | 129,464 | | | 1,550,979 |
Plains All American Pipeline L.P. | | | 537,706 | | | 10,038,971 |
| | | | | | 12,166,005 |
United States Natural Gas Gathering/Processing - 1.6%
| | | | | | |
USA Compression Partners LP | | | 91,103 | | | 2,185,561 |
Western Midstream Partners LP | | | 225,517 | | | 9,180,797 |
| | | | | | 11,366,358 |
United States Natural Gas/Natural Gas Liquids Pipelines - 8.5%
| | | | | | |
Cheniere Energy Partners L.P. | | | 45,006 | | | 2,621,600 |
Energy Transfer LP | | | 1,445,967 | | | 28,716,905 |
Enterprise Products Partners L.P. | | | 787,224 | | | 27,104,122 |
| | | | | | 58,442,627 |
United States Refined Product Pipelines - 4.6%
| | | | | | |
CrossAmerica Partners LP | | | 21,227 | | | 438,338 |
Global Partners LP | | | 32,396 | | | 1,828,754 |
MPLX LP | | | 438,817 | | | 22,669,286 |
Sunoco LP | | | 124,851 | | | 7,049,087 |
| | | | | | 31,985,465 |
TOTAL MASTER LIMITED PARTNERSHIPS
(Cost $68,031,256) | | | | | | 113,960,455 |
| | | Shares | | | |
SHORT-TERM INVESTMENTS - 0.6%
|
Money Market Funds - 0.6%
|
Invesco Government & Agency Portfolio - Class Institutional, 4.58%(b) | 4,430,229 | | | 4,430,229 |
TOTAL SHORT-TERM INVESTMENTS
(Cost $4,430,229) | | | 4,430,229 |
TOTAL INVESTMENTS - 99.9%
(Cost $473,661,974) | | | | | | $689,319,931 |
Other Assets in Excess of
Liabilities - 0.1% | | | | | | 720,248 |
TOTAL NET ASSETS - 100.0% | | | | | | $ 690,040,179 |
| | | | | | | |
Percentages are stated as a percent of net assets.
(a)
| Non-income producing security. |
(b)
| The rate shown represents the 7-day annualized effective yield as of November 30, 2024. |
The accompanying notes are an integral part of these financial statements.
TABLE OF CONTENTS
TORTOISE FUNDS
Statements of Assets and Liabilities
November 30, 2024
| | | | | | | |
ASSETS:
| | | | | | |
Investments, at value | | | $ 57,806,594 | | | $ 689,319,931 |
Dividend tax reclaims receivable | | | 86,380 | | | 71,089 |
Dividends receivable | | | 78,721 | | | 849,272 |
Interest receivable | | | 800 | | | 10,675 |
Foreign currency, at value | | | — | | | 470 |
Total assets | | | 57,972,495 | | | 690,251,437 |
LIABILITIES:
| | | | | | |
Payable to adviser | | | 13,061 | | | 211,258 |
Total liabilities | | | 13,061 | | | 211,258 |
NET ASSETS | | | $ 57,959,434 | | | $ 690,040,179 |
Net Assets Consists of:
| | | | | | |
Paid-in capital | | | $56,278,535 | | | $494,445,201 |
Total distributable earnings | | | 1,680,899 | | | 195,594,978 |
Total net assets | | | $ 57,959,434 | | | $ 690,040,179 |
Net assets | | | $ 57,959,434 | | | $ 690,040,179 |
Shares issued and outstanding | | | 1,150,000 | | | 18,800,000 |
Net asset value per share | | | $50.40 | | | $36.70 |
COST:
| | | | | | |
Investments, at cost | | | $ 51,820,213 | | | $ 473,661,974 |
Foreign currency, at cost | | | $— | | | $477 |
| | | | | | | |
The accompanying notes are an integral part of these financial statements.
TABLE OF CONTENTS
TORTOISE FUNDS
Statements of Operations
For the Year Ended November 30, 2024
| | | | | | | |
INVESTMENT INCOME:
| | | | | | |
Dividend income | | | $1,024,380 | | | $19,629,253 |
Less: Dividend withholding taxes | | | (39,304) | | | (1,259,517) |
Interest income | | | 8,069 | | | 118,647 |
Total investment income | | | 993,145 | | | 18,488,383 |
EXPENSES:
| | | | | | |
Investment advisory fee | | | 214,006 | | | 2,215,509 |
Total expenses | | | 214,006 | | | 2,215,509 |
Net investment income | | | 779,139 | | | 16,272,874 |
REALIZED AND UNREALIZED GAIN (LOSS) ON INVESTMENTS AND TRANSLATIONS OF FOREIGN CURRENCY
| | | | | | |
Net realized gain (loss) from:
| | | | | | |
Investments | | | 5,540,753 | | | 55,993,040 |
Foreign currency translation | | | (30,467) | | | (12,831) |
Net realized gain | | | 5,510,286 | | | 55,980,209 |
Net change in unrealized appreciation (depreciation) on:
| | | | | | |
Investments | | | 4,694,340 | | | 153,512,578 |
Foreign currency translation | | | 1,468 | | | (7) |
Net change in unrealized appreciation | | | 4,695,808 | | | 153,512,571 |
Net realized gain and unrealized gain on investments and translations of foreign currency | | | 10,206,094 | | | 209,492,780 |
NET INCREASE IN NET ASSETS RESULTING FROM
OPERATIONS | | | $ 10,985,233 | | | $ 225,765,654 |
| | | | | | | |
The accompanying notes are an integral part of these financial statements.
TABLE OF CONTENTS
TORTOISE FUNDS
Statements of Changes in Net Assets
| | | | | | | |
OPERATIONS:
| | | | | | | | | | | | |
Net investment income | | | $779,139 | | | $812,577 | | | $16,272,874 | | | $14,517,323 |
Net realized gain on investments, including foreign currency gain (loss) | | | 5,510,286 | | | 1,010,264 | | | 55,980,209 | | | 55,002,763 |
Net change in unrealized appreciation (depreciation) of investments and translations of foreign currency | | | 4,695,808 | | | 3,058,465 | | | 153,512,571 | | | (54,222,554) |
Net increase in net assets from operations | 10,985,233 | | | 4,881,306 | | | 225,765,654 | | | 15,297,532 |
DISTRIBUTIONS TO SHAREHOLDERS:
| | | | | | | | | | |
Distributions to shareholders | | | (654,224) | | | (1,016,406) | | | (15,563,907) | | | (17,271,051) |
Return of capital | | | — | | | — | | | (9,301,408) | | | (8,411,109) |
Total distributions to shareholders | | | (654,224) | | | (1,016,406) | | | (24,865,315) | | | (25,682,160) |
CAPITAL TRANSACTIONS:
| | | | | | | | | | | | |
Proceeds from shares sold | | | 28,954,300 | | | — | | | 147,003,355 | | | 152,730,499 |
Payments for shares redeemed | | | (28,739,560) | | | (17,487,715) | | | (189,372,735) | | | (170,866,090) |
ETF transaction fees (See Note 1) | | | — | | | — | | | 1,980 | | | — |
Net increase (decrease) in net assets from capital transactions | | | 214,740 | | | (17,487,715) | | | (42,367,400) | | | (18,135,591) |
Net increase (decrease) in net assets | | | 10,545,749 | | | (13,622,815) | | | 158,532,939 | | | (28,520,219) |
NET ASSETS:
| | | | | | | | | | | | |
Beginning of the year | | | 47,413,685 | | | 61,036,500 | | | 531,507,240 | | | 560,027,459 |
End of the year | | | $57,959,434 | | | $ 47,413,685 | | | $ 690,040,179 | | | $ 531,507,240 |
SHARES TRANSACTIONS
| | | | | | | | | | | | |
Shares sold | | | 600,000 | | | — | | | 5,200,000 | | | 6,000,000 |
Shares redeemed | | | (600,000) | | | (450,000) | | | (6,700,000) | | | (6,900,000) |
Total decrease in shares outstanding | | | — | | | (450,000) | | | (1,500,000) | | | (900,000) |
| | | | | | | | | | | | | |
The accompanying notes are an integral part of these financial statements.
TABLE OF CONTENTS
Tortoise Global Water ESG Fund
Financial Highlights
| | | | |
PER SHARE DATA(a):
| | | | | | | | | | | | | | | |
Net asset value, beginning of year | | | $41.23 | | | $38.15 | | | $47.75 | | | $38.05 | | | $33.06 |
INVESTMENT OPERATIONS:
| | | | | | | | | | | | | | | |
Net investment income | | | 0.68 | | | 0.68 | | | 0.59 | | | 0.77 | | | 0.57 |
Net realized and unrealized gain (loss) on investments | | | 9.06 | | | 3.14 | | | (9.44) | | | 9.42 | | | 4.88 |
Total from investment operations | | | 9.74 | | | 3.82 | | | (8.85) | | | 10.19 | | | 5.45 |
| | | | | | | | | | | | | | | |
LESS DISTRIBUTIONS FROM:
| | | | | | | | | | | | | | | |
Net investment income | | | (0.57) | | | (0.74) | | | (0.75) | | | (0.49) | | | (0.46) |
Total distributions | | | (0.57) | | | (0.74) | | | (0.75) | | | (0.49) | | | (0.46) |
Net asset value, end of year | | | $50.40 | | | $41.23 | | | $38.15 | | | $47.75 | | | $38.05 |
Total return | | | 23.80% | | | 10.13% | | | (18.73)% | | | 26.98% | | | 16.80% |
SUPPLEMENTAL DATA AND RATIOS:
| | | | | | | | | | | | | | | |
Net assets, end of year (in thousands) | | | $57,959 | | | $47,414 | | | $61,037 | | | $64,468 | | | $20,927 |
Ratio of expenses to average net assets | | | 0.40% | | | 0.40% | | | 0.40% | | | 0.40% | | | 0.40% |
Ratio of net investment income to average net assets | | | 1.46% | | | 1.63% | | | 1.52% | | | 2.22% | | | 1.74% |
Portfolio turnover rate | | | 55% | | | 19% | | | 26% | | | 21% | | | 19% |
| | | | | | | | | | | | | | | | |
(a)
| For a Fund share outstanding for the entire period. |
The accompanying notes are an integral part of these financial statements.
TABLE OF CONTENTS
Tortoise North American Pipeline Fund
Financial Highlights
| | | | |
PER SHARE DATA(a):
| | | | | | | | | | | | | | | |
Net asset value, beginning of year | | | $26.18 | | | $26.42 | | | $21.63 | | | $17.50 | | | $22.18 |
INVESTMENT OPERATIONS:
| | | | | | | | | | | | | | | |
Net investment income(b) | | | 0.78 | | | 0.65 | | | 0.62 | | | 0.43 | | | 0.48 |
Net realized and unrealized gain (loss) on investments and translations of foreign currency(b) | | | 11.04 | | | 0.34 | | | 5.28 | | | 4.74 | | | (4.12) |
Total from investment operations | | | 11.82 | | | 0.99 | | | 5.9 | | | 5.17 | | | (3.64) |
LESS DISTRIBUTIONS FROM:
| | | | | | | | | | | | | | | |
Net investment income | | | (0.80) | | | (0.77) | | | (0.51) | | | (0.46) | | | (0.42) |
Net realized gains | | | — | | | (0.06) | | | — | | | — | | | — |
Return of capital | | | (0.50) | | | (0.40) | | | (0.60) | | | (0.58) | | | (0.62) |
Total distributions | | | (1.30) | | | (1.23) | | | (1.11) | | | (1.04) | | | (1.04) |
ETF transaction fees per share | | | 0.00(c) | | | — | | | — | | | — | | | — |
Net asset value, end of year | | | $36.70 | | | $26.18 | | | $26.42 | | | $21.63 | | | $17.50 |
Total return | | | 46.73% | | | 4.21% | | | 27.89% | | | 30.10% | | | −15.74% |
SUPPLEMENTAL DATA AND RATIOS:
| | | | | | | | | | | | | | | |
Net assets, end of year (in thousands) | | | $690,040 | | | $531,507 | | | $560,027 | | | $421,715 | | | $359,713 |
Ratio of expenses to average net assets | | | 0.40% | | | 0.40% | | | 0.40% | | | 0.40% | | | 0.40% |
Ratio of net investment income to average net assets | | | 2.92% | | | 2.84% | | | 2.27% | | | 2.20% | | | 2.34% |
Portfolio turnover rate | | | 9% | | | 19% | | | 12% | | | 17% | | | 28% |
| | | | | | | | | | | | | | | | |
(a)
| Net investment income per share has been calculated based on average shares outstanding during the year. |
(b)
| The per common share data for the years ended November 30, 2023, 2022, 2021 and 2020 does not reflect the change in estimate of investment income and return of capital. See Note 2 to the financial statements for further disclosure. |
(c)
| Amount represents less than $0.005 per share. |
The accompanying notes are an integral part of these financial statements.
TABLE OF CONTENTS
Tortoise Funds
Notes to Financial Statements
November 30, 2024
1. Organization
Managed Portfolio Series (the “Trust”) was organized as a Delaware statutory trust on January 27, 2011. The Trust is registered under the Investment Company Act of 1940, as amended (the “1940 Act”), as an open-end management investment company. The Tortoise North American Pipeline Fund (the “North American Pipeline Fund”) and the Tortoise Global Water ESG Fund (the “Global Water ESG Fund, f/k/a Ecofin Global Water ESG Fund”) (or collectively, “the Funds”) are each a non-diversified series with their own investment objectives and policies within the Trust. The Trust has evaluated the structure, objective and activities of the Funds and determined that they meet the characteristics of an investment company. As such, these financial statements have applied the guidance as set forth in the Accounting Standards Codifications (“ASC”) 946, Financial Services Investment Companies.
The investment objective of the North American Pipeline Fund seeks investment results that correspond generally to the price and distribution rate (total return) performance of the Tortoise North American Pipeline IndexSM (the “North American Pipeline Index”). The North American Pipeline Fund commenced operations on June 29, 2015.
The investment objective of the Global Water ESG Fund seeks investment results that correspond (before fees and expenses) generally to the price and distribution rate (total return) performance of the Tortoise Global Water ESG IndexSM (the “Water Index”). The Global Water ESG Fund commenced operations on February 14, 2017.
Shares of the North American Pipeline Fund and Global Water ESG Fund are listed and traded on the NYSE Arca, Inc. (the “NYSE”). Market prices for the shares may be different from their net asset value (“NAV”). The Funds issue and redeem shares on a continuous basis at NAV only in blocks of 50,000 shares, called “Creation Units.” Creation Units are issued and redeemed principally in-kind for securities included in a specified universe, with cash included to balance to the Creation Unit total. Once created, shares generally trade in the secondary market at market prices that change throughout the day in amounts less than a Creation Unit. Except when aggregated in Creation Units, shares are not redeemable securities of the Funds. Shares of the Funds may only be purchased or redeemed by certain financial institutions (“Authorized Participants”). An Authorized Participant is either (i) a broker-dealer or other participant in the clearing process through the Continuous Net Settlement System of the National Securities Clearing Corporation or (ii) a Depository Trust Company participant and, in each case, must have executed a Participation Agreement with the Distributor. Most retail investors do not qualify as Authorized Participants nor have the resources to buy and sell whole Creation Units. Therefore, they are unable to purchase or redeem the shares directly from the Funds. Rather, most retail investors may purchase shares in the secondary market with the assistance of a broker and are subject to customary brokerage commissions or fees.
The Funds currently offer one class of shares, which have no front-end sales load, no deferred sales charge, and no redemption fee. A purchase (i.e. creation) transaction fee is imposed for the transfer and other transaction costs associated with the purchase of Creation Units. The standard fixed creation transaction fee for each Fund is $500, which is payable by the Advisor. In addition, a variable fee may be charged on all cash transactions or substitutes for Creation Units of up to a maximum of 2% as a percentage of the value of the Creation Units subject to the transaction. Variable fees are imposed to compensate the Funds for the transaction costs associated with the cash transactions. Variable fees received by the Funds are displayed in the capital shares transaction section of the Statement of Changes in Net Assets. The Funds may issue an unlimited number of shares of beneficial interest, with no par value. All shares of the Funds have equal rights and privileges.
2. Significant Accounting Policies
The Funds are investment companies and follows accounting and reporting guidance under Financial Accounting Standards Board Accounting Standards Codification (“ASC”) Topic 946, “Financial Services-Investment Companies. The following is a summary of significant accounting policies followed by the Fund in the preparation of its financial statements. These policies are in conformity with generally accepted accounting principles in the United States of America (“GAAP”).
Securities Valuation – All investments in securities are recorded at their estimated fair value, as described in Note 3.
TABLE OF CONTENTS
Tortoise Funds
Notes to Financial Statements
November 30, 2024(Continued)
Foreign Currency Translation – The books and records relating to the Funds’ non-U.S. dollar denominated investments are maintained in U.S. dollars on the following bases: (1) market value of investment securities, assets, and liabilities are translated at the current rate of exchange; and (2) purchases and sales of investment securities, income, and expenses are translated at the relevant rates of exchange prevailing on the respective dates of such transactions. The Funds do not isolate the portion of gains and losses on investments in equity securities that is due to changes in the foreign exchange rates from that which is due to changes in market prices of equity securities. The Funds report certain foreign currency-related transactions as components of realized gains for financial reporting purposes, whereas such components are treated as ordinary income for federal income tax purposes.
Federal Income Taxes – The Funds intend to meet the requirements of subchapter M of the Internal Revenue Code applicable to regulated investment companies and to distribute substantially all net taxable investment income and net realized gains to shareholders in a manner which results in no tax cost to the Funds. Therefore, no federal income or excise tax provision is required. As of November 30, 2024, the Funds did not have any tax positions that did not meet the “more-likely-than-not” threshold of being sustained by the applicable tax authority. The Funds recognize interest and penalties, if any, related to unrecognized tax benefits on uncertain tax positions as income tax expense in the Statement of Operations. During the period ended November 30, 2024, the Funds did not incur any interest or penalties. Each of the tax years in the four-year period ended November 30, 2024 remain subject to examination by taxing authorities for the North American Pipeline Fund and Global Water ESG Fund.
Securities Transactions, Income and Distributions – Security transactions are accounted for on the date the securities are purchased or sold (trade date). Realized gains and losses are reported on a specific identified cost basis. Interest income is recognized on an accrual basis, including amortization of premiums and accretion of discounts. Dividend income and distributions are recorded on the ex-dividend date. Withholding taxes on foreign dividends have been provided for in accordance with the Funds’ understanding of the applicable country’s tax rules and regulations. Distributions received from the Funds’ investments generally are comprised of ordinary income and return of capital. The Funds allocate distributions between investment income and return of capital based on estimates made at the time such distributions are received. Such estimates are based on information provided by each portfolio company and other industry sources. These estimates may subsequently be revised based on actual allocations received from the portfolio companies after their tax reporting periods are concluded, as the actual character of these distributions is not known until after the fiscal year end of the Funds.
During the year ended November 30, 2024, the North American Pipeline Fund reallocated the amount of return of capital recognized based on the 2023 tax reporting information received. The impact of this adjustment is a decrease to return of capital on distributions of approximately $407,138.
The North American Pipeline Fund will make distributions of net investment income, if any, quarterly. The Global Water ESG Fund will make distributions of net investment income, if any, semiannually. The Funds will also distribute net realized capital gains, if any, annually. Distributions to shareholders are recorded on the ex-dividend date. The treatment for financial reporting purposes of distributions made to shareholders during the year from net investment income or net realized capital gains may differ from their ultimate treatment for federal income tax purposes. These differences are caused primarily by differences in the timing of the recognition of certain components of income, expense or realized capital gain for federal income tax purposes. Where such differences are permanent in nature, GAAP requires that they be reclassified in the components of the net assets based on their ultimate characterization for federal income tax purposes. Any such reclassifications will have no effect on net assets, results of operations or net asset values per share of the Funds. These differences are primarily due to redemptions in kind, return of capital distributions and book/tax differences from underlying investments.
For the period ended November 30, 2024, the following reclassifications were made:
| | | | | | | |
North American Pipeline Fund | | | $(51,641,826) | | | $51,641,826 |
Global Water ESG Fund | | | (5,223,719) | | | 5,223,719 |
| | | | | | | |
TABLE OF CONTENTS
Tortoise Funds
Notes to Financial Statements
November 30, 2024(Continued)
Use of Estimates – The preparation of financial statements in conformity with GAAP requires management to make estimates and assumptions that affect the reported amounts of assets and liabilities and disclosure of contingent assets and liabilities at the date of the financial statements and the reported amounts of revenues and expenses during the reporting period. Actual results could differ from those estimates.
Share Valuation – The NAV per share of the Funds are calculated by dividing the sum of the value of the securities held by the Funds, plus cash and other assets, minus all liabilities (including estimated accrued expenses) by the total number of shares outstanding for the Funds, rounded to the nearest cent. The North American Pipeline Fund’s shares and Ecofin Global Water ESG Fund’s shares will not be priced on the days on which the NYSE is closed for trading. The offering and redemption price per share for the Funds are equal to the Funds’ net asset value per share.
Indemnifications – Under the Trust’s organizational documents, its officers and trustees are indemnified against certain liabilities arising out of the performance of their duties to the Trust. In addition, in the normal course of business, the Trust may enter into contracts that provide general indemnification to other parties. The Trust’s maximum exposure under these arrangements is unknown, as this would involve future claims that may be made against the Trust that have not yet occurred and may not occur. However, the Trust has not had prior claims or losses pursuant to these contracts and expects the risk of loss to be remote.
Cash and Cash Equivalents – Cash and cash equivalents include short-term, liquid investments with an original maturity of three months or less and include money market fund accounts.
Illiquid Securities – A security may be considered illiquid if it lacks a readily available market. Securities are generally considered liquid if they can be sold or disposed of in the ordinary course of business within seven days at approximately the price at which the security is valued by the Fund. Illiquid securities may be valued under methods approved by the Board of Trustees (the “Board”) as reflecting fair value. The Funds will not hold more than 15% of the value of its net assets in illiquid securities. At November 30, 2024, the Global Water ESG Fund had investments in illiquid securities with a total value of $0 or 0.0% of total net assets. At November 30, 2024, the North American Pipeline Fund did not hold any illiquid securities.
Global Water ESG Fund
| | | | | | | | | | |
CT Environmental Group Limited | | | 113,060 | | | 6/2018 | | | $ 15,150 |
| | | | | | | | | | |
New Accounting Pronouncements – In November 2023, the FASB issued ASU No. 2023-07 Segment Reporting (Topic 280); Improvements to Reportable Segment Disclosures, which improves reportable segment disclosure requirements, primarily through enhanced disclosures about significant segment expenses. The ASU is effective for fiscal years beginning after December 15, 2023, and interim periods within fiscal years beginning after December 15, 2024. Management is currently evaluating the impact of applying the ASU to the Funds’ financial statements.
3. Securities Valuation
The Funds have adopted fair value accounting standards, which establish an authoritative definition of fair value and set out a hierarchy for measuring fair value. These standards require additional disclosures about the various inputs and valuation techniques used to develop the measurements of fair value, a discussion in changes in valuation techniques and related inputs during the period and expanded disclosure of valuation levels for major security types. These inputs are summarized in the three broad levels listed below:
Level 1 –
Quoted prices in active markets for identical assets or liabilities.
Level 2 –
Observable inputs other than quoted prices included in Level 1. These inputs may include quoted prices for similar instruments, interest rates, prepayment speeds, credit risk, yield curves, default rates and similar data.
Level 3 –
Significant unobservable inputs for the asset or liability, representing the Fund’s view of assumptions a market participant would use in valuing the asset or liability.
TABLE OF CONTENTS
Tortoise Funds
Notes to Financial Statements
November 30, 2024(Continued)
Following is a description of the valuation techniques applied to each Fund’s major categories of assets and liabilities measured at fair value on a recurring basis. Each Fund’s investments are carried at fair value.
Common stock (including MLPs) – Securities that are primarily traded on a national securities exchange are valued at the last sale price on the exchange on which they are primarily traded on the day of valuation or, if there has been no sale on such day, at the mean between the bid and ask prices. Securities traded primarily on the Nasdaq Global Market System for which market quotations are readily available are valued using the Nasdaq Official Closing Price (“NOCP”). If the NOCP is not available, such securities are valued at the last sale price on the day of valuation, or if there has been no sale on such day, at the mean between the bid and ask prices. To the extent these securities are actively traded and valuation adjustments are not applied, they are categorized in Level 1 of the fair value hierarchy.
Investment Companies – Investments in other mutual funds, including money market funds, are valued at their net asset value per share. To the extent these securities are actively traded and valuation adjustments are not applied, they are categorized in Level 1 of the fair value hierarchy.
The Board of Trustees (the “Board”) has adopted a pricing and valuation policy for use by the Funds and their Valuation Designee (as defined below) in calculating the Funds’ NAV. Pursuant to Rule 2a-5 under the 1940 Act, the Funds have designated Tortoise Index Solutions, LLC (the “Adviser”) as their “Valuation Designee” to perform all of the fair value determinations as well as to perform all of the responsibilities that may be performed by the Valuation Designee in accordance with Rule 2a-5. The Valuation Designee is authorized to make all necessary determinations of the fair values of portfolio securities and other assets for which market quotations are not readily available or if it is deemed that the prices obtained from brokers and dealers or independent pricing services are unreliable.
The inputs or methodology used for valuing securities are not an indication of the risk associated with investing in those securities.
The following table is a summary of the inputs used to value each Fund’s securities by level within the fair value hierarchy as of November 30, 2024:
North American Pipeline Fund
| | | | | | | | | | | | | |
Common stock | | | $ 570,929,247 | | | $ — | | | $ — | | | $ 570,929,247 |
Master limited partnerships | | | 113,960,455 | | | — | | | — | | | 113,960,455 |
Short-term investment | | | 4,430,229 | | | — | | | — | | | 4,430,229 |
Total investments in securities | | | $689,319,931 | | | $— | | | $— | | | $ 689,319,931 |
| | | | | | | | | | | | | |
Global Water ESG Fund
| | | | | | | | | | | | | |
Common stock | | | $ 57,580,694 | | | $ — | | | $ — | | | $ 57,580,694 |
Short-term investment | | | 225,900 | | | — | | | — | | | 225,900 |
Total investments in securities | | | $57,806,594 | | | $— | | | $— | | | $ 57,806,594 |
| | | | | | | | | | | | | |
Refer to each Fund’s Schedule of Investments for additional industry information.
TABLE OF CONTENTS
Tortoise Funds
Notes to Financial Statements
November 30, 2024(Continued)
The following is a reconciliation of Level 3 assets for which significant unobservable inputs were used to determine fair value.
| | | | |
Balance as of 11/30/2023 | | | $— |
Accrued discounts/premiums | | | — |
Realized gain (loss) | | | — |
Change in net unrealized appreciation (depreciation) | | | — |
Net purchases (sales) | | | — |
Transfers into and/or out of Level 3 | | | — |
Balance as of 11/30/2024 | | | $— |
Net unrealized depreciation of Level 3 Securities as of November 30, 2024 | | | $(15,150) |
| | | | |
4. Concentration Risk and General Risk
Because the North American Pipeline Fund’s assets are concentrated in the energy pipeline industry and the Global Water ESG Fund’s assets are concentrated in the water industry, the Funds are subject to loss due to adverse occurrences that may affect those industries. Funds that primarily invest in a particular industry may experience greater volatility than funds investing in a broad range of industries.
5. Investment Advisory Fee and Other Transactions with Affiliates
The Trust has an agreement with Tortoise Index Solutions, L.L.C. (the “Adviser”) to furnish investment advisory services to the Funds. Pursuant to an Investment Advisory Agreement between the Trust and the Adviser, the Adviser is entitled to receive, on a monthly basis, an annual advisory fee equal to 0.40% of each Fund's average daily net assets. The Adviser bears the cost of all advisor and non-advisory services required to operate each Fund.
The Adviser has engaged Exchange Traded Concepts, LLC (the “Sub-Adviser”) as the Sub-Adviser to the Funds. Subject to the supervision of the Adviser, the Sub-Adviser is primarily responsible for the day-to-day management of the Funds’ portfolio, including purchase, retention and sale of securities. Fees associated with these services are paid to the Sub-Adviser by the Adviser.
U.S. Bancorp Fund Services, LLC, doing business as U.S. Bank Global Fund Services (“Fund Services” or the “Administrator”) acts as the Funds’ Administrator, Transfer Agent and Fund Accountant. U.S. Bank, N.A. (the “Custodian”) serves as the custodian to the Funds. The Custodian is an affiliate of the Administrator. The Administrator performs various administrative and accounting services for the Funds. The Administrator prepares various federal and state regulatory filings, reports and returns for the Funds; prepares reports and materials to be supplied to the Trustees and monitors the activities of the Funds’ custodian, transfer agent and accountants. The officers of the Trust including the Chief Compliance Officer are employees of the Administrator. As compensation for its services, the Administrator is entitled to a monthly fee at an annual rate based upon the average daily net assets of the Funds, subject to annual minimums.
6. Investment Transactions
The aggregate purchases and sales, excluding U.S. government securities, short-term investments and in-kind transactions, by each Fund for the period ended November 30, 2024, were as follows:
| | | | | | | |
North American Pipeline Fund | | | $125,785,478 | | | $50,454,430 |
Global Water ESG Fund | | | 29,192,231 | | | 33,796,796 |
| | | | | | | |
TABLE OF CONTENTS
Tortoise Funds
Notes to Financial Statements
November 30, 2024(Continued)
During the period ended November 30, 2024, in-kind transactions associated with creation and redemptions were as follows:
| | | | | | | |
North American Pipeline Fund | | | $60,689,350 | | | $181,713,374 |
Global Water ESG Fund | | | 28,708,519 | | | 23,881,293 |
| | | | | | | |
During the period ended November 30, 2024, net capital gains resulting from in-kind redemptions were as follows:
| | | | |
North American Pipeline Fund | | | $58,284,485 |
Global Water ESG Fund | | | 5,770,828 |
| | | | |
7. Federal Tax Information
As of November 30, 2024, the Funds’ most recently completed fiscal year end, the cost basis of investments for federal income tax purposes and the components of accumulated losses on a tax basis were as follows:
| | | | | | | |
Cost of investments | | | $479,979,696 | | | $52,942,920 |
Gross unrealized appreciation | | | 223,034,130 | | | 8,448,791 |
Gross unrealized depreciation | | | (27,439,152) | | | (3,583,649) |
Net unrealized appreciation (depreciation) | | | 195,594,978 | | | 4,865,142 |
Undistributed ordinary income | | | — | | | 346,840 |
Undistributed long-term capital gain | | | — | | | — |
Total distributable earnings | | | — | | | 346,840 |
Other accumulated losses | | | | | | (3,531,083) |
Total accumulated gain | | | $195,594,978 | | | $1,680,899 |
| | | | | | | |
The difference between book and tax-basis cost is attributable primarily to wash sales and master limited partnership (“MLP”) adjustments.
As of November 30, 2024, the Global Water ESG Fund had a short-term capital loss carryforward of $1,249,238 and a long-term capital loss carryforward of $2,281,845, which may be carried forward for an unlimited period under the Regulated Investment Company Modernization Act of 2010. To the extent Funds realize future net capital gains, those gains will be offset by any unused capital loss carryforwards. Capital loss carryforwards will retain their character as either short-term or long-term capital losses. Thus, such losses must be used first to offset gains of the same character; for example, long-term loss carryforwards will first offset long-term gains, before they can be used to offset short-term gains. The capital gains and losses have been estimated based on information currently available and are subject to revision upon receipt of the 2024 tax reporting information from the individual MLPs. As of November 30, 2024, the Global Water ESG Fund utilized $612,298 of capital loss carryforwards in the current year.
In order to meet certain excise tax distribution requirements, the Funds are required to measure and distribute annually net capital gains realized during a twelve month period ending November 30 and net investment income earned during a twelve month period ending December 31. In connection with this, the Funds are permitted for tax purposes to defer into its next fiscal year qualified late year ordinary losses. Qualified late year ordinary losses are generally losses incurred between January 1 and the end of its fiscal year, November 30, 2024. The Funds did not defer any late year ordinary losses for the taxable year ended November 30, 2024.
TABLE OF CONTENTS
Tortoise Funds
Notes to Financial Statements
November 30, 2024(Continued)
During the period ended November 30, 2024 the Funds paid the following distributions to shareholders:
| | | | | | | |
Ordinary income* | | | $15,563,907 | | | $654,224 |
Long-term capital gains** | | | — | | | — |
Return of capital | | | 9,301,408 | | | — |
Total distributions | | | $24,865,315 | | | $654,224 |
| | | | | | | |
During the year ended November 30, 2023, the Funds paid the following distributions to shareholders:
| | | | | | | |
Ordinary income* | | | $15,996,596 | | | $1,016,406 |
Long-term capital gains** | | | 1,274,455 | | | — |
Return of capital | | | 8,411,109 | | | — |
Total distributions | | | $25,682,160 | | | $1,016,406 |
| | | | | | | |
*
| For federal income tax purposes, distributions of short-term capital gains are treated as ordinary income distributions.
|
**
| The Fund designates as long-term capital gain distributions, pursuant to Internal Revenue Code Section 852(b)(3)(C). |
8. Subsequent Events
On December 31, 2024, the North American Pipeline Fund paid an income distribution to shareholders in the amount of $6,683,600, or $0.3472000 per share.
On December 31, 2024, the Global Water ESG Fund paid an income distribution to shareholders in the amount of $371,725, or $0.32323914 per share.
Management has performed an evaluation of subsequent events through the date the financial statements were issued and has determined that no items require recognition or disclosure.
TABLE OF CONTENTS
Tortoise Funds
Report of Independent Registered Public Accounting Firm
To the Shareholders of Tortoise Global Water ESG Fund
and Tortoise North American Pipeline Fund and
the Board of Trustees of Managed Portfolio Series
Opinion on the Financial Statements
We have audited the accompanying statements of assets and liabilities of Tortoise Global Water ESG Fund (formerly, Ecofin Global Water ESG Fund) and Tortoise North American Pipeline Fund (collectively referred to as the “Funds”), (two of the Funds constituting the Managed Portfolio Series (the “Trust”)), including the schedules of investments, as of November 30, 2024, and the related statements of operations for the year then ended, the statements changes in net assets for each of the two years in the period then ended, the financial highlights for each of the five years in the period then ended and the related notes (collectively referred to as the “financial statements”). In our opinion, the financial statements present fairly, in all material respects, the financial position of each of the Funds (two of the funds constituting Managed Portfolio Series) at November 30, 2024, the results of their operations for the year then ended, the changes in their net assets for each of the two years in the period then ended and their financial highlights for each of the five years in the period then ended, in conformity with U.S. generally accepted accounting principles.
Basis for Opinion
These financial statements are the responsibility of the Trust’s management. Our responsibility is to express an opinion on each of the Funds’ financial statements based on our audits. We are a public accounting firm registered with the Public Company Accounting Oversight Board (United States) (“PCAOB”) and are required to be independent with respect to the Trust in accordance with the U.S. federal securities laws and the applicable rules and regulations of the Securities and Exchange Commission and the PCAOB.
We conducted our audits in accordance with the standards of the PCAOB. Those standards require that we plan and perform the audit to obtain reasonable assurance about whether the financial statements are free of material misstatement, whether due to error or fraud. The Trust is not required to have, nor were we engaged to perform, an audit of the Trust’s internal control over financial reporting. As part of our audits, we are required to obtain an understanding of internal control over financial reporting but not for the purpose of expressing an opinion on the effectiveness of the Trust’s internal control over financial reporting. Accordingly, we express no such opinion.
Our audits included performing procedures to assess the risks of material misstatement of the financial statements, whether due to error or fraud, and performing procedures that respond to those risks. Such procedures included examining, on a test basis, evidence regarding the amounts and disclosures in the financial statements. Our procedures included confirmation of securities owned as of November 30, 2024, by correspondence with the custodian. Our audits also included evaluating the accounting principles used and significant estimates made by management, as well as evaluating the overall presentation of the financial statements. We believe that our audits provide a reasonable basis for our opinion.
We have served as the auditor of one or more of the portfolios that comprise the Managed Portfolio Series since 2011.
Minneapolis, Minnesota
January 28, 2025
TABLE OF CONTENTS
Tortoise Funds
Additional Information (Unaudited)
Availability of Fund Portfolio Information
The Fund files complete schedules of portfolio holdings with the SEC for the first and third quarters of each fiscal year on Part F of Form N-PORT. The Funds’ Part F of Form N-PORT are available on the SEC’s website at www.sec.gov and may be reviewed and copied at the SEC’s Public Reference Room in Washington, D.C. Information on the operation of the Public Reference Room may be obtained by calling 1-800-732-0330. The Funds’ Part F of Form N-PORT may also be obtained by calling toll-free 1-844-TR-INDEX or 1-844-874-6339.
Availability of Proxy Voting Information
A description of the Fund’s Proxy Voting Policies and Procedures is available without charge, upon request, by calling 1-844-TR-INDEX or 1-844-874-6339. Information regarding how the Fund voted proxies relating to portfolio securities during the most recent 12 month period ended June 30, is available (1) without charge, upon request, by calling 1-844-TR-INDEX or 1-844-874-6339, or (2) on the SEC’s website at www.sec.gov.
Qualified Dividend Income/Dividends Received Deduction
For the fiscal year ended November 30, 2024, certain dividends paid by the Funds may be reported as qualified dividend income and may be eligible for taxation at capital gain rates. The percentage of dividends declared from ordinary income designated as qualified dividend income was 100.00% and 100.00% for the North American Pipeline Fund and Global Water ESG Fund, respectively.
For corporate shareholders, the percent of ordinary income distributions qualifying for the corporate dividends received deduction for the fiscal year ended November 30, 2024 was 68.24% and 47.94% for the North American Pipeline Fund and Global Water ESG Fund, respectively.
The percentage of taxable ordinary income distributions that are designated as short-term capital gain distributions under Internal Revenue Section 871(k)(2)(C) was 8.13% and 0.00% for the North American Pipeline Fund and Global Water ESG Fund, respectively.
TABLE OF CONTENTS
Contacts
Board of Trustees
David Massart
Leonard Rush, CPA
David Swanson
Robert Kern
Investment Adviser
Tortoise Index Solutions, L.L.C.
d/b/a TIS Advisors
5901 College Boulevard, Suite 400
Overland Park, KS 66211
Independent Registered Public Accounting Firm
Ernst & Young LLP
700 Nicollet Mall, Suite 500
Minneapolis, MN 55402
Transfer Agent, Fund Accountant and Fund Administrator
U.S. Bancorp Fund Services, LLC
615 E. Michigan Street
Milwaukee, WI 53202
Distributor
Quasar Distributors, LLC
3 Canal Plaza, Suite 100
Portland, ME 04101
Custodian
U.S. Bank, N.A.
1555 North Rivercenter Drive
Milwaukee, WI 53212
Fund Counsel
Stradley Ronon Stevens & Young LLP
2005 Market Street
Suite 2600
Philadelphia, PA 19103
844-TR-INDEX
(844-874-6339)
This report must be accompanied or preceded by a prospectus.
The Fund’s Statement of Additional Information contains additional information about the Fund’s trustees and is
available without charge upon request by calling 1-844-TR-INDEX or 1-844-874-6339.
| (b) | Financial Highlights are included within the financial statements filed under Item 7 of this Form. |
Item 8. Changes in and Disagreements with Accountants for Open-End Investment Companies.
There were no changes in or disagreements with accountants during the period covered by this report.
Item 9. Proxy Disclosure for Open-End Investment Companies.
There were no matters submitted to a vote of shareholders during the period covered by this report.
Item 10. Remuneration Paid to Directors, Officers, and Others of Open-End Investment Companies.
All fund expenses, including Trustee compensation is paid by the Investment Adviser pursuant to the Investment Advisory Agreement. Additional information related to those fees is available in the Fund’s Statement of Additional Information.
Item 11. Statement Regarding Basis for Approval of Investment Advisory Contract.
Not applicable.
Item 12. Disclosure of Proxy Voting Policies and Procedures for Closed-End Management Investment Companies.
Not applicable to open-end investment companies.
Item 13. Portfolio Managers of Closed-End Management Investment Companies.
Not applicable to open-end investment companies.
Item 14. Purchases of Equity Securities by Closed-End Management Investment Company and Affiliated Purchasers.
Not applicable to open-end investment companies.
Item 15. Submission of Matters to a Vote of Security Holders.
There have been no material changes to the procedures by which shareholders may recommend nominees to the registrant’s board of trustees.
Item 16. Controls and Procedures.
| (a) | The Registrant’s [Principal Executive Officer] and [Principal Financial Officer] have reviewed the Registrant’s disclosure controls and procedures (as defined in Rule 30a-3(c) under the Investment Company Act of 1940 (the “Act”)) as of a date within 90 days of the filing of this report, as required by Rule 30a-3(b) under the Act and Rules 13a-15(b) or 15d-15(b) under the Securities Exchange Act of 1934. Based on their review, such officers have concluded that the disclosure controls and procedures are effective in ensuring that information required to be disclosed in this report is appropriately recorded, processed, summarized and reported and made known to them by others within the Registrant and by the Registrant’s service provider. |
| (b) | There were no changes in the Registrant’s internal control over financial reporting (as defined in Rule 30a-3(d) under the Act) that occurred during the period covered by this report that have materially affected, or are reasonably likely to materially affect, the Registrant’s internal control over financial reporting. |
Item 17. Disclosure of Securities Lending Activities for Closed-End Management Investment Companies
Not applicable to open-end investment companies.
Item 18. Recovery of Erroneously Awarded Compensation.
(a) Not applicable
(b) Not applicable
Item 19. Exhibits.
(2) Not applicable
(3) A separate certification for each principal executive officer and principal financial officer pursuant to Section 302 of the Sarbanes-Oxley Act of 2002. Filed herewith.
(4) Not applicable to open-end investment companies
(5) Not applicable to open-end investment companies
SIGNATURES
Pursuant to the requirements of the Securities Exchange Act of 1934 and the Investment Company Act of 1940, the registrant has duly caused this report to be signed on its behalf by the undersigned, thereunto duly authorized.
| | (Registrant) | Managed Portfolio Series | |
| | By (Signature and Title)* | /s/ Brian R. Wiedmeyer | |
| | | Brian R. Wiedmeyer, Principal Executive Officer | |
Pursuant to the requirements of the Securities Exchange Act of 1934 and the Investment Company Act of 1940, this report has been signed below by the following persons on behalf of the registrant and in the capacities and on the dates indicated.
| | By (Signature and Title)* | /s/ Brian R. Wiedmeyer | |
| | | Brian R. Wiedmeyer, Principal Executive Officer | |
| | By (Signature and Title)* | /s/ Benjamin J. Eirich | |
| | | Benjamin J. Eirich, Principal Financial Officer | |
* Print the name and title of each signing officer under his or her signature.