Exhibit 99.1

Investor Presentation Third Quarter 2016

INTRODUCTION

Page 3 We make forward - looking statements in this presentation within the meaning of the Private Securities Litigation Reform Act of 1995 . These forward - looking statements relate to expectations or forecasts for future events, including, without limitation, our ability to achieve synergies from the EMC acquisition, expenses, future financial or business performance or strategies, or the future performance of the connectivity and content markets . These statements may be preceded by, followed by or include the words “may,” “might,” “will,” “will likely result,” “should,” “estimate,” “plan,” “project,” “forecast,” “intend,” “expect,” “anticipate,” “believe,” “seek,” “continue,” “target” or similar expressions . These forward - looking statements are based on information available to us as of the date they were made (which is September 27 , 2016 ), and involve a number of risks and uncertainties which may cause them to turn out to be wrong . Accordingly, forward - looking statements should not be relied upon as representing our views as of any subsequent date, and we do not undertake any obligation to update forward - looking statements to reflect events or circumstances after the date they were made, whether as a result of new information, future events or otherwise, except as may be required under applicable securities laws . As a result of a number of known and unknown risks and uncertainties, our actual results or performance may be materially different from those expressed or implied by these forward - looking statements . Please refer to our second quarter earnings release, furnished on Form 8 - K, our most recent quarterly reports filed on Form 10 - Q, and our most recent annual report filed on Form 10 - K, and in particular any discussion of risk factors or forward - looking statements therein, which are available on the SEC’s website (www . sec . gov), for a full discussion of the risks and other factors that may impact any forward - looking statements in this presentation or that you may hear during this presentation . SAFE HARBOR STATEMENT Introduction
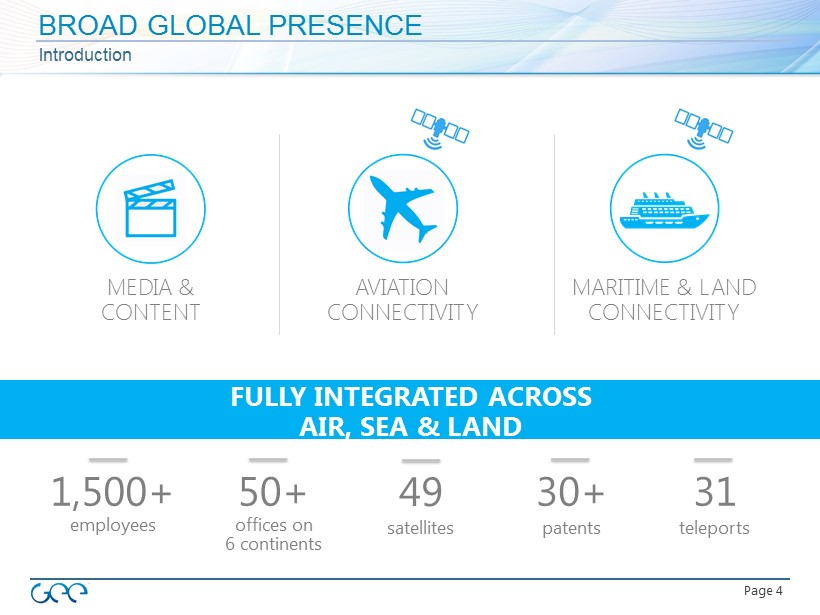
Page 4 BROAD GLOBAL PRESENCE Introduction employees 1,500+ offices on 6 continents 50+ patents 30+ teleports 31 satellites 49 FULLY INTEGRATED ACROSS AIR, SEA & LAND MEDIA & CONTENT AVIATION CONNECTIVITY MARITIME & LAND CONNECTIVITY

Page 5 Addressable Customer Base Core Capabilities Customer Markets LARGE ADDRESSABLE MARKET Introduction Commercial Aviation Cruise Yachts UN / NGO Telco Business Jet 21,000 Aircraft 158,000 Cabins 130,000 Ships 13,000 Yachts Remote Telcos Humanitarian campaigns Content Films and TV Shows Live TV Video - on - Demand Games, Apps, etc. Connectivity Broadband Internet Compression / Bandwidth Optimization Cellular Voice / Data Remote Backhaul Mission Critical Services Operational Data Additional Bandwidth Services Equipment 28,000 Aircraft Shipping / O&G __________________________ Source: Company presentations. (1) Includes 121,000 commercial ships and 8,500 off - shore rigs. (1) Global Eagle Entertainment
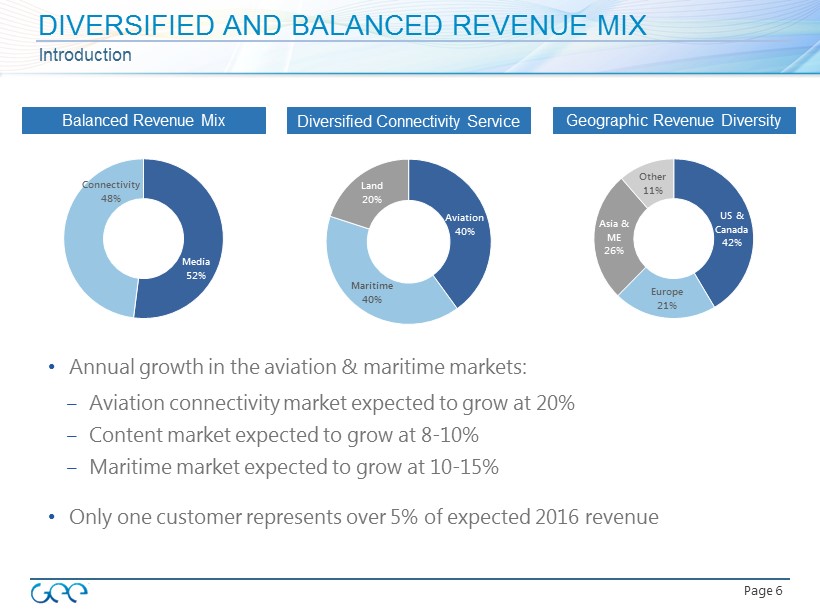
Page 6 DIVERSIFIED AND BALANCED REVENUE MIX Introduction Media 52% Connectivity 48% US & Canada 42% Europe 21% Asia & ME 26% Other 11% Aviation 40% Maritime 40% Land 20% Balanced Revenue Mix Diversified Connectivity Service Geographic Revenue Diversity • Annual growth in the aviation & maritime markets: – Aviation connectivity market expected to grow at 20% – Content market expected to grow at 8 - 10% – Maritime market expected to grow at 10 - 15% • Only one customer represents over 5% of expected 2016 revenue
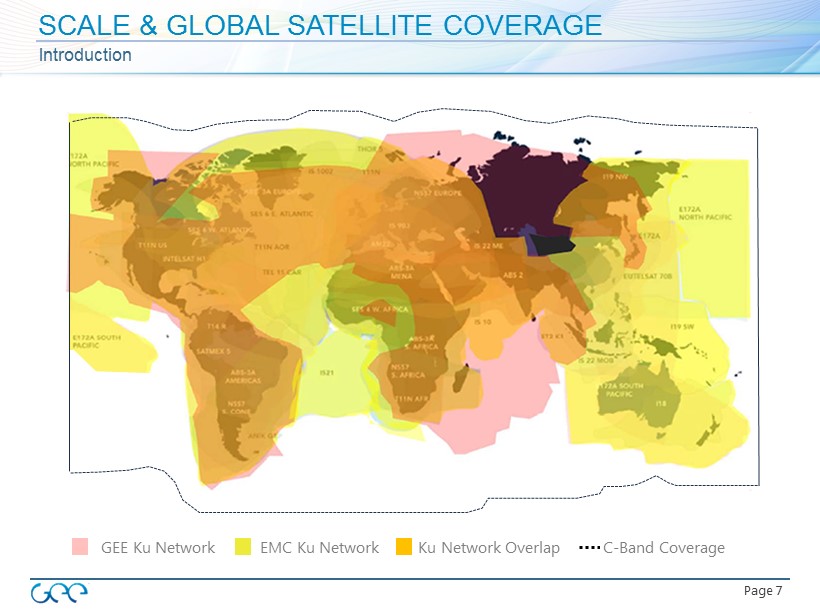
Page 7 GEE Ku Network EMC Ku Network Ku Network Overlap C - Band Coverage SCALE & GLOBAL SATELLITE COVERAGE Introduction

Page 8 SG&A Merge G&A and systems Streamline sales & marketing operations Revenue Synergies Consolidate and integrate services Cross - sell content and value - added services Teleport and Network Operations Consolidate capacity into EMC’s teleports Reduce network POPs, NOCs, MPLS backbone Satellite Bandwidth Savings Purchasing power enables stronger contracts Savings from new and legacy contract renewals COST & REVENUE SYNERGIES IN EMC TRANSACTION Introduction $15mm $40mm 2017 2018 Expected Cost Synergy Realization Dollars in Millions

MEDIA & CONTENT

Page 10 DEEP RELATIONSHIPS WITH STUDIOS AND AIRLINES Media & Content Studio Content In - Flight Distribution Rights Independents International Studios (Asia, Bollywood, Europe, Middle East, French, Latino) Formatting and Post - Production Work Games/Apps
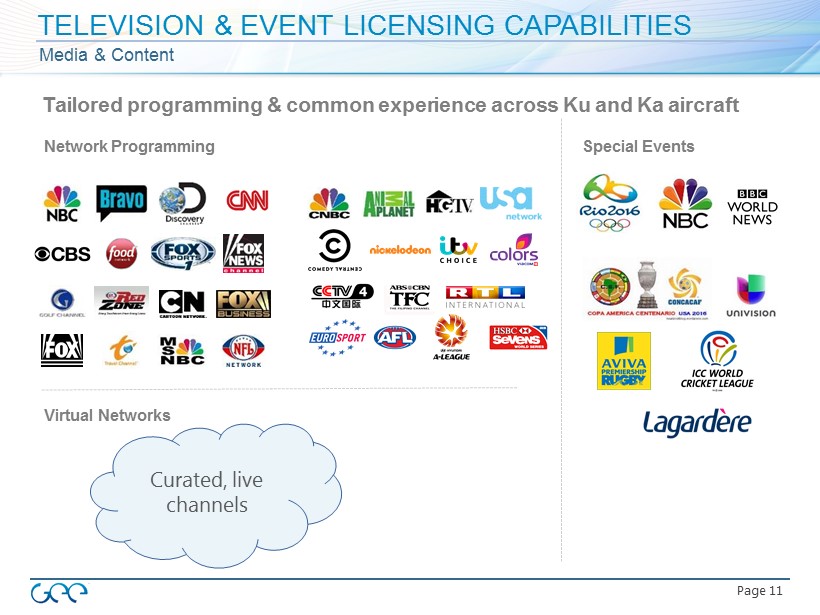
Page 11 Curated, live channels Tailored programming & common experience across Ku and Ka aircraft Network Programming Virtual Networks Special Events TELEVISION & EVENT LICENSING CAPABILITIES Media & Content
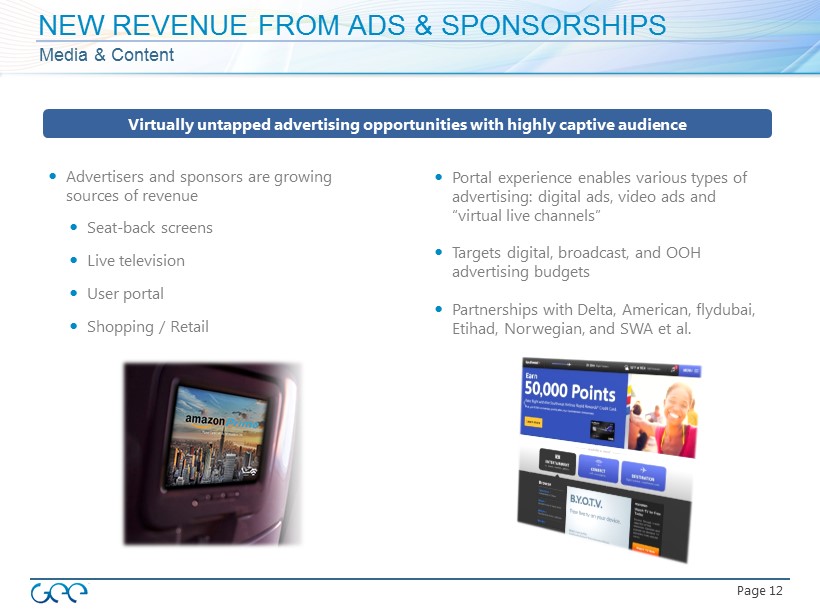
Page 12 Advertisers and sponsors are growing sources of revenue Seat - back screens Live television User portal Shopping / Retail Portal experience enables various types of advertising: digital ads, video ads and “virtual live channels ” Targets digital, broadcast, and OOH advertising budgets Partnerships with Delta, American, flydubai, Etihad , Norwegian, and SWA et al. NEW REVENUE FROM ADS & SPONSORSHIPS Media & Content Virtually untapped advertising opportunities with highly captive audience

Page 13 DIGITAL MEDIA PRODUCTS Media & Content Airtime Content - to - Go Airtime IFE M obile app downloaded to passengers ' devices, enabling a personalized infotainment experience. Airlines can deploy IFE without any onboard hardware. Live Television GEE licenses all content , acquires the signal, processes the media and delivers live television to each aircraft. GEE was the first to deliver IPTV to airlines. Entice Hardware and software solution for streaming content securely to passengers’ devices. Enables airlines to deliver a feature rich unique experience to passengers. Features up to 10,000 hours of movie and TV content streamed to passengers’ own devices, as well as music and games.

AVIATION CONNECTIVITY
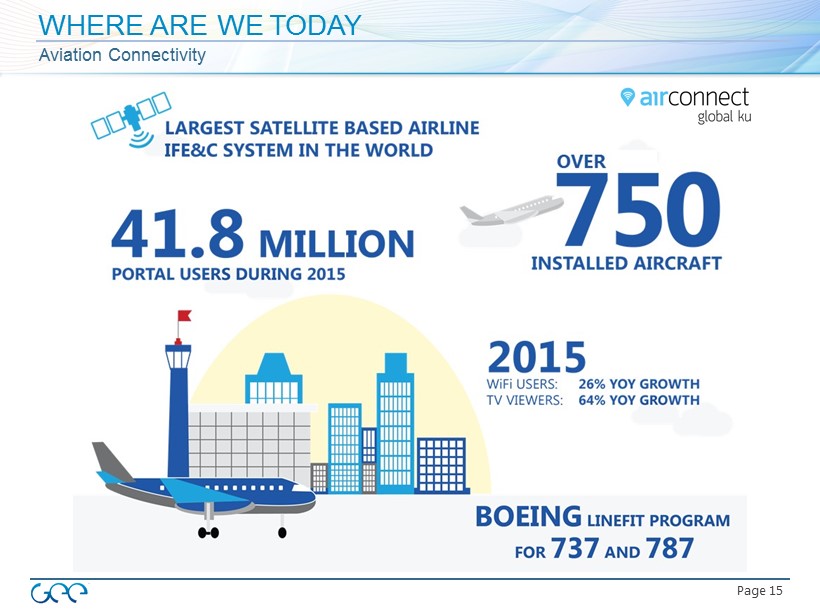
Page 15 WHERE ARE WE TODAY Aviation Connectivity
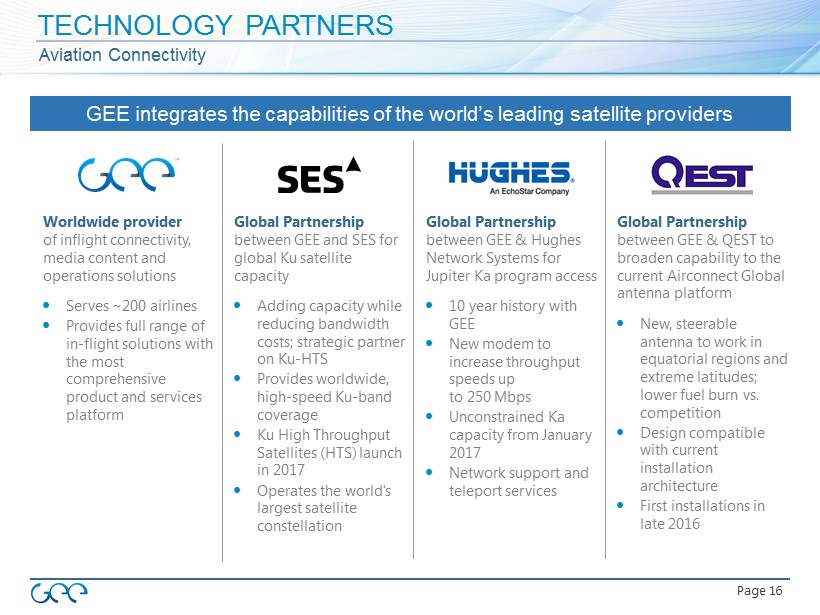
Page 16 Global Partnership between GEE and SES for global Ku satellite capacity Adding capacity while reducing bandwidth costs; strategic partner on Ku - HTS Provides worldwide, high - speed Ku - band coverage Ku High Throughput Satellites (HTS) launch in 2017 Operates the world’s largest satellite constellation Global Partnership between GEE & Hughes Network Systems for Jupiter Ka program access 10 year history with GEE New modem to increase throughput speeds up to 250 Mbps Unconstrained Ka capacity from January 2017 Network support and teleport services Worldwide provider of inflight connectivity, media content and operations solutions Serves ~200 airlines Provides full range of in - flight solutions with the most comprehensive product and services platform TECHNOLOGY PARTNERS Aviation Connectivity Global Partnership between GEE & QEST to broaden capability to the current Airconnect Global antenna platform New, steerable antenna to work in equatorial regions and extreme latitudes; lower fuel burn vs. competition Design compatible with current installation architecture First installations in late 2016 GEE integrates the capabilities of the world’s leading satellite providers

Page 17 Space Segment Ground Infrastructure Aircraft Terminals Customer Delivery Ku/HTS Network Ku Wideband SES - 14 (HTS) SES - 15 (HTS) Turn - key platform Authentication Transactions Advertising/offers Video/TV Ku/HTS Band Transport Gateways Teleport Infrastructure MPLS Circuits Network Access & Firewalls Traffic & NAT Routers Public Internet Gateway GSAA Ku band Ku aperture/RF SMU (Server) MDU (Dual - modem) Common form/fit CWAPs (802.11n/ac) Content Management User Interface Service Analytics Traffic analysis Bandwidth fairness Operations data Operations analytics Inventory tracking GEE END - TO - END NETWORK MANAGEMENT Aviation Connectivity Ku Band

Page 18 CONNECTED AIRCRAFT Aviation Connectivity Connected aircraft drives revenue for GEE masFlight and navAero Source data from avionics & EFBs Transmit via IFC, cell & WiFi links Load and analyze data in the cloud Deliver unique value via solutions x ARINC 429/717 data streams x Now incorporating data from GEE SMU x navAero UAID now capable of data streaming x Fork data by priority – requires onboard logic x Send high - priority data via IFC + SMU stream x navAero vQAR solution for lower priority data x Real - time data ingestion into masFlight x Combine with other masFlight data sources x Structure and analyze to power applications Real - time data Historical data
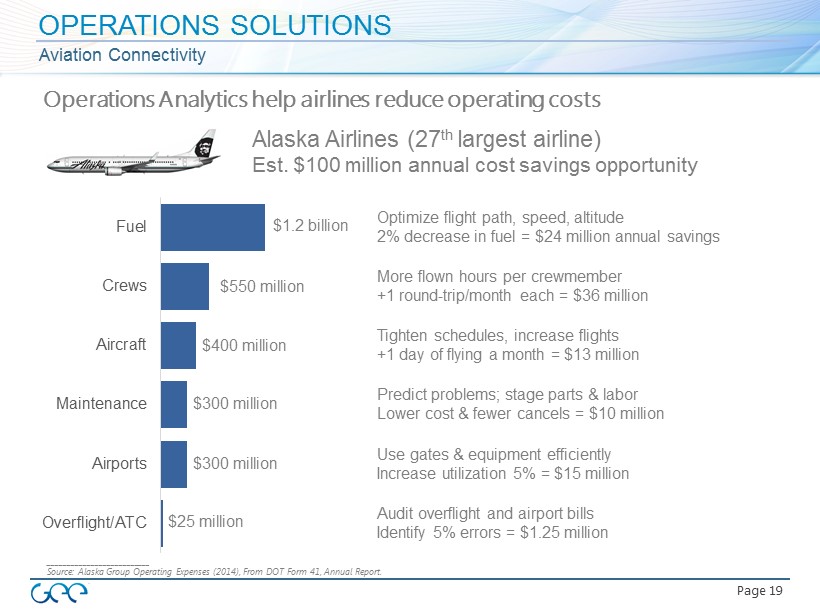
Page 19 Operations Analytics help airlines reduce operating costs Alaska Airlines (27 th largest airline) Est. $100 million annual cost savings opportunity Fuel Crews Aircraft Maintenance Airports Overflight/ATC $1.2 billion $550 million $400 million $300 million $300 million $25 million Optimize flight path, speed, altitude 2% decrease in fuel = $24 million annual savings M ore flown hours per crewmember +1 round - trip/month each = $36 million Tighten schedules, increase flights +1 day of flying a month = $13 million Predict problems; stage parts & labor Lower cost & fewer cancels = $10 million Use gates & equipment efficiently Increase utilization 5% = $15 million Audit overflight and airport bills Identify 5% errors = $1.25 million OPERATIONS SOLUTIONS Aviation Connectivity __________________________ Source: Alaska Group Operating Expenses (2014), From DOT Form 41, Annual Report.

MARITIME & LAND CONNECTIVITY

Page 21 Crew welfare bundles include products with defined usage limits and prices Offerings compatible with both GSM services and private devices Products include VoIP, internet and media content GEE’s passenger entertainment offerings have some of the same components as crew welfare products Key growth areas include internet connection, SpeedNet, VOD, SVOD, live TV, and 3G Customers purchase volumes of bandwidth to meet mission - critical communication needs Product offerings require on - site components, driving service level agreements Mission Critical Connectivity Crew Welfare (entertainment, connection to family/friends) Passenger Entertainment & Content PRODUCTS FOCUS ON THREE MAIN AREAS Maritime & Land Connectivity Expected Maritime VSAT Growth (1) Number of Active Terminals by Frequency Band 0 10,000 20,000 30,000 40,000 50,000 '10 '11 '12 '13 '14 '15 '16 '17 '18 '19 '20 '21 '22 '23 Ka - band Ku - band C - band Expected Global Energy VSAT Growth Two - Way VSAT Networking Sites, 000s 0 50 100 150 200 250 300 '13 '14 '15 '16 '17 '18 '19 '20 '21 '22 '23 __________________________ Source: Mobile Satellite Communications © Euroconsult 2014, NSR. (1) Includes MENA and LatAm regions.

Page 22 TRIPLE PLAY CUSTOMER PORTAL Maritime & Land Connectivity Full portfolio of services for live TV, SVOD, TVOD, 3G and WiFi Calling Access to linear TV, SVOD, TVOD, VoIP and 3G services Seamless end - user interface on any device, online or by using the app Devices include phone, tablet, laptop, computer or kiosk Leverages proprietary software – successfully implemented today Bundled packages and direct billing Usage meters Access to support and educational marketing Triple Play Customer Portal Live TV Streaming Video on Demand WiFi Calling Broadband Internet 3G Services

Page 23 MULTI - MEDIA SOLUTIONS FOR CREW WELFARE Maritime & Land Connectivity GEE Provides Multimedia Solutions for Crew Members, Offshore and Onshore SVOD & TVOD Hollywood blockbusters and documentaries for the Cruise market as well as today’s best television programs Live TV Special Events Exclusive live one - off events are available for purchase or acquisition Music Wide variety of music, available on any device Games Games for all ages – educational, puzzles, entertainment Communications provider to remote, off - the - grid customers Telephony Digital Books & Magazines Best selling novels and current magazines for in multiple languages
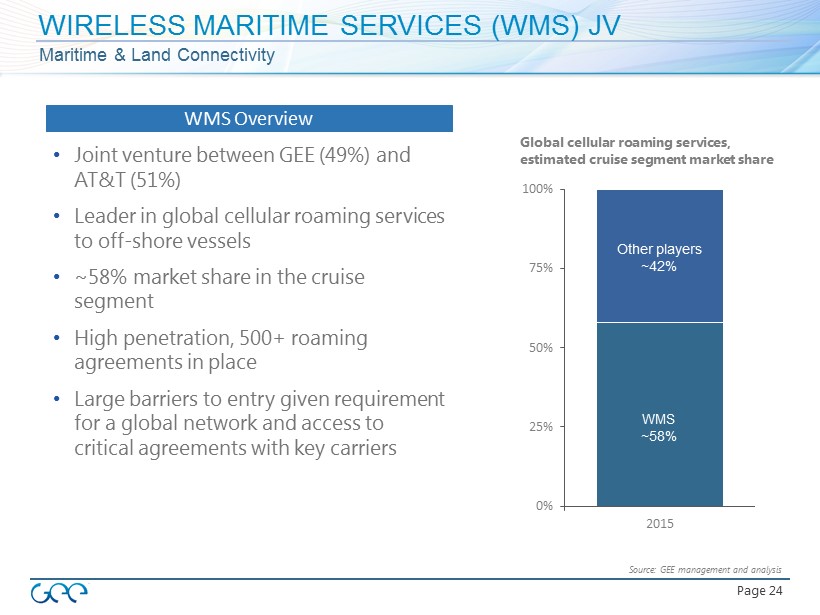
Page 24 Maritime & Land Connectivity • Joint venture between GEE (49%) and AT&T (51%) • Leader in global cellular roaming services to off - shore vessels • ~58% market share in the cruise segment • High penetration , 500+ roaming agreements in place • Large barriers to entry given requirement for a global network and access to critical agreements with key carriers 0% 25% 50% 75% 100% 2015 Global cellular roaming services, estimated cruise segment market share WMS ~58% Other players ~42% Source: GEE management and analysis WIRELESS MARITIME SERVICES (WMS) JV WMS Overview

FINANCIALS
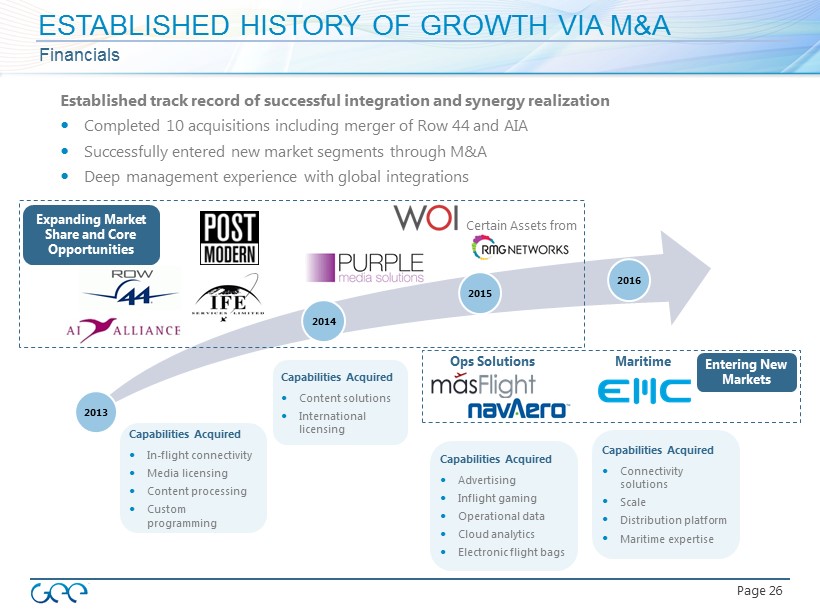
Page 26 Established track record of successful integration and synergy realization Completed 10 acquisitions including merger of Row 44 and AIA Successfully entered new market segments through M&A Deep management experience with global integrations ESTABLISHED HISTORY OF GROWTH VIA M&A Financials Capabilities Acquired In - flight connectivity Media licensing Content processing Custom programming Capabilities Acquired Content solutions International licensing Capabilities Acquired Advertising Inflight gaming Operational data Cloud analytics Electronic flight bags Capabilities Acquired Connectivity solutions Scale Distribution platform Maritime expertise Certain Assets from Ops Solutions Maritime 2014 2016 2015 2013 Entering New Markets Expanding Market Share and Core Opportunities

Page 27 REVENUE GROWTH AND EXPANDING MARGINS Financials $260 $388 $426 $0 $100 $200 $300 $400 $500 2013 2014 2015 $12 $31 $50 $0 $20 $40 $60 2013 2014 2015 * See Appendix A and Appendix B for the definition of Adjusted EBITDA and a reconciliation to Net Income Revenue Adjusted EBITDA* Dollars in Millions Dollars in Millions Note: Net Income of - $114.9 (2013), - $54.8 (2014) and - $2.1 (2015)

Page 28 DEFINITION OF ADJUSTED EBITDA Appendix A To supplement our financials, which are prepared and presented in accordance with generally accepted accounting principles, or GAAP, we present Adjusted EBITDA, which is a non - GAAP financial measure, as a measure of our performance . The presentation of Adjusted EBITDA is not intended to be considered in isolation from, or as a substitute for, or superior to, net income (loss) or any other performance measures derived in accordance with GAAP or as an alternative to net cash provided by operating activities or any other measures of our cash flows or liquidity . For more information on this non - GAAP financial measure, please see the table entitled “Net Income to Adjusted EBITDA Reconciliation” at the end of this presentation . Adjusted EBITDA is one of the primary measures used by our management and board of directors to understand and evaluate our financial performance and operating trends, including period to period comparisons, to prepare and approve our annual budget and to develop short and long term operational plans . Additionally, Adjusted EBITDA is one of the primary measures used by the compensation committee of our board of directors to establish the funding targets for our annual bonus pool for our employees and executives . We believe our presentation of Adjusted EBITDA is useful to investors both because it allows for greater transparency with respect to key metrics used by management in its financial and operational decision - making and our management frequently uses it in discussions with investors, commercial bankers, securities analysts and other users of our financial statements . We define Adjusted EBITDA as net income (loss) attributable to common stockholders before, when applicable, net income (loss) attributable to non - controlling interests, income tax expense (benefit), other (income) expense, depreciation and amortization, as further adjusted to eliminate the impact of, when applicable, stock - based compensation, acquisition and realignment costs, restructuring charges, foreign exchange gain (loss) on intercompany loans and any gains or losses on certain asset sales or dispositions . Other income (expense), acquisition and realignment costs and restructuring charges include such items, when applicable, as (a) non - cash GAAP purchase accounting adjustments for certain deferred revenue and costs, (b) legal, accounting and other professional fees directly attributable to acquisition activity, (c) employee severance payments and third party professional fees directly attributable to acquisition or corporate realignment activities, (d) legal settlements or reserves for legal settlements in the period that pertain to matters existing at acquired companies, (e) changes in the fair value of our derivative financial instruments, (f) interest expense associated with our debt and (g) any restructuring charges in the period pursuant to our integration plan announced on September 23 , 2014 . Management does not consider these costs to be indicative of our core operating results .
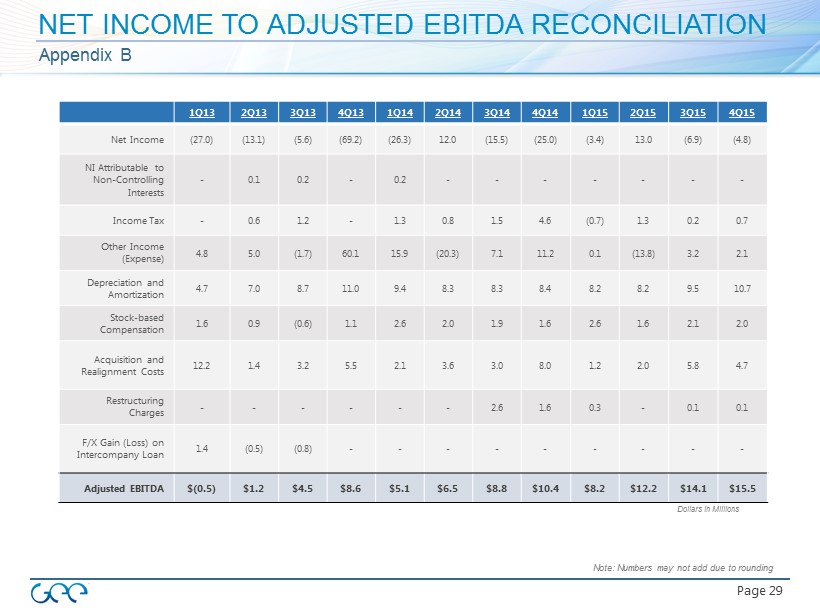
Page 29 NET INCOME TO ADJUSTED EBITDA RECONCILIATION Appendix B Dollars in Millions 1Q13 2Q13 3Q13 4Q13 1Q14 2Q14 3Q14 4Q14 1Q15 2Q15 3Q15 4Q15 Net Income (27.0) (13.1) (5.6) (69.2) (26.3) 12.0 (15.5) (25.0) (3.4) 13.0 (6.9) (4.8) NI Attributable to Non - Controlling Interests - 0.1 0.2 - 0.2 - - - - - - - Income Tax - 0.6 1.2 - 1.3 0.8 1.5 4.6 (0.7) 1.3 0.2 0.7 Other Income (Expense) 4.8 5.0 (1.7) 60.1 15.9 (20.3) 7.1 11.2 0.1 (13.8) 3.2 2.1 Depreciation and Amortization 4.7 7.0 8.7 11.0 9.4 8.3 8.3 8.4 8.2 8.2 9.5 10.7 Stock - based Compensation 1.6 0.9 (0.6) 1.1 2.6 2.0 1.9 1.6 2.6 1.6 2.1 2.0 Acquisition and Realignment Costs 12.2 1.4 3.2 5.5 2.1 3.6 3.0 8.0 1.2 2.0 5.8 4.7 Restructuring Charges - - - - - - 2.6 1.6 0.3 - 0.1 0.1 F/X Gain (Loss) on Intercompany Loan 1.4 (0.5) (0.8) - - - - - - - - - Adjusted EBITDA $(0.5) $1.2 $4.5 $8.6 $5.1 $6.5 $8.8 $10.4 $8.2 $12.2 $14.1 $15.5 Note: Numbers may not add due to rounding