Exhibit 99.1

Steve Ziganti
3 Steves Winery
Livermore, California
Q2 2016 Shareholder Letter
SQUARE.COM/INVESTORS
Second Quarter Highlights
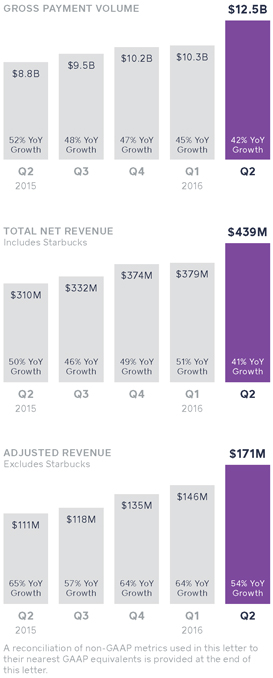
| • | | Gross Payment Volume was $12.5 billion, up 42% year over year. |
| • | | Total net revenue was $439 million, up 41% year over year; Adjusted Revenue was $171 million, up 54% year over year. |
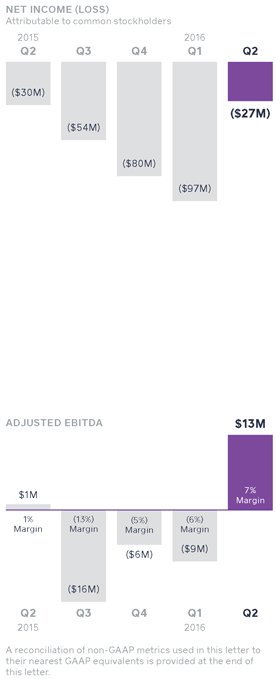
| • | | Net loss was $27 million, an improvement of over $2 million year over year. |
| • | | We achieved positive Adjusted EBITDA of $13 million, a margin improvement of 7 points year over year. |
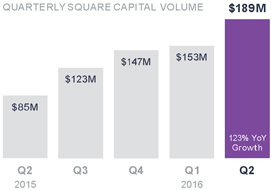
| • | | We extended $189 million in Square Capital, up 123% year over year and 23% sequentially. |
To Our Shareholders:
We are pleased with our second quarter results, which highlight strong growth at scale and a significant profitability milestone. Gross Payment Volume (GPV) for the second quarter was $12.5 billion, up 42% year over year. New-seller growth made up the majority of our GPV increase, while positive dollar-based retention from existing sellers also had a meaningful impact. Total net revenue was $439 million, up 41% year over year. Adjusted Revenue was $171 million, up 54% year over year, and exceeded the high end of our guidance.
Net loss was $27 million, and we achieved positive Adjusted EBITDA of $13 million, which also exceeded the high end of our guidance. This represents an Adjusted EBITDA margin of 7%, an improvement of 7 points year over year and 14 points sequentially. This Adjusted EBITDA improvement reflects our increased scale and operating leverage, positive dollar-based retention from existing sellers, and our ability to drive new product adoption.
We are excited about our results and how well positioned we are for the future. We started Square with the mission to enable sellers to accept payments anywhere and never miss a sale.
Second Quarter Key Results
GROSS PAYMENT VOLUME
$12.5 Billion+42% YoY
TOTAL NET REVENUE
$439 Million+41% YoY
ADJUSTED REVENUE
$171 Million+54% YoY
NET INCOME (LOSS)
($27) Million+$2 Million YoY
ADJUSTED EBITDA
$13 Million7% of Adjusted Revenue
Adjusted EBITDA margin is calculated as Adjusted EBITDA divided by Adjusted Revenue.
A reconciliation of non-GAAP metrics used in this letter to their nearest GAAP equivalents is provided at the end of this letter.
2
Our focus on technology and design allows us to create products and services that are accessible, intuitive, and easy to use. This has enabled us to build a cohesive commerce ecosystem that extends into point-of-sale software, business loans, employee management, and much more. In addition, we are using data science and risk systems to service sellers of all sizes, significantly expanding our addressable market. And as we grow our business, we continue to drive improvements in profitability.
We launched new products that provide sellers with more options to accept payments quickly and easily.
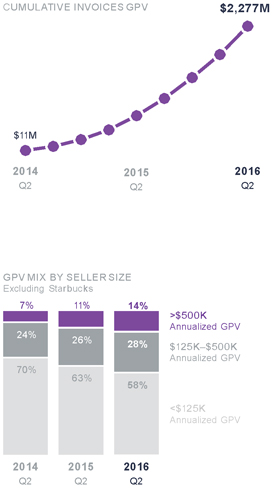
In the second quarter, we continued to innovate, launching several new products including Scheduled Invoices, Recurring Invoices, and Card on File, which allows a seller to save a buyer’s card for future billing. Many of our sellers manually create the same invoice for the same buyer on a recurring basis. Recurring Invoices automates that process, so they can get paid quickly without extra work or hassle. Recurring Invoices and Card on File unlock a larger market opportunity for us, particularly in the services, health and beauty, and home repair categories. To date, the convenience of Invoices has made it enormously popular with sellers. As of the second quarter, 140,000 active sellers use Invoices, representing 122% growth since the second quarter of 2015. Additionally, we have reached $2.3 billion of cumulative GPV from Invoices since the product launched in June 2014, with $542 million processed in the second quarter of 2016.
We grew larger-seller GPV 61% year over year, while maintaining overall transaction revenue margin.
We are pleased with our growth in larger sellers, which we define as those sellers that generate more than $125,000 in annualized GPV. GPV from these larger sellers grew 61% year
3
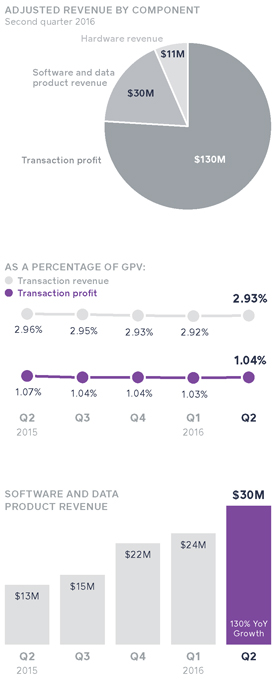
over year, representing 42% of GPV in the second quarter of 2016, up from 37% of GPV in the second quarter of 2015. We have achieved this larger-seller GPV growth while maintaining transaction revenue margin, demonstrating that larger sellers are not focused solely on price and recognize the full value of our cohesive ecosystem. In the second quarter of 2016, transaction revenue as a percentage of GPV was 2.93%. When excluding the promotional processing credits for our new contactless and chip reader, it was 2.94%, compared to 2.96% in the prior year period.
Our success with larger sellers is due to multiple factors. First, larger sellers join Square because of our products’ differentiated ease of use. Larger sellers typically have more staff, and they can train their employees on Square in minutes because of our hardware and software’s intuitive design. Second, we have focused on bringing payments together with additional services into one cohesive ecosystem. This cohesion can be attractive to larger sellers, who typically do not want to stitch together hardware, software, and payments services from many different vendors. Third, larger sellers benefit from fast access to capital, whether it’s next-day settlement of funds, Instant Deposit, or Square Capital loans.
For example, The Scottish Plumber, based in Chicago, initially came to Square through our website and was onboarded by our sales team. With 30 employees and 20 trucks, the company needed to accept mobile payments quickly and securely in the field. Before Square, employees had to write down customer credit card numbers on paper invoices and call the information into a dispatcher. In addition to enhanced security, the time saved with Square helps this business service more calls every week. The company has since grown to 40 employees, and it uses Employee Management to manage its mobile staff and Invoices to bill customers online. Square Capital has enabled The Scottish Plumber to purchase equipment that it previously rented, saving the business approximately $5,000 per month in rental fees.
4
Located in Livermore, California, 3 Steves Winery has grown its business on Square. Three years ago, the winery heard about us through word of mouth. Since then, the business has grown from three employees (all named Steve) to almost 50 (not all named Steve), and it now uses Invoices to bill customers online and Employee Management to track employee hours and sales. At the suggestion of our Account Management team, the company adopted Square Payroll, automating a manual process and saving hours every week. 3 Steves Winery remains with Square because of the easy-to-use payments and cohesion with other Square services.
We extended $189 million in Square Capital, up 123% year over year and 23% sequentially.
In the second quarter, we extended almost 34,000 business loans totaling $189 million, which is an increase of 123% year over year and 23% sequentially. Square Capital’s competitive advantages continue to attract additional institutional investors, with five new investors added to the program during the second quarter. We sell a majority of our loans to third-party investors for an upfront fee and a small ongoing servicing fee. In addition, we continue to have a strong continued pipeline of interested investors.
Our relationship with millions of sellers differentiates Square Capital and results in minimal customer acquisition costs for the product. We’re able to proactively offer loans to a seller because our real-time payments and POS data provides us with a complete view of the seller’s business. This eliminates the lengthy (and often unsuccessful) loan application process for the seller, while facilitating prudent risk management. A typical Square Capital loan is close to 10% of a seller’s GPV,
5
which we believe is enough of an investment for sellers to grow their business without being overburdened. Our loans have transparent pricing, with a weighted-average fee at origination of approximately 14% of the loan amount, and no other fees, interest, or penalties. Sellers repay their loan, within an average of nine months, by simply running their business. Repayment occurs automatically through a fixed percentage of every card transaction a seller takes. To date, we have maintained advance and loan loss rates of approximately 4%.
Financial Discussion
Gross Payment Volume (GPV)
In the second quarter of 2016, we processed $12.5 billion in GPV, an increase of 42% from the second quarter of 2015.New-seller growth made up the majority of our GPV increase, while positive dollar-based retention from existing sellers also had a meaningful impact. Our larger sellers continue to make up a growing portion of our GPV at 42% in the second quarter of 2016, representing a steady increase from 37% in the second quarter of 2015.
Revenue
Total net revenue, which includes revenue from Starbucks, was $439 million in the second quarter of 2016, up 41% compared to the second quarter of 2015. In the second quarter of 2016, Adjusted Revenue, which excludes revenue from Starbucks, increased 54% year over year to $171 million. This is comprised of $130 million in transaction profit, $30 million in software and data revenue, and $11 million in hardware revenue.
Transaction revenue was $365 million in the second quarter of 2016, an increase of 40% from the second quarter of 2015.
6
This represents 2.93% of GPV, compared to 2.96% in the prior year period. Transaction profit was $130 million in the second quarter of 2016, up 38% from the second quarter of 2015. Transaction profit as a percentage of GPV was 1.04%. However, when excluding the promotional processing credits for our new contactless and chip reader, transaction revenue and transaction profit as percentages of GPV were 2.94% and 1.05%, respectively.
Our software and data product revenue was $30 million in the second quarter of 2016, up 130% from the second quarter of 2015 and up 25% on a sequential basis. Square Capital, Caviar, and, to a lesser extent, Instant Deposit drove the majority of the increase.
Hardware revenue in the quarter was $11 million, up 209% from the second quarter of 2015, and down 31% on a sequential basis. The sequential decline was driven by elevated hardware revenue in the first quarter, which was a result of fulfilling the majority of the pre-order backlog for our new contactless and chip reader. Ongoing sales of our new reader remain strong as sellers realize how quickly they can begin accepting EMVchip-enabled cards. Our reader is also NFC enabled, allowing buyers to simply tap their phones—the fastest way to pay.
Lastly, Starbucks transaction revenue was $33 million and transaction profit from Starbucks was $4 million in the second quarter of 2016, benefiting from previously renegotiated processing rates. This compares to $34 million and transaction loss of $7 million in the second quarter of 2015. As a reminder, our payment processing agreement with Starbucks is set to expire in the third quarter of 2016; however, we are currently negotiating an amendment that may extend the agreement beyond the third quarter to allow Starbucks additional time to complete its transition, which has been taking longer than anticipated.
7
Operating Expenses/Earnings
Operating expenses were $176 million in the second quarter of 2016, up 49% year over year. Excluding share-based compensation expense, operating expenses were up 35% year over year.
Product development expenses were $69 million in the second quarter of 2016, up 50% from the second quarter of 2015, primarily reflecting growth in personnel costs (includingshare-based compensation expense). Sales and marketing expenses were $39 million in the second quarter of 2016, up 24% from the second quarter of 2015, reflecting growth in personnel costs as well as costs related to paid marketing. Our general and administrative expenses were $51 million this quarter, an increase of 60% from the second quarter of 2015. Theyear-over-year increase was primarily due to investment in functions such as customer support, legal, risk, finance, and Square Capital operations that are expected to drive operating leverage in future periods.
Transaction, loan, and advance losses were $17 million in the second quarter of 2016. This includes a $6 millionnon-recurring impact from an out-of-period adjustment as a result of a correction to the calculation of our reserve for transaction losses. Excluding this adjustment, transaction losses as a percentage of GPV for the second quarter of 2016 would have been less than our 0.1% cumulative historical average.
GAAP net loss was $27 million in the second quarter of 2016. On a GAAP basis, net loss per share, basic and diluted, was $0.08 for the second quarter of 2016, compared to $0.20 in the second quarter of 2015. We had 334 million weighted-average shares as of the second quarter of 2016.
Adjusted EBITDA was $13 million in the second quarter of
8
2016, compared to approximately $1 million in the second quarter of 2015, representing 7 points of margin improvement year over year. This Adjusted EBITDA improvement reflects our increased scale and operating leverage, positive dollar-based retention of our sellers, and our ability to drive new product adoption.
Balance Sheet/Cash Flow
We ended the second quarter of 2016 with $423 million in cash, cash equivalents, and investments in marketable securities, down from $444 million at the end of the first quarter of 2016. The decline in our cash balances was driven by changes in working capital, specifically the payment of the $48 million litigation settlement we accrued for in the first quarter of 2016, primarily offset by positive Adjusted EBITDA and favorable working capital trends related to our net customers payable balance.
Guidance
For 2016, our total net revenue is expected to be in the range of $1.63 billion to $1.67 billion. We have not previously guided to this GAAP measure. Total net revenue growth will be impacted by the continued decline in Starbucks transaction revenue as it transitions to a new payments processor.
In light of our strong execution in the second quarter, we are raising our full year 2016 guidance for both Adjusted Revenue and Adjusted EBITDA. We expect Adjusted Revenue to be in the range of $655 million to $670 million, up 6% at the midpoint from our previously guided range of $615 million to $635 million. We expect Adjusted EBITDA to be in the range of $18 million to $24 million, up from our previously guided range of $8 million to $14 million. At the midpoint, this is a 12 point year-over-year improvement in 2016 Adjusted EBITDA margin.
9
For the third quarter, we expect our total net revenue to be in the range of $410 million to $420 million, Adjusted Revenue to be in the range of $167 million to $171 million, and Adjusted EBITDA to be in the range of $5 million to $6 million. At the midpoint, this implies a 17 point year-over-year improvement in third quarter Adjusted EBITDA margin.
| | | | | | | | |
| | | Q3 2016 | | | FY 2016 | |
| | |
Total net revenue | | | $410M to $420M | | | | $1.63B to $1.67B | |
| | |
Adjusted Revenue | | | $167M to $171M | | | | $655M to $670M | |
| | |
Adjusted EBITDA | | | $5M to $6M | | | | $18M to $24M | |
As a reminder, our business is subject to certain seasonal trends. Historically, our transaction revenue is weakest in our first quarter, resulting in significantly stronger sequential growth in the second quarter, followed by moderating sequential growth in the third quarter.
Additionally, operating expenses in the third and fourth quarters of 2016 may be impacted by relatively elevated employer taxes associated with the potential exercise of vested and exercisable employee stock options. While our third quarter guidance reflects the impact of employer taxes related to these options, the magnitude and timing of these expenses will depend on the amounts exercised and the stock price at the time of exercise, each of which can cause actual results to vary.
We have not reconciled Adjusted EBITDA guidance to GAAP net loss because we do not provide guidance on GAAP net loss or the reconciling items that are between Adjusted EBITDA and GAAP net loss, such as share-based compensation expense, as a result of the uncertainty regarding, and the potential variability of, these items. Accordingly, a reconciliation of the non-GAAP financial measure guidance to the corresponding GAAP measure is not available without unreasonable effort, though we have provided a reconciliation of GAAP to non-GAAP financial measures in the financial statement tables at the end of this letter. It is important to note that the actual amount of such reconciling items will have a significant impact if they were included in our Adjusted EBITDA and Adjusted EBITDA margin.
10
Earnings Webcast
Square (NYSE:SQ) will host a conference call and earnings webcast at 2:00 p.m. Pacific time/5:00 p.m. Eastern time today, August 3, 2016, to discuss these financial results. The domestic dial-in for the call is (877) 313-8511. The Conference ID is 42862983. To listen to a live audio webcast, please visit Square’s Investor Relations website at square.com/investors. A replay will be available on the same website following the call.
We will release financial results for the third quarter on November 1, 2016, after the market closes, and will also host a conference call and earnings webcast at 2:00 p.m. Pacific time/5:00 p.m. Eastern time on the same day to discuss these financial results.
| | |
 | |  |
| Jack Dorsey | | Sarah Friar |
| CEO | | CFO |
MEDIA CONTACT
press@squareup.com
INVESTOR RELATIONS CONTACT
ir@squareup.com
11
“We’ve increased customer retention with Square because it adds a level of credibility and professionalism to our services that we didn’t have before.
“Square has also made our dispatchers’ lives easier, a priceless benefit for a very stressful and hectic position.”
Simon Raczkowiak
The Scottish Plumber
Chicago, Illinois
SAFE HARBOR STATEMENT
This letter contains forward-looking statements within the meaning of the Safe Harbor provisions of the Private Securities Litigation Reform Act of 1995. All statements other than statements of historical fact could be deemed forward-looking, including, but not limited to, statements regarding the future performance of Square, Inc. and its consolidated subsidiaries (the Company); the Company’s expected financial results for future periods, including with respect to total net revenue, Adjusted Revenue, and Adjusted EBITDA; future growth in the Company’s businesses, including with respect to Square Capital, its anticipated loan volume, and investor capacity; the Company’s ability to successfully manage its acquisitions and dispositions of assets; the Company’s expectations regarding scale and profitability; and management’s statements related to business strategy, plans, and objectives for future operations. In some cases, forward-looking statements can be identified by terms such as “may,” “will,” “appears,” “should,” “expects,” “plans,” “anticipates,” “could,” “intends,” “target,” “projects,” “contemplates,” “believes,” “estimates,” “predicts,” “potential,” or “continue,” or the negative of these words or other similar terms or expressions that concern our expectations, strategy, plans, or intentions. Such statements are subject to a number of risks, uncertainties, and assumptions, and investors are cautioned not to place undue reliance on these statements. Actual results could differ materially from those expressed or implied, and reported results should not be considered as an indication of future performance.
Risks that contribute to the uncertain nature of the forward-looking statements include, among others, the Company’s ability to deal with the substantial and increasingly intense competition in its industry; changes to the rules and practices of payment card networks and acquiring processors; the effect of evolving regulations and oversight related to the Company’s provision of payments services and other financial services; the effect of management changes and business initiatives; and changes in political, business, and economic conditions; as well as other risks listed or described from time to time in the Company’s filings with the Securities and Exchange Commission (the SEC), including our Annual Report on Form 10-K for the fiscal year ended December 31, 2015, and Quarterly Report on Form 10-Q for the fiscal quarter ended March 31, 2016, each of which are on file with the SEC and available on the investor relations page of the Company’s website. Except as required by law, the Company assumes no obligation to update any of the statements in this letter.
KEY OPERATING METRICS AND NON-GAAP FINANCIAL MEASURES
To supplement our financial information presented in accordance with generally accepted accounting principles in the United States (GAAP), we consider certain operating and financial measures that are not prepared in accordance with GAAP, including Gross Payment Volume, Adjusted Revenue, Adjusted EBITDA, and Adjusted EBITDA margin. Each of these metrics and measures excludes the effect of our payment processing agreement with Starbucks. We amended our payment processing agreement with Starbucks to eliminate the exclusivity provision in order to permit Starbucks to begin transitioning to another payment processor starting October 1, 2015. Under the amendment, Starbucks also agreed to pay increased processing rates to us for as long as it continues to process transactions with us. While Starbucks announced that it would transition to another payment processor prior to the expiration of the payment processing agreement in the third quarter of 2016, we are continuing to process a portion of Starbucks payments, generating transaction revenue at the newly increased rates. We are now negotiating an amendment that may extend the agreement beyond the third quarter of 2016 to allow Starbucks additional time to complete their transition, which has been taking longer than anticipated. We do not intend to renew this agreement with Starbucks upon its expiration. As a result, we believe it is useful to exclude Starbucks activity to clearly show the impact Starbucks has had on our financial results historically, to provide insight into the impact of the expected termination of the Starbucks agreement on our revenues going forward, to facilitate period-to-period comparisons of our business, and to facilitate comparisons of our performance to that of other payment processors. Our agreements with other sellers, including Starbucks following the amendment described above, generally provide both those sellers and us the unilateral right to terminate such agreements at any time, without fine or penalty. Furthermore, we generally do not enter into long-term contractual agreements with sellers.
We define Gross Payment Volume (GPV) as the total dollar amount of all card payments processed by sellers using Square, net of refunds. GPV excludes card payments processed for Starbucks. Additionally, GPV excludes activity related to our Square Cash peer-to-peer payments service. Adjusted Revenue is a non-GAAP financial measure that we define as our total net revenue less transaction costs, adjusted to eliminate the effect of activity under our payment processing agreement with Starbucks. As described above, Starbucks has announced that it will transition to another payment processor and will cease using our payment processing services altogether, and we believe that providing Adjusted Revenue metrics that exclude the impact of our agreement with Starbucks is useful to investors. We believe it is useful to exclude transaction costs from Adjusted Revenue as this is a primary metric used by management to measure our business performance, and it affords greater comparability to other payment processing companies. Adjusted Revenue has limitations as a financial measure, should be considered as supplemental in nature, and is not meant as a substitute for the related financial information prepared in accordance with GAAP.
Adjusted EBITDA is a non-GAAP financial measure that represents our net loss, adjusted to eliminate the effect of Starbucks transaction revenue, Starbucks transaction costs, and the litigation settlement with Robert E. Morley, before interest income and expense, provision or benefit for income taxes, depreciation, amortization, share-based compensation expense, other income and expense, the gain or loss on the sale of property and equipment, and impairment of intangible assets. We have included Adjusted EBITDA because it is a key measure used by our management to evaluate our operating performance, generate future operating plans, and make strategic decisions, including those relating to operating expenses and the allocation of internal resources. Accordingly, we believe that Adjusted EBITDA provides useful information to investors and others in understanding and evaluating our operating results in the same manner as our management and board of directors. In addition, it provides a useful measure for period-to-period comparisons of our business, as it removes the effect of certain non-cash items and certain variable charges. Adjusted EBITDA has limitations as a financial measure, should be considered as supplemental in nature, and is not meant as a substitute for the related financial information prepared in accordance with GAAP.
These non-GAAP financial measures should not be considered in isolation from, or as a substitute for, financial information prepared in accordance with GAAP. These non-GAAP financial measures are not based on any standardized methodology prescribed by GAAP and are not necessarily comparable to similarly titled measures presented by other companies.
13
| | |
| Consolidated Statements of Operations | | UNAUDITED |
| | In thousands, except per share data |
| | | | | | | | | | | | | | | | |
| | | THREE MONTHS ENDED | | | SIX MONTHS ENDED | |
| | | Jun 30, 2016 | | | Jun 30, 2015 | | | Jun 30, 2016 | | | Jun 30, 2015 | |
Revenue: | | | | | | | | | | | | | | | | |
Transaction revenue | | $ | 364,864 | | | $ | 259,864 | | | $ | 665,317 | | | $ | 470,974 | |
Starbucks transaction revenue | | | 32,867 | | | | 33,630 | | | | 71,705 | | | | 62,867 | |
Software and data product revenue | | | 29,717 | | | | 12,928 | | | | 53,513 | | | | 20,934 | |
Hardware revenue | | | 11,085 | | | | 3,591 | | | | 27,267 | | | | 5,795 | |
| | | | | | | | | | | | | |
Total net revenue | | | 438,533 | | | | 310,013 | | | | 817,802 | | | | 560,570 | |
| | | | | | | | | | | | | |
Cost of revenue: | | | | | | | | | | | | | | | | |
Transaction costs | | | 234,857 | | | | 165,823 | | | | 429,133 | | | | 297,930 | |
Starbucks transaction costs | | | 28,672 | | | | 40,921 | | | | 65,282 | | | | 77,132 | |
Software and data product costs | | | 10,144 | | | | 5,072 | | | | 19,177 | | | | 8,227 | |
Hardware costs | | | 14,015 | | | | 6,713 | | | | 40,755 | | | | 10,910 | |
Amortization of acquired technology | | | 1,886 | | | | 1,142 | | | | 4,256 | | | | 1,744 | |
| | | | | | | | | | | | | |
Total cost of revenue | | | 289,574 | | | | 219,671 | | | | 558,603 | | | | 395,943 | |
| | | | | | | | | | | | | |
Gross profit | | | 148,959 | | | | 90,342 | | | | 259,199 | | | | 164,627 | |
| | | | | | | | | | | | | |
Operating expenses: | | | | | | | | | | | | | | | | |
Product development | | | 68,638 | | | | 45,887 | | | | 133,230 | | | | 85,432 | |
Sales and marketing | | | 39,220 | | | | 31,730 | | | | 77,716 | | | | 67,911 | |
General and administrative | | | 50,784 | | | | 31,804 | | | | 146,891 | | | | 59,923 | |
Transaction, loan, and advance losses | | | 17,455 | | | | 8,513 | | | | 25,316 | | | | 24,835 | |
Amortization of acquired customer assets | | | 222 | | | | 482 | | | | 539 | | | | 950 | |
| | | | | | | | | | | | | |
Total operating expenses | | | 176,319 | | | | 118,416 | | | | 383,692 | | | | 239,051 | |
| | | | | | | | | | | | | |
Operating loss | | | (27,360) | | | | (28,074) | | | | (124,493) | | | | (74,424) | |
| | | | | | | | | | | | | |
Interest (income) and expense, net | | | (129) | | | | 444 | | | | (60) | | | | 858 | |
Other (income) and expense, net | | | (198) | | | | (50) | | | | (984) | | | | 746 | |
| | | | | | | | | | | | | |
Loss before income tax | | | (27,033) | | | | (28,468) | | | | (123,449) | | | | (76,028) | |
| | | | | | | | | | | | | |
Provision for income taxes | | | 312 | | | | 1,152 | | | | 651 | | | | 1,570 | |
| | | | | | | | | | | | | |
Net loss | | $ | (27,345) | | | $ | (29,620) | | | $ | (124,100) | | | $ | (77,598) | |
| | | | | | | | | | | | | |
Net loss per share: | | | | | | | | | | | | | | | | |
Basic | | $ | (0.08) | | | $ | (0.20) | | | $ | (0.37) | | | $ | (0.53) | |
| | | | | | | | | | | | | |
Diluted | | $ | (0.08) | | | $ | (0.20) | | | $ | (0.37) | | | $ | (0.53) | |
| | | | | | | | | | | | | |
Weighted-average shares used to compute net loss per share: | | | | | | | | | | | | | | | | |
Basic | | | 334,488 | | | | 149,253 | | | | 332,906 | | | | 147,288 | |
| | | | | | | | | | | | | |
Diluted | | | 334,488 | | | | 149,253 | | | | 332,906 | | | | 147,288 | |
| | | | | | | | | | | | | |
14
| | |
| Consolidated Balance Sheets | | UNAUDITED |
| | In thousands, except share and per share data |
| | | | | | | | | | |
| Assets | | | | Jun 30, 2016 | | | Dec 31, 2015 | |
| Current assets: | | | | | | | | | | |
Cash and cash equivalents | | | | $ | 342,436 | | | $ | 470,775 | |
Short-term investments | | | | | 60,991 | | | | — | |
Restricted cash | | | | | 13,545 | | | | 13,537 | |
Settlements receivable | | | | | 204,541 | | | | 142,727 | |
Loans held for sale | | | | | 29,774 | | | | 604 | |
Merchant cash advance receivable, net | | | | | 21,268 | | | | 36,473 | |
Other current assets | | | | | 48,473 | | | | 41,447 | |
| | | | | |
| Total current assets | | | | | 721,028 | | | | 705,563 | |
| | | | | |
| Property and equipment, net | | | | | 86,325 | | | | 87,222 | |
| Goodwill | | | | | 56,699 | | | | 56,699 | |
| Acquired intangible assets, net | | | | | 22,329 | | | | 26,776 | |
| Long-term investments | | | | | 19,602 | | | | — | |
| Restricted cash | | | | | 23,131 | | | | 14,686 | |
| Other assets | | | | | 4,178 | | | | 3,826 | |
| | | | | |
| Total assets | | | | $ | 933,292 | | | | 894,772 | |
| | | | | |
| | | |
| Liabilities and Stockholders’ Equity | | | | | | | | | | |
| Current liabilities: | | | | | | | | | | |
Accounts payable | | | | $ | 16,211 | | | $ | 18,869 | |
Customers payable | | | | | 310,242 | | | | 224,811 | |
Accrued transaction losses | | | | | 16,093 | | | | 17,176 | |
Accrued expenses | | | | | 26,133 | | | | 44,401 | |
Other current liabilities | | | | | 42,790 | | | | 28,945 | |
| | | | | |
| Total current liabilities | | | | | 411,469 | | | | 334,202 | |
| | | | | |
| Other liabilities | | | | | 50,364 | | | | 52,522 | |
| | | | | |
| Total liabilities | | | | | 461,833 | | | | 386,724 | |
| | | | | |
| Stockholders’ equity: | | | | | | | | | | |
Preferred stock, $0.0000001 par value: 100,000,000 shares authorized at June 30, 2016, and December 31, 2015. None issued and outstanding at June 30, 2016, and December 31, 2015. | | | | | — | | | | — | |
Common stock, $0.0000001 par value: 1,000,000,000 Class A shares authorized at both June 30, 2016, and December 31, 2015; 118,365,688 and 31,717,133 issued and outstanding at June 30, 2016, and December 31, 2015, respectively. 500,000,000 Class B shares authorized at both June 30, 2016, and December 31, 2015; 222,597,682 and 303,232,312 issued and outstanding at June 30, 2016, and December 31, 2015, respectively. | | | | | — | | | | — | |
Additional paid-in capital | | | | | 1,203,136 | | | | 1,116,882 | |
Accumulated deficit | | | | | (731,749) | | | | (607,649) | |
Accumulated other comprehensive income (loss) | | | | | 72 | | | | (1,185) | |
| | | | | |
| Total stockholders’ equity | | | | | 471,459 | | | | 508,048 | |
| | | | | |
| Total liabilities and stockholders’ equity | | | | $ | 933,292 | | | $ | 894,772 | |
| | | | | |
15
| | |
| Consolidated Statements of Cash Flows | | UNAUDITED |
| | In thousands |
| | | | | | | | | | |
| | | | | SIX MONTHS ENDED | |
| Cash Flows from Operating Activities | | | | Jun 30, 2016 | | | Jun 30, 2015 | |
| Net loss | | | | $ | (124,100) | | | $ | (77,598) | |
| Adjustments to reconcile net loss to net cash used in operating activities: | | | | | | | | | | |
Depreciation and amortization | | | | | 18,136 | | | | 11,956 | |
Share-based compensation | | | | | 68,120 | | | | 28,693 | |
Provision for transaction losses | | | | | 23,392 | | | | 21,566 | |
Provision for (reduction in) uncollectible merchant cash advances | | | | | (93) | | | | 3,148 | |
Deferred provision for income taxes | | | | | 63 | | | | (207) | |
Loss on disposal of property and equipment | | | | | 131 | | | | 240 | |
Changes in operating assets and liabilities: | | | | | | | | | | |
Settlements receivable | | | | | (62,169) | | | | (56,326) | |
Purchase of loans held for sale | | | | | (212,727) | | | | — | |
Proceeds from sales and principal payments of loans held for sale | | | | | 183,748 | | | | — | |
Merchant cash advance receivable | | | | | 15,298 | | | | (6,145) | |
Other current assets | | | | | (7,313) | | | | (4,735) | |
Other assets | | | | | (377) | | | | 1,177 | |
Accounts payable | | | | | 2,538 | | | | 3,408 | |
Customers payable | | | | | 84,826 | | | | 67,286 | |
Charge-offs and recoveries to accrued transaction losses | | | | | (24,475) | | | | (14,174) | |
Accrued expenses | | | | | (13,784) | | | | 3,834 | |
Other current liabilities | | | | | 13,446 | | | | (10) | |
Other noncurrent liabilities | | | | | (431) | | | | 7,388 | |
| | | | | |
Net cash used in operating activities | | | | | (35,771) | | | | (10,499) | |
| | | | | |
| | | |
| Cash Flows from Investing Activities | | | | | | | | | | |
Purchase of marketable securities | | | | | (102,245) | | | | — | |
Proceeds from maturities of marketable securities | | | | | 16,768 | | | | — | |
Proceeds from sale of marketable securities | | | | | 4,964 | | | | — | |
Purchase of property and equipment | | | | | (15,840) | | | | (20,760) | |
Payment for acquisition of intangible assets | | | | | (400) | | | | (110) | |
Change in restricted cash | | | | | (8,453) | | | | — | |
Business acquisitions (net of cash acquired) | | | | | — | | | | (3,750) | |
| | | | | |
Net cash used in investing activities | | | | | (105,206) | | | | (24,620) | |
| | | | | |
| | | |
| Cash Flows from Financing Activities | | | | | | | | | | |
Payments of offering costs related to initial public offering | | | | | (5,530) | | | | — | |
Proceeds from issuances of common stock from the exercise of options and employee stock purchase plan | | | | | 15,496 | | | | 8,633 | |
| | | | | |
Net cash provided by financing activities | | | | | 9,966 | | | | 8,633 | |
| | | | | |
Effect of foreign exchange rate changes on cash and cash equivalents | | | | | 2,672 | | | | (874) | |
| | | | | |
Net decrease in cash and cash equivalents | | | | | (128,339) | | | | (27,360) | |
| Cash and cash equivalents, beginning of period | | | | | 470,775 | | | | 225,300 | |
| | | | | |
| Cash and cash equivalents, end of period | | | | $ | 342,436 | | | $ | 197,940 | |
| | | | | |
16
| | |
| Key Operating Metrics and Non-GAAP Financial Measures | | UNAUDITED |
| | In thousands, except GPV |
| | | | | | | | | | | | | | | | |
| | | THREE MONTHS ENDED | | | SIX MONTHS ENDED | |
| | | Jun 30, 2016 | | | Jun 30, 2015 | | | Jun 30, 2016 | | | Jun 30, 2015 | |
| | | | | | | | | | | | | | | | |
Gross Payment Volume (GPV) (in millions) | | $ | 12,451 | | | $ | 8,793 | | | $ | 22,741 | | | $ | 15,910 | |
Adjusted Revenue | | $ | 170,809 | | | $ | 110,560 | | | $ | 316,964 | | | $ | 199,773 | |
Adjusted EBITDA | | $ | 12,554 | | | $ | 859 | | | $ | 3,471 | | | $ | (19,270) | |
Adjusted Revenue Reconciliation | | | | | | | | | | | | | | | UNAUDITED | |
| | | | | | | | | | | | | | | In thousands | |
| | | THREE MONTHS ENDED | | | SIX MONTHS ENDED | |
| | | Jun 30, 2016 | | | Jun 30, 2015 | | | Jun 30, 2016 | | | Jun 30, 2015 | |
| | | | | | | | | | | | | | | | |
Total net revenue | | $ | 438,533 | | | $ | 310,013 | | | $ | 817,802 | | | $ | 560,570 | |
Less: Starbucks transaction revenue | | | 32,867 | | | | 33,630 | | | | 71,705 | | | | 62,867 | |
Less: Transaction costs | | | 234,857 | | | | 165,823 | | | | 429,133 | | | | 297,930 | |
| | | | | | | | | | | | | |
Adjusted Revenue | | $ | 170,809 | | | $ | 110,560 | | | $ | 316,964 | | | $ | 199,773 | |
| | | | | | | | | | | | | |
Adjusted EBITDA Reconciliation | | | | | | | | | | | | | | | UNAUDITED | |
| | | | | | | | | | | | | | | In thousands | |
| | | THREE MONTHS ENDED | | | SIX MONTHS ENDED | |
| | | Jun 30, 2016 | | | Jun 30, 2015 | | | Jun 30, 2016 | | | Jun 30, 2015 | |
| | | | | | | | | | | | | | | | |
Net loss | | $ | (27,345) | | | $ | (29,620) | | | $ | (124,100) | | | $ | (77,598) | |
Starbucks transaction revenue | | | (32,867) | | | | (33,630) | | | | (71,705) | | | | (62,867) | |
Starbucks transaction costs | | | 28,672 | | | | 40,921 | | | | 65,282 | | | | 77,132 | |
Share-based compensation expense | | | 36,922 | | | | 15,232 | | | | 68,120 | | | | 28,693 | |
Depreciation and amortization | | | 9,018 | | | | 6,410 | | | | 18,136 | | | | 11,956 | |
Litigation settlement (benefit) expense | | | (2,000) | | | | — | | | | 48,000 | | | | — | |
Interest (income) and expense | | | (129) | | | | 444 | | | | (60) | | | | 858 | |
Other (income) and expense | | | (198) | | | | (50) | | | | (984) | | | | 746 | |
Provision for income taxes | | | 312 | | | | 1,152 | | | | 651 | | | | 1,570 | |
Loss (gain) on sale of property and equipment | | | 169 | | | | — | | | | 131 | | | | 240 | |
| | | | | | | | | | | | | |
Adjusted EBITDA | | $ | 12,554 | | | $ | 859 | | | $ | 3,471 | | | $ | (19,270) | |
| | | | | | | | | | | | | |
17
| | | | | | | | | | | | | | | | |
| Share-Based Compensation by Function | | | | | | | | | | | | | | | UNAUDITED | |
| | | | | | | | | | | | | | | In thousands | |
| | | THREE MONTHS ENDED | | | SIX MONTHS ENDED | |
| | | Jun 30, 2016 | | | Jun 30, 2015 | | | Jun 30, 2016 | | | Jun 30, 2015 | |
| | | | | | | | | | | | | | | | |
| Product development | | $ | 24,168 | | | $ | 10,391 | | | $ | 46,115 | | | $ | 19,349 | |
| Sales and marketing | | | 3,363 | | | | 1,345 | | | | 6,266 | | | | 2,774 | |
| General and administrative | | | 9,391 | | | | 3,496 | | | | 15,739 | | | | 6,570 | |
| | | | | | | | | | | | | |
Total share-based compensation | | $ | 36,922 | | | $ | 15,232 | | | $ | 68,120 | | | $ | 28,693 | |
| | | | | | | | | | | | | |
Depreciation and Amortization by Function | | | | | | | | | | | | | | | UNAUDITED | |
| | | | | | | | | | | | | | | In thousands | |
| | | THREE MONTHS ENDED | | | SIX MONTHS ENDED | |
| | | Jun 30, 2016 | | | Jun 30, 2015 | | | Jun 30, 2016 | | | Jun 30, 2015 | |
| | | | | | | | | | | | | | | | |
| Cost of revenue | | $ | 2,445 | | | $ | 1,142 | | | $ | 5,374 | | | $ | 1,745 | |
| Product development | | | 3,128 | | | | 3,055 | | | | 6,269 | | | | 5,936 | |
| Sales and marketing | | | 6 | | | | — | | | | 8 | | | | 4 | |
| General and administrative | | | 3,439 | | | | 2,213 | | | | 6,485 | | | | 4,271 | |
| | | | | | | | | | | | | |
Total depreciation and amortization | | $ | 9,018 | | | $ | 6,410 | | | $ | 18,136 | | | $ | 11,956 | |
| | | | | | | | | | | | | |
18