
REYNOLDS TOWING SERVICE
Urbana, IL
Q4 2016 Shareholder Letter
SQUARE.COM/INVESTORS
Highlights
| • | | In 2016, we achieved growth at scale with full-year GPV of $50 billion, up 39% year over year, while hitting a significant profitability milestone. |
| • | | We released Square for Retail, our first industry-specificpoint-of-sale solution. |
| • | | Our platform enables fast development: In just two months, we built Virtual Terminal for browser-based payments, and it generated GPV of more than $40 million in January 2017. |
| • | | We’re creating meaningful vectors of growth, with products launched since 2014 representing 14% of total net revenue and 25% of Adjusted Revenue in the fourth quarter of 2016. |
Fourth Quarter 2016 Key Results
| | | | |
| GROSS PAYMENT VOLUME (GPV) | | TOTAL NET REVENUE | | NET INCOME (LOSS) |
| | |
| | 
| | 
|
| | |
| GPV MIX BY SELLER SIZE | | ADJUSTED REVENUE | | ADJUSTED EBITDA |
| | |
| | 
| | 
|
A reconciliation ofnon-GAAP metrics used in this letter to their nearest GAAP equivalents is provided at the end of this letter.
Adjusted EBITDA margin is calculated as Adjusted EBITDA divided by Adjusted Revenue.
In the fourth quarter of 2015, net loss is $48 million, while net loss attributable to common stockholders is $80 million. Net loss of $48 million excludes the impact of the deemed stock dividend of $32.2 million.
2
| | |
| To Our Shareholders: | | FEBRUARY 22, 2017 |
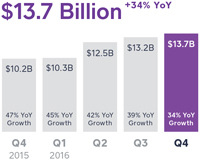
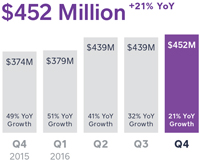
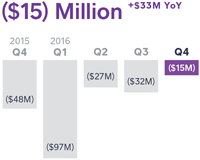
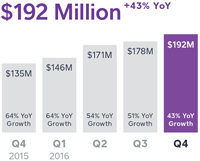
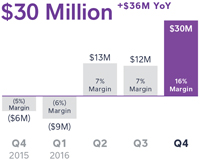
We’re very proud of our first year as a public company. We delivered value for our customers in a way that meaningfully grew the business at scale, increasing both revenue and margins. Gross Payment Volume (GPV) for the fourth quarter was $13.7 billion, up 34% year over year. Total net revenue was $452 million, up 21% year over year, and Adjusted Revenue was $192 million, up 43% year over year. Net loss was $15 million, an improvement of $33 million on a year-over-year basis. We achieved fourth-quarter Adjusted EBITDA of $30 million, an improvement of $36 million on a year-over-year basis. Fourth-quarter Adjusted EBITDA margin of 16% is an improvement of 20 points year over year. Sustained GPV growth is a result of our ability to efficiently add new sellers to Square and provide them with the tools they need to grow. We saw strong growth across our products, with revenue growth driven by both transaction-based and subscription and services-based monetization efforts. We maintained a payback period of 4 to 5 quarters for our seller acquisition costs and a positive dollar-based retention rate, which together underscore our ability to grow this revenue profitably. Additionally, we increased operating efficiency and continued to make improvements in transaction losses. We are carrying this momentum into 2017 by thoughtfully balancing margin expansion and our investments in growth. We released Square for Retail, our first industry-specificpoint-of-sale solution. Sellers often require sophisticated tools that meet the specialized needs of their respective industries. Earlier this month, we launched Square for Retail: anend-to-end retailpoint-of-sale solution that fully integrates with our managed payments offering and hardware. It is optimized for retailers, with a search-based user interface and fast bar code scanning, while advanced inventory management supports tens of thousands of items and manages cost of goods sold, purchase orders, and other capabilities that a retail business needs. Sellers can better understand their buyers’ habits with advanced clienteling capabilities that build customer profiles and | | Payback periodmeasures the effectiveness of sales and marketing spend. Payback period equals the number of quarters for a cohort’s cumulative transaction-based profit to surpass our sales and marketing expense in the quarter in which we acquired the cohort. We do not include profit outside of transaction-based profit in this calculation. This excludes costs associated with our Square Cash peer to peer transfer service. GPV BY ANNUAL COHORT Attractive cohort economics with positive dollar-based retention. 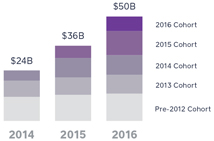
ON THE COVER: Square has helpedReynolds Towing Servicereduce its back-office staff by enabling drivers to take secure payments in the field, and our payment dispute management saves the business valuable time. |
3
| | |
provide purchasing history directly from the point of sale. Just as with Square Point of Sale (previously named Square Register), sellers can download the Square Retail app and get started in minutes. We charge a monthly subscription per device, and it has all of the advantages that sellers have come to expect from Square: speed, ease of use, dependability, and cohesion with the entire Square ecosystem. Pure Liquid Wine & Spirits, a retailer located in the World Trade Center in New York City, uses Square for Retail along with Square Stand and our contactless and chip reader. The setup process was “plug and play.” The store has found Square to be “easy to use, powerful, and intuitive,” and the cost of goods sold reporting has been particularly helpful for its workflow. With the advanced capabilities of Square for Retail, we can now better serve a sizeable market consisting of over 450,000 small tomedium-sized retailers in the U.S. that represent over $700 billion in annual gross receipts.1 In addition to building industry-specific tools, we are also expanding with new third-party integrations in our App Marketplace that help us target larger sellers with specialized needs. We continue to add partners to our platform, recently integrating withe-commerce platforms Magento and Wix; restaurant inventory management platform SimpleOrder; and retail point of sale SuitePOS. Our App Marketplace enables sellers to integrate Square with other business solutions, which expands functionality for our existing sellers and brings new sellers to Square. For example, Sean’s Bar & Kitchen signed up with Square as a result of our partnership with restaurant point of sale TouchBistro. Sean’s, a full-service bar and restaurant in midtown Manhattan, was using payment hardware that could only accept magnetic-stripe cards. Following the EMV liability shift, the business became more vulnerable to chargebacks and therefore needed new hardware to accept chip cards. With our contactless and chip reader, Sean’s can now securely accept payments from 12 points of sale across itstwo-floor,150-seat restaurant. The business was able to keep TouchBistro as the point of sale while integrating easily with Square. Our platform enables fast development: In just two months, we built Virtual Terminal for browser-based payments, and it generated GPV of more than $40 million in January 2017. | | Square Point of Sale: designed to get every type of business up and running quickly; integrated with the full Square ecosystem. 
Square Retail: optimized for retailers with a search-based user interface for larger inventories; integrated with the full Square ecosystem. 
Square Register was recently renamed Square Point of Sale to better describe what the product does and improve customer discoverability. 
(1) “Small tomedium-sized” refers to retailers with annualized gross receipts of $250,000–$50 million. Based on 2012 U.S. Census data. |
4
| | |
In October 2016, we launched Virtual Terminal, which allows sellers to key in payments from a web browser and is ideal for sellers that typically use a computer instead of a mobile device. The product has attracted new sellers and captured additional GPV from existing sellers. Shane How, founder and CEO of Innovo Media Group, abusiness-to-business marketing firm in Orange County, California, joined Square specifically for Virtual Terminal. He runs his business on a computer and previously used another merchant acquirer but became frustrated with hidden fees and varying rates for different credit cards. Shane switched to Square for Virtual Terminal and the benefits of our full ecosystem, includingnext-day deposits, transparent pricing, QuickBooks integration, reporting and analytics, and Square Invoices. We used the technology behind our recently launchede-commerce API to build and launch Virtual Terminal in the U.S. in just two months. We then quickly followed and launched this product in Australia in February 2017. This development speed demonstrates how quickly we can move by leveraging the breadth and agility of our platform. Virtual Terminal generated more than $40 million in GPV in January 2017. We are pleased to see such a remarkable start for abrand-new product. Virtual Terminal is just one example of our ability to offer sellers full service payments and accept any way their buyers want to pay. With our managed payments offering, sellers pay a transparent transaction fee and receive comprehensive technology and features, including reporting and analytics,next-day settlements, digital receipts, payment dispute management and chargeback protection, and Payments Card Industry (PCI) compliance. Products and services that cover the entire payment life cycle differentiate us from our competition and speak to the powerful benefits of our integrated hardware, software, and payment processing. We’re creating meaningful vectors of growth, with products launched since 2014 now representing 14% of total net revenue and 25% of Adjusted Revenue in the fourth quarter of 2016. Products launched since 2014, such as Square Capital, Caviar, Invoices, Instant Deposit, APIs, and other services collectively represented over 25% of Adjusted Revenue in the fourth quarter of 2016. | | PRODUCTS LAUNCHED SINCE 2014 As a percentage of Adjusted Revenue 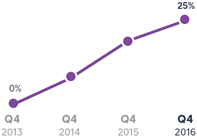
“Products launched since 2014” excludes hardware revenue. |
5
| | |
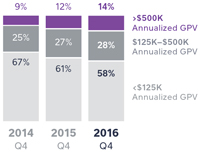
For Square Capital, we facilitated over 40,000 business loans totaling $248 million in the fourth quarter of 2016, an increase of 68% year over year, while maintaining loan default rates at approximately 4%. Additionally, we processed $624 million in Invoices GPV during the fourth quarter of 2016, growing 68% year over year and representing nearly $2.5 billion on an annualized basis. We’re able to upsell and cross-sell to our base of millions of sellers with minimal incremental cost, largely due to our respected brand and ability to tailor offerings directly to sellers, especially in the context of their usage (e.g., providing an Instant Deposit prompt when sellers receive a payment via Square Invoices, or during a long weekend when settlement would otherwise be delayed by a holiday). Financial Discussion Gross Payment Volume (GPV) In the fourth quarter of 2016, we processed $13.7 billion in GPV, an increase of 34% from the fourth quarter of 2015. For the full year of 2016, GPV totaled $50 billion, a 39% increase from the full year of 2015. In the fourth quarter, we continued to see strength from larger sellers, whose GPV grew 47% on a year-over-year basis and accounted for 42% of total GPV, up from 39% in the fourth quarter of 2015. Revenue Total net revenue was $452 million in the fourth quarter of 2016, up 21% compared to the fourth quarter of 2015, and $1.7 billion for the full year of 2016, up 35% compared to the full year of 2015. Of note, total net revenue growth was impacted by Starbucks’ transition off of our infrastructure, which was completed in the fourth quarter of 2016. We do not expect to generate Starbucks transaction-based revenue going forward. Adjusted Revenue was $192 million in the fourth quarter of 2016, an increase of 43% year over year. For the full year of 2016, Adjusted Revenue was $687 million, an increase of 52% from the full year of 2015. | | Larger sellers are those that generate more than $125,000 in annualized GPV. GROSS PAYMENT VOLUME 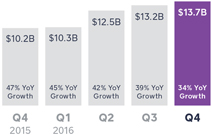
Adjusted Revenue is defined as total net revenue less transaction-based revenue from Starbucks and transaction-based costs. |
6
| | |
| |
To better describe how we monetize our product offerings, we’ve renamed transaction revenue and software and data product revenue to transaction-based revenue and subscription and services-based revenue, respectively. The respective revenues included in these line items remain the same as for prior periods. Transaction-based revenue was $402 million in the fourth quarter of 2016, up 35% from the fourth quarter of 2015. Transaction-based revenue as a percentage of GPV was 2.94% in the fourth quarter of 2016, consistent with the prior year period. Transaction-based profit as a percentage of GPV was 1.04% in the fourth quarter of 2016, flat compared to the prior year period. For the full year of 2016, transaction-based revenue was $1.5 billion, up 39% compared to the full year of 2015. Subscription and services-based revenue was $41 million in the fourth quarter of 2016, up 81% from the fourth quarter of 2015, driven primarily by growth in Square Capital, Caviar, and Instant Deposit revenue. For the full year of 2016, subscription and services-based revenue was $129 million, an increase of 123% compared to the full year 2015. Hardware revenue in the fourth quarter of 2016 was $9 million, up 39% from the fourth quarter of 2015. For the full year of 2016, hardware revenue was $44 million, up 171% compared to the full year of 2015. Hardware revenue benefited primarily from sales of our contactless and chip reader, which began shipping in December 2015, as well as increased demand for Square Stand. Operating Expenses/Earnings Operating expenses were $181 million in the fourth quarter of 2016, up 15% year over year and down 1% on a sequential basis.Non-GAAP operating expenses were up 17% year over year, accounting for 72% of Adjusted Revenue in the fourth quarter of 2016, compared to 88% in the fourth quarter of 2015. • Product development expenses were $65 million on a GAAP basis and $40 million on anon-GAAP basis in the fourth quarter of 2016, up 10% and 12%, respectively, from the fourth quarter of 2015. This primarily | | TOTAL NET REVENUE 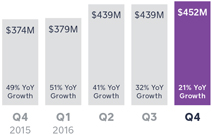
ADJUSTED REVENUE 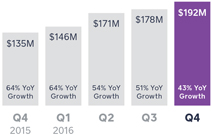
AS A PERCENTAGE OF GPV: 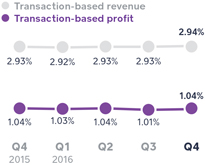
|
| |
7
| | |
reflects increases in engineering personnel costs, offset by the timing of certain hardware development expenses. • Sales and marketing expenses were $49 million on a GAAP basis and $45 million on anon-GAAP basis in the fourth quarter of 2016, up 29% and 27%, respectively, from the fourth quarter of 2015. The increase was driven by costs related to Square Cash, the timing of certain paid marketing campaigns, and growth in sales and account management personnel costs. • General and administrative expenses were $53 million on a GAAP basis and $41 million on anon-GAAP basis in the fourth quarter of 2016. These costs represent a 16% and 19% increase, respectively, from the fourth quarter of 2015. The year-over-year increase was due primarily to increased personnel costs for functions including legal, finance, risk, and support, partly offset by lower professional services fees. • Transaction, loan, and advance losses were $13 million in the fourth quarter of 2016. Transaction losses as a percentage of GPV for the fourth quarter of 2016 are trending below our 0.1% historical average, which underscores ongoing improvements in our risk management. Net loss was $15 million in the fourth quarter of 2016. Net loss per share attributable to common shareholders, basic and diluted, was $0.04 for the fourth quarter of 2016, compared to a loss per share of $0.34 in the fourth quarter of 2015. We had 356 million weighted-average shares as of the fourth quarter of 2016. For the full year, net loss per share attributable to common shareholders was $0.50 based on 342 million weighted-average shares. Adjusted EBITDA was $30 million in the fourth quarter of 2016, compared to a loss of $6 million in the fourth quarter of 2015, an improvement of $36 million on a year-over-year basis. Fourth-quarter Adjusted EBITDA margin of 16% is an improvement of 20 points year over year. For the full year of 2016, Adjusted EBITDA was $45 million, compared to a loss of $41 million for the full year of 2015, a margin improvement of 16 points year over year. This Adjusted EBITDA improvement reflects strong topline growth, increased operating efficiency, and improvements in transaction losses. Adjusted Net Income (Loss) Per Share (Adjusted EPS) was $0.05 based on 383 million weighted-average diluted shares for the fourth quarter of 2016. | | TRANSACTION LOSS AS A PERCENTAGE OF GPV 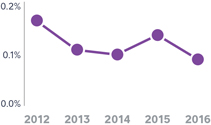
|
| |
| | NET INCOME (LOSS) 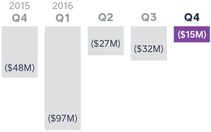
|
| | ADJUSTED EBITDA 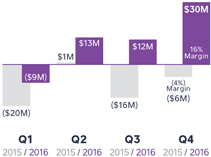
Adjusted EBITDA margin is calculated as Adjusted EBITDA divided by Adjusted Revenue. |
8
| | |
For the full year of 2016, Adjusted EPS was $0.04, a $0.43 increase from the prior year. Weighted-average diluted shares was 370 million for the full year of 2016. Balance Sheet/Cash Flow We ended the fourth quarter of 2016 with $539 million in cash, cash equivalents, and investments in marketable securities, up from $461 million at the end of the fourth quarter of 2015. The increase in our cash balances was driven by positive Adjusted EBITDA and proceeds from employee stock option exercises. Separately, we have reclassified amounts related to money customers keep in Square Cash as “customer funds.” | | Adjusted EPS is computed by dividing net loss, excluding transaction-based revenue and costs related to Starbucks, share-based compensation expense, amortization of intangible assets, loss on sale of property and equipment, and litigation settlement expenses, by the weighted-average number of shares of common stock during the period, including all potentially dilutive shares. A reconciliation ofnon-GAAP metrics used in this letter to their nearest GAAP equivalents is provided at the end of this letter. |
9
Guidance
| | | | |
| | | Q1 | | 2017 |
| | |
Total net revenue | | $440M to $452M | | $2.09B to $2.15B |
| | |
Adjusted Revenue | | $190M to $193M | | $880M to $900M |
| | |
Adjusted Revenue YoY growth (midpoint) | | 31% | | 30% |
| | |
| | |
Adjusted EBITDA | | $14M to $18M | | $100M to $110M |
| | |
Adjusted EBITDA margin (midpoint) | | 8% | | 12% |
| | |
| | |
Net income (loss) per share | | $(0.09) to $(0.07) | | $(0.24) to $(0.20) |
| | |
Adjusted EPS (diluted) | | $0.00 to $0.02 | | $0.15 to $0.19 |
Our 2017 guidance reflects plans to continue investing in scaling our business, balanced by our ongoing commitment to margin expansion. As a reminder, our business is subject to certain seasonal trends. Historically, the first quarter is our slowest in terms of sequential growth of transaction-based revenue. Additionally, we do not expect to see Starbucks transaction-based revenue going forward, which will have a negative impact on year-over-year growth in total net revenue in 2017. Lastly, hardware revenue in the first quarter of 2016 was elevated due to the fulfillment of the majority ofpre-orders for our contactless and chip reader during the period. As a result, year-over-year hardware revenue growth for the first quarter and full year of 2017 will be more moderate relative to prior periods. |
We have not reconciled Adjusted EBITDA and Adjusted EPS guidance to their GAAP equivalents as a result of the uncertainty regarding, and the potential variability of, reconciling items such as share-based compensation expense and weighted-average fully diluted shares outstanding. Accordingly, a reconciliation of thesenon-GAAP guidance metrics to their corresponding GAAP equivalents is not available without unreasonable effort. However, we have provided a reconciliation of GAAP tonon-GAAP metrics in tables at the end of this letter. It is important to note that the actual amount of such reconciling items would have a significant impact if they were included in our Adjusted EBITDA, Adjusted EBITDA margin, and Adjusted EPS.
10
| | |
Earnings Webcast Square (NYSE:SQ) will host a conference call and earnings webcast at 2:00 p.m. Pacific time/5:00 p.m. Eastern time today, February 22, 2017, to discuss these financial results. The domesticdial-in for the call is (877)313-8511. The Conference ID is 53562760. To listen to a live audio webcast, please visit Square’s Investor Relations website at square.com/investors. A replay will be available on the same website following the call. We will release financial results for the first quarter of 2017 on May 3, 2017, after the market closes, and will also host a conference call and earnings webcast at 2:00 p.m. Pacific time/5:00 p.m. Eastern time on the same day to discuss those financial results. | | MEDIA CONTACT press@squareup.com INVESTOR RELATIONS CONTACT ir@squareup.com |
| | |

| | 
|
| Jack Dorsey | | Sarah Friar |
| CEO | | CFO |
11
| | |

| | “I started with Square accepting mobile payments on my phone. We’ve since grown and opened a store, and now use Square to run Tori Blush online and offline. Everything is connected—it’s the most convenient and straightforward system to use. “Square has been with us every step of the way, and I can see myself adding even more services.” Suzanna Chun Founder ofTori Blush toriblush.com |
SAFE HARBOR STATEMENT
This letter contains forward-looking statements within the meaning of the Safe Harbor provisions of the Private Securities Litigation Reform Act of 1995. All statements other than statements of historical fact could be deemed forward-looking, including, but not limited to, statements regarding the future performance of Square, Inc. and its consolidated subsidiaries (the Company); the Company’s expected financial results for future periods; future growth in the Company’s businesses; cessation of transaction-based revenue from Starbucks; the Company’s expectations regarding scale, profitability, and the demand for its products, product features, and services; and management’s statements related to business strategy, plans, and objectives for future operations. In some cases, forward-looking statements can be identified by terms such as “may,” “will,” “appears,” “should,” “expects,” “plans,” “anticipates,” “could,” “intends,” “target,” “projects,” “contemplates,” “believes,” “estimates,” “predicts,” “potential,” or “continue,” or the negative of these words or other similar terms or expressions that concern our expectations, strategy, plans, or intentions. Such statements are subject to a number of risks, uncertainties, and assumptions, and investors are cautioned not to place undue reliance on these statements. Actual results could differ materially from those expressed or implied, and reported results should not be considered as an indication of future performance.
Risks that contribute to the uncertain nature of the forward-looking statements include, among others, the Company’s ability to deal with the substantial and increasingly intense competition in its industry; changes to the rules and practices of payment card networks and acquiring processors; the effect of evolving regulations and oversight related to the Company’s provision of payments services and other financial services; the effect of management changes and business initiatives; and changes in political, business, and economic conditions; as well as other risks listed or described from time to time in the Company’s filings with the Securities and Exchange Commission (the SEC), including the Company’s Annual Report on Form10-K for the fiscal year ended December 31, 2015, and Quarterly Reports on Form10-Q for the fiscal quarters ended March 31, 2016, June 30, 2016, and September 30, 2016, each of which is on file with the SEC and available on the investor relations page of the Company’s website. Except as required by law, the Company assumes no obligation to update any of the statements in this letter.
KEY OPERATING METRICS ANDNON-GAAP FINANCIAL MEASURES
To supplement our financial information presented in accordance with generally accepted accounting principles in the United States (GAAP), we consider certain operating and financial measures that are not prepared in accordance with GAAP, including Gross Payment Volume, Adjusted Revenue, Adjusted EBITDA, Adjusted EBITDA margin, Adjusted Net Income (Loss), and Adjusted EPS. We believe these metrics and measures are useful to facilitateperiod-to-period comparisons of our business and to facilitate comparisons of our performance to that of other payments solution providers. Each of these metrics and measures excludes the effect of our processing agreement with Starbucks. As of December 31, 2016, Starbucks has completed its previously announced transition to another payments solution provider. As a result, we believe it is useful to exclude Starbucks activity to clearly show the impact Starbucks has had on our financial results historically, and to provide insight into the impact of the termination of the Starbucks agreement on our revenues going forward. Our agreements with other sellers generally provide both those sellers and us the unilateral right to terminate such agreements at any time, without fine or penalty. Furthermore, we generally do not enter into long-term contractual agreements with sellers.
We define Gross Payment Volume (GPV) as the total dollar amount of all card payments processed by sellers using Square, net of refunds. GPV excludes card payments processed for Starbucks. Additionally, GPV excludesnon-revenue-generating activity related to our Square Cashpeer-to-peer payments service.
Adjusted Revenue is anon-GAAP financial measure that we define as our total net revenue less transaction-based costs, adjusted to eliminate the effect of activity under our processing agreement with Starbucks. As described above, Starbucks has completed its previously announced transition to another payments solutions provider, and we believe that providing Adjusted Revenue metrics that exclude the impact of our agreement with Starbucks is useful to investors. We believe it is useful to exclude transaction-based costs from Adjusted Revenue as this is a primary metric used by management to measure our business performance, and it affords greater comparability to other payments solution providers. Adjusted Revenue has limitations as a financial measure, should be considered as supplemental in nature, and is not meant as a substitute for the related financial information prepared in accordance with GAAP.
Adjusted EBITDA, Adjusted Net Income (Loss), and Adjusted EPS arenon-GAAP financial measures that represent our net loss and net loss per share, adjusted to eliminate the effect of Starbucks transaction-based revenue, Starbucks transaction-based costs, share-based compensation expense, amortization of intangibles, the litigation settlement with Robert E. Morley, and the gain or loss on the sale of property and equipment. In addition to the items above, Adjusted EBITDA as anon-GAAP financial measure also excludes depreciation, interest income and expense, other income and expense, and provision or benefit from income taxes. Basic Adjusted Net Income (Loss) Per Share is computed by dividing the Adjusted Net Income (Loss) by the weighted-average number of shares of common stock outstanding during the period. Diluted Adjusted Net Income (Loss) Per Share is computed by dividing Adjusted Net Income (Loss) by the weighted-average number of shares of common stock outstanding, including all potentially dilutive shares. Diluted Adjusted Net Income (Loss) Per Share is the same as Basic Adjusted Net Income (Loss) Per Share because the effects of potentially dilutive items were anti-dilutive given the Adjusted Net Loss position.
We have included Adjusted EBITDA, Adjusted Net Income (Loss), and Adjusted EPS because they are key measures used by our management to evaluate our operating performance, generate future operating plans, and make strategic decisions, including those relating to operating expenses and the allocation of internal resources. Accordingly, we believe that Adjusted EBITDA, Adjusted Net Income (Loss), and Adjusted EPS provide useful information to investors and others in understanding and evaluating our operating results in the same manner as our management and board of directors. In addition, they provide a useful measure forperiod-to-period comparisons of our business, as they remove the effect of certainnon-cash items and certain variable charges. Adjusted
13
EBITDA, Adjusted Net Income (Loss), and Adjusted EPS have limitations as financial measures, should be considered as supplemental in nature, and are not meant as substitutes for the related financial information prepared in accordance with GAAP.
Thesenon-GAAP financial measures should not be considered in isolation from, or as a substitute for, financial information prepared in accordance with GAAP. Thesenon-GAAP financial measures are not based on any standardized methodology prescribed by GAAP and are not necessarily comparable to similarly titled measures presented by other companies.
14
| | |
| Consolidated Statements of Operations | | UNAUDITED |
| | In thousands, except per share data |
| | | | | | | | | | | | | | | | |
| | | THREE MONTHS ENDED | | | YEAR ENDED | |
| | | Dec 31, 2016 | | | Dec 31, 2015 | | | Dec 31, 2016 | | | Dec 31, 2015 | |
Revenue: | | | | | | | | | | | | | | | | |
Transaction-based revenue | | $ | 402,496 | | | $ | 298,516 | | | $ | 1,456,160 | | | $ | 1,050,445 | |
Starbucks transaction-based revenue | | | 34 | | | | 47,084 | | | | 78,903 | | | | 142,283 | |
Subscription and services-based revenue | | | 40,518 | | | | 22,385 | | | | 129,351 | | | | 58,013 | |
Hardware revenue | | | 8,869 | | | | 6,375 | | | | 44,307 | | | | 16,377 | |
| | | | | | | | | | | | | |
Total net revenue | | | 451,917 | | | | 374,360 | | | | 1,708,721 | | | | 1,267,118 | |
| | | | | | | | | | | | | |
Cost of revenue: | | | | | | | | | | | | | | | | |
Transaction-based costs | | | 260,006 | | | | 192,730 | | | | 943,200 | | | | 672,667 | |
Starbucks transaction-based costs | | | (49) | | | | 46,896 | | | | 69,761 | | | | 165,438 | |
Subscription and services-based costs | | | 11,431 | | | | 8,650 | | | | 43,132 | | | | 22,470 | |
Hardware costs | | | 12,118 | | | | 14,238 | | | | 68,562 | | | | 30,874 | |
Amortization of acquired technology | | | 1,886 | | | | 2,753 | | | | 8,028 | | | | 5,639 | |
| | | | | | | | | | | | | |
Total cost of revenue | | | 285,392 | | | | 265,267 | | | | 1,132,683 | | | | 897,088 | |
| | | | | | | | | | | | | |
Gross profit | | | 166,525 | | | | 109,093 | | | | 576,038 | | | | 370,030 | |
| | | | | | | | | | | | | |
Operating expenses: | | | | | | | | | | | | | | | | |
Product development | | | 64,889 | | | | 59,186 | | | | 268,537 | | | | 199,638 | |
Sales and marketing | | | 49,406 | | | | 38,448 | | | | 173,876 | | | | 145,618 | |
General and administrative | | | 53,027 | | | | 45,723 | | | | 251,993 | | | | 143,466 | |
Transaction, loan, and advance losses | | | 13,034 | | | | 13,169 | | | | 51,235 | | | | 54,009 | |
Amortization of acquired customer assets | | | 147 | | | | 384 | | | | 850 | | | | 1,757 | |
| | | | | | | | | | | | | |
Total operating expenses | | | 180,503 | | | | 156,910 | | | | 746,491 | | | | 544,488 | |
| | | | | | | | | | | | | |
Operating loss | | | (13,978) | | | | (47,817) | | | | (170,453) | | | | (174,458) | |
| | | | | | | | | | | | | |
Interest and other (income) and expense, net | | | 153 | | | | (772) | | | | (780) | | | | 1,613 | |
| | | | | | | | | | | | | |
Loss before income tax | | | (14,131) | | | | (47,045) | | | | (169,673) | | | | (176,071) | |
| | | | | | | | | | | | | |
Provision for income taxes | | | 1,036 | | | | 1,244 | | | | 1,917 | | | | 3,746 | |
| | | | | | | | | | | | | |
Net loss | | | (15,167) | | | | (48,289) | | | | (171,590) | | | | (179,817) | |
| | | | | | | | | | | | | |
Deemed dividend on Series E preferred stock | | | — | | | | (32,200) | | | | — | | | | (32,200) | |
| | | | | | | | | | | | | |
Net loss attributable to common stockholders | | $ | (15,167) | | | $ | (80,489) | | | $ | (171,590) | | | $ | (212,017) | |
| | | | | | | | | | | | | |
Net loss per share attributable to common stockholders: | | | | | | | | | | | | | | | | |
Basic | | $ | (0.04) | | | $ | (0.34) | | | $ | (0.50) | | | $ | (1.24) | |
| | | | | | | | | | | | | |
Diluted | | $ | (0.04) | | | $ | (0.34) | | | $ | (0.50) | | | $ | (1.24) | |
| | | | | | | | | | | | | |
Weighted-average shares used to compute net loss per share attributable to common stockholders: | | | | | | | | | | | | | | | | |
Basic | | | 356,343 | | | | 234,548 | | | | 341,555 | | | | 170,498 | |
| | | | | | | | | | | | | |
Diluted | | | 356,343 | | | | 234,548 | | | | 341,555 | | | | 170,498 | |
| | | | | | | | | | | | | |
15
| | |
| Consolidated Balance Sheets | | UNAUDITED In thousands, except share and per share data |
| | | | | | | | | | |
| Assets | | | | Dec 31, 2016 | | | Dec 31, 2015 | |
| Current assets: | | | | | | | | | | |
Cash and cash equivalents | | | | $ | 452,030 | | | $ | 461,329 | |
Short-term investments | | | | | 59,901 | | | | — | |
Restricted cash | | | | | 22,131 | | | | 13,537 | |
Settlements receivable | | | | | 321,102 | | | | 142,727 | |
Customer funds held | | | | | 43,574 | | | | 9,446 | |
Loans held for sale | | | | | 42,144 | | | | 604 | |
Merchant cash advance receivable, net | | | | | 4,212 | | | | 36,473 | |
Other current assets | | | | | 56,331 | | | | 41,447 | |
| | | | | |
| Total current assets | | | | | 1,001,425 | | | | 705,563 | |
| | | | | |
| Property and equipment, net | | | | | 88,328 | | | | 87,222 | |
| Goodwill | | | | | 57,173 | | | | 56,699 | |
| Acquired intangible assets, net | | | | | 19,292 | | | | 26,776 | |
| Long-term investments | | | | | 27,366 | | | | — | |
| Restricted cash | | | | | 14,584 | | | | 14,686 | |
| Other assets | | | | | 3,194 | | | | 3,826 | |
| | | | | |
| Total assets | | | | $ | 1,211,362 | | | | 894,772 | |
| | | | | |
| | | |
| Liabilities and Stockholders’ Equity | | | | | | | | | | |
| Current liabilities: | | | | | | | | | | |
Accounts payable | | | | $ | 12,602 | | | $ | 18,869 | |
Customers payable | | | | | 388,058 | | | | 215,365 | |
Customer funds obligation | | | | | 43,574 | | | | 9,446 | |
Accrued transaction losses | | | | | 20,064 | | | | 17,176 | |
Accrued expenses | | | | | 39,543 | | | | 44,401 | |
Other current liabilities | | | | | 73,623 | | | | 28,945 | |
| | | | | |
| Total current liabilities | | | | | 577,464 | | | | 334,202 | |
| | | | | |
| Debt | | | | | — | | | | — | |
| | | | | |
| Other liabilities | | | | | 57,745 | | | | 52,522 | |
| | | | | |
| Total liabilities | | | | | 635,209 | | | | 386,724 | |
| | | | | |
| Stockholders’ equity: | | | | | | | | | | |
Preferred stock, $0.0000001 par value: 100,000,000 shares authorized at December 31, 2016, and December 31, 2015. None issued and outstanding at December 31, 2016, and December 31, 2015. | | | | | — | | | | — | |
Class A common stock, $0.0000001 par value: 1,000,000,000 shares authorized at December 31, 2016, and December 31, 2015; 198,746,620 and 31,717,133 issued and outstanding at December 31, 2016, and December 31, 2015, respectively. | | | | | — | | | | — | |
Class B common stock, $0.0000001 par value: 500,000,000 shares authorized at December 31, 2016, and December 31, 2015; 165,800,756 and 303,232,312 issued and outstanding at December 31, 2016, and December 31, 2015, respectively. | | | | | — | | | | — | |
Additionalpaid-in capital | | | | | 1,357,381 | | | | 1,116,882 | |
Accumulated other comprehensive loss | | | | | (1,989) | | | | (1,185) | |
Accumulated deficit | | | | | (779,239) | | | | (607,649) | |
| | | | | |
| Total stockholders’ equity | | | | | 576,153 | | | | 508,048 | |
| | | | | |
| Total liabilities and stockholders’ equity | | | | $ | 1,211,362 | | | $ | 894,772 | |
| | | | | |
16
| | |
| Consolidated Statements of Cash Flows | | UNAUDITED In thousands |
| | | | | | | | | | |
| Cash Flows from Operating Activities | | | | 2016 | | | 2015 | |
| Net loss | | | | $ | (171,590) | | | $ | (179,817) | |
| Adjustments to reconcile net loss to net cash provided by operating activities: | | | | | | | | | | |
Depreciation and amortization | | | | | 37,745 | | | | 27,626 | |
Share-based compensation | | | | | 138,786 | | | | 82,292 | |
Excess tax benefit from share-based payment activity | | | | | — | | | | (1,101) | |
Provision for transaction losses | | | | | 50,819 | | | | 43,379 | |
Provision for uncollectible receivables related to merchant cash advances | | | | | 1,159 | | | | 6,240 | |
Deferred provision for income taxes | | | | | 58 | | | | 26 | |
(Gain) loss on disposal of property and equipment | | | | | (49) | | | | 270 | |
Changes in operating assets and liabilities: | | | | | | | | | | |
Settlements receivable | | | | | (178,405) | | | | (27,420) | |
Customer funds held | | | | | (34,128) | | | | (6,462) | |
Purchase of loans held for sale | | | | | (668,976) | | | | (816) | |
Proceeds from sales and principal payments of loans held for sale | | | | | 627,627 | | | | 21 | |
Merchant cash advance receivable | | | | | 31,102 | | | | (13,411) | |
Other current assets | | | | | (14,986) | | | | (12,430) | |
Other assets | | | | | 631 | | | | 1,220 | |
Accounts payable | | | | | (2,147) | | | | 7,831 | |
Customers payable | | | | | 172,446 | | | | 69,547 | |
Customer funds obligation | | | | | 34,128 | | | | 6,462 | |
Charge-offs and recoveries to accrued transaction losses | | | | | (47,931) | | | | (34,655) | |
Accrued expenses | | | | | (409) | | | | 21,450 | |
Other current liabilities | | | | | 44,102 | | | | 19,760 | |
Other liabilities | | | | | 3,149 | | | | 11,111 | |
| | | | | |
Net cash provided by operating activities | | | | | 23,131 | | | | 21,123 | |
| | | | | |
| | | |
| Cash Flows from Investing Activities | | | | | | | | | | |
Purchase of marketable securities | | | | | (164,766) | | | | — | |
Maturities of marketable securities | | | | | 43,200 | | | | — | |
Sales of marketable securities | | | | | 34,222 | | | | — | |
Purchase of property and equipment | | | | | (25,433) | | | | (37,432) | |
Proceeds from sale of property and equipment | | | | | 296 | | | | — | |
Payment for acquisition of intangible assets | | | | | (400) | | | | (1,286) | |
Increases in restricted cash | | | | | (8,492) | | | | (1,878) | |
Business acquisitions (net of cash acquired) | | | | | (1,360) | | | | (4,500) | |
| | | | | |
Net cash used in investing activities: | | | | | (122,733) | | | | (45,096) | |
| | | | | |
17
| | |
| Consolidated Statements of Cash Flows (continued) | | UNAUDITED In thousands |
| | | | | | | | | | |
| Cash Flows from Financing Activities | | | | 2016 | | | 2015 | |
Proceeds from issuance of preferred stock, net | | | | | — | | | | 29,952 | |
Proceeds from issuance of common stock upon initial public offering, net of offering | | | | | — | | | | 251,257 | |
costs | | | | |
Payments of offering costs related to initial public offering | | | | | (5,530) | | | | — | |
Proceeds from debt | | | | | — | | | | — | |
Principal payments on debt | | | | | — | | | | (30,000) | |
Payments of debt issuance costs | | | | | — | | | | (1,387) | |
Principal payments on capital lease obligation | | | | | (168) | | | | — | |
Proceeds from issuances of common stock from the exercise of options and employee stock purchase plan | | | | | 96,439 | | | | 13,840 | |
Excess tax benefit from share-based payment award | | | | | — | | | | 1,101 | |
| | | | | |
Net cash provided by financing activities | | | | | 90,741 | | | | 264,763 | |
| | | | | |
Effect of foreign exchange rate on cash and cash equivalents | | | | | (438) | | | | (1,776) | |
| | | | | |
Net increase (decrease) in cash and cash equivalents | | | | | (9,299) | | | | 239,014 | |
| Cash and cash equivalents, beginning of the year | | | | | 461,329 | | | | 222,315 | |
| | | | | |
| Cash and cash equivalents, end of the year | | | | $ | 452,030 | | | $ | 461,329 | |
| | | | | |
18
| | |
| Key Operating Metrics andNon-GAAP Financial Measures | | UNAUDITED |
| | In thousands, except GPV and per share data |
| | | | | | | | | | | | | | | | |
| | | THREE MONTHS ENDED | | | YEAR ENDED | |
| | | Dec 31, 2016 | | | Dec 31, 2015 | | | Dec 31, 2016 | | | Dec 31, 2015 | |
| | | | | | | | | | | | | | | | |
| Gross Payment Volume (GPV) (in millions) | | $ | 13,694 | | | $ | 10,193 | | | $ | 49,683 | | | $ | 35,643 | |
| Adjusted Revenue | | $ | 191,877 | | | $ | 134,546 | | | $ | 686,618 | | | $ | 452,168 | |
| Adjusted EBITDA | | $ | 29,793 | | | $ | (6,069) | | | $ | 44,887 | | | $ | (41,115) | |
| Adjusted Net Income (Loss) | | $ | 20,766 | | | $ | (12,476) | | | $ | 15,018 | | | $ | (66,597) | |
| Adjusted Net Income (Loss) Per Share Basic | | $ | 0.06 | | | $ | (0.05) | | | $ | 0.04 | | | $ | (0.39) | |
| Adjusted Net Income (Loss) Per Share Diluted | | $ | 0.05 | | | $ | (0.05) | | | $ | 0.04 | | | $ | (0.39) | |
Adjusted Revenue Reconciliation | | | | | | | | | | | | | | | UNAUDITED | |
| | | | | | | | | | | | | | | In thousands | |
| | | THREE MONTHS ENDED | | | YEAR ENDED | |
| | | Dec 31, 2016 | | | Dec 31, 2015 | | | Dec 31, 2016 | | | Dec 31, 2015 | |
| | | | | | | | | | | | | | | | |
| Total net revenue | | $ | 451,917 | | | $ | 374,360 | | | $ | 1,708,721 | | | $ | 1,267,118 | |
| Less: Starbucks transaction-based revenue | | | 34 | | | | 47,084 | | | | 78,903 | | | | 142,283 | |
| Less: Transaction-based costs | | | 260,006 | | | | 192,730 | | | | 943,200 | | | | 672,667 | |
| | | | | | | | | | | | | |
Adjusted Revenue | | $ | 191,877 | | | $ | 134,546 | | | $ | 686,618 | | | $ | 452,168 | |
| | | | | | | | | | | | | |
Adjusted EBITDA Reconciliation | | | | | | | | | | | | | | | UNAUDITED | |
| | | | | | | | | | | | | | | In thousands | |
| | | THREE MONTHS ENDED | | | YEAR ENDED | |
| | | Dec 31, 2016 | | | Dec 31, 2015 | | | Dec 31, 2016 | | | Dec 31, 2015 | |
| | | | | | | | | | | | | | | | |
| Net loss | | $ | (15,167) | | | $ | (48,289) | | | $ | (171,590) | | | $ | (179,817) | |
| Starbucks transaction-based revenue | | | (34) | | | | (47,084) | | | | (78,903) | | | | (142,283) | |
| Starbucks transaction-based costs | | | (49) | | | | 46,896 | | | | 69,761 | | | | 165,438 | |
| Share-based compensation expense | | | 33,887 | | | | 32,806 | | | | 138,786 | | | | 82,292 | |
| Depreciation and amortization | | | 9,928 | | | | 9,100 | | | | 37,745 | | | | 27,626 | |
| Litigation settlement (benefit) expense | | | — | | | | — | | | | 48,000 | | | | — | |
| Interest and other (income) expense, net | | | 153 | | | | (772) | | | | (780) | | | | 1,613 | |
| Provision for income taxes | | | 1,036 | | | | 1,244 | | | | 1,917 | | | | 3,746 | |
| Loss (gain) on sale of property and equipment | | | 39 | | | | 30 | | | | (49) | | | | 270 | |
| | | | | | | | | | | | | |
Adjusted EBITDA | | $ | 29,793 | | | $ | (6,069) | | | $ | 44,887 | | | $ | (41,115) | |
| | | | | | | | | | | | | |
19
| | |
| Adjusted Net Income (Loss) Reconciliation | | UNAUDITED |
| | In thousands, except per share data |
| | | | | | | | | | | | | | | | | | | | | | | | | | | | |
| | | THREE MONTHS ENDED | | | YEAR ENDED | |
| | | Dec 31, 2016 | | | Sep 30, 2016 | | | Jun 30, 2016 | | | Mar 31, 2016 | | | Dec 31, 2015 | | | Dec 31, 2016 | | | Dec 31, 2015 | |
| | | | | | | | | | | | | | | | | | | | | | | | | | | | | |
| Net loss | | | (15,167) | | | | (32,323) | | | | (27,345) | | | | (96,755) | | | | (48,289) | | | | (171,590) | | | | (179,817) | |
| Starbucks transaction-based revenue | | | (34) | | | | (7,164) | | | | (32,867) | | | | (38,838) | | | | (47,084) | | | | (78,903) | | | | (142,283) | |
| Starbucks transaction-based costs | | | (49) | | | | 4,528 | | | | 28,672 | | | | 36,610 | | | | 46,896 | | | | 69,761 | | | | 165,438 | |
| Share-based compensation expense | | | 33,887 | | | | 36,779 | | | | 36,922 | | | | 31,198 | | | | 32,806 | | | | 138,786 | | | | 82,292 | |
| Amortization of intangible assets | | | 2,090 | | | | 2,076 | | | | 2,134 | | | | 2,713 | | | | 3,165 | | | | 9,013 | | | | 7,503 | |
Litigation settlement (benefit) expense | | $ | — | | | $ | — | | | $ | (2,000) | | | $ | 50,000 | | | $ | — | | | $ | 48,000 | | | $ | — | |
Loss (gain) on sale of property and equipment | | $ | 39 | | | $ | (219) | | | $ | 169 | | | $ | (38) | | | $ | 30 | | | $ | (49) | | | $ | 270 | |
| | | | | | | | | | | | | | | | | | | | | | | | | |
Adjusted Net Income (Loss) | | $ | 20,766 | | | $ | 3,677 | | | $ | 5,685 | | | $ | (15,110) | | | $ | (12,476) | | | $ | 15,018 | | | $ | (66,597) | |
| | | | | | | | | | | | | | | | | | | | | | | | | |
Adjusted Net Income (Loss) Per Share: | | | | | | | | | | | | | | | | | | | | | | | | | | | | |
Basic | | $ | 0.06 | | | $ | 0.01 | | | $ | 0.02 | | | $ | (0.05) | | | $ | (0.05) | | | $ | 0.04 | | | $ | (0.39) | |
Diluted | | $ | 0.05 | | | $ | 0.01 | | | $ | 0.02 | | | $ | (0.05) | | | $ | (0.05) | | | $ | 0.04 | | | $ | (0.39) | |
Weighted-average shares used to
compute Adjusted Net Income (Loss) | | | | | | | | | | | | | | | | | | | | | | | | | | | | |
Per Share: | | | | | | | | | | | | | | | | | | | | | | | | | | | | |
Basic | | | 356,343 | | | | 343,893 | | | | 334,488 | | | | 331,324 | | | | 234,548 | | | | 341,555 | | | | 170,498 | |
Diluted | | | 382,531 | | | | 370,746 | | | | 365,731 | | | | 331,324 | | | | 234,548 | | | | 370,258 | | | | 170,498 | |
| | |
| Adjusted Revenue Guidance Reconciliation | | UNAUDITED |
| | In thousands |
| | | | | | | | |
| | | THREE MONTHS ENDED | | | YEAR ENDED | |
| | | Mar 31, 2017 | | | Dec 31, 2017 | |
| | | | | | | | | |
| Total net revenue | | $ | 440,000 - 452,000 | | | $ | 2,090,000 - 2,150,000 | |
| Less: Transaction-based costs | | | 250,000 - 259,000 | | | | 1,210,000 - 1,250,000 | |
| | | | | |
Adjusted Revenue | | $ | 190,000 - 193,000 | | | $ | 880,000 - 900,000 | |
| | | | | |
20
| | | | | | | | | | | | | | | | |
| Non-GAAP Operating Expenses | | | | | | | | | | | | | | | UNAUDITED | |
| | | | | | | | | | | | | | | In thousands | |
| | | THREE MONTHS ENDED | | | YEAR ENDED | |
| | | Dec 31, 2016 | | | Dec 31, 2015 | | | Dec 31, 2016 | | | Dec 31, 2015 | |
| | | | |
| Operating expenses | | $ | (180,503) | | | $ | (156,910) | | | $ | (746,491) | | | $ | (544,488) | |
| Share-based compensation | | | 33,887 | | | | 32,806 | | | | 138,786 | | | | 82,292 | |
| Depreciation and amortization | | | 7,544 | | | | 5,165 | | | | 27,536 | | | | 20,804 | |
| Litigation settlement expense | | | — | | | | — | | | | 48,000 | | | | — | |
| Loss (gain) on sale of fixed assets | | | 39 | | | | 30 | | | | (49) | | | | 270 | |
| | | | | | | | | | | | | |
Non-GAAP operating expenses | | $ | (139,033) | | | $ | (118,909) | | | $ | (532,218) | | | $ | (441,122) | |
| | | | | | | | | | | | | |
| | | | |
| Product development | | $ | (64,889) | | | $ | (59,186) | | | $ | (268,537) | | | $ | (199,638) | |
| Share-based compensation | | | 21,340 | | | | 21,451 | | | | 91,404 | | | | 54,738 | |
| Depreciation and amortization | | | 3,639 | | | | 2,240 | | | | 13,190 | | | | 11,347 | |
| Loss (gain) on sale of fixed assets | | | — | | | | — | | | | — | | | | — | |
| | | | | | | | | | | | | |
Non-GAAP product development | | $ | (39,910) | | | $ | (35,495) | | | $ | (163,943) | | | $ | (133,553) | |
| | | | | | | | | | | | | |
| | | | |
| Sales and marketing | | $ | (49,406) | | | $ | (38,448) | | | $ | (173,876) | | | $ | (145,618) | |
| Share-based compensation | | | 4,159 | | | | 2,836 | | | | 14,122 | | | | 7,360 | |
| Depreciation and amortization | | | 17 | | | | 3 | | | | 30 | | | | 10 | |
| Loss (gain) on sale of fixed assets | | | 41 | | | | 53 | | | | 73 | | | | 53 | |
| | | | | | | | | | | | | |
Non-GAAP sales and marketing | | $ | (45,189) | | | $ | (35,556) | | | $ | (159,651) | | | $ | (138,195) | |
| | | | | | | | | | | | | |
| | | | |
| General and administrative | | $ | (53,027) | | | $ | (45,723) | | | $ | (251,993) | | | $ | (143,466) | |
| Share-based compensation | | | 8,388 | | | | 8,519 | | | | 33,260 | | | | 20,194 | |
| Depreciation and amortization | | | 3,888 | | | | 2,922 | | | | 14,316 | | | | 9,447 | |
| Litigation settlement expense | | | — | | | | — | | | | 48,000 | | | | — | |
| Loss (gain) on sale of fixed assets | | | (2) | | | | (23) | | | | (122) | | | | 217 | |
| | | | | | | | | | | | | |
Non-GAAP general and administrative | | $ | (40,753) | | | $ | (34,305) | | | $ | (156,539) | | | $ | (113,608) | |
| | | | | | | | | | | | | |
Depreciation and Amortization by Function | | | | | | | | | | | | | | | UNAUDITED | |
| | | | | | | | | | | | | | | In thousands | |
| | | THREE MONTHS ENDED | | | YEAR ENDED | |
| | | Dec 31, 2016 | | | Dec 31, 2015 | | | Dec 31, 2016 | | | Dec 31, 2015 | |
| | | | |
| Cost of revenue | | $ | 2,384 | | | $ | 3,935 | | | $ | 10,209 | | | $ | 6,822 | |
| Product development | | | 3,639 | | | | 2,240 | | | | 13,190 | | | | 11,347 | |
| Sales and marketing | | | 17 | | | | 3 | | | | 30 | | | | 10 | |
| General and administrative | | | 3,888 | | | | 2,922 | | | | 14,316 | | | | 9,447 | |
| | | | | | | | | | | | | |
Total depreciation and amortization | | $ | 9,928 | | | $ | 9,100 | | | $ | 37,745 | | | $ | 27,626 | |
| | | | | | | | | | | | | |
21